cicor technologies ltd
TRANSCRIPT
I 1 I
Investora 2013 Cicor Technologies Ltd.
Patric Schoch, CEO ad interim / CFO
12.09.13 Investora 2013
Erich Trinkler, Executive Vice President Cicor Electronic Solutions
I 2 I
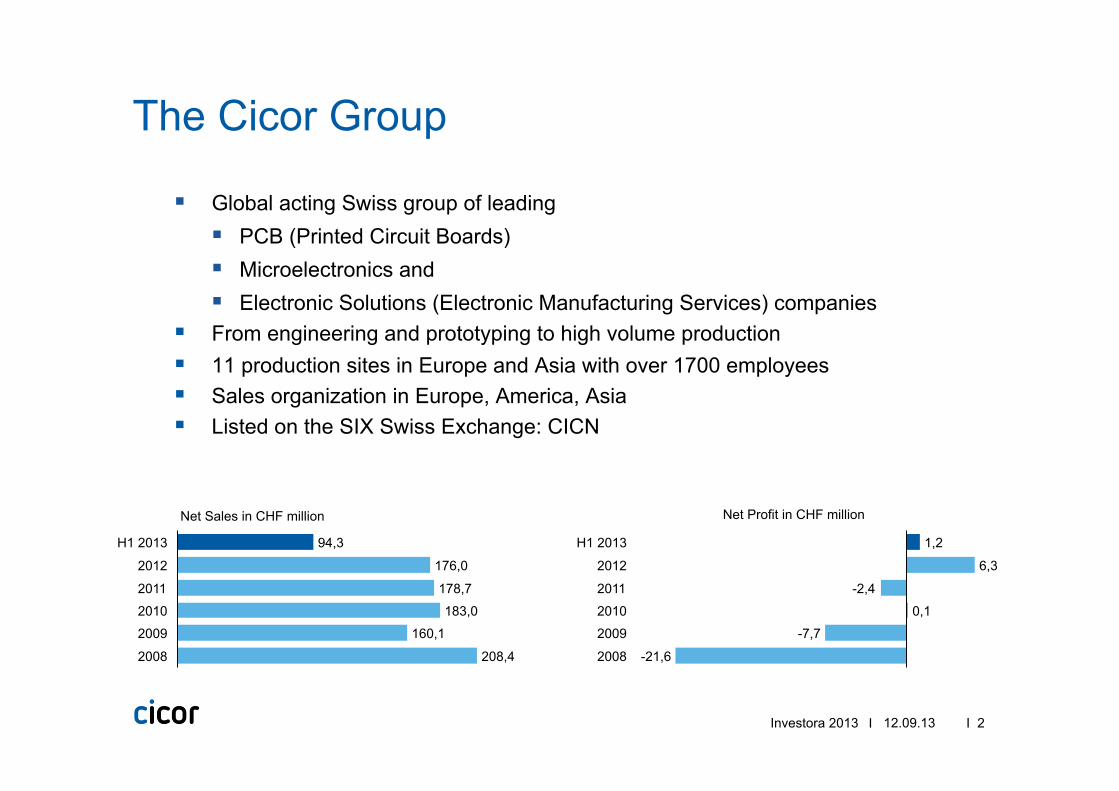
The Cicor Group
§ Global acting Swiss group of leading § PCB (Printed Circuit Boards) § Microelectronics and § Electronic Solutions (Electronic Manufacturing Services) companies
§ From engineering and prototyping to high volume production § 11 production sites in Europe and Asia with over 1700 employees § Sales organization in Europe, America, Asia § Listed on the SIX Swiss Exchange: CICN
Investora 2013 12.09.13
Net Sales in CHF million
2008 208,4
2009 160,1
2010 183,0
2011 178,7
2012 176,0
H1 2013 94,3
2008 -21,6
2009 -7,7
2010 0,1
2011 -2,4
2012 6,3
H1 2013 1,2
Net Profit in CHF million
I 3 I
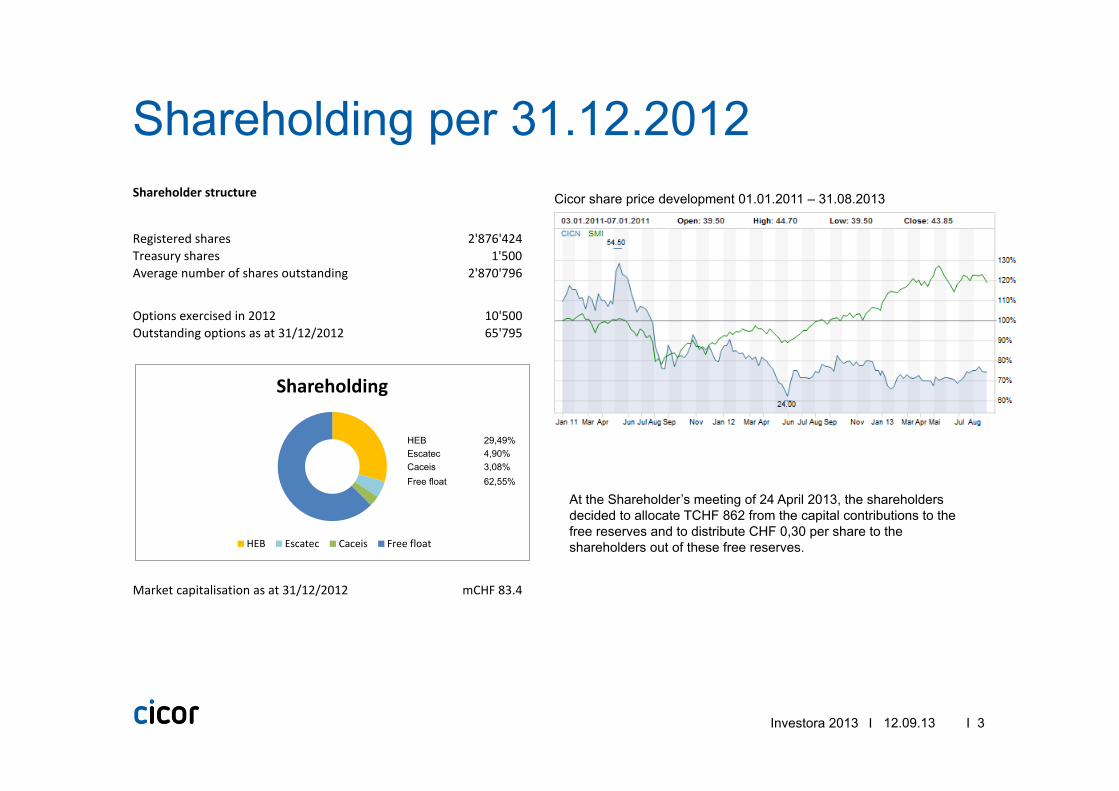
Shareholding per 31.12.2012
12.09.13 Investora 2013
Shareholder structure
Registered shares 2'876'424Treasury shares 1'500 Average number of shares outstanding 2'870'796
Options exercised in 2012 10'500Outstanding options as at 31/12/2012 65'795
Market capitalisation as at 31/12/2012 mCHF 83.4
Shareholding
HEB Escatec Caceis Free float
HEB 29,49% Escatec 4,90% Caceis 3,08% Free float 62,55%
Cicor share price development 01.01.2011 – 31.08.2013
At the Shareholder’s meeting of 24 April 2013, the shareholders decided to allocate TCHF 862 from the capital contributions to the free reserves and to distribute CHF 0,30 per share to the shareholders out of these free reserves.
I 4 I
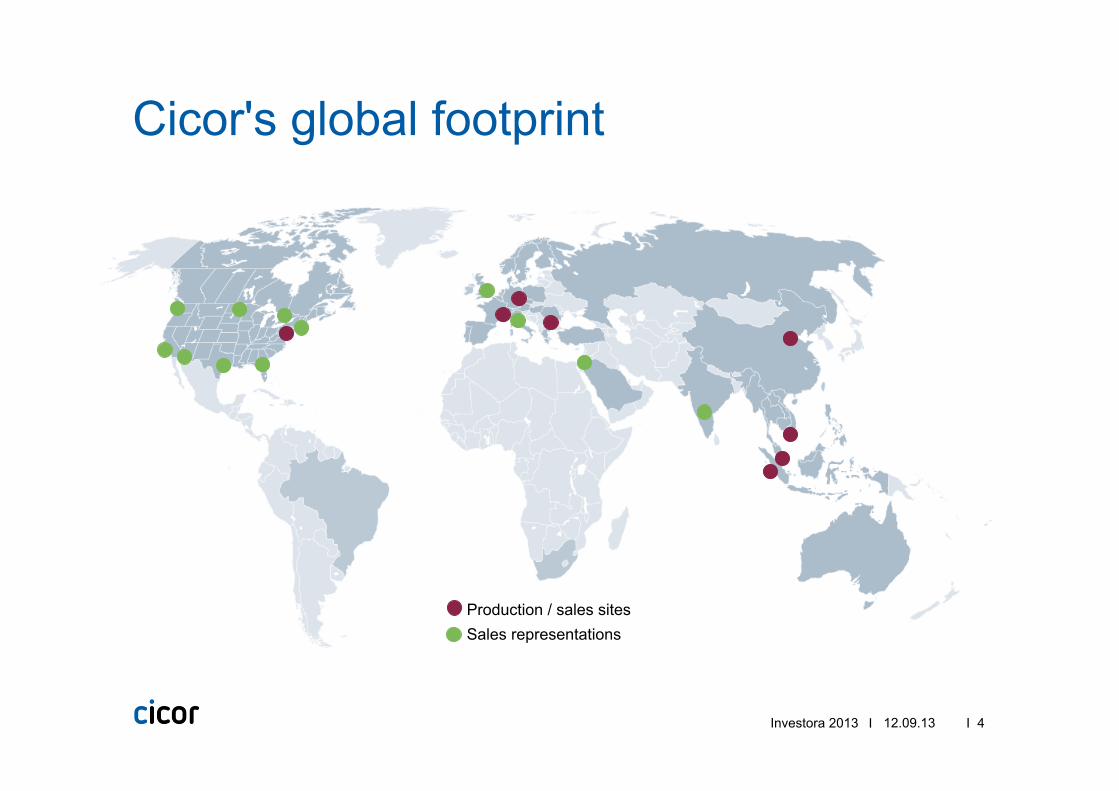
Cicor's global footprint
Global and local presence
Production / sales sites Sales representations
Investora 2013 12.09.13
I 5 I
Cicor Group
Investora 2013 12.09.13
I 6 I
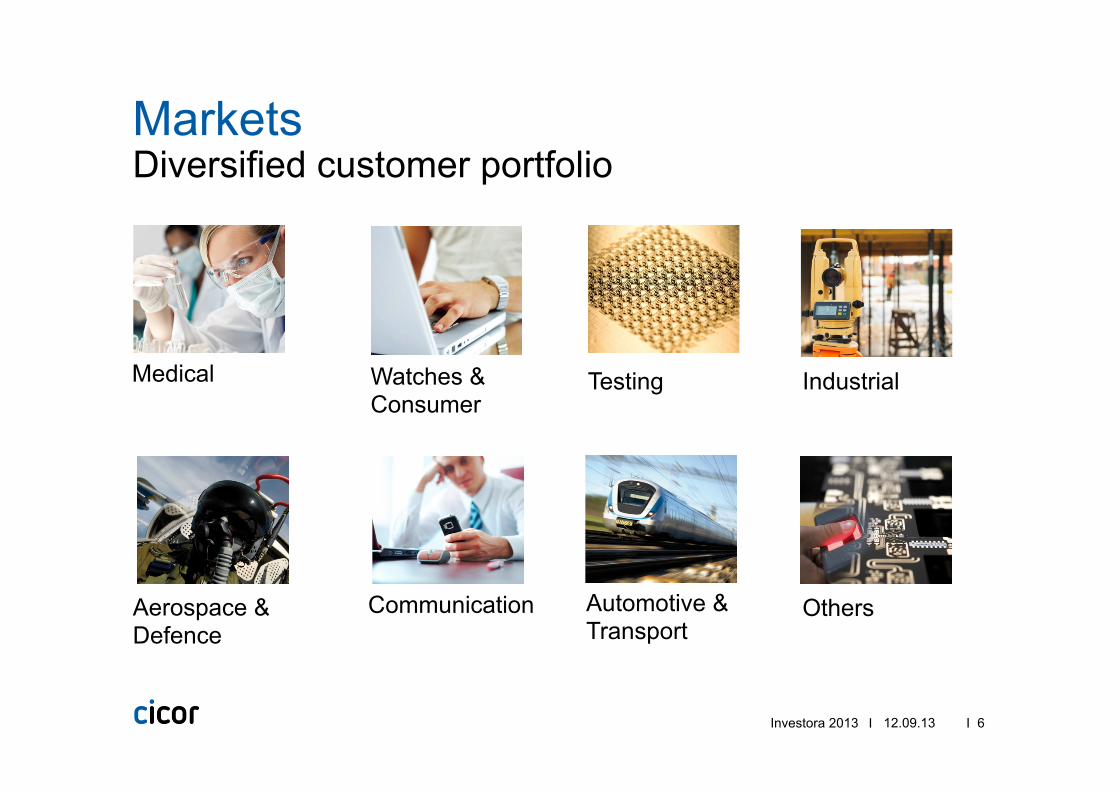
Diversified customer portfolio Markets
Investora 2013 12.09.13
Medical
Watches & Consumer
Testing Industrial
Aerospace & Defence
Communication
Automotive & Transport
Others

I 7 I
Cicor group structure Profile
Asia
Cicor Technologies Group
Europe
ES Division
ME Division
PCB Division
Americas
Boudry Switzerland
Sites
Sales Organization
Moudon Switzerland
Wangs Switzerland
Ulm Germany
Radeberg Germany
Bronschhofen Switzerland
Arad Romania
Quartino Switzerland
ME
ASIA Division
ES +
Plastic Injection Molding
+ Tooling
PCB
Singapore Singapore Anam Vietnam Batam Indonesia Suzhou China
Minnesota USA
Investora 2013 12.09.13
Asia 17
(18%)
ES
46 (49%)
ME 15 (16%)
PCB 16
(17%) Sales ratio H1 2013 in CHF mio and %
I 8 I
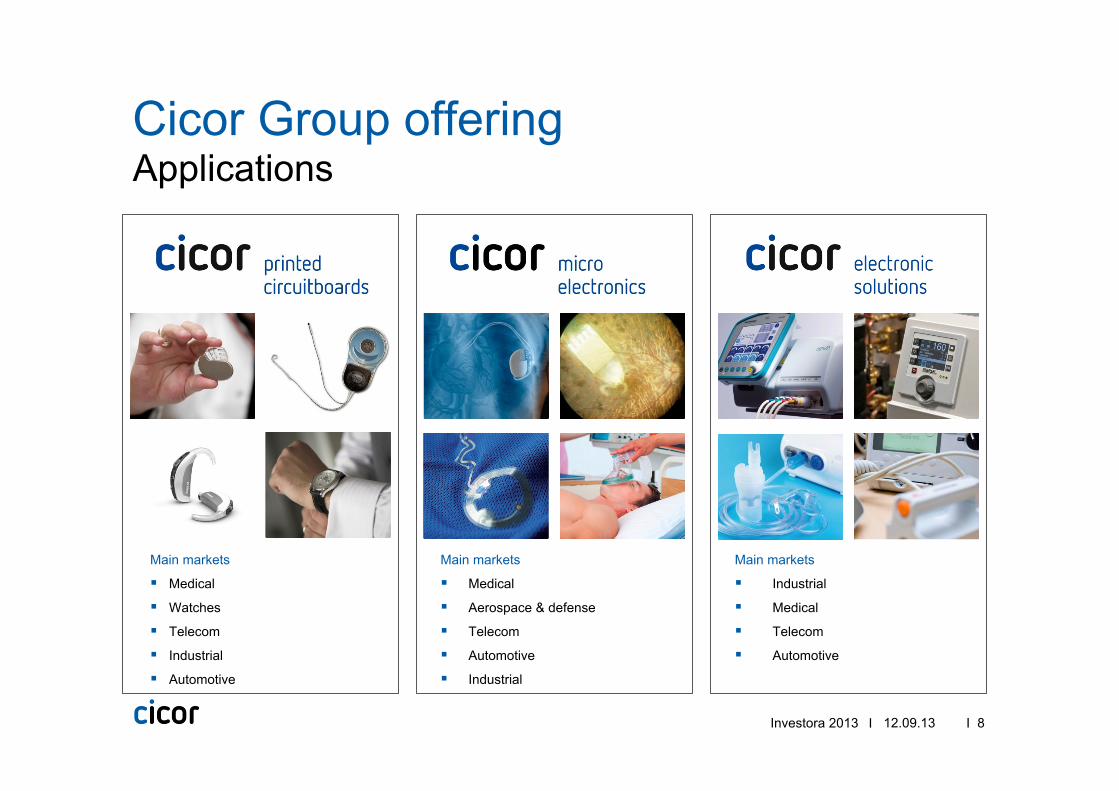
Applications Cicor Group offering
Investora 2013 12.09.13
Main markets
§ Medical
§ Watches
§ Telecom
§ Industrial
§ Automotive
Main markets
§ Medical
§ Aerospace & defense
§ Telecom
§ Automotive
§ Industrial
Main markets
§ Industrial
§ Medical
§ Telecom
§ Automotive
I 9 I
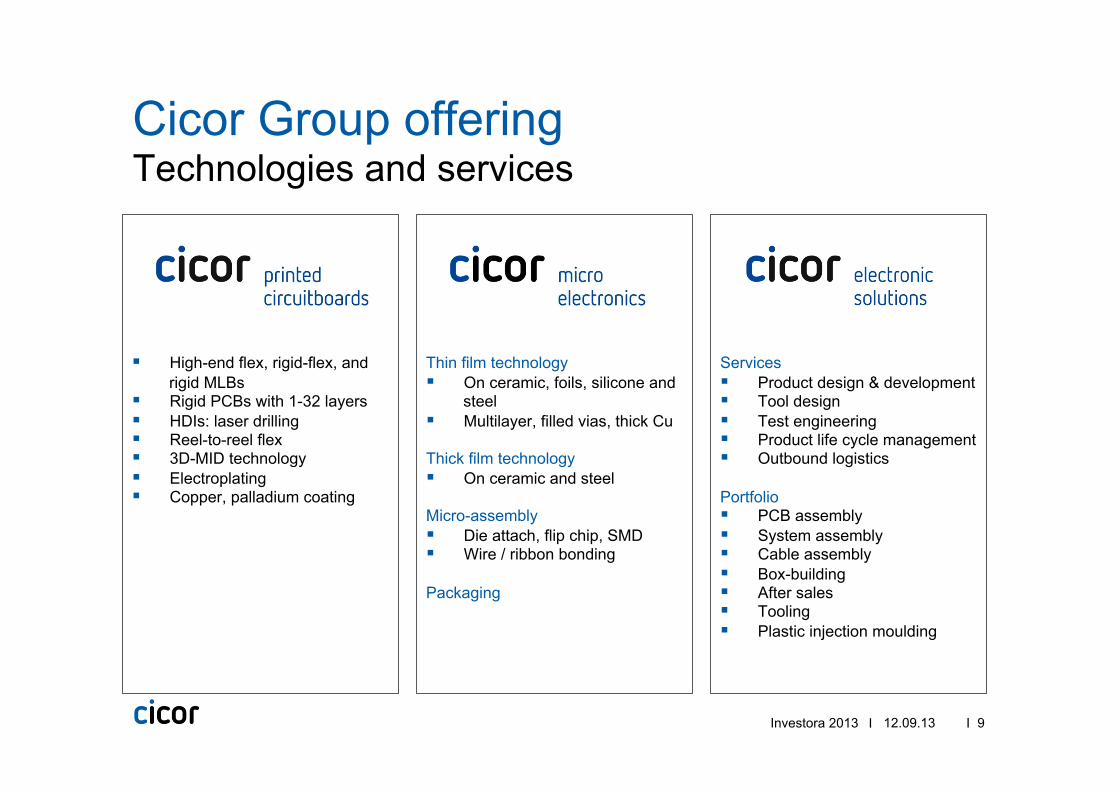
Technologies and services Cicor Group offering
Investora 2013 12.09.13
§ High-end flex, rigid-flex, and rigid MLBs
§ Rigid PCBs with 1-32 layers § HDIs: laser drilling § Reel-to-reel flex § 3D-MID technology § Electroplating § Copper, palladium coating
Thin film technology § On ceramic, foils, silicone and
steel § Multilayer, filled vias, thick Cu
Thick film technology § On ceramic and steel
Micro-assembly § Die attach, flip chip, SMD § Wire / ribbon bonding
Packaging
Services § Product design & development § Tool design § Test engineering § Product life cycle management § Outbound logistics Portfolio § PCB assembly § System assembly § Cable assembly § Box-building § After sales § Tooling § Plastic injection moulding
I 10 I
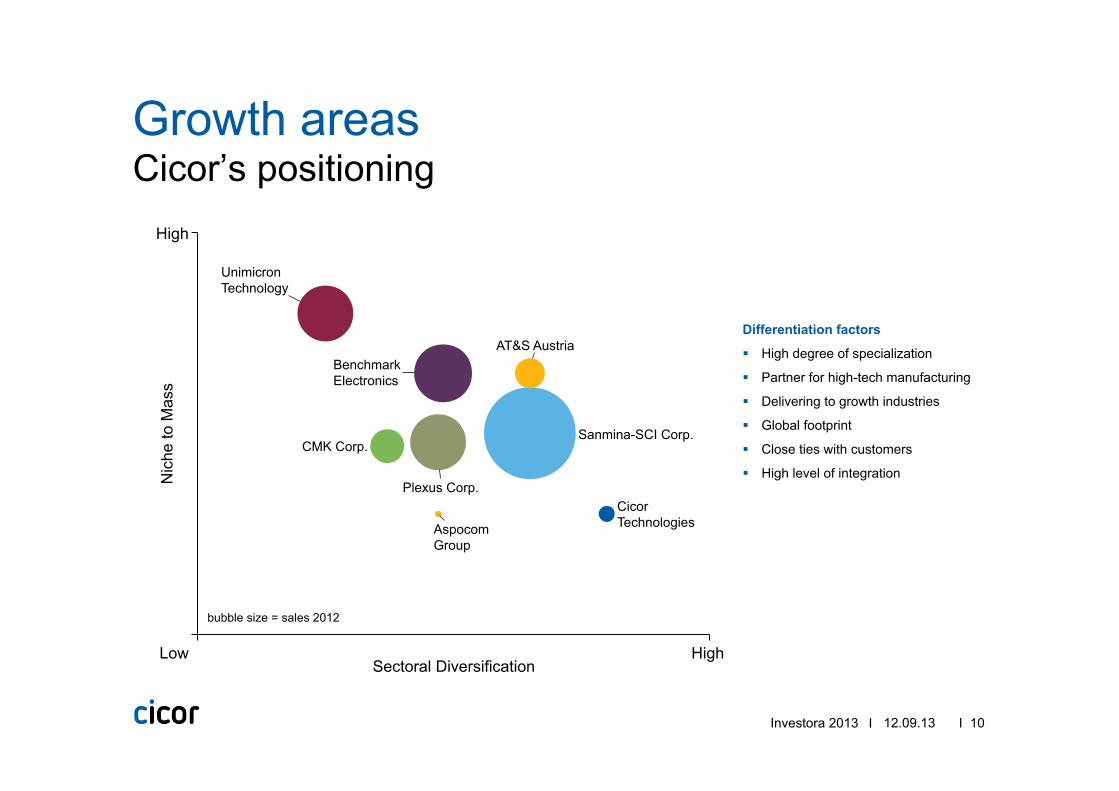
Cicor’s positioning Growth areas
Investora 2013 12.09.13
Sectoral Diversification
Nic
he to
Mas
s
Sanmina-SCI Corp.
Benchmark Electronics
Plexus Corp. Cicor Technologies
CMK Corp.
Unimicron Technology
AT&S Austria
Aspocom Group
High
Low High
bubble size = sales 2012
Differentiation factors
§ High degree of specialization
§ Partner for high-tech manufacturing
§ Delivering to growth industries
§ Global footprint
§ Close ties with customers
§ High level of integration
I 11 I
Erich Trinkler Executive Vice President
Cicor Electronic Solutions
Investora 2013 12.09.13
I 12 I
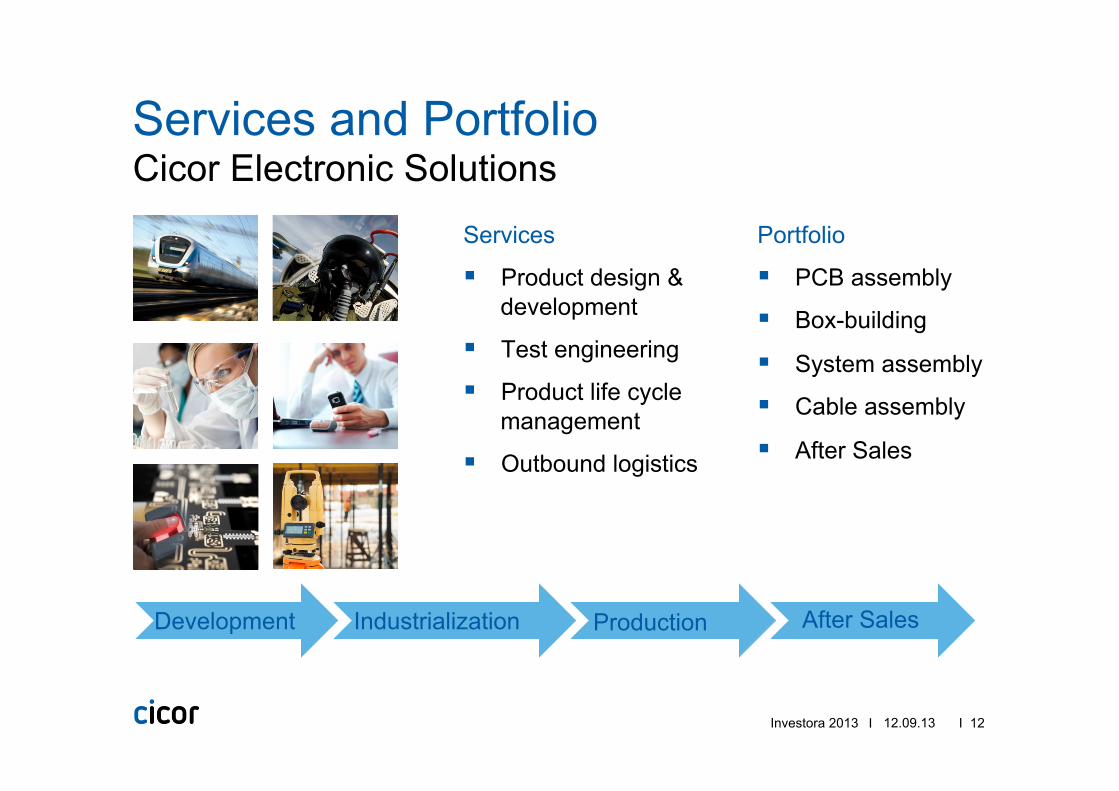
Cicor Electronic Solutions Services and Portfolio
Services
§ Product design & development
§ Test engineering
§ Product life cycle management
§ Outbound logistics
Portfolio
§ PCB assembly
§ Box-building
§ System assembly
§ Cable assembly
§ After Sales
Development Industrialization Production After Sales
12.09.13 Investora 2013
I 13 I
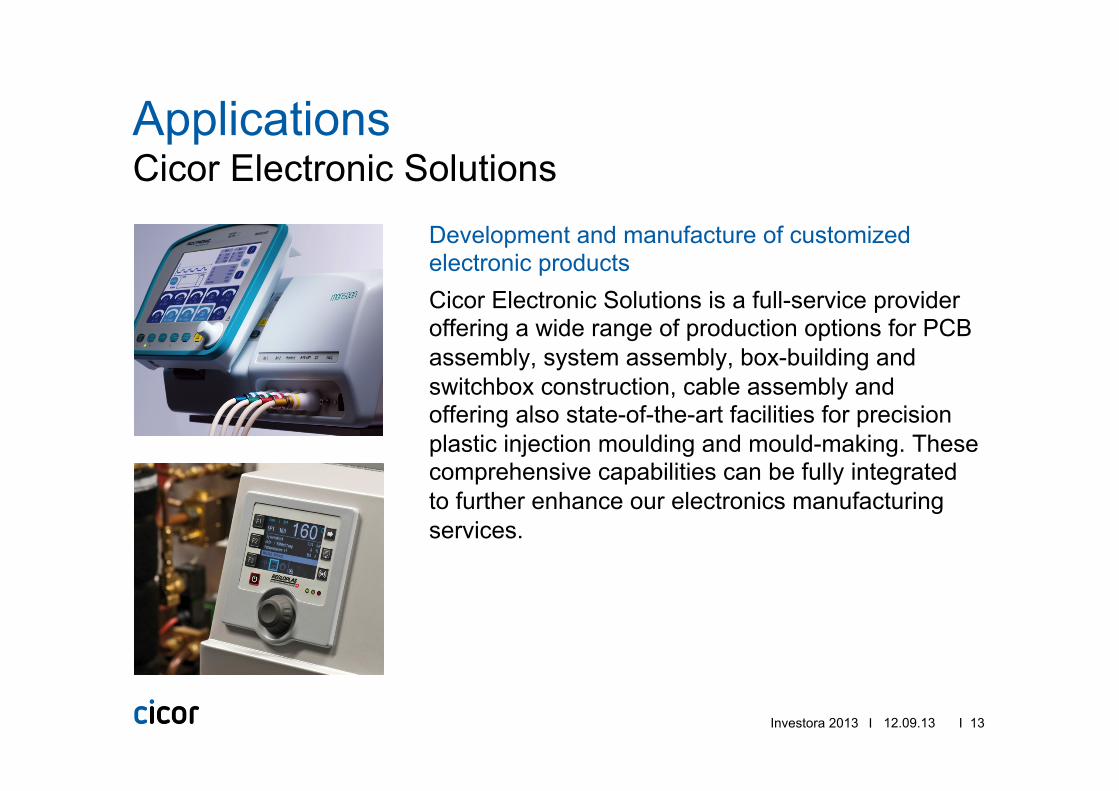
Cicor Electronic Solutions Applications
Investora 2013 12.09.13
Development and manufacture of customized electronic products Cicor Electronic Solutions is a full-service provider offering a wide range of production options for PCB assembly, system assembly, box-building and switchbox construction, cable assembly and offering also state-of-the-art facilities for precision plastic injection moulding and mould-making. These comprehensive capabilities can be fully integrated to further enhance our electronics manufacturing services.
I 14 I
Solid results and return to growth Interim Results 2013
Investora 2013 12.09.13
I 15 I
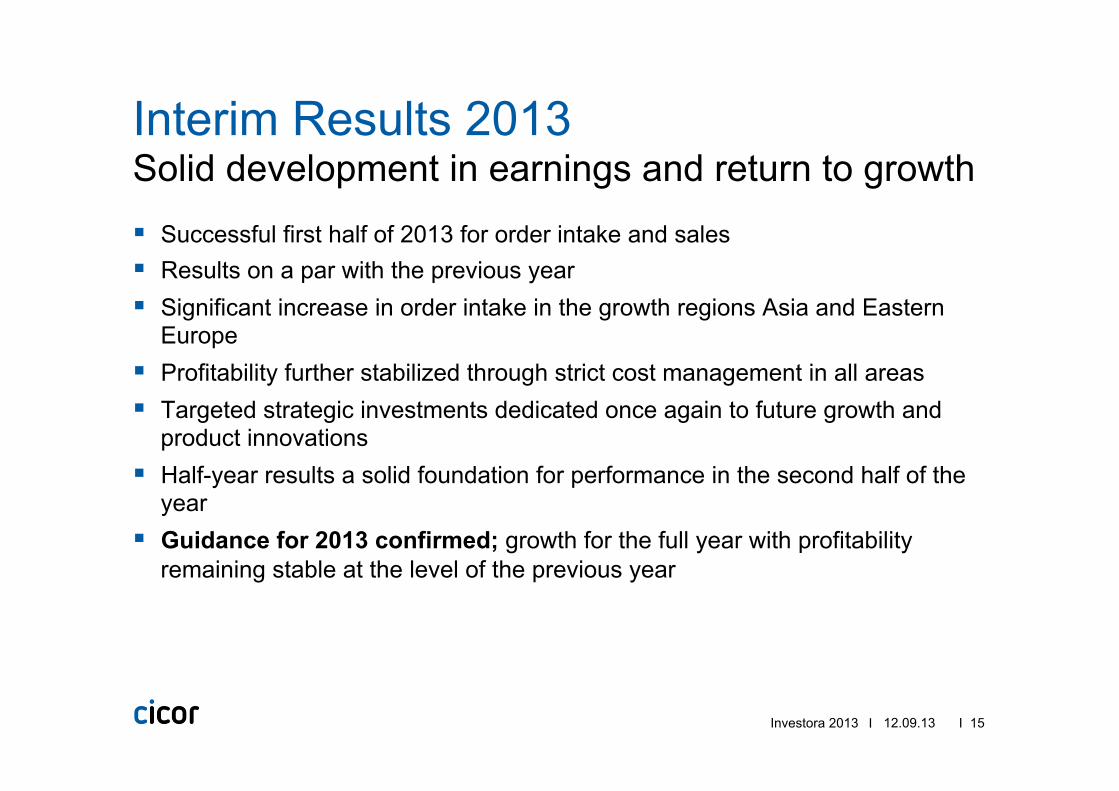
Solid development in earnings and return to growth Interim Results 2013
§ Successful first half of 2013 for order intake and sales § Results on a par with the previous year § Significant increase in order intake in the growth regions Asia and Eastern
Europe § Profitability further stabilized through strict cost management in all areas § Targeted strategic investments dedicated once again to future growth and
product innovations § Half-year results a solid foundation for performance in the second half of the
year § Guidance for 2013 confirmed; growth for the full year with profitability
remaining stable at the level of the previous year
Investora 2013 12.09.13
I 16 I
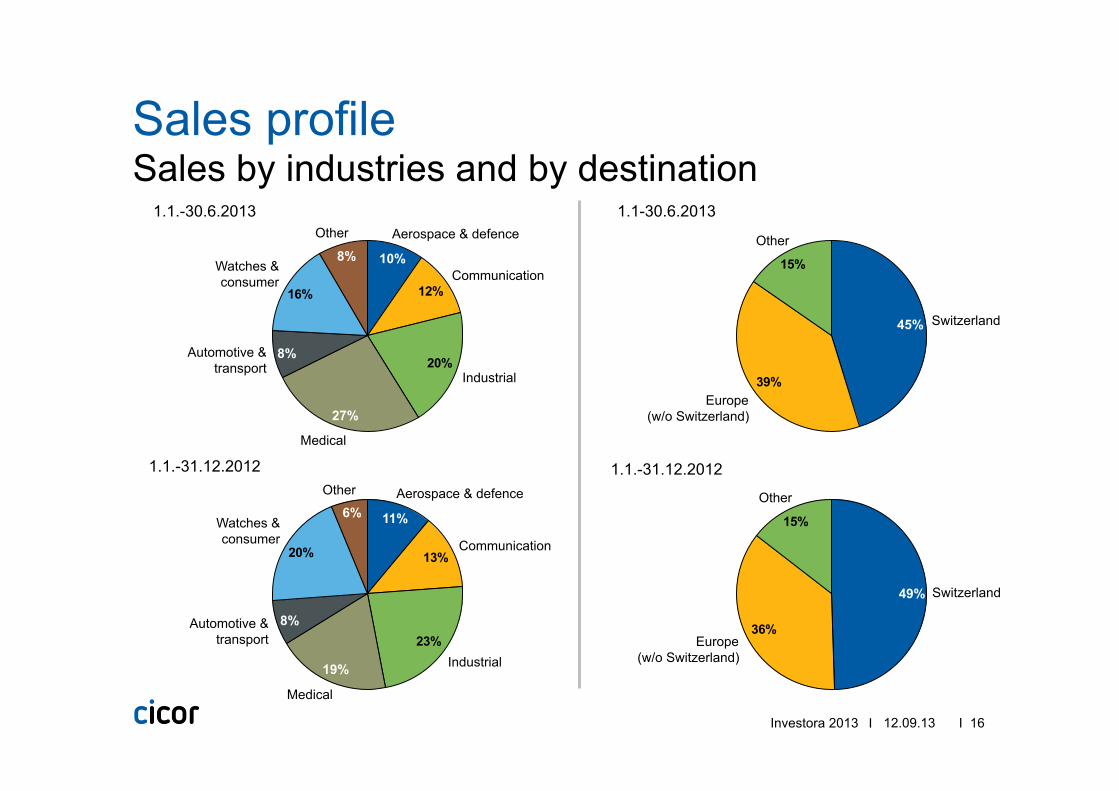
Sales by industries and by destination Sales profile
Investora 2013 12.09.13
16% 12%
20%
Other
8% Watches & consumer
Automotive & transport
8%
Medical
27%
Industrial
Communication
Aerospace & defence
10%
20% 13%
23%
Medical
19% Industrial
Communication
Aerospace & defence
11%
Other
6% Watches & consumer
Automotive & transport
8%
39%
15%
Other
Europe (w/o Switzerland)
Switzerland 45%
15%
36%
Other
Europe (w/o Switzerland)
Switzerland 49%
1.1.-30.6.2013
1.1.-31.12.2012
1.1-30.6.2013
1.1.-31.12.2012

I 17 I
Key-Figures HY1 2013 vs. 2012
Investora 2013 12.09.13
Net sales EBIT EBITDA
+9,0%
2013
99 736
2012
91 537 94 251
+11,7%
2012
84 380
2013
2 525
2012
2 853
+13,0%
2013
7 180
+10,8%
2013 2012
6 482
-10,9%
2013
1 197
2012
1 344
§ 2012 figures restated as a result of the implementation of IAS 19 (revised) § Results HY1 2012 including 305 TCHF gains from asset sale Unterägeri
7,6%
7,7%
RO
S: 3
,0%
RO
S: 3
,0%
1,3%
1,6%
Net profit (before minorities)
(all figures in TCHF at actual FX rates)
Order intake
I 18 I
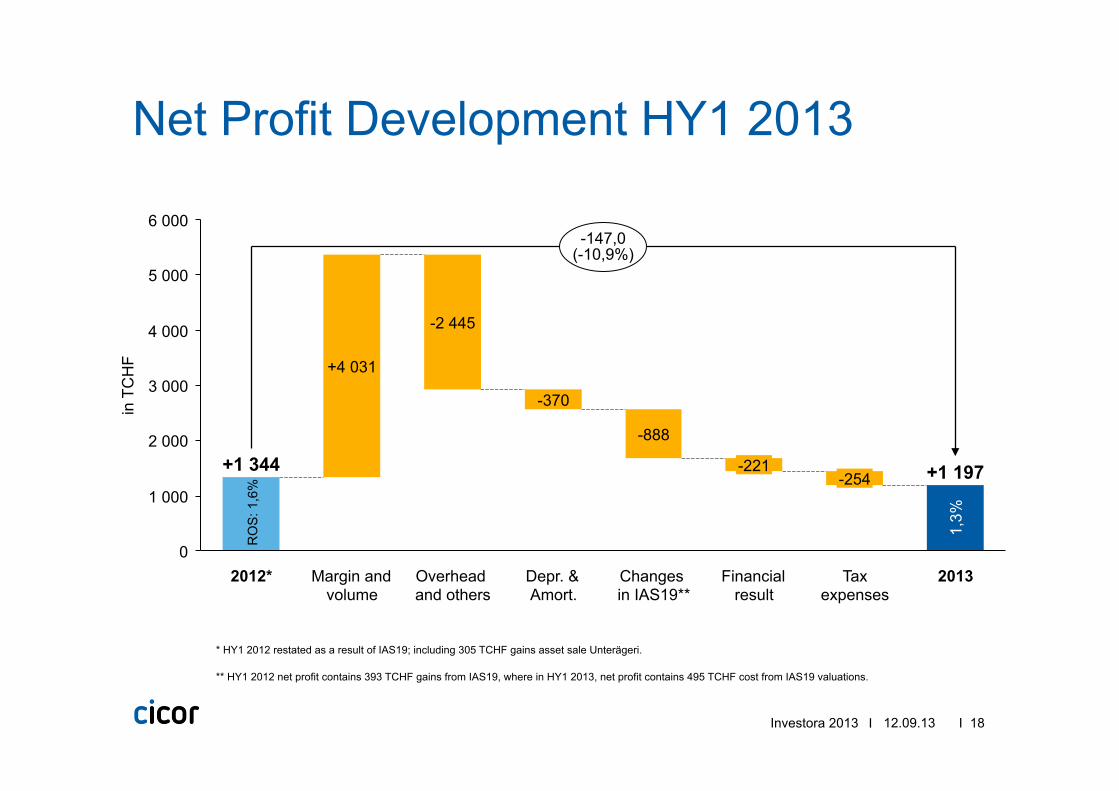
Net Profit Development HY1 2013
Investora 2013 12.09.13
3 000
6 000
5 000
2 000
1 000
0
4 000
in T
CH
F
2012*
+1 344 -888
Margin and volume
Changes in IAS19**
-2 445
Overhead and others
-370
Depr. & Amort.
-147,0 (-10,9%)
2013
+1 197
Tax expenses
-254
Financial result
-221
+4 031
1,3%
RO
S: 1
,6%
* HY1 2012 restated as a result of IAS19; including 305 TCHF gains asset sale Unterägeri.
** HY1 2012 net profit contains 393 TCHF gains from IAS19, where in HY1 2013, net profit contains 495 TCHF cost from IAS19 valuations.

I 19 I
Asia with highest growth rates
Divisional Results HY1 2013 vs. 2012
Investora 2013 12.09.13
PCB 2012* 2012** 2013 %YoY
Total Sales 16 648 15 734 16 003 +1,7%
EBITDA 3 459 2 239 2 388 +6,6%
ROS% 22,0% 14,2% 14,9%
ME 2012 2013 %YoY
Total Sales 13 829 15 388 +11,3%
EBITDA -35 1 369 >100%
ROS% NA 8,9%
ES 2012 2013 %YoY
Total Sales 43 350 46 418 +7,1%
EBITDA 3 442 3 114 -9,5%
ROS% 7,9% 6,7%
Asia 2012 2013 %YoY
Total Sales 11 132 17 410 +56,4%
EBITDA 810 1 573 +94,2%
ROS% 7,3% 9,0%
49%
Asia
18%
PCB
17%
ME 16%
ES
13%
52%
16%
19%
ES
Asia PCB**
ME
HY1 2013 sales by division
** PCB figures excluding effects from closing Unterägeri * PCB figures including effects from closing Unterägeri, for information only
Note: 2012 EBITDA figures restated as a result of IAS19
(all figures in TCHF at actual FX rates)
HY1 2012 sales by division
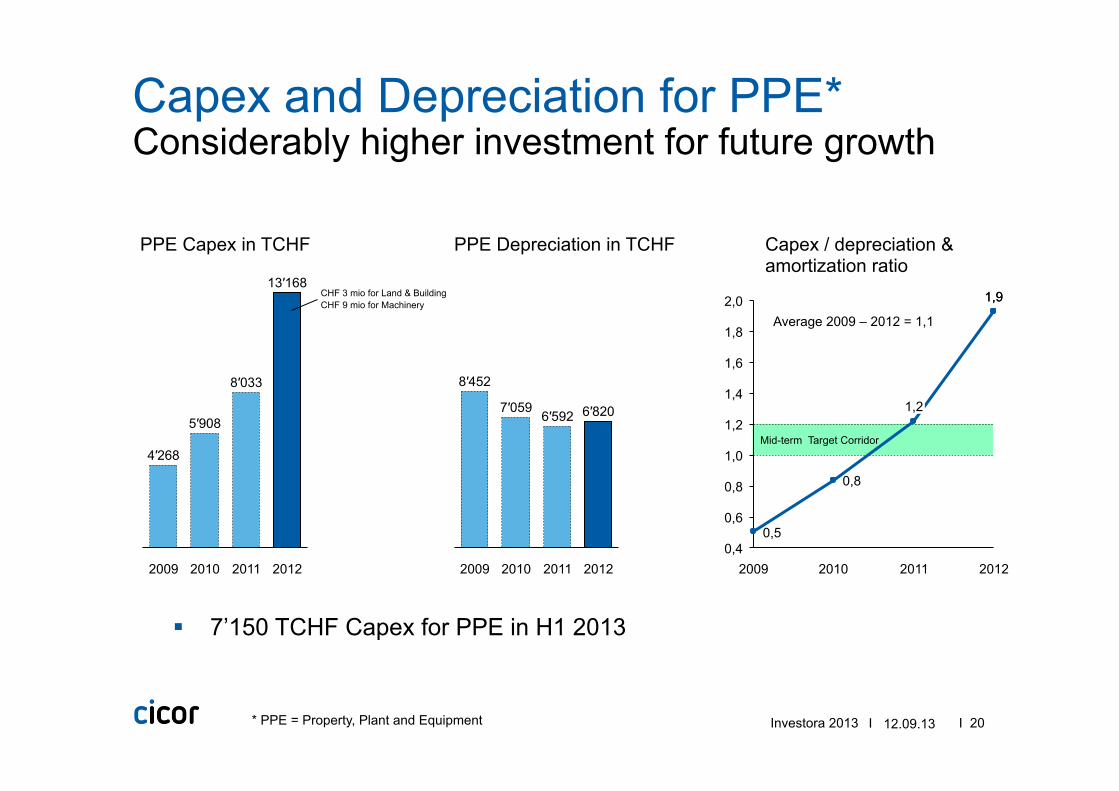
I 20 I
Mid-term Target Corridor
Considerably higher investment for future growth Capex and Depreciation for PPE*
2012
6′820
2011
6′592
2010
7′059
2009
8′452
PPE Capex in TCHF PPE Depreciation in TCHF Capex / depreciation & amortization ratio
* PPE = Property, Plant and Equipment
2012
13′168
2011
8′033
2010
5′908
2009
4′268
Investora 2013 12.09.13
CHF 3 mio for Land & Building CHF 9 mio for Machinery
Average 2009 – 2012 = 1,1 2,0
1,8
1,6
1,4
1,2
1,0
0,8
0,6
0,4 2010
0,8
2009
0,5
2012
1,9 1,9
2011
1,2
§ 7’150 TCHF Capex for PPE in H1 2013
I 21 I
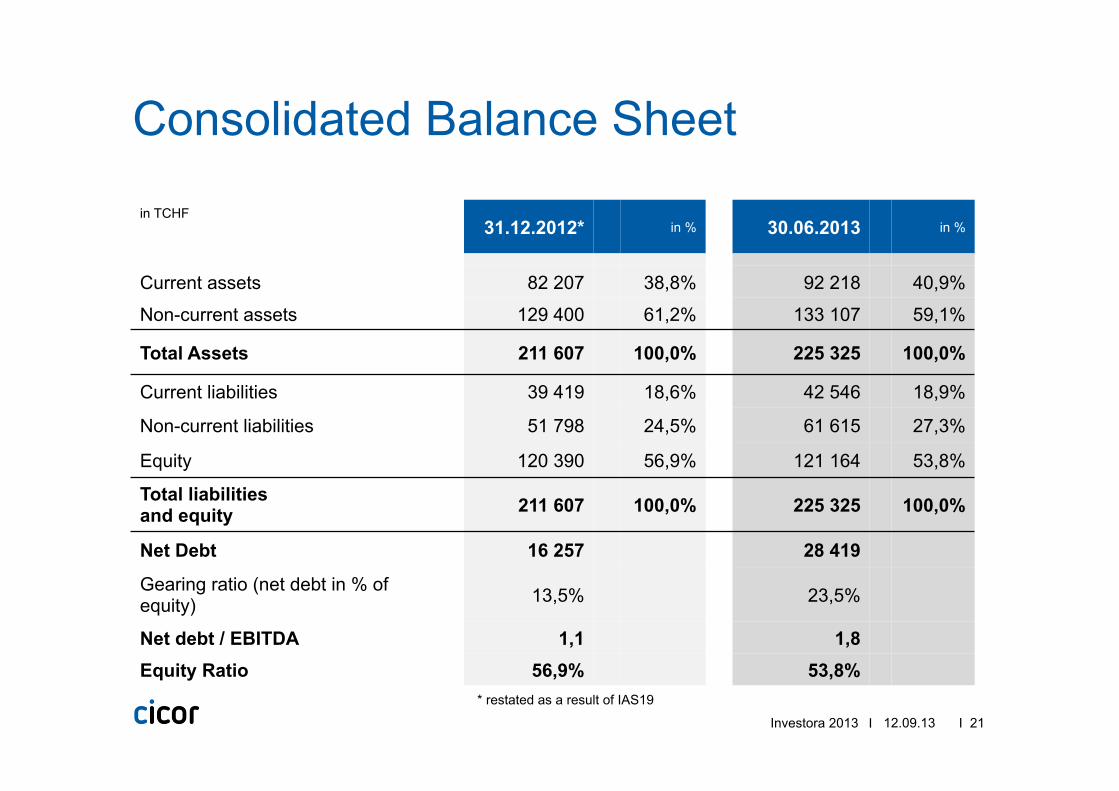
Consolidated Balance Sheet
Investora 2013 12.09.13
in TCHF 31.12.2012* in % 30.06.2013 in %
Current assets 82 207 38,8% 92 218 40,9%
Non-current assets 129 400 61,2% 133 107 59,1%
Total Assets 211 607 100,0% 225 325 100,0%
Current liabilities 39 419 18,6% 42 546 18,9%
Non-current liabilities 51 798 24,5% 61 615 27,3%
Equity 120 390 56,9% 121 164 53,8%
Total liabilities and equity 211 607 100,0% 225 325 100,0%
Net Debt 16 257 28 419
Gearing ratio (net debt in % of equity) 13,5% 23,5%
Net debt / EBITDA 1,1 1,8 Equity Ratio 56,9% 53,8%
* restated as a result of IAS19
I 22 I
Disclaimer
The information in this presentation does not constitute an offer or invitation and may not be construed as a recommendation by us to purchase, hold or sell shares of Cicor Technologies Ltd. This information or any copy thereof may not be sent or taken to or distributed in any jurisdiction in which such transmission or distribution is unlawful. This document may contain certain ‘forward-looking’ statements. By their nature, forward-looking statements involve risk and uncertainty because they relate to future events and circumstances. Actual outcomes and results may differ materially from any outcomes or results expressed or implied by such forward-looking statements.
12.09.13 Investora 2013
I 23 I
www.cicor.com
Investora 2013 12.09.13