cid working paper no. 101 :: democratic transitions by ... · research in debating the ... by...
TRANSCRIPT

Democratic Transitions
David L. Epstein, Robert Bates, Jack Goldstone, Ida Kristensen, and Sharyn O’Halloran
CID Working Paper No. 101
January 2004
Copyright 2004 David L. Epstein, Robert Bates, Jack
Goldstone, Ida Kristensen, and Sharyn O’Halloran and the President and Fellows of Harvard College
at Harvard UniversityCenter for International DevelopmentWorking Papers

Democratic Transitions
David L. Epstein, Robert Bates, Jack Goldstone, Ida Kristensen, and Sharyn O’Halloran*
Abstract Recent studies of democratization, most importantly Przeworski, Alvarez, Cheibub, Limongi, 2000 (PACL), question the modernization hypothesis that richer countries are more likely to be democratic. PACL claim instead that transitions to democracy are unpredictable, but once there, countries can remain democratic with higher levels of GDP per capita. We retest this hypothesis using an expanded data set and a three-way, rather than two-way, categorization of regimes: autocracies, partial democracies, and full democracies. We find that the modernization theory does hold up well, contrary to PACL’s findings: greater levels of prosperity do predict when countries are likely to leave autocracy and stay fully democratic. Partial democracies, on the other hand, emerge as the most volatile and least predictable category of regimes. We also find considerable support for Acemoglu and Robinson’s (2002) theories on inequality and transitions. Our analysis highlights the need to better understand the workings of partial, or unconsolidated, democracies, as these are also the countries most likely to enter external wars or fall prey to internal failure. Keywords: Growth, Africa, institutions, democracy, governance. JEL Codes: H10, P51, P52, Z13 ________________________________________________________________ *Epstein, Kristensen, and O’Halloran: Department of Political Science, Columbia University; Bates: Department of Government, Harvard University; Goldstone: Department of Sociology, UC Davis. Paper prepared for presentation at the Midwest Political Science Association meetings, Chicago, IL, April 3-6, 2003. Preliminary Draft; comments welcome.

1 Introduction
The study of democratization is one of the most venerable literatures in comparative politics. Itis also one of the most vigorous, as controversies over theory and method interact with empiricalresearch in debating the origins and determinants of democratic forms of government. In recentyears, however, an uncharacteristic lull seems to have descended on this vibrant field — a lull weattribute to the need to absorb the pivotal contribution of Prezworski, Alvarez, Chibu, and Limogi(2000) (hereafter referenced PACL). Rather than igniting debate, as would be right and proper,PACL appears instead to have quenched it.
Among the most famous of PACL’s findings is that modernization is not systematically relatedto democracy. Rather, the positive association between the two, they argue, results from thereduced likelihood of more modern countries sliding back, as it were, into undemocratic formsof government, once they have (randomly) become democratic. This finding is now treated asincontrovertible.
In this article, however, we demonstrate it to be wrong. The grounds for this contention emergefrom within the field itself. For as in any established literature, in the study of democratization,debates over method and theory inform, and are informed by, empirical investigation. It is byattending to these debates that we have been led to dissent from the consensus precipitated byPACL’s contribution.
Some of the oldest debates in this field center on issues of measurement. In some instances, aswhen addressing the core properties of a democracy (e.g. Dahl (1971) on polyarchy), these debatesare richly substantive. Other times — as when debating whether democracy is best thought ofas a discrete or continuous concept, or, if discrete, as a dichotomy or trichotomy (e.g., Collierand Adcock 1999) — they appear trivial. Appearances can be deceiving, however. Shifting fromthe dichotomous classification of political systems, in which governments are either democratic orauthoritarian, leads us to reassess the validity of PACL’s results. Within a continuous or eventrichotomous classification scheme, measures of modernization, we find, do significantly associatewith movements toward higher levels of democracy. Put another way, the findings of PACL appearnot to be robust to even seemingly trivial changes in coding methods.
At least as vigorous as the debates over method are those over theory, and these too shape thispaper. In particular, we have been influenced by the recent contributions of political economiststo this field. As do Prezworski (1991) and O’Donnell and Schmitter (1986), political economists— such as Rosendorff (2001) and Acemoglu and Robinson (1999; 2000) — tend to downplay theanalysis of sociological or economic aggregates and their relationship to democracy, as practicedby earlier contributors to the field (e.g., Lerner 1958 and Deutsch 1961). They instead tend toemphasize strategy and choice, particularly by incumbent elites. As do Haggard and Kaufman(1995), they place institutions at the forefront of their analysis; they differ, however, in tending toview institutions as objects of, rather than constraints upon, the choices of strategic actors.
Lastly, political economists place struggles over distribution at the center of their analysis.Thus Acemoglu and Robinson (1999, 2002) argue that democratization results when the loss of
2
income arising from the transfer of power exceeds the costs of resisting that transition; under suchcircumstances, they hypothesize, incumbent elites will repress calls for democracy. Acemoglu andRobinson thus view democratization as offering the elite a way of eluding the costs of repressionby credibly assuring the majority of their intent to share the wealth of the nation. Their analysisoffers the important, and less than obvious, prediction that the relation between inequality anddemocracy will have an inverse-U shape: at high levels of inequality the elite represses, while atlow levels they can accommodate redistributive demands within the authoritarian system. It isthus at intermediate levels of inequality that transitions to democracy are most likely to occur.Similarly, countries with more inequality are more likely to experience coups against democracy,making democratic consolidation more difficult.
Rosendorff (2001) offers a similar argument, but renders the costs of resistance endogenous.Like Haggard and Kaufman (1995), Rosendorff stresses the importance of short-term economicconditions on the behavior of elites. While the former stress the significance of growth shocks andinflation, Rosendorff emphasizes changes in the stock of capital and size of the workforce and theirimpact on the contest function that yields the costs of repression.
In this article, then, we too focus on the relationship between modernization and democracy.When we refer to modernization, we refer not only to its sociological correlates, such as literacy, butalso to measures of economic development, such as the size of the workforce and, most centrally,the level of per capita income. In reacting to the contributions of PACL, we employ more finelygrained measures of democracy. And in responding to the contributions of political economists, wedevelop and deploy an indirect measure of income inequality.
From our analysis we learn a) that modernization is systematically related to democratization;b) that income inequality, and its square, are systematically related to democratization; and c)that the frontier of this field has therefore shifted. It has shifted from the study of autocracies anddemocracies to the study of partial democracies (see also Geddes 1999). These systems have becomemore numerous. As we show here, their behavior influences level and rate of democratization; aswe demonstrate elsewhere (Esty, Goldstone, et. al. 1998), their behavior influences the level ofconflict in the modern world. While thus influential, these systems, being highly heterogeneous,are poorly understood. The study of democratization, we therefore conclude, should place them atits focus.
The following section reviews the data used in our analysis, including our measure of partialdemocracies, previous experiences with democratization, and a new measure of inequality. We thensummarize the statistical techniques used in our analysis: Markov, tobit, and duration models.The next section presents our results, using our methods to evaluate the alternative theories ofdemocratization and consolidation. The last section concludes.
3

2 Identifying Partial Democracies
Among the most hotly debated issues in the study of democratization is that of the choice ofmeasures (see, for example, Bollen and Jackman 1989; Collier and Adcock 1999). As we haveobserved, the study by PACL employs a dichotomous classification. If (i) the chief executive iselected; (ii) the legislature is elected; (iii) there is more than one political party; and (iv) anincumbent regime has lost power, then the country is deemed democratic; otherwise, it is classifiedauthoritarian. Consider, however, the 85 authoritarian regimes that Geddes (1999, pp. 115-16)records as having collapsed during the “third wave.” Of these, 34 re-emerged as authoritarianregimes, and 30 as stable democracies; 21 others, however, remained contested and unstable, shenotes, and of these, four descended into “warlordism.” Geddes’ discussion thus reminds us of thesignificance of partial democracies, a category that dichotomous measures fail to — indeed, cannot— address.
In fact, we find that in our data on all countries from 1955-2000, there were only 16 transitionsfrom full democracy to autocracy, and 22 reverse transitions from autocracy to full democracy.However, there were a total of 149 transitions into or out of partial democracy. This is particularlystriking in that at any point in time, the percentage of partial democracies is always under 30% ofall regimes (see Figure 1). Nonetheless, movement into and out of this intermediate categoryclearly dominates the dynamics of regime transitions. Moreover, as Figure 1 also shows, thepercentage of partial democracies among the world’s societies has grown markedly since the collapseof communism. Understanding the dynamics of movement into and out of this category is thereforelikely to be of increased importance for future transitions to democracy.
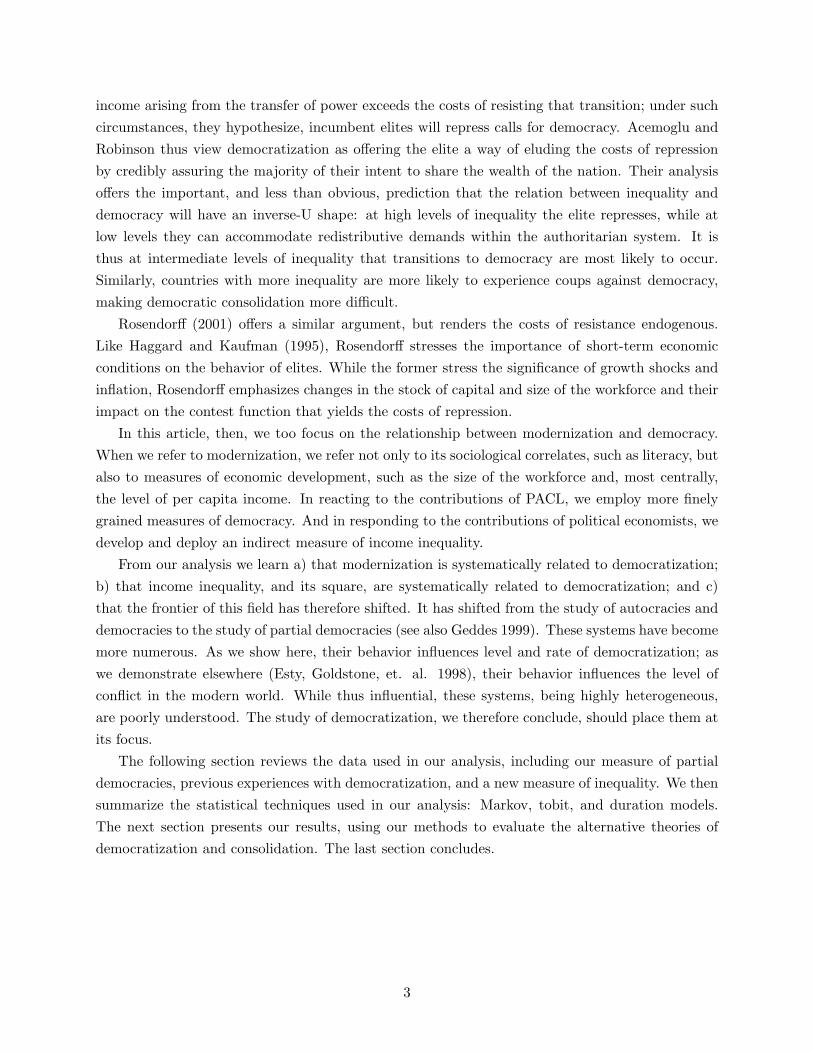
Breaking down the overall pattern, Figure 2 shows the distribution of autocratic, partial, anddemocratic countries over time by region. This figure shows that the largest decline in autocraticstates and the largest increase in democratic states have been taking place in South, North andCentral America, whereas the number of autocratic states fell dramatically in Europe as the collapseof communist states began taking place in the late 1980’s. Africa and Asia show similar patternsas the one depicted in Figure 1 for all states, although those two regions generally have fewerdemocracies and more autocracies than the world average. Finally, Australia has been a stableregion, having only democratic countries until Fiji slid to partial democracy in 1990.
Whereas Figures 1 and 2 show the overall patterns of democratization, Tables 1 and 2 andFigure 3 take the individual countries as the unit of analysis. Table 1 shows the distribution ofautocracies, partial democracies, and democracies, conditioning by the previous year’s category.The table reveals that both autocracies and full democracies are quite stable in the short run. Anaverage of 97.5% of all autocracies stay autocratic the next year, while an average of 98.1% of alldemocracies remain democratic the following year; thus around 2% of countries in these categorieschange in a given year. Partial democracies are almost four times less stable, with 8% of themchanging into an autocracy or a democracy the following year.
Table 2 expands the time horizon to five years and hence shows the distribution of autocracies,partial democracies, and democracies by the democratization level of the countries five years earlier.
4

0%
10%
20%
30%
40%
50%
60%
70%
80%
90%
100%
1955
1957
1959
1961
1963
1965
1967
1969
1971
1973
1975
1977
1979
1981
1983
1985
1987
1989
1991
1993
1995
1997
1999
Year
DemocracyPartialAutocracy
Figure 1: World Democratization Trends, 1955-2000
Table 1: Polity Transitions— One Year Lag
Polity Index
Previous Year Autocracy Partial Democracy DemocracyAutocracy 97.47% 1.89% 0.63%Partial Democracy 5.12% 91.97% 2.9%Democracy 1.00% 0.87% 98.13%
5
South America
EuropeAustralia
Africa Asia
North & Central America
Figure 2: Regional Democratization Trends, 1955-2000
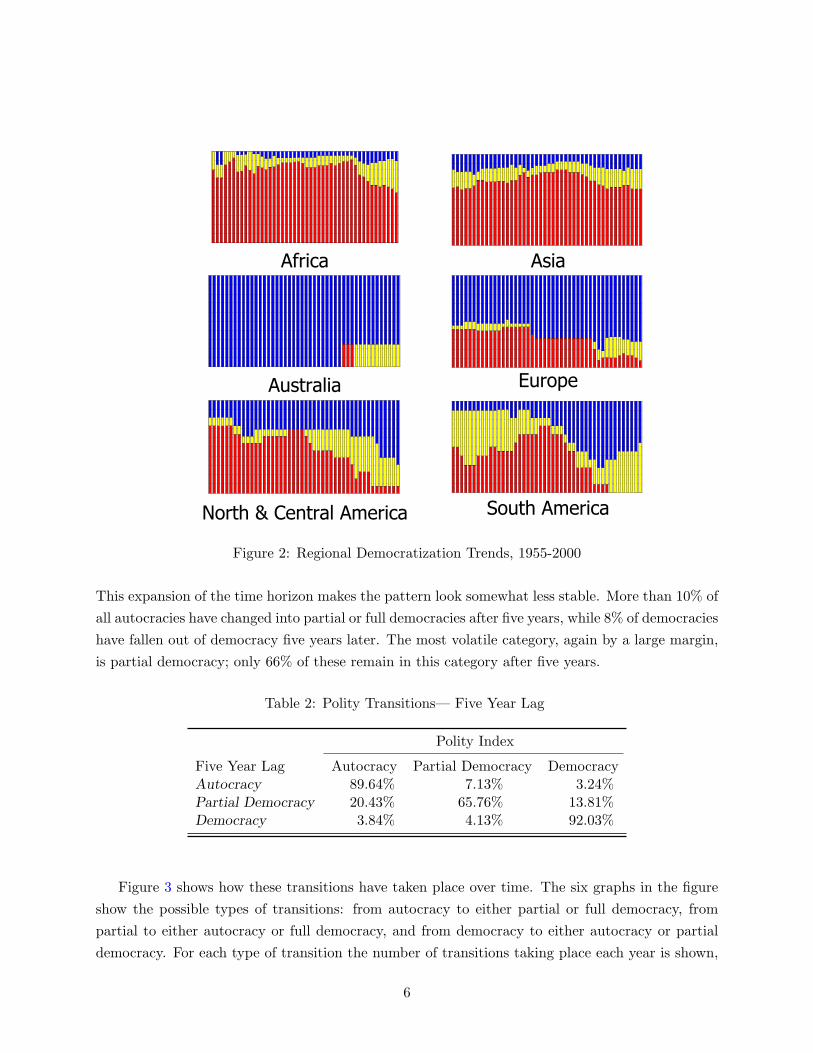
This expansion of the time horizon makes the pattern look somewhat less stable. More than 10% ofall autocracies have changed into partial or full democracies after five years, while 8% of democracieshave fallen out of democracy five years later. The most volatile category, again by a large margin,is partial democracy; only 66% of these remain in this category after five years.
Table 2: Polity Transitions— Five Year Lag
Polity Index
Five Year Lag Autocracy Partial Democracy DemocracyAutocracy 89.64% 7.13% 3.24%Partial Democracy 20.43% 65.76% 13.81%Democracy 3.84% 4.13% 92.03%
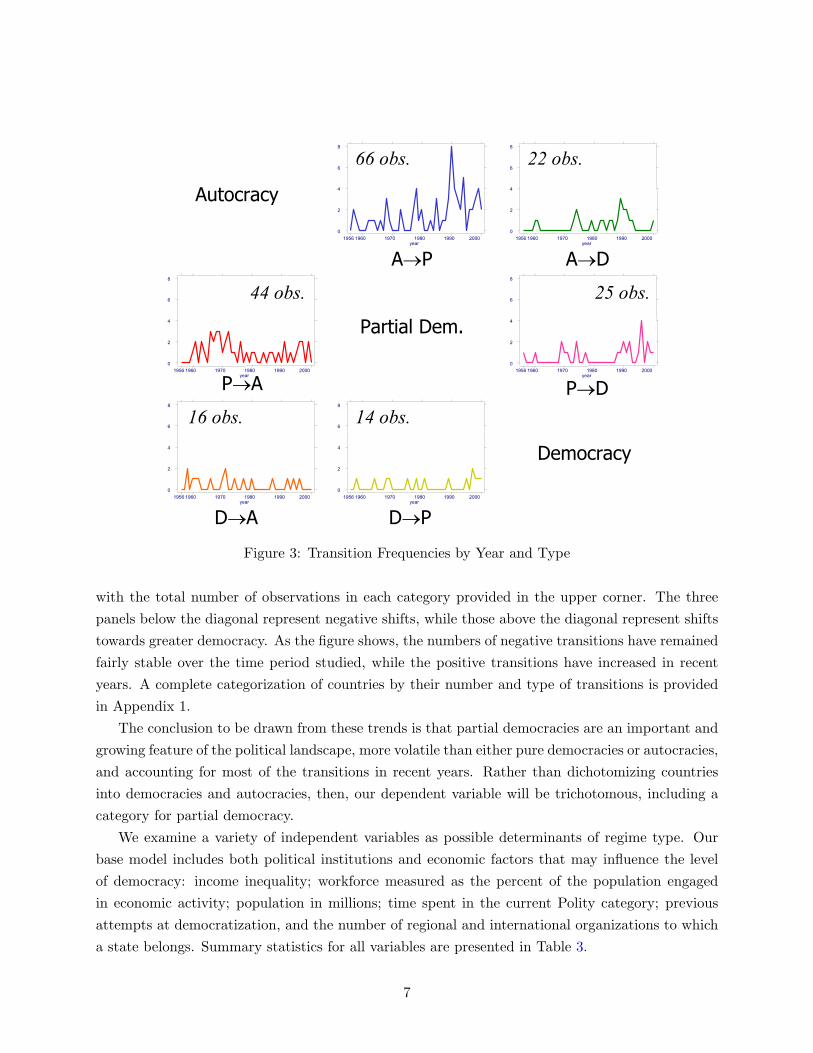
Figure 3 shows how these transitions have taken place over time. The six graphs in the figureshow the possible types of transitions: from autocracy to either partial or full democracy, frompartial to either autocracy or full democracy, and from democracy to either autocracy or partialdemocracy. For each type of transition the number of transitions taking place each year is shown,
6
A→P A→D
Autocracy
year1956 1960 1970 1980 1990 2000
0
2
4
6
8
year1956 1960 1970 1980 1990 2000
0
2
4
6
8
P→DP→A
Partial Dem.
year1956 1960 1970 1980 1990 2000
0
2
4
6
8
year1956 1960 1970 1980 1990 2000
0
2
4
6
8
D→A D→P
Democracy
year1956 1960 1970 1980 1990 2000
0
2
4
6
8
year1956 1960 1970 1980 1990 2000
0
2
4
6
8
66 obs.
16 obs. 14 obs.
44 obs. 25 obs.
22 obs.
Figure 3: Transition Frequencies by Year and Type
with the total number of observations in each category provided in the upper corner. The threepanels below the diagonal represent negative shifts, while those above the diagonal represent shiftstowards greater democracy. As the figure shows, the numbers of negative transitions have remainedfairly stable over the time period studied, while the positive transitions have increased in recentyears. A complete categorization of countries by their number and type of transitions is providedin Appendix 1.
The conclusion to be drawn from these trends is that partial democracies are an important andgrowing feature of the political landscape, more volatile than either pure democracies or autocracies,and accounting for most of the transitions in recent years. Rather than dichotomizing countriesinto democracies and autocracies, then, our dependent variable will be trichotomous, including acategory for partial democracy.
We examine a variety of independent variables as possible determinants of regime type. Ourbase model includes both political institutions and economic factors that may influence the levelof democracy: income inequality; workforce measured as the percent of the population engagedin economic activity; population in millions; time spent in the current Polity category; previousattempts at democratization, and the number of regional and international organizations to whicha state belongs. Summary statistics for all variables are presented in Table 3.
7

Table 3: Descriptive statistics for variables used in regression analysis
Variable Description Mean Std. Dev. Min MaxPolity Score -10 to 10 score indicating
country’s level of democ-ratization
-0.50 7.62 -10 10
Inequality Residual from infant mor-tality regression
0.00 0.48 -1.64 1.74
Workforce % of population engagedin economic activity
0.43 0.08 0.14 0.71
Population In millions 0.026 0.098 0.000035 1.28Time in Cur-rent Polity Cat-egory
Number of years inautocracy/partial/fulldemocracy
10.42 11.59 0 45
Previous De-mocratization(Sumdown)
Sum of absolute value ofdownward shifts in PolityScore
0.29 0.69 0 5
Memberships inRegional Orgs.
Number of membershipsin regional organizations
9.97 8.43 0 46
Memberships inInternationalOrgs.
Number of membershipsin international organiza-tions
35.70 17.62 0 98
Log GDP percapita
Log of per capita grossdomestic product
7.37 1.53 4.34 10.77
InequalitySquared
Square of infant mortalityresidual
0.23 0.36 0.00 3.03
∆ Workforce(1 year)
One-year % change inworkforce
0.00068 0.0049 -0.15 0.075
∆ Workforce(5 year)
Five-year % change inworkforce
0.00006 0.029 -1.02 0.69
∆ Log CapitalStock (1 year)
One-year % change inphysical capital stock
0.035 0.047 -0.22 0.35
∆ Log CapitalStock (5 year)
Five-year % change inphysical capital stock
-0.00056 0.141 -1.27 1.68
GDP Growth % change in GDP percapita
0.016 0.058 -0.44 0.77
Log of Inflation Log of % change in pro-ducer price index
2.12 3.995 -25.02 8.08
8

Of the other theories, modernization predicts that GDP per capita is a consistent predictor ofmoves towards democracy, while PACL would claim that it only helps current democracies remaindemocratic, but does not predict other movements up the Polity scale.
To test Acemoglu and Robinson’s approach, we add squared inequality to the base model, wherethe prediction is that this term will have a negative and significant coefficient. For Rosendorff, weadd the change in workforce and capital stock; the prediction is that these will have negative andsignificant coefficients, as will the level of inequality. And for Haggard and Kaufman, we includeGDP growth and the log of inflation, which should enter with negative and positive coefficients,respectively.
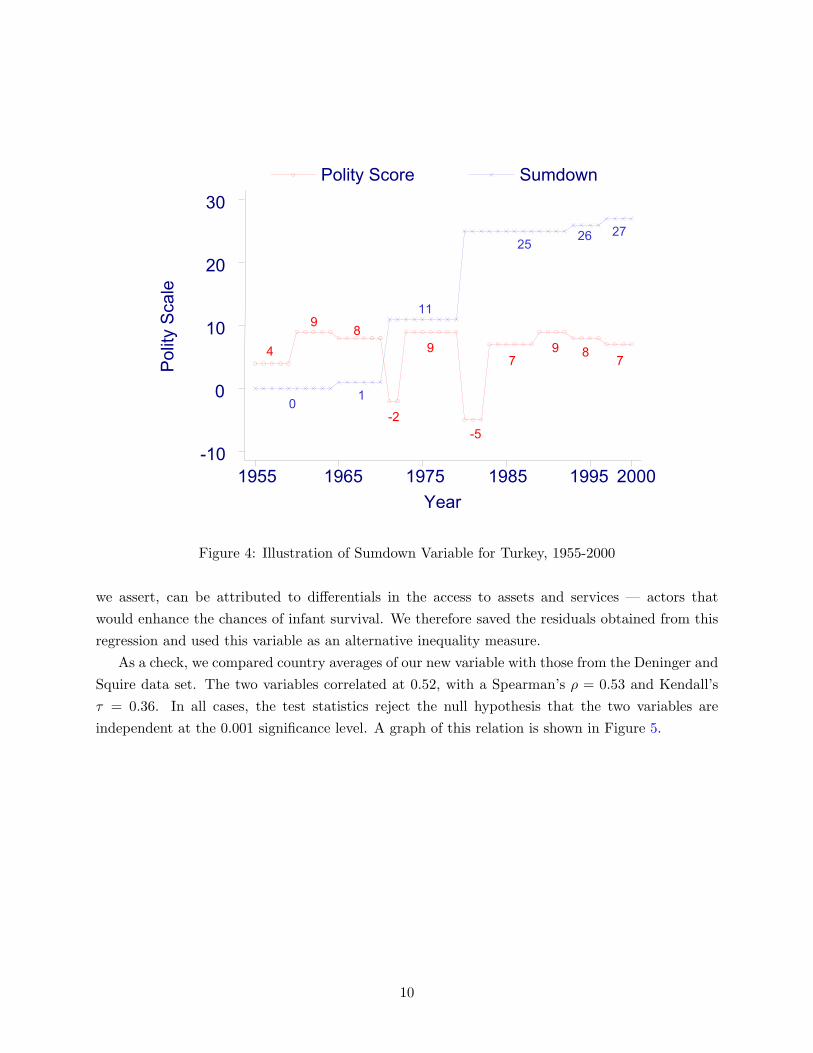
Of the variables in the base model, two merit further comment. Although many observersrefer to the fact that a country’s previous transition history may affect current attempts atdemocratization, this history is difficult to measure. We finally settled on a variable, Sumdown,which is the cumulative sum at any given time of a country’s previous transitions down since 1955,as measured by the Polity score.
To illustrate the construction of this variable, Figure 4 provides the values of both the Polityscore and the Sumdown variables for Turkey from 1955 to 2000. As shown, the Polity score forTurkey varied widely over this period, from 4 up to 9, down to -2, back up to 9, back down to-5, up to 9, and then finally down to 7. Sumdown is the cumulative sum of the absolute valuesof negative changes in the Polity Score. Hence, as long as the Polity Score remains unchanged orincreases, the Sumdown variable does not change (as in Turkey up to the year of 1964). Whenthe Polity Score decreases, Sumdown increases. Therefore, when Turkey’s score fell from 9 to 8 in1965, Sumdown went from 0 to 1. Likewise, when it fell 14 points from 9 to -5 in 1980, Sumdownincreased 14 points (from 11 to 25). Thus the period from 1964 to 1971 represents a failed attemptat democratization, with a total drop of 11 points. The next attempt failed similarly, with a drop of14 points. Thus the sum of the drops in the Polity Score provides a good indicator of the country’snegative experiences with democratization in the past.
The level of inequality in the country also features in many of the democratization theories; butunfortunately even our best direct measures provide scanty coverage. The well-known Deningerand Squire (1995) data set, using the gini-coefficient to measure income inequality, has data foronly 42% of our cases. Given these limitations, we constructed an alternative inequality measurebased on the idea that the expected value of infant mortality results from a combination of averageliving standards and inequality in access to private assets and public services. To parse out theeffect of inequality on infant mortality, and hence to obtain an alternative inequality variable, weregressed infant mortality on access to safe water, access to health care, health expenditures percapita, total health expenditures, calories per capita per day, a standard of living index, reportsof famine, people affected by drought, people affected by earthquakes, people affected by floods,people affected by unnamed storms, and people affected by named storms. These variables capturethe average level if social and economic development and shocks to that level resulting from naturaldisasters. Given these determinants of infant mortality, a major portion of the residual variability,
9
Polit
y Sc
ale
Year
Polity Score Sumdown
1955 1965 1975 1985 1995 2000-10
0
10
20
30
48
-2
9
-5
79 8 7
9
0 1
11
25 26 27
Figure 4: Illustration of Sumdown Variable for Turkey, 1955-2000
we assert, can be attributed to differentials in the access to assets and services — actors thatwould enhance the chances of infant survival. We therefore saved the residuals obtained from thisregression and used this variable as an alternative inequality measure.
As a check, we compared country averages of our new variable with those from the Deninger andSquire data set. The two variables correlated at 0.52, with a Spearman’s ρ = 0.53 and Kendall’sτ = 0.36. In all cases, the test statistics reject the null hypothesis that the two variables areindependent at the 0.001 significance level. A graph of this relation is shown in Figure 5.
10
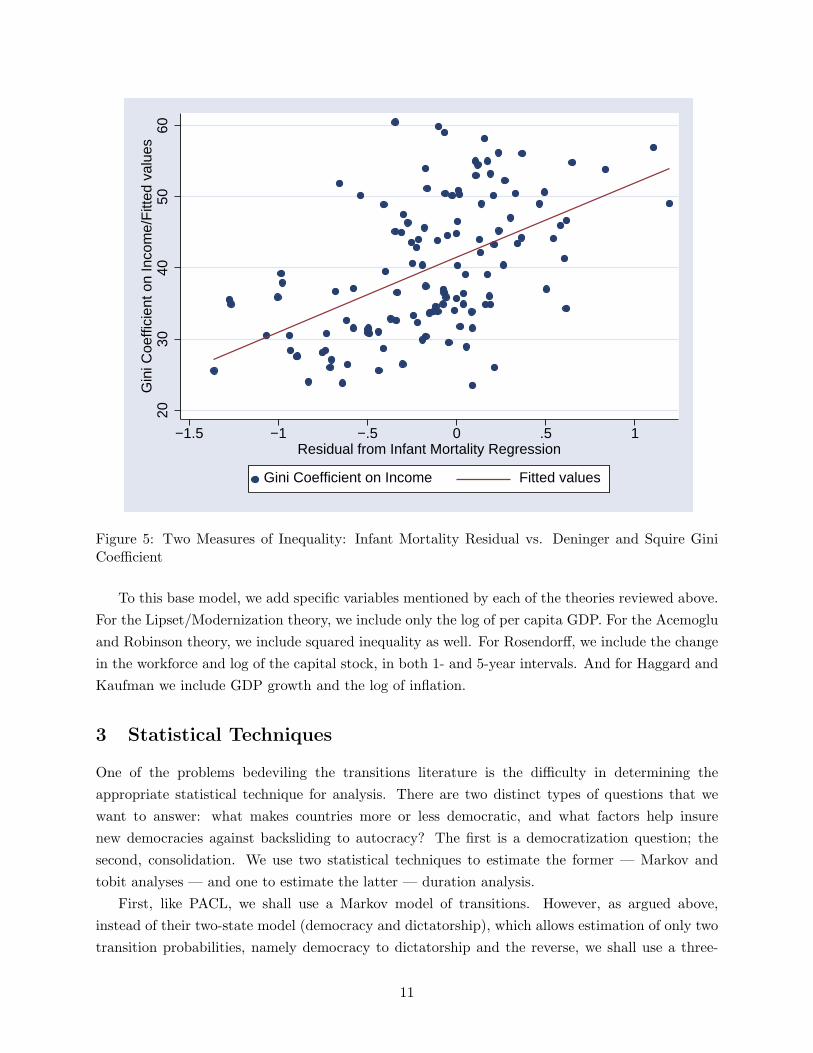
2030
4050
60G
ini C
oeffi
cien
t on
Inco
me/
Fitt
ed v
alue
s
−1.5 −1 −.5 0 .5 1Residual from Infant Mortality Regression
Gini Coefficient on Income Fitted values
fi
Figure 5: Two Measures of Inequality: Infant Mortality Residual vs. Deninger and Squire GiniCoefficient
To this base model, we add specific variables mentioned by each of the theories reviewed above.For the Lipset/Modernization theory, we include only the log of per capita GDP. For the Acemogluand Robinson theory, we include squared inequality as well. For Rosendorff, we include the changein the workforce and log of the capital stock, in both 1- and 5-year intervals. And for Haggard andKaufman we include GDP growth and the log of inflation.
3 Statistical Techniques
One of the problems bedeviling the transitions literature is the difficulty in determining theappropriate statistical technique for analysis. There are two distinct types of questions that wewant to answer: what makes countries more or less democratic, and what factors help insurenew democracies against backsliding to autocracy? The first is a democratization question; thesecond, consolidation. We use two statistical techniques to estimate the former — Markov andtobit analyses — and one to estimate the latter — duration analysis.
First, like PACL, we shall use a Markov model of transitions. However, as argued above,instead of their two-state model (democracy and dictatorship), which allows estimation of only twotransition probabilities, namely democracy to dictatorship and the reverse, we shall use a three-
11
state model. Using the Polity IV scaling of regimes from +10 to -10 (Marshall and Jaggers 19??),we define regimes as Full Autocracies (Polity value -10 to 0), Partial Democracies (+1 to +7), andFull Democracies (+8 to +10). This allows us to estimate six distinct transitions: Autocracy toPartial Democracy, Partial Democracy to Full Democracy, and Autocracy to Full Democracy, aswell as the reverse of each. The Markov model allows us to treat each of these six transitions asdistinct, and to search for causal factors associated with each kind of change.
In addition, we shall examine democratization using a method that allows an explicit means ofcontrolling for the fact that our data is necessarily censored — that is, our scale is limited to the -10to +10 range, perhaps artificially. So we use a double-censored tobit model for these estimationsas well, which allows us to use the full range of Polity values, rather than categories or ranges ofvalues.
To investigate the consolidation question, duration models are appropriate. These weredeveloped in biometrics to estimate, for example, the factors affecting the survival of patientswith a given disease. In our setting the equivalent question is to determine what factors help anewly-fledged democracy survive.
Our analysis differs from the classic medical setting, though, in that each “patient” (or country,for us) can experience more than one episode of failure; they can fall out of democracy more thanonce. Hence we want to employ a repeated failures variant of the duration model. These modelsare becoming increasingly popular in political science, and our treatment of them owes much torecent work by Box-Steffensmeier and Zorn (2002).
Data Censoring
To examine the impact of data censoring, we first estimate a variant of linear regression known asa tobit model, where it is assumed that the data are censored at either or both ends of their rangeof values. That is, we assume
y∗t = xt(β) + εt, εt ∼ N(0, σ2), (1)
yt = y∗t if a ≤ y∗t ≤ b; yt = a if y∗t < a; yt = b if y∗t > b, (2)
where a and b are the upper and lower bounds of the interval, respectively. (For the Polity scaleused in this study, a = −10 and b = 10.) This gives rise to the log-likelihood function:
∑a≤y∗t≤b
log(1σ
φ(1σ
(yt −Xtβ))) +∑y∗t <a
log(Φ(1σ
(a−Xtβ))) +∑y∗t >b
log(Φ(− 1σ
(b−Xtβ))).
The first term corresponds to non-limit observations, the second to observations at the lower limita, and the third to observations at the upper limit b.1
The tobit methodology will give accurate estimates for processes in which data cannot beobserved out of some predetermined range. It also allows for the estimation of the percent of
1See Greene (2003), pp. 764-66 for a discussion of these models.
12

censored observations, in order to determine the degree to which the upper and lower limitsconstrain the estimation.
This part of the estimation, then, acts similarly to a standard least squares regression, and ittakes advantage of the full 21 point Polity scale when determining marginal effects. However, it isvulnerable to the criticism that moves up the Polity scale are caused by factors equal and oppositeto those driving moves down the scale. As PACL have shown, it is often the case that a given factormay have a different impact on transitions toward, or away from, greater democracy. We thereforesupplement the tobit analysis with a Markov switching model.
Markov Transition Model
The Markov model looks at a smaller number of possible democratization categories and thenestimates the probability of moving from any given state to any other state in a single period.Markov models analyze the transitions from a lagged y of zero, one, or two, to a current y of zero,one, or two, allowing for different processes based on the lagged value of y. While in principlethese processes could be based on totally different independent variables, it is notationally mostconvenient that the same variables affect both transition processes, but with different parameters.With this simplifying assumption, the transition model has
P (yt|yt−1 = 0) = Oprobit(xtα) (3)
P (yt|yt−1 = 1) = Oprobit(xtβ) (4)
P (yt|yt−1 = 2) = Oprobit(xtγ), (5)
where Oprobit is the ordered probit function. The key to this equation is that the parameter vectorsα, β, and γ are not constrained to be equal, so the transition probabilities can change dependingon whether the state starts out the period as an autocracy, partial, or full democracy. Due to theirflexibility, Markov transition models are becoming increasingly popular in political studies; see forinstance Jackman (2000) and Beck, Epstein, Jackman and O’Halloran (2001).
Survival Analysis
To investigate the consolidation question, we employ duration models. However, as mentionedabove, our application differs from the classic biometric scenario in two important ways: we thinkthat countries might have unit-specific heterogeneity, and they are subject to repeated failures.
First, it is clear that different countries might have different probabilities of failure due toparticularities of history, government, interest group configurations, and so on. In panel regressions,we would use fixed effects to account for this. In duration models, the equivalent notion is unit-specific “frailty,” written as
hi(t) = λi(t)νi,
where hi(t) is the hazard rate for observation i at time t and νi is an individual-specific factor which
13
operates multiplicatively on the hazard.If countries differ in their frailties, but these terms are left out of the estimating equation, then
there will be more variability in the actual hazard than the model is picking up (Omori and Johnson1993). Over time, this will cause observations to “select out” of the data; that is, low-frailty caseswill stay in, while high-frailty ones will drop out. The result is an underestimated hazard function,with a corresponding overestimate of the survival times. Not only will this lead to incorrectlyestimating the shape of the hazard; if the νi terms are correlated with the independent variables,then the coefficient estimates on these will be biased as well.
Analogously with panel data, these unit-specific effects can be estimated via fixed or randomeffects. In the survival context, fixed effects are not considered a good option (see Lancaster 2000),so a random-effects approach is much more common (Lancaster 1979, Vaupel et. al. 1979, 1981).This typically involves choosing a distribution for the νi’s; the most commonly-used is the gamma(1, θ) distribution, which we use here.
For the estimation, we first fit a standard proportional hazards model, and then choose a setof possible values for θ (e.g., {0, 0.1, 0.2, . . . , 4.0, 4.5, 5.0}). For each possible value of θ, we thengenerate an estimated “predicted frailty” for each observation:
νi =1 + θCi
1 + θH(Ti|Xi, β).
We then fit a second duration model, this time including the estimated νi terms as an additionalcovariate, with a fixed coefficient of 1.0 (that is, as an offset):
h(t) = h0(t)νi exp(Xiβ).
We then repeat these steps for each value of θ, replacing H(T ) with the value from the modelincluding the generated frailties, until convergence.
The second aspect of our data is that we can have repeated failures — countries can fall out ofdemocracy more than once, and we would not wish to impose a priori the requirement that thesefailures be independent of one another. In particular, methods that ignore correlations amongrepeated failures tend to underestimate the standard errors of the coefficients of interest.
To account for this, we require that our frailty terms not be independent, but rather correlatedacross observations. This can be done most simply at the country level, or more generally amongsome aggregation of countries, like continent or region. Our approach is to test down: start with amodel with shared frailties, and if these are not significant, remove this requirement and estimatea less restricted model instead.
4 Results
The results from the tobit model are illustrated in Table 4, which highlights some interestingregularities in the data. First, the results in our base model hold up well in all specifications:
14

countries are more likely to be democratic with low inequality, larger workforce participation,lower total population, less time in their current Polity category, fewer previous attemptsat democratization, fewer memberships in regional organizations, and more memberships ininternational organizations. The results on previous democratization attempts indicate thatcountries which experience many rises and falls tend to be more autocratic. But compare thesefinding to those of the Markov and duration models below.
Testing the modernization hypothesis, our results contradict those of PACL, in that GDP percapita is a consistently strong predictor of democracy. PACL find that the level of affluence in asociety has no impact on democratization, although democratic consolidation is more likely in anaffluent country. PACL “find it difficult to explain why dictatorships die and democracies emerge(137).” We, on the other hand, identify several variables that significantly affect democratization —GDP per capita being one of those variables. Thus, a higher level of GDP per capita is associatedwith a positive change in a country’s Polity score in models 2, 3, and 5. This finding is, of course,subject to the possible objection that the modernization variables describe well those countriesalready in democracy, but do not predict transitions out of autocracy. This possibility is addressedin the Markov transition analysis below.
On the other hand, our results support the predictions offered by Acemoglu and Robinson (1999;2002). The squared inequality variable is negative and significant, even when the untransformedinequality variable is included in the model as well. This highlights the importance of good theorybuilding in the study of democratization; economic disparities do influence the rate of democraticchange, but sometimes in less than obvious ways. It is in the intermediate range of inequality thatthe elite are forced to relinquish political power and democratize as a credible commitment towardsredistribution in the future.
Rosendorff’s predictions fare less well. There is indeed a negative and significant coefficient oninequality in model 4, as in the other models, but the coefficients on the change in capital stock andworkforce have positive coefficients, significant in one case. Neither are the Haggard and Kaufmanvariables significant predictors of democratic levels.
We now turn to the Markov analysis in Table 5, which addresses the question: Is a transitionfrom autocracy to partial democracy the same as a move from partial democracy to a stable,consolidated democracy? The table presents a summary of the α, β, and γ coefficients fromequations 3 through 5, with a blank square indicating that the coefficient was not significant at the5% level.
Once again our findings conflict with PACL. Table 5 indicates that they are right in assessingthat a high level of GDP makes it more likely than democracies will stay democratic. But,contrary to the PACL findings, GDP per capita also helps countries move from autocracy to partialdemocracy and hence begin their democratization process. And higher GDP also helps preventpartial democracies from backsliding to autocracy. Thus at every stage, the original modernizationtheory seems to be a good description of reality.
A few other results from the Markov analysis are worth noting. First, inequality predicts changes
15

Table 4: Tobit regression analysis of competing democratization theories (regional fixed effectsomitted)
Dependent Variable: Polity ScoreIndep. Var. Base model Lipset/PACL A & R Rosendorff H & KLagged Polity 0.964**
(0.007)0.950**(0.008)
0.949**(0.008)
0.931**(0.015)
0.954**(0.009)
Inequality -0.637**(0.100)
-0.886**(0.110)
-0.871**(0.110)
-1.046**(0.259)
-0.848**(0.127)
Workforce 2.589**(0.768)
2.669**(0.766)
2.962**(0.775)
6.339**(2.067)
3.449**(0.904)
Population -1.859**(0.370)
-1.213**(0.388)
-1.132**(0.389)
-1.964(1.062)
-1.198*(0.542)
Time in currentPolity category
-0.024**(0.005)
-0.030**(0.005)
-0.030**(0.005)
-0.000(0.012)
-0.029**(0.006)
Previous Democrati-zation (Sumdown)
-0.587**(0.063)
-0.566**(0.063)
-0.570**(0.063)
-0.733**(0.131)
-0.549**(0.070)
Memberships inRegional Orgs.
-0.069**(0.012)
-0.063**(0.013)
-0.064**(0.013)
-0.111**(0.031)
-0.067**(0.015)
Memberships inInternational Orgs.
0.063**(0.007)
0.056**(0.007)
0.056**(0.007)
0.076**(0.018)
0.055**(0.009)
Log GDP Per Capita 0.276**(0.052)
0.312**(0.053)
0.283**(0.061)
Inequality squared -0.314*(0.124)
∆ Workforce(1 year)
67.112(35.973)
∆ Workforce(5 years)
30.822**(10.696)
∆ log capital stock(1 year)
2.475(2.024)
∆ log capital stock(5 years)
0.335(0.636)
GDP Growth -0.799(0.925)
Log of Inflation 0.015(0.013)
Constant -1.756**(0.429)
-3.578**(0.549)
-3.754**(0.553)
-0.834(1.339)
-3.708**(0.674)
Pseudo R2 0.40 0.41 0.41 0.41 0.41N 3662 3662 3662 1236 3126Left-censored 87 87 87 23 82Uncensored 2801 2801 2801 808 2272Right-censored 774 774 774 405 772
16
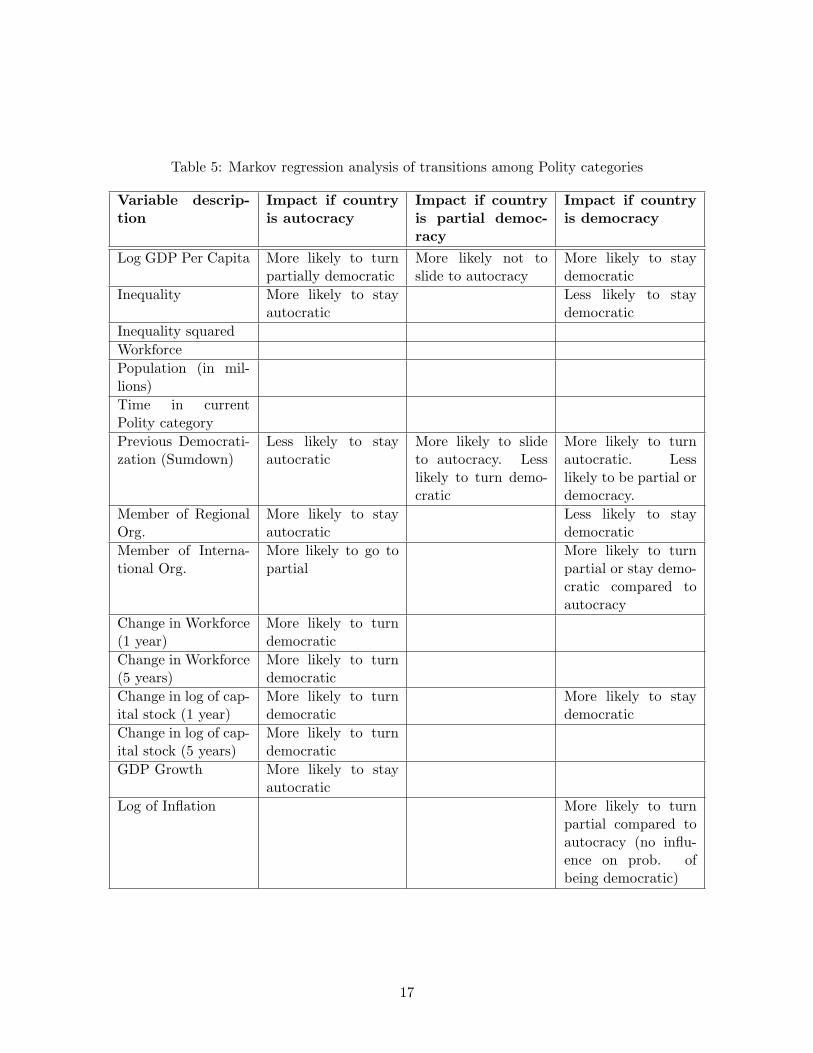
Table 5: Markov regression analysis of transitions among Polity categories
Variable descrip-tion
Impact if countryis autocracy
Impact if countryis partial democ-racy
Impact if countryis democracy
Log GDP Per Capita More likely to turnpartially democratic
More likely not toslide to autocracy
More likely to staydemocratic
Inequality More likely to stayautocratic
Less likely to staydemocratic
Inequality squaredWorkforcePopulation (in mil-lions)Time in currentPolity categoryPrevious Democrati-zation (Sumdown)
Less likely to stayautocratic
More likely to slideto autocracy. Lesslikely to turn demo-cratic
More likely to turnautocratic. Lesslikely to be partial ordemocracy.
Member of RegionalOrg.
More likely to stayautocratic
Less likely to staydemocratic
Member of Interna-tional Org.
More likely to go topartial
More likely to turnpartial or stay demo-cratic compared toautocracy
Change in Workforce(1 year)
More likely to turndemocratic
Change in Workforce(5 years)
More likely to turndemocratic
Change in log of cap-ital stock (1 year)
More likely to turndemocratic
More likely to staydemocratic
Change in log of cap-ital stock (5 years)
More likely to turndemocratic
GDP Growth More likely to stayautocratic
Log of Inflation More likely to turnpartial compared toautocracy (no influ-ence on prob. ofbeing democratic)
17

0.5
1
4.338934 10.69568
0.5
1
4.597264 9.659036
0.5
1
5.209844 10.73535
0.5
1
-1.45599 1.74149
0.5
1
-1.641473 1.25747
0.5
1
-1.379472 1.452754
0.5
1
0 43
0.5
1
0 43
0.5
1
0 27
GDP/cap
Inequality
Previous Attempts
Autocracy Partial Democracy
Figure 6: Summary of Markov Model Analysis
out of autocracy and full democracy, but not partial democracy. Second, previous experiences withdemocratization are significant in all three categories, making partial and full democracies morelikely to slide back, but making autocracies more likely to transition to some form of democracy.Thus this variable seems to capture inherent volatility: countries with histories of movement up anddown the polity scale are likely to leave their current state as well, be it democracy or autocracy.
The impact of these three variables is illustrated in summary form in Figure 6. There aretwo lines in each figure: the area above the top line represents the probability that a country isautocratic next period; the area between the lines represent the probability of a partial democracynext period; while the area below the lines represents the probability of a full democracy. Thehorizontal axis goes from the minimum to maximum value that the variable takes on for thatcategory, and the probabilities are calculated with all other variables held to their means.
The figure shows that, while GDP per capita is significant in all three states, its largest impact ison full democracies. In particular, full democracies with low GDP are likely to backslide into partialdemocracies in the next period. Similarly, full democracies with high inequality are relatively likelyto backslide, as are those with many previous democratization attempts (high values of Sumdown).
The most notable pattern in the table, though, is the lack of many significant determinants ofmovement out of partial democracy. This suggests that while we have good predictors of transitionsfrom autocracy and democracy, we lack explanations of what makes partial democratic countriesdemocratize or revert from partial democracies to autocratic systems. It is this middle categorythat seeks further understanding.
18

Duration Analysis
Finally, we turn to the duration analysis, which determines which factors help countries staydemocratic. Given our trichotomous measure of democracy, there are two ways in which we couldask this question: what prevents full democracies from sliding back to partial democracies orautocracies, and what prevents partial democracies from sliding back to autocracy?
PACL also perform duration analysis, and they find that new democracies are in fact morelikely to fail than more established ones, but that once GDP per capita is taken into account, thisdifference disappears. We therefore include GDP per capita as one of our independent variables,as well as inequality, Sumdown, and workforce participation.
Table 6 shows the results of estimating the probabilities that states fall out of full democracy.Using our testing down approach, we see that the frailty terms were not significant, either sharedor unshared, as indicated by the fact that the likelihood ratio test of θ is always over the standard0.05 significance level. This alone is an important finding: once the other independent variableshave been taken into account, the country-specific effects disappear.2
Table 6: Duration analysis of probability states fall out of full democracy.
Parametric (Weibull) CoxIndependent variable Shared Frailty FrailtyLog GDP Per Capita 0.346**
(0.092)0.269*(0.158)
0.333**(0.098)
Previous Democratiza-tion (Sumdown)
0.396**(0.109)
0.306a
(0.188)0.421**(0.122)
Inequality 8.583**(5.299)
14.72*(5.299)
8.220**(5.194)
Workforce 0.0002*(0.0008)
5.04e-06(0.00005)
0.0001*(0.0003)
1/p 0.477(0.138)
0.380(0.202)
θ 0.329 8.71e-08LR test of θ 0.313 1.00N 894 894 894# of subjects 50 50 50# of failures 19 19 19
Note: Standard errors in parentheses. ** denotes significant at the 0.01 level; * denotes significantat the 0.05 level; a denotes significant at the 0.1 level.
Using our testing down approach, we thus estimate a standard Cox proportional hazards model,reported in the last column of the table. We see that higher GDP per capita, more previousattempts at democratization, and higher workforce participation make a country less likely to fall
2The frailty terms are significant with only GDP per capital on the right hand side of the equation, for instance.
19

out of democracy, while greater inequality makes it more likely.3 Our results thus question thefindings of PACL, in that more than just GDP per capita affects the probability of dropping outof full democracy. They do support Acemoglu and Robinson, though, as inequality does predictcoups against democratic governments.
We now run a similar analysis for partial democracies, to see if we can gain some traction onthe question of what keeps them stable. Table 7 presents the results. Again, the frailty terms werenever more than marginally significant, with or without workforce participation included in theestimating equation. We therefore use the Cox model for our estimates.
Table 7: Duration analysis of probability states fall out of partial democracy.
Paramteric (Weibull) CoxIndependentVariable
SharedFrailty
SharedFrailty
Frailty Frailty
Log GDP Per Capita 0.503**(0.088)
0.581**(0.114)
0.440**(0.115)
0.500**(0.133)
0.503**(0.090)
Previous Democrati-zation (Sumdown)
0.369**(0.097)
0.357**(0.104)
0.310**(0.115)
0.274**(0.108)
0.402**(0.106)
Inequality 2.665a
(1.456)2.887a
(1.623)3.577a
(2.661)5.748*(4.798)
2.409a
(1.207)Workforce 115.93
(385.86)1553.51(7049.6)
31.41(93.81)
Inequality squared 3.372*(1.649)
1/p 1.233(0.392)
1.339(0.471)
0.990(0.404)
0.970(0.410)
θ 6.30e-07 0.134 0.202 0.319LR test of θ 1.000 0.341 .204 0.088a
N 1549 1545 1549 1545 1549# of subjects 83 82 83 82 83# of failures 35 35 35 35 35
Note: Standard errors in parentheses. ** denotes significant at the 0.01 level; * denotes significantat the 0.05 level; a denotes significant at the 0.1 level.
As above, GDP per capita and more attempts at democratization make falling out of democracyless likely, and inequality has a negative effect. Note that the results on Sumdown contradict thefindings from the Markov analysis, which found that higher values of Sumdown were correlated witha lower likelihood of remaining democratic. This is puzzling, and demands greater investigation.
Interestingly, infant mortality squared is also significant in this equation (including this variablein the parametric regressions caused difficulties in model convergence). This is also a logicalconsequence of the Acemoglu and Robinson approach, though they do not call attention to it
3Recall that in interpreting duration models, coefficients less than 1 mean that a transition is less likely at highervalues of the variable, and coefficients greater than 1 make it more likely.
20
in their writings.
5 Conclusion
The conditions under which democracies arise and consolidation takes place is one of the mostpressing for students of governmental processes. Not because democracy is an outcome in and ofitself, but it is a process by which conflict is managed, resources are distributed, and the publicwill is translated into policy.
We tackled this problem with a new data set including more independent variables, countries,and years than had previously been available. We employed tobit regressions, which take advantageof the full range of the independent variable, Markov transition models, and duration models.
Our results are intriguing. On the one hand, they counter the results of PACL, the standardagainst which work in this field should be judged, by showing that a range of modernizationvariables, including per capita GDP, predict well transitions out of autocracy, and help preventdemocratic regimes from backsliding into authoritarianism. On the other hand, we have removedthe problem from autocracies only to deposit it in the lap of partial democracies. These are “fragile”democracies, countries in their “awkward middle stages,” or perhaps “unconsolidated democracies.”Whatever one wishes to call them, they emerge from our analysis as the keys to understandingdemocratic transitions, more volatile than either straight autocracies or democracies, yet whosemovements up and down the Polity scale seem, at the moment, to be largely unpredictable. Oneof our major findings, then, is that it is this category — the partial democracies — upon whichfuture research should focus.
21

References
Acemoglu, D. and J. Robinson (1999). A Theory of Political Transitions. Cambridge MA.Acemoglu, D. and J. Robinson (2000). “Why did the West Extend the Franchise?” Quarterly
Journal of Economics 140(4): 1167-1200.Acemoglu, D. and J. Robinson (2002). The Political Determinants of Dictatorship and
Democracy. Manuscript: MIT.Bollen, K. and R. Jackman. 1989. “Democracy, Stability, and Dichotomies.” American
Sociological Review 54: 612-21.Collier, D. and R. Adcock. 1999. “Democracy and Dichotomies: A Pragmatic Approach to
Choices about Concepts. Annual review of Political Science.” In Nelson Polsby, ed. Annual Reviewof Political Science. Palo Alto: Stanford University Press.
Dahl, Robert A. 1971. Polyarchy: Participation and Opposition. New Haven: Yale UniversityPress.
Deutsch, K. W. 1961. “Social Mobilization and Political Development.” American PoliticalScience Review 55(3): 493-510.
Esty, D. C., J. A. Goldstone, et al. 1998. State Failure Task Force: Phase II Findings. McLeanVA: SAIC.
Gastil, R. D. 1982. Freedom in the World. New Brunswick, NJ: Transaction Publishers.Geddes, B. 1999. “What Do We Know About Democratization After Twenty Years?” Annual
Review of Political Science 2: 115-44.Greene, William. 2003. Econometric Analysis. Upper Saddle River, NJ: Prentice Hall.Haggard, S. and R. Kaufman (1995). The Political Economy of Democratic Transitions.
Princeton, Princeton University Press.Huntington, S. P. 1991. The Third Wave. Norman, OK: Oklahoma University Press.Jaggers, K. and T. R. Gurr. 1995. “Tracing Democracy’s Third Wave with the Polity III Data.”
Journal of Peace Research 31(4): 469-82.Lerner, D. (1958). The Passing of Traditional Society. New York, Free Press of Glencoe.Lerner, D. 1958. The Passing of Traditional Society. New York: Free Press of Glencoe.Lipset, S. M. 1959. “Some Social Requisites of Democracy.” American Political Science Review
53: 69-105.O’Donnell, G. and P. Schmitter (1986). Transitions from Authoritarian Rule. Baltimore MD,
Johns Hopkins University Press.Przeworski, A. (1991). Democracy and the Market. Cambridge, Cambridge University Press.Przeworski, A., M. E. Alvarez, et al. 2000. Democracy and Development. New York: Cambridge
University Press.Rosendorf, B. P. (2001). ”Choosing Democracy.” Economics and Politics 13(1): 1-29.Sivard, R. 1996. World Military and Social Expenditure. Washington DC: World Priority.Stewart, F., V. FitzGerald, et al. 2001. War and Underdevelopment. New York: Oxford
University Press.
22

Appendix 1: Descriptive Statistics on Transitions
We have 195 countries in the dataset. 25 countries have no values for polx4. That leaves 170countries:
• 40 very stable countries: same Polity value throughout the dataset
– 24 very stable full democracies with Polity value of 105
– 1 very stable democracy with Polity value of 86
– 4 very stable partial democracies existing between 6 and 11 years7
– 11 very stable autocracies8
• 44 stable countries: same category (autocracy, partial or democracy) throughout the datasetbut Polity value changes
– 4 stable democracies9
– 5 stable partial democracies10 (only one older than 10 years)
– 35 stable autocracies11
After identifying the very stable and the stable countries, we want to characterize the countriesmaking transitions between categories. Two features seem to be of interest: the size of transitions(how many categories) and the number of transitions (average stay in each category). Concerningthe latter feature, I distinguish between somewhat stable countries making a single transition andunstable countries making several transitions.
4 Andorra, Antigua & Barbuda, Bahamas, Barbados, Belize, Bosnia and Herzegovina, Brunei, Cape Verde,Dominica, Grenada, Liechtenstein, Maldive Islands, Malta, Monaco, Palau, San Marino, Sao Tome-Principe,Seychelles, Solomon Islands, St. Kitts-Nevis, St. Lucia, St. Vincent and the Grenadines, Suriname, Vanuatu,and Western Samoa.
5 Countries existing in all 46 years are: Australia, Austria, Belgium, Canada, Costa Rica, Denmark, Finland,Iceland, Ireland, Italy, Japan, Luxembourg, Netherlands, New Zealand, Norway, Sweden, Switzerland, and UK.Countries existing less than all 46 years are: Czech Republic (8), Germany (11), West Germany (36), Lithuania (10),Papua New Guinea (26), and Slovenia (10).
6 Latvia (10)7 Estonia (10), Ethiopia after 1993 (6), Macedonia (10), Namibia (11)8 Countries existing in all 46 years are: Bhutan, Libya, and Saudi Arabia. Countries existing less than all 46 years
are: Eritrea (8), Kyrgyzstan (10), Qatar (30), United Arab Emirates (30), Uzbekistan (10), Vietnam (25), SouthVietnam (21), and Yemen (8).
9 Israel, Jamaica, Mauritius, and Trinidad.10 Georgia (10), Lebanon (46), Moldova (10), Russia (9), and Ukraine (10)11 Afghanistan, Algeria, Angola, Bahrain, Burundi, Cameroon, Chad, China, Congo-Kinshasa, Cuba, Egypt,
Ethiopia, Gabon, Germany – East, Guinea, Iraq, Jordan, Kazakhstan, Korea –North, Kuwait, Liberia, Mauritania,Morocco, Oman, Rwanda, Swaziland, Tajikistan, Togo, Tunisia, Turkmenistan, USSR, Vietnam – North, Yemen –North, Yemen – South, and Yugoslavia - former.
23

• 56 shifting between two categories
– 8 shifting between partial and democracy
∗ 4 somewhat stable: 3 countries up to democracy12 and 1 down to partial13
∗ 4 unstable countries going up once and down once14
– 37 shifting between partial and autocracy
∗ 22 somewhat stable: 15 up to partial15 and 7 down to autocracy16
∗ 15 unstable17
– 11 shifting between autocracy and democracy
∗ 9 somewhat stable: 7 countries up to democracy18 and 2 down to autocracy19
∗ 2 unstable countries going two categories up once and two down once20
• 30 shifting between all three categories
– Only in one direction
∗ 6 countries up21 and none the other way
– 24 forth and back
∗ 10 countries making 3 transitions between categories22
∗ 3 making 4 transitions23
∗ 2 making 5 transitions24
∗ 6 making 6 transitions25
∗ 2 making 8 transitions26
∗ 1 making 10 transitions27
12 Botswana, Slovakia, and South Africa13 Malaysia14 Cyprus, France, India, and Sri Lanka15 Central African Republic, Cote d’Ivoire, Croatia, Djibouti, El Salvador, Guinea-Bissau, Honduras, Indonesia,
Iran, Malawi, Mali, Mozambique, Paraguay, Tanzania, and Yugoslavia16 Belarus, Equatorial Guinea, Kenya, Singapore, Somalia, Syria, and Zimbabwe17 Up once and down once: Armenia, Azerbaijan, Benin, Burkina Faso, Guyana, and Zambia. More shifts: Albania,
Cambodia, Comoros, Congo-Brazzaville, Ghana, Haiti, Nepal, Sierra Leone, and Uganda18 Bolivia, Bulgaria, Czechoslovakia, Hungary, Portugal, Senegal, and Spain19 Burma and Laos20 Lesotho and Uruguay21 Mexico, Mongolia, Nicaragua, Poland, Romania, and Taiwan22 Bangladesh, Brazil, Chile, Colombia, Fiji, Greece, Madagascar, Panama, Philippines, and Venezuela23 Gambia, Guatemala, and Pakistan (pre 72)24 Niger and Nigeria25 Argentina, Dominican Republic, Ecuador, Pakistan (post 72), Peru, and Sudan26 Korea – south and Thailand27 Turkey
24