cidel captive insurance investment platform august 2011
TRANSCRIPT
Cidel Captive Insurance Investment Platform
August 2011

2
Cidel Overview
Investment Management
Captive Platform Overview
Investment Platforms
Service Model
Why Cidel?
Agenda
For information purposes only and not for public use
3
Cidel Overview
For information purposes only and not for public use
Cidel is an international financial service group that designs and implements customized financial solutions to help clients build, preserve andtransfer wealth.
With a strategic network of operations in Barbados, Canada and internationally, Cidel’s broad range of investment, trust and structuring capabilities provide clients with solutions that are global, innovative, transparent and compliant.
In the world of private banking and trust, Cidel is recognized as a dedicated, high calibre advisor with exceptional, longstanding relationships.
Largest private wealth manager service provider in Barbados (65 staff)
4
Cidel Overview
For information purposes only and not for public use
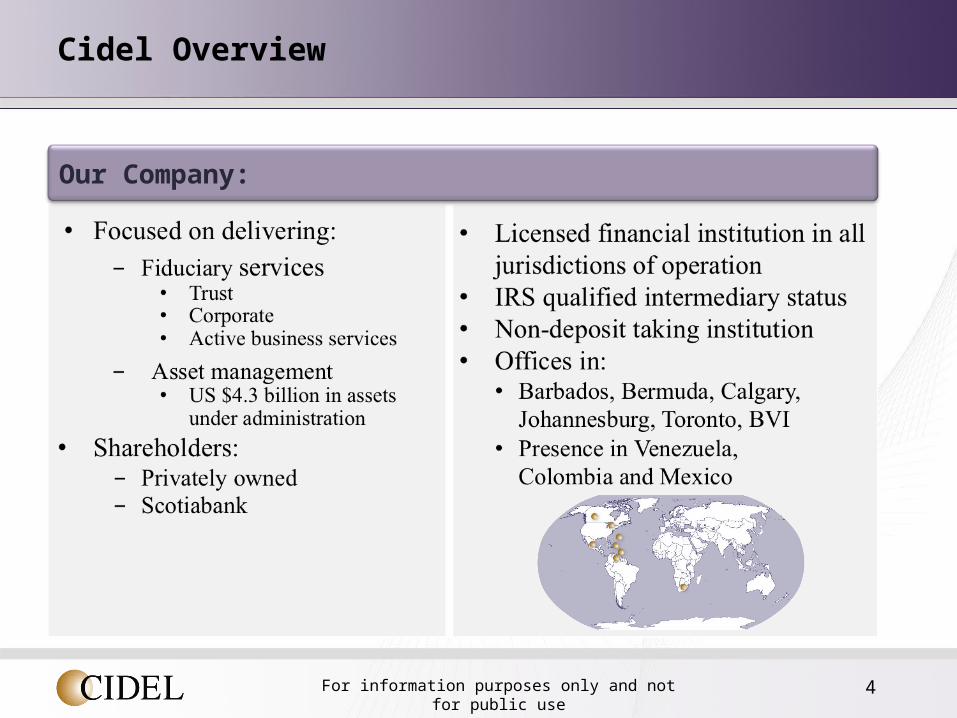
Our Company:
5
Why Cidel for Captives?
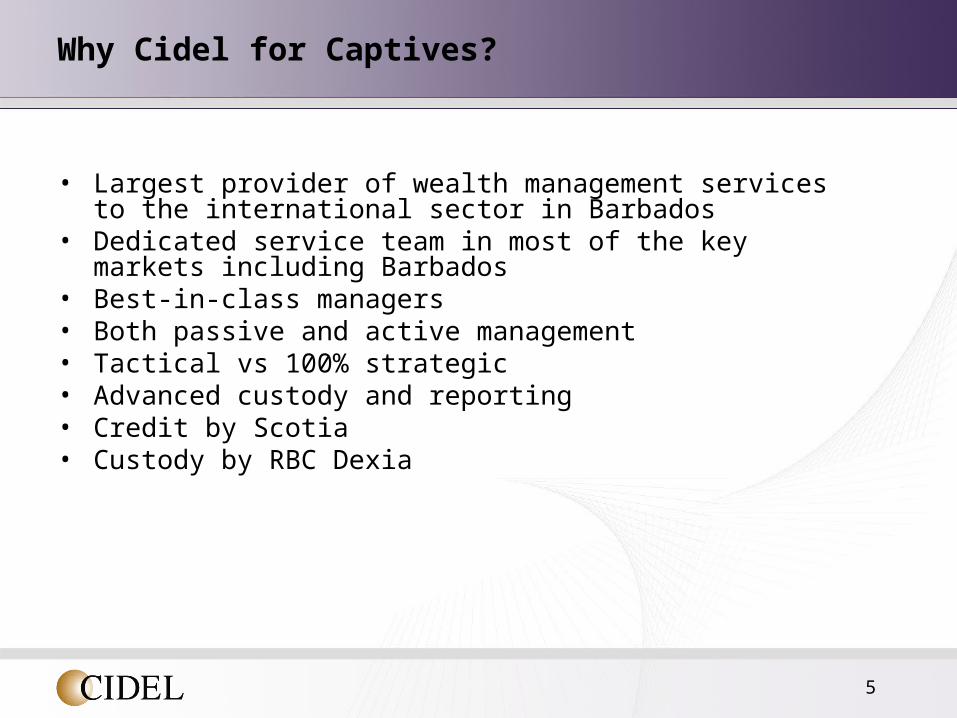
• Largest provider of wealth management services to the international sector in Barbados
• Dedicated service team in most of the key markets including Barbados• Best-in-class managers• Both passive and active management • Tactical vs 100% strategic• Advanced custody and reporting• Credit by Scotia• Custody by RBC Dexia

6
Cidel Overview
Investment Management
Captive Platform Overview
Investment Platforms
Service Model
Why Cidel?
Agenda
For information purposes only and not for public use
7
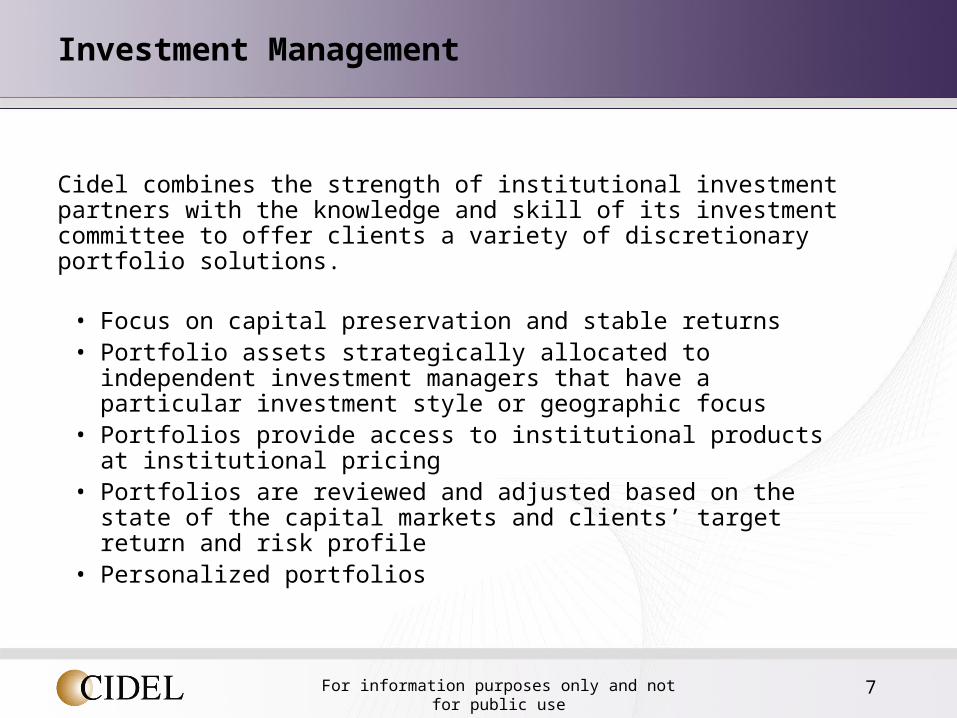
Investment Management
Cidel combines the strength of institutional investment partners with the knowledge and skill of its investment committee to offer clients a variety of discretionary portfolio solutions.
• Focus on capital preservation and stable returns• Portfolio assets strategically allocated to independent investment
managers that have a particular investment style or geographic focus• Portfolios provide access to institutional products at institutional
pricing• Portfolios are reviewed and adjusted based on the state of the capital
markets and clients’ target return and risk profile • Personalized portfolios
For information purposes only and not for public use
8
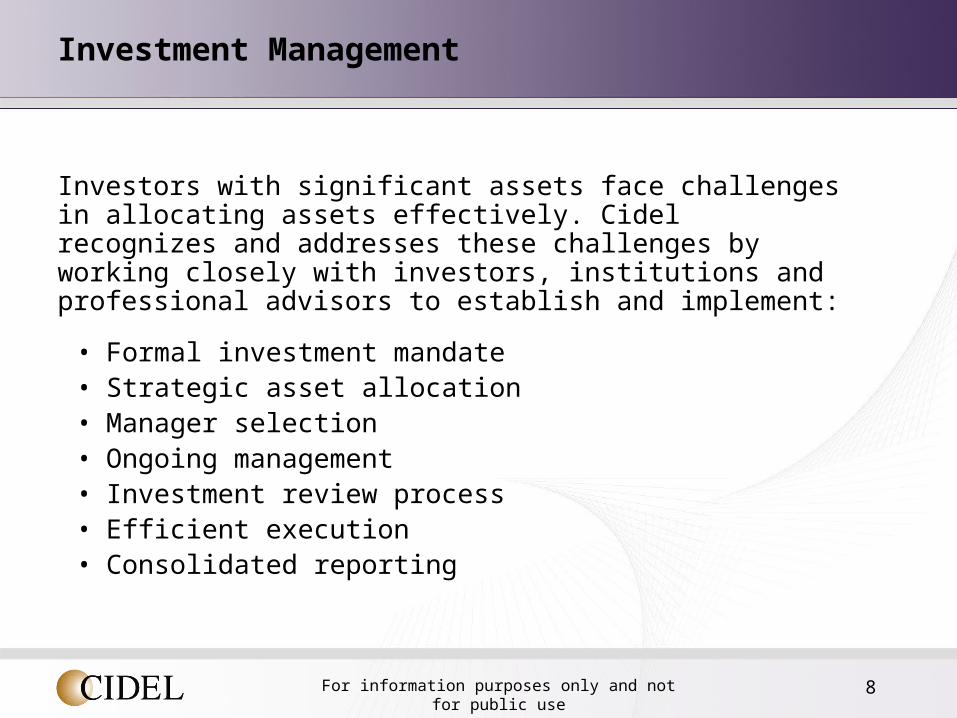
Investment Management
Investors with significant assets face challenges in allocating assets effectively. Cidel recognizes and addresses these challenges by working closely with investors, institutions and professional advisors to establish and implement:
• Formal investment mandate• Strategic asset allocation• Manager selection• Ongoing management• Investment review process• Efficient execution• Consolidated reporting
For information purposes only and not for public use

9
Cidel Overview
Investment Management
Captive Platform Overview
Investment Platforms
Service Model
Why Cidel?
Agenda
For information purposes only and not for public use
10
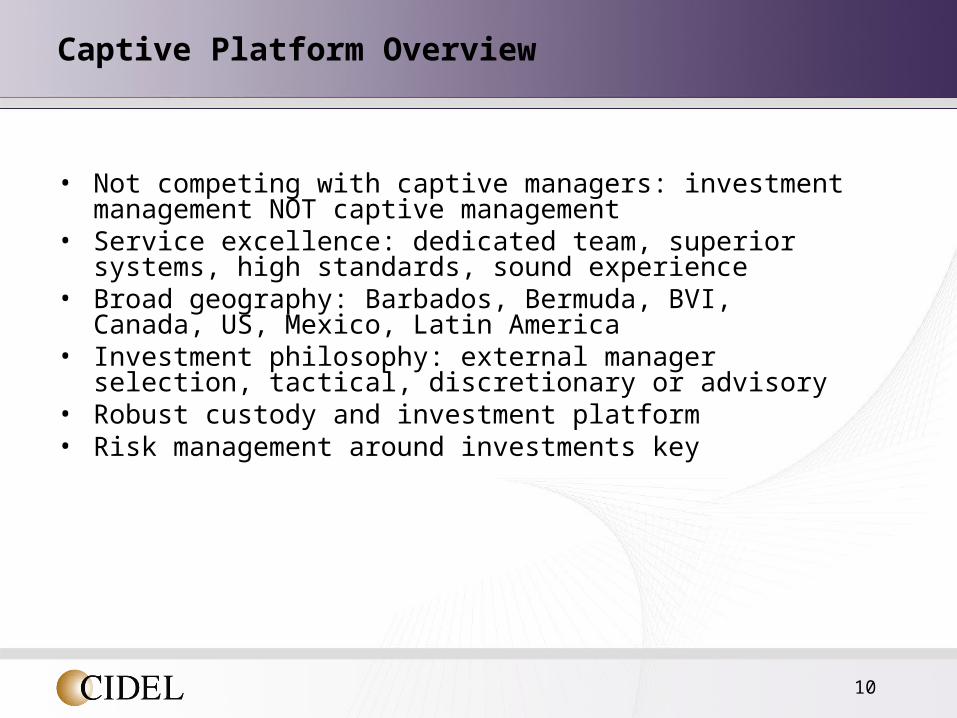
Captive Platform Overview
• Not competing with captive managers: investment management NOT captive management
• Service excellence: dedicated team, superior systems, high standards, sound experience
• Broad geography: Barbados, Bermuda, BVI, Canada, US, Mexico, Latin America
• Investment philosophy: external manager selection, tactical, discretionary or advisory
• Robust custody and investment platform• Risk management around investments key

11
Captive Platform Overview
• Letters of credit: Scotia
• Directorships if required
• Fees: competitive, flexible
• Custody with RBC Dexia
12
Cidel Overview
Investment Management
Captive Platform Overview
Investment Platforms
Service Model
Why Cidel?
Agenda
For information purposes only and not for public use
13
Investment Strategy
• Majority of captives are managed on a discretionary basis so captive manager does not have to make investment decisions
• Set strategic asset allocation (ie. 80%-20% FI and equities)• Tactically adjust strategic allocation depending on market conditions• Independently select 3rd party managers (hire and fire)

14
Money Market: BlackRock Institutional Funds
Founded in 1988, BlackRock is a premier provider of global investment management, risk management, and advisory services. BlackRock’s assets under management total US$3.66 trillion across equity, fixed income, cash management, alternative investment, real estate and advisory strategies.
Fund: BlackRock Institutional US Dollar Liquidity Fund
Benchmark: 7-Day Libor
15
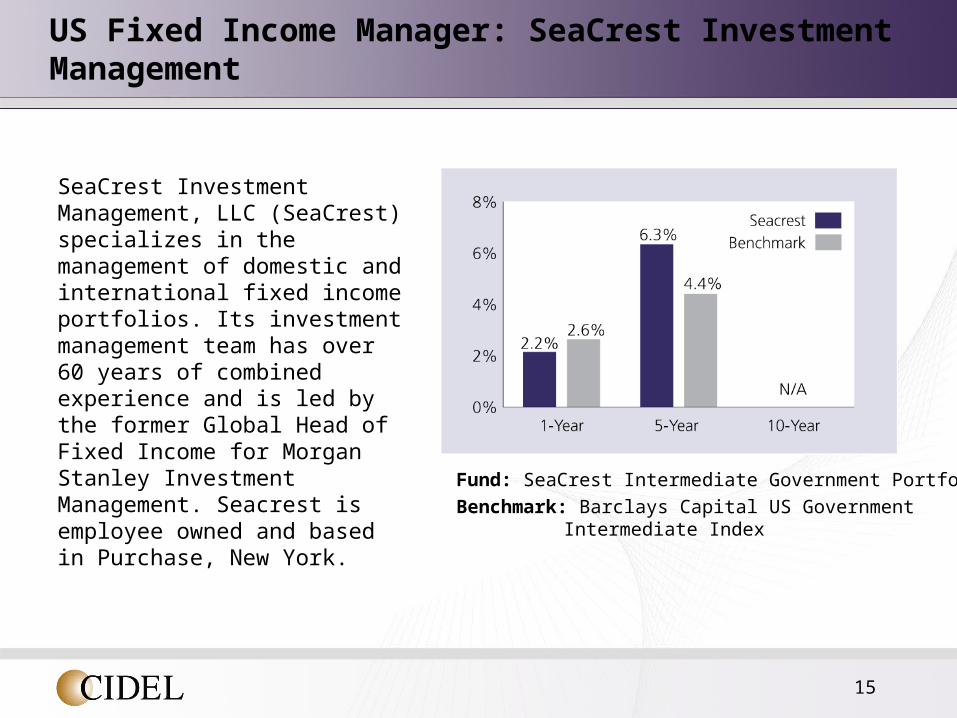
US Fixed Income Manager: SeaCrest Investment Management
Fund: SeaCrest Intermediate Government Portfolio
Benchmark: Barclays Capital US Government Intermediate Index
SeaCrest Investment Management, LLC (SeaCrest) specializes in the management of domestic and international fixed income portfolios. Its investment management team has over 60 years of combined experience and is led by the former Global Head of Fixed Income for Morgan Stanley Investment Management. Seacrest is employee owned and based in Purchase, New York.
16
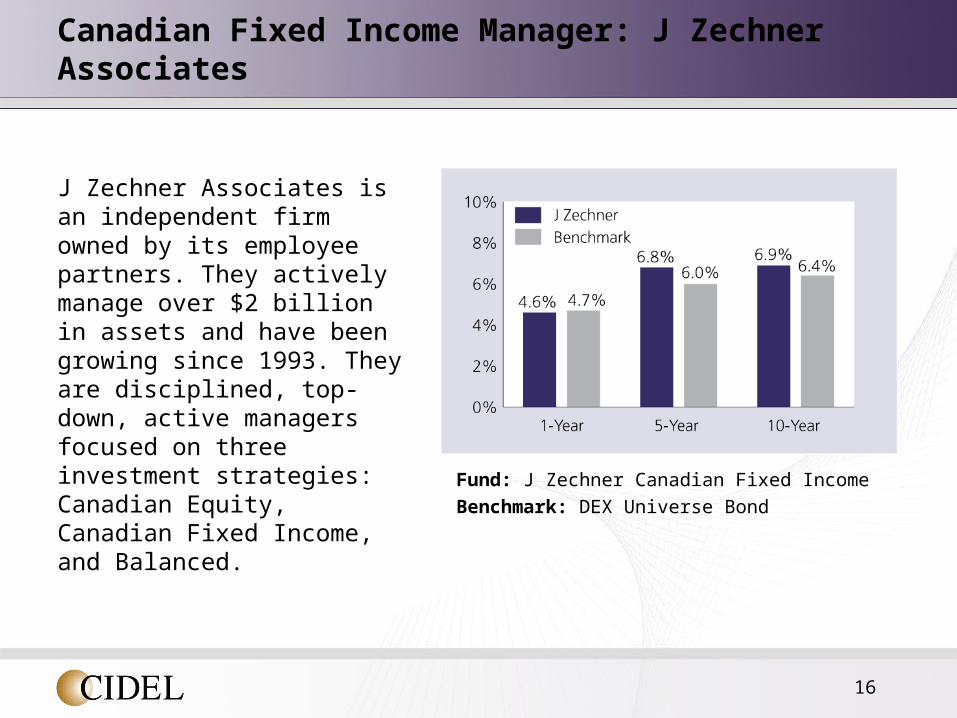
Canadian Fixed Income Manager: J Zechner Associates
J Zechner Associates is an independent firm owned by its employee partners. They actively manage over $2 billion in assets and have been growing since 1993. They are disciplined, top-down, active managers focused on three investment strategies: Canadian Equity, Canadian Fixed Income, and Balanced.
Fund: J Zechner Canadian Fixed Income
Benchmark: DEX Universe Bond

17
Equity: Toron Investment Management
Fund: Toron Core Equity Fund (USD)
Benchmark: MSCI World
Toron Investment Management, founded in 1988, is an investment counselling firm providing a range of investment management services to individuals and institutional clients with a focus on global equity investing. Toron is headquartered in Toronto, Canada.
18
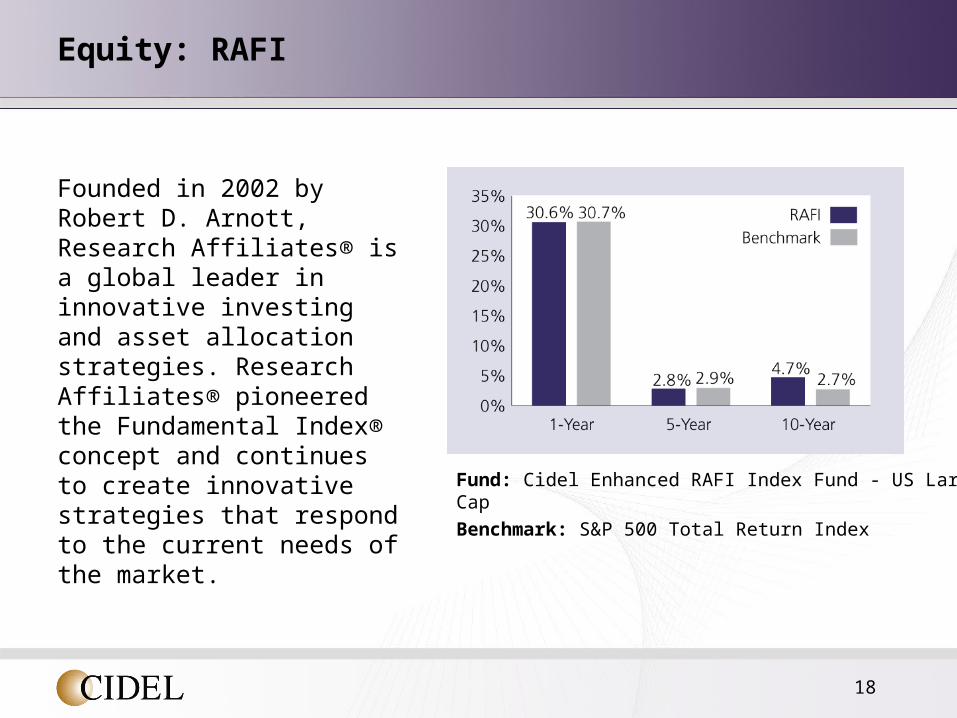
Equity: RAFI
Founded in 2002 by Robert D. Arnott, Research Affiliates® is a global leader in innovative investing and asset allocation strategies. Research Affiliates® pioneered the Fundamental Index® concept and continues to create innovative strategies that respond to the current needs of the market. Fund: Cidel Enhanced RAFI Index Fund - US Large Cap
Benchmark: S&P 500 Total Return Index
Research Affiliates Fundamental Index®
Efficient Indexingfor an Inefficient Market®
Doug Gratz, CFA
Associate Director

20 ©Research Affiliates, LLCRAFI Global 2011Q2
■ By accepting this document you agree to keep its contents confidential and not to use the information contained in this document, and in the other materials you will be provided with, for any purpose other than for considering a participation in the proposed transactions. You also agree not to disclose information regarding the transactions to anyone within your organization other than those required to know such information for the purpose of analyzing or approving such participation. No disclosure may be made to third parties (including potential co-investors) regarding any information disclosed in this presentation without the prior permission of Research Affiliates, LLC.
■ The material contained in this document is for information purposes only. This material is not intended as an offer or solicitation for the purchase or sale of any security or financial instrument, nor is it advice or a recommendation to enter into any transaction. The information contained herein should not be construed as financial or investment advice on any subject matter. Research Affiliates and its related entities do not warrant the accuracy of the information provided herein, either expressed or implied, for any particular purpose. Nothing contained in this material is intended to constitute legal, tax, securities or investment advice, nor an opinion regarding the appropriateness of any investment, nor a solicitation of any type. The general information contained in this material should not be acted upon without obtaining specific legal, tax and investment advice from a licensed professional. Indexes are unmanaged and cannot be invested in directly. Returns represent past performance, are not a guarantee of future performance, and are not indicative of any specific investment.
■ THE INDEX DATA PUBLISHED HEREIN IS SIMULATED, UNMANAGED AND CANNOT BE INVESTED IN DIRECTLY. PAST SIMULATED PERFORMANCE IS NO GUARANTEE OF FUTURE PERFORMANCE AND IS NOT INDICATIVE OF ANY SPECIFIC INVESTMENT. ACTUAL INVESTMENT RESULTS MAY DIFFER. The simulated data contained herein is based on the patented non-capitalization weighted indexing system, method and computer program product (see Robert D. Arnott, Jason Hsu and Philip Moore. 2005. “Fundamental Indexation.” Financial Analysts Journal [March/April]:83-99).
■ Any information and data pertaining to indexes contained in this document relates only to the index itself and not to any asset management product based on the index. No allowance has been made for trading costs, management fees, or other costs associated with asset management as the information provided relates only to the index itself. With the exception of the data on Research Affiliates Fundamental Index, all other information and data are based on information and data available from public sources.
■ Russell Investment Group is the source and owner of the Russell Index data contained or reflected in this material and all trademarks and copyrights related thereto. The presentation may contain confidential information and unauthorized use, disclosure, copying, dissemination, or redistribution is strictly prohibited. This is a presentation of Research Affiliates, LLC. Russell Investment Group is not responsible for the formatting or configuration of this material or for any inaccuracy in Research Affiliates’ presentation thereof.
■ The trade names Fundamental Index®, RAFI®, the RAFI logo, and the Research Affiliates corporate name and logo are registered trademarks and are the exclusive intellectual property of Research Affiliates, LLC. Any use of these trade names and logos without the prior written permission of Research Affiliates, LLC is expressly prohibited. Research Affiliates, LLC reserves the right to take any and all necessary action to preserve all of its rights, title and interest in and to these marks.
■ Fundamental Index®, the non-capitalization method for creating and weighting of an index of securities, is patented and patent-pending proprietary intellectual property of Research Affiliates, LLC (US Patent No. 7,620,577; 7,747,502; and 7,792,719; Patent Pending Publ. Nos. US-2007-0055598-A1, US-2008-0288416-A1, US-2010-0191628, US-2010-0262563, WO 2005/076812, WO 2007/078399 A2, WO 2008/118372, EPN 1733352, and HK1099110).
©2011, Research Affiliates, LLC. All rights reserved. Duplication or dissemination prohibited without prior written permission.
Important Information
Research Affiliates
22 ©Research Affiliates, LLCRAFI Global 2011Q2
Mission■ Concentrate on Research and product development■ Partner with world-class Affiliates to bring product to market
Global leader in■ Global tactical asset allocation (GTAA) ■ Innovative indexation
Profile■ Approximately $83 billion in assets managed using RA investment
strategies as of June 30, 20111
■ Founded in 2002 by Rob Arnott■ Majority employee-owned
Research Affiliates, LLC
1As of 6/30/2011: Based on estimates. Includes assets managed or sub-advised by Research Affiliates or licensees using RAFI, eRAFI ®, or GTAA strategies.
Note: Please refer to the disclosure slide at the end for all relevant disclaimers, disclosures, and information on our intellectual property.
Equity Philosophy
Indexing is a Great Strategy(if properly designed)
24 ©Research Affiliates, LLCRAFI Global 2011Q2
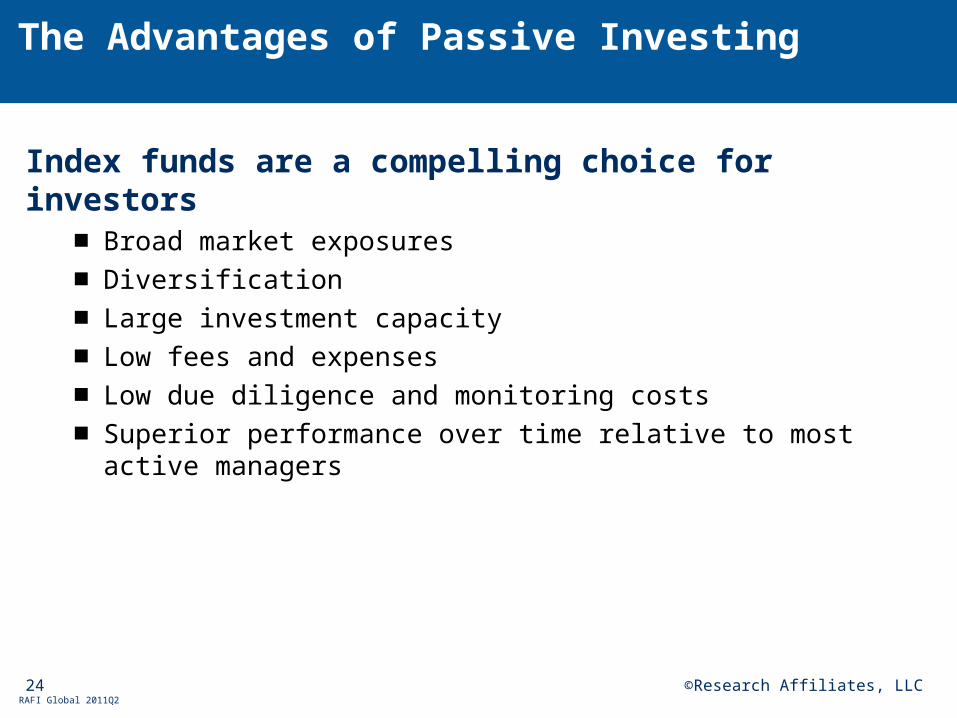
The Advantages of Passive Investing
Index funds are a compelling choice for investors■ Broad market exposures■ Diversification■ Large investment capacity■ Low fees and expenses■ Low due diligence and monitoring costs■ Superior performance over time relative to most active managers
25 ©Research Affiliates, LLCRAFI Global 2011Q2
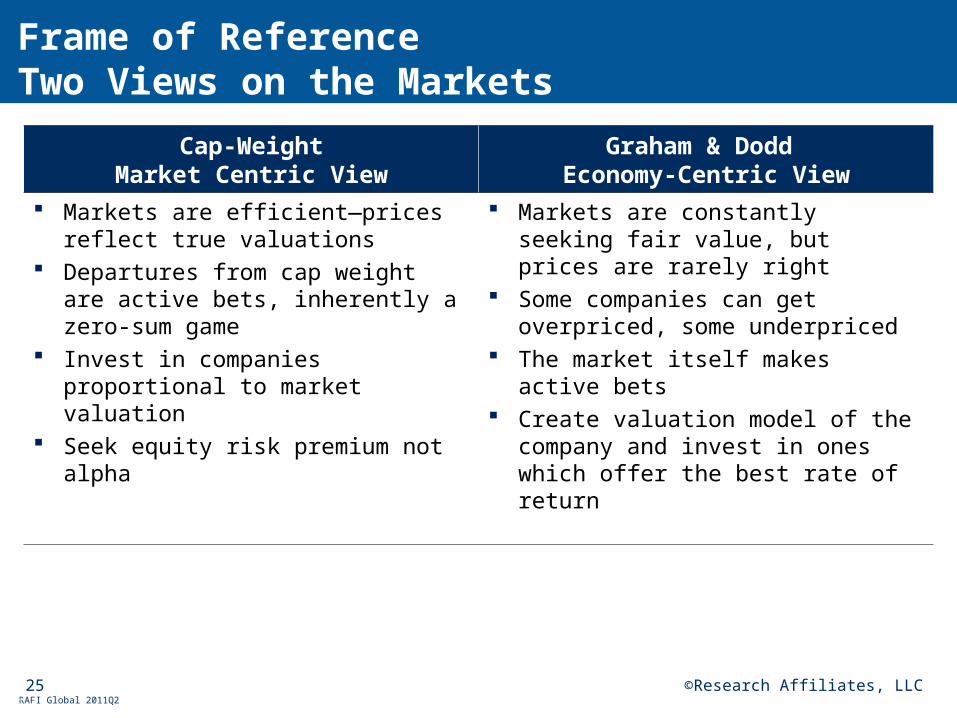
Frame of ReferenceTwo Views on the Markets
25
Cap-WeightMarket Centric View
Graham & Dodd Economy-Centric View
Markets are efficient—prices reflect true valuations
Departures from cap weight are active bets, inherently a zero-sum game
Invest in companies proportional to market valuation
Seek equity risk premium not alpha
Markets are constantly seeking fair value, but prices are rarely right
Some companies can get overpriced, some underpriced
The market itself makes active bets Create valuation model of the company
and invest in ones which offer the best rate of return
26 ©Research Affiliates, LLCRAFI Global 2011Q2
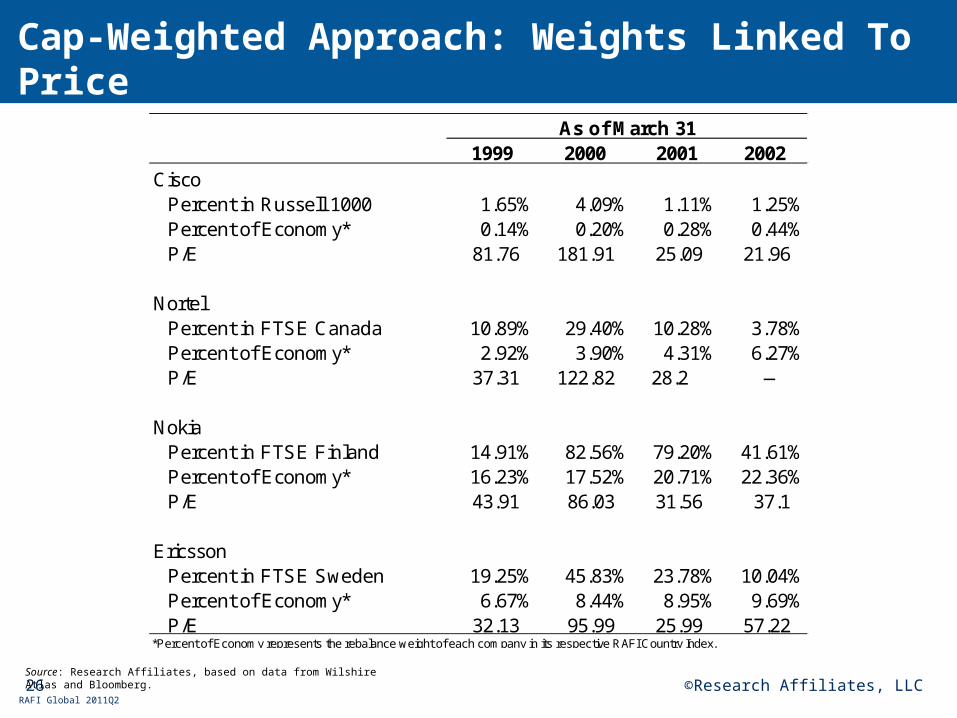
Cap-Weighted Approach: Weights Linked To PriceData From the Tech Bubble of 2000
Source: Research Affiliates, based on data from Wilshire Atlas and Bloomberg.
1999 2000 2001 2002Cisco
Percent in Russell 1000 1.65% 4.09% 1.11% 1.25%Percent of Economy* 0.14% 0.20% 0.28% 0.44%P/E 81.76 181.91 25.09 21.96
NortelPercent in FTSE Canada 10.89% 29.40% 10.28% 3.78%Percent of Economy* 2.92% 3.90% 4.31% 6.27%P/E 37.31 122.82 28.2 —
NokiaPercent in FTSE Finland 14.91% 82.56% 79.20% 41.61%Percent of Economy* 16.23% 17.52% 20.71% 22.36%P/E 43.91 86.03 31.56 37.1
EricssonPercent in FTSE Sweden 19.25% 45.83% 23.78% 10.04%Percent of Economy* 6.67% 8.44% 8.95% 9.69%P/E 32.13 95.99 25.99 57.22
*Percent of Economy represents the rebalance weight of each company in its respective RAFI Country Index.
As of March 31
27 ©Research Affiliates, LLCRAFI Global 2011Q2
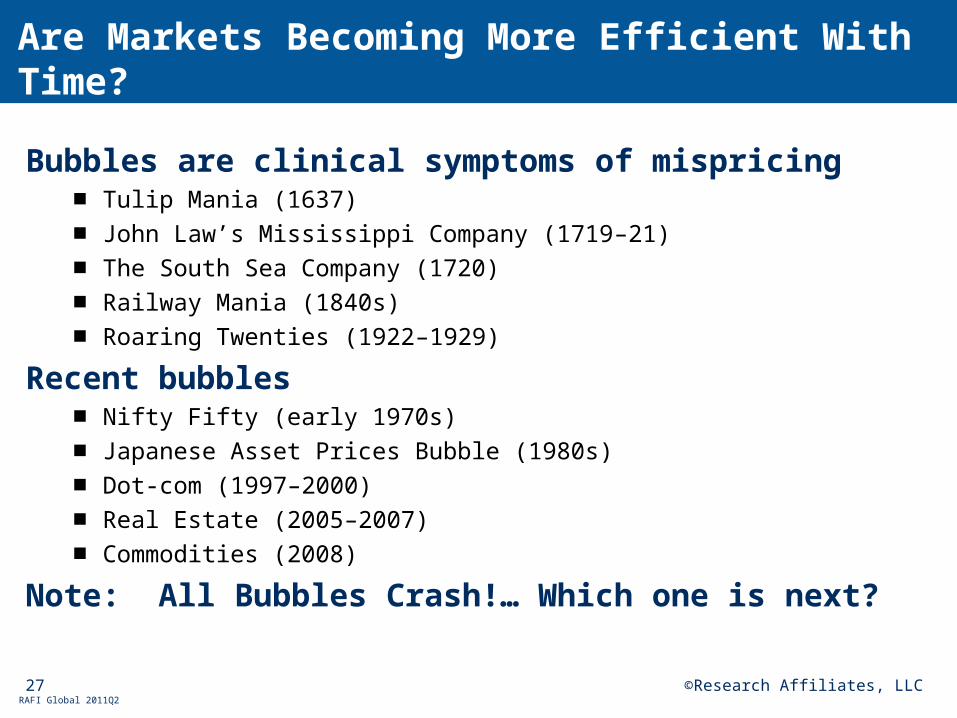
Bubbles are clinical symptoms of mispricing■ Tulip Mania (1637)
■ John Law’s Mississippi Company (1719–21)
■ The South Sea Company (1720)
■ Railway Mania (1840s)
■ Roaring Twenties (1922–1929)
Recent bubbles■ Nifty Fifty (early 1970s)
■ Japanese Asset Prices Bubble (1980s)
■ Dot-com (1997–2000)
■ Real Estate (2005–2007)
■ Commodities (2008)
Note: All Bubbles Crash!… Which one is next?
Are Markets Becoming More Efficient With Time?

The Fundamental Index® MethodologyEfficient Indexing
for an Inefficient Market®

29 ©Research Affiliates, LLCRAFI Global 2011Q2
Select and weight stocks by non-price measures of firm size
■ Sales, cash flow, dividends, and book value
Achieve excess returns over cap weighting1
■ 2–4% in developed markets■ Greater in less efficient markets
Preserve the advantages of passive investing ■ Diversification■ Liquidity■ Transparency■ Broad economic representation■ Low cost access to equity markets
The Fundamental Index Approach
1Based on Research Affiliates historical simulated data using CRSP, Compustat, Worldscope and Datastream, on universe of U.S. equities 1962-2009 and International equities 1984-2009.

30 ©Research Affiliates, LLCRAFI Global 2011Q2
Effectively break the link with price■ Pricing errors are uncorrelated■ Both overvalued and undervalued stocks will be either overweighted
or underweighted, but the errors largely offset each other
Metrics reflect objective measures of relative size■ Widely acceptable measures of company size■ Less susceptible to gaming■ Easily accessible data■ Not intended to be predictive of future size or value■ Broadly available across countries
The Fundamental Index Factors

31 ©Research Affiliates, LLCRAFI Global 2011Q2
RAFI Developed 1000 Weights: Composite Measure of Size, 2011 Target Weights
Source: Research Affiliates, LLC., based on data from Bloomberg back office.
RAFI
Weight Rank Weight Rank Weight Rank Weight Rank Weight
Exxon Mobil 1.4% 2 1.6% 2 1.2% 7 0.8% 15 1.4%
Bank of America 0.5% 18 0.9% 6 1.0% 11 1.5% 1 1.1%
ING 0.7% 9 2.2% 1 0.4% 51 0.4% 44 1.1%
General Electric 0.7% 11 0.7% 18 1.5% 1 0.8% 11 1.0%
Wal-Mart 1.5% 1 0.7% 17 0.5% 36 0.5% 28 0.7%
Cash Flow DividendCurrent
Book Value
5-Year Average
Sales
32 ©Research Affiliates, LLCRAFI Global 2011Q2
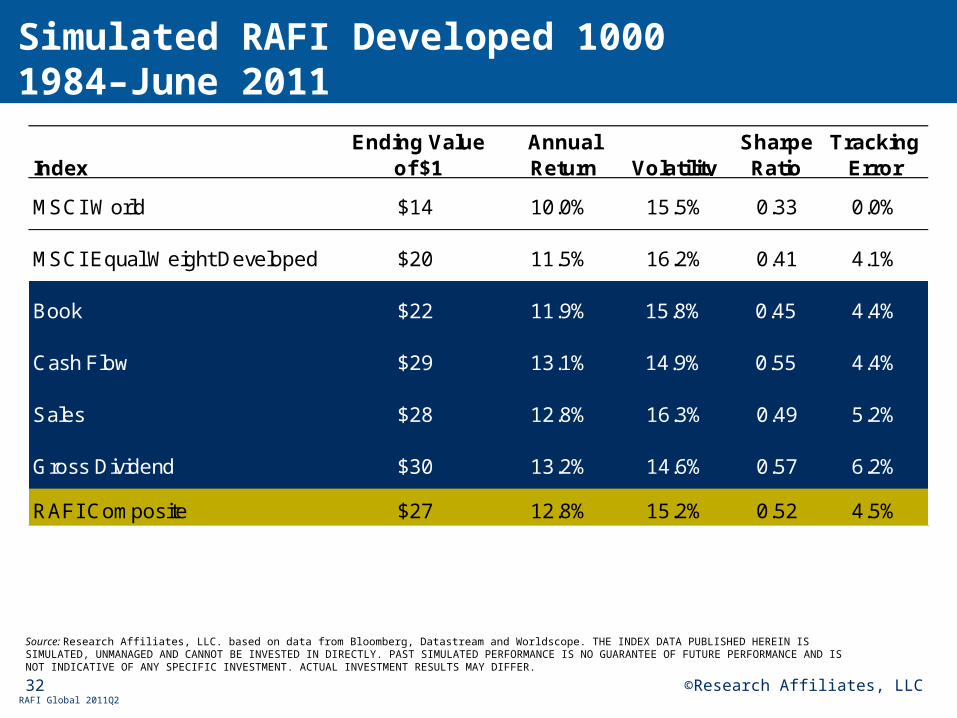
Simulated RAFI Developed 10001984–June 2011
Source: Research Affiliates, LLC. based on data from Bloomberg, Datastream and Worldscope. THE INDEX DATA PUBLISHED HEREIN IS SIMULATED, UNMANAGED AND CANNOT BE INVESTED IN DIRECTLY. PAST SIMULATED PERFORMANCE IS NO GUARANTEE OF FUTURE PERFORMANCE AND IS NOT INDICATIVE OF ANY SPECIFIC INVESTMENT. ACTUAL INVESTMENT RESULTS MAY DIFFER.
IndexEnding Value
of $1Annual Return Volatility
Sharpe Ratio
Tracking Error
MSCI World $14 10.0% 15.5% 0.33 0.0%
MSCI Equal Weight Developed $20 11.5% 16.2% 0.41 4.1%
Book $22 11.9% 15.8% 0.45 4.4%
Cash Flow $29 13.1% 14.9% 0.55 4.4%
Sales $28 12.8% 16.3% 0.49 5.2%
Gross Dividend $30 13.2% 14.6% 0.57 6.2%
RAFI Composite $27 12.8% 15.2% 0.52 4.5%

33 ©Research Affiliates, LLCRAFI Global 2011Q2
Any single-metric index works, but has a structural bias■ Sales—overexposed to large companies with thin margins■ Cash flow—overexposed to cyclical stocks at cyclical peaks■ Dividends—overexposed to mature, high-yield companies and
exclusion of growth companies■ Book value—overexposed to companies with aggressive accounting
Composite approach improves methodology■ Diversifies exposure to data source, sectors, and other risks■ Improves robustness of methodology■ Improves stability of factors■ Superior risk–return performance*
Benefits of a Composite Approach
*Research Affiliates historical simulated data based on universe of U.S. equities 1962-2007.

34 ©Research Affiliates, LLCRAFI Global 2011Q2
Averaging Over Five Years Improves Performance1962–June 2011
Source: Research Affiliates, LLC. Based on data from CRSP and Compustat. THE INDEX DATA PUBLISHED HEREIN IS SIMULATED, UNMANAGED AND CANNOT BE INVESTED IN DIRECTLY. PAST SIMULATED PERFORMANCE IS NO GUARANTEE OF FUTURE PERFORMANCE AND IS NOT INDICATIVE OF ANY SPECIFIC INVESTMENT. ACTUAL INVESTMENT RESULTS MAY DIFFER.
■ Helps smooth peaks and valleys in financial data
■ Less susceptible to aggressive accounting
■ Recent financial data more highly correlated with recent price moves
■ Breaks the link with price
5-Year 4-Year 3-Year 2-Year 1-Year Cap 1000
Annual Return 11.66% 11.64% 11.60% 11.56% 11.50% 9.67%Annual Volatilty 15.43% 15.44% 15.45% 15.47% 15.44% 15.25%Value Add 1.99% 1.97% 1.93% 1.89% 1.83%Tracking Error 4.52% 4.49% 4.43% 4.39% 4.32%Information Ratio 0.44 0.44 0.44 0.43 0.42Turnover 11.67% 11.81% 12.01% 12.32% 13.11%

The Fundamental Index® StrategyPerformance
36 ©Research Affiliates, LLCRAFI Global 2011Q2
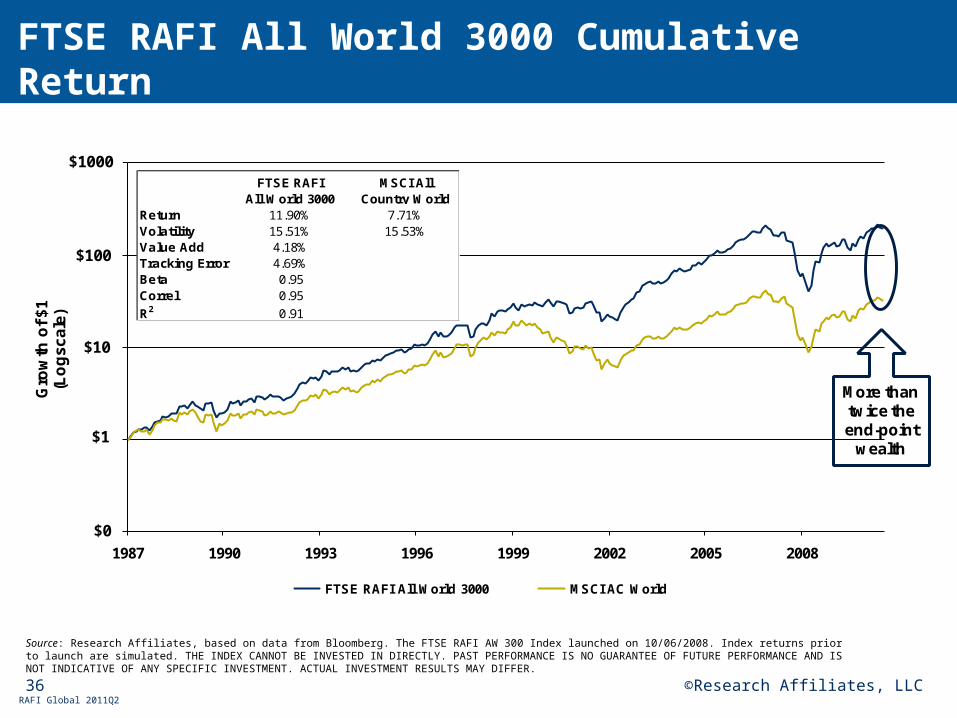
FTSE RAFI All World 3000 Cumulative Return1988–June 2011
Source: Research Affiliates, based on data from Bloomberg. The FTSE RAFI AW 300 Index launched on 10/06/2008. Index returns prior to launch are simulated. THE INDEX CANNOT BE INVESTED IN DIRECTLY. PAST PERFORMANCE IS NO GUARANTEE OF FUTURE PERFORMANCE AND IS NOT INDICATIVE OF ANY SPECIFIC INVESTMENT. ACTUAL INVESTMENT RESULTS MAY DIFFER.
1987 1990 1993 1996 1999 2002 2005 2008
Gro
wth
of
$1
(Lo
gs
ca
le)
FTSE RAFI All World 3000 MSCI AC World
$0
$1
$10
$100
$1000FTSE RAFI
All World 3000MSCI All
Country WorldReturn 11.90% 7.71%Volatility 15.51% 15.53%Value Add 4.18%Tracking Error 4.69%Beta 0.95Correl 0.95
R2 0.91
More than twice the end-point
wealth

37 ©Research Affiliates, LLCRAFI Global 2011Q2
FTSE RAFI AW 3000 vs. Cap-WeightThree-Year Returns: 1988–June 2011
Source: Research Affiliates, based on data from Bloomberg. The FTSE RAFI AW 300 Index launched on 10/06/2008. Index returns prior to launch are simulated. THE INDEX CANNOT BE INVESTED IN DIRECTLY. PAST PERFORMANCE IS NO GUARANTEE OF FUTURE PERFORMANCE AND IS NOT INDICATIVE OF ANY SPECIFIC INVESTMENT. ACTUAL INVESTMENT RESULTS MAY DIFFER.
-20%
-15%
-10%
-5%
0%
5%
10%
15%
20%
25%
30%
35%
-20% -15% -10% -5% 0% 5% 10% 15% 20% 25% 30% 35%
FT
SE
RA
FI A
W 3
00
0 3
-Ye
ar
An
nu
aliz
ed
Re
turn
MSCI AC World 3-Year Annualized Return
For Cap Return < 0%, RAFI
adds value in 100% of all cases
For Cap Return 0-10%, RAFI adds value in
100% of all cases
For Cap Return 10-20%, RAFI adds value in
76% of all cases
For Cap Return > 20%, RAFI adds value in
80% of all cases
38 ©Research Affiliates, LLCRAFI Global 2011Q2
-10%
-5%
0%
5%
10%
15%
1990 1992 1994 1996 1998 2000 2002 2004 2006 2008 2010
FT
SE
RA
FI
AW
300
0 m
inu
s M
SC
I AC
Wo
rld
3
-Ye
ar R
olli
ng
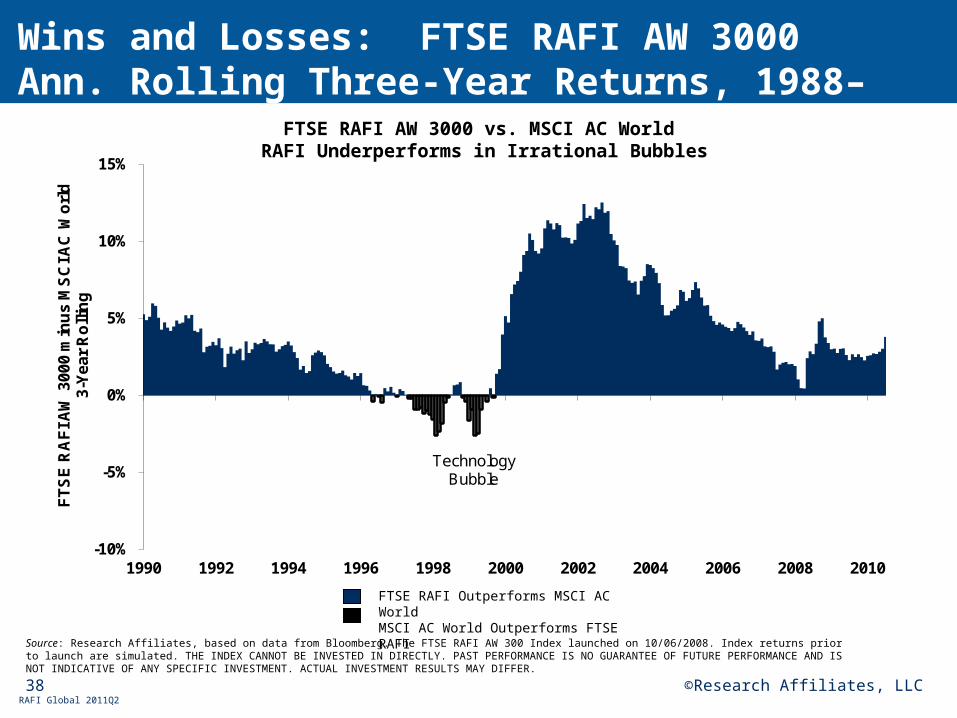
TechnologyBubble
FTSE RAFI Outperforms MSCI AC WorldMSCI AC World Outperforms FTSE RAFI
Wins and Losses: FTSE RAFI AW 3000Ann. Rolling Three-Year Returns, 1988–June 2011
FTSE RAFI AW 3000 vs. MSCI AC World RAFI Underperforms in Irrational Bubbles
Source: Research Affiliates, based on data from Bloomberg. The FTSE RAFI AW 300 Index launched on 10/06/2008. Index returns prior to launch are simulated. THE INDEX CANNOT BE INVESTED IN DIRECTLY. PAST PERFORMANCE IS NO GUARANTEE OF FUTURE PERFORMANCE AND IS NOT INDICATIVE OF ANY SPECIFIC INVESTMENT. ACTUAL INVESTMENT RESULTS MAY DIFFER.

39 ©Research Affiliates, LLCRAFI Global 2011Q2
The Fundamental Index Concept Works Globally23 Country Returns, June 2011
Note: 23- Country Average values are determined from the return series of the average country, not the average of each respective statistic in the above table.Source: Research Affiliates, LLC. Based on data from Bloomberg. The FTSE RAFI US 1000 country indexes launched on 11/28/2005. Index returns prior to launch are simulated. THE INDEX CANNOT BE INVESTED IN DIRECTLY. PAST PERFORMANCE IS NO GUARANTEE OF FUTURE PERFORMANCE AND IS NOT INDICATIVE OF ANY SPECIFIC INVESTMENT. ACTUAL INVESTMENT RESULTS MAY DIFFER.
CountryFTSE RAFI
ReturnMSCI
ReturnValue
AddedTracking
ErrorInfo
RatioAlpha
t -statisticStart Date
Austria 16.1% 8.5% 7.6% 9.0% 0.85 4.66 1984Ireland 7.5% 2.9% 4.6% 23.7% 0.20 0.98 1988Japan 0.1% -4.3% 4.4% 4.3% 1.02 3.38 1984France 14.4% 10.6% 3.8% 6.1% 0.63 3.40 1984Portugal 9.7% 5.9% 3.8% 12.1% 0.31 1.78 1989Hong Kong 19.0% 15.7% 3.2% 5.8% 0.55 3.12 1984Germany 12.0% 8.9% 3.1% 5.3% 0.59 3.91 1984Canada 12.5% 9.5% 3.0% 6.2% 0.48 3.90 1984Norway 13.3% 10.6% 2.8% 7.5% 0.37 1.88 1984Spain 13.1% 10.5% 2.6% 4.4% 0.60 3.87 1988Singapore 10.2% 7.9% 2.3% 6.6% 0.34 1.84 1988Italy 11.7% 9.5% 2.2% 5.4% 0.40 2.04 1984United Kingdom 12.8% 10.6% 2.1% 4.5% 0.48 2.36 1984United States 12.7% 10.6% 2.1% 4.9% 0.43 3.04 1984Greece 11.0% 9.2% 1.8% 12.6% 0.14 0.52 1989Australia 13.1% 11.4% 1.7% 4.2% 0.40 2.87 1984Sweden 15.2% 13.7% 1.5% 8.7% 0.18 1.49 1984Finland 11.0% 9.6% 1.5% 16.8% 0.09 1.06 1988Belgium 10.9% 10.0% 0.9% 7.8% 0.11 0.90 1984Netherlands 11.0% 10.3% 0.7% 9.8% 0.08 -0.06 1984Switzerland 9.8% 9.5% 0.3% 4.6% 0.06 0.29 1984Denmark 9.1% 9.7% -0.5% 10.1% -0.05 -0.16 1984New Zealand 2.8% 5.0% -2.2% 9.3% -0.23 -1.16 198823-Country Average 13.5% 10.9% 2.5% 3.3% 0.77 3.90 1984

40 ©Research Affiliates, LLCRAFI Global 2011Q2
-10%
-5%
0%
5%
10%
15%
20%
25%
30%
35%
40%
-10% -5% 0% 5% 10% 15% 20% 25% 30% 35% 40%
RA
FI A
nn
ua
lize
d 3
-Ye
ar
Re
turn
MSCI Annualized 3-Year Return
Other Developed G5 Average Linear (Average)
For Cap Return 20-30%, RAFI adds value in
62% of all cases
For Cap Return 10-20%, RAFI adds value in
71% of all cases
For Cap Return 0-10%, RAFI adds value in
81% of all cases
For Cap Return < 0%, RAFI
adds value in 89% of all cases
For Cap Return > 30%, RAFI adds value in
50% of all cases
Rolling Three-Year Returns, 23 CountriesJune 2011
Source: Research Affiliates, LLC. based on data from Bloomberg. Start dates for each country represented in the following graph is available on Slide 20. The FTSE RAFI country indexes launched on 11/28/2005. Index returns prior to launch are simulated. THE INDEX CANNOT BE INVESTED IN DIRECTLY. PAST PERFORMANCE IS NO GUARANTEE OF FUTURE PERFORMANCE AND IS NOT INDICATIVE OF ANY SPECIFIC INVESTMENT. ACTUAL INVESTMENT RESULTS MAY DIFFER.

41 ©Research Affiliates, LLCRAFI Global 2011Q2
Does not outperform in every bear market■ When markets punish deep value stocks in favor of growth
● Not typical of bear markets, which normally savage growth stocks
Alpha recovery occurs when prices correct■ Correction of irrational exuberance in stocks (tech bubble)
● Fundamental Index strategy typically outperforms by a wide margin
■ Macroeconomic reasons (energy crisis, financial crisis)● Fundamental Index strategy typically on par with cap-weighted benchmarks
Fundamental Index advantage comes from:■ Avoiding overreactions to irrational anti-bubbles ■ Trading into the least favored companies
Fundamental Index Performance During Global Financial Crisis
42 ©Research Affiliates, LLCRAFI Global 2011Q2
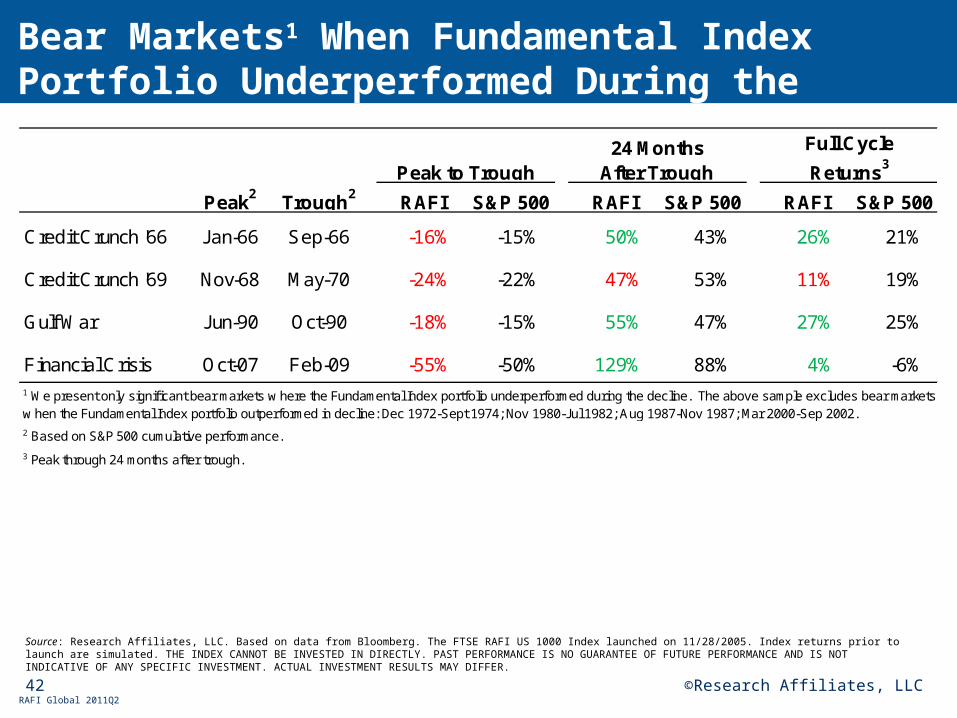
Bear Markets1 When Fundamental Index Portfolio Underperformed During the Decline
Source: Research Affiliates, LLC. Based on data from Bloomberg. The FTSE RAFI US 1000 Index launched on 11/28/2005. Index returns prior to launch are simulated. THE INDEX CANNOT BE INVESTED IN DIRECTLY. PAST PERFORMANCE IS NO GUARANTEE OF FUTURE PERFORMANCE AND IS NOT INDICATIVE OF ANY SPECIFIC INVESTMENT. ACTUAL INVESTMENT RESULTS MAY DIFFER.
Peak2 Trough2 RAFI S&P 500 RAFI S&P 500 RAFI S&P 500
Credit Crunch '66 Jan-66 Sep-66 -16% -15% 50% 43% 26% 21%
Credit Crunch '69 Nov-68 May-70 -24% -22% 47% 53% 11% 19%
Gulf War Jun-90 Oct-90 -18% -15% 55% 47% 27% 25%
Financial Crisis Oct-07 Feb-09 -55% -50% 129% 88% 4% -6%
2 Based on S&P 500 cumulative performance.
3 Peak through 24 months after trough.
Peak to Trough24 Months
After Trough
Full Cycle
Returns3
1 We present only signif icant bear markets w here the Fundamental Index portfolio underperformed during the decline. The above sample excludes bear markets w hen the Fundamental Index portfolio outperformed in decline: Dec 1972-Sept 1974; Nov 1980-Jul 1982; Aug 1987-Nov 1987; Mar 2000-Sep 2002.
43 ©Research Affiliates, LLCRAFI Global 2011Q2
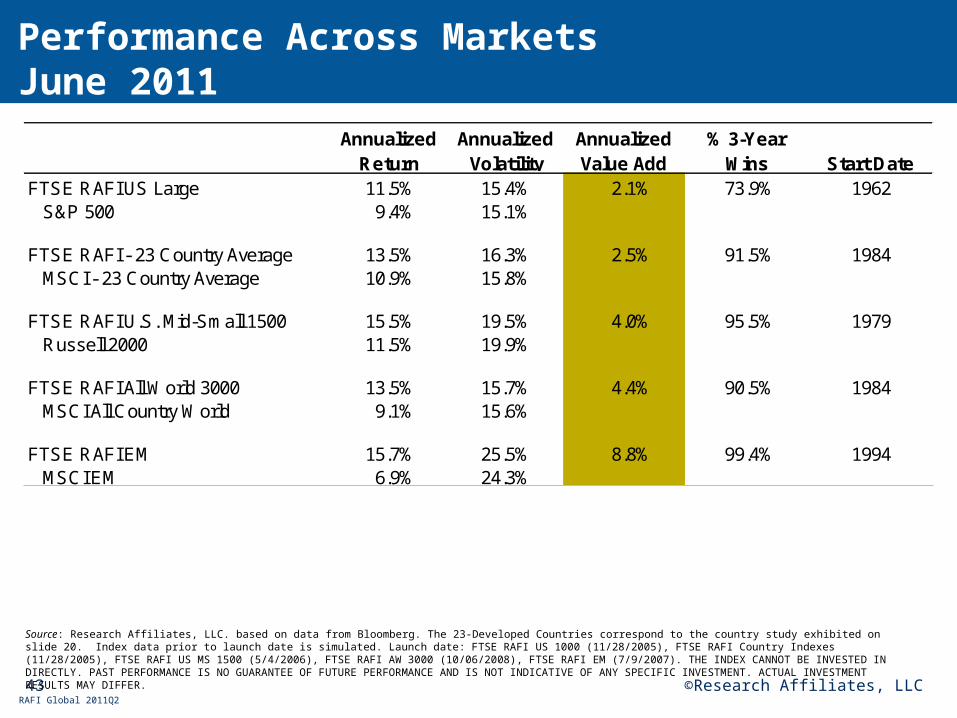
Performance Across Markets June 2011
Source: Research Affiliates, LLC. based on data from Bloomberg. The 23-Developed Countries correspond to the country study exhibited on slide 20. Index data prior to launch date is simulated. Launch date: FTSE RAFI US 1000 (11/28/2005), FTSE RAFI Country Indexes (11/28/2005), FTSE RAFI US MS 1500 (5/4/2006), FTSE RAFI AW 3000 (10/06/2008), FTSE RAFI EM (7/9/2007). THE INDEX CANNOT BE INVESTED IN DIRECTLY. PAST PERFORMANCE IS NO GUARANTEE OF FUTURE PERFORMANCE AND IS NOT INDICATIVE OF ANY SPECIFIC INVESTMENT. ACTUAL INVESTMENT RESULTS MAY DIFFER.
Annualized Return
Annualized Volatility
Annualized Value Add
% 3-Year Wins Start Date
FTSE RAFI US Large 11.5% 15.4% 2.1% 73.9% 1962S&P 500 9.4% 15.1%
FTSE RAFI - 23 Country Average 13.5% 16.3% 2.5% 91.5% 1984MSCI - 23 Country Average 10.9% 15.8%
FTSE RAFI U.S. Mid-Small 1500 15.5% 19.5% 4.0% 95.5% 1979Russell 2000 11.5% 19.9%
FTSE RAFI All World 3000 13.5% 15.7% 4.4% 90.5% 1984MSCI All Country World 9.1% 15.6%
FTSE RAFI EM 15.7% 25.5% 8.8% 99.4% 1994MSCI EM 6.9% 24.3%
Further Validation of theFundamental Index® Concept
45 ©Research Affiliates, LLCRAFI Global 2011Q2
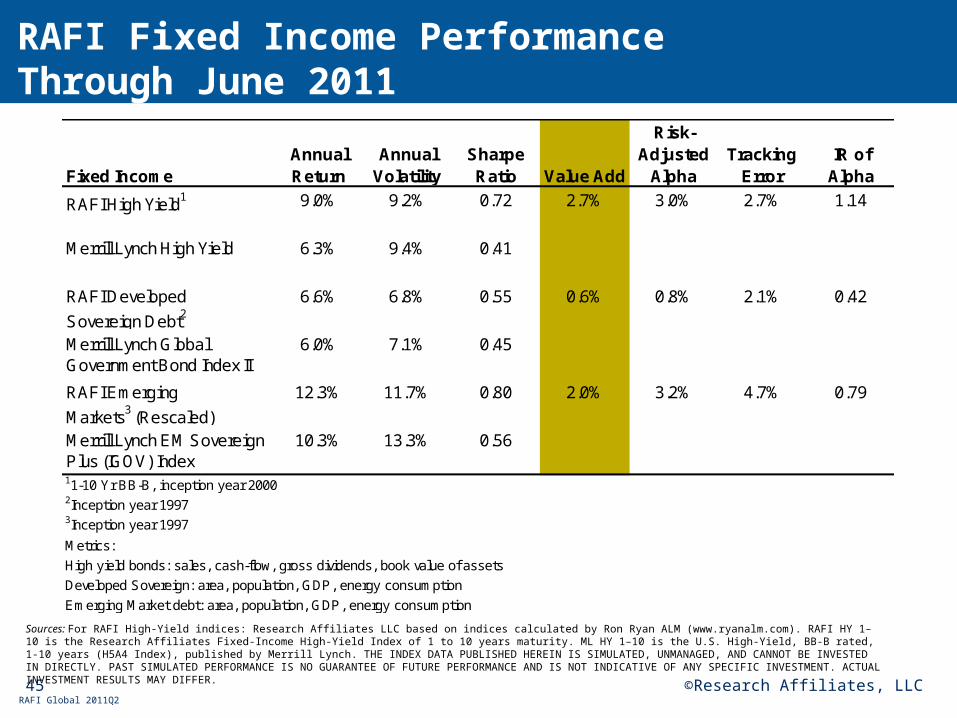
RAFI Fixed Income PerformanceThrough June 2011
Sources: For RAFI High-Yield indices: Research Affiliates LLC based on indices calculated by Ron Ryan ALM (www.ryanalm.com). RAFI HY 1–10 is the Research Affiliates Fixed-Income High-Yield Index of 1 to 10 years maturity. ML HY 1–10 is the U.S. High-Yield, BB-B rated, 1-10 years (H5A4 Index), published by Merrill Lynch. THE INDEX DATA PUBLISHED HEREIN IS SIMULATED, UNMANAGED, AND CANNOT BE INVESTED IN DIRECTLY. PAST SIMULATED PERFORMANCE IS NO GUARANTEE OF FUTURE PERFORMANCE AND IS NOT INDICATIVE OF ANY SPECIFIC INVESTMENT. ACTUAL INVESTMENT RESULTS MAY DIFFER.
Fixed IncomeAnnual Return
Annual Volatility
Sharpe Ratio Value Add
Risk-Adjusted
AlphaTracking
ErrorIR of
Alpha
RAFI High Yield1 9.0% 9.2% 0.72 2.7% 3.0% 2.7% 1.14
Merrill Lynch High Yield 6.3% 9.4% 0.41
RAFI Developed
Sovereign Debt26.6% 6.8% 0.55 0.6% 0.8% 2.1% 0.42
Merrill Lynch Global Government Bond Index II
6.0% 7.1% 0.45
RAFI Emerging
Markets3 (Rescaled)
12.3% 11.7% 0.80 2.0% 3.2% 4.7% 0.79
Merrill Lynch EM Sovereign Plus (IGOV) Index
10.3% 13.3% 0.56
11-10 Yr BB-B, inception year 20002Inception year 19973Inception year 1997
Metrics:
High yield bonds: sales, cash-flow, gross dividends, book value of assets
Developed Sovereign: area, population, GDP, energy consumption
Emerging Market debt: area, population, GDP, energy consumption
46 ©Research Affiliates, LLCRAFI Global 2011Q2
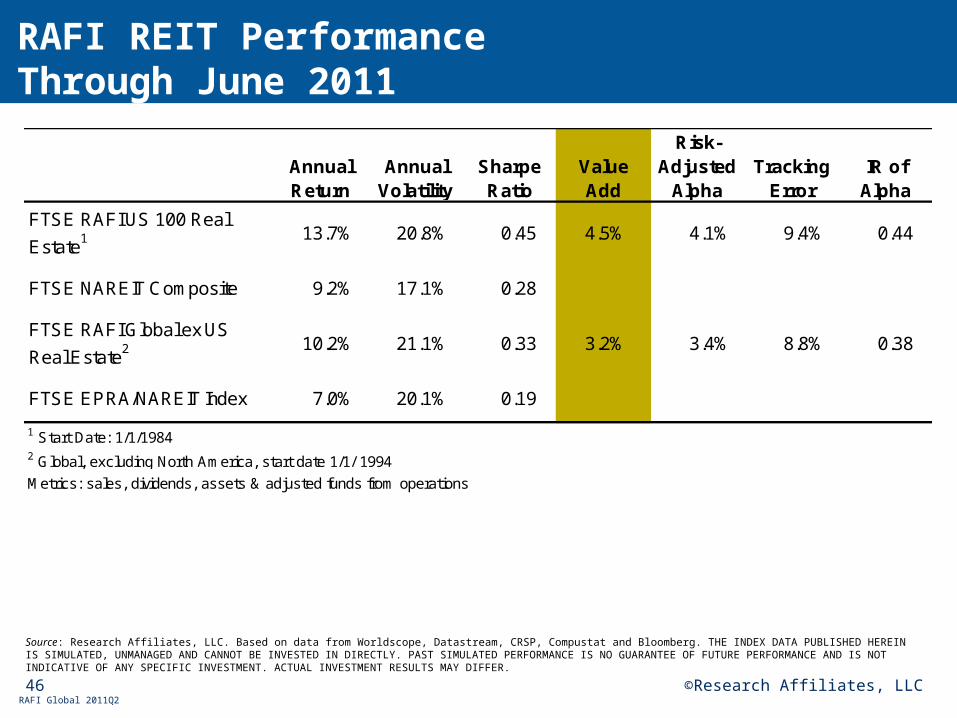
RAFI REIT PerformanceThrough June 2011
Source: Research Affiliates, LLC. Based on data from Worldscope, Datastream, CRSP, Compustat and Bloomberg. THE INDEX DATA PUBLISHED HEREIN IS SIMULATED, UNMANAGED AND CANNOT BE INVESTED IN DIRECTLY. PAST SIMULATED PERFORMANCE IS NO GUARANTEE OF FUTURE PERFORMANCE AND IS NOT INDICATIVE OF ANY SPECIFIC INVESTMENT. ACTUAL INVESTMENT RESULTS MAY DIFFER.
Annual Return
Annual Volatility
Sharpe Ratio
Value Add
Risk-Adjusted
AlphaTracking
ErrorIR of
Alpha
FTSE RAFI US 100 Real
Estate1 13.7% 20.8% 0.45 4.5% 4.1% 9.4% 0.44
FTSE NAREIT Composite 9.2% 17.1% 0.28
FTSE RAFI Global ex US
Real Estate2 10.2% 21.1% 0.33 3.2% 3.4% 8.8% 0.38
FTSE EPRA/NAREIT Index 7.0% 20.1% 0.19
1 Start Date: 1/1/19842 Global, excluding North America, start date 1/1/ 1994
Metrics: sales, dividends, assets & adjusted funds from operations
47 ©Research Affiliates, LLCRAFI Global 2011Q2
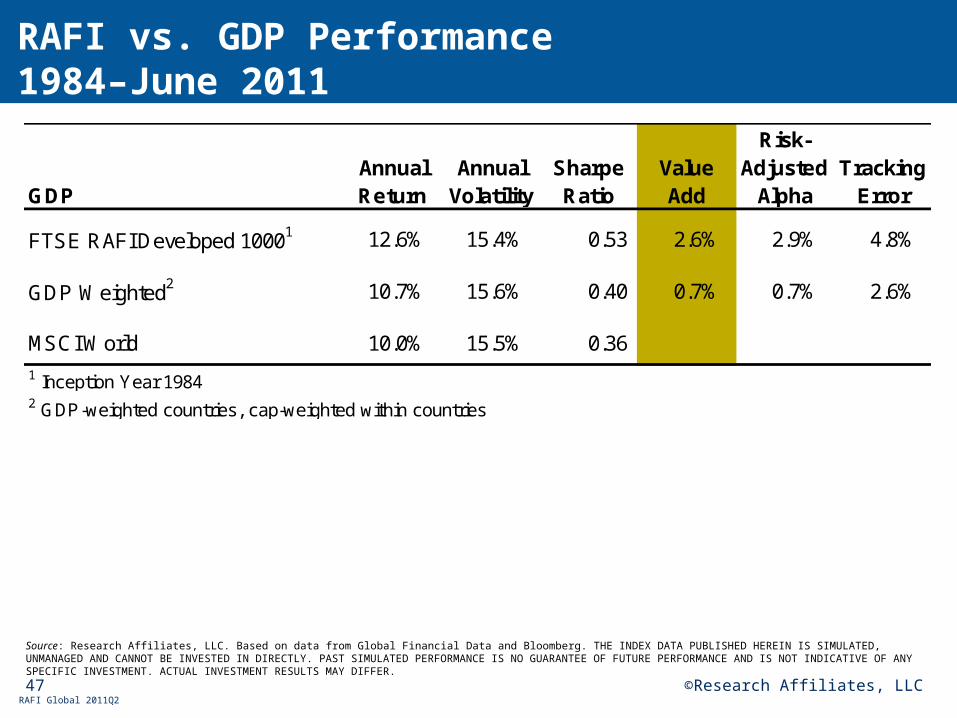
RAFI vs. GDP Performance1984–June 2011
Source: Research Affiliates, LLC. Based on data from Global Financial Data and Bloomberg. THE INDEX DATA PUBLISHED HEREIN IS SIMULATED, UNMANAGED AND CANNOT BE INVESTED IN DIRECTLY. PAST SIMULATED PERFORMANCE IS NO GUARANTEE OF FUTURE PERFORMANCE AND IS NOT INDICATIVE OF ANY SPECIFIC INVESTMENT. ACTUAL INVESTMENT RESULTS MAY DIFFER.
GDPAnnual Return
Annual Volatility
Sharpe Ratio
Value Add
Risk-Adjusted
AlphaTracking
Error
FTSE RAFI Developed 10001 12.6% 15.4% 0.53 2.6% 2.9% 4.8%
GDP Weighted2 10.7% 15.6% 0.40 0.7% 0.7% 2.6%
MSCI World 10.0% 15.5% 0.36
1 Inception Year 19842 GDP-weighted countries, cap-weighted within countries
The Fundamental Index® StrategyCharacteristics

49 ©Research Affiliates, LLCRAFI Global 2011Q2
Largest Holdings—Developed 1000June 2011
Source: Research Affiliates, based on data from FTSE and Wilshire Atlas.
Company Weight Company Weight1 Exxon Mobil 1.5% Exxon Mobil 1.3%
2 AT&T 1.2% Apple 1.0%
3 BP 1.2% Microsoft 0.7%
4 ING Groep 1.1% Nestle 0.7%
5 General Electric 1.0% IBM 0.7%
6 Chevron 0.9% Chevron 0.7%
7 Bank of America 0.9% General Electric 0.6%
8 Total 0.9% AT&T 0.6%
9 HSBC 0.9% Johnson & Johnson 0.6%
10 Royal Dutch Shell - A 0.8% Procter & Gamble 0.6%
11 Vodafone 0.8% HSBC 0.6%
12 Pfizer 0.8% Oracle 0.5%
13 J P Morgan Chase 0.8% Pfizer 0.5%
14 Citigroup 0.8% J P Morgan Chase 0.5%
15 Wal Mart 0.8% Coca Cola 0.5%
16 Verizon Communications 0.7% Novartis 0.5%
17 Banco Santander 0.7% BHP Billiton 0.5%
18 Conocophillips 0.7% Wells Fargo 0.5%
19 Royal Dutch Shell - B 0.7% Wal Mart 0.4%
20 Telefonica 0.6% BP 0.4%Top 20 Total 17.7% Top 20 Total 12.4%
FTSE RAFI Developed 1000 FTSE All World Developed
50 ©Research Affiliates, LLCRAFI Global 2011Q2
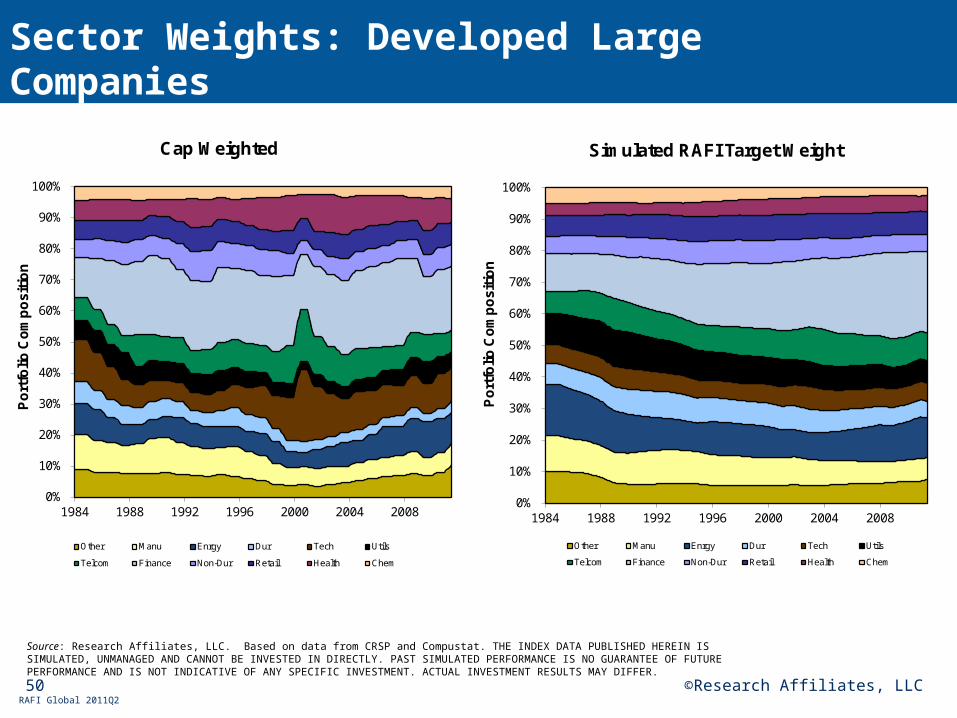
Sector Weights: Developed Large CompaniesRolling 12-Month Averages: 1984–June 2011
Source: Research Affiliates, LLC. Based on data from CRSP and Compustat. THE INDEX DATA PUBLISHED HEREIN IS SIMULATED, UNMANAGED AND CANNOT BE INVESTED IN DIRECTLY. PAST SIMULATED PERFORMANCE IS NO GUARANTEE OF FUTURE PERFORMANCE AND IS NOT INDICATIVE OF ANY SPECIFIC INVESTMENT. ACTUAL INVESTMENT RESULTS MAY DIFFER.
0%
10%
20%
30%
40%
50%
60%
70%
80%
90%
100%
1984 1988 1992 1996 2000 2004 2008
Po
rtfo
lio
Co
mp
osi
tio
n
Cap Weighted
Other Manu Enrgy Dur Tech Utils
Telcom Finance Non-Dur Retail Health Chem
0%
10%
20%
30%
40%
50%
60%
70%
80%
90%
100%
1984 1988 1992 1996 2000 2004 2008
Po
rtfo
lio
Co
mp
osi
tio
n
Simulated RAFI Target Weight
Other Manu Enrgy Dur Tech Utils
Telcom Finance Non-Dur Retail Health Chem

51 ©Research Affiliates, LLCRAFI Global 2011Q2
0%
10%
20%
30%
40%
50%
60%
70%
80%
90%
100%
1984 1988 1992 1996 2000 2004 2008
Po
rtfo
lio C
om
po
siti
on
United States Canada United Kingdom Germany
France Italy Other Europe Dev. AP ex Japan
Japan EM
0%
10%
20%
30%
40%
50%
60%
70%
80%
90%
100%
1984 1988 1992 1996 2000 2004 2008
Po
rtfo
lio
Co
mp
osi
tio
n
United States Canada United Kingdom Germany
France Italy Other Europe Dev. AP ex Japan
Japan EM
Country Weights: All World 3000 Rolling 12-Month Averages: 1984–June 2011
Source: Research Affiliates, LLC. Based on data from CRSP, Compustat, Datastream, and Worldscope. THE INDEX DATA PUBLISHED HEREIN IS SIMULATED, UNMANAGED AND CANNOT BE INVESTED IN DIRECTLY. PAST SIMULATED PERFORMANCE IS NO GUARANTEE OF FUTURE PERFORMANCE AND IS NOT INDICATIVE OF ANY SPECIFIC INVESTMENT. ACTUAL INVESTMENT RESULTS MAY DIFFER.
Cap Weighted Simulated RAFI Target Weight
The Fundamental Index® StrategyAttribution
53 ©Research Affiliates, LLCRAFI Global 2011Q2
1996 1998 2000 2002 2004 2006 2008 2010
Gro
wth
of
$1
(Lo
gs
ca
le)
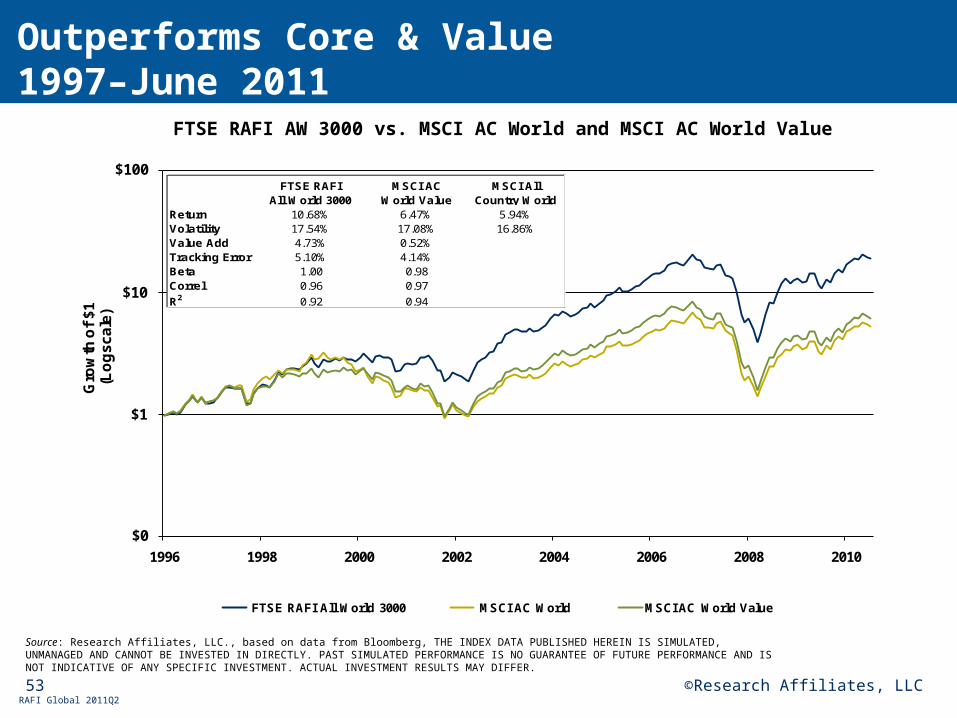
FTSE RAFI All World 3000 MSCI AC World MSCI AC World Value
$0
$1
$10
$100FTSE RAFI
All World 3000MSCI AC
World ValueMSCI All
Country WorldReturn 10.68% 6.47% 5.94%Volatility 17.54% 17.08% 16.86%Value Add 4.73% 0.52%Tracking Error 5.10% 4.14%Beta 1.00 0.98Correl 0.96 0.97
R2 0.92 0.94
Outperforms Core & Value1997–June 2011
FTSE RAFI AW 3000 vs. MSCI AC World and MSCI AC World Value
Source: Research Affiliates, LLC., based on data from Bloomberg, THE INDEX DATA PUBLISHED HEREIN IS SIMULATED, UNMANAGED AND CANNOT BE INVESTED IN DIRECTLY. PAST SIMULATED PERFORMANCE IS NO GUARANTEE OF FUTURE PERFORMANCE AND IS NOT INDICATIVE OF ANY SPECIFIC INVESTMENT. ACTUAL INVESTMENT RESULTS MAY DIFFER.
54 ©Research Affiliates, LLCRAFI Global 2011Q2
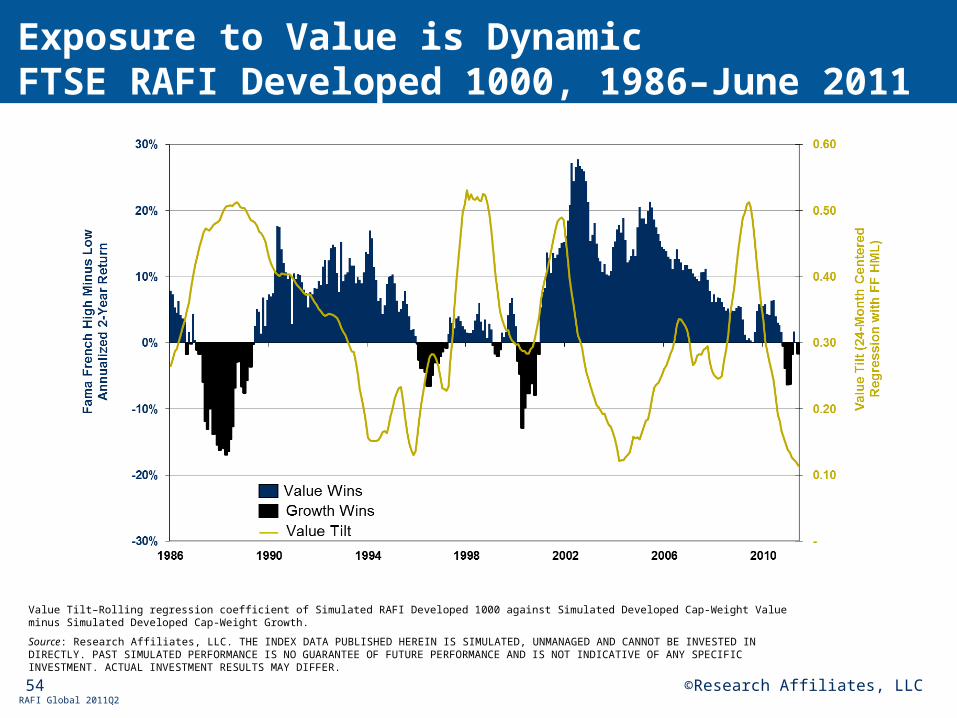
Exposure to Value is DynamicFTSE RAFI Developed 1000, 1986–June 2011
Value Tilt–Rolling regression coefficient of Simulated RAFI Developed 1000 against Simulated Developed Cap-Weight Value minus Simulated Developed Cap-Weight Growth.
Source: Research Affiliates, LLC. THE INDEX DATA PUBLISHED HEREIN IS SIMULATED, UNMANAGED AND CANNOT BE INVESTED IN DIRECTLY. PAST SIMULATED PERFORMANCE IS NO GUARANTEE OF FUTURE PERFORMANCE AND IS NOT INDICATIVE OF ANY SPECIFIC INVESTMENT. ACTUAL INVESTMENT RESULTS MAY DIFFER.

55 ©Research Affiliates, LLCRAFI Global 2011Q2
Dynamic Attribution Analysis
Source: Research Affiliates, LLC. Based on research conducted by Research Affiliates, LLC for the periods indicated in the tables above. The analysis displays value added attribution of simulated RAFI AW 3000 against a simulated Cap-Weight All World 3000 Index and simulated RAFI US Large vs S&P 500 Index. Returns are in USD. Source data provided by CRSP, Compustat, Datastream and Worldscope. Hypothetical or simulated performance results have certain inherent limitations and do not represent actual trading. Past simulated performance is no guarantee of future results.
The Dynamic Attribution Analysis displayed above is described in the following paper: Hsu, Jason C., Kalesnik, Vitali and Myers, Brett W., “Performance Attribution: Measuring Dynamic Allocation Skill,” (March 26, 2010). Available at SSRN: http://ssrn.com/abstract=1578934
Total Value Added 4.35% Total Value Added 2.15%Average Tilts 0.86% Average Tilts 0.59%Dynamic Tilts 3.48% Dynamic Tilts 1.56%
Sector Allocation 0.24% Sector Allocation 0.47%Average Sector Exposure -0.04% Average Sector Exposure -0.05%Dynamic Sector Exposure 0.28% Dynamic Sector Exposure 0.51%
Style: Growth vs. Value 1.88% Style: Growth vs. Value 1.16%Average Value Exposure 0.72% Average Value Exposure 0.44%Dynamic Value Exposure 1.15% Dynamic Value Exposure 0.72%
Style: Small vs. Large 0.00% Style: Small vs. Large 0.45%Average Size Exposure 0.06% Average Size Exposure 0.20%Dynamic Size Exposure -0.06% Dynamic Size Exposure 0.25%
Country Allocation 1.37% Stock Selection 0.07%Average Country Exposure 0.12%Dynamic Country Exposure 1.25%
Stock Selection 0.85%
Simulated RAFI All World 3000 (1984–June 2011) Simulated RAFI US 1000 (1962–June 2011)

Research AffiliatesFTSE RAFI® Index Performance
57 ©Research Affiliates, LLCRAFI Global 2011Q2
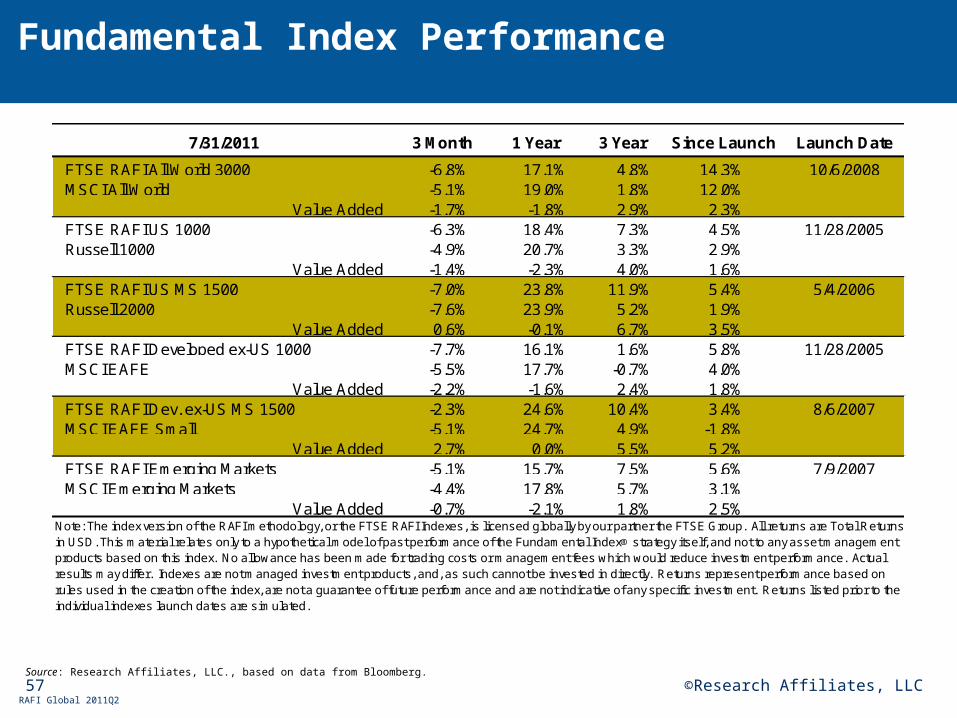
Fundamental Index Performance
Source: Research Affiliates, LLC., based on data from Bloomberg.
7/31/2011 3 Month 1 Year 3 Year Since Launch Launch Date
FTSE RAFI All World 3000 -6.8% 17.1% 4.8% 14.3% 10/6/2008MSCI All World -5.1% 19.0% 1.8% 12.0%
Value Added -1.7% -1.8% 2.9% 2.3%FTSE RAFI US 1000 -6.3% 18.4% 7.3% 4.5% 11/28/2005Russell 1000 -4.9% 20.7% 3.3% 2.9%
Value Added -1.4% -2.3% 4.0% 1.6%FTSE RAFI US MS 1500 -7.0% 23.8% 11.9% 5.4% 5/4/2006Russell 2000 -7.6% 23.9% 5.2% 1.9%
Value Added 0.6% -0.1% 6.7% 3.5%FTSE RAFI Developed ex-US 1000 -7.7% 16.1% 1.6% 5.8% 11/28/2005MSCI EAFE -5.5% 17.7% -0.7% 4.0%
Value Added -2.2% -1.6% 2.4% 1.8%FTSE RAFI Dev. ex-US MS 1500 -2.3% 24.6% 10.4% 3.4% 8/6/2007MSCI EAFE Small -5.1% 24.7% 4.9% -1.8%
Value Added 2.7% 0.0% 5.5% 5.2%FTSE RAFI Emerging Markets -5.1% 15.7% 7.5% 5.6% 7/9/2007MSCI Emerging Markets -4.4% 17.8% 5.7% 3.1%
Value Added -0.7% -2.1% 1.8% 2.5%Note: The index version of the RAFI methodology, or the FTSE RAFI Indexes, is licensed globally by our partner the FTSE Group. All returns are Total Returns in USD. This material relates only to a hypothetical model of past performance of the Fundamental Index® strategy itself, and not to any asset management products based on this index. No allowance has been made for trading costs or management fees which would reduce investment performance. Actual results may differ. Indexes are not managed investment products, and, as such cannot be invested in directly. Returns represent performance based on rules used in the creation of the index, are not a guarantee of future performance and are not indicative of any specific investment. Returns listed prior to the individual indexes launch dates are simulated.
58 ©Research Affiliates, LLCRAFI Global 2011Q2
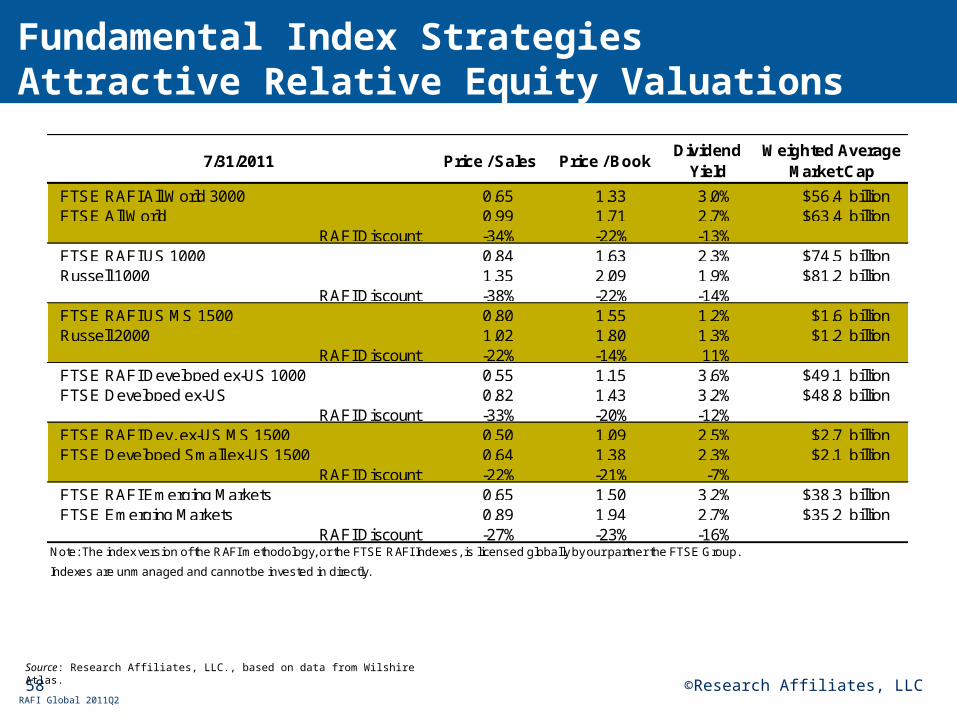
Fundamental Index StrategiesAttractive Relative Equity Valuations
Source: Research Affiliates, LLC., based on data from Wilshire Atlas.
7/31/2011 Price / Sales Price / BookDividend
Yield
FTSE RAFI All World 3000 0.65 1.33 3.0% $56.4 billionFTSE All World 0.99 1.71 2.7% $63.4 billion
RAFI Discount -34% -22% -13%FTSE RAFI US 1000 0.84 1.63 2.3% $74.5 billionRussell 1000 1.35 2.09 1.9% $81.2 billion
RAFI Discount -38% -22% -14%FTSE RAFI US MS 1500 0.80 1.55 1.2% $1.6 billionRussell 2000 1.02 1.80 1.3% $1.2 billion
RAFI Discount -22% -14% 11%FTSE RAFI Developed ex-US 1000 0.55 1.15 3.6% $49.1 billionFTSE Developed ex-US 0.82 1.43 3.2% $48.8 billion
RAFI Discount -33% -20% -12%FTSE RAFI Dev. ex-US MS 1500 0.50 1.09 2.5% $2.7 billionFTSE Developed Small ex-US 1500 0.64 1.38 2.3% $2.1 billion
RAFI Discount -22% -21% -7%FTSE RAFI Emerging Markets 0.65 1.50 3.2% $38.3 billionFTSE Emerging Markets 0.89 1.94 2.7% $35.2 billion
RAFI Discount -27% -23% -16%
Indexes are unmanaged and cannot be invested in directly.
Note: The index version of the RAFI methodology, or the FTSE RAFI Indexes, is licensed globally by our partner the FTSE Group.
Weighted Average Market Cap

The Fundamental Index® StrategyEnhancements
60 ©Research Affiliates, LLCRAFI Global 2011Q2
Objective■ Seek to enhance Fundamental Index return advantage over S&P 500
by 50–100 bps with minimal pick-up in tracking error
Process■ Constantly scan for promising new ideas
● Review leading research journals
● Participate in academic and practitioner conferences
■ Rigorously examine and test promising new ideas● Determine economic and behavioral rationale for excess return
● Gauge robustness and statistical significance using econometric methods
● Determine additional trading costs and weigh in light of excess return
● Assess impact on other enhancements and Fundamental Index strategy advantage
What Do We Do in Enhanced RAFI?
61 ©Research Affiliates, LLCRAFI Global 2011Q2
Quality of Corporate Earnings■ Reduce weights in companies that use aggressive accounting■ Use net operating assets ratio
Financial Distress Risk■ Reduce weights in companies that are closer to default■ Use debt coverage ratio
Signal Diversification■ Reduce the big active weights of the largest cap-weighted stocks■ Use proprietary methodology
Enhancements to the Fundamental Index Methodology

62 ©Research Affiliates, LLCRAFI Global 2011Q2
Cap-weighting has a rich history… and a flaw
The Fundamental Index concept improves on cap weighting■ Addresses the shortcomings of cap weighting while maintaining the
benefits of a broad market index■ Generally outperforms its cap-weighted counterparts■ Adds more value as pricing errors increase (i.e., in markets like
emerging markets, international, and small cap)
Efficient Indexing for an Inefficient Market

63
Cidel Overview
Investment Management
Captive Platform Overview
Investment Platforms
Service Model
Why Cidel?
Agenda
For information purposes only and not for public use

64
Service
• Dedicated Investment Manager, Relationship Manager and Account Representative
• Single account with bank and investment subs
• Online access
• Streamlined due diligence process
• Robust reporting
• Flexible infrastructure
65
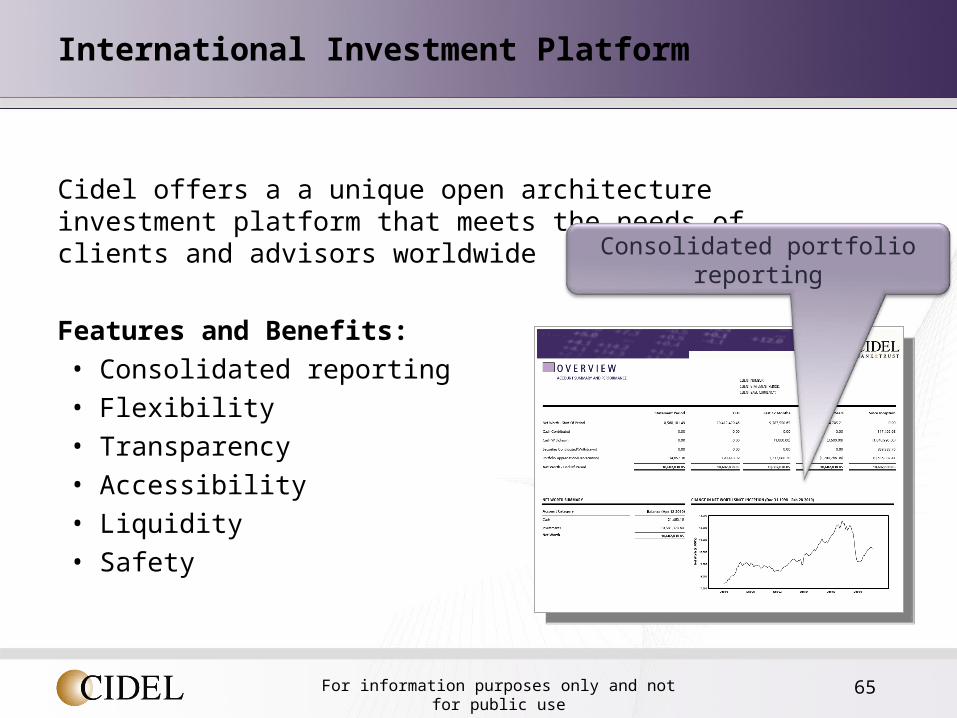
International Investment Platform
Cidel offers a a unique open architecture investment platform that meets the needs of clients and advisors worldwide
Features and Benefits:
• Consolidated reporting
• Flexibility
• Transparency
• Accessibility
• Liquidity
• Safety
For information purposes only and not for public use
Consolidated portfolio reporting

66
International Investment Platform
For information purposes only and not for public use
Consolidated reportof all asset classes
Multiple holding types across multiple currencies

67
Cidel Overview
Investment Management
Captive Platform Overview
Investment Platforms
Service Model
Why Cidel?
Agenda
For information purposes only and not for public use
Why Cidel?
• Largest provider of wealth management services to the international sector in Barbados
• Dedicated service team in most of key markets including Barbados• Best-in-class managers• Both passive and active management • Tactical vs 100% strategic• Advanced custody and reporting• Credit by Scotia• Custody by RBC Dexia

69
Market Commentary
• Low interest rate environment
• Widening credit spreads, corporate default risks, lower bond yields
• Sovereign debt crisis
• High volatility
• Identify any risk factors that are likely to impact captives directly re: claims or regulation

The material contained in this document is for information purposes only and is not intended as an offer or solicitation for purchase or sale of any product or service, nor is it advice or a recommendation to enter into any transaction. We have endeavoured to offer current, accurate and clearly expressed information. However, since inadvertent errors may occur, relevant legislation and regulations may change and/or the application of laws and regulations may vary, the information may be neither current nor accurate. All individuals should obtain specific professional advice with regard to the respective tax or other professional area. No action should be taken or omitted to be taken in reliance upon any of the information provided and in no event shall Cidel Bank & Trust inc., its subsidiaries, its directors, principals, agents or employees be liable for any direct, indirect, incidental, special, exemplary, punitive, consequential or other damages whatsoever including, but not limited to contract, negligence or other tortuous actions arising out of or in connection with any content of the information provided or other use hereof.
To understand where a person wants to be, you first have to know the person
Perhaps we should talk?
Cidel Barbados Captive Team:
Ryle Weekes Joy Aberback
[email protected] [email protected]
+1 246 430 5350www.cidel.com