cife - s3l.stanford.edus3l.stanford.edu/projects/drsense/drfinalproposal_v1.pdf · ! 1! cife center...
TRANSCRIPT

1
CIFE Center for Integrated Facility Engineering •Stanford
University
CIFE Seed Proposal Summary Page 2011-12 Projects
Proposal Title: DRSense -‐ Automated and Scalable Assessment of Demand Response for Green Building Portfolios
Principal Investigator(s): Prof. Ram Rajagopal (Civil and Environmental Engineering), Prof. Abbas El Gamal (Electrical Engineering) and Dr. Amit Narayan (Electrical Engineering)
Research Staff:
Proposal Number: (Assigned by CIFE):
Total Funds Requested: US$ 80,000
First Submission? Y If extension, project URL:
Abstract (up to 150 words):
Green energy efficient building portfolios need to incorporate significant participation in Demand Response (DR) programs to reduce their operating costs and peak energy consumption. Currently, building owners and managers are unable to evaluate the DR potential of their portfolio, assign the best DR strategies for each individual building and perform a cost/benefit analysis of implementing DR. The main limitation is the very manual one time evaluation in current practice. Instead we propose a DRSense: a tool that combines real-time data, models for building consumption and data mining with advanced statistical methods to derive DR potential. If successful, the open-source web based tool will enable facility operators to continuously assess building performance and optimize the dynamic strategy for DR that achieves the most savings. Given the important role of DR in the future grid, it is essential to develop tools that guide the configuration of DR for a specific building portfolio.

2
Motivating engineering/business problem: Green energy efficient buildings make significant use of renewable technologies and strive for lower operating costs. Costs are higher if more energy is consumed during peak load times. An important technology that is essential for greening a building is Demand Response (DR). DR is a tariff or program established to motivate changes in electric use by end-‐use customers in response to changes in the price of electricity over time, or to give incentive payments designed to induce lower electricity consumption at times of high market prices or when grid reliability is jeopardized [CMU-‐DREME]. DR provides an approach to reduce operation costs of a building by shifting or limiting consumption during peak periods. At the same time DR decreases the peak generation requirements of the power system, reducing emissions and increasing grid reliability establishing it as an essential need [FERC2010].
Building owners and managers considering incorporation of DR into their portfolios have to answer a number of important questions:
• How much DR is available for a given building and a portfolio of buildings? • What strategies are best suited for DR for a given building? • What is the cost and benefit for incorporating DR at a building? • How to maximize the DR potential for the entire portfolio given the cost / benefit analysis of individual
buildings? Today, answering these questions requires an energy audit by a specialized energy management consultant who visits each building and spends considerable amount of time determining the DR strategy and estimating DR potential for a given building. For large commercial buildings where such an assessment can be done once, facility managers have no easy way to determine if a given building is meeting its desired DR goals during a DR event, or where a particular building stands with respect to its ‘peers’ in terms of its DR performance for a given DR event. This type of benchmarking could be useful in improving the participation rates for buildings that are already enrolled in DR programs but are not maximizing the peak energy reduction potential of the building. In fact, on an average only 30-‐40% of enrolled DR capacity participates in any given DR event. A continuous assessment of
Figure 2: Demand response programs available at various utilities/systems. Potential benefits achieved if increasing participation in demand response programs. Notice that different programs have different impacts.[LBL-DR-Market-Potential].
3
demand response can give a more accurate portrait of DR for each building in a portfolio accounting for changes in use patterns and operation decisions, contrasting with a single time assessment and can significantly improve the overall participation in DR events. Moreover, the time and expense involved in the assessment process precludes most small and medium sized buildings from this type of manual DR assessment. In fact, most utility programs only allow customers using more than 100kW to participate in their DR programs [Figure 2] [LBL-‐DR-‐Market-‐Potential]. In the absence of an automated, low cost assessment, most customers are not able to determine the benefits and effort involved in signing up for a DR program. The aim of our research is to develop DRSense: a low-‐cost automated self-‐assessment tools for commercial building managers to determine the strategies and DR potential of their building portfolio. DRSense will integrate real-‐time building data, such as that generated by Cisco’s Building Mediator, and combine it with advanced data mining and forecasting analytics to provide a real-‐time assessment of DR. DRSense can enhance the current BIM model from a static view to a dynamic view that incorporates energy considerations. Moreover, DRSense will be integrated into the ‘continuous commissioning’ process so that DR participation of an enrolled building is monitored and automatically benchmarked against other ‘similar’ buildings in near real-‐time to determine if a building is optimally participating in DR and maximizing the DR potential under the constraints of occupant comfort. The portfolio benchmarking can also be used to compare the buildings with least DR potential to those with most to evaluate more permanent energy efficiency interventions. Wider adoption of DR also has clear societal benefits, as recent studies [FERC2009] show that 60% participation in the program leads to 14% decrease in required generation. We believe the tool we propose to be necessary to drive a wider adoption and maximize the value of DR.
Theoretical and Practical Point of Departure
State of the art: The typical methodology for assessing the DR potential of a building requires an intensive and expensive audit of the building to provide an estimate of a building’s DR potential and applicable DR strategies. As mentioned earlier, this approach is not scalable and is practical only on large commercial buildings as a one-‐time exercise. Recently, some research has been done on using modeling and simulation to aid in the process of determining a building’s energy consumption and various energy efficiency measures that can be applied at that building. Typically, a model for the building is setup in energy simulation software such as EnergyPlus [LBL-‐DR-‐Eplus] to model a building a multiple time scales. Usually, this model is created by a dedicated professional consultant requiring detailed knowledge of the simulation software. The software itself requires detailed information about the building such as room sizes, temperature zones, wall materials, window parameters, and variable parameters such as temperature set points, occupancy schedules and weather patterns. Simulations are then carried out to evaluate the energy usage profile of the building at different time scales and time horizons. In theory, such whole building simulations can be used to evaluate DR potential, to determine the strategies most effective for a given building and to enroll the building in the appropriate DR utility program. As a practical matter, for a site with multiple buildings or a utility portfolio with thousands of buildings, it is infeasible to create the detailed models needed by building simulation programs for each building to assess the potential DR benefit. Some software tools that attempt to simplify the process of model creation and use the simplified models to get a quick assessment of DR potential have been proposed. For example, DR Quick Assessment Tool [DR-‐DRQAT] from Lawrence Berkeley National Labs uses standard building configurations and only selected aggregate information about fixed and variable parameter settings to perform DR evaluation. Such simplified approaches only work well to evaluate energy usage at large time scales, such as hours or days due to model inaccuracy, and for only selected strategies such as HVAC thermostat control within the buildings. None of the previous studies that we have seen

4
attempt to systematically analyze a building and all the applicable DR strategies to rank-‐order the strategies based on the peak energy saving potential to maximize the overall building DR potential. In this project, we will attempt to systematically analyze one large commercial building and model all the applicable DR strategies to estimate the peak energy usage potential for each one of them. An important dimension of DR is the strategy space (Figure 5). The strategy space for a given building is the set of all potentially applicable DR strategies for that building. Some important DR strategies are pre-‐cooling, global temperature adjustment, lighting reduction and limiting the Fan VFD. DR strategies operate by reducing demand at different time scales and by different amounts. A major goal of DR assessment is to evaluate the DR potential across the whole strategy space, including the joint space of strategies for a portfolio of buildings. The effect of a DR strategy combination can be represented as a Virtual Generation Profile (VGP) that corresponds to the (negative) energy generated by the building portfolio. The earliest notification time required to implement the combined strategy corresponds to the virtual generator dispatch time. The VGP and Dispatch Time together enable a building portfolio to participate in the ancillary service power market. Another practical issue with using building simulation for the purpose of DR estimation as done in the earlier studies is that even carefully constructed models can deviate from actual energy consumption due to variations in occupancy and building use patterns or inaccurate fixed parameters. Typical energy models predict actual energy consumption within 5% to 20% of actual consumption (Figure 3). DR programs are designed to obtain portfolio energy usage reductions as small as 1 % to 2% from peak usage at peak usage time. Thus, model inaccuracies can affect the ability of executing important DR strategies for a building, especially those strategies that operate in small time scales such as minutes.
Mitigating this difficulty requires incorporating real-‐time data from the building. Currently, some studies propose using the real-‐time data to improve the tuning of the building energy model, and some of the data is subsequently used as inputs to the model [DR-‐DRQAT,DR-‐Inverse-‐Model]. Typically variables such as airflow temperatures, measured zone temperatures, outside air temperature and total used power are used in the process. The resulting models are generally more accurate (see Figures 3 and 4), but can still lack explanatory power at smaller time scales. Also, the process of calibration and fine-‐tuning is typically manual and very time consuming. A distinguishing feature of our work will be to automate the process of model calibration. We will tie-‐in the data collected as part of the ‘continuous commissioning’ of a building from the EMS systems to automatically, and in near real-‐time, calibrate the building simulation model using online machine learning and statistical data-‐mining
Figure 3: Development and calibration of simulation model using DRQAT. Accuracy of simulation on 11 buildings after calibration process[DR-DRQAT].

5
techniques. This calibrated model will get refined over time and could be used to make short-‐term decisions around operating DR most effectively or long-‐term decisions around the DR programs to participate and determining contract structures.
Figure 4: Data based model performance for predicting coaling load for Iowa Energy Center, a typical small commercial building. Precooling DR strategy showing measured data and simulations for a similar scenario using learnt model.[DR-‐Inverse-‐Model].
Figure 5: DR strategies happen at different time-scales and require distinct amount of advance notice: for example, pre-cooling is a day ahead strategy and lighting reduction or Fan VFD limit is near real-time [LBL-‐DR-‐Coordination]. Each strategy or combination of strategies leads to a Virtual Generation Profile(VGP).
Figure 6: Proposed approach relies on combining sensor information from buildings in a site with weather information and a DR model to create the set of achievable Virtual Generation Profiles of a portfolio of buildings. The DR model might be based on a simulator such as EnergyPlus or on purely statistical data mining methods. Our approach allows targeting individual buildings in a portfolio for specific DR contracts, including beneficial correlations between energy use in the portfolio.
6
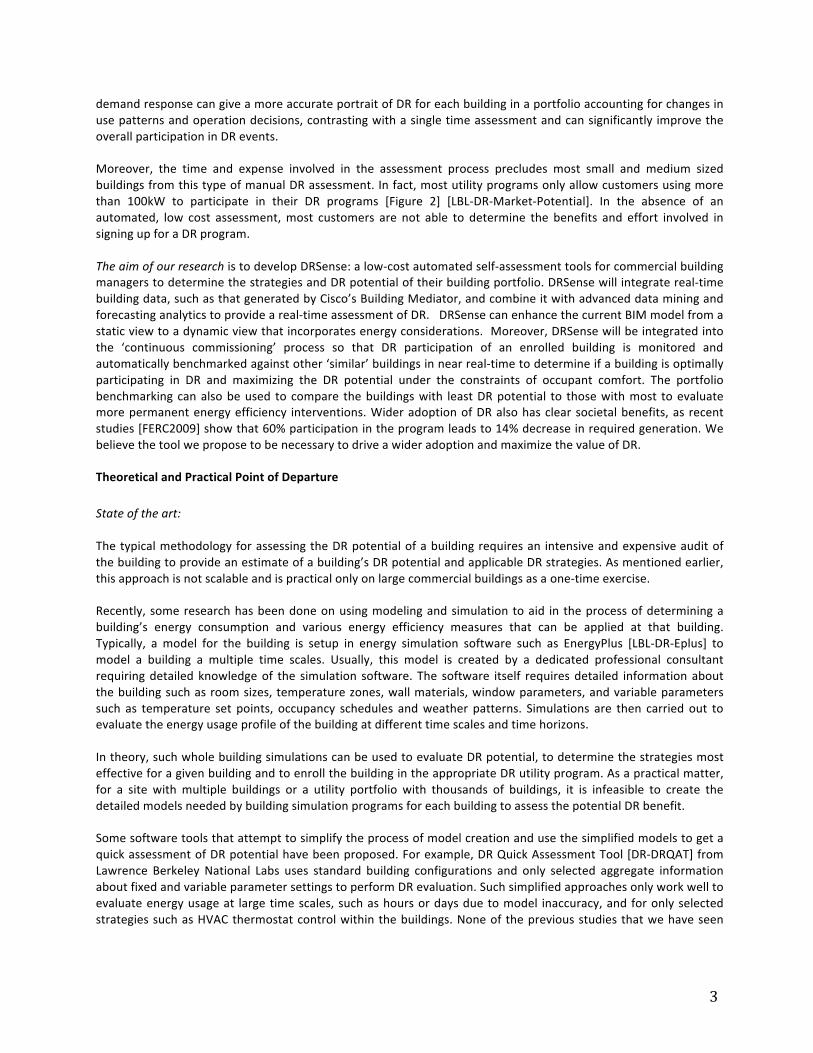
Proposed approach: Our proposed approach (Figure 6) relies on combining building sensor information and a DR model to create the Virtual Generation Profile of a portfolio of buildings. It departs from the existing approaches in many ways: • Each building is directly modeled based on existing high resolution sensor information, including forecasts of
observed time series such as weather and plug loads; • Multiple single building strategies are evaluated in isolation or in combination, giving a broader coverage of the
strategy space; • Model is used for DR assessment, i.e. difference between baseline use and use while strategy is applied, as
opposed to baseline simulation alone, creating the possibility of cancellation of systematic errors from un-‐modeled dynamics;
• Whole building portfolio is evaluated resulting in joint DR potential and VGP estimates that are potentially better than the sum of individual parts due to complementary nature of energy use;
• Whole building portfolio evaluation reveals relative performance of buildings in the portfolio, offering a potential approach to prioritize more expensive interventions;
• Systematic characterization of VGP and dispatch time are usually not considered in DR assessment tools;
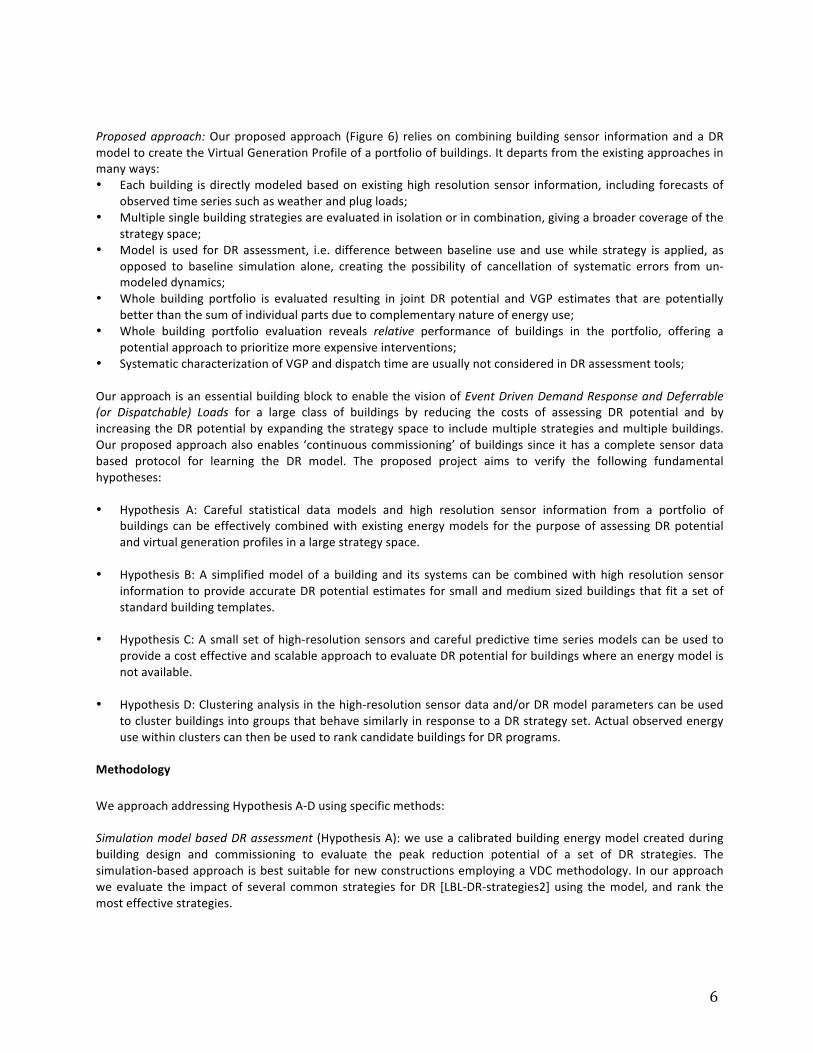
Our approach is an essential building block to enable the vision of Event Driven Demand Response and Deferrable (or Dispatchable) Loads for a large class of buildings by reducing the costs of assessing DR potential and by increasing the DR potential by expanding the strategy space to include multiple strategies and multiple buildings. Our proposed approach also enables ‘continuous commissioning’ of buildings since it has a complete sensor data based protocol for learning the DR model. The proposed project aims to verify the following fundamental hypotheses: • Hypothesis A: Careful statistical data models and high resolution sensor information from a portfolio of
buildings can be effectively combined with existing energy models for the purpose of assessing DR potential and virtual generation profiles in a large strategy space.
• Hypothesis B: A simplified model of a building and its systems can be combined with high resolution sensor
information to provide accurate DR potential estimates for small and medium sized buildings that fit a set of standard building templates.
• Hypothesis C: A small set of high-‐resolution sensors and careful predictive time series models can be used to
provide a cost effective and scalable approach to evaluate DR potential for buildings where an energy model is not available.
• Hypothesis D: Clustering analysis in the high-‐resolution sensor data and/or DR model parameters can be used
to cluster buildings into groups that behave similarly in response to a DR strategy set. Actual observed energy use within clusters can then be used to rank candidate buildings for DR programs.
Methodology
We approach addressing Hypothesis A-‐D using specific methods: Simulation model based DR assessment (Hypothesis A): we use a calibrated building energy model created during building design and commissioning to evaluate the peak reduction potential of a set of DR strategies. The simulation-‐based approach is best suitable for new constructions employing a VDC methodology. In our approach we evaluate the impact of several common strategies for DR [LBL-‐DR-‐strategies2] using the model, and rank the most effective strategies.

7
Hybrid model based DR assessment (Hypothesis B): we use a simplified model for a building that is calibrated using the available high-‐resolution sensor information. Some simplified models are proposed in [DC-‐Load-‐Following, DR-‐Inverse-‐Model] for modeling air conditioning system or heat flows in small and medium buildings. They reduce to high dimensional time series models used in forecasting [TimeSeries]. An alternative we will consider is to have preset parameters in an EnergyPlus simulation based on observed building parameters, and tune some of these parameters so the simulation matches the observed data. Since the model used is simplified, the method will be best suited for small & medium sized buildings that fit one of the existing pre-‐defined standard templates. Data-‐based DR assessment (Hypothesis C): we use the data collected from building sensors and stored in building energy management systems to determine the ‘sensitivity’ of building energy consumption to temperature set points, outside temperature and other parameters to estimate the DR potential of specific strategies. This is a ‘black-‐box’ approach and highly scalable, and only requires minimal or no assumptions about the building model. It relies on time series and nonlinear regression analysis [TimeSeries]. The methodology might be well suited to evaluate specific strategies in a given building such as HVAC set point selection or lighting control. The sensors that are most important for the DR potential evaluation can be found using variable selection approaches, resulting in a potentially smaller set of sensors required for assessment. This method is best suited for existing commercial and industrial buildings that don’t have energy simulation models and for which developing a new model could be time consuming. If successful, the methodology will be incorporated in a software tool that will be made available as a web-‐based service to building energy managers. Optimizing Building DR Building Clusters (Hypothesis D): we use the DR models for a portfolio of buildings to cluster various buildings according to either their state variables or their DR potential estimate to various strategy sets. Energy clustering can be performed as in [DR-‐Clustering] or following hierarchical procedures for time series [TimeSeries]. Once the sets are clustered we can rank the buildings inside each cluster according to their DR potential given the current operational conditions. Buildings can then be actuated according to their cluster and rank. Figure 7 shows a high level diagram of the process.
Massively Parallel, High Performance Computing Techniques: The amount of data generated from building sensors and interval meters in growing rapidly as more and more buildings are deploying advanced metering and building information management (BIM) systems. As an example, the Y2E2 building at Stanford generates approximately 3.5 Mb of data per day. This translates to about 1-‐Gigabytes of data per year. With over 4.5 Million commercial buildings in U.S., the data collected from these sensors and meters can rapidly grow into several terabytes very quickly. Fortunately, the internet world has been dealing with enormous amounts of data to analyze click-‐stream data associated with surfing web-‐sites and many new advances have been made in processing of large scale data sets. We plan to use the latest advances in machine learning, econometrics and processing large scale data using
Figure 7: (Clustering buildings by DR model). The clustering reveals strategy response performance among buildings in a group. Inside each group, the best strategy mix reveals a building with the most potential, due to current operating conditions or scenarios.
8
massively parallel and distributed computing infrastructure such as Map-‐Reduce [Map-‐Reduce] and Hadoop [Hadoop] that have been deployed by internet companies such as Netflix, Google and Amazon to analyze customer behavior and usage data. Application of the methods The proposed methods will be applied in real data obtained from a building. We will use the Y2E2 building in the Stanford campus as the initial test case. This building has a calibrated EnergyPlus model developed by a consultant during the design phase. Sensor data is also continuously collected on various building parameters. We will determine predictions using the three models (A, B and C) above and compare it to field measurements to determine the forecasted DR with the actual DR in certain scenarios. We will also compare the EnergyPlus model estimates with estimates from methods B and C that rely on simpler models supported by sensor data. We will perform building portfolio analysis by comparing the energy usage patterns for multiple buildings on the Stanford campus. We will try to identify and rank buildings with maximum DR potential and the DR strategies most suitable for the buildings using methodologies B and C above, since EnergyPlus models are not available for all buildings. Finally we will check Hypothesis D using time-‐series analysis [TimeSeries] to cluster all the buildings into groups of ‘similar’ buildings and benchmark the energy usage of each building within its cluster. Then, we can identify buildings that are candidates for DR or energy efficiency within a given group. In the next phase of this project, we expect to create a web-‐based software utility where a building portfolio manager can input the data on energy usage directly (or by interfacing with EMS systems within a building) and can then rank the buildings in terms of DR potential and DR performance. We expect that developing this tool will be crucial in driving the adoption of DR at a mass scale and make DR feasible for smaller customers who are currently priced out of the market due to the heavy initial investment of time or resources during the planning phase.
Relationship to CIFE goals
The proposed project contributes to multiple CIFE goals: • Enables a very important driver for sustainability in facility operations, since DR can have a very large impact
on both energy costs and environmental costs.
• Involves research that requires the integration of multiple disciplines such as statistics, data mining, computation, building analysis, and involves multiple stakeholders such as building and facility managers, utilities and smart grid related businesses.
• If successful, the proposed methods can dramatically improve the energy use and management of a facility,
improving its performance and reducing building operation costs as well as the impact in the environment. • Is expected to lead to the development of a web based tool that could be accessible by all CIFE members to
analyze their facilities. If substantial energy efficiency and sustainability goals are to be achieved by buildings in the coming years, a massive deployment of Demand Response will be required, and such deployments require a scalable, easy to implement assessment program.

9
Industry involvement
We have had multiple discussions with industry partners to define the need and goals for the research as well as getting commitments on data access. The industry partners include the entire eco-‐system of the distribution supply-‐chain including utility companies, building owners & managers and Energy Management System providers. Some specific partners who will collaborate with us on the project are: • Stanford Facilities Management: will provide data access for various buildings on Stanford campus and also
potentially try some of the proposed DR strategies.
• Cisco: will provide their building mediator product to access data from EMS systems in selected buildings and their advanced analytics capabilities.
• PG&E and Lawrence Berkeley National Laboratory: will provide access to data from commercial buildings,
including data on building’s participation in Auto-‐DR programs over several years. • Palo Alto Utility: will provide data access in commercial buildings and will also provide access to the rollout of
DR to selected customers in Palo Alto in summer of 2011 and 2012.
Research plan, schedule and risks
There are five measurable milestones in the proposed project: • Milestone 1: Use existing EnergyPlus model for Y2E2 to rank multiple DR strategies applicable to the building
according to their DR potential. Validate Hypothesis-‐A using existing data collected from the building. This part will be completed in the first 4-‐months of the project.
• Milestone 2: Build a demand forecasting model for Y2E2 and determine DR potential based on HVAC control strategies and/or lighting control strategies using time series analysis algorithms. Compare the forecasts with the EnergyPlus forecasts. This validates Hypothesis C. This part will be done concurrently with the work under Milestone-‐1 and will be completed in the first 4-‐months of the project.
• Milestone 3: Change building set points according to one or two simple strategies and record basic data. Use the data to provide more complete validation of Hypothesis A, B and C. This part will be completed in the first 6-‐months of the project
• Milestone 4: Combine the demand forecasting model and a simple multiple time-‐series model that captures the heat flow dynamics. Compare the DR potential forecasts with that obtained in Milestones 1 and 2 above. This milestone may only be partially achieved in our first year of the project. It validates Hypothesis B.
• Milestone 5: Build software tool that can be used to evaluate the DR potential for a building given its general parameters about the building and past energy usage data. The software tool will use time-‐series analysis and clustering techniques to group buildings and identify those with highest potential for DR. We will start the development of this software during the 2nd half of the year, after the completion of Milestones 1, 2 and 3 above, and demonstrate an initial prototype by the end of the first year. We anticipated continuing the development of the software for one more year after the initial prototype is completed.
The most significant risks faced by our proposed approach are • The EnergyPlus model is not well calibrated. This is a risk for Hypothesis A. The risk is mitigated by the fact that
its calibration has been verified at an aggregate level to be within 10 to 15% of the actual loads. • The existing sensors deployed in Y2E2 do not provide sufficient data for accurate estimation because either
different types of sensors are required or they report bad data. This is an important issue for Hypothesis B and C. This risk is somewhat mitigated because a subset of the sensors has been shown to be functional according our group’s experience with this data.
• The techniques we propose work well for Y2E2 but fail to work for other buildings. In other words, they don’t scale well. This risk is mitigated by prior research cited in our reference that seems to suggest builds are similar
10
and somewhat predictable as long as sufficient data is available. This work, even if it is not successful initially, will give us further insight in understanding the important characteristics across different building types that characterize the building model for accurate prediction, and will open avenues for further research.
All findings from the study of the project will be published as a project report and all software developed as part of this project will be made available online as an open-‐source software.
Next steps
As mentioned above, the proposed seed funding will allow us to identify the techniques needed for quick and automated DR potential estimation for a building portfolio. We also plan to develop a software prototype for this purpose and release it under an open-‐source license. We anticipate that the development of the software utility will continue for one more year for which we will have to secure additional funding from the industry. In this phase we will make the software widely available as a web-‐based tool that interfaces with building energy management systems and become part of the ‘continuous commissioning’ process of the building and will incorporate a wider class of buildings and DR strategies. Based on the results of this research, we plan to apply for a more general grant from NSF or DOE to extend the investigation to a broader set of buildings and look at related problems such as: • Incorporate the DR model to build a ‘virtual power plant’ model out of a portfolio of buildings that can be
dispatched just like a generator with characterization of capacity, cost, ramp-‐rates etc. The optimal dispatch policies and the benefit of aggregating additional distributed energy resources such as solar panels, micro wind turbines, and fast start small generators will be investigated along with demand side management techniques in a unified framework.
• Use the simplified building models to perform grid-‐level simulation using GridSpice, an open-‐source power network and electricity market simulator being developed as Stanford Univerisity. Recent studies [ref-‐1,2,3] have shown that the interaction and hidden coupling between DR and distribution automation strategies such as automatic volt-‐var control can reduce the available DR by as much as 30% if the interaction is not properly accounted for. One of the applications of GridSpice is to optimize the overall grid operation by maximally utilizing DR and active demand side management given the constraints imposed by the electrical network of the grid. The model developed as part of this CIFE proposal will be used to develop the load model for the grid for GridSpice simulation.
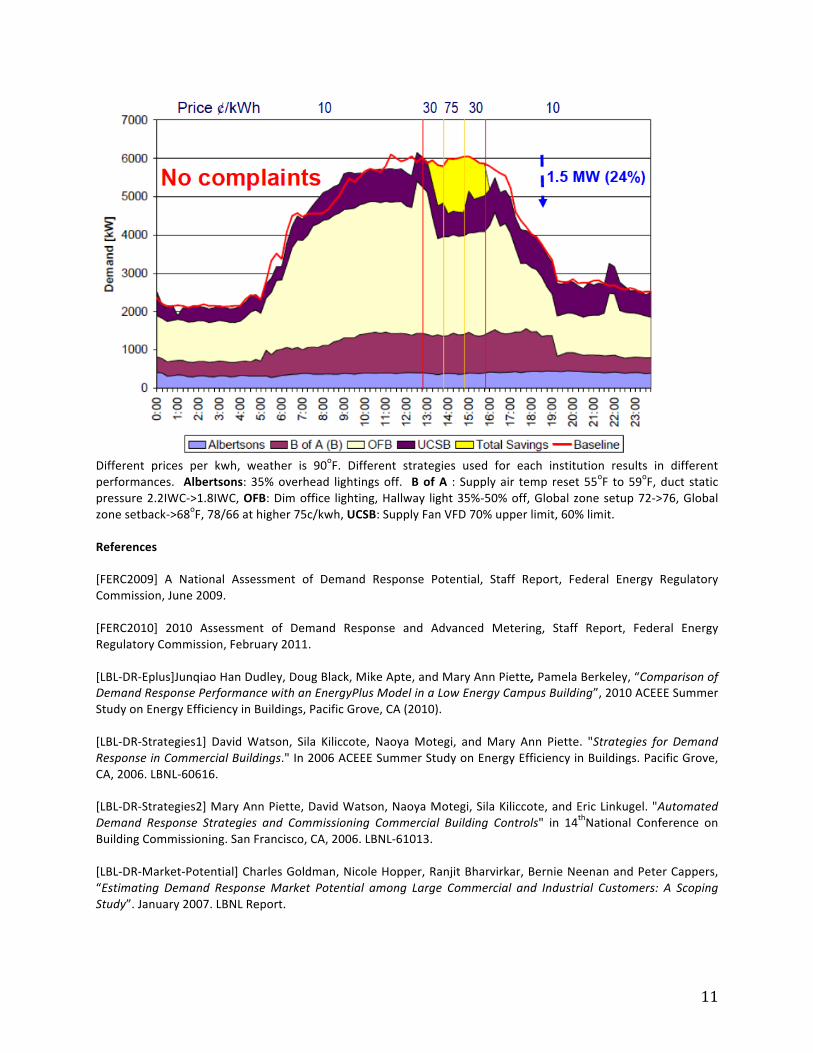
Conclusion Even though DR has become an essential ingredient of modern electricity grid, the adoption levels remain low and most medium and small customers are unable to take full advantage of DR programs due the complexity and cost associated with optimally participating in available DR programs. Our aim is to dramatically simplify the decision making process related to enrollment and provide continuous feedback on participation performance in DR programs by providing a tool that is easy to use for the end customer and leverages the sensor data available from building energy management systems. Figure 8 presents one of the vision scenarios for the proposed research: a dashboard that can inform a facility manager to quickly determine where the best DR choices are concentrated and the DR strategies that result in the maximum DR participation given occupant comfort constraints and that gets continuously updated as more historical data becomes available on the portfolio’s DR participation.
11
Different prices per kwh, weather is 90oF. Different strategies used for each institution results in different performances. Albertsons: 35% overhead lightings off. B of A : Supply air temp reset 55oF to 59oF, duct static pressure 2.2IWC-‐>1.8IWC, OFB: Dim office lighting, Hallway light 35%-‐50% off, Global zone setup 72-‐>76, Global zone setback-‐>68oF, 78/66 at higher 75c/kwh, UCSB: Supply Fan VFD 70% upper limit, 60% limit. References [FERC2009] A National Assessment of Demand Response Potential, Staff Report, Federal Energy Regulatory Commission, June 2009. [FERC2010] 2010 Assessment of Demand Response and Advanced Metering, Staff Report, Federal Energy Regulatory Commission, February 2011. [LBL-‐DR-‐Eplus]Junqiao Han Dudley, Doug Black, Mike Apte, and Mary Ann Piette, Pamela Berkeley, “Comparison of Demand Response Performance with an EnergyPlus Model in a Low Energy Campus Building”, 2010 ACEEE Summer Study on Energy Efficiency in Buildings, Pacific Grove, CA (2010). [LBL-‐DR-‐Strategies1] David Watson, Sila Kiliccote, Naoya Motegi, and Mary Ann Piette. "Strategies for Demand Response in Commercial Buildings." In 2006 ACEEE Summer Study on Energy Efficiency in Buildings. Pacific Grove, CA, 2006. LBNL-‐60616. [LBL-‐DR-‐Strategies2] Mary Ann Piette, David Watson, Naoya Motegi, Sila Kiliccote, and Eric Linkugel. "Automated Demand Response Strategies and Commissioning Commercial Building Controls" in 14thNational Conference on Building Commissioning. San Francisco, CA, 2006. LBNL-‐61013. [LBL-‐DR-‐Market-‐Potential] Charles Goldman, Nicole Hopper, Ranjit Bharvirkar, Bernie Neenan and Peter Cappers, “Estimating Demand Response Market Potential among Large Commercial and Industrial Customers: A Scoping Study”. January 2007. LBNL Report.

12
[LBL-‐DR-‐Field-‐Tests]Junqiao Han, Mary Ann Piette and Sila Kiliccote, “Field Test Results of Automated Demand Response in a Large Office Building”, Proceedings of the 8th International Conference on EcoBalance, Tokyo, Japan, 2008. [CMU-‐DREME] Kathleen Spees and Lester B. Lave. “Demand Response and Electricity Market Efficiency”, The Electricity Journal, Vol. 20, No. 3, pp. 69-‐85, 2007. [LBL-‐DR-‐Coordination] Charles Goldman, Michael Reid, Roger Levy and Alison Silverstein, “Coordination of Energy Efficiency and Demand Response”, LBNL Report, 2010. [DC-‐Load-‐Following] Duncan S. Callaway, “Tapping the energy storage potential in electric loads to deliver load following and regulation, with application to wind energy”, Energy Conversion and Management, No. 50, pp. 1389–1400, 2009. [DR-‐Inverse-‐Model]Kyoung-‐ho Lee and James E. Braun, “Development and Application of an inverse building model for demand response in small commercial buildings”, SimBuild 2004, IBPSA-‐USA National Conference Boulder, CO, 2004. [DR-‐RL-‐Control] S. Liu and G.P. Henze, “Evaluation of Reinforcement Learning for Optimal Control of Building Active and Passive Thermal Storage Inventory”, Journal of Solar Energy Engineering, Vol. 129, No. 215, 2007. [DR-‐Adaptive-‐Control] Kun-‐Yuan Huang, Hong-‐Chan Chin, and Yann-‐Chang Huang, “A Model Reference Adaptive Control Strategy for Interruptible Load Management” IEEE Transactions in Power Systems, Vol. 19, No. 1, 2004. [DR-‐Simple-‐Model] Badri Ramanathan and Vijay Vittal, “A Framework for Evaluation of Advanced Direct Load Control With Minimum Disruption”, IEEE Transactions in Power Systems, Vol. 23, No. 4, 2008. [simple model for a house air conditioner -‐-‐-‐ no model of house! ] [DR-‐Clustering]Wendy Foslien, Valerie Guralnik, Steve Harp and William Koran, “Application of Clustering Techniques to Energy Data to Enhance Analysts’ Productivity”, ACEEE Summer Study on Energy Efficiency in Buildings, 2002. [DR-‐JC]Kelly Smith and Michelle Quibell, “Technology in Commercial Buildings: a Key to Scaling Up Demand Response”, Issue Brief, Institute for Building Efficiency, Johnson Controls, 2010. [DR-‐DRQAT] R. Yin, P. Xu, M.A. Piette and S. Kiliccote, “Study on Auto-‐DR and Pre-‐cooling of Commercial Buildings with Thermal Mass in California”, Energy and Buildings, v. 42, issue 7, pp. 967-‐975. [TimeSeries] James D. Hamilton, Time Series Analysis, Princeton University Press, 1994. [Map-‐Reduce] J. Dean, S. Ghemawat, “MapReduce: simplified data processing on large clusters”, in Communication of ACM, January 2008. [Hadoop] Azza Abouzeid, Kamil Bajda-‐Pawlikowski, Daniel J. Abadi, Alexander Rasin, and Avi Silberschatz. HadoopDB: An architectural hybrid of mapreduce and dbms technologies for analytical workloads. VLDB, 2(1):922–933, 2009.