cindy rountree to cite this version
TRANSCRIPT
HAL Id: cea-01596241https://hal-cea.archives-ouvertes.fr/cea-01596241
Submitted on 27 Sep 2017
HAL is a multi-disciplinary open accessarchive for the deposit and dissemination of sci-entific research documents, whether they are pub-lished or not. The documents may come fromteaching and research institutions in France orabroad, or from public or private research centers.
L’archive ouverte pluridisciplinaire HAL, estdestinée au dépôt et à la diffusion de documentsscientifiques de niveau recherche, publiés ou non,émanant des établissements d’enseignement et derecherche français ou étrangers, des laboratoirespublics ou privés.
Recent progress to understand stress corrosion crackingin sodium borosilicate glasses: linking the chemical
composition to structural, physical and fractureproperties
Cindy Rountree
To cite this version:Cindy Rountree. Recent progress to understand stress corrosion cracking in sodium borosilicateglasses: linking the chemical composition to structural, physical and fracture properties. Journalof Physics D: Applied Physics, IOP Publishing, 2017, 50, pp. 343002. �10.1088/1361-6463/aa7a8b�.�cea-01596241�

Journal of Physics D: Applied Physics
TOPICAL REVIEW
Recent progress to understand stress corrosioncracking in sodium borosilicate glasses: linking thechemical composition to structural, physical andfracture propertiesTo cite this article: Cindy L Rountree 2017 J. Phys. D: Appl. Phys. 50 343002
View the article online for updates and enhancements.
Related contentStress-corrosion mechanisms in silicateglassesMatteo Ciccotti
-
Indentation-based methods to assessfracture toughness for thin coatingsJinju Chen
-
The mechanical and strength properties ofdiamondJ E Field
-
This content was downloaded from IP address 132.166.160.12 on 27/09/2017 at 15:18
1 © 2017 IOP Publishing Ltd Printed in the UK
Journal of Physics D: Applied Physics
C L Rountree
Recent progress to understand stress corrosion cracking in sodium borosilicate glasses: linking the chemical composition to structural, physical and fracture properties
Printed in the UK
343002
JPAPBE
© 2017 IOP Publishing Ltd
50
J. Phys. D: Appl. Phys.
JPD
10.1088/1361-6463/aa7a8b
34
Journal of Physics D: Applied Physics
1. Introduction
Oxide glasses are among the oldest industrial materials known to man, and they are widely used due to their advanta-geous properties: transparency, low thermal expansion, high melting point temperature, relative inertness, etc. Yet, oxide glasses are not without significant shortcomings. In par ticular, they remain inherently brittle, despite significant scientific
ingenuity to overcome this drawback. Moreover, they undergo abrupt catastrophic failure. Frequently, post-mortem failure studies reveal material flaws which were propagating via stress corrosion cracking. Understanding and predicting the growth of such flaws under sub-critical crack propagation remains a hurdle for scientists. Furthermore, how the basic glass network (i.e. the interconnect of the glass structure) dic-tates the physical, mechanical and stress corrosion cracking
Recent progress to understand stress corrosion cracking in sodium borosilicate glasses: linking the chemical composition to structural, physical and fracture properties
Cindy L Rountree
SPEC, CEA, CNRS, Université Paris-Saclay, CEA Saclay 91191 Gif-sur-Yvette, France
E-mail: [email protected]
Received 27 March 2017Accepted for publication 14 June 2017Published 2 August 2017
AbstractThis topical review is dedicated to understanding stress corrosion cracking in oxide glasses and specifically the SiO2 B2O3 Na2O (SBN) ternary glass systems. Many review papers already exist on the topic of stress corrosion cracking in complex oxide glasses or overly simplified glasses (pure silica). These papers look at how systematically controlling environmental factors (pH, temperature...) alter stress corrosion cracking, while maintaining the same type of glass sample. Many questions still exist, including: What sets the environmental limit? What sets the velocity versus stress intensity factor in the slow stress corrosion regime (Region I)? Can researchers optimize these two effects to enhance a glass’ resistance to failure? To help answer these questions, this review takes a different approach. It looks at how systemically controlling the glass’ chemical composition alters the structure and physical properties. These changes are then compared and contrasted to the fracture toughness and the stress corrosion cracking properties. By taking this holistic approach, researchers can begin to understand the controlling factors in stress corrosion cracking and how to optimize glasses via the initial chemical composition.
Keywords: Sodium borosilicate glasses, Microstructure, stress corrosion cracking, physical properties, fracture properties, SiO2 B2O3 Na2O
(Some figures may appear in colour only in the online journal)
Topical Review
IOP
2017
1361-6463
1361-6463/17/343002+34$33.00
https://doi.org/10.1088/1361-6463/aa7a8bJ. Phys. D: Appl. Phys. 50 (2017) 343002 (34pp)

Topical Review
2
properties remains a mystery. This review is a compilation of recent developments in the study of oxide glasses with a con-centration on SiO2 B2O3 Na2O (SBN) glasses, and it looks into the future with suggestions for fruitful areas of research.
Stress corrosion cracking (SCC) concerns the sub-critical growth of a crack front and occurs when environmental corro-sive agents attack the crack front, thus causing it to propagate [1, 2]. Previous literature and reviews [1–12] address stress corrosion cracking of industrial materials, including oxide glasses. These works approach the problem from the macro-scopic scale. Three characteristic regimes of velocity (v) ver-sus the stress intensity factor (K) exist [1, 2]. A potential forth regime exists, but its existence depends on the glass chemical composition [1, 2]. Research works relate key features in v versus K curves to environmental parameters, e.g. temper-ature (T), humidity, and pH. The glasses incorporated in these studies routinely contain four or more oxides. Thus, they are far too complex to identify fundamental structural units and to develop a first principles understanding of stress corrosion induced crack propagation. Additionally, these studies do not systematically alter the chemical composition which makes it all the more difficult to link the glass chemical composition to the physical properties and the complex stress corrosion cracking behaviors.
This review builds on these previous studies by taking a holistic vantage point of stress corrosion cracking in oxide glasses. In other words, it looks at how systematically altering the chemical composition leads to changes in the structural properties. These structural variations cause changes in the physical, fracture and stress corrosion cracking properties. To reach a new understanding of how these properties are linked, this review considers experimental results, molecular dynam-ics (MD) simulations, and glass models on oxide glasses, and specifically, SiO2–B2O3–Na2O glasses.
The balance of this section consists of three sec-tions addressing, in part, the prior art. Section 1.1 presents a brief review of the origin of modern glasses. Section 1.2 pre-sents the mathematical formulation of the fracture mechanics problem. Section 1.3 reviews sub-critical failure of glasses. This discussion includes definitions of key stress regimes and standard equations.
Section 2 concerns structural features of oxide glasses. This section begins with an overview of how the chemical composition of glasses dictates the atomic level structure. Section 2.1 contains a rather broad discussion on oxides roles in glasses—what types of oxides are glass formers; what types of oxides are structure modifiers; and what types of oxides can play both roles. Section 2.2 narrows the scope to ternary glasses consisting of two glass formers, silica (SiO2) and Diboron trioxide (B2O3 also called boron oxide and boron tri-oxide), and one alkali oxide glass modifier and presents the elementary structural units of these systems.
Section 3 reviews current literature devoted to first order mixing approaches for predicting physical properties in oxide glasses such as density, Young, shear and bulk moduli, Poisson’s ratio, glass transition temperature, etc. Section 3.1 compares three bulk density mixing models for SiO2 B2O3 glasses containing alkali oxides modifiers. The discussion
includes a detailed comparison between the experimental data and the mixing model results for a number of these glasses. The last part of the section, section 3.2, concerns specifi-cally SiO2 B2O3 Na2O ternary glasses. Scholarly literature cites first order mixing models for a number of the physical properties: Young’s modulus, shear modulus, bulk modulus, Poisson’s ratio, and glass transition temperature. The material in this section ties back to section 2 and provides a framework for predicting the physical properties of various glasses as a function of the concentration of the elementary units.
Section 4 examines the fracture properties of a rather sim-plistic ternary system, SiO2 B2O3 Na2O. It begins (section 4.1) with a discussion of the fracture toughness of the systems as a function of the chemical composition and strives to estab-lish an understanding of the links between the chemical com-position and the physical properties. Section 4.2 moves on to stress corrosion cracking and examines relationships between the environmental limit, the slope in Region I, the chemical composition, and the physical properties of the glasses. It shows that a parameter coined the degree of polymerization provides a nice functional collapse of the Region I data. The degree of polymerization provides a measure of the glass reticulation.
It is well noted that sections 2, 3 and 4 continually hone in on [SiO2] [B2O3] [Na2O] oxide glasses. This is a natural reduction of the scope of oxide glasses as [SiO2], [B2O3] and [Na2O] are the main components of many industrial glasses. Moreover, these components are used to model the behav-ior of their more complex counterparts (e.g. [13]). The last section provides a wrap up and an outlook to possible future avenues of research.
1.1. Glass history: a brief overview
Glasses are among the oldest industrial materials known to man, and they are widely used to this day. A historical under-standing of technology and chemistry related to advancements of glasses, whether deliberate or accidental, aids in the devel-opment of new ideas for today’s ongoing studies of glasses. Thus, this section briefly reviews the evolution of glass tech-nologies and glass chemistries and points out how certain chemical modifications alter the physical and mechanical properties of the glasses.
In nature, exposing glass formers (e.g. silica) to high temper-atures, e.g. volcanoes (forming Obsidian glass) or lighting strikes, leads to naturally forming glasses. Archaeological dis-coveries reveal that man used Obsidian glass for arrowheads during the Stone Age. Yet, the first man-made glass objects, commonly believed to have occurred by accident, originated in 3500 BCE in Mesopotamia. This discovery yielded beads and decorative glass glazes [14, 15].
Early glass vessels were made by core-formed techniques starting from 1600 BCE in the ancient Near East [14]. Artisans dipped solid cores into molten glass. The glassware was then shaped and decorated to make intricate vessels. After form-ing the glass vessel, the central core was picked out resulting in a hollow vessel. Initially, these glasses were opaque, but in due course, translucent glasses appeared. Controlling these
J. Phys. D: Appl. Phys. 50 (2017) 343002

Topical Review
3
aesthetic properties (i.e. hues, transparency, etc) and work-ability drove the ongoing development of the glass industry.
A major technological breakthrough came with the devel-opment of glass blowing techniques, presumably in Syria around 50 BCE [14, 15]. Craftsmen used long pipes to blow the glass into varying shapes. Initially, the shapes were dic-tated by molds. As craftsmen mastered the trade, they moved on to shaping the glasses via tools. To this day, craftsmen still practice these techniques for fabricating art pieces, artistic tableware, and precision scientific glassware.
Glass artisans of the Roman Empire greatly enhanced the glass technology and industry. More importantly, they spread the techniques throughout Europe and into Asia. Roman glass artisans are credited with the development of color-less, transparent glasses. Opaque and translucent glasses arise from impurities. One of the predominant impurities was Fe2+ which gives a greenish hue to glasses [16, 17]. Craftsmen dis-covered that adding antimony [17] and manganese oxide [16] causes the transformation of Fe2+ into Fe3+ which provides a much lighter yellow hue. It should be further noted that the hue also depends on the valence and coordination number of Mn [16]. Mn+3 results in a purplish hue, and Mn+2 results in a yellowish hue [16, 18]. Antimony and manganese oxide not only alter the hues/colors of the glasses, but they offer other advantages. Antimony aids in removing bubbles [19], and manganese oxide alters the physical properties of the glass (e.g. viscosity [20]).
Other craftsmen found that by carefully selecting their raw materials (i.e. iron free sand and Natron), they were able to achieve higher quality glasses [21]. Furthermore, the addition of Na2O, then and now, enhances the work-ability of glasses by decreasing the glass transition temperature, decreasing the viscosity, etc [22]; but, Na2O in high concentrations has a negative effect, decreasing resistance to fracture [23].
Given the availability of colorless/transparent glasses, architects began to incorporate glasses at an increasing rate in architectural structures (windows, tiles, decorations...) which undoubtedly increased the aesthetics of the buildings [24]. Today, researchers, engineers and craftsmen alter the compo-sition of the glasses to fabricate glasses with precise hues and colors; yet, they do not always optimize physical and mechan-ical properties.
After the fall of the Roman Empire and into the early part of the Middle Ages, very few major glass technological advances occurred. Nonetheless, the use of potash (ashes from beech wood or fern [25, 26]) became common. Historians hypoth-esize that this change came about due to a declining supply of soda (obtained from natron or soda-rich ashes from maritime plants) and/or an increase in the demand for glasses [27, 28]. Replacing raw materials rich in Na2O for raw materials rich in K2O alters the physical and mechanical properties of the glasses. For example, this replacement decreases the coeffi-cient of expansion, increases the viscosity, and increases the glass resistance to water [29].
Towards the middle of the Middle Ages (1100 CE), German craftsmen developed a technique (coined cylindrical/muff glass technique) to make sheet glass (subsequently enhanced by Venetian craftsmen) [28]. They would blow long cylinders of
glass, remove the ends, and cut the cylinders along the length [28, 30]. Afterwards, they would again heat the cylinder, so that it can be unrolled and flatted with blocks of wood to form large sheets. Yet the sizes of the sheets were limited. Surpassing this technique was the crown glass technique. This technique made use of a pipe to blow a hollow glass ball which was pierced and spun to form a glass sheet. This technique utilizes centripetal force to draw the glass into large sheets. The disadvantage to this technique is the central connection point of the glass sheet to the pipe. This point left a flaw in the glass, and although not stated in literature, probably gave way to a failure point.
During this time period, the hues of these glasses remained a disadvantage. In the 15th century, glass makers in Vince-Murano invented cristallo, an usually clear, hard, brilliant glass [15, 31, 32]. The clarity of the glass arose from highly pure components and purification of the potash. This in turn meant that Mn2O was no longer needed as a bleaching agent. Unfortunately, the potash cleansing and purification processes removed calcium, magnesium and alumina which contribute to stabilizing the glasses [32]. Thus, these glasses were less durable than glasses with a hue.
As many of these technological advances were taking place in Italy, George Ravenscroft was commissioned in England to find a glass that matched, or surpassed, the Italian cristallo glass [33]. In 1674, Ravenscroft patented lead crystal glasses. These glasses use lead to increase clarity and to enhance mechanical properties: increase density, increase refractive index, decrease working temperatures, decrease viscosity, etc. It is noteworthy that these glasses were hard enough to with-stand engraving. By the end of the 18th century, glass makers across Europe were routinely incorporating lead in their glass recipes. Today, lead is still used in glasses for fabricating lens; however, its use in glassware has decreased due to issues con-cerning lead poisoning.
In the latter part of the 17th century, Louis Lucas de Nehou enhanced the sheet glass manufacturing process by pouring molten glass onto an iron table and subsequently rolling it out [34]. This technique enabled glass makers to fabricate large sheets of glass rather than the small sheets formed from blow-ing glass. In the context of the industrial revolution, Henry Bessemer advanced the fabrication of sheet glass by using two rollers to form a continuous ribbon of glass [35]. Around the turn of the 20th century, Michael Owens filed a series of pat-ents, which ultimately enabled him to automatically produce glass bottles [36–40].
Today, glass usages extend well beyond common house hold materials (windows, vases, cookware, drinking glasses, etc) to include heat resistant technologies, protection pan-els (smart phones, plasma screens, solar panels, etc), lens for satellites in outer space, etc. Despite these far reaching uses, glasses still fail abruptly. Frequently, post-mortem fail-ure studies reveal material flaws which were propagating via stress corrosion cracking. Understanding and predicting the growth of such flaws under sub-critical stress conditions remains a hurdle for scientists. Furthermore, how the basic glass network (i.e. the interconnect of the glass structure) dic-tates the physical, mechanical and stress corrosion cracking properties remains a mystery.
J. Phys. D: Appl. Phys. 50 (2017) 343002

Topical Review
4
1.2. Fracture of materials: in the absence of a corrosive environment
In the early 1900s, Inglis [42] studied fracture in an infinite plate under stress (where σ is the stress applied at infinity) with a penny shaped hole (figure 1) in the plate. He showed that the stresses, σA, concentrate at point A, as shown in figure 1. The stress, σA, is given by:
σA = σ
(1 +
2ab
)= σ
(1 + 2
√aρ
) (1)
where a and b correspond, respectively, to the lengths of the
semi-major and semi-minor axes of the hole; and ρ = b2
a is the radius of curvature at the tip of the elliptical shaped hole. Allowing a � b, equation (1) may be rewritten as follows:
σA ∼ 2σ√
aρ
. (2)
Inglis equation is problematic when the crack tip becomes infinitely sharp (i.e. very long and thin). Griffith [44, 45] took this into consideration and considered the onset of crack propagation from an energy balance viewpoint. He believed that the work done to extend the crack must equal the energy needed to create the two fracture surfaces. Applying this theory to Inglis’ configuration shown in figure 1, in the limit where b → 0, the stress, σf , required for crack propagation is given by [41, 45]:
σf =
√2γE′
πa (3)
where γ is the surface energy and a is the length of the crack; and E′ is a geometry dependent reduced modulus. If the crack front is in plane stress (thin plates), then [41, 45]:
E′ = E (4)
where E is the Young’s modulus. On the other hand, if the crack front is in plane strain (thick plates), then [41, 45]:
E′ =E
1 − ν2 (5)
where E is again the Young’s modulus and ν is the Poisson’s ratio. Griffith’s formulation provides a more favorable esti-mate of the fracture stress; however, it leaves out dissipative energies such as heat.
In the mid 20th century, Irwin [46–48] considered the prob-lem from the viewpoint of an incremental increase in the crack length, a → a + δa. In this context, he proposed the mechan-ical-energy-release rate, G, which is the energy released when the crack front extends by δa [46]. For an infinite plane with a crack of length 2a, the mechanical-energy-release rate is:
G =πσ2a
E. (6)
The point at which the crack begins to propagate corresponds to G = Gc, where Gc is the critical energy release rate:
Gc =πσf
2aE
. (7)
Normally, Gc is considered a material property.For simple geometries, calculating the stress field around a
notch in a linear elastic material is feasible [46, 49–51]. The stress field ahead of a crack tip (figure 2, [10, 43]) is:
σaij(r, θ) =
Ka√2πr
f aij (θ) + O(1) (8)
where σaij corresponds to the stress field components shown
in figure 2; θ and r correspond to polar coordinates and are defined in figure 2; Ka corresponds to the stress intensity fac-tor; f a
ij depends on the geometry; O(1) corresponds to higher order terms; and a denotes the mode of fracture.
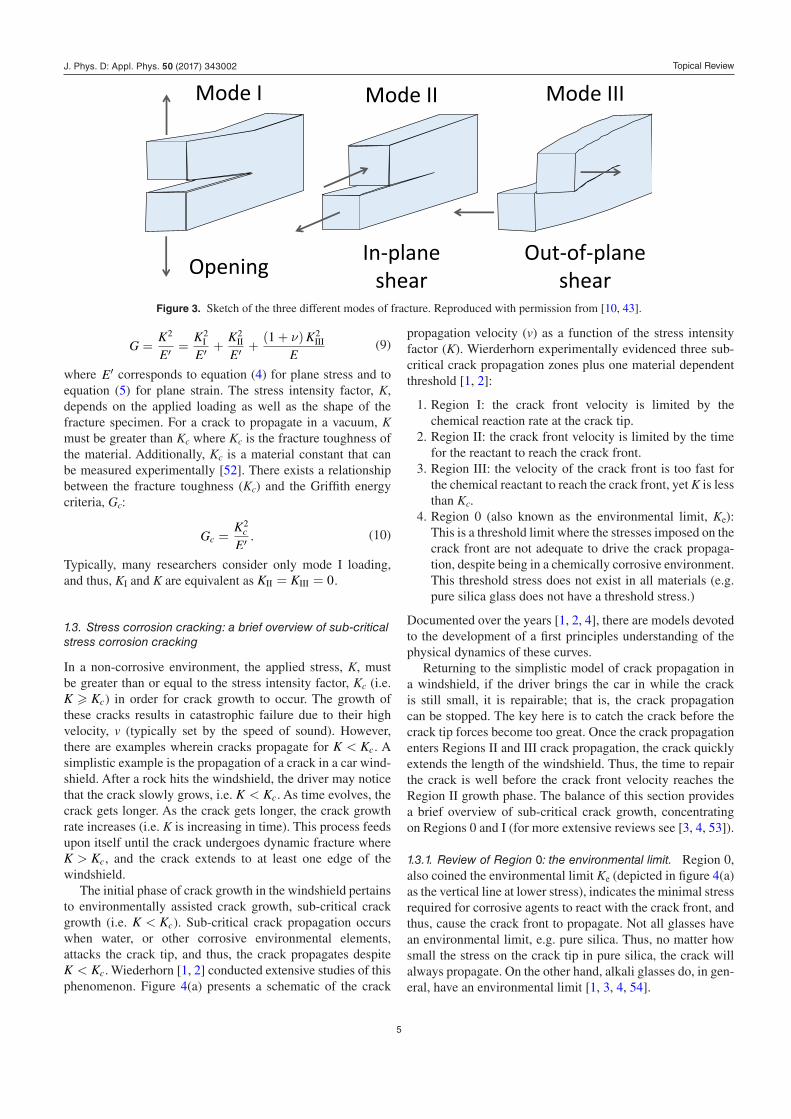
There are three modes of fracture (figure 3): opening mode (Mode I), in-plane shear mode (Mode II), and out-of-plane shear mode (Mode III). For mixed mode loading, the mechan-ical-energy-release rate is additive, thus [41]:
Figure 1. Sketch of Inglis’s plate under stress (σ) with an elliptical hole in it (recreated from [41]; for more details see [41–43]). The parameters a and b represent the length of the semi-major and semi-minor axis of the hole. Stresses concentrate at the vertices of the semi-major axis (i.e. points A in the figure). The radius of curvature at A is ρA.
Figure 2. Sketch of the stress field around a crack tip in polar coordinates—r is the distance from the crack tip and θ is the polar angle. The variables σij and τij represent the normal and shear components of the stress, respectively. Reproduced with permission from [10, 43].
J. Phys. D: Appl. Phys. 50 (2017) 343002
Topical Review
5
G =K2
E′ =K2
I
E′ +K2
II
E′ +(1 + ν)K2
III
E (9)
where E′ corresponds to equation (4) for plane stress and to equation (5) for plane strain. The stress intensity factor, K, depends on the applied loading as well as the shape of the fracture specimen. For a crack to propagate in a vacuum, K must be greater than Kc where Kc is the fracture toughness of the material. Additionally, Kc is a material constant that can be measured experimentally [52]. There exists a relationship between the fracture toughness (Kc) and the Griffith energy criteria, Gc:
Gc =K2
c
E′ . (10)
Typically, many researchers consider only mode I loading, and thus, KI and K are equivalent as KII = KIII = 0.
1.3. Stress corrosion cracking: a brief overview of sub-critical stress corrosion cracking
In a non-corrosive environment, the applied stress, K, must be greater than or equal to the stress intensity factor, Kc (i.e. K � Kc) in order for crack growth to occur. The growth of these cracks results in catastrophic failure due to their high velocity, v (typically set by the speed of sound). However, there are examples wherein cracks propagate for K < Kc. A simplistic example is the propagation of a crack in a car wind-shield. After a rock hits the windshield, the driver may notice that the crack slowly grows, i.e. K < Kc. As time evolves, the crack gets longer. As the crack gets longer, the crack growth rate increases (i.e. K is increasing in time). This process feeds upon itself until the crack undergoes dynamic fracture where K > Kc, and the crack extends to at least one edge of the windshield.
The initial phase of crack growth in the windshield pertains to environmentally assisted crack growth, sub-critical crack growth (i.e. K < Kc). Sub-critical crack propagation occurs when water, or other corrosive environmental elements, attacks the crack tip, and thus, the crack propagates despite K < Kc. Wiederhorn [1, 2] conducted extensive studies of this phenomenon. Figure 4(a) presents a schematic of the crack
propagation velocity (v) as a function of the stress intensity factor (K). Wierderhorn experimentally evidenced three sub-critical crack propagation zones plus one material dependent threshold [1, 2]:
1. Region I: the crack front velocity is limited by the chemical reaction rate at the crack tip.
2. Region II: the crack front velocity is limited by the time for the reactant to reach the crack front.
3. Region III: the velocity of the crack front is too fast for the chemical reactant to reach the crack front, yet K is less than Kc.
4. Region 0 (also known as the environmental limit, Ke): This is a threshold limit where the stresses imposed on the crack front are not adequate to drive the crack propaga-tion, despite being in a chemically corrosive environment. This threshold stress does not exist in all materials (e.g. pure silica glass does not have a threshold stress.)
Documented over the years [1, 2, 4], there are models devoted to the development of a first principles understanding of the physical dynamics of these curves.
Returning to the simplistic model of crack propagation in a windshield, if the driver brings the car in while the crack is still small, it is repairable; that is, the crack propagation can be stopped. The key here is to catch the crack before the crack tip forces become too great. Once the crack propagation enters Regions II and III crack propagation, the crack quickly extends the length of the windshield. Thus, the time to repair the crack is well before the crack front velocity reaches the Region II growth phase. The balance of this section provides a brief overview of sub-critical crack growth, concentrating on Regions 0 and I (for more extensive reviews see [3, 4, 53]).
1.3.1. Review of Region 0: the environmental limit. Region 0, also coined the environmental limit Ke (depicted in figure 4(a) as the vertical line at lower stress), indicates the minimal stress required for corrosive agents to react with the crack front, and thus, cause the crack front to propagate. Not all glasses have an environmental limit, e.g. pure silica. Thus, no matter how small the stress on the crack tip in pure silica, the crack will always propagate. On the other hand, alkali glasses do, in gen-eral, have an environmental limit [1, 3, 4, 54].
Figure 3. Sketch of the three different modes of fracture. Reproduced with permission from [10, 43].
J. Phys. D: Appl. Phys. 50 (2017) 343002

Topical Review
6
Lawn [41] links the delayed onset of crack propagation to a shielding zone which encompasses the crack tip. The shield-ing zone dissipates energy around the crack tip. Thus, the effective stress intensity factor at the crack tip is:
Kl = Kg + Ksz (11)
where Kl is the stress intensity factor in the local region around the crack tip, i.e. enclave zone; Kg is the global (or continuum) stress intensity factor; and Ksz is the shielding contributions (figure 5). Thus, the physical properties of the glass and the crack front within this shielding zone (or process zone, PZ) dictate the glass response to an external stress.
The environmental limit, Ke, is known to depend on the glass chemical composition [1, 3, 4, 54]. There are several mechanisms proposed in literature to explain variations in Ke:
1. Stresses at the crack tip cause enhanced diffusion of alkali atoms. Thus, the energy necessary for alkali atoms to migrate out of the PZ reduces the overall energy provided to the crack tip. This energy sink aids in delaying the onset of crack propagation, thus giving rise to a critical environmental stress intensity factor [1, 2, 54].
2. Hydronium-Na+ exchange causes a compression in the PZ due to the larger size of the hydronium ions [54–56].
3. Blunting of the crack tip [54]. 4. Variations in the pH at the crack tip [54, 57–59]
For nearly 50 years, scientists have debated the fundamen-tal mechanisms leading to Ke, yet conclusive first principle explanations remain elusive. Frequently, they choose one or two of the explanations above and ignore the underline struc-ture of the glass. It is also noteworthy that many experimental tests, until recently, did not systematically alter the chemical
composition. Rather, studies used complex oxide glasses (or overly simplified glasses, e.g. pure silica) to study these effects. Thus, effects due to the glass structure were difficult to qualify and quantify, and trends were less than conclusive. A concerted study of simple ternary glasses as a function of chemical composition will facilitate the development of our understanding and ultimately lead to better glass products. This review, in conjunction with Barlet et al works [23, 60–66], represents a step in this direction.
>
II
<
log
(a)
KI (MPa.m1/2)0.2 0.3 0.4 0.5 0.6
v(m
/s)
10-12
10-10
10-8
10-6
10-4
Silica
Alumiosilicate
Borosilicate
Soda-Lime
(b)
Figure 4. (a) The schematic depicts the three regions of sub-critical cracking (indicated by Roman numerals) associated with stress corrosion cracking (recreated from [1, 2, 4]). KI is the stress intensity factor in mode I fracture, in this figure and all subsequent figures. The velocity of the crack front is denoted by v. Some materials exhibit a threshold environmental limit, frequently denoted by Ke and coined Region 0 or the environmental limit, where the stress at the crack tip is not sufficient for water to react with crack front, thus the crack tip does not propagate. (b) Wiederhorn’s stress corrosion cracking curves in Regions 0 and I for soda-lime (red circles), alumino-silicate (blue triangles), borosilicate (green squares), and silica (purple stars) glasses (recreated from [1]). Fracture experiments occurred in distilled water at constant temperature, 25 ◦C.
Figure 5. Sketch of the K-field felt by the crack tip (recreated from [41]). Kl represents the stress intensity factor in the local region around the crack tip, or the enclave. Kg represents the global (or continuum) stress intensity factor.
J. Phys. D: Appl. Phys. 50 (2017) 343002
Topical Review
7
1.3.2. Review of Region I. In Region I, the velocity of the crack front is an increasing function of the stress intensity factor (figure 4(a)). The slope in this region depends on several factors including the chemical composition of the glass. Researchers say the sample is more susceptible to stress corrosion crack-ing for higher slopes [67]. Wiederhorn suggests, in Region I, that the velocity of the crack front depends on the time for the chemical reaction to occur at the crack tip [1, 2, 4]. Moreover, his exponential fit for Region I, derived from the reaction-rate theory, is a common fit used throughout literature [1, 2, 4]:
v = A ∗(
pH2O
po
)m
∗ exp ((−∆Ea + bKI) /RT) (12)
where A, ∆Ea, m and b are empirical parameters; T is the temper ature of the environment; R is the ideal gas constant; and pH2O and po are the partial pressure of the vapor phase in the atmosphere and the total atmospheric pressure, respec-tively. It should be noted that, ∆Ea is also considered the acti-vation energy of the reaction. Wiederhorn links the slope, b, to variations in the crack tip activation volume (∆V∗) and the crack tip radius of curvature (ρct) [1, 3, 57, 68, 69]:
b =2∆V∗√πρct
. (13)
Some authors attribute the activation volume (∆V∗) to a differ ential change in the volume from the initial to the acti-vated state [68, 70]. On the other hand, Freiman et al [3] conjunctures:
∆V∗ = Naπ(r2
A + r2B
) δl2
(14)
where rA and rB are the radii of atoms A and B which undergo a bond elongation of δl, and Na is Avogadro’s number. The combination of equations (13) and (14) gives:
b =Naπ
(r2
A + r2B
)δl
√πρct
. (15)
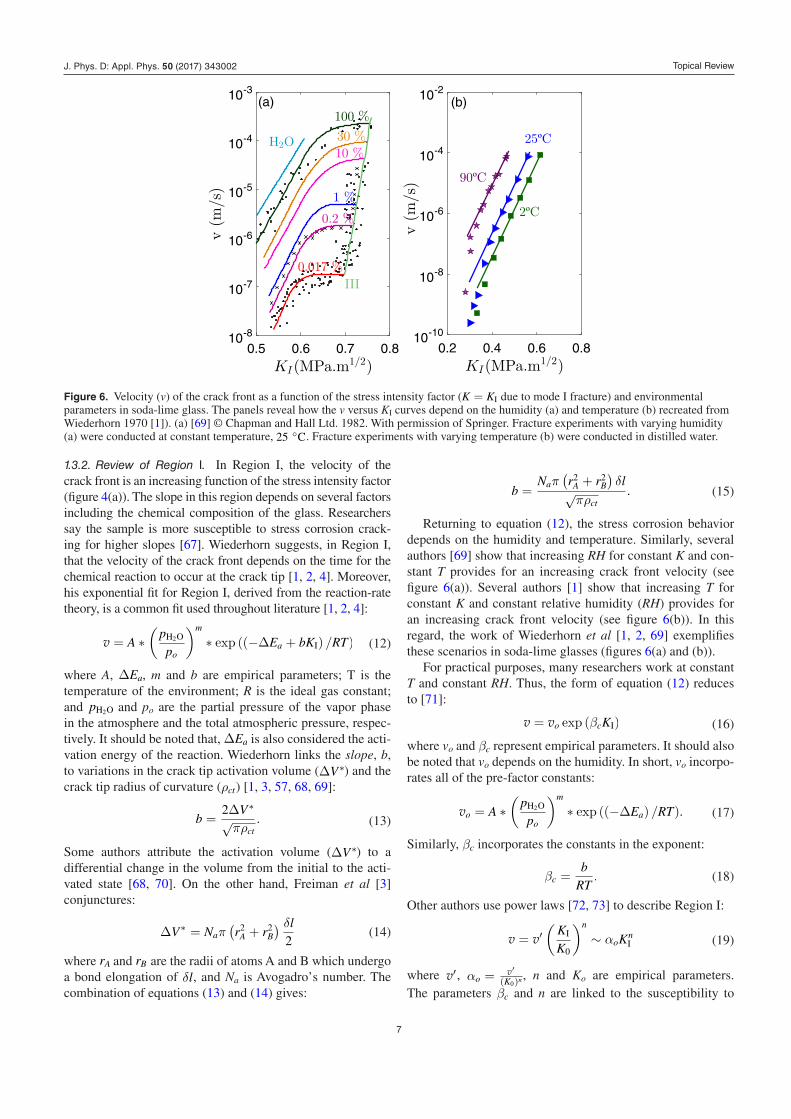
Returning to equation (12), the stress corrosion behavior depends on the humidity and temperature. Similarly, several authors [69] show that increasing RH for constant K and con-stant T provides for an increasing crack front velocity (see figure 6(a)). Several authors [1] show that increasing T for constant K and constant relative humidity (RH) provides for an increasing crack front velocity (see figure 6(b)). In this regard, the work of Wiederhorn et al [1, 2, 69] exemplifies these scenarios in soda-lime glasses (figures 6(a) and (b)).
For practical purposes, many researchers work at constant T and constant RH. Thus, the form of equation (12) reduces to [71]:
v = vo exp (βcKI) (16)
where vo and βc represent empirical parameters. It should also be noted that vo depends on the humidity. In short, vo incorpo-rates all of the pre-factor constants:
vo = A ∗(
pH2O
po
)m
∗ exp ((−∆Ea) /RT). (17)
Similarly, βc incorporates the constants in the exponent:
βc =b
RT. (18)
Other authors use power laws [72, 73] to describe Region I:
v = v′(
KI
K0
)n
∼ αoKnI (19)
where v′, αo = v′(K0)n , n and Ko are empirical parameters.
The parameters βc and n are linked to the susceptibility to
KI(MPa.m1/2)0.5 0.6 0.7 0.8
v(m
/s)
10-8
10-7
10-6
10-5
10-4
10-3
100 %
0.017 %
0.2 %
1 %
10 %30 %H2O
III
KI(MPa.m1/2)0.2 0.4 0.6 0.8
v(m
/s)
10-10
10-8
10-6
10-4
10-2
25ºC
2ºC
90ºC
(a) (b)
Figure 6. Velocity (v) of the crack front as a function of the stress intensity factor (K = KI due to mode I fracture) and environmental parameters in soda-lime glass. The panels reveal how the v versus KI curves depend on the humidity (a) and temperature (b) recreated from Wiederhorn 1970 [1]). (a) [69] © Chapman and Hall Ltd. 1982. With permission of Springer. Fracture experiments with varying humidity (a) were conducted at constant temperature, 25 ◦C. Fracture experiments with varying temperature (b) were conducted in distilled water.
J. Phys. D: Appl. Phys. 50 (2017) 343002

Topical Review
8
stress corrosion cracking. Atkinson et al [67] provides a bit of insight into the meaning of n:
• n = 2–10 implies diffusion controlled crack growth. • n = 20–50 implies stress corrosion controlled crack
growth.
Mould [74–76] theorizes methods for crack propagation via a rate-limiting step at the crack tip. In glasses, this is simply the hydration of the reactant, water, with the stretched Si O Si bond at the crack tip. It is commonly agreed that the glass chemical composition alters the v versus K curve, yet there is much that remains a mystery. For years, researchers have routinely studied overly complicated glasses, or pure silica (figure 4(b)), and they have neglected the study of, for exam-ple, ternary glasses with a focus on systematically altering the glass chemistry. Thus, the concepts presented by Mould [74, 75] continue to prevail as models for stress corrosion cracking of glasses. While the prevailing models/theories have merit, they fail to address functional dependencies that are undoubtedly critical to our understanding of industrial glasses.
1.3.3. Review of Region II. Region II corresponds to the stress regime where the velocity of the crack front is virtu-ally independent of the stress applied at the crack tip. In other words, incremental increases in the stress intensity factor do not result in incremental increases in the velocity. However, it does depend on the amount of water in the atmosphere [2, 4]. Increasing the amount of water in the atmosphere causes the velocity to increase. Thus, the velocity depends on the time for water to reach the crack front. Based on the work by Atkin-son et al [67], Region II crack growth can be characterized by an n (in equation (19)) between 2 and 10 [67]. The level of the plateau in Region II is a function of the amount of water in the system:
v = vopH2ODH2O (20)
where DH_2O corresponds to the diffusion coefficient of water molecules in air [2, 4].
1.3.4. Review of Region III. In Region III, the crack front moves too fast for water to reach the crack front. Thus, Wiederhorn evidenced an overlay of the velocity versus stress intensity factor for humidities ranging from 0.017 to 100% [2, 69]. However, the crack growth in this region does depend on the environmental conditions (i.e. dielectric constants) as evidenced in literature [75, 77].
It is noteworthy, the challenge for engineers and scientists is preventing stress corrosion cracking. This implies that the stress intensity factor at the crack front must be less than the environmental limit. In the case that a crack front develops and begins to propagate, the challenge evolves to intervening in an effort to avoid catastrophic failure. The intervention needs to occur before the crack propagation enters into Region II and III failure, which frequently leads to dynamic fracture.
2. The structure of oxide glasses
Oxide glasses, by definition, have no long-range order (i.e. atoms in the material lack translational and/or rotational symmetry) as opposed to crystalline counterparts. Figure 7 displays a sectional view from a 3D molecular dynamics sim-ulation of a pure amorphous silica system [43, 78–83]. In the context of the short range structural order, one silicon atom resides in the center of the tetrahedron structure with four oxygen atoms located at the corners of the tetrahedron. The bond length between the silicon and oxygen atoms is approxi-mately 1.61 ± 0.05 Å (see figure 8(a)). Figures 8(b) and (c) display the Si Si and O O bond lengths. The O Si O angle corresponds to an angle in a tetrahedron, and the distribution is sharply peaked around 109◦ (see figure 9; red line). The Si O Si angle corresponds to the interlink angle between the SiO4 tetrahedral structures, and the distribution is broadly peaked around 146◦ (see figure 9; blue line).
The SiO4 tetrahedra are connected to one another and pre-dominantly form rings composed of six silicon atoms and six oxygen atoms. These rings correspond to the mid-range order of SiO2 glasses. A ring is the shortest path connecting a Si atom
Figure 7. A sectional view of a 3D molecular dynamics simulation which shows a typical amorphous silica (SiO2) system. Blue spheres represent Si atoms, and red spheres represent O atoms.
J. Phys. D: Appl. Phys. 50 (2017) 343002

Topical Review
9
back to itself via Si O bonds [81, 84, 85]. The nomenclature for the ring size depends on the number of Si atoms in the ring. An n-member ring has n Si atoms and one O atom between each of the Si atoms (for a total of n O atoms in the ring). For example, a 3-member ring has three Si atoms with one O atom between each of the Si atoms, for a total of three O atoms in the ring. Figure 10 displays a histogram of the ring distribu-tion in pure amorphous silica as found by MD simulations. The distribution in the figure ranges from 3-member rings to 9-member rings; however, larger rings are possible [81, 84, 85]. The distribution (figure 10) peaks at 6-member rings with a fractional contribution greater than 30%.
Pure amorphous silica glass is one of the simplest glasses; yet, industrial glasses invariably include more than four dif-ferent oxides with silica being the dominant oxide comp-onent. The additional oxides provide desirable changes to the physical properties of the resulting glasses, for example,
lower refractive index, lower dispersion, increased heat shock resistance, lower melting point temperatures, enhanced work-ability, decrease in the coefficient of thermal expansion, etc. Schott’s BK7 Borosilicate glass is a common glass used in optics and contains an assortment oxides: predominant comp-onents include SiO2, B2O3, K2O, Na2O and BaO, as well as minor components including Sb2O3, CaO, TiO2 , and ZnO2. Another major industrial glass is Corning 7740 Pyrex which is used in manufacturing laboratory glassware and kitchenware. It consists of SiO2, B2O3, and Na2O with minor amounts of Al2O3, CaO, Cl, MgO and Fe2O3.
2.1. Basic chemical composition of oxide glasses
Components of oxide glasses fall into one of three categories: (1) glass formers, (2) glass modifiers, and (3) glass intermediates (or conditional glass formers). Glass formers correspond to oxides that naturally form an amorphous structure. Zachariasen [86] in 1932 laid the groundwork for scientists to understand vitreous
Bond length (nm)0.2 0.4 0.6
Inte
nsity
(c)
Si-Si
Bond length (nm)0.2 0.4 0.6
Inte
nsity
(a)Si-O
Bond length (nm)0.2 0.4 0.6
Inte
nsity
(b)
O-O
Figure 8. Pair distribution function as a function of bond length. Figures in panels correspond to the distribution of: (a) Si–O bond length, (b) O–O bond length, and (c) Si–Si bond length. Bond lengths are based on molecular dynamics simulations of pure-amorphous silica with ∼5000 atoms in the system (for simulation details see [43, 78–81]). Simulations invoke the Vashishta et al potential [82, 83].
Angle (°)60 80 100 120 140 160 180
Inte
nsity
0
0.2
0.4
0.6
0.8
1
1.2
O-Si-O angle
Si-O-Si angle
Figure 9. Distribution of bond angles. The red line centered around 109◦ represents the distribution of O–Si–O bond angles within the silica tetrahedra. The blue line centered around 146◦ represents distribution of the Si–O–Si bond angles or the angle between tetrahedra. Bond angles extracted from molecular dynamics simulations of pure-amorphous silica (for details of simulations see [43, 78–81]) with ∼5000 atoms in the system using Vashishta et al potential [82, 83].
Ring size (n)3 4 5 6 7 8 9
Pre
cent
age
(%)
0
5
10
15
20
25
30
35
Figure 10. Distribution of rings as per molecular dynamics simulations of pure-amorphous silica [43, 78–81] with ∼5000 atoms. Simulations invoke the Vashishta et al potential [82, 83]. The independent variable, n, concerns the ring size. An n-member ring has n Si atoms and one O atom between each of the Si atoms (for a total of n Oxygen atoms in the ring).
J. Phys. D: Appl. Phys. 50 (2017) 343002

Topical Review
10
materials. He supplied the glass community with four simple rules to forming a glass. Let AmOn, where A is the cation, cor-respond to the oxide of choice; then ideally AmOn should meet the following conditions to form an amorphous media [86]:
• each O atom must be connected to at most two A atoms. • A atoms must not have an excess of O atoms surrounding
it (typically three or four). • the O atoms should be corner sharing and not edge nor
face sharing • in three dimensions, at least three O atoms corners should
be shared.
Zachariasen [86] listed five amorphous oxides in 1932 as already fabricated: silica (SiO2), boron trioxide (B2O3), ger-mania (GeO2), phosphorus trioxide (P2O3) and amorphous arsenious oxide (As2O3). Since Zachariasen’s time, additional glasses have been successfully fabricated: Sb2O3, In2O3, Tl2O3, SnO2 , PbO2 , SeO2, etc. It should be noted that Zachariasen predicted the existence of Sb2O3 glasses; however, at the time, the glass had not been successfully fabricated [87]. Sun [88] enhanced our understanding of glass formers with his bond strength studies. He found that all of the glass formers have bond strengths greater than 80 kcal per Avogadro bond. These oxides naturally form amorphous medias upon ‘rapid’ quenching of their liquid states. In general, glass formers typ-ically have a 3D network of covalent bonds and are acidic (e.g. silica is weakly acidic) [89].
In comparison, glass modifiers cannot form an amorphous structure [88]. As the name implies, they modify the glass structure. Frequently, but not exclusively, the addition of a glass modifier to a glass former causes non-bridging oxygen (NBO) atoms in the glass structure with an ion in the vicinity of the NBO for charge neutrality. A simple example is a binary SiO2 Na2O system (see figure 11). For each Na2O molecule added to a pure silica system, two NBO atoms are formed on the silica tetrahedra.
Adding glass modifiers to the glass formers alters the mat-erial properties of the formers. For example, adding sodium (Na2O) to silica decreases the glass transition temperature, decreases the viscosity, etc. Yet, there are less desirable side effects; sodium reduces the glass chemical resistance. Beyond sodium oxide, common glass modifiers include [88] potas-sium oxide (K2O), calcium oxide (or quicklime; CaO), stron-tium oxide (or strontia; SrO), and barium oxide (BaO). In general, glass modifiers have low bond strengths [88], typi-cally <60 kcal per Avogadro bond. Glass modifiers are typi-cally characterized by ionic bonds and are basic [89].
The last major group of oxides is the glass intermediates (or conditional glass formers). These oxides do not inherently form an amorphous structure. However, in some instances when they are added to a glass former, they aid in forming the glass network. In other instances, they can act as glass modifiers. One of the major, conditional glass formers is alu-minium oxide (Al2O3). Adding small amounts of Al2O3 to a binary SiO2 Na2O glass causes: (1) Al atoms to replace the Si atoms (i.e. the Al structure in the glass is a tetrahedron with a negative charge) in the glass network with a Na+ ion in the vicinity for charge compensation and (2) a reduction in the number of NBO atoms (each Al atom removes one NBO atom). Thus, the connectivity (or reticulation) of the glass increases. Additionally, the Al2O3 forms covalent bonds in the glass network. Once the mole concentration of Al2O3
exceeds the mole concentration of Na2O, [Al2O3][Na2O] > 1, then the
Al atoms can be 4-, 5- or 6- coordinated [90]. (Note 6-coordi-nated Al corresponds to Al in a neutral site [90].) In this case, the Al2O3 forms ionic bonds in the glass network. Other com-mon oxides in the category of glass intermediates include [88] beryllium oxide (or beryllia; BeO), zinc oxide (ZnO), cad-mium oxide (CdO), lead oxide (or monoxide; PbO), and tita-nium dioxide (or titania; TiO2). Glass intermediates typically have an intermediate bond strengths [88], ranging between 60 and 80 kcal per Avogadro bond. They form covalent or ionic bonding, and they are amphoteric.
Routinely oxide glasses are composed of numerous form-ers, modifiers and intermediates. The number of oxides fre-quently exceeds four, and for extremely complex glasses such at R7T7 (used to encapsulate nuclear byproducts), they contain as many as 30 different oxides [91]. Modeling and predicting material properties in these complex glasses is impossible without basic knowledge of the primary oxides. Scientist and engineers use model systems to understand the key components of the more complex glasses [92–94]. Many model systems contain three oxides [60, 95–102], two formers and one modifier. In this spirit, the balance of this review is devoted to ternary glass systems.
2.2. Basic structural units in [SiO2]–[B2O3]–[M2O] ternary systems and their fractional concentrations
Industrial glasses frequently contain four to seven (or more) oxides. But, scientists will simplify these systems to model glasses containing the three main components: SiO2, B2O3 and an alkali or alkaline earth metals oxides. Literature details a variety of models for binary and ternary glasses containing
Oxygen
Na+ ion
Silica+
Silica glass Na2O SiO2-Na2O glass
Figure 11. Sketch of what happens when the glass modifier Na2O is added to a pure amorphous silica system. Initially, all the silica tetrahedra are connected and only bridging oxygen atoms exist (represented by the silica glass). To this, one Na2O molecule is added. The resulting glass has two non-bridging oxygen (NBO) atoms on the silica therahedra which are no longer connected, and the Na+ ion in the vicinity is for charge compensation (represented by the SiO2 Na2O glass).
J. Phys. D: Appl. Phys. 50 (2017) 343002

Topical Review
11
alkali and alkaline earth metal oxides [60, 95–97, 99–102]. For ternary systems containing alkali metal oxides (Li2O, Na2O or K2O), similar elementary units exist. Thus, Feil et al [101] and Budhwani et al [100] generalized the description of these ternary systems as follows:
KSBM[SiO2]− [B2O3]− RSBM[M2O] (21)
where [·] denotes the mole percent, M denotes the alkali metal (Li, Na or K), KSBM is the ratio of [SiO2] to [B2O3]:
KSBM =[SiO2]
[B2O3], (22)
and RSBM is the ratio of [M2O] to [B2O3]:
RSBM =[M2O]
[B2O3]. (23)
Table 1 provides a list of symbols used to represent elemen-tary units in the text henceforth. Table 2 summarizes the equa-tions to calculate the fractions of elementary units in these ternary systems based on KSBM and RSBM values.
Considering the binary KSBM[SiO2] [B2O3] system, the borate and silicate networks have a tendency to demix. Figure 12 provides sketches of elementary units (f1, f2, f3, f4, Q0, Q1, Q2, Q3, and Q4), and table 1 summarizes the elemen-tary units. As in the pure silica system, the elementary silicate unites are tetrahedra with a Si atom in the center and four bridging oxygen atoms on the corners. Q4 denotes the frac-tion of these units. The elementary borate units are triangu-lar BO2/3 planar elements (denoted as [3]B) with a B atom in the center and three bridging oxygen atoms at the corners. The nomenclature f1 denotes the fraction of [3]B units with all bridging oxygen atoms.
Adding M2O to the binary KSBM[SiO2] [B2O3] system causes various other units to be created and subsequently destroyed based on the amount of M2O in the ternary system. The concentration regimes are [60, 95, 97, 101, 103, 104]:
RSBM < Rmax = 0.5+ 0.0625 ∗KSBM Low concentra-tions of M2O added to the binary system causes the [3]B
units to transform into [4]B units (BO4/2 tetrahedra units: A boron atom resides in the center of the tetrahedron sur-rounded by four bridging oxygen atoms with a M+ ion in the vicinity for charge compensation). Theoretically, all oxygen atoms are bridging. The nomenclature f2 denotes the fraction of [4]B units in the glass (see tables 1 and 2). For RSBM � 0.5, the silica network remains unaltered (i.e. Q4 = 1), and the two networks remain theoretically demixed. However, for 0.5 < RSBM < Rmax, the glass network begins to mix, forming reedmergnerite units with one four-coordinated boron bonded to four silica tetrahedra [95]. This stage does not lead to NBO atoms. The role of the alkali metal oxide would be a network compensator in this case, as theoretically all oxygen atoms are bridging.
Rmax < RSBM < Rd1 = 0.5+ 0.25 ∗KSBM In this regime, M2O begins to form NBO atoms on the silica network. Each M+ ion which does not form a [4]B unit connects to the silica network forming a NBO on a silica tetrahedron [60, 95, 97, 101, 103, 104]. Table 2 presents the equations used to calculate the fraction of Qn elements in the glass. The n in Qn denotes the number of bridging oxygen atoms on the silica tetrahedron. Likewise, 4 − n indicates the number of NBO atoms on the Si network (see table 1). The alkali metal oxide in this regime plays a dual role network compensator to the borate network and network modifier to the silicate network (i.e. the forma-tion of NBO atoms on the silica network).
Rd1 < RSBM < Rd2 = 1.5+ 0.75 ∗KSBM In this regime, the [M2O] forms NBO atoms on both the silica and borate networks [60, 95, 97, 101, 103, 104]. For the borate network, [4]B units will be transformed into [3]B units with one (fraction denoted by f3) or two (frac-tion denoted by f4) NBO atoms and one or two M+ ions nearby, respectively. Any M+ ion not attaching to the borate network continues to form NBO atoms on the silica network. The rate of NBO atoms on the silica network follows the equations presented for Qn in table 2.
Table 1. The table summarizes the symbols used to describe the fraction of elementary building blocks for KSBM[SiO2]− [B2O3]− RSBM[M2O]
glasses (where KSBM = [SiO2][B2O3]
and RSBM = [M2O][B2O3]
). It should be noted the chemical formulas appear as AOc where A represents the glass former,
O is the oxygen atom, and c represents effective number of O atoms surrounding the glass former. (Common nomenclature found in [60, 95, 97, 100, 101, 103, 104].)
Elementary units Meaning
f1 fraction of planar borate units, BO3/2, with three bridging oxygen atoms, [3]Bf2 fraction of tetrahedra borate units, BO4/2, with four bridging oxygen atoms and a M+ ion in the vicinity for charge
compensation, [4]Bf3 fraction of [3]B units with two bridging oxygen atoms, one NBO atom and a M+ ion in the vicinity (e.g. Metaborate units)f4 fraction of [3]B units with one bridging oxygen atoms, two NBO atoms and two M+ ions (e.g. Pyroborate units)f (SiNBO) number NBO atoms on silica tetrahedraQ4 fraction of SiO4/2 tetrahedra with four bridging oxygen atomsQ3 fraction of Si tetrahedra with three bridging oxygen atoms, one NBO atom and a M+ ion in the vicinityQ2 fraction of Si tetrahedra with two bridging oxygen atoms, two NBO atoms and two M+ ions in the vicinityQ1 fraction of Si trahedrons with one bridging oxygen atoms, three NBO atoms and three M+ ions in the vicinityQ0 fraction of Si tetrahedra with four NBO atoms and four M+ ions in the vicintiy
J. Phys. D: Appl. Phys. 50 (2017) 343002

Topical Review
12
Tab
le 2
. T
he ta
ble
pres
ents
the
frac
tion
of e
lem
enta
ry b
uild
ing
bloc
ks [
60, 9
5–97
, 99–
101]
for
KSB
M[S
iO2]−
[B2O
3]−
RSB
M[M
2O] g
lass
es (
whe
re K
SBM=
[SiO
2][B
2O3]
and
RSB
M=
[M2O
][B
2O3]
). I
n
gene
ral,
thes
e eq
uatio
ns p
rovi
de a
n es
timat
e of
the
num
ber
of e
lem
enta
ry u
nits
in K
SBN[S
iO2]−
[B2O
3]−
RSB
N[N
2O];
but s
ome
auth
ors
expa
nd th
em to
oth
er a
lkal
i met
al o
xide
s in
clud
ing
Li 2
O a
nd K
2O [
99].
Als
o fo
r th
e es
timat
es o
f Q
n, F
elle
r et
al u
sed
a sl
idin
g ru
ler
form
at [
99].
How
ever
, Bar
let e
t al [
60]
pres
ent G
auss
ian
fits
for
Qn
equa
tions
bas
ed o
n M
aeka
wa
et a
l dat
a an
d id
eas
[105
]. T
able
3 p
rese
nts
the
coef
ficie
nts
of th
e G
auss
ian
fits.
Alth
ough
not
sho
wn
here
, Qn
shou
ld b
e no
rmal
ized
due
to s
mal
l rou
nd-o
ff e
rror
s. T
his
ensu
res
that
Qsu
m=
∑4 n=
0Q
n=
1.
(Equ
atio
ns c
ome
from
[60
, 97,
99–
101]
.)
Ele
men
tary
un
its
RSB
M v
alue
s
Ref
eren
ces
RSB
M<
Rm
axR
max<
RSB
M<
Rd1
Rd1
<R
SBM<
Rd2
Rd2
<R
SBM<
Rd3
Rd3
<R
SBM
Rm
ax=
0.5+
0.06
25∗
KSB
MR
d1=
0.5+
0.25
∗K
SBM
Rd2
=1.
5+
0.75
∗K
SBM
Rd3
=2+
KSB
M
f 11−
RSB
M1−
Rm
ax8−
KSB
M8
∗( .7
5−
RSB
M2+
KSB
M
)0
0[6
0, 9
5–97
, 10
0, 1
01]
f 2R
SBM
Rm
ax8+
KSB
M12
∗( 1
−R
SBM
2+K
SBM
)0
[60,
95–
97,
100,
101
]
f 30
0R
SBM−
Rd1
12∗( 8−
KSB
M2+
KSB
M
)(8−
KSB
M)
6∗( 1
−R
SBM
2+K
SBM
)0
[60,
95–
97,
100,
101
]
f 40
01.
5f3+
KSB
M6
(R
SBM
(2+
KSB
M)−
.25)
(8−
KSB
M)
16+
(RSB
M−
Rd2)
4∗( (8
−K
SBM)
(2+
KSB
M)
) +K
SBM
6
(R
SBM
2+K
SBM−
0.25)
1[6
0, 9
5–97
, 10
0, 1
01]
f(Si
NB
O)
02(
RSB
M−
Rm
ax)
KSB
M3 8+
13 6
( (RSB
M−
Rd1)
(2+
KSB
M)
)2
[100
, 101
]
Q4
11−
f(Si
NB
O)
{ 1−
f(Si
NB
O)
f(Si
NB
O)�
0.5
A4e
−( f(
SiN
BO)−
B4
C4
) 2
f(Si
NB
O)>
0.5
[60,
97,
10
5]
Q3
0f(
SiN
BO)
{ f (Si
NB
O)
f(Si
NB
O)�
0.5
A3e
−( f(
SiN
BO)−
B3
C3
) 2
f(Si
NB
O)>
0.5
[60,
97,
10
5]
Q2
00
A2e
−( f(
SiN
BO)−
B2
C2
) 2[6
0, 9
7,
105]
Q1
00
A1e
−( f(
SiN
BO)−
B1
C1
) 2[6
0, 9
7,
105]
Q0
00
11+
2.2∗
105 e
−3.
65∗(
f(Si
NB
O))
[60,
97,
10
5]
J. Phys. D: Appl. Phys. 50 (2017) 343002

Topical Review
13
The role of the alkali metal oxide is network modifier for both the silica and borate networks.
Rd2 < RSBM < Rd3 = 2+KSBM Ideally in this region, no f1 units remain in the glass [60, 95, 97, 101, 103, 104]. As RSBM increases, [3]B units with NBO atoms continue to replace [4]B units. Also, the number of NBO atoms on the silica tetrahedron increases. At the upper limit, (RSBM � Rd3), Dell et al [95, 101] equations impose the requirement that f4 = 1 and all the other fn fractions equal zero.
Table 2 provides the equations to calculate the fractional ele-mentary units in each regime.
Molecular dynamics (MD) simulations enable a counting of the fractional units in KSBN[SiO2]− [B2O3]− RSBN[Na2O] glasses [60]. For low amounts of sodium, R < Rd1, MD simu-lations and the formulation in table 2 for the elementary unit fractions compare favorably. For R > Rd1, the agreement is not as favorable. MD simulations suggest that the sodium has a higher tendency to attach to the borate network than the formulations in table 2 predict. Moreover, MD simula-tions suggest that the f2 units form in lower quantity than expected by the formulations in table 2 and the f3 units form in
Figure 12. Sketches of how elementary units evolve with [M2O] (for more detailed discussions see text herein and references [60, 95, 97, 101, 103, 104]). (a) [M2O] = 0: The system ideally consists of planar 3-coordinated boron units (represented herein by [3]B; chemical formula: BO3/2) and tetrahedra of 4-coordinated silica units (SiO4/2). All oxygen atoms should be bridging. f1 represents the fraction of [3]B units, and Q4 represents the fraction of 4-coordinated silica units. Both of which ideally should be one in this instance. (b) RSBM < Rmax: In this Region, [M2O] causes the [3]B units to transform into tetrahedra of 4-coordinated boron units (represented herein by [4]B; chemical formula: BO4/2) with a M+ ion for charge compensation. f2 represents the fraction of [4]B units. The silica tetrahedra units remain unchanged (i.e. Q4 units). All oxygen atoms should be bridging. (c) Rmax < RSBM < Rd1: In this region, [M2O] ideally does not alter the boron units (i.e. existing units: f1 and f2). The silica tetrahedra units begin to have non-bridging oxygen units on them. Q3 represents the fraction of silica tetrahedra units with three bridging oxygen atoms and one NBO with a M+ ion for charge compensation. (d) Rd1 < RSBM < Rd3: In this region, [M2O] alters both the boron and silica units. [4]B units
revert back to [3]B with one or two NBO atoms on them with one or two M+ ions for charge compensation, f3 or f4 respectively. The silica tetrahedra units can have four to no bridging oxygen atoms. Qn represents these elements where n is the number of bridging oxygen atoms and 4 − n represents the NBO atoms and the number of M+ ions for charge compensation. It should be noted that the different panels show the new units created. Hence, glasses with Rmax < RSBM < Rd1 can have the elementary units shown in panels (a)–(c). Table 2 presents the factional units of each species.
Table 3. Coefficients from Barlet et al [60] for calculating the fraction of Qn units.
An Bn Cn
Q4 1.04 −0.19 0.8Q3 0.77 1.02 0.79Q2 0.71 2.08 0.79Q1 0.52 2.94 0.8Q0 0.91 3.91 0.8
Figure 13. Density of SBN glasses as a function of their mole % of SiO2, B2O3, and Na2O. The surface is from Inoue et al [97] first order mixing equations and parameters. The color bar indicates the density of the SBN glass in g/cc. Blue diamonds indicate experimental data. Reprinted from [60], with permission from Elsevier.
J. Phys. D: Appl. Phys. 50 (2017) 343002

Topical Review
14
higher quantity than expected by the formulations in table 2. Likewise, MD simulations suggest that the silica system has a lower affinity for the sodium. In this regard, the system has a tendency to maintain the Q4 elements. Yet, once sodium enters the silica network, MD simulations show that it has a tendency to isolate the Si tetrahedra, forming Q2, Q1 and Q0 elements in higher concentrations.
3. Physical properties of glasses
Several papers use the elementary units presented in the previ-ous section in combination with first order mixing models to provide educated guesses of material properties such as the density, Young’s, shear, and bulk moduli and Poisson’s ratio. Density models discussed herein apply to SiO2 and B2O3 as glass formers and one of three alkali metal oxides (Li2O, Na2O or K2O) as the glass modifier. Beyond density, mod-els for Young’s, Shear and Bulk moduli and Poisson’s ratio are only applicable to SiO2 B2O3 Na2O glasses. This section reviews these models and their limitations.
3.1. Density
One of the most fundamental and easiest material properties to measure is a material’s density (ρ): measure the mass (M) and volume (V) of a sample and divide the results (ρ = M/V). Even odd shaped samples are no problem given Archimedes’ method for determining the volume of odd shape samples by submerging the sample in water and measuring the volume of the displaced water [106]. Literature exemplifies the ease of the measurement, with an abundance of measurements found on all types of materials, including oxide glasses. Bansal and Doremus’s book [107] provides evidence of this, with a catalog of many physical properties of oxide glasses. Modern online catalogs include SciGlass [108] and INTERGLAD [109].
Scientists use these databases, scour literature and/or conduct experimental density measurements [60, 97, 99–101, 107, 110–120] to uncover relationships between the glass density and chemical composition. For ternary KSBM[SiO2]− [B2O3]− RSBM[M2O] systems, authors [97, 99–101] found that first order mixing models provide rea-sonable initial estimates for the densities.
Feil and Feller [101] use binary [B2O3]− RSBM[M2O] sys-tems (i.e. KSBM = 0) and the fraction of elementary units in these systems to develop first order mixing models for ρ. For this binary system, KSBM = 0, the mass estimate is:
M =
4∑i=1
fi ∗ Mfi (24)
where Mfi is the mass of the elementary unit fi. Table 4 pro-vides the equations for the masses. The system volume is:
V =
4∑i=1
fi ∗ Vfi (25)
where Vfi is the volume of the elementary unit fi. Using least-squares analysis [121] on experimental values of ρ, Feil and Feller [101] provide estimates for Vfi in the binary [B2O3]− RSBM[M2O] systems. Table 5 provides their Vfi values.
Once Feil and Feller [101] developed their system of equa-tions for the binary [B2O3]− RSBM[M2O] glass, they trivially extended the binary density calculations to the ternary sys-tems, as per the following equation:
ρ =
∑4i=1 fi ∗ Mfi + 0.5 ∗ KSBM ∗ MFeil
∑4i=1 fi ∗ Vfi + 0.5 ∗ KSBM ∗ VFeil
. (26)
Table 4 details Feil’s equation for the Silica network mass, MFeil. Feil and Feller [101] did not use first order mixing models to estimate the silica unit volume, VFeil. Rather, they assume the volume, VFeil, to be equal to the volume of the silica tertrahedron, VSiO2, plus an incremental volume term, dVSiO2, representing the volume change due to a NBO and an M+ ions in the area:
VFeil = VSiO2 + dVSiO2 ∗ f (SiNBO). (27)
A two parameter linear regression analysis provides the values for VSiO2 and dVSiO2. Subsequently, Budhwani and Feller [100] adopted a more elaborate expression for V:
VBudhwani = VSiO2 +
{dV4→3
SiO2∗ f (SiNBO) f (SiNBO) � 1
dV4→3SiO2
+ dV3→2SiO2
∗ ( f (SiNBO)− 1) 1�f (SiNBO)�2 (28)
where dV4→3SiO2
represents the incremental increase in the silica tetrahedron volume corresponding to the Q4 transformation to Q3 and dV3→2
SiO2 represents the incremental increase in the silica
Table 4. The table presents how to calculate the mass of the elementary units along with Feil and Feller [101] equation for the mass of the silica component of the glass. Matom corresponds to the mass of the atom.
System units Mass Reference
f1 Mf1 = MB + 1.5 ∗ MO [60, 101]f2 Mf2 = MB + 2 ∗ MO + MNa [60, 101]f3 Mf3 = MB + 2 ∗ MO + MNa [60, 101]f4 Mf4 = MB + 2.5 ∗ MO + 2 ∗ MNa [60, 101]Feil’s Silica network mass MFeil = MSi + (2 + 0.5 ∗ f (SiNBO)) ∗ MO + f (SiNBO) ∗ MNa [60, 101]
Q4 MQ4 = MSi + 2 ∗ MO [60, 97]Q3 MQ3 = MSi + 2.5 ∗ MO + MNa [60, 97]Q2 MQ2 = MSi + 3 ∗ MO + 2 ∗ MNa [60, 97]Q1 MQ1 = MSi + 3.5 ∗ MO + 3 ∗ MNa [60, 97]Q0 MQ0 = MSi + 4 ∗ MO + 4 ∗ MNa [60, 97]
J. Phys. D: Appl. Phys. 50 (2017) 343002

Topical Review
15
terahedron volume corresponding to the Q3 transformation to Q2. This equation simply implies, once all of the silica tetra-hedra become saturated with one NBO atom and a M+ ion nearby, additional M+ ions result in a second NBO atom on the silica tetrahedra. The incremental volume increase associated with the Q4 → Q3 transition is different than the incremental volume increase associated with the Q3 → Q2 transition.
Given the availability of online databases (e.g. [108, 109]), scientists can readily estimate, via linear regression analysis, the parameters in equations (26)–(28). In another approach, Inoue et al [97] used density data found in the INTERGLAD
database to determine first order mixing parameters for both the silica and borate network:
ρ =2 ∗ [B2O3] ∗
∑4i=1 fi ∗ Mfi + [SiO2] ∗
∑4i=1 Qi ∗ MQi
2 ∗ [B2O3] ∗∑4
i=1 fi ∗ Vfi + [SiO2] ∗∑4
i=1 Qi ∗ VQi
(29)where expressions for MQi and Mfi are in table 4, expressions for fi and Qi are in table 2, and Inoue et al [97] uses multiple regression analysis to estimate the Vfi and VQi parameters. Note, KSBN is not used in equation (29). This modification avoids a singularity when [B2O3] = 0. Table 5 presents Inoue
Table 6. Table of density results for Feil and Feller [101], Budhwani and Feller [100] and Inoue et al [97] for a selection of
[SiO2] [B2O3] [Na2O] glasses. The columns labeled δmodel present the relative errors (δmodel =(
ρexp
ρmodel − 1)× 100%) between experimental
and model data. FF signifies the Feil and Feller [101] model. BF signifies the Budhwani and Feller [100] model. Inoue signifies the Inoue et al [97] model. Figure 14 provides a visual tool to locate the data in the ternary diagram.
[Na2O] [B2O3] [SiO2]ρexp (g cc−1)
ρInoue (g cc−1)
δInoue (%)
ρFF (g cc−1)
δFF (%)
ρBF (g cc−1)
δBF (%) Reference
10.4 46.9 42.7 2.149 2.187 −2 2.236 −4 2.168 −1 [122]4.6 45.3 50.1 2.06 2.098 −2 2.179 −5 2.104 −2 [122]3.4 45.1 51.5 2.069 2.081 −1 2.168 −5 2.092 −1 [122]9.1 41.0 49.9 2.162 2.198 −2 2.252 −4 2.172 −0.5 [122]6.4 44.5 49.0 2.12 2.133 −1 2.203 −4 2.129 −0.4 [122]
10.0 42.6 47.5 2.181 2.204 −1 2.253 −3 2.177 0.2 [122]0.0 27.5 72.5 2.042 2.117 −4 2.220 −8 2.106 −3 [122]0.0 41.7 58.3 1.97 2.044 −4 2.148 −8 2.063 −5 [122]
16.1 56.3 27.6 2.264 2.233 1 2.251 1 2.207 3 [122]20.8 46.4 32.8 2.4 2.386 1 2.361 2 2.303 4 [122]
0.0 0.0 100.0 2.212 2.285 −3 2.384 −7 2.200 1 [60]0.0 100.0 0.0 1.823 1.813 1 1.919 −5 1.919 −5 [60]
16.5 23.9 59.6 2.4619 2.452 0.4 2.442 1 2.331 6 [60]26.8 20.6 52.6 2.5446 2.526 1 2.313 10 2.405 6 [60]28.9 20.1 51.0 2.5407 2.530 0.4 2.328 9 2.407 6 [60]34.5 18.6 46.9 2.5368 2.536 0.04 2.365 7 2.410 5 [60]14.2 15.8 70.0 2.4736 2.449 1 2.456 1 2.326 6 [60]19.2 14.1 66.7 2.524 2.494 1 2.483 2 2.372 6 [60]25.5 13.3 61.1 2.5344 2.534 0.02 2.302 10 2.408 5 [60]29.1 12.9 58.0 2.5383 2.545 −0.3 2.333 9 2.412 5 [60]
Table 5. Input parameters for calculating the molar volume, Vm, using various models. In calculating Vm for both Feil and Feller [101] and Budhwani and Feller [100], one needs to assume a value for the density of [B2O3]. Here it is assumed to be ρB2O3 = 1.823 g cm−3.
Author Reference
Borate units cm3 mol−1 Silicate units cm3 mol−1
Vf1 Vf2 Vf3 Vf4 VQ4 VQ3 VQ2 VQ1 VQ0 VSiO2 dVSiO2 dV4→3SiO2
dV3→2SiO2
KSBN[SiO2]− [B2O3]− RSBN[Na2O]
Feil and Feller [101] 18.1 23.9 30.9 40.5 Not applicable (na) 25.2 10.5 na na
Budhwani and Feller
[100] 18.1 23.9 30.9 40.5 na 27.3 na 9.0 11.3
Inoue et al (cm3 mol−1)
[97] 19.2 21 29 41.7 26.3 35.2 50.3 20.8 na na na na na
KSBL[SiO2]− [B2O3]− RSBL[Li2O]
Budhwani and Feller
[100] 18.7 17.8 24.3 30.7 na 27.3 na 4.6 6.7
KSBK[SiO2]− [B2O3]− RSBK[K2O]
Budhwani and Feller
[100] 18.1 31.9 39.5 56.1 na 27.3 na 15.7 19.3
J. Phys. D: Appl. Phys. 50 (2017) 343002

Topical Review
16
et al [97] parameters for KSBN[SiO2]− [B2O3]− RSBN[Na2O] systems. Figure 13 shows a visualization of the density data for SBN systems presented in Barlet et al [60] and the surface plot corresponds to Inoue’s model.
Barlet et al [60] compares the results of density mixing models from Feil and Feller [101], Budhwani and Feller [100] and Inoue et al [97] for KSBN[SiO2]− [B2O3]− RSBN[Na2O] systems to experimental measurements. They found that the parameters proposed by Inoue et al [97] provide the most favorable comparison to experimental data found in literature (table 6). Yet, it is noted that all three models provide poor density estimates at the extremities: pure silica and pure boron oxide. Barlet et al [60] also compares the results of molecu-lar dynamics (MD) simulations to experimental values. MD simulations [60] provide more favorable estimates of the den-sities, with a relative root mean square discrepancy of 0.5% compared to 1% for the Inoue et al [97] model (taken over the seven samples in [60] and pure silica in [79]). Perhaps, this is not particularly surprising as the glass density is one of the material properties used to set the parameters of the interatomic potentials.
3.2. Estimating other physical and mechanical properties of SBN glasses
Inoue et al [97] also developed first order mixing parameters to aid in estimating various other material properties (MP): the Young’s modulus (E), Shear modulus (G), Bulk modulus (B), Poisson’s ratio (ν), glass transition temperature (Tg), and coefficient of thermal expansion (α). The general form of the equation to estimate a material property, MP, is:
MP = 2 ∗ [B2O3] ∗4∑
i=1
fi ∗ Cfi + [SiO2] ∗4∑
i=1
Qi ∗ CQi (30)
where Cfi and CQi are the first order mixing parameters (which have the units of the material property in question) for the
corre sponding borate and silicate elementary units. Table 7 presents Inoue et al [97] mixing coefficients for SBN material properties.
Continuous functions for material properties provide con-venient first estimates in the absence of explicit data meas-urements. However, they depend on the database population density corresponding to the material property of interest. In regimes where the material property data density is poor, the calculated material property is subject to be poor. For exam-ple, the Poisson’s ratio of pure silica and pure boron oxide are 0.221 and 0.308, respectively, based on Inoue et al [97] mix-ing coefficients in comparison to experimental values of 0.164 [122, 123] for silica and 0.259 [122, 124] for boron oxide. That implies a 26% relative error for silica and 16% relative error for boron oxide. To ensure acceptable values for these extremities, constraining the regression analysis to honor these accepted values would be desirable.
On inspection of the Cfi and CQi values for Poisson’s ratio, Cf3, Cf4, CQ2 and CQ1 stand out, as the values fall outside the physi-cally accepted range for Poisson’s ratio for isotropic materials (recalling the range is −1 to 0.5). Beyond the Cfi and CQi values, another source of error in these calculations is the error in the independent variables, fi and Qi. MD simulations [60] suggest that in high sodium systems (R > Rd1), the borate network has a higher affinity for sodium than the equations in table 2 predicts.
Nonetheless, table 8 presents the Poisson’s ratio (ν) for several ternary SBN glasses along with the experimental val-
ues and relative errors (δREMP =
(MPexp
MPInoue − 1)× 100% where
MP denotes the material property in question). The Poisson’s ratio, ν, for this series of samples has a relative root mean square discrepancy (table 10) of 10%, which is higher than the Inoue et al stated value of 6%. Moreover, one sample alone has a relative error of nearly 30%. Interestingly, the upper section of the table has a relative root mean square discrepancy equiva-lent to the Inoue et al stated value of 6%. The lower section of the table (last eight entries from [60]) compares less favorably, with a relative root mean square discrepancy of 14%.
Table 8 also includes tabulations for Young’s modulus (E), shear modulus (G), bulk modulus (B), Poisson’s ratio (ν) and glass transition temperature (Tg) values as calculated via Inoue et al [97] mixing coefficients, corresponding exper-imental values and corresponding relative errors. Table 10 presents the absolute (∆MP) and relative (δMP) root mean square discrepancy values for data in table 8. The Young’s modulus (E) for this series of samples has a relative root mean square discrepancy (table 10) of 16% which is significantly higher than the Inoue et al stated value of 8%. The Young’s modulus for pure boron oxide presents the largest relative error (1143%) between Eexp and EInoue . The upper section of the table has a relative root mean square discrepancy of 19%, which is significantly larger than the Inoue et al stated value of 8%. In this section of the table, the Inoue et al function over estimates the experimental Young’s modulus, as indi-cated by the negative sign in the relative error calculations in table 8. The lower half of the table (last 8 entries from [60]) compares more favorably with a relative root mean square discrepancy of 10%. In this section of table 8, the Inoue et al function frequently underestimates the experimental Young’s
0
20
40
60
80
0 20 40 60 80
0
20
40
60
80
SiO2
Na
2 OB 2O 3O
Figure 14. Ternary diagram of the location of the points defined in tables 6 and 8. Blue diamonds are for the extremities; pure silica and pure boron oxide [60, 122]. Red circles indicate data from [60]. Green × indicate data points from [122].
J. Phys. D: Appl. Phys. 50 (2017) 343002

Topical Review
17
modulus, as indicated by the positive value of the relative error calculations.
The bulk modulus, B, for this series of samples has a rela-tive root mean square discrepancy (table 10) of 12%, which is significantly higher than the Inoue et al stated value of 5%. Moreover, BInoue is negative for pure boron oxide and has a rel-ative error of nearly 200%. The bulk modulus for the upper sec-tion of the table compares reasonably well with the Inoue et al results. In this section of table 10, the absolute and relative root mean square discrepancies are 2 GPa and 8% (respectively) as compared to the Inoues et al values of 2 GPa and 5%. The bulk modulus for the lower section of the table has less favorable results. In this section of table 10, the absolute and relative root mean square discrepancies are 6 GPa and 16%, respectively.
The shear modulus, G, for this series of samples has a rela-tive root mean square discrepancy (table 10) of 12%, which is significantly higher than the Inoue et al stated value of 4%. Moreover, GInoue is negative for boron oxide and has a relative error of over 1000%. The shear modulus for the upper sec-tion of the table has absolute and relative root mean square dis-crepancies of 2 GPa and 10%, respectively, as compared to the Inoue et al values of 1.1 GPa and 4%. The shear modulus for the lower section of the table has even less favorable results. In this section of table 10, the absolute and relative root mean square discrepancies are 4 GPa and 15%, respectively.
Developing mixing coefficients for the physical parameters based on regression analysis relies significantly on available data—data density and data coverage. Inoue et al [97] use the INTERGLAD database [109] for fitting their parameters. For the density set of data, they had 550 samples from which to fit their mixing coefficients as compared to the Poisson’s ratio for which they only had 37 samples. Thus, more data on these SBN samples homogeneously covering the entire ternary range would enable better estimates of the physical properties. In order to enhance first order mixing models, a way forward may be to implement whole genome regression models rather than standard regression analysis [125]. These methods are designed for data sets with a large number of parameters and a relatively small sample size.
Kieu et al [126, 127] and Chen et al [128] use MD simu-lations to calculate several physical properties (including the Young and shear moduli) for three SBN glasses and pure silica. Table 9 presents these results in comparison with exper imental values. Clearly, for these three samples and pure silica, MD simulations provide more favorable values of the Young and shear moduli. Perhaps, this is not particularly surprising as these
values are frequently used (in combination with other material properties) in setting the interatomic potential parameters.
In summary, the Inoue et al [97] mixing coefficients pro-vide a first guess for a number of physical parameters. The mixing coefficients also demonstrate a complex relationship between physical properties and the fraction of elementary units. An understanding of these relationships contributes, in part, to an understanding of fracture toughness and stress cor-rosion cracking results in the next section.
4. Fracture properties of glasses
This section addresses two aspects of glass fracture: fracture toughness (via nano-indentation) and stress corrosion crack-ing properties in Regions 0 and I. Scientists have, to a degree, conducted systematic studies of how the chemical composi-tion alters the fracture toughness. Section 4.1 takes a closer look at the relationship between the chemical composition and the fracture toughness. Section 4.2 considers how the stress corrosion cracking behavior depends on the chemical composition. Recently, Barlet et al [65] examined both the fracture toughness (albeit via indentation) and the stress cor-rosion cracking behavior in SBN glasses. These results will be predominately considered in the balance of this section.
4.1. Fracture toughness
The fracture toughness of a glass (see section 1.2 for a brief review) is one of the principal properties that scientist and engineers consider when fabricating devices. It corresponds to the value at which a glass breaks in absence of environmental factors (i.e. the crack front’s propagation is not aided by water or other chemical environmental factors). For an ideal fracture toughness measurement, one should load and break a sample in mode I fracture under ultra-high vacuum. Under these cir-cumstances, the point at which the crack begins to propagate is the onset of dynamic fracture, and thus, in equation (10), the applied stress intensity factor, K, equates the fracture toughness, Kc. However, conducting stress corrosion cracking experiments in ultra-high vacuum is not always feasible.
Nano and micro indentation techniques represent an alterna-tive to pure mode I tests in ultra-high vacuum. The major advan-tage is, many laboratories are equipped with nano and micro indenters for hardness test. Moreover, it is a rather easy and fast measurement: simply indent the material surface with an
Table 7. First order mixing parameters for equation (30) for various material properties (data from Inoue et al [97]).
Material property, MP Symbol Units
First order mixing coefficients
Borate units Silicate units
Cf1 Cf2 Cf3 Cf4 CQ4 CQ3 CQ2 CQ1
Poisson’s ratio ν 0.154 0.203 −1.48 4.22 0.221 0.355 −3.9 52.3Young’s modulus E GPa 0.7 117 609 −300 64.7 88.2 1430 −64 400Shear modulus G GPa −4.24 50 164 −95.2 26.4 30 559 −23 900Bulk modulus B GPa −0.57 81.2 −73.9 307 32.8 78.8 −34.3 −220 000Glass transition temperature Tg K 224 950 2100 −522 818 1230 82.7 40 500Thermal expansion coefficient α 10−7 K−1 22.3 169 747 −141 25 138 4070 −145 000
J. Phys. D: Appl. Phys. 50 (2017) 343002

Topical Review
18
Tab
le 8
. A
sel
ectio
n of
tern
ary
SBN
gla
sses
and
thei
r ex
peri
men
tal m
ater
ial p
rope
rtie
s in
com
pari
son
with
mat
eria
l pro
pert
ies
estim
ated
fro
m im
putin
g fir
st o
rder
mix
ing
para
met
ers
7 in
to
equa
tion
(30)
. Mat
eria
l pro
pert
ies
in th
e ta
ble
incl
ude
You
ng’s
(E
), S
hear
(G
) an
d B
ulk
mod
ulus
(B
), P
oiss
on’s
rat
io (ν)
and
gla
ss tr
ansi
tion
(Tg)
as
calc
ulat
ed b
y In
oue
et a
l [97
] m
ixin
g co
effic
ient
s an
d ex
peri
men
tal v
alue
s (e
xp).
δre M
P r
epre
sent
s th
e re
lativ
e er
ror
perc
ent d
iffe
renc
e be
twee
n th
e ex
peri
men
t pro
pert
y an
d th
e pr
oper
ty a
s ca
lcul
ated
fro
m e
quat
ion
(30)
(i.e
. δre M
P=
(M
Pex
p
MP
Inou
e−
1) ×10
0%).
Fig
ure
14 p
rovi
des
a vi
sual
tool
to lo
cate
the
data
in th
e te
rnar
y di
agra
m.
[Na 2
O]
[B2O
3][S
iO2]
Eex
p (G
Pa)
EIn
oue
(GPa
)δre E
(%
)G
exp
(GPa
)G
Inou
e (G
Pa)
δre G
(%)
Bex
p (G
Pa)
BIn
oue
(GPa
)δre B
(%
)ν
exp
νIn
oue
δre ν
(%)
Tgex
p (K
)Tg
Inou
e (K
)δre Tg
(%)
Ref
eren
ce
exp.
10.4
46.9
42.7
42.9
353
−18
17.1
219
−8
29.0
931
−4.
70.
2541
0.24
92
453
711
−36
[122
]4.
645
.350
.134
.02
44−
2213
.64
14−
522
.44
23−
4.1
0.24
740.
255
−3
392
679
−42
[122
]3.
445
.151
.535
.65
42−
1514
.29
136
23.4
722
6.8
0.24
690.
256
−4
673
[122
]9.
141
.049
.944
.53
54−
1818
.09
20−
827
.58
31−
10.4
0.23
10.
245
−6
724
[122
]6.
444
.549
.039
.14
47−
1715
.55
16−
427
.05
263.
60.
2588
0.25
23
694
[122
]10
.042
.647
.545
.63
54−
1618
.55
20−
628
.17
31−
10.2
0.23
0.24
6−
672
4[1
22]
0.0
27.5
72.5
34.3
147
−27
13.6
317
−19
23.7
423
1.1
0.25
910.
245
671
6[1
22]
0.0
41.7
58.3
26.3
238
−31
10.6
712
−10
16.4
619
−11
.80.
2335
0.25
7−
935
166
4−
47[1
22]
16.1
56.3
27.6
52.7
656
−6
21.2
520
633
.97
35−
2.4
0.24
110.
250
−4
469
712
−34
[122
]20
.846
.432
.867
.65
70−
427
.87
272
39.3
444
−11
0.21
340.
236
−10
500
778
−36
[122
]0.
00.
010
0.0
73.2
6513
31.5
2619
36.3
3310
.70.
164
0.22
1−
2681
8[6
0, 1
22]
0.0
100.
00.
017
.41.
411
436.
9−
8−
181
12−
1.1
−11
52.6
0.25
90.
308
−16
448
[60,
122
]16
.523
.959
.680
.176
633
.131
845
.846
0.3
0.20
90.
223
−6
543
829
−34
[60]
26.8
20.6
52.6
80.3
6916
32.4
2721
51.2
54−
4.6
0.23
860.
280
−15
535
809
−34
[60]
28.9
20.1
51.0
74.7
741
29.8
285
50.8
501.
70.
255
0.29
4−
1349
478
9−
37[6
0]34
.518
.646
.976
.773
530
.327
1154
.338
44.5
0.26
40.
369
−28
467
725
−36
[60]
14.2
15.8
70.0
81.8
759
37.3
3122
47.7
456.
90.
212
0.22
1−
458
883
7−
30[6
0]19
.214
.166
.781
.973
1233
.429
1549
.947
5.3
0.22
60.
223
157
383
7−
32[6
0]25
.513
.361
.177
.267
1531
.426
2047
.753
−9.
70.
230.
271
−15
539
816
−34
[60]
29.1
12.9
58.0
72.8
74−
129
.128
348
.845
9.3
0.25
10.
285
−12
505
778
−35
[60]
J. Phys. D: Appl. Phys. 50 (2017) 343002

Topical Review
19
indenter and examine the resulting imprint. Indenters can have a multitude of shapes: spherical, three-sided pyramid, four-sided pyramid, etc. The work reported herein considers Vickers indenters (four sided pyramid indenters) results. In practice, samples are indented multiple times with increasing indentation forces until Palmqvist radial cracks or half-penny median-radial cracks develop [129–131]. However, before the development of these cracks, information from the residual indents can be extracted, including the hardness (H) of the material and the amount of shear flow versus densification (see [23, 132]). The hardness of the material (i.e. its resistance to deformation) is determined by measuring the length of the residual indentation imprint (2a in figure 15) and entering the measurement in the defining expression for Vickers hardness, HVic:
HVic =1.8544P(2a)2 . (31)
Figure 16 displays the relationship between Vickers hardness (HVic) and Poisson’s ratio (ν) for several SBN glasses. For this series of glasses, the Vickers hardness (HVic) decreases with increasing ν (or increasing [Na2O]). Furthermore, both experiments and simulations [23, 133, 134] show that there is a competition between densification under the indenter and plastic flow around the indenter. Glasses containing more SiO2 have a tendency to undergo a higher degree of densifica-tion and less shear flow. Glasses with higher concentrations of [3]B have a tendency to undergo more shear flow [132–135].
Palmqvist radial cracks correspond to surface cracks radi-ating from the indentation corners (figure 15). However, oppo-site corner cracks are not connected to each other. The ratio of the crack length (c), measured from the center of the indent, to the half the diagonal length of the indentation imprint, a, is typically less than 2 or 2.5 (depending on the model). Two generic equations [136, 137] to acquire the fracture toughness from Palmqvist cracks corresponds to [138, 139]:
KVicc = ε
(E
HVic
)n Pal1/2
(32)
or [140]
KVicc = ε
(E
HVic
)n ( Pc3/2
)(al
)1/2 (33)
where ε is a constant and n is a constant ranging between 0 and 1. The exact values of ε and n depend on the models [136–139].
Half-penny median-radial cracks correspond to cracks which radiate from the corners of an indent (figure 15). These cracks extend into the bulk forming a semi-circle connecting
the crack tips. The ratio of the crack length, c, measured from the center of the indent to half the diagonal length of the indent imprint, a, is typically greater than 2 or 2.5. As with Palmqvist cracks, there are multiple equations to calculate the fracture toughness of half-penny median-radial cracks. One such equation is as follows [136, 137, 141–145]:
KVicc = ε
(E
HVic
)n Pc1.5 (34)
Yet, another equation to calculate the fracture toughness is [136, 137, 146]:
KVicc = ε
Pac1/2 . (35)
Ponton and Rawlings [136] provide an overview of these mod-els, plus a few others, for calculating the fracture toughness of a material via indentation measurements. Figure 17 shows the results for the models presented in the Ponton and Rawlings review (equations originally coded per reference [147]). Calculations are based on residual indentations on one sample ([SiO2] = 58.00%, [Na2O] = 29.10%, and [B2O3] = 12.90%) with a maximum load of 50 g. In this example, the mini-mal and maximal fracture toughness varies from 0.22 to 1.75 MPa · m1/2. The average is 0.81 MPa · m1/2, and the median is 0.72 MPa · m1/2. Clearly, it is difficult to establish an ideal model or ideal fracture toughness. Thus, many users invoke a standard material and find the model that best fits that standard material.
Thus, this review paper will follow its predecessors and compare and contrast trends of models rather than particular data points [23, 141]. Herein, two models with two different n are considered. The first model is a version of Evans and Charles 1976 model with n = 0.4 [130, 136, 148]:
KVicc = 0.022
(E
HVic
)0.4 Pc1.5 . (36)
They propose the use of this model for materials with hardness, fracture toughness and Poisson’s ratios in the ranges between 1 to 70 GPa , 0.9 to 16 MPa · m1/2 and 0.2 to 0.3, respectively. Table 11 displays the values of these three parameters for several SBN glass samples studied by Barlet et al [23]. HVic and KVic
c data represent averages of indents with maximum loads, P = 50 g and P = 100 g. The maximum load was held for 15 s in all instances. The measured values for both HVic and ν are within the suggested range of validity prescribed for use of equation (36). However, the fracture toughness is a little low relative to the test values used in the Evans and Charles 1976 paper. Nevertheless, this will be chosen as one of the test models herein. Figure 18(a) displays KVic
c (using equation (36)) as a function of Poisson’s ratio, where each KVic
c data point results from averages over several indentations with maximum loads of 50 g and 100 g.
The second model is a version of the Anstis et al 1981 model [131, 149] with n = 2/3 [131, 136, 148]:
KVicc = 0.0095
(E
HVic
)2/3 Pc1.5 . (37)
Table 9. Young’s and bulk moduli from simulations as compared to experimental values.
NAMEEexp (GPa)
EMD (GPa)
δE (%)
Bexp (GPa)
BMD (GPa)
δB (%) Reference
Silica 73.2 67 8 [60, 128]SBN12 80.1 71.8 10 45.8 42 8 [126, 127]SBN70 82.6 82 1 47.7 45 6 [126, 127]SBN55 72.8 69.4 5 48.8 48.6 0 [126, 127]
J. Phys. D: Appl. Phys. 50 (2017) 343002

Topical Review
20
Laugier [148] suggests this model is appropriate for both ceramics and glasses. Figure 18(b) and table 11 displays KVic
c values for these glasses.
Clearly KVicc decreases with increasing ν (or increas-
ing [Na2O] as ν is proportional to [Na2O] for these SBN samples [65]) for both equations (36) and (37). This implies that the onset of dynamic fracture decreases with
increasing ν (or [Na2O]) in this set of glasses. This was not the first time, nor the only ternary system, that the fracture toughness was seen to decrease with increasing [Na2O]. Gehrke et al in 1991 measured the stress corrosion crack-ing in [SiO2]− [Na2O]− [Al2O3]. They also found that the fracture toughness (Kc) decreases with increasing [Na2O] (see figure 19).
Figure 15. Sketch of residual imprints left after a surface was subjected to a Vickers indenter with a prescribed load (P). Depending on the load several different types of cracks can form. Two common types are Palmqvist radial cracks (c/a < 2.5) or half-penny median-radial cracks (c/a > 2.5). Palmqvist cracks radiate off the indentation corners and remain at the surface (i.e. the two opposite cracks are not connected). Half-penny median-radial cracks radiate off the indentation corners and propagate into the bulk such that the cracks on opposite corners are connected.
Table 10. Values of error analysis done by Inoue et al [97] for his data sets compared to the error analysis calculated for data in tables 6
and 8. The absolute root mean square discrepancy is ∆MP =(
1N
∑j
(MPexp
j − MPInouej
)2) 1
2. The relative root mean square discrepancy is
δMP =(
1N
∑j
(MPexp
j
MPInouej
− 1)
2) 1
2. * values exclude pure silica and pure boron oxide.
Units Inoue Table 6* First 10 lines of table 6 Last 8 lines of table 6
∆ρ g cc−1 0.04 0.04 0.02
δρ % 2 2 1
Units Inoue Table 8* First 10 lines of table 8 Last 8 lines of table 8
∆E GPa 4.60 9 9 7δE % 7.7 16 19 10∆G GPa 1.1 5 2 4δG % 4.3 12 10 15∆B GPa 1.8 5 2 6δB % 5.1 12 8 16∆ν 0.0014 0.04 0.01 0.05δν % 6.1 10 6 14∆Tg K 24.3 300 300 300δTg % 3.2 40 40 30
J. Phys. D: Appl. Phys. 50 (2017) 343002
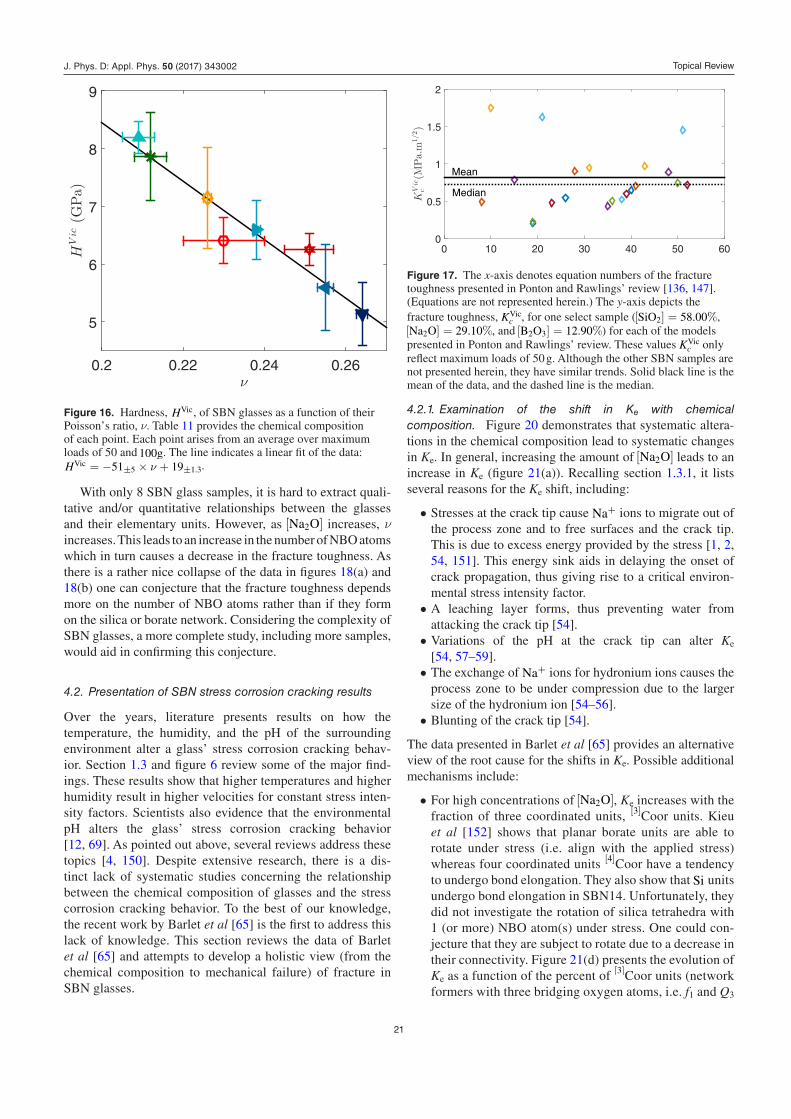
Topical Review
21
With only 8 SBN glass samples, it is hard to extract quali-tative and/or quantitative relationships between the glasses and their elementary units. However, as [Na2O] increases, ν increases. This leads to an increase in the number of NBO atoms which in turn causes a decrease in the fracture toughness. As there is a rather nice collapse of the data in figures 18(a) and 18(b) one can conjecture that the fracture toughness depends more on the number of NBO atoms rather than if they form on the silica or borate network. Considering the complexity of SBN glasses, a more complete study, including more samples, would aid in confirming this conjecture.
4.2. Presentation of SBN stress corrosion cracking results
Over the years, literature presents results on how the temper ature, the humidity, and the pH of the surrounding environ ment alter a glass’ stress corrosion cracking behav-ior. Section 1.3 and figure 6 review some of the major find-ings. These results show that higher temperatures and higher humidity result in higher velocities for constant stress inten-sity factors. Scientists also evidence that the environ mental pH alters the glass’ stress corrosion cracking behavior [12, 69]. As pointed out above, several reviews address these topics [4, 150]. Despite extensive research, there is a dis-tinct lack of systematic studies concerning the relationship between the chemical composition of glasses and the stress corrosion cracking behavior. To the best of our knowledge, the recent work by Barlet et al [65] is the first to address this lack of knowledge. This section reviews the data of Barlet et al [65] and attempts to develop a holistic view (from the chemical composition to mechanical failure) of fracture in SBN glasses.
4.2.1. Examination of the shift in Ke with chemical composition. Figure 20 demonstrates that systematic altera-tions in the chemical composition lead to systematic changes in Ke. In general, increasing the amount of [Na2O] leads to an increase in Ke (figure 21(a)). Recalling section 1.3.1, it lists several reasons for the Ke shift, including:
• Stresses at the crack tip cause Na+ ions to migrate out of the process zone and to free surfaces and the crack tip. This is due to excess energy provided by the stress [1, 2, 54, 151]. This energy sink aids in delaying the onset of crack propagation, thus giving rise to a critical environ-mental stress intensity factor.
• A leaching layer forms, thus preventing water from attacking the crack tip [54].
• Variations of the pH at the crack tip can alter Ke [54, 57–59].
• The exchange of Na+ ions for hydronium ions causes the process zone to be under compression due to the larger size of the hydronium ion [54–56].
• Blunting of the crack tip [54].
The data presented in Barlet et al [65] provides an alternative view of the root cause for the shifts in Ke. Possible additional mechanisms include:
• For high concentrations of [Na2O], Ke increases with the fraction of three coordinated units, [3]Coor units. Kieu et al [152] shows that planar borate units are able to rotate under stress (i.e. align with the applied stress) whereas four coordinated units [4]Coor have a tendency to undergo bond elongation. They also show that Si units undergo bond elongation in SBN14. Unfortunately, they did not investigate the rotation of silica tetrahedra with 1 (or more) NBO atom(s) under stress. One could con-jecture that they are subject to rotate due to a decrease in their connectivity. Figure 21(d) presents the evo lution of Ke as a function of the percent of [3]Coor units (network formers with three bridging oxygen atoms, i.e. f1 and Q3
ν0.2 0.22 0.24 0.26
HV
ic(G
Pa)
5
6
7
8
9
Figure 16. Hardness, HVic, of SBN glasses as a function of their Poisson’s ratio, ν. Table 11 provides the chemical composition of each point. Each point arises from an average over maximum loads of 50 and 100g. The line indicates a linear fit of the data: HVic = −51±5 × ν + 19±1.3.
0 10 20 30 40 50 60
KV
icc
(MPa.
m1/
2 )
0
0.5
1
1.5
2
Mean
Median
Figure 17. The x-axis denotes equation numbers of the fracture toughness presented in Ponton and Rawlings’ review [136, 147]. (Equations are not represented herein.) The y-axis depicts the fracture toughness, KVic
c , for one select sample ([SiO2] = 58.00%, [Na2O] = 29.10%, and [B2O3] = 12.90%) for each of the models presented in Ponton and Rawlings’ review. These values KVic
c only reflect maximum loads of 50 g. Although the other SBN samples are not presented herein, they have similar trends. Solid black line is the mean of the data, and the dashed line is the median.
J. Phys. D: Appl. Phys. 50 (2017) 343002

Topical Review
22
units). Similarly, figure 21(c) presents the evolution of Ke as a function of the percent of [4]Coor units (network formers with four bridging oxygen atoms, i.e. f2 and Q4 units). There is a trend for Ke to increase with an increase in the [3]Coor units. Thus, the depolymerization (decrease in reticulation level, or connectivity) of the glass aids in shifting Ke to higher values [65, 152] (see figure 22).
• Elaborating on silica tetrahedron with one NBO and three bridging oxygen atoms, floppy modes in binary SiO2 Na2O glasses [153] and orientational ordering in pure silica [79] exists. Applying these ideas to silica units with NBO atoms leads to several effects, as pro-posed by Barlet et al [65]: (1) increases the degrees of freedom on [4]Si units; (2) increases the depolymeriza-tion of the glass; and (3) increases the plasticity (used in the most general form—irreversible deformation [79]) of the glass. These effects may contribute to the increase in Ke.
• Pockets/channels/paths of Na2O are believed to exist in Na2O rich glasses [152, 154, 155]. These features may contribute to a redistribution of stresses in the process zone, thus shifting Ke to higher values.
Table 11. Table comparing models for KVicc (data from [60–62, 64, 65]).
Name [Na2O] [B2O3] [SiO2] E (GPa)
ν Hvic (GPa)
KVicc
(equation (36)) MPa · m1/2
KVicc
(equation (37)) MPa · m1/2
Symbol
SBN12 16.5 23.9 59.6 80.1 0.209 8.20 0.86 0.75SBN25 26.8 20.6 52.6 80.3 0.238 6.59 0.69 0.60SBN30 28.9 20.1 51 74.7 0.255 5.59 0.55 0.47SBN35 34.5 18.6 46.9 76.7 0.264 5.13 0.50 0.46SBN70 14.2 15.8 70 81.8 0.212 7.86 0.79 0.64SBN63 19.2 14.1 66.7 81.9 0.226 7.14 0.71 0.60SBN59 25.5 13.3 61.1 77.2 0.23 6.40 0.70 0.58SBN55 29.1 12.9 58 72.8 0.251 6.25 0.60 0.52
ν
0.2 0.22 0.24 0.26
KV
icc
(MPa.
m1/
2 )
0.4
0.5
0.6
0.7
0.8
0.9(a)
ν0.2 0.22 0.24 0.26
KV
icc
(MPa.
m1/
2 )
0.4
0.5
0.6
0.7
0.8
0.9(b)
Figure 18. Vickers fracture toughness, KVicc , as a function of Poisson’s ratio, ν using (a) equation (36) and (b) equation (37). Symbols
represent different types of SBN glasses (see table 11 for the key). Each point arises from an average over maximum loads of 50 and 100 g which have well formed cracks.
KI (MPa.m1/2)0.3 0.4 0.5 0.6 0.7 0.8
log 1
0(v)
(m.s
−1 )
-12
-10
-8
-6
-4
-2
0
[Na2O] = 14%
[Na2O] = 26%
[Na2O] = 36%
Figure 19. Semi-log plot of the crack front velocity, v, as a function of the stress intensity factor, KI. These results correspond to Gehrke et al 1991 study of stress corrosion cracking in [SiO2] [Na2O] [Al2O3] (SNA) glasses in a liquid water environment. [54] © Chapman and Hall 1991. With permission of Springer.
J. Phys. D: Appl. Phys. 50 (2017) 343002

Topical Review
23
• When Na+ ions act as network modifier, rather than a compensator, the ions are more mobile, and corre-spondingly, the glass plasticity increases [62, 132, 156, 157].
It is noted that for SBN63 ([Na2O] = 19.2%, [B2O3] = 14.1%, and [SiO2] = 66.7%, the yellow diamond), Ke has a slight tendency to decrease relative to SBN12 and SBN70. First, this point should be taken with care as it does not feature a dis-tinct value for Ke. Furthermore, this point represents an inter-mediate level of [Na2O] (0.5 + KSBN
16 < RSBN < 0.5 + KSBN4 ). In
this glass network, [Na2O] causes NBO atoms on the silica network with Na+ ions in the vicinity and leaves the borate network unaltered (i.e. a high level of [4]B units). The reticu-lation level of the borate network is high, but the silica net-work begins to experience a degree of depolymerization. Furthermore, the relationship between the chemical composi-tion and Ke may be far more complex than suggested by these 8 samples. More stress corrosion cracking tests, to determine the environ mental limit (Ke) may aid in resolving this issue.
Figure 23 attempts to identify correlations, if any, between KVic
c and Ke. For the blue series of points, corresponding to KSBN = 2.5, KVic
c appears to be inversely proportional to Ke. Moreover, as [Na2O] increases for these three points, Ke increases and KVic
c decreases. For the red series of points, corre-sponding to KSBN = 4.5, there appears to be slight evidence that KVic
c is inversely proportional to Ke, considering SBN70 ([Na2O] = 14.2%, [B2O3] = 15.8%, and [SiO2] = 70%) and SBN55 ([Na2O]=29.1%, [B2O3]=12.9%, and [SiO2]=58% ). Neither SBN63 ([Na2O]=19.2%, [B2O3]=14.1%, and [SiO2]= 66.7%, yellow diamond) nor SBN59 ([Na2O] = 25.5%, [B2O3] = 13.3%, and [SiO2] = 61.1%, red circle) display clear Ke trends as does the other samples; thus, conclusions are hard to draw for KSBN = 4.5.
Turning to the underlying structure of the glasses, both SBN70 ([Na2O] = 14.2%, [B2O3] = 15.8%, and [SiO2] = 70%, pink star-burst) and SBN12 ([Na2O] = 16.5%, [B2O3] = 23.9%, and [SiO2] = 59.6%, light blue upward tri-angle) are rather connected, with only a very small fraction of
NBO atoms. Both glasses have a relatively low Ke and high KVic
c (see figure 23). Water attacks the crack front at relatively low stresses, but it takes a rather significant stress to invoke dynamic fracture. Thus, in these systems the process zone is rather ineffective in delaying the onset of crack propagation.
All of the other samples, with the exception of SBN63 (which has NBO atoms ideally forming on the silica network), have NBO atoms forming on both the borate network (with borate units reverting back to planar 3-coordinated units with one or two NBO atoms) and the silicate network. These NBO atoms cause depolymerization in the glasses and invoke plas-ticity [23] which aids in delaying Ke. Thus, in these systems the process zone is more effective in delaying the onset of crack propagation. However, for these systems, KVic
c decreases, thus implying the systems require less stress to invoke dynamic fracture. The glass structure delays crack propagation, but once a crack starts (in many geometries K increases with crack length) to propagate, the increasing crack length leads to an increasing stress intensity factor (K) and dynamic fracture will follow sooner than it does in SBN70 and SBN12.
SBN63 is an intermediate between low and high [Na2O] glasses. It has a high number of 4-coordinated borate units, ideally no (or very few) NBO atoms on the 4- or 3- coordinated borate units. Yet, NBO atoms occur on the sil-ica tetrahedra. SBN63 has a slightly lower value of Ke than SBN12 and SBN70, but due to the statistical errors, the values are virtually the same. With only one sample in the regime, understanding links between KVic
c and Ke is not via-ble. Additional exper imental measurements on glasses in this regime are needed to sort out the complex relationships.
Considering other ternary systems, Gehrke et al studied [SiO2] [Na2O] [Al2O3] (SNA) [54]. They did not find a clear cut, monotonic, trend in Ke (see figure 19). As [Na2O] increases from 14% to 26%, Ke initially increases slightly. Then, as [Na2O]
increases from 26% and 36%, Ke decreases substanti ally. At
first blush, the structure (when [Al2O3][Na2O] = 1), [Al2O3] should only
be found in an AlO4 tetrahedral state with a Na+ ion in the vicinity for charge compensation. In this case, no extra sodium
0.3 0.35 0.4 0.45 0.5 0.55
10−10
10−9
10−8
10−7
10−6
10−5
KI(MPa.m1/2)
v(m s
)
SBN 12SBN 35SBN 30
(a)
0.3 0.35 0.4 0.45 0.5 0.55
10−10
10−9
10−8
10−7
10−6
10−5
KI(MPa.m1/2)
v(m s
)
SBN 55SBN 59SBN 70SBN 63
(b)
Figure 20. Velocity, v, as a function of stress intensity factor, KI, for 7 different SBN glasses with two different KSBN values: (a) 2.5 and (b) 4.5. Reprinted from [65], with permission from Elsevier. Table 12 provides the chemical composition of the glasses.
J. Phys. D: Appl. Phys. 50 (2017) 343002

Topical Review
24
is available to form NBO atoms. Thus, the Na2O would act as a network modifier in this role. For excess levels of Na2O in the
glass (i.e. [Al2O3][Na2O] < 1), NBO atoms will form in the glass (i.e.
network compensator). Several authors [158, 159] suggest that the glass structure may not be this simple. Recently, Bechgaard et al evidenced 5-fold Al5 units for samples with low Al/Na ratios. Understanding how these changes alter Ke requires more extensive structural and stress corrosion cracking tests.
Clearly the process zone changes in the SBN and SNA ter-nary systems [54, 65]. These changes, which are inherently due to the chemical composition, play on the environmental limit (Ke). Altering the sodium content in the glasses leads to complex changes in Ke. Understanding and developing generic rules/guidelines requires more systematic studies of these systems and systems like them.
4.2.2. Change in the v versus KI in Region I as a function of the chemical composition. As seen above, varying the glass chemical composition results in changes in the process zone. In turn, this gives rise to variations in the environmental limit (Ke). This section examines how changes in the chemical composition alter the behavior of stress corrosion cracking in Region I (i.e. the onset of stress corrosion cracking).
Table 12 presents a summary of Region I slopes (βc) for the SBN series as well as values for Wiederhorn’s complex oxide glasses. Figure 24(a) depicts βc as a function of [Na2O] for the SBN glasses, and figure 24(b) depicts βc as a function of [Na2O] for both the SBN glasses and Wiederhorn’s complex glasses. In figure 24(b), the only modifier considered is [Na2O]. It is with great caution (and a lack of better methods) that one should only consider [Na2O]. This is elaborated on later in this section.
[Na2O]10 20 30 40
Ke(M
Pa.m
1/2 )
0.34
0.36
0.38
0.4
0.42 (a)
ν0.2 0.22 0.24 0.26 0.28
Ke(M
Pa.m
1/2 )
0.34
0.36
0.38
0.4
0.42 (b)
[4]Coor(%)40 60 80 100
Ke(M
Pa.m
1/2 )
0.34
0.36
0.38
0.4
0.42(c)
[3]Coor(%)0 20 40 60
Ke(M
Pa.m
1/2 )
0.34
0.36
0.38
0.4
0.42 (d)
Figure 21. (a) Environmental limit, Ke, as a function of [Na2O] in the glass samples. (b) Environmental limit, Ke, as a function of the Poisson’s ratio, ν, in the glass. (c) Environmental limit, Ke, as a function of four coordinated units (i.e. silica and boron tetrahedral units, [4]Coor) with four bridging oxygen atoms. (d) Environmental limit, Ke, as a function of three coordinated units (i.e. silica tetrahedral with 1 NBO and boron planar units with three bridging oxygen atoms, [3]Coor) with three bridging oxygen atoms. Neither SBN63 ([Na2O] = 19.2%, [B2O3] = 14.1%, and [SiO2] = 66.7%, the yellow diamond) nor SBN55 ([Na2O] = 25.5%, [B2O3] = 13.3%, and [SiO2] = 61.1%, red circle) display clear Ke lines (despite smaller applied loads), as opposed to the other samples. Thus, the values in the graph represent the smallest KI obtained for the samples along with their error bars. To visually remind the reader of the uncertainty of these samples, a hashed line has been used for the lower error bar. Reprinted from [65], with permission from Elsevier.
J. Phys. D: Appl. Phys. 50 (2017) 343002
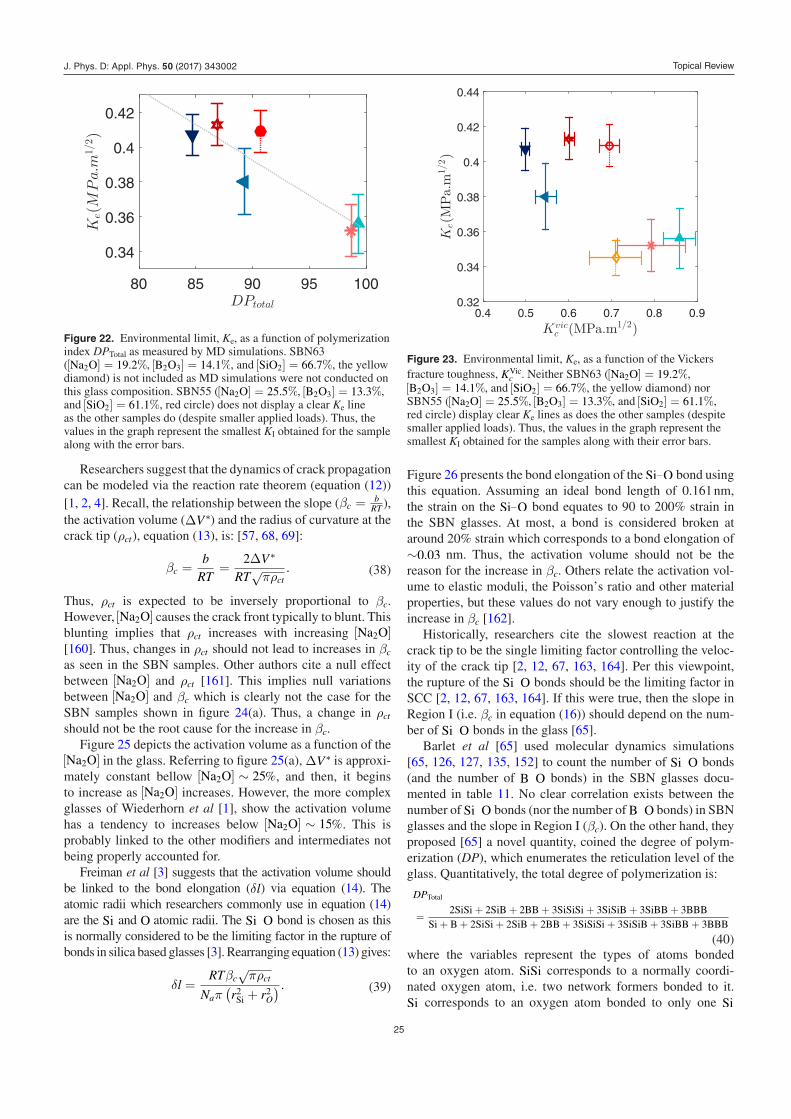
Topical Review
25
Researchers suggest that the dynamics of crack propagation can be modeled via the reaction rate theorem (equation (12)) [1, 2, 4]. Recall, the relationship between the slope (βc =
bRT ),
the activation volume (∆V∗) and the radius of curvature at the crack tip (ρct), equation (13), is: [57, 68, 69]:
βc =b
RT=
2∆V∗
RT√πρct
. (38)
Thus, ρct is expected to be inversely proportional to βc. However, [Na2O] causes the crack front typically to blunt. This blunting implies that ρct increases with increasing [Na2O] [160]. Thus, changes in ρct should not lead to increases in βc as seen in the SBN samples. Other authors cite a null effect between [Na2O] and ρct [161]. This implies null variations between [Na2O] and βc which is clearly not the case for the SBN samples shown in figure 24(a). Thus, a change in ρct should not be the root cause for the increase in βc.
Figure 25 depicts the activation volume as a function of the [Na2O] in the glass. Referring to figure 25(a), ∆V∗ is approxi-mately constant bellow [Na2O] ∼ 25%, and then, it begins to increase as [Na2O] increases. However, the more complex glasses of Wiederhorn et al [1], show the activation volume has a tendency to increases below [Na2O] ∼ 15%. This is probably linked to the other modifiers and intermediates not being properly accounted for.
Freiman et al [3] suggests that the activation volume should be linked to the bond elongation (δl) via equation (14). The atomic radii which researchers commonly use in equation (14) are the Si and O atomic radii. The Si O bond is chosen as this is normally considered to be the limiting factor in the rupture of bonds in silica based glasses [3]. Rearranging equation (13) gives:
δl =RTβc
√πρct
Naπ(r2
Si + r2O
) . (39)
Figure 26 presents the bond elongation of the Si O bond using this equation. Assuming an ideal bond length of 0.161 nm, the strain on the Si O bond equates to 90 to 200% strain in the SBN glasses. At most, a bond is considered broken at around 20% strain which corresponds to a bond elongation of ∼0.03 nm. Thus, the activation volume should not be the reason for the increase in βc. Others relate the activation vol-ume to elastic moduli, the Poisson’s ratio and other material properties, but these values do not vary enough to justify the increase in βc [162].
Historically, researchers cite the slowest reaction at the crack tip to be the single limiting factor controlling the veloc-ity of the crack tip [2, 12, 67, 163, 164]. Per this viewpoint, the rupture of the Si O bonds should be the limiting factor in SCC [2, 12, 67, 163, 164]. If this were true, then the slope in Region I (i.e. βc in equation (16)) should depend on the num-ber of Si O bonds in the glass [65].
Barlet et al [65] used molecular dynamics simulations [65, 126, 127, 135, 152] to count the number of Si O bonds (and the number of B O bonds) in the SBN glasses docu-mented in table 11. No clear correlation exists between the number of Si O bonds (nor the number of B O bonds) in SBN glasses and the slope in Region I (βc). On the other hand, they proposed [65] a novel quantity, coined the degree of polym-erization (DP), which enumerates the reticulation level of the glass. Quantitatively, the total degree of polymerization is:
DPTotal
=2SiSi + 2SiB + 2BB + 3SiSiSi + 3SiSiB + 3SiBB + 3BBB
Si + B + 2SiSi + 2SiB + 2BB + 3SiSiSi + 3SiSiB + 3SiBB + 3BBB (40)where the variables represent the types of atoms bonded to an oxygen atom. SiSi corresponds to a normally coordi-nated oxygen atom, i.e. two network formers bonded to it. Si corresponds to an oxygen atom bonded to only one Si
DPtotal
80 85 90 95 100
Ke(M
Pa.m
1/2 )
0.34
0.36
0.38
0.4
0.42
Figure 22. Environmental limit, Ke, as a function of polymerization index DPTotal as measured by MD simulations. SBN63 ([Na2O] = 19.2%, [B2O3] = 14.1%, and [SiO2] = 66.7%, the yellow diamond) is not included as MD simulations were not conducted on this glass composition. SBN55 ([Na2O] = 25.5%, [B2O3] = 13.3%, and [SiO2] = 61.1%, red circle) does not display a clear Ke line as the other samples do (despite smaller applied loads). Thus, the values in the graph represent the smallest KI obtained for the sample along with the error bars.
Kvicc (MPa.m1/2)
0.4 0.5 0.6 0.7 0.8 0.9
Ke(M
Pa.
m1/
2 )
0.32
0.34
0.36
0.38
0.4
0.42
0.44
Figure 23. Environmental limit, Ke, as a function of the Vickers fracture toughness, KVic
c . Neither SBN63 ([Na2O] = 19.2%, [B2O3] = 14.1%, and [SiO2] = 66.7%, the yellow diamond) nor SBN55 ([Na2O] = 25.5%, [B2O3] = 13.3%, and [SiO2] = 61.1%, red circle) display clear Ke lines as does the other samples (despite smaller applied loads). Thus, the values in the graph represent the smallest KI obtained for the samples along with their error bars.
J. Phys. D: Appl. Phys. 50 (2017) 343002

Topical Review
26
atom and has a NBO atom. SiSiSi corresponds to an over- coordinated Oxygen atom, i.e. three network formers bonded to it (not many of these elements exists in the glass). DPTotal = 1 implies a fully polymerized system; DPTotal < 1 corresponds to a depolymerization of the glass. In other words, its reticula-tion level decreases as DPTotal decreases.
MD simulations provide an excellent method to count the types of oxygen atoms in a glass, and thus, to arrive at a
quantitative value for DPTotal [65]. Figure 27 shows how the slope (βc) in Region I depends on DPTotal. For glasses with a rather high reticulation levels (DPTotal > 0.9), βc is essen-tially constant, given the expected errors. However, for glasses which have a significant deploymerization (DPTotal < 0.9), βc increases as DPTotal decreases. The role of Na+ ions influences significantly DPTotal, which, in turn, influences the slope (βc) in Region I:
Table 12. Table of glass chemical compositions and stress corrosion cracking properties concerning the slope in Region I (βc).
Glass name
Glass formers Glass intermediates Glass modifier
βc σβcReference Symbol[SiO2] [B2O3] [As2O3] [Al2O3] [PbO] [TiO2] [Na2O] [K2O] [MgO] [CaO]
Silica 99.4 0 0 0 0 0 0 0 0 0 87 2 [1]
Aluminosilicate I 58.4 3.5 0 12.1 0 0 1 0 18.3 6.6 56 1 [1]
Aluminosilicate II 66.7 0 0.2 10.8 0 0.6 13.1 2.3 5.8 0.5 66 1 [1]
Borosilicate 82.4 12.4 0 1.2 0 0 4 0 0 0 81 2 [1]
Lead-alkali 75.2 0 0 3 8.1 0 12.2 1.6 0 0 58 2 [1]
Soda-lime silicate 71.4 0 0 1.2 0 0 13.5 0.6 5.9 7.4 44 2 [1]
SBN12 59.6 23.9 0 0 0 0 16.5 0 0 0 46 3 [65]
SBN30 51 20.1 0 0 0 0 28.9 0 0 0 57 3 [65]
SBN35 46.9 18.6 0 0 0 0 34.5 0 0 0 93 8 [65]
SBN70 70 15.8 0 0 0 0 14.2 0 0 0 49 2 [65]
SBN63 66.7 14.1 0 0 0 0 19.2 0 0 0 47 3 [65]
SBN59 61.1 13.3 0 0 0 0 25.5 0 0 0 49 2 [65]
SBN55 58 12.9 0 0 0 0 29.1 0 0 0 64 4 [65]
[Na2O]0 20 40
βc
40
50
60
70
80
90
100
110
[Na2O]10 20 30 40
βc
40
50
60
70
80
90
100
110(b)(a)
Figure 24. The slope in Region I (βc) as a function of [Na2O]. Panel (a) displays the SBN samples of Barlet et al [65]. Panel (b) displays all samples presented in table 12. It should be noted that Wiederhorn et al [1] glasses include multiple glass modifiers and glass intermediates and are more complex than the SBN samples of Barlet et al [65]. Reprinted from [65], with permission from Elsevier.
J. Phys. D: Appl. Phys. 50 (2017) 343002

Topical Review
27
• Low levels of Na2O (RSBN < 0.5 + KSBN16 ) lead to Na+
ions acting as network modifiers, and thus, NBO atoms are not formed. Moreover, [4]B units are formed (with Na+ ions for charge compensation), thus increasing the reticulation level. Additionally, the Na+ ions are less mobile [156]. SBN12 and SBN14 provide examples of these types of glasses and have a relatively a low value of βc.
• Intermediate levels of Na2O (0.5 + KSBN16 < RSBN < 0.5+
KSBN4 ) lead to NBO atoms on the silica network with Na+
ions in the vicinity, and the borate network is unaltered (i.e. high level of [4]B units). Thus, the reticulation level of the borate network is high, but the silica network begins to experience some degree of depolymerization. SBN63 is the only sample which meets this criteria. This sample exhibits a slight decrease in βc, but it is within error bars of SBN63, SBN70 and SBN12; it is essentially constant.
• High levels of Na2O (RSBN > 0.5 + KSBN4 ) lead to Na+
ions acting as network compensators. In this instance, NBO atoms form on both the silica and borate network.
[Na2O]0 10 20 30 40
∆V
*(c
m3 /
mol
)
2
2.5
3
3.5
4
4.5
5
5.5
6
[Na2O]10 20 30 40
∆V
*(c
m3 /
mol
)
2
2.5
3
3.5
4
4.5
5
5.5
DPTotal
0.8 0.85 0.9 0.95 1
∆V
*(c
m3 /
mol
)
2
3
4
5
6 (b)(a)
Figure 25. (a) The evolution of the activation volume, ∆V∗, for the samples in table 11 as a function of [Na2O], where the radius of curvature, ρct , is assumed to be 0.5 nm. The insert in image (a) corresponds to ∆V∗ as a function of the polymerization index, DPTotal. Image (b) depicts the activation volumes of all the samples in table 11 as a function of [Na2O]. Glasses in Wiederhorn et al [1] include multiple modifiers and intermediates; however, only the amount of [Na2O] is shown in the graph. The dashed and dotted lines represent the values of pure silica and soda-lime silicate presented in Freiman et al [3].
[Na2O]0 10 20 30 40
δl(n
m)
0.15
0.2
0.25
0.3
0.35
0.4
[Na2O]10 20 30 40
δl(n
m)
0.15
0.2
0.25
0.3
0.35
0.4
DP Total
0.8 0.85 0.9 0.95 1
δl(n
m)
0.15
0.2
0.25
0.3
0.35
0.4 (b)(a)
Figure 26. (a) Bond elongation, δl, as a function of [Na2O] for SBN samples in table 11. The insert in image (a) corresponds to δl as a function of the polymerization index DPTotal. Image (b) depicts δl as a function of [Na2O] for all samples in table 11 (i.e. Wiederhorn et al [1] and Barlet et al [65]). The glasses in Wiederhorn et al [1], which include multiple modifiers and intermediates, are more complex than the SBN samples of Barlet et al [65]. However, only the amount of [Na2O] is shown in the graph. The dashed lines represent the value of pure silica presented in Freiman et al [3].
J. Phys. D: Appl. Phys. 50 (2017) 343002

Topical Review
28
Moreover, [4]B units revert to [3]B units with NBO atoms (and mobile Na+ ions). This clearly decreases the reticulation on both the silica and borate networks. In this regime, a clear increase in βc occurs. Considering figure 27, a threshold value for DPtotal is highly prob-able, and it likely corresponds to RSBN∼0.5 + KSBN
4 . The mesoscopic scale of these glasses has channels/pockets of sodium. These points act as weak points, and thus, the crack front is probably propagating via prying weak points apart rather than breaking a fully coordinated network.
Thus, it is conjectured that the mesoscopic scale (e.g. the scale between the size of a silica tetrahedron and on the order of 10–100 nm [165–168] depending on the chemical composi-tion of the glass) of the glasses dictates stress corrosion crack-ing in Region I. Methods that highlight mesoscopic features, such as the DPTotal, may be beneficial in the study of βc.
At the macroscopic scale, figure 28 depicts the behavior of βc as a function of the Vickers fracture toughness, KVic
c . The collapse of the data is not as clean as in figure 27. However, for constant KSBN, βc increases with decreasing KVic
c . This is consistent with the fact that KVic
c appears to be more depend-ent on the amount of sodium in the glass whereas βc depends more on the role of the sodium in the glass.
5. Wrap up and future outlook
Clearly the glass chemical composition dictates atomic level structural features which in turn drive variations in the physi-cal, mechanical and fracture properties of oxide glasses. Research works show [23, 60–65] that estimating the elemen-tary structural units and using them as the independent vari-able in developing first order mixing coefficients aid in the modeling of physical properties: density, Young modulus,
Bulk modulus, etc. These models aid in developing a micro-scopic understanding of the glass.
In particular, Inoue et al [97] use first order multiple regression analysis and the INTERGLAD database to model a number of SBN glass physical properties. For a first approx-imation, the calculation is adequate for the density, yet it has much room for improvement for other physical properties. In part, this is a data density and data coverage issue. The den-sity calculations were based on 550 data points as compared to the Young modulus and Poison’s ratio which were based on 296 and 37 points, respectively. Building more extensive databases in the future will enhance the reliability of the mod-els. A second point which should be noted is, calculations of physical properties did not directly take into consideration the miscibility gap in SBN glasses. Thus, continuous calculations across zones wherein there is a phase transition may not be good practice.
In the context of the fracture properties, the fracture tough-ness, as measured with the Vickers indenter, decreases with increasing sodium (or Poisson’s ratio). Yet, the stress corro-sion cracking properties, the Ke and βc, depend more on the role of sodium in the glass. Low sodium glasses provide a high reticulation level, leading to lower values of Ke. These systems are not normal glasses, as they undergo more densi-fication when subjected to indentation. Moreover, βc remains relatively small. However, increasing the amount of sodium leads to delayed onset of crack propitiation (i.e. higher Ke). This phenomenon should be linked to an increase in plastic-ity. Indentations do reveal more plastic shear flow via pile-up as [Na2O] increases. Thus, these two scenarios do corroborate one another. Yet, once the stress exceeds the environ mental limit, the force causes the crack front to propagate faster (i.e. increasing βc). Moreover, Kvic
c decreases with increasing sodium. Hence, these glasses will undergo catastrophic failure in a shorter time.
An optimal glass chemistry/structure would be to increase Ke and Kvic
c and decrease βc. Recent preliminary studies of electron irradiated SBN glass samples may hold the key to tailoring the glass chemistry/structure [62, 66]. Electron
Figure 27. Slope in Region I (βc) as a function of the total degree of polymerization (DPTotal) of the glass network. Reprinted from [65], with permission from Elsevier. DPTotal = 1 represents a full polymerized system. DPTotal < 1 represents a system with some degree of depolymerization.
Kvicc (MPa.m1/2)
0.45 0.5 0.55 0.6 0.65 0.7 0.75 0.8 0.85 0.9
βc
40
50
60
70
80
90
100
110
Figure 28. Slope in Region I (βc) as a function of the Vickers fracture toughness, KVic
c , using equation (36).
J. Phys. D: Appl. Phys. 50 (2017) 343002

Topical Review
29
irradiation of 4 SBN samples (2 low sodium sample and 2 high sodium samples) display 3 different effects (figure 29):
• The null effect: Electron irradiation had essentially a null (within the error of the calculation) effect on stress cor-rosion cracking results for the two high sodium glasses (SBN35 and SBN55); see figures 29(c) and (d). These systems do demonstrate a non-null electron paramagnetic resonance (EPR) effect after electron irradiation and nearly a nearly null effect before electron irradiation. However, the EPR changes do not scale up to significant changes in the mechanical properties of the glasses.
• The disadvantageous effect: One of the low sodium sam-ples (see figure 29(a); SBN12) after electron irradiation evidences an increase in βc. Ke decreased slightly, but may be in the realm of a null effect given the measure-ment errors. Kvic
c was not measurable due to the lack of well-formed half-penny radial cracks. These samples do feature significant increases in the EPR response before and after irradiation. Moreover, Raman spectra indicate an increase in the mixing of the borate and silicate systems. Thus, the increase in βc may be a response to abnormal angles in the silicate and borate units, making them more susceptible to stress corrosion cracking as proposed by West and Hench [169, 170].
• The enhancement effect: One of the low sodium samples (see figure 29(b); SBN14) after electron irradiation evi-
dences a decrease in βc and an increase in Ke. The effect of Kvic
c was not quantifiable as a value was obtainable before, but not after irradiation. The samples feature a significant increase its resistance to cracking. These samples show evidence of significant increases in the EPR response after irradiation (but the change was not as significant as the disadvantageous effect). Moreover, Raman spectra reveal a decrease in the mixing of the borate and silicate systems. This may indicate more normal angles in the silicate and borate units, thus making them less susceptible to stress corrosion cracking, as proposed by West and Hunch [169, 170]. The demixing indicated by Raman spectra may aid in the enhanced fracture properties. More research is needed to verify this response.
This suggests, if scientists and researchers choose wisely, then they can enhance the fracture response of their SBN glasses. To date, the last scenario for increasing stress corrosion crack-ing responses has not been studied significantly. On the other hand, authors have studied glasses residing in the miscibility gap [171]. Patents present them as being crush resistant [172]. It is highly likely that the demixing causes the stress to redis-tribute around the crack tip in such a way that the environ-mental limit is delayed and the structure contains elements which are less likely to be affected by stress corrosion crack-ing, thus decreasing βc.
KI(MPa.m1/2)0.3 0.4 0.5 0.6
v(m
/s)
10-10
10-8
10-6
10-4
SBN 12 pristineSBN 12 2 GGy
(a)
KI(MPa.m1/2)0.4 0.6 0.8
v(m
/s)
10-10
10-8
10-6
10-4
SBN 14 pristineSBN 14 1.5 GGy
(b)
KI(MPa.m1/2)
0.3 0.4 0.5 0.6
v(m
/s)
10-8
10-6
10-4
SBN 35 pristineSBN 35 1.5 GGy
(c)
KI(MPa.m1/2)
0.3 0.4 0.5 0.6
v(m
/s)
10-8
10-6
10-4
SBN 55 2 GGySBN 55 pristine
(d)
Figure 29. Evolution of the stress corrosion cracking curves before and after electron irradiation. Images plot the velocity, v, as a function of the stress intensity factor, KI, for (a) SBN12, (b) SBN14, (c) SBN35 and (d) SBN55.
J. Phys. D: Appl. Phys. 50 (2017) 343002

Topical Review
30
Suzuki et al [171] synthesized demixed glasses via heat treatment. Thus, an interesting way forward would be the study of stress corrosion cracking in heat treated glasses in the miscibility gap.
MD simulations provide a means to probe the materials at the atomic scale. In this regard, an interesting way forward is the development of charge transfer simulations, such as ReaxFF and COMB potentials, of SBN systems. Simulations continue to provide insight into a glass behavior in vacuum. The addition of water to the crack tip may provide an under-standing of the activation volume; and more to the point, is the activation volume a meaningful parameter in the study of stress corrosion cracking.
The way forward in the study of SBN glasses is vast. First principle theoretical work, MD simulations, laboratory work, and enhanced materials databases are all key to the ongoing development of superior glasses and the development of our understanding of stress corrosion cracking.
Acknowledgments
This work consists of a review of Marina Barlet’s thesis works originally published in [23, 60–66] and conducted in collabora-tion with Jean-Marc Delaye and Daniel Bonamy as well as oth-ers who co-authored the papers referenced above. I would like to thank Arnaud Lesaine for providing the code to create fig-ures 17 and 18. I would like to thank Daniel Bonamy and Steven P Rountree for fruitful discussions. Electron irradiation experi-ments were conducted at LSI (Laboratoire des Solides Irradiés), Palaiseau, France and supported by the French Network EMIR. This work has been supported by a number of funding agencies including CEA, Triangle de la Physique (RTRA), Ile-de-France (C’Nano and ISC-PIF), National Science Foundation Graduate Research program (Grant No. 0401467), Investissements d’Avenir of LabEx PALM (ANR-10-LABX-0039-PALM) and LabEx LaSIPS (ANR-10-LABX-0040-LaSIPS).
References
[1] Wiederhorn S and Bolz L 1970 Stress corrosion and static fatigue of glass J. Am. Ceram. Soc. 53 543–8
[2] Wiederhorn S M 1967 Influence of water vapor on crack propagation in soda-lime glass J. Am. Ceram. Soc. 50 407
[3] Freiman S W, Wiederhorn S M and Mecholsky J J 2009 Environmentally enhanced fracture of glass: a historical perspective J. Am. Ceram. Soc. 92 1371–82
[4] Ciccotti M 2009 Stress-corrosion mechanisms in silicate glasses J. Phys. D: Appl. Phys. 42 214006
[5] Atkinson B K 1984 Subcritical crack growth in geological materials J. Appl. Mech. 89 4077–114
[6] Anderson O L and Grew P C 1977 Stress corrosion theory of crack propagation with applications to geophysics Rev. Geophys. 15 77–104
[7] Mostovoy S, Smith H, Lingwall R and Ripling E 1971 A note on stress corrosion cracking rates Eng. Fract. Mech. 3 291–9
[8] Carter C S 1971 Observations on the stress corrosion crack propagation characteristics of high strength steels Corrosion 27 471–7
[9] Evans A G 1972 A method for evaluating the time-dependent failure characteristics of brittle materials—and its application to polycrystalline alumina J. Mater. Sci. 7 1137–46
[10] Anderson T L 1995 Fracture Mechanics: Fundamental and Applications 2nd edn (Boca Raton, FL: CRC Press)
[11] Brantut N, Heap M, Meredith P and Baud P 2013 Time-dependent cracking and brittle creep in crustal rocks: a review J. Struct. Geol. 52 17–43
[12] Freiman S W 1984 Effects of chemical environments on slow crack growth in glasses and ceramics J. Appl. Mech. 89 4072–6
[13] Deladerriere N, Delaye J M, Peuget S and Bureau G 2008 Effect of elastic collisions on acoustic wave propagation in simplified nuclear glass: molecular dynamics simulation Nucl. Instrum. Methods Phys. Res. B 266 2687–90
[14] Oppenheim A L 1973 Towards a history of glass in the ancient near east J. Am. Orient. Soc. 93 259–66
[15] Kurkjian C R and Prindle W R 1998 Perspectives on the history of glass composition J. Am. Ceram. Soc. 81 795–813
[16] Schreurs J W H and Brill R H 1984 Iron and sulfur related colors in ancient glasses Archaeometry 26 199–209
[17] Stalhandske C 2000 The impact of refining agents on glass colour Glastenknisk Tidskr. 55 65–71
[18] Mirti P, Casoli A and Appolonia L 1993 Scientific analysis of roman glass from augusta praetoria Archaeometry 35 225–40
[19] Fujita K, Takahara Y and Chikaura Y 2008 Influence of refining agent in soda lime glass for ultraviolet ray transmittance Mater. Trans. 49 372–5
[20] Zhang L and Jahanshahi S 1998 Review and modeling of viscosity of silicate melts: part I. Viscosity of binary and ternary silicates containing CaO, MgO, and MnO Metall. Mater. Trans. B 29 177–86
[21] Jackson C M 2005 Making colourless glass in the Roman Period Archaeometry 47 763–80
[22] Knoche R, Dingwell D, Seifert F and Webb S 1994 Nonlinear properties of supercooled liquids in the system Na2O-SiO2 Chem. Geol. 116 1–16
[23] Barlet M, Delaye J-M, Charpentier T, Gennisson M, Bonamy D, Rouxel T and Rountree C 2015 Hardness and toughness of sodium borosilicate glasses via Vicker’s indentations J. Non-Crystal. Solids 417–8 66–79
[24] MacMahon A and Price J 2005 Glass-Working and Glassworkers in Cities and Towns (Oxford: Oxbow Books) ch 10, pp 167–90
[25] Melcher M and Schreiner M 2005 Evaluation procedure for leaching studies on naturally weathered potash- lime-silica glasses with medieval composition by scanning electron microscopy J. Non-Crystal. Solids 351 1210–25
[26] Smedley J W and Jackson C M 2002 Medieval and post-medieval glass technology: a review of bracken in glassmaking Glass Technol. 43 221–4
[27] Hudson A P and Newton R 1976 A means for the in situ identification of medieval glass by the detection of its natural radioactivity Archaeometry 18 229–32
[28] Dungworth D 2011 The value of historic window glass Historic Environ.: Policy Pract. 2 21–48
[29] Owens-Illinois Glass Company 1950 Effect of K2O and Li2O on properties of soda-dolomite lime-silica glasses J. Am. Ceram. Soc. 33 181–6
[30] Tutag N and Hamilton L 1987 Discovering Stained Glass in Detroit edn (Detroit, MI: Wayne State University Press)
[31] Charleston R J 1990 Masterpieces of Glass expanded edn (New York: Harry N Abrams Inc.)
J. Phys. D: Appl. Phys. 50 (2017) 343002

Topical Review
31
[32] Rasmussen S C 2012 How glass changed the world: the history and chemistry of glass from antiquity to the 13th Century SpringerBriefs in Molecular Science vol 3 (Berlin: Springer)
[33] Charleston R J 1960 Lead in glass Archaeometry 3 1–4[34] Alcan F 1866 Séances et Travaux de l’Académie des Sciences
Morales et Politiques Compte Rendu vol 76 (Paris: Académie des sciences morales et politiques)
[35] Bessemer H 1905 Sir Henry Bessemer, F.R.S.: an Autobiography; with a Concluding Chapter (Brookfield, VT: Institute of Metals)
[36] Owens M 1895 Apparatus for blowing glass US Patent 534840[37] Owens M J 1895 M. J. Owens machine for blowing glass US
Patent 548588 A[38] Owens M J 1895 M J Owens machine fur blowing glass US
Patent 548587 A[39] Owens M 1904 Glass-shaping machine US Patent 766768[40] Owens M 1904 Glass melting and shaping device US Patent
774690[41] Lawn B 1993 Fracture of Brittle Solids 2nd edn (Cambridge:
Cambridge University Press)[42] Inglis C 1913 Stress in a plate due to the presence of sharp
corners and cracks Trans. Inst. Naval Arch. 55 219–41[43] Rountree C L, Kalia R K, Lidorikis E, Nakano A, Van
Brutzel L and Vashishta P 2002 Atomistic aspects of crack propagation in brittle materials: multimillion atom molecular dynamics simulations Ann. Rev. Mater. Res. 32 377–400
[44] Griffith A A 1921 The phenomena of rupture and flow in solids Phil. Trans. R. Soc. Lond. A 221 163–98
[45] Knott J 1973 Fundamental of Fracture Mechanics (London: Butterworths)
[46] Irwin G 1957 Analysis of stresses and strains near the end of a crack traversing a plate J. Appl. Mech. 24 361–4
[47] Irwin G 1958 Fracture vol 6 (Berlin: Springer) pp 551–90[48] Irwin G, Kies J and Smith H 1958 Fracture strengths relative
to onset and arrest of crack propagation Proc. ASTM vol 58 (Philadelphia, PA: American Society for Testing Materials) pp 640–57
[49] Westergaard H 1939 Bearing pressures and cracks J. Appl. Mech. 6 49–53
[50] Sneddon I N 1946 The distribution of stress in the neighbourhood of a crack in an elastic solid Proc. R. Soc. Lond. A 187 229–60
[51] Williams M L 1961 The bending stress distribution at the base of a stationary crack J. Appl. Mech. 28 78–82
[52] Rountree C L and Bonamy D 2014 Procede de mesure de la tenacite d’un materiau French Patent WO2014023729 A1
[53] Gy R 2003 Stress corrosion of silicate glass: a review J. Non-Crystal. Solids 316 1–11
[54] Gehrke E, Ullner C and Hahnert M 1991 Fatigue limit and crack arrest in alkali—containing silicate glasses J. Mater. Sci. 26 5445–55
[55] Fett T, Guin J and Wiederhorn S 2005 Stresses in ion-exchange layers of soda-lime-silicate glass Fatigue Fract. Eng. Mater. Struct. 28 507–14
[56] Gehrke E, Ullner C and Hahnert M 1990 Effect of corrosive media on crack-growth of model glasses and commercial silicate-glasses Glastech. Ber. 63 255–65
[57] Wiederhorn S M 1973 Prevention of failure in glass by proof-testing J. Am. Ceram. Soc. 56 227–8
[58] Tomozawa M, Cherniak D J and Lezzi P J 2012 Hydrogen-to-alkali ratio in hydrated alkali aluminosilicate glass surfaces J. Non-Crystal. Solids 358 3546–50
[59] Geneste G, Bouyer F and Gin S 2006 Hydrogen-sodium interdiffusion in borosilicate glasses investigated from first principles J. Non-Crystal. Solids 352 3147–52
[60]Barlet M, Kerrache A, Delaye J-M and Rountree C L 2013 SiO2-Na2O-B2O3 density: a comparison of experiments, simulations, and theory J. Non-Crystal. Solids 382 32–44
[61] Barlet M, Delaye J-M, Bonamy D and Rountree C L 2013 Understanding the evolution of mechanical properties under irradiation in nuclear glasses via experiments 13th Int. Conf. on Fracture (Beijing, China) pp 1–7
[62] Barlet M 2014 Evolution of mechanical properties of silicate glasses: impact of the chemical composition and effects of irradiation PhD Thesis Ecole Polytechnique
[63] Barés J, Barlet M, Rountree C L, Barbier L and Bonamy D 2014 Nominally brittle cracks in inhomogeneous solids: from microstructural disorder to continuum-level scale Frontiers Phys. 2 70
[64] Barlet M, Delaye J-M, Gennisson M, Caraballo R, Boizot B, Bonamy B and Rountree C L 2014 Influence of electronic irradiation on failure and hardness properties of pure silica glasses Proc. Mater. Sci. 7 286–93
[65] Barlet M, Delaye J-M, Boizot B, Caraballo R, Peuget S and Rountree C L 2016 From network polymerization to stress corrosion cracking in sodium-borosilicate glasses: effect of the chemical composition J. Non-Crystal. Solids 450 174–84
[66] Barlet M, Delaye J-M, Boizot B, Bonamy D, Caraballo R, Peuget S and Rountree C L Stress corrosion cracking in irradiated sodium-borosilicate glasses: effect of the chemical composition J. Non-Crystal. Solids in preparation
[67] Atkinson B K and Meredith P G 1987 Chapter: The theory of subcritical crack growth with applications to minerals and rocks Fracture Mechanics of Rock (Geology Series) (Amsterdam: Academic) p 119
[68] Wiederhorn S M, Fuller E and Thomson R 1980 Micromechanisms of crack-growth in ceramics and glasses in corrosive environments Met. Sci. 14 450–8
[69] Wiederhorn S, Freiman S W, Fuller E R and Simmons C J 1982 Effects of water and other dielectrics on crack-growth J. Mater. Sci. 17 3460–78
[70] Hillig W and Charles W 1965 Surfaces stress-dependent surface reactions, and strength High Strength Materials ed V Zackey (New York: Wiley) ch 17, pp 682–705
[71] Wiederhorn S M 1975 Crack growth as an interpretation of static fatigue J. Non-Crystal. Solids 19 169–81
[72] Maugis D 1985 Subcritical crack growth, surface energy, fracture toughness, stick-slip and embrittlement J. Mater. Sci. 20 3041–73
[73] Evans A G and Wiederhorn S M 1974 Crack-propagation and failure prediction in silicon-nitride at elevated-temperatures J. Mater. Sci. 9 270–8
[74] Mould R E 1960 Strength and static fatigue of abraded glass under controlled ambient conditions. III, Aging of fresh abrasions J. Am. Ceram. Soc. 43 160–7
[75] Wiederhorn S M 1982 Effect of deuterium-oxide on crack-growth in soda-lime-silica glass J. Am. Ceram. Soc. 65 C202–3
[76] Michalske T A and Freiman S W 1983 A molecular mechanism for stress corrosion in vitreous silica J. Am. Ceram. Soc. 66 284–8
[77] Freiman S W 1974 Effect of alcohols on crack propagation in glass J. Am. Ceram. Soc. 57 350–3
[78] Rountree C, Bonamy D, Dalmas D, Prades S, Kalia R, Guillot C and Bouchaud E 2010 Fracture in glass via molecular dynamics simulations and atomic force microscopy experiments Phys. Chem. Glasses 51 127–32
[79] Rountree C L, Vandembroucq D, Talamali M, Bouchaud E and Roux S 2009 Plasticity-induced structural anisotropy of silica glass Phys. Rev. Lett. 102 195501
[80] Rountree C, Prades S, Bonamy D, Bouchaud E, Kalia R and Guillot C 2007 A unified study of crack propagation in amorphous silica: using experiments and simulations J. Alloys Compd. 434 60–3
J. Phys. D: Appl. Phys. 50 (2017) 343002

Topical Review
32
[81] Van Brutzel L, Rountree C L, Kalia R K, Nakano A and Vashishta P 2002 Dynamic fracture mechanisms in nanostructured and amorphous silica glasses million-atom molecular dynamics simulations Nanophase and Nanocomposite Materials IV vol 703 (Cambridge: Cambridge University Press)
[82] Vashishta P, Nakano A, Kalia R K and Ebbsjo I 1996 Crack propagation and fracture in ceramic films—million atom molecular dynamics simulations on parallel computers Mater. Sci. Eng. B 37 56–71
[83] Vashishta P, Kalia R K, Rino J P and Ebbsjo I 1990 Interaction potential for SiO2—a molecular-dynamics study of structural correlations Phys. Rev. B 41 12197–209
[84] Pasquarello A and Car R 1998 Identification of raman defect lines as signatures of ring structures in vitreous silica Phys. Rev. Lett. 80 5145–7
[85] Roder A, Kob W and Binder K 2001 Structure and dynamics of amorphous silica surfaces J. Chem. Phys. 114 7602–14
[86] Zachariasen W H 1932 The atomic arrangement in glass J. Am. Chem. Soc. 54 3841–51
[87] Hedden W A and King B W 1956 Antimony oxide glasses J. Am. Ceram. Soc. 39 218–22
[88] Sun K-H 1947 Fundamental condition of glass formation J. Am. Ceram. Soc. 30 277–81
[89] Newton D, Thorpe A and Otter C 2004 Revise A2 Chemistry for Salters (OCR) (Oxford: Heinemann)
[90] Bunker B C, Kirkpatrick R J and Brow R K 1991 Local structure of alkaline-earth boroaluminate crystals and glasses: I, crystal chemical concepts-structural predictions and comparisons to known crystal structures J. Am. Ceram. Soc. 74 1425–9
[91] Gin S, Godon N, Mestre J, Vernaz E and Beaufort D 1994 Experimental investigation of aqueous corrosion of R7T7 nuclear glass at 90° C in the presence of organic species Appl. Geochem. 9 255–69
[92] Peuget S et al 2009 Irradiation stability of r7t7-type borosilicate glass Proc. of the GLOBAL 2009 Congress—the Nuclear Fuel Cycle: Sustainable Options and Industrial Perspectives p 567
[93] Deladerriere N, Delaye J M, Augereau F, Despaux G and Peuget S 2008 Molecular dynamics study of acoustic velocity in silicate glass under irradiation J. Nucl. Mater. 375 120–34
[94] de Bonfils J, Peuget S, Panczer G, de Ligny D, Henry S, Noel P-Y, Chenet A and Champagnon B 2010 Effect of chemical composition on borosilicate glass behavior under irradiation J. Non-Crystal. Solids 356 388–93
[95] Dell W J, Bray P J and Xiao S Z 1983 B-11 nmr-studies and structural modeling of Na2O-B2O3-SiO2 glasses of high soda content J. Non-Crystal. Solids 58 1–16
[96] Bray P J, Feller S A, Jellison G E and Yun Y H 1980 B-10 nmr-studies of the structure of borate glasses J. Non-Crystal. Solids 38–9 93–8
[97] Inoue H, Masuno A, Watanabe Y, Suzuki K and Iseda T 2012 Direct calculation of the physical properties of sodium borosilicate glass from its chemical composition using the concept of structural units J. Am. Ceram. Soc. 95 211–6
[98] Aboutaleb D, Douglad J, Safi B, Jbara O and Iratni A 2012 Phase separation and chemical durability in the SiO2-B2O3-Na2O (SBN) glass system Asian J. Chem. 24 473–80
[99] Feller S A, Lower N and Affatigato M 2001 Density as a probe of oxide glass structure Phys. Chem. Glasses 42 240–6
[100] Budhwani K and Feller S 1995 A density model for the lithium, sodium and potassium borosilicate glass systems Phys. Chem. Glasses 36 183–90
[101] Feil D and Feller S 1990 The density of sodium borosilicate glasses related to atomic arrangements J. Non-Crystal. Solids 119 103–11
[102] Roderick J M, Holland D, Howes A P and Scales C R 2001 Density-structure relations in mixed-alkali borosilicate glasses by Si-29 and B-11 MAS-NMR J. Non-Crystal. Solids 293 746–51
[103] Yun Y H, Feller S A and Bray P J 1979 Correction and addendum to nuclear magnetic-resonance studies of the glasses in the system Na2O-B2O3-SiO2 J. Non-Crystal. Solids 33 273–7
[104] Bray P J, Geissberger A E, Bucholtz F and Harris I A 1982 Glass structure J. Non-Crystal. Solids 52 45–66
[105] Maekawa H, Maekawa T, Kawamura K and Yokokawa T 1991 The structural groups of alkali silicate-glasses determined from Si-29 MAS-NMR J. Non-Crystal. Solids 127 53–64
[106] Piroird K, Lazarus V, Gauthier G, Lesaine A, Bonamy D and Rountree C L 2016 Role of evaporation rate on the particle organization and crack patterns obtained by drying a colloidal layer Europhys. Lett. 113 38002
[107] Bansal N P and Doremus R H 1986 Handbook of Glass Properties (London: Academic)
[108] EPAM Systems 2015 Sciglass—glass property information system http://www.akosgmbh.de/sciglass/sciglass.htm
[109] New Glass Forum in Japan 2009 INTERGLAD—international glass database www.newglass.jp/interglad_n/gaiyo/info_e.html
[110] Abd El-Moneim A, Youssof I M and Shoaib M M 1998 Elastic moduli prediction and correlation in SiO2-based glasses Mater. Chem. Phys. 52 258–62
[111] Takahashi K, Osaka A and Furuno R 1983 The elastic properties of the glasses in the system R2O-B2O3-SiO2 (R = Na and K) and Na2O-B2O3 Yogyo Kyokaishi 91 199
[112] Vedam K and Schneider W C 1972 Variation of the refractive index of boric oxide glasses with hydrostatic pressure to 7 kbar J. Appl. Phys. 43 3623–7
[113] Breckner R 1970 Properties and structure of vitreous silica J. Non-Crystal. Solids 5 123–75
[114] Doweidar H 1992 The density of sodium borosilicate glasses in relation to the microstructure J. Phys. Chem. Solids 53 807–14
[115] Cousen A and Turner W E S 1928 The density of boric oxide glass and the atomic weight of boron J. Chem. Soc. 0 2654
[116] Shaw R R and Uhlmann D R 1969 Effect of phase separation on the properties of simple glasses. I. Density and molar volume J. Non-Crystal. Solids 1 474–98
[117] Konijnendijk W L 1975 The structure of borosilicate glasses PhD Thesis Technological University Eindhoven, Eindhoven, Netherlands
[118] Sosman R B 1927 The Properties of Silica: an Introduction to the Properties of Substances in the Solid Non-Conducting State (New York: Chemical Catalog Company)
[119] Imaoka M, Hasegawa H, Hamaguchi T and Kurotaki Y 1971 Chemical composition and tensile strength of glasses in the B2O3-PbO and B2O3-SiO2-Na2O systems Yogyo-Kyokai-shi 5 164–72
[120] Jabra R, Pelous J and Phalippou J 1980 Brillouin scattering measurements of attenuation and velocity of hypersounds in SiO2-B2O3 glasses J. Non-Crystal. Solids 37 349–58
[121] Chong B C L et al 1989 The density of 2 mixed alkali borate glass systems related to atomic arrangements J. Non-Crystal. Solids 109 105–13
[122] Maynell C A, Saunders G A and Scholes S 1973 Ultrasound propagation in glasses in the metastable immiscibility region of the sodium borosilicate system J. Non-Crystal. Solids 12 271–94
[123] Ojovan M I 2004 Glass formation in amorphous SiO2 as a percolation phase transition in a system of network defects J. Exp. Theor. Phys. Lett. 79 632–4
J. Phys. D: Appl. Phys. 50 (2017) 343002

Topical Review
33
[124] Zhuang H-Z, Zou X-W, Jin Z-Z and Tian D-C 1998 β and α relaxation in B2O3 below and near the glass transition temperature Phys. Lett. A 237 253–6
[125] de los Campos G, Hickey J M, Pong-Wong R, Daetwyler H D and Calus M P L 2013 Whole-genome regression and prediction methods applied to plant and animal breeding Genetics 193 327–45
[126] Kieu L-H, Delaye J-M, Cormier L and Stolz C 2011 Development of empirical potentials for sodium borosilicate glass systems J. Non-Crystal. Solids 357 3313–21
[127] Kieu L-H 2011 Compréhension de l’origine de l’évolution sous irradiation de la ténacité des verres nucléaires PhD Thesis l’Ecole Polytechnique
[128] Chen Y-C, Nomura K-I, Kalia R K, Nakano A and Vashishta P 2009 Void deformation and breakup in shearing silica glass Phys. Rev. Lett. 103 035501
[129] Cook R F and Pharr G M 1990 Direct observation and analysis of indentation cracking in glasses and ceramics J. Am. Ceram. Soc. 73 787–817
[130] Evans A G and Charles E 1976 Fracture toughness determinations by indentation J. Am. Ceram. Soc. 59 371–2
[131] Anstis G, Chantikul P, Lawn B and Marshall D 1981 A critical evaluation of indentation technique for measuring fracture toughness: I, direct crack measurement J. Am. Ceram. Soc. 64 533–8
[132] Sellappan P, Rouxel T, Celarie F, Becker E, Houizot P and Conradt R 2013 Composition dependence of indentation deformation and indentation cracking in glass Acta Mater. 61 5949–65
[133] Kilymis D, Delaye J-M and Ispas S 2016 Density effects on the structure of irradiated sodium borosilicate glass: a molecular dynamics study J. Non-Crystal. Solids 432 354–60
[134] Kilymis D and Delaye J-M 2014 Deformation mechanisms during nanoindentation of sodium borosilicate glasses of nuclear interest J. Chem. Phys. 141 014504
[135] Kieu L-H, Delaye J-M and Stolz C 2012 Modeling the effect of composition and thermal quenching on the fracture behavior of borosilicate glass J. Non-Crystal. Solids 358 3268–79
[136] Ponton C B and Rawlings R D 1989 Vickers indentation fracture toughness test Part 1 Review of literature and formulation of standardised indentation toughness equations Mater. Sci. Technol. 5 865–72
[137] Ponton C B and Rawlings R D 1989 Vickers indentation fracture toughness test Part 2 Application and critical evaluation of standardised indentation toughness equations Mater. Sci. Technol. 5 961–76
[138] Niihara K 1983 A fracture-mechanics analysis of indentation-induced Palmqvist crack in ceramics J. Mater. Sci. Lett. 2 221–3
[139] Shetty D, Wright I, Mincer P and Clauer A 1985 Indentation fracutre of WC-CO cermets J. Mater. Sci. 20 1873–82
[140] Laugier M 1987 New formula for indentation toughness in ceramics J. Mater. Sci. Lett. 6 355–6
[141] Sellappan P, Guin J-P, Rocherulle J, Celarie F, Rouxel T and Riedel R 2013 Influence of diamond particles content on the critical load for crack initiation and fracture toughness of SiOC glass-diamond composites J. Eur. Ceram. Soc. 33 847–58
[142] Lawn B R and Fuller E R 1975 Equilibrium penny-like cracks in indentation fracture J. Mater. Sci. 10 2016–24
[143] Weber W J, Matzke H and Routbort J L 1984 Indentation testing of nuclear-waste glasses J. Mater. Sci. 19 2533–45
[144] Lankford J 1982 Indentation microfracture in the palmqvist crack regime—implications for fracture-toughness evaluation by the indentation method J. Mater. Sci. Lett. 1 493–5
[145] Haranoh T, Ishikawa H, Shinkai N and Mizuhashi M 1982 Crack evolution in vickers indentation for soda-lime silica glass J. Mater. Sci. 17 1493–500
[146] Lawn B R and Swain M V 1975 Microfracture beneath point indentations in brittle solids J. Mater. Sci. 10 113–22
[147] Lesaine A 2017 Code to caluclate Ponton and Rawlings fracuture toughness to be published
[148] Laugier M 1985 The elastic/plastic indentation of ceramics J. Mater. Sci. Lett. 4 1539–41
[149] Lawn B, Evan A G and Marshall D B 1980 Elastic-plastic indentation damage in ceramics—the median-radial crack system J. Am. Ceram. Soc. 63 574–81
[150] Freiman S 2012 The fracture of glass: past, present, and future Int. J. Appl. Glass Sci. 3 89–106
[151] Charles R J 1958 Static fatigue of glass. I J. Appl. Phys. 29 1549–53
[152] Kieu L-H, Delaye J-M and Stolz C 2011 Modeling radiation effects on the fracture process in simplified nuclear glass Adv. Fract. Damage Mech. X 488–9 154–7
[153] Smedskjaer M M and Bauchy M 2015 Sub-critical crack growth in silicate glasses: role of network topology Appl. Phys. Lett. 107 141901
[154] Meyer A, Horbach J, Kob W, Kargl F and Schober H 2004 Channel formation and intermediate range order in sodium silicate melts and glasses Phys. Rev. Lett. 93 027801
[155] Golombeck R A 2008 Investigations of adsorption sites on oxide surfaces using solid-state NMR and TPD-IGC PhD Thesis Pennsylvania State University
[156] Grandjean A, Malki M and Simonnet C 2006 Effect of composition on ionic transport in SiO2-B2O3-Na2O glasses J. Non-Crystal. Solids 352 2731–6
[157] Greaves G N, Greer A L, Lakes R S and Rouxel T 2011 Poisson’s ratio and modern materials Nat. Mater. 10 823–37
[158] Shelby J E and Eagan R J 1976 Helium migration in sodium aluminosilicate glasses J. Am. Ceram. Soc. 59 420–5
[159] Bechgaard T K, Goel A, Youngman R E, Mauro J C, Rzoska S J, Bockowski M, Jensen L R and Smedskjaer M M 2016 Structure and mechanical properties of compressed sodium aluminosilicate glasses: role of non-bridging oxygens J. Non-Crystal. Solids 441 49–57
[160] Guin J and Wiederhorn S 2003 Crack growth threshold in soda lime silicate glass: role of hold-time J. Non-Crystal. Solids 316 12–20
[161] Gy R 2001 Stress corrosion of glass Physical Aspects of Fracture (London: Kluwer) pp 305–20
[162] Yu H-H 2005 Crack nucleation from a single notch caused by stress-dependent surface reactions Int. J. Solids Struct. 42 3852–66
[163] Charles R J and Hillig W B 1961 Union scientifique continentale du verre Symp. on Mechanical Strength of Glass and Ways of Improving it (Florence, Italy) pp 511–27
[164] Michalske T A and Freiman S W 1982 A molecular interpretation of stress-corrosion in silica Nature 295 511–2
[165] Bonamy D, Prades S, Ponson L, Dalmas D, Rountree C, Bouchaud E and Guillot C 2006 Experimental investigation of damage and fracture in glassy materials at the nanometre scale Int. J. Mater. Prod. Technol. 26 339–53
J. Phys. D: Appl. Phys. 50 (2017) 343002

Topical Review
34
[166] Bonamy D, Prades S, Rountree C L, Ponson L, Dalmas D, Bouchaud E, Ravi-Chandar K and Guillot C 2006 Nanoscale damage during fracture in silica glass Int. J. Fract. 140 3–14
[167] Lechenault F, Rountree C, Cousin F, Bouchaud J, Ponson L and Bouchaud E 2011 Damage of silicate glasses during stress corrosion J. Phys.: Conf. Ser. 319 012005
[168] Lechenault F, Rountree C L, Cousin F, Bouchaud J P, Ponson L and Bouchaud E 2011 Evidence of deep water penetration in silica during stress corrosion fracture Phys. Rev. Lett. 106 165504
[169] West J and Hench L 1994 Silica fracture: part I. A ring contraction model J. Mater. Sci. 29 3601–6
[170] West J and Hench L 1994 Silica fracture: part II. A ring opening model via hydrolysis J. Mater. Sci. 29 5808–16
[171] Suzuki M and Tanaka T 2008 Materials design for the fabrication of porous glass using phase separation in multi-component borosilicate glass ISIJ Int. 48 1524–32
[172] Hammel J J and Allersma T 1976 Thermally stable and crush resistant microporous glass catalyst supports and methods of making US Patent 3972721
J. Phys. D: Appl. Phys. 50 (2017) 343002