circularity assessment protocol
TRANSCRIPT
Melaka, Malaysia | University Of Georgia Circularity Informatics Lab i
Circularity Assessment ProtocolMELAKA, MALAYSIA

Melaka, Malaysia | University Of Georgia Circularity Informatics Lab ii
ForewordThe Circularity Assessment Protocol (CAP) was born out an effort to define the concept of the circular economy in our cities and communities. While plastic pollution continues to be discussed at the highest levels of government and global organizations, cities and communities are the front lines. CAP is conducted where requested, where a city is engaged in the process. Local knowledge and expertise are the foundation of the information that the com-munity uses, with additional data collected in partnership with CAP collaborators. Partners and teams build capacity through learning methods together. Open data collection is an important part of the process; leakage data contrib-utes to a global open dataset. Trends across cities, countries and regions can illuminate global narratives.
Data is power to communities and enterprising individuals who are recognized for their role in materials manage-ment through CAP but are often marginalized in society. CAP data can catalyze economic development through business opportunities and subsequent interventions. The issue of plastic pollution is not for outsiders to solve in other locations, but for communities to address by collaboratively collecting data to lead themselves through the context-sensitive design of their own desired circular economy. Communities are empowered by local and global CAP data to inform their decisions about what is working, or where and how to intervene to increase circularity. Com-munities that participate in CAP can better define resource needs and participate in knowledge exchange.
Urban Ocean, a partnership of The Circulate Initiative, Resilient Cities Network and Ocean Conservancy, works with city leaders to bring new ideas, partners and resources together to solve interrelated problems around materials management, including addressing key priorities such as public health and economic development. A critical step in the Urban Ocean process is the Gap Assessment, which maps challenges, risks, and vulnerabilities within mate-rials management systems and helps to develop a unique, integrated picture of the materials and circular economy related challenges and opportunities faced by each city. The CAP, developed in our Circularity Informatics Lab (CIL) at the University of Georgia, was chosen as the ideal tool to deploy as part of the Urban Ocean Gap Assessment.
The interconnected nature of complex urban systems and the value of circular economy in building resilient cities was starkly evident when the COVID-19 pandemic began just following the launch of the first Urban Ocean cohort. As a team, we immediately transitioned to online global work, with our local implementation partners becoming even deeper collaborators, conducting all field work with virtual training. This allowed for embedded ownership of the data at the local level and ultimately a powerful network of collaborators and supporters across learning cities to drive scientifically informed decision making. Local implementation partners have then continued to work with the Urban Ocean team through stakeholder workshops and into the proposal phase, as advocates for the science and key contributors in their own cities.
Urban Ocean and its partnerships provide an ideal platform to support resilient cities. CAP data can help guide inter-ventions, create a baseline to measure success, and put essential data in the hands of the local community to drive change. We believe piecemeal solutions that are not contextually grounded are insufficient to create a systemic shift. Communities need to be involved, not just as stakeholders, but as the powerful change-makers they are.
— Jambeck Research Group, Circularity Informatics Lab, University of GeorgiaDr. Jenna Jambeck, Dr. Amy Brooks, Taylor Maddalene, Jenni Mathis, Kathryn Youngblood

Melaka, Malaysia | University Of Georgia Circularity Informatics Lab iii
The Circularity Informatics Lab at the University of Georgia is committed to information sharing, data analytics, empowering communities, and
systems change related to circular materials management.
Published by:
The Circularity Informatics Lab (CIL)
Location:
New Materials Institute
University of Georgia
Athens, GA
USA 30602
www.circularityinformatics.org
Contact:
Dr. Jenna Jambeck
Local Implementation Partner:
Universiti Kebangsaan Malaysia (UKM), Malaysia
Authors:
Taylor Maddalene (CIL), Azlan Abas (UKM), Quinn O’Brien (CIL), Kath-
ryn Youngblood (CIL), Jenna Jambeck (CIL), Madison Werner (CIL)
Contributors and Reviewers:
Kadaruddin Aiyub (UKM), Nur Hakimah Asnawi (UKM), Azahan Awang
(UKM), Rabeah Adawiyah Baharudin (UKM), Keri Browder (OC), Katrin
Bruebach (RCities), Luciana Cardoso (RCities), Lam Kuok Choy (UKM),
Saurabh Gaidhani (RCities), Aajirah Hanim (UKM), Ellen Martin (TCI),
Nini Purwajati (RCities), Norliah Rahman (Melaka Historic City Coun-
cil), Nur Shazwanie Rosehan (UKM), Muhamad Faiz Aiman Sohaimin
(UKM), Alvaro Soldevila (RCities), Chever Voltmer (OC), Zuhailla Zubel
(Melaka Historic City Council)
Recommended Citation:
Circularity Informatics Lab, August 2021. Circularity Assessment: Mela-
ka, Malaysia. University of Georgia, Athens, GA, USA.
Design/Layout:
Deeds Creative, Athens GA
Photo Credits:
Page 22, 24, 28, 29: UKM
URL Links:
This publication contains links to external websites. Responsibility for
the content of the listed external sites always lies with their respective
publishers.
Maps:
The maps printed here are intended only for information purposes and
in no way constitute recognition under international law of boundaries
and territories. CIL accepts no responsibility for these maps being en-
tirely up to date, correct, or complete. All liability for any damage, direct
or indirect, resulting from their use is excluded.
On behalf of:
The Urban Ocean Program, a three-way cooperative partnership
among The Circulate Initiative (TCI), Ocean Conservancy (OC), and
Resilient Cities Network (RCities). Funding for this work was provided
by TCI.
www.circularityinformatics.org
Athens, GA, August 2021

Melaka, Malaysia | University Of Georgia Circularity Informatics Lab iv
ContentsExecutive Summary 1
Urban Ocean Program 2Key Findings and Opportunities 3Strengths 7
Glossary of Acronyms and Abbreviations 8
Introduction 9
CAP Results 12Input 12Community 14Product Design 18Use 21Collection 24End Of Cycle 28Leakage 32
Opportunities 36
References 39
Appendix 41Litter Densities Sampled in Panama City 41Full List of MDT Litter Items and Associated Material Categories 42List of all Manufacturers and Parent Companies of Top Convenience Items in Panama City 44Additional Information on Plastics 45Waste Collection Process 48Sungai Udang Landfill (Further Information) 49

Melaka, Malaysia | University Of Georgia Circularity Informatics Lab v
Figures & TablesFigure 1: Map of the 10x10km sample area within the city of Melaka. 11Figure 2: Location of manufacturing facilities of common brands of convenience products in Melaka 13Figure 3: Location (in Malaysia only) of manufacturing facilities of common brands of convenience products in Melaka 13Figure 4: Material Breakdown of Top Convenience Store Items 19Figure 5: Convenience Store product to plastic ratios, shown in grams 19Figure 6: Figure 4: Material Breakdown of To-Go Items 21Figure 7: Collection Point from Rumah sampah, Jalan Tun Mamat, Medan Selera Jalan Tun Ali 24Figure 8: Guidance on Waste Types for Household Source Separation from kpkt.gov.my 25Figure 9 a-b: Guidance on Household Waste Separation in English swm-environment.com and Malaysian provided by the city 25, 26 Figure 10: Map of Waste Bins identified in the city during litter transects 27Figure 11: Zoomed-in version of waste receptables identified in three transect areas in Melaka 27Figure 12: Example of dump site in Kampung Bukit Baharu, Melaka 28Figure 13: Malaysian Household Waste Composition (As Generated), from NSWMD 2013 29Figure 14: Locations of SWM Facilities (1, 2, and 3) in the state of Melaka, from JPSPN 2020 30Figure 15: Reasons among Malaysians for not recycling, from Moh et al. 2017 30Figure 16: Waste Sector “Players” Contributions to Recycling, from NSWMD 2013 31Figure 17: Photos of the LIP conducting litter surveys in Melaka 32Figure 18: Photos of litter items in Melaka from LIP 32Figure 19: Litter Material Breakdown for Melaka 33Figure 20: Proportion of most common plastic items in low (inner), mid (middle), and high (outer) population count areas 34Figure 21: Litter Densities in Melaka 41Figure 22: Global Materials Flow of Plastic 46Figure 23: Overview of the waste collection and management processes as reported by the City of Melaka 48
Table 1: Most Popular Product Distances to Parent Company Headquarters and Manufacturing Facilities. 12Table 2: Summary of stakeholder interview list 14Table 3: Average weight of products and their plastic packaging for common convenience items 18Table 4: Vendor Food Products Packaging Type and Weights 20Table 5: Cost of Available Plastic Alternatives 21Table 6: Litter density and top litter items from all transects in Melaka 34Table 7: Full List of MDT Litter Items and Associated Material Categories 42Table 8: Parent Companies of Top Convenience Items in Melaka 44Table 9: Manufacturers of Top Convenience Items in Melaka 45Table 10: Common Polymers, Uses and Density related to Seawater 47

Executive SummaryDeveloped by the Circularity Informatics Lab at the University of Georgia (UGA), the Circularity Assessment Protocol (CAP) is a standardized assessment protocol to inform decision-makers through collecting community-level data on plastic usage and management. Grounded in materials flow and systems thinking concepts, the CAP uses a hub-and-spoke model to holistically characterize how consumer plastic flows into a community, is consumed, and flows out, either through waste management systems or leakage into the environment. The model, shown below, consists of seven spokes: input, community, material and product design, use, collection, end of cycle, and leakage. At the center, the system is driven by policy, economics, and governance with key influencers including non-governmental organizations, industry, and government.
Between October 2020 and March 2021, a team from Universiti Kebangsaan Malaysia (UKM) — which served as the local implementing partner (LIP) for this project, as the UGA team was unable to travel due to the COVID-19 pan-demic — with guidance and support from the Circularity Informatics Lab, conducted fieldwork Melaka, Malaysia. The CAP was conducted with support from the city’s local government, the Chief Resilience Officer (a top-level advisor
1 | Executive Summary

Melaka, Malaysia | University Of Georgia Circularity Informatics Lab Executive Summary | 2
in the city that is responsible for leading, coordinating and developing a city's resilience strategy and policy), and the larger Urban Ocean team. Field work included product and packaging assessments in stores across the city; key stakeholder interviews with government, industry, and non-profit organizations; material type characterizations for consumer plastic items; cost analysis of reusable products and alternatives to plastic available in the city; visual audits of recycling contamination; identification of public waste and recycling collection bins; and litter transects in three categories of the population. Key findings from each spoke are summarized in the table below.
Urban Ocean Program
Urban Ocean is a three-way cooperative partnership among The Circulate Initiative (TCI), Ocean Conservancy (OC), and Resilient Cities Network (R-Cities) that works with city leaders to bring new ideas, partners, and resources together to solve interrelated problems around waste management. It aims to demonstrate how actions to improve waste management and recycling can provide holistic, resilient, and sustainable solutions that not only reduce ocean plastic pollution but also address key city priorities such as improving public health, promoting innovation, support-ing economic development and job growth, and reducing greenhouse gas emissions through a capacity building and accelerator program for cities.
Melaka is one of the cities in the initial cohort of Urban Ocean learning cities. The CAP in Melaka, coupled with the upcoming Opportunity Assessment Tool, represents Stage 2 of the Urban Ocean Initiative which involves a compre-hensive Gap Assessment to map challenges, risks and vulnerabilities within the cities’ critical waste management systems. The data gathered from the CAP in Melaka will contribute to three workshops where stakeholders will dis-cuss findings and develop proposal(s) for interventions that will then be brought to an Accelerator Summit for review and support, as showed by the timeline of the program below:
Melaka, Malaysia | University Of Georgia Circularity Informatics Lab Executive Summary | 3
Get to know the partners:
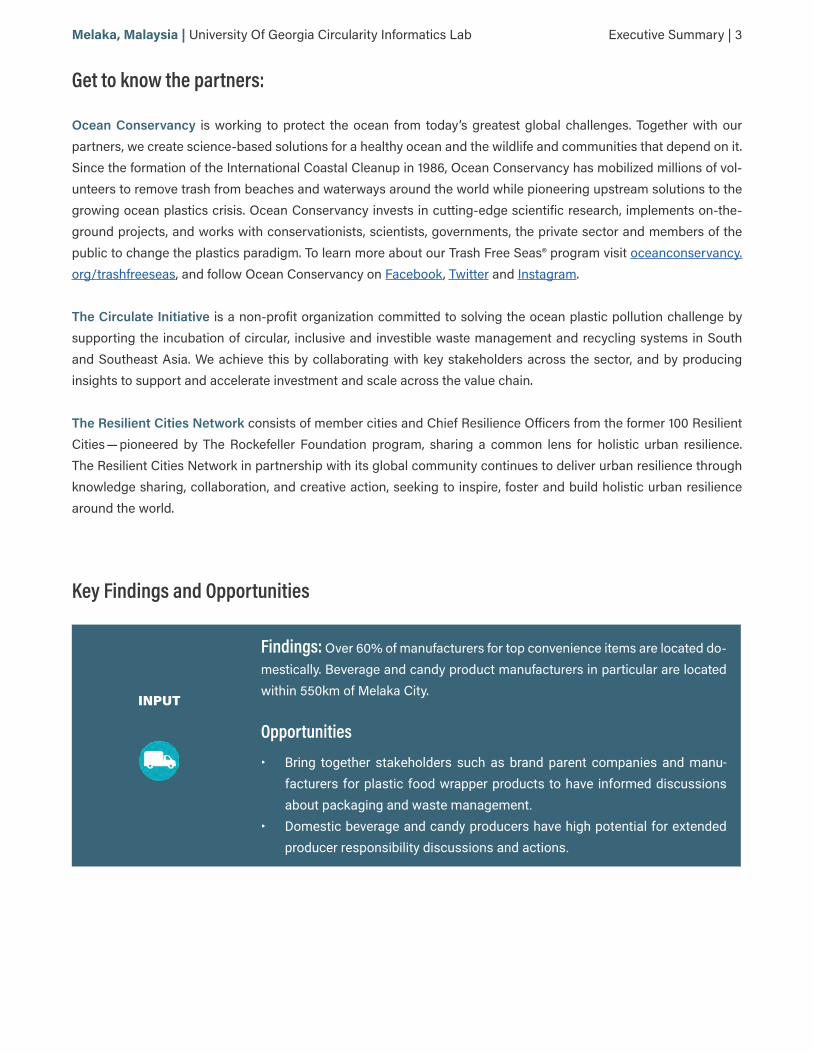
Ocean Conservancy is working to protect the ocean from today’s greatest global challenges. Together with our partners, we create science-based solutions for a healthy ocean and the wildlife and communities that depend on it. Since the formation of the International Coastal Cleanup in 1986, Ocean Conservancy has mobilized millions of vol-unteers to remove trash from beaches and waterways around the world while pioneering upstream solutions to the growing ocean plastics crisis. Ocean Conservancy invests in cutting-edge scientific research, implements on-the-ground projects, and works with conservationists, scientists, governments, the private sector and members of the public to change the plastics paradigm. To learn more about our Trash Free Seas® program visit oceanconservancy.org/trashfreeseas, and follow Ocean Conservancy on Facebook, Twitter and Instagram.
The Circulate Initiative is a non-profit organization committed to solving the ocean plastic pollution challenge by supporting the incubation of circular, inclusive and investible waste management and recycling systems in South and Southeast Asia. We achieve this by collaborating with key stakeholders across the sector, and by producing insights to support and accelerate investment and scale across the value chain.
The Resilient Cities Network consists of member cities and Chief Resilience Officers from the former 100 Resilient Cities — pioneered by The Rockefeller Foundation program, sharing a common lens for holistic urban resilience. The Resilient Cities Network in partnership with its global community continues to deliver urban resilience through knowledge sharing, collaboration, and creative action, seeking to inspire, foster and build holistic urban resilience around the world.
Key Findings and Opportunities
INPUT
Findings: Over 60% of manufacturers for top convenience items are located do-mestically. Beverage and candy product manufacturers in particular are located within 550km of Melaka City.
Opportunities• Bring together stakeholders such as brand parent companies and manu-
facturers for plastic food wrapper products to have informed discussions about packaging and waste management.
• Domestic beverage and candy producers have high potential for extended producer responsibility discussions and actions.

Melaka, Malaysia | University Of Georgia Circularity Informatics Lab Executive Summary | 4
COMMUNITY
Findings: Feedback was generally mixed on levels of public awareness for plastic pollution and there are still significant barriers to adopting alternatives or moving away from problematic single-use items such as straws and bags. Key issues and barriers cited include fragmented communication between the government, industries, and citizens, little distinction between awareness cam-paigns and local policies, logistical discrepancies in waste collection frequency and processing capacity, as well as a lack of community and tourist awareness.
Opportunities• Build upon national-level awareness campaigns (e.g., the Comprehensive
Action Plan of Solid Waste Management 2015–2020) and develop hyper-lo-cal messaging for residents of Melaka to raise public awareness on plastic pollution and the value of certain ‘trash’ items.
• The UN designation of Melaka City as a World Heritage Site could be used to help amplify and carry litter awareness to the community and tourist's messages in a synergistic way. For example, information given to tourists about the city could contain guidance and reminders about how to manage waste properly.
• Existing laws and policies that are in place, particularly around segregation of household waste and reducing illegal dumping, should be fully imple-mented and enforced.
PRODUCT DESIGN
Findings: 48% of convenience items were packaged in multi-layer plastic film, which is difficult to recycle and can easily escape the waste stream. Beverage products from convenience stores were packaged in either PET or aluminum, which are highly recyclable. Many to-go items from food vendors featured multi-ple types of plastic that were wrapped and tied in plastic for transportation.
Opportunities• Alternative designs and product delivery schemes could be explored for
multi-layer plastic film packaged items.• Partnerships should be developed to ensure that the connection is made
between stores, consumers, and recycling companies for convenience bev-erage products, either through deposit schemes, incentives, messaging, or otherwise to maximize collection of those recyclable items.

Melaka, Malaysia | University Of Georgia Circularity Informatics Lab Executive Summary | 5
USE
Findings: Few alternatives to plastic were available among restaurants and food vendors. Interviews revealed that availability and high costs of alternatives are a barrier both to consumers and to businesses. Incentives for alternatives and circular models could have a significant impact on reducing plastic waste. There are no refillable container or deposit schemes that are apparent in the city.
Opportunities• The city should explore opportunities for policies and incentives that would
increase the availability and decrease the cost of alternatives to single-use plastic or refillable/reusable options, particularly for to-go items that need to be transported.
COLLECTION
Findings: The relatively recent requirements around household waste segrega-tion for collection will hopefully reduce the nearly 80% of landfilled waste that is recyclable. However, community awareness and compliance continued to be a challenge, and many residents are unsure if their efforts at home are reflected in collection and downstream solid waste management processes.
Opportunities• As public awareness around recyclable materials grows, adding public re-
cycling bins and increasing the presence of traditional waste bins in rural areas may be beneficial. It may also be useful to include private and house-hold recycling bins as well as community-centric sites for collection of re-cyclables.
• Along with source segregation and waste categorization, the city could have designated waste collection trucks that correspond to those categories to maximize collection.
• Proper disposal bins and messaging should be implemented to encourage the use of bins/cigarette containers for tobacco waste.

Melaka, Malaysia | University Of Georgia Circularity Informatics Lab Executive Summary | 6
END OF CYCLE
Findings: The vast majority (90-95%) of waste in Malaysia is landfilled, though the infrastructure for non-sanitary and sanitary landfills is ailing. While there have been recent investments in segregation, collection, and transportation of waste, little investment has been made on the infrastructure at the end of the cycle to contain and treat the waste destined for landfills, particularly in the Melaka State area.
Opportunities• Continue the ongoing trend of transitioning open dumpsites to landfills, and
of transitioning non-sanitary landfills to sanitary, for the state of Melaka to increase their capacity to handle solid waste.
• Conduct a feasibility study on implementing composting infrastructure and programs to address high proportions of organic waste.
• Invest in infrastructure at the end of the cycle to contain and treat the waste, particularly in the Melaka State area. Interventions should still be supported that reduce waste production, increase segregation, and increase recycling rates.
LEAKAGE
Findings: Litter density was generally low as compared to other similar cities and Melaka could be an example city for UO on measures to reduce litter. Lit-ter densities across developing countries in South Asia typically range from 0.5 items/m2 to 15 items/m2, with an average of around 4-5 items/m2, while den-sities in Melaka ranged from 0.99 – 1.81 items/m2. Cigarettes were the top litter item across all three population count areas. Food wrappers were a close second in terms of abundance.
Opportunities• Melaka City could be an example city as well to demonstrate an urban and
tourist-driven area where litter is minimal compared to other places in a similar geography, and could share with others how waste is collected and managed to minimize litter.
• Opportunities for alternatives and circularity for convenience snack items could also be explored.
• Melaka could design trash traps in the Melaka River to stop plastic leakage into the water stream.
• If there is a desire to measure impact from interventions targeting opportu-nities to reduce plastic leakage, conducting transects over time, and at later periods in time is recommended.

Melaka, Malaysia | University Of Georgia Circularity Informatics Lab Executive Summary | 7
Strengths
• Litter densities in Melaka were found to be relatively low compared to other cities of a similar context.• With the designation as a UNESCO Heritage Site, the city may have access to unique opportunities and funding
mechanisms to reach the tourist population around messaging to reduce litter.• Melaka has a strong set of regulations and strategic plans in place, both nationally and for the city, which would
be impactful if associated enforcement is implemented. Of particular importance is Act 672 which implements mandatory household waste separation (SWCorp 2020).
• While a large portion of the currently landfilled waste is recyclable, this could mean that transitions that make recycling more user-friendly and accessible (such as household segregation) could have a significant impact on reducing plastic waste in the city going forward.
• The National “Roadmap Towards Zero Single-Use” outlines clear milestones for what the county would like to see of consumers, governments, and businesses by 2030 to reduce single-use plastic waste (MESTECC 2018).
• The SWCorp Strategic Plan 2014–2020 gave way to the Comprehensive Action Plan of Solid Waste Manage-ment 2015–2020 as well as several other public awareness and cleanliness initiatives such as 4R (‘Relevant, Referred, Respected, and Renown’), 4CE (‘Communicate, Educate, Engage, Empower, and Enforce’), ‘Trash to Treasure,’ and several other programs (Moh et al. 2014) — each of which could be adopted with hyper-local relevance to the residents of Melaka.

Melaka, Malaysia | University Of Georgia Circularity Informatics Lab Executive Summary | 8
Glossary of Acronyms and Abbreviations
CAP — Circularity Assessment ProtocolCE — Circular EconomyCIL — Circularity Informatics LabC&D — Construction and Demolition MaterialEPR — Extended Producer ResponsibilityHDPE — High Density PolyethyleneGDP — Gross Domestic ProductIWC — Independent Waste CollectorJPSPN — National Solid Waste Management Department (Jabatan Pengurusan Sisa Pepejal Negara)
LIP — Local Implementing PartnerMPs — MicroplasticsMSW — Municipal Solid WasteMSWM — Municipal Solid Waste ManagementNMI — New Materials InstituteOC — Ocean ConservancyOMSW — Ordinary Municipal Solid WastePE — PolyethylenePET — Polyethylene terephthalatePP — PolypropylenePPE — Personal Protective EquipmentPS — PolystyreneRCities — Resilient Cities NetworkSWCrop — Solid Waste and Public Cleansing Management CorporationSWM — Solid Waste ManagementTCI — The Circulate InitiativeUGA — University of GeorgiaUKM — Universiti Kebangsaan Malaysia

IntroductionThe state of Melaka is one of thirteen states and federal territories in Malaysia, a country that is home to a growing population of 31 million, over 75% of which are reported to live in urban areas (UEMI 2021). Municipal Solid Waste (MSW) generation in Malaysia has increased significantly in recent years, with estimates generally ranging between 0.5 and 2.5kg per capita per day, or the equivalent of a total of 25000 - 30000 tons per day (Johari et al. 2013). As com-pared to the other states, Melaka’s MSW generation is below the average at around 1,000 tons/day, with the highest being Selangor at 6,855 tons/day and the lowest being Perlis at around 100 tons/day (Yusop et al. 2019).
Melaka, Malaysia
9 | Introduction

Melaka, Malaysia | University Of Georgia Circularity Informatics Lab Introduction | 10
Melaka City is the capital of the state of Melaka, located on the coast in the southwestern portion of Peninsular Ma-laysia. The population of Melaka City is estimated to be over 930,000 with an average annual growth rate of around 1% (DOSM 2020). Designated as a UNESCO Heritage Site in 2008, the city has a rich history as a key port town and hub of cultural exchange. The city also serves as the outlet for the Melaka River and has been referred to as the “Ven-ice of the East” (Britannica 2008).
As one of the cities in the initial Urban Ocean cohort, Melaka has set out to characterize and understand its materials flow and waste management systems and identify associated opportunities for collaborative solutions. As a first step in the Urban Ocean process, UGA partnered with a local implementing partner (LIP) in Melaka — Universiti Kebang-saan Malaysia (UKM) — to conduct CAP in the city.
The Circularity Informatics Lab at the University of Georgia has developed a Circularity Assessment Protocol (CAP), which is a standardized assessment protocol used to collect community-level data to inform decision-makers. The CAP characterizes seven community components:
1. Inputs — What products are sold in the community and where do they originate?2. Community — What conversations are happening and what are the stakeholders’ attitudes and perceptions?3. Product design — What materials, formats, and innovations are found in products, particularly packaging?4. Use — What are the community trends around the use and reuse of product types?5. Collection — How much and what types of waste are generated? How much is collected and what infrastructure
exists?6. End-of-cycle — How is waste disposed? What is the fate of waste once it is properly discarded? How is it treated?7. Leakage — What waste ends up in the environment? How and why is it getting there?
Various influencing factors drive this system including governance, economics, policy, and legislation (e.g., bans, taxes). Furthermore, multiple stakeholders exist at every level of the CAP influencing the complex system, and these include the public, government, industry, NGOs, consumers, and academia. While the hub and spoke model illus-trates the CAP, it is a complex system with components inherently interconnected to each other and life cycle im-pacts beyond each spoke. The CAP is a framework approach to the flow of materials, in this case focusing on plastic and packaging, and the quantity and characterization of leakage from this sector will be characterized during litter assessments that can inform upstream interventions in the rest of the systems model. As of early 2021, CAP has been conducted in 26 cities in ten countries. For additional context on plastic pollution, please see the Appendix.
This report documents work conducted by the Circularity Informatics Lab at UGA and UKM in Melaka as part of the Urban Ocean Initiative. Background information and a literature review were conducted in September 2020. Fieldwork was conducted from October 2020 - March 2021. The CAP report is split into the following sections, which include results and discussion of each: Input, Community, Product Design, Use, Collection, End of Cycle, and Leak-age, followed by Opportunities to support the forthcoming Opportunities Assessment for Urban Ocean cohort cities.

Melaka, Malaysia | University Of Georgia Circularity Informatics Lab Introduction | 11
Figure 1: Map of the 10x10km sample area within the city of Melaka.
Population densities are shaded in gray. The 1km2 sample areas for product data are
shown in red and 200m2 areas for litter transects are shown in yellow.

CAP Results
Input
To get a snapshot of the characterization, scope, and source of common plastic packaged items that are entering Melaka, samples of common convenience items were sampled within the 1km2 transect areas. Only two of the nine transect areas had convenience stores in them. For each shop, the LIP collected the most popular brands of chips, beverages, candy, and tobacco products where possible. The "most popular brand" was determined as the most purchased brand based upon shelf space taken up and/or the shopkeeper's input. This yielded 25 product samples total, 9 of which were candy, 8 chips, 6 beverages, and 2 tobacco products. The weight of both the plastic packaging and the product itself were measured for each item using scales at the University.
For each of the top products documented, the LIP noted the type of packaging (including polymer, if possible), the brand, and the parent company. From there, the team was able to determine the manufacturing location, which was determined from manufacturing locations listed on product packaging or desktop research, as well as the head-quarters location for the parent company of the brand (largely determined by desktop research). Table 1 contains the minimum, maximum, and average distance to both the manufacturing facilities and parent companies, while Figures 2 and 3 show maps of both manufacturer and parent company locations.
Table 1: Most Popular Product Distances to Parent Company Headquarters and Manufacturing Facilities.
Distance Store to Parent Company (km) Distance Store to Manufacturer (km)
Minimum Maximum Average Median Minimum Maximum Average Median
Beverages 195 12,470 4,227 243 103 2,388 548 198
Candy 178 26,753 13,904 13,045 178 5,213 2,625 2,316
Chips 0 26,753 7,519 1,252 0 667 162 97
Tobacco Products 12,514 14,035 13,275 13,275 1,839 3,488 2,663 2,663
12 | CAP Results

CAP Results | 13Melaka, Malaysia | University Of Georgia Circularity Informatics Lab
Figure 2: Location of manufacturing facilities of common brands of convenience products in Melaka
Figure 3: Location (in Malaysia only) of manufacturing facilities of common brands of convenience products in Melaka
Based on the convenience products sampled, 61% of the manufacturers and 38% of the parent companies were based domestically in Malaysia. Many of the foreign manufactures and companies were, however, based within the

CAP Results | 14Melaka, Malaysia | University Of Georgia Circularity Informatics Lab
Southeast Asia region, with several coming from Indonesia, Thailand, and the Philippines. On average, candy and tobacco products had manufacturers and parent companies that were located the farthest distances from Melaka. Manufacturers for beverage and candy products were on average less than 550km from Melaka, several within Ma-laysia, which could provide the highest opportunity for fostering circularity and EPR locally.
Of all of the convenience products sampled, around 50% were packaged in multilayer plastic film, and the vast ma-jority (80%) were packaged in some form of thin plastic film. Of the beverage products, half were packaged in PET, and half were packaged in Aluminum, both of which would have a high potential for recyclability.
Community
To understand current attitudes and perceptions of plastic waste, semi-structured interviews were conducted by the LIP with 18 key stakeholders (Table 2). Among those interviewed, five were food vendors, four were from private waste management or recycling companies, four were community members, two were local hotel staff, one was from a local NGO, one was from academia, and one was from local government (Table 2).
Table 2: Summary of stakeholder interview list
Stakeholder Group Number of Interviews
Food Vendors 5
Private Waste Management or Recycling Companies 4
Community Members 4
Local Hotel Staff 2
Local NGOs 1
Academia 1
Local Government 1
Most stakeholders interviewed said that waste collection services are available to all members of the community. However, when asked about general perceptions and awareness around plastic waste, responses were mixed. Some stakeholders believed that plastic waste is a problem in their community, while others did not. Examples of the sen-timents can be found in the groups of quotes below:

CAP Results | 15Melaka, Malaysia | University Of Georgia Circularity Informatics Lab
Examples of interviewees that felt plastic waste was an issue in Melaka:
“Because this is a tourist area, plastic waste disposal is a major issue.”
— Food Vendor
“Community and plastic seem inseparable as many depend on the use of plastic items in daily life … They throw plastic waste everywhere and do not even recycle it.”
— Academic
“Many premises use plastic material here. In the Jonker Walk Heritage area, the drain is not large, if the material is used it will cause the drain to be clogged and water to stagnate. Sometimes it is a breeding ground for mosquitoes.”
— Food Vendor
“[Plastic] is a problem too, because we also understand why this plastic has a long shelf life to dispose of so indirectly it is also a problem. For example, on the sidewalks, areas of focus — roads, etc., a lot of plastic is scattered, making the scenery not so beautiful. So plastic is the cause of the area not looking clean.”
— Private Waste Company Manager
In contrast, other key stakeholders did not believe that plastic waste is a problem within their community, citing adequate personal responsibility and existing government policy as mitigators of plastic pollution. Some, including vendors, may also believe that the products that they are selling are eco-friendly or do not have a negative environ-mental impact.
Examples of interviewees that did not feel that plastic waste was an issue in Melaka:
“We do not think plastic pollution is a big problem in our community. Not really. I think our community still manages to care about our environment since this area is a tourist attraction. Everyone plays their own role in keeping the environment clean and safe.”
— Hotel Employee
“In my opinion, plastic pollution is not a big problem around my community. They know how to dump their wastes accordingly.”
— Community Member

CAP Results | 16Melaka, Malaysia | University Of Georgia Circularity Informatics Lab
“From my observation, plastic pollution is not a problem in my community because the residents manage their waste properly.”
— Community Member
“I do not think plastic pollution is a problem in my community. This might be the result from the government policy.”
— Community Member
Another theme that emerged from the interview process was the level of awareness among community members. Generally, opinions about community awareness were mixed. The public awareness campaigns at the national level as outlined by the SWCorp Strategic Plan 2014–2020 could provide a framework to address awareness at the local level in Melaka. Interviewees who felt plastic waste awareness is high in Melaka also cited other factors such as expensive alternatives, a lack of implementation, and a lack of tourist awareness as barriers to mitigating plastic pollution. These quotes are shown below:
“Based on my observations, [awareness] is quite satisfactory, most of my customers already understand the use of plastic. Most of my customers are food traders, they have started using paper packaging, compared to plastic like paper straw, and box. We here also order more food packaging stock based on paper than plastic due to high demand from customers. It's just a bit of a problem, customers complain in terms of the price set for packaging paper is quite expensive compared to plastic.”
— Food Vendor
“Awareness is high, we have also done a survey questionnaire on the awareness of the use of plastic, recycling, and environmental care is indeed high. But in terms of implementation that I see is low.”
— Private Waste Company Manager
“For me, the level of awareness at the local level of the state of Melaka is no problem. But visitors from outside Melaka, in fact they know that Jongker Walk is a protected area, but many still use plastic. They have no awareness … Tourism activities contribute to the abundance of plastic waste.”
— Food Vendor
Other interviewees believed that awareness about plastic pollution could be improved in Melaka.
Examples of interviewees that felt plastic waste awareness is low in Melaka:

CAP Results | 17Melaka, Malaysia | University Of Georgia Circularity Informatics Lab
“In my opinion, the level of awareness on plastic pollution is still very low among our community … I think this problem occurred because there is less exposure to public on how to manage the waste in a proper way.”
— Food Vendor
“In my opinion, the level of awareness regarding plastic pollution among our community/public is still low. There are still many plastic wastes scattered everywhere. Littering behaviors among community still occurs until today.”
— Food Vendor
“Overall, I feel the level of awareness on plastic pollution among the community is still low. The exposure to plastic pollution is still insufficient among the public. We can see almost all business activities use plastic bags in packaging their products … Before enforcing certain policies, the authorities must provide more effective alternatives to replace current packaging methods by offering more reasonable price for [alternative] materials.”
— Hotel Employee
“The community still does not have an awareness about plastic pollution. They still produce and use plastic in their daily life and do not recycle. Awareness and sensitivity about plastic pollution in society may be due to indifference and lack of understanding of relationships in ecological systems.''
— NGO
From the stakeholder interviews, we discovered some potential barriers to effective waste management in Melaka. These barriers include fragmented communication between the government, industries, and citizens, little distinc-tion between awareness campaigns and local policies, logistical discrepancies in waste collection frequency and processing capacity, as well as a lack of community and tourist awareness. Some interviewees also noted that while awareness should be improved, awareness can be limited by the resources offered to people, an example being the high cost of plastic alternatives. Stakeholders shared that improving waste management could include expanding processing and sorting capacities, increasing monitoring and evaluation, and increasing community awareness. Additionally, stakeholders stated that there must be a specific focus on ensuring that capacity and awareness is extended to tourist and commercial areas so that plastic mitigation efforts could be more holistic. These clear ideas from the community on ways to improve going forward and the general trends of awareness and waste management indicate that waste management in Melaka is moving in a positive direction.

CAP Results | 18Melaka, Malaysia | University Of Georgia Circularity Informatics Lab
Product Design
To characterize material types used in common consumer products, samples of common convenience and to-go items were obtained as described in the Input section. The LIP was not able to sample stores and vendors in each of the nine 1km2 transect areas as several did not have any within the square. The average weight of both the packaging and the product itself was collected for all 25 samples (Table 3).
Table 3: Average weight of products and their plastic packaging for common convenience items
Product Type Number of SamplesAverage Weight of Plastic
Packaging (g) Average Quantity of
Product (g)
Beverages 6 17.8 200
Candy 9 3.3 64.7
Chips 8 7.8 65
Tobacco Products 2 5.5 20
Of all of the 25 products that were sampled from convenience stores, all of the candy products were packaged in some type of plastic film, either clear or multilayer, and all but one of the chip products were packaged in multilayer plastic film. The one exception for the chip items was packaged in a paper and foil wrapper, which is still considered a multi-material product that is likely not recyclable or reusable. All of the tobacco products were also packaged in a combination of paperboard and foil. The pattern for beverage products was different, in that half of the items were packaged in PET and the other half were packaged aluminum, both of which are typically readily recyclable and fairly high value.

CAP Results | 19Melaka, Malaysia | University Of Georgia Circularity Informatics Lab
Figure 4: Material Breakdown of Top Convenience Store Items
Beverage products on average had the highest weight of the product and the highest weight of packaging. Beverage and candy products had the smallest ratio of packaging weight to the product weight, while tobacco products had the highest.
Figure 5: Convenience Store product to plastic ratios, shown in grams
Within five of the selected nine 1km2 transects in Melaka, the LIP also visited up to 3 randomly selected food vendors or to-go restaurants to sample the food packaging and utensil types that were being distributed, totaling 9 vendors sampled. The remaining four transect areas did not have any restaurants or food vendors within them. The LIP col-lected 31 to-go items from those restaurants and vendors and documented their weight, material type, and brand, where possible (Table 4).

CAP Results | 20Melaka, Malaysia | University Of Georgia Circularity Informatics Lab
Table 4: Vendor Food Products Packaging Type and Weights
Material Type Number of SamplesAverage Weight of
Packaging (g)
Clear PET 5 10.8
Clear Plastic (likely PP) 10 2.13
Disposable Plastic PP 4 14
Paper 2 18
Paper box 1 17
Paper Cup 1 5
Paper Cup + Plastic Cup Lid 1 13
Other Plastic 2 0.425
Plastic Bag (Disposable Plastic PP) 1 3
Plastic Container for Food 1 12
Plastic Cup + Plastic Cup lid + Plastic Bag for Cup 2 9
Plastic for water wrap + Water-wrapped plastic straps 1 2.5
Wood stick 1 2
The pattern observed in to-go items was somewhat similar to that of the top convenience items. Most of the items were polypropylene, largely in the form of straws or disposable plastic bags. The LIP found that 16% of the to-go items were multi-material plastic, meaning that they were typically a combination of a cup, lid, bag, and plastic ties or string. This is often done so that a to-go product can be transported in a car, motorcycle, or moped. There was an equal proportion of to-go items that were PET, clear plastic (likely PP or film), and paper. Overall, 16% of the to-go products were biodegradable and organic material, including paper and wood, though all of the material is destined for landfill.

CAP Results | 21Melaka, Malaysia | University Of Georgia Circularity Informatics Lab
Figure 6: Material Breakdown of To-Go Items
It was noted by the LIP that there were not many instances of alternatives to plastic available at restaurants or food vendors. The stakeholder interviews showed that the lack of alternatives available as well as the higher price of those alternatives were barriers to adoption, which is explained further in the Use section below.
Use
Table 5: Cost of Available Plastic Alternatives
Product TypeAlternative
Material TypeCost of Alternative
to ConsumerCost of Traditional
Plastic to ConsumerAdditional Cost of
Alternative (%)
Straw Paper No cost to consumerNo plastic option
available—
In Melaka, some businesses and restaurants use alternatives to single-use plastic, such as paper straws and pa-per bags for food packaging. Additionally, some businesses and restaurants sell alternatives to single-use plastic, such as metal straws and woven bags. In total, two alternatives to single-use plastic were recorded in two different restaurants. From our interviews, the most common items with available alternatives were straws, bags, and to-go containers. Paper tended to be the most common material alternative.
Alternatives to plastic straws came up often in our key stakeholder interviews; many businesses are providing paper

CAP Results | 22Melaka, Malaysia | University Of Georgia Circularity Informatics Lab
alternatives as an option to their customers, yet these alternatives were not always mandatory. Some businesses reported consumer complaints about plastic alternatives, so they give the option of using either plastic or paper packaging for bags and to-go containers.
“Our hotel has made an effort to provide other alternatives to plastic like a paper bag and bio-degradable plastic. Community reactions depend on the customer because sometime most of the guests wanted plastic bag over paper bag so we must provide plastic too.”
— Hotel Employee
There are mixed opinions about the community’s perception of plastic alternatives. Some business owners reported that the community was generally opposed to plastic alternatives.
“From our customers, some of them still cannot accept the changes. They are still lacking in the knowledge of plastic waste.”
— Food Vendor
One food vendor noted that community dissatisfaction with plastic alternatives tended to stem from those alterna-tives being more expensive than plastic.
“We receive positive and negative feedback from our customers regarding less plastic usage practiced by our vendor. Some of them are willing to pay extra for the new packaging of F&B because they agree that our vendor practices are more practical, proper, and safe to their health. But some of them complain because of the extra charge they need to pay.”
— Food Vendor
In contrast, other businesses and restaurants report that the switch to alternatives has been generally supported in the community.
“So far there have been no complaints from our customers and tourists. Most already understand the use of plastic is not encouraged in the community here.”
— Food Vendor
“ … These [alternatives to plastic] are well received and most tourists and customers will usually bring their own bags to fill the items bought in our store instead of using plastic bags provided from us.”
— Food Vendor
It is also important to note that efforts to move towards alternatives should be complemented with awareness and

CAP Results | 23Melaka, Malaysia | University Of Georgia Circularity Informatics Lab
infrastructure to support the proper disposal and management of those items once discarded. For example, if the city were to move towards biodegradable options, it would be worth exploring the costs and benefits of making those transitions in light of potentially also installing an industrial composter and hosting a public awareness campaign on disposal. Public private partnerships could also be explored to meet those needs in the city.
Aside from actions taken by businesses and restaurants, some interviewees felt that it was the responsibility of in-dividual consumers to bring and use their own plastic alternatives. One business owner explained that they did not always provide alternatives to plastic because many people within the community use their own bags.
“Alternatives to replace plastic already exist, sometimes we ourselves do not provide plastic to customers because in Melaka it is already known not to use plastic. So most customers use their own bags to place purchased items...So far, most customers from Melaka already know that they do not use plastic. So community acceptance is good.”
— Food Vendor
One interviewee noted that government efforts to reduce the public’s use of single-use plastic were successful, as many consumers now bring woven bags.
“Since our local government encouraged people to use less plastic bags, the community nowadays tends to bring their own bags, such as woven bags every time they want to go shopping.”
— Community Member
Other businesses have implemented a policy to not provide straws at all.
Generally, paper was the most common plastic alternative, yet these alternatives were not always mandatory and were not consistently available.

CAP Results | 24Melaka, Malaysia | University Of Georgia Circularity Informatics Lab
Collection
Figure 7: Collection Point from Rumah sampah, Jalan Tun Mamat, Medan Selera Jalan Tun Ali
(Photo Credit: UKM)
It is estimated that more than 70% of the generated waste in Malaysia is collected using both curbside and communal centers, with a reported collection frequency varying from daily to every two days (Johari 2014). Source separating of household solid waste in Malaysia was made mandatory under the Solid Waste and Public Cleansing Management Act of 2007 (Act 672), which is currently enforced in the states and Federal Territories of Kuala Lumpur, Putrajaya, Johor, Melaka, Negeri Sembilan, Pahang, Kedah and Perlis (SWcorp 2020). A detailed flow chart of the solid waste collection process for Melaka can be found in the Appendix.
As of 2015, in Melaka and southern Malaysia, waste is collected by SWM Environment on a “2 + 1” collection frequen-cy schedule, where household residual waste collection is done twice a week while the recyclable waste and bulky waste collection are done once a week. Residual waste includes kitchen waste, food waste, contaminated materials, and disposable diapers. Recyclables that must be segregated include paper, plastic, bulky waste, and garden waste, and those that are separated must be neatly packed inside suitable plastic bags/containers and placed next to the trash bin on collection day (SWcorp 2020) (Figure 8 and 9a-b).

CAP Results | 25Melaka, Malaysia | University Of Georgia Circularity Informatics Lab
Figure 8: Guidance on Waste Types for Household Source Separation from kpkt.gov.my
Figure 9 a-b: Guidance on Household Waste Separation in English swm-environment.com and Malaysian provided by the city
(a)

CAP Results | 26Melaka, Malaysia | University Of Georgia Circularity Informatics Lab
(b)
Since 1997, SWM Environment, or the Solid Waste and Public Cleansing Management Corporation (SWCorp), has taken over the management of solid waste and public cleansing from the Local Authorities, working towards full privatization of solid waste management (discussed further in the End of Life section). They have over 8,000 staff, support 27 local authorities, manage over 1,600 collection vehicles and operate 27 workshops as well as depots ser-vicing over 5.1 million people across a geographical region of 27,560 sq. km. Infographics such as those in Figure 8 and Figure 9a-b are disseminated throughout communities in local languages to encourage proper segregation and disposal.

CAP Results | 27Melaka, Malaysia | University Of Georgia Circularity Informatics Lab
Figure 10: Map of Waste Bins identified in the city during litter transects
Figure 11: Zoomed-in version of waste receptables identified in three transect areas in Melaka
Based on the waste receptacles identified in the 1x1km2 areas during the litter transects, the LIP identified 57 waste bins (as shown in Figure 7), 7 informal dump sites (as shown in Figure 12), 1 informal recycling center, and zero public recycling bins. Of the 57 bins documented, only seven were overflowing with waste, and they were found in a com-bination of business areas and residential areas, some of which were regularly maintained and some of which were not. The average density of waste bins was around six bins per square kilometer, with two of the nine transect areas

CAP Results | 28Melaka, Malaysia | University Of Georgia Circularity Informatics Lab
having no public waste bins. There was also no documentation of public recycling bins available in any of the nine transect areas. It was noted in the informal recycling location that there was some contamination, mainly from paper boxes wrapped or coated in plastic.
Figure 12: Example of dump site in Kampung Bukit Baharu, Melaka
(Photo Credit: UKM)
End of Cycle
Since the passing of Act 672 in 2007, Malaysia has been going through a federalization and privatization process with its SWM. The Act began to be enforced in 2011 and includes clauses related to mandatory source separation, litter reduction, and fines and imprisonment for illegal dumping. It also aims to standardize SWM and public cleaning ser-vices across the country by privatizing collection and transportation services of household waste under the federal government, thereby reducing financial pressure on local authorities and governments. To support implementation of Act 672, the National Solid Waste Management Department (Jabatan Pengurusan Sisa Pepejal Negara — JPSPN) and the Solid Waste and Public Cleansing Management Corporation (SWCorp) were developed in Malaysia using the Solid Waste Management and Public Cleansing Corporation Act of 2007. JPSPN is responsible for proposing policies, plans, and strategies, while SWCorp is responsible for their enforcement. As part of Act 672, SWCorp took over the management of MSW from the local authorities and it is broken into three private concessionaires based on geographic region. Southern Waste Management Environment Sdn Bhd oversees the Southern states of Peninsular Malaysia, including the state of Melaka. However, not all of Malaysia has made the transition towards privatization, and policy development under Act 672 is more focused now on pressing topics such as illegal dumping prevention and increased recycling (Moh 2017).
CAP Results | 29Melaka, Malaysia | University Of Georgia Circularity Informatics Lab
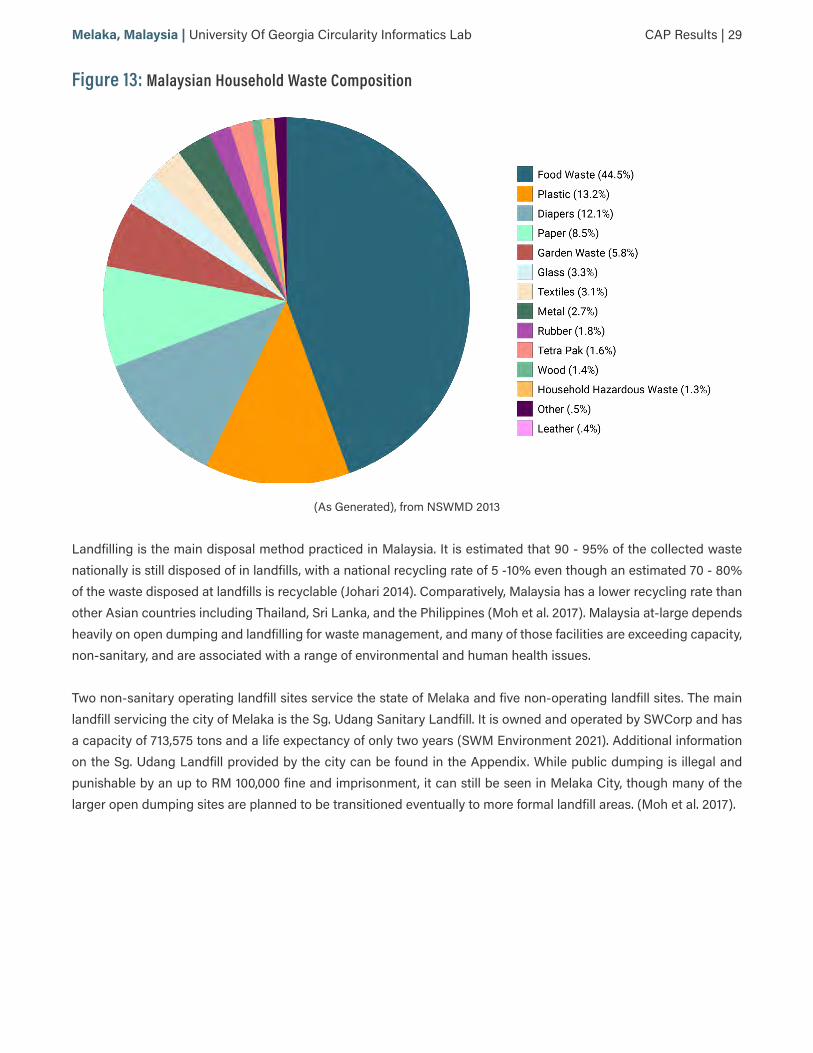
Figure 13: Malaysian Household Waste Composition
(As Generated), from NSWMD 2013
Landfilling is the main disposal method practiced in Malaysia. It is estimated that 90 - 95% of the collected waste nationally is still disposed of in landfills, with a national recycling rate of 5 -10% even though an estimated 70 - 80% of the waste disposed at landfills is recyclable (Johari 2014). Comparatively, Malaysia has a lower recycling rate than other Asian countries including Thailand, Sri Lanka, and the Philippines (Moh et al. 2017). Malaysia at-large depends heavily on open dumping and landfilling for waste management, and many of those facilities are exceeding capacity, non-sanitary, and are associated with a range of environmental and human health issues.
Two non-sanitary operating landfill sites service the state of Melaka and five non-operating landfill sites. The main landfill servicing the city of Melaka is the Sg. Udang Sanitary Landfill. It is owned and operated by SWCorp and has a capacity of 713,575 tons and a life expectancy of only two years (SWM Environment 2021). Additional information on the Sg. Udang Landfill provided by the city can be found in the Appendix. While public dumping is illegal and punishable by an up to RM 100,000 fine and imprisonment, it can still be seen in Melaka City, though many of the larger open dumping sites are planned to be transitioned eventually to more formal landfill areas. (Moh et al. 2017).

CAP Results | 30Melaka, Malaysia | University Of Georgia Circularity Informatics Lab
Figure 14: Locations of SWM Facilities (1, 2, and 3) in the state of Melaka
from JPSPN 2020
A survey conducted in 2013 showed that around 24% of Malaysian households interviewed said that they were un-aware of the recycling separation requirements. They cited the reasons shown in Figure 10 as to why they did not re-cycle, with the top response being that there was not enough space to store those recyclable items (Moh et al. 2017).
Figure 15: Reasons among Malaysians for not recycling
from Moh et al. 2017
The recycling rate at the household level has been estimated to be around 10% for Malaysia overall, and slightly higher (10.6%) in the southern region where Melaka is located (JPSPN 2020). The informal sector is also critical for

CAP Results | 31Melaka, Malaysia | University Of Georgia Circularity Informatics Lab
recycling in Malaysia, and Figure 13 demonstrates the national breakdown of the various forms of formal and infor-mal recycling and the composition of waste that they typically handle. Plastic is largely handled by the Scavenger/Street Collector/Waste Collection Worker category, followed closely by a category that is comprised exclusively of ‘Recyclers.’
Figure 16: Waste Sector “Players” Contributions to Recycling
from NSWMD 2013
In early 2021, the Malaysian Ministry of Housing and Local Government announced that it plans to release the re-quest for proposals (RFP) for a waste-to-energy project in Sungai Udang in the state of Melaka. This is one of six Waste-to-Energy (WtE) plants proposed for the country to be developed by the end of 2021 (Lim 2021). The original plan from the Melaka government was to spend around RM3.6 million to build a new WtE plant on a designated 3.84-hectare site which could receive 1,000 tons of solid waste daily and produce up to 25-megawatt of energy to service 25,000 households in the area (MalayMail 2020). This series of large incinerators have been proposed to ad-dress increasing concerns for dependence on over-capacity landfills and the prevalence of open dumping, though previous incinerator plants in Malaysia have been met with concerns. For example, the Ringgit Malaysia incinera-tor plant in Broga was adamantly opposed by the local community for over five years due to concerns over dioxin emissions until the government shut down the project in 2007 (Moh 2017). There is optimism for the newly proposed projects among government officials, but upstream interventions such as waste reduction, effective segregation, and processing of recyclables should be prioritized for sustainable SWM.

CAP Results | 32Melaka, Malaysia | University Of Georgia Circularity Informatics Lab
Leakage
Figure 17: Photos of the LIP conducting litter surveys in Melaka
(Photo Credit: UKM)
In total, 2,743 litter items were recorded across 25 100m2 transects in nine different square kilometer areas sampled between October 2020 and March 2021. Locations were selected using a stratified random sampling method, in which transects were randomly selected in nine square kilometers which were distributed across three groups of population count (upper, middle, lower) based on LandScan ambient population data. Litter items were recorded us-ing the open-source Marine Debris Tracker app. A full list of items available in the app and their associated material categories can be found in the Appendix.
Figure 18: Photos of litter items in Melaka from LIP
(Photo Credit: UKM)
Across all transects, the largest percentage by category of litter items was tobacco products, followed very closely by food plastic. Plastic fragments, paper, and other plastic comprised between 6% and 10%, while all other material cat-egories including PPE, metal, C&D materials, cloth, glass, personal care items, organics, e-waste, fishing gear, and

CAP Results | 33Melaka, Malaysia | University Of Georgia Circularity Informatics Lab
other waste formed 3% or less of the total litter count (Figure 16). The total percentage of common plastic items (the sum of food plastic, other plastic, PPE, plastic fragments, and personal care items) found was 49% of the total items.
Figure 19: Litter Material Breakdown for Melaka
When examining the litter characterization based on the population count, we see some distinctions can be seen between the three groups (Figure 17). Tobacco products comprised the majority in the middle and high population count areas, while food plastic was the top material type among litter in the low population count areas. However, tobacco products and food plastic were the top material categories by a large margin in all three. There were similar compositions seem for plastic fragments (8-13%%), paper (8-9%), and PPE (1-5%) litter among all three population count areas. The middle population count areas had higher proportions of C&D materials and other plastic materials than the lower or higher population count areas.

CAP Results | 34Melaka, Malaysia | University Of Georgia Circularity Informatics Lab
Figure 20: Proportion of most common plastic items in low (inner), mid (middle), and high (outer) population count areas
The upper population count areas had the highest litter density and the middle population count had the lowest, but there was not a very large margin between the middle and low count areas. In the high population count areas, cig-arettes were the most abundant item by a very high margin, nearly four times larger in count than the second most abundant item. It is important to note that the high population count areas correspond with areas that have some of the highest amounts of tourist presence and activity in the city. There was a similar pattern observed in medium population count areas, where cigarettes were the most abundant item and twice as high in count as the second most abundant item. In the low population count areas, plastic grocery bags and plastic bottles were unique among the top five items across the population count areas.
Table 6: Litter density and top litter items from all transects in Melaka
Population Tertile Top 5 Litter ItemsLitter Density
(count/m2)
Upper (2,609 – 29,469 persons/sq km)
1) Cigarettes, 2) Plastic Food Wrapper, 3) Straws, 4) Hard Plastic Fragments, 5) Paper
1.81

CAP Results | 35Melaka, Malaysia | University Of Georgia Circularity Informatics Lab
Population Tertile Top 5 Litter ItemsLitter Density
(count/m2)
Middle (621 – 2,608 persons/sq km)
1) Cigarettes, 2) Plastic Food Wrapper, 3) Straws, 4) Plastic String, Tape, or
Packing Straps, 5) Other Plastic0.99
Lower (49 – 620 persons/sq km)
1) Cigarettes, 2) Plastic Food Wrapper, 3) Plastic Grocery Bag, 4) Hard Plastic
Fragments, 5) Plastic Bottle1.10
Litter densities across other developing countries in South Asia typically range from 0.5 items/m2 to 15 items/m2, with an average of around 4-5 items/m2 (n = 40). The litter in Melaka is below the average values of those observed in South Asia, and also slightly lower than those found in a small island nation (1.8 items/m2) for the middle and low population count areas (Youngblood et al., In Preparation).

OpportunitiesWe recommend exploring the following opportunities to expand and enhance circularity in Melaka based on the find-ings of this report. These opportunities are categorized based on the seven spokes of the CAP model and are roughly listed based on the level of potential impact to reduce plastic waste in Melaka within each spoke. The purpose of the forthcoming Opportunity Assessment Workshop in Melaka as part of Urban Ocean is for the city to further prioritize these opportunities based on impact, feasibility, and cost. It is important to note that the opportunities listed below are individualized based on the findings, but solutions cannot happen in a vacuum and are most impactful when strategically combined within a holistic system framework.
INPUT
• Plastic food wrappers rank high for litter items in each population count area — there is an opportunity to bring the stakeholders such as brand parent companies and manufacturers to have informed discussions about packaging and waste management.
• Particularly for the beverage and candy product manufacturers that are located within 550km of Melaka City, there are key opportunities for EPR.
COMMUNITY
• Barriers to effective waste management in Melaka include fragmented communication between the govern-ment, industries, and citizens, little distinction between awareness campaigns and local policies, logistical dis-crepancies in waste collection frequency and processing capacity, as well as a lack of community and tourist awareness. These should all be addressed in the Urban Ocean Opportunity Assessment with the intention of planning for solutions to tackle each.
• There may be opportunities to build on national-level awareness campaigns and develop hyper-local messag-ing for residents of Melaka to raise public awareness on plastic pollution and the value of certain ‘trash’ items.
• The city should continue to monitor the success of and expand upon public awareness and cleanliness activi-ties outlined in the Comprehensive Action Plan of Solid Waste Management 2015–2020.
• As a World Heritage Site, Melaka City seems to have a relatively high awareness of issues related to single-use plastic and solid waste management. This UN designation could be used to help amplify and carry litter aware-ness to the community and tourist's messages in a synergistic way.
• Information given to tourists about the city could contain guidance and reminders about how to manage waste properly.
• Laws and policies are in place, particularly around segregation of household waste and reducing illegal dump-ing, but are reportedly not always effective or fully implemented. This provides an excellent opportunity to dis-cuss various methods of support and enforcement of existing laws.
36 | Opportunities

Opportunities | 37Melaka, Malaysia | University Of Georgia Circularity Informatics Lab
• The city may want to explore opportunities for policies and incentives that would increase the availability and decrease the cost of alternatives to single-use plastic or refillable/reusable options, particularly for to-go items that need to be transported.
PRODUCT DESIGN
• The vast majority of convenience items were packaged in multi-layer plastic film, which is difficult to recycle and easily escapes the waste stream.
• Beverage products from convenience stores were packaged in either PET or aluminum, which are highly recy-clable. Partnerships could be developed to ensure that the connection is made between stores, consumers, and recycling companies, either through deposit schemes, incentives, messaging, or otherwise to maximize collection of those recyclable items.
USE
• The city may want to explore opportunities for policies and incentives that would increase the availability and decrease the cost of alternatives to single-use plastic or refillable/reusable options, particularly for to-go items that need to be transported.
COLLECTION
• As public awareness around recyclable materials grows, adding public recycling bins and increasing the pres-ence of traditional waste bins in rural areas may be beneficial. It may also be useful to include private and household recycling bins as well as community-centric sites for collection of recyclables.
• Along with source segregation and waste categorization, the city may want to have designated waste collection trucks that correspond to those categories to maximize collection.
• Cigarettes may be littered (and the top litter item across all three population count areas) because people don’t realize they are waste plastic. A proper disposal bin and messaging could encourage the use of bins/cigarette containers.
END OF CYCLE
• While infrastructure investment can be costly, it may be beneficial for the ongoing trend of transitioning open dumpsites to landfills, and of transitioning non-sanitary landfills to sanity, may be useful to explore for the state of Melaka to increase their capacity to handle solid waste.
• As the majority of the waste stream is organic matter, it would be useful for the city to conduct a feasibility study on implementing composting infrastructure and programs.
• Increase the number of public trash and recycling bins in areas with higher litter rates and less bin availability.• Equal levels of investment should be made in infrastructure at the end of the cycle as upstream in order to con-
tain and treat the waste destined for landfills, particularly in the Melaka State area. However, incineration should be employed as a last resort for waste management, and interventions should still be supported that reduce waste production, increase segregation, and increase recycling rates should be prioritized.

Opportunities | 38Melaka, Malaysia | University Of Georgia Circularity Informatics Lab
LEAKAGE
• Although there is still leakage, Melaka City could be an example city as well to demonstrate an urban and tour-ist-driven area where litter is minimal compared to other places in a similar context, and share with others how waste is collected and managed to minimize litter.
• Since cigarettes were the top litter item found in the city, public campaigns to reduce litter and waste leakage should be targeted at those products to create meaningful change.
• Melaka could design trash traps in the Melaka river to stop plastic leakage into the water stream.

ReferencesBritannica, T. Editors of Encyclopaedia (2008, July 22). Melaka. Encyclopedia Britannica. https://www.britannica.com/place/Melaka-Malaysia
DOSM (2020). Department of Statistics, Malaysia - Malaysia @ A Glance: Melaka. https://www.dosm.gov.my/v1/index.php?r=column/cone&menu_id=TmlOYTJZTEJJZXg5QUZQMUxrRVFKUT09#:~:text=Melaka%20%40%20a%20Glance%20%20%20%20,%20%200.46%20%2022%20more%20rows%20
Johari, A., Alkali, H., Hashim, H., Ahmed, S. I., & Mat, R. (2014). Municipal Solid Waste Management and Potential Revenue from Recycling in Malaysia. Modern Applied Science, 8(4). https://doi.org/10.5539/mas.v8n4p37
JPSPN (National Solid Waste Management Department). National Strategic Plan for Solid Waste Management. Retrieved July 30, 2020. https://jpspn.kpkt.gov.my/index.php/pages/view/55
Lim, M., Ang, K., Abdul Razak, F. (2021). Malaysia: Sungai Udang Waste-to-Energy Project RFP. Global Compliance News. https://www.globalcompliancenews.com/2021/03/04/malaysia-sungai-udang-waste-to-energy-project-rfp-24022021/
MalayMail (2020). Govt targets six waste-to-energy plants by 2021, says minister. https://www.malaymail.com/news/malaysia/2020/07/03/govt-targets-six-waste-to-energy-plants-by-2021-says-minister/1881154
Ministry of Energy, Science, Technology, Environment & Climate Change (MESTECC) (2018). Malaysia’s Road Map Towards Zero Single-Use Plastics 2018 - 2030: Towards a Sustainable Future. 2018. https://www.mestecc.gov.my/web/wp-content/uploads/2019/03/Malaysia-Roadmap-Towards-Zero-Single-Use-Plastics-2018-20302.pdf
Moh, Y., A. M. L. (2017). Solid waste management transformation and future challenges of source separation and recycling practice in Malaysia. Resources, Conservation & Recycling, 116, 1–14. https://doi-org.proxy-remote.galib.uga.edu/10.1016/j.resconrec.2016.09.012
National Solid Waste Management Department (NSWMD) (2013). Survey on Solid Waste Composition, Character-
39 | References

References | 40Melaka, Malaysia | University Of Georgia Circularity Informatics Lab
istics & Existing Practice of Solid Waste Recycling in Malaysia. https://jpspn.kpkt.gov.my/resources/index/user_1/Sumber_Rujukan/kajian/Final_Report_REVz.pdf
Separation at Source (SAS) by Solid Waste Corporation (SWCorp). (2020). https://www.kpkt.gov.my/separationat-source/en/
SWM Environment (2021). Landfill Management. SWM / SWCorp website. https://www.swm-environment.com/what-we-do/landfill-management/index.html
UEMI (2021). UEMI in Malaysia - Project of UN Habitat. http://www.uemi.net/melaka---malaysia.html
Yusop, Y. M., Othman, N. (2019). Linking the Malaysia’s Solid Waste Management Policy Instruments with House-hold Recycling Behavior. International Journal of Academic Research in Progressive Education and Development, 8(4), 474–488.
Youngblood, Y., Brooks, A., Das, N., Singh, A., Nigar, M., Verma, G., Zakir, T., Duncan, E., Khatoon, H., Maddalene, T., Napper, I., Nelms, S., Patel, S., Jambeck, J. (In Preparation). Characterizing litter in communities along the Ganges River: An ambient population-based method for surveying active input.

AppendixFigure 21: Litter Densities in Melaka (population counts are shaded in gray)
Average Litter Density in Sq Km (items/sq m) .25.25 - .5.5 - 11 - 1.5 > 1.5
Litter Denisty for Transect (items/m)< .25.25 - .5.5 - 11 - 1.5 > 1.5
Upper population count (36,568 - 77,275 persons/sq km)
Mid population count (13,910 - 36,568 persons/sq km)
Lower population count (740 - 13,910 persons/sq. km)
41 | Appendix

Appendix | 42Melaka, Malaysia | University Of Georgia Circularity Informatics Lab
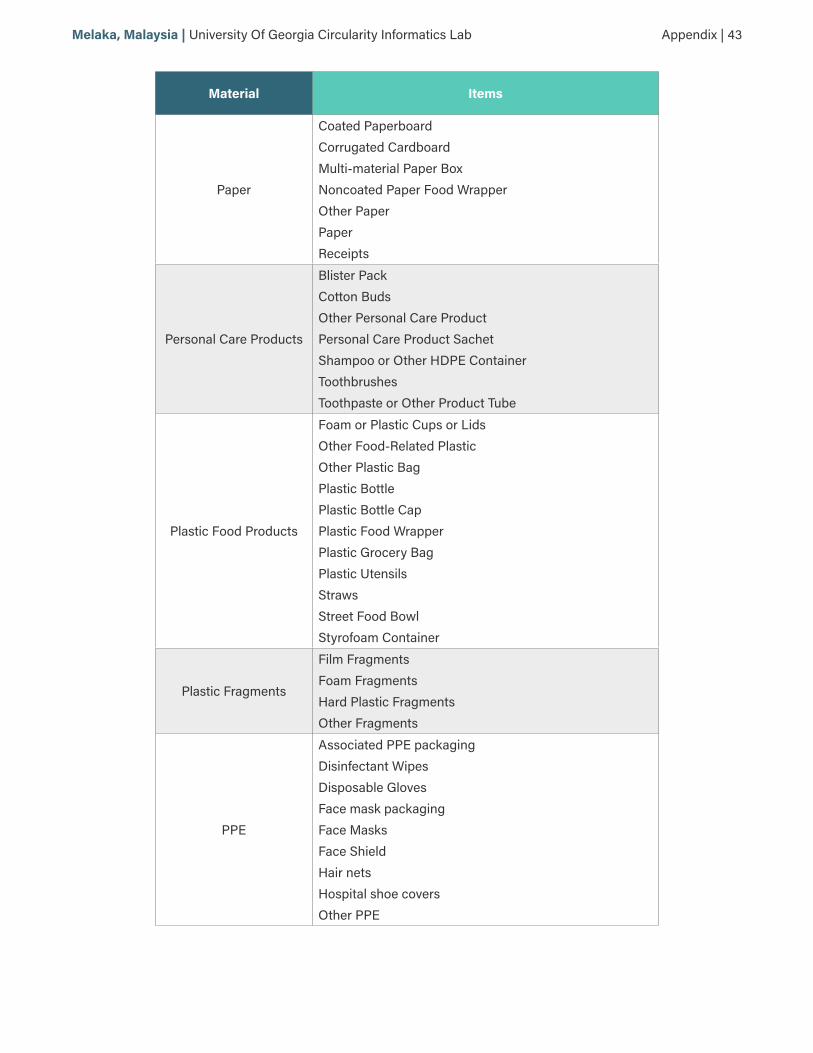
Table 7: Full List of MDT Litter Items and Associated Material Categories
Material Items
C&D Materials
Aggregate & Brick Bolts, Nails, and Screws Building Materials Lumber Other C&D
ClothClothing Fabric Pieces Other Cloth
E-WasteBatteries E-Waste Fragments Other E-Waste
Fishing Gear
Buoys and Floats Fishing Line Other Fishing Gear Plastic Net or Net Pieces Plastic Rope
GlassGlass Bottle Glass or Ceramic Fragments Other Glass
Metal
Aluminum Foil Aluminum or Tin Cans Metal Bottle Caps or Tabs Metal Fragments Other Metal
Organic WasteFood Waste Other Organic Waste
OtherOtherPopsicle Stick
Other Plastic Products
Bulk Bags Flip Flops Other Plastic Plastic String, Tape, or Packing Straps Rubber Bands Tires
Appendix | 43Melaka, Malaysia | University Of Georgia Circularity Informatics Lab
Material Items
Paper
Coated Paperboard Corrugated Cardboard Multi-material Paper Box Noncoated Paper Food Wrapper Other Paper Paper Receipts
Personal Care Products
Blister Pack Cotton Buds Other Personal Care Product Personal Care Product Sachet Shampoo or Other HDPE Container Toothbrushes Toothpaste or Other Product Tube
Plastic Food Products
Foam or Plastic Cups or Lids Other Food-Related Plastic Other Plastic Bag Plastic Bottle Plastic Bottle Cap Plastic Food Wrapper Plastic Grocery Bag Plastic Utensils Straws Street Food Bowl Styrofoam Container
Plastic Fragments
Film Fragments Foam Fragments Hard Plastic Fragments Other Fragments
PPE
Associated PPE packaging Disinfectant Wipes Disposable Gloves Face mask packaging Face Masks Face Shield Hair nets Hospital shoe covers Other PPE

Appendix | 44Melaka, Malaysia | University Of Georgia Circularity Informatics Lab
Material Items
Tobacco Products
Cigarette Packaging Cigarettes Other Tobacco Product Tobacco Sachets
Table 8: Parent Companies of Top Convenience Items in Melaka
Manufacturer Location
Angene Sdn Bhd Batu Bahat, Johor, Malaysia
Dunhill Tobacco of London Limited United Kingdom
F&N Beverags Shah Alam, Selangor, Malaysia
Global Point Foods Industries Sdn Bhd Shah Alam, Selangor, Malaysia
Guangdong Chaoan Wanbao Foodstuff Co., Ltd Chaozhou, Guangdong, China
HEUSCHEN & SCHROUFF The Netherlands
JTI SA, Switzland Genève, Switzerland
Khee San Food Industries Sdn Bhd Seri Kembangan, Selangor, Malaysia
Lactails Trading Malaysia Sdn Bhd Wilayah Pesekutuan, Malaysia
Mamee Double Decker sdn Bhd Subang Jaya, Selangor, Malaysia
Mondelez International, Inc Deerfield, IL
Nestle Vevey, Switzerland
Oriental Food Industries Sdn Bhd. Air Keroh Industrial Estate, Melaka, Malaysia
Perfelti Van Melle Lainate, Italy
PT MAYORA INDAH Tbk. Jakarta, Indonesia
T.C. Pharmaceutical Industries co. ltd Pranchinburi, Thailand
Wise Foods Inc Berwick, Pennsylvania
Wrigley Company Chicago, IL

Appendix | 45Melaka, Malaysia | University Of Georgia Circularity Informatics Lab
Table 9: Manufacturers of Top Convenience Items in Melaka
Manufacturer Location
Angene Sdn Bhd Batu Bahat, Johor, Malaysia
BJC Foods (Malaysia) Sdn. Bhd Shah Alam, Selangor, Malaysia
F&N Beverags Manufacturing sdn Bhd Shah Alam, Selangor, Malaysia
Global Point Foods Industries Sdn Bhd Shah Alam, Selangor, Malaysia
Guangdong Chaoan Wanbao Foodstuff Co., Ltd Chaozhou, Guangdong, China
JTI Asia Manufacturing Corp. Philippines
Khee San Food Industries Sdn Bhd Seri Kembangan, Selangor, Malaysia
Kilang Makanan Mamee Sdn Bhd Air Keroh Industrial Area, Melaka, Malaysia
Mars Wrigley Confectionary (china) Limited, Yonghe Branch Getdd Guangzhou, P.R. China
Mondelez International (Thailand) Sdn. Bhd Chalongkrung Road, lamplatiew, lad krabang, Thailand
Nestle Product Sdn Bhd Petaling Jaya, Selangor, Malaysia
Oriental Food Industries Sdn Bhd. Air Keroh Industrial Estate, Melaka, Malaysia
Pacific Food Product Sdn Bhd Air Keroh Industrial Estate, Melaka, Malaysia
Petaling Jaya Dairy Sdn Bhd Petaling Jaya, Selangor, Malaysia
PT MAYORA INDAH Tbk. Jakarta, Indonesia
PT. Perfelti Van Melle Indonesia Bogor, Indonesia
T.C. Pharmaceutical Industries co. ltd Pranchinburi, Thailand
URC SNACK FOODS (MALAYSIA) Pasir Gudang, Johor, Malaysia
Additional Information on Plastics
The following is an except of the testimony given my Dr. Jenna Jambeck to the US House of Representatives October 29, 2019.
"Marine debris has been recognized as a contamination issue for more than 50 years1 but the laser-focus on plastic has
occurred just in the past 5-7 years. Plastic completely changed our world after its expanded use in World War II, and global
annual plastic production has increased from 1.7 million metric tons/yr in 1950 to 360 million metric tons/yr (not including
polyester fibers) in 2019.2 Along with a steep increase in production, we have seen a resulting increase in plastic in the
1. Ryan, P. (2015). A Brief History of Marine Litter Research, in Marine Anthropogenic Litter, Bergmann et al. (eds.), Springer, New York, NY.2. Plastics Europe, https://www.plasticseurope.org/application/files/9715/7129/9584/FINAL_web_version_Plastics_the_facts2019_14102019.pdf

Appendix | 46Melaka, Malaysia | University Of Georgia Circularity Informatics Lab
waste stream from 0.4% in 1960 (in the US) to 12% in 2020 (current global average by mass). All traditional plastics do not
biodegrade, but only fragment into smaller, ultimately microscopic or nanoscopic, pieces. A cumulative 8.3 billion metric
tons of plastic has been produced since 19503. Since approximately 40% of plastic is used for packaging and single use
items, this means that 6.4 billion metric tons has become waste by 2015 (Figure A)6. Globally, on average, we have recy-
cled only about 9% of plastic, with 12% recycled and 79% ending up in our landfills or in the environment. With cumulative
quantities projected to reach 34 billion metric tons of production and 12 billion metric tons of waste, the management of
plastic in the waste stream is only continuing to grow.6"
Figure 22: Global Materials Flow of Plastic6
Polymers that make up the plastics that we commonly encounter are listed in Table 1. But plastics also contain ad-ditives to alter color, texture, shape, form, antimicrobial surfaces, make it flame retardant, and for other properties.4 The wide variety of available additives results in thousands of different plastic material compounds for particular pur-poses, creating a diverse array of plastic materials that end up in our trash, which can make recovery and recycling challenging (Table A).5
3. Geyer, R., Jambeck, J.R., Lavender Law, K. (2017). Production, use, and fate of all plastics ever made, Science Advances, 19 Jul 2017, Vol. 3, no. 74. Additives have been mixed into plastic compounds since they have been in the consumer market: Deanin, R.D. (1975). Additives in plastics, Environmental Health Perspectives, 11: 35-39.5. https://www.epa.gov/sites/production/files/2018-07/documents/smm_2015_tables_and_figures_07252018_fnl_508_0.pdf
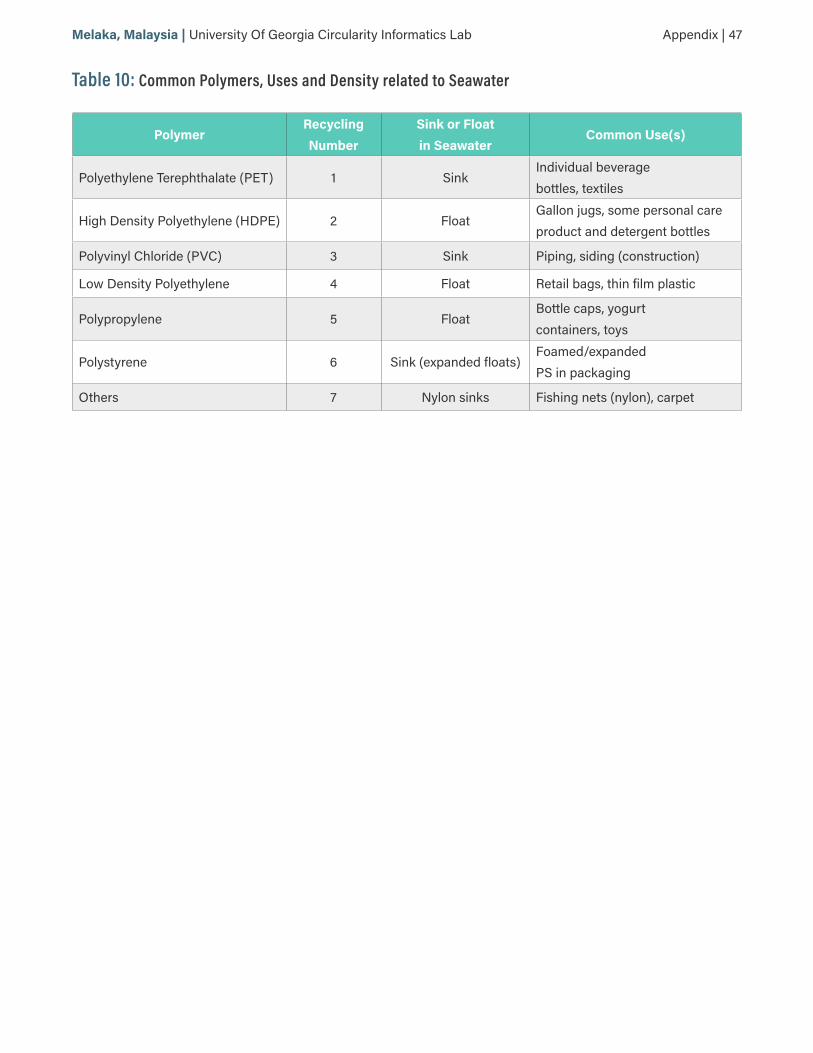
Appendix | 47Melaka, Malaysia | University Of Georgia Circularity Informatics Lab
Table 10: Common Polymers, Uses and Density related to Seawater
PolymerRecycling Number
Sink or Float in Seawater
Common Use(s)
Polyethylene Terephthalate (PET) 1 SinkIndividual beverage bottles, textiles
High Density Polyethylene (HDPE) 2 FloatGallon jugs, some personal care product and detergent bottles
Polyvinyl Chloride (PVC) 3 Sink Piping, siding (construction)
Low Density Polyethylene 4 Float Retail bags, thin film plastic
Polypropylene 5 FloatBottle caps, yogurt containers, toys
Polystyrene 6 Sink (expanded floats)Foamed/expanded PS in packaging
Others 7 Nylon sinks Fishing nets (nylon), carpet

Appendix | 48Melaka, Malaysia | University Of Georgia Circularity Informatics Lab
Waste Collection Process
A summary of the waste collection process in Melaka is provided in Figure B, below.
Figure 23: Overview of the waste collection and management processes as reported by the City of Melaka

Appendix | 49Melaka, Malaysia | University Of Georgia Circularity Informatics Lab
Sungai Udang Landfill (Further Information)
Landfill
• Sungai Udang sanitary landfill consists of 64 acre land area, include 2km road from main road.• Disposal site cell — 42 acre
Waste Capacity and Land Area

Appendix | 50Melaka, Malaysia | University Of Georgia Circularity Informatics Lab
• Landfill area designed to cater up to 950 ton/day of solid waste for the entire Melaka.• Total solid waste disposal cell — 1, 669, 960 ton.• Current usage until 1st January 2020 — 321, 000 ton (20% of total land area).• The cell is predicted will fully occupied in 1st March 2024.
END OF DOCUMENT