circus and zoo animal welfare in sweden: an
TRANSCRIPT

This is an author produced version of a paper published in Animal welfare. This paper has been peer-reviewed but may not include the final publisher proof-corrections or pagination.
Citation for the published paper: Hitchens, P.L., Hultgren, J., Frössling, J., Emanuelson, U., Keeling, L.J.,. (2017) Circus and zoo animal welfare in Sweden: An epidemiological analysis of data from regulatory inspections by the official competent authorities. Animal welfare. Volume: 26, Number: 4, pp 373-382. http://dx.doi.org/10.7120/09627286.26.4.373.
Access to the published version may require journal subscription. Published with permission from: Universities Federation for Animal Welfare.
This author manuscript is published here with permission from Universities Federation for Animal Welfare, under a CC-BY-NC-ND license.
Epsilon Open Archive http://epsilon.slu.se

1
Circus and zoo animal welfare in Sweden, assessed using existing official animal welfare control data
Peta L. Hitchens1*, Jan Hultgren2, Jenny Frössling2,3, Ulf Emanuelson4, and Linda J. Keeling1
1 Swedish University of Agricultural Sciences (SLU), Department of Animal Environment and Health, Box 7068, 750 07 Uppsala, Sweden 2 Swedish University of Agricultural Sciences (SLU), Department of Animal Environment and Health, Box 234, 532 23 Skara, Sweden 3 National Veterinary Institute, SVA SE-751 89 Uppsala, Sweden 4 Swedish University of Agricultural Sciences (SLU), Department of Clinical Sciences, Box 7054, 750 07 Uppsala, Sweden * Corresponding Author; E-mail: [email protected] Abstract Multi-facility epidemiological studies assessing associations between animal-based measures and resource- and management-based measures at circuses and zoos are needed because of the relatively low numbers of each species kept at each facility, but these can be difficult to carry out. Existing data from official animal welfare control could be the answer to some of these problems. In this paper we report the analysis of these data for circus and zoo animals in Sweden for 2010 to 2014. There were 42 inspections of 38 circuses and 318 inspections of 179 zoos. For animal-based measures at routine inspections of circuses and zoos, respectively, 9.1 and 14.3% did not comply with requirements for general care of hooves/claws and coat, 10.0 and 8.6% for body condition, and 0 and 1.7% for cleanliness. In addition, the zoo checklist assessed whether animals were kept in groups as appropriate, finding non-compliance in 17.0% of inspections. The most frequent non-compliances with resource- and management-based measures at routine inspections of circuses were 41.7% for space and 38.5% for exercise requirements. For zoos, 29.4% did not comply with space followed by 28.8% for enrichment requirements. In multivariable analysis of data pertaining to zoos, facilities that had inadequate or unsafe housing and space design, nutritional requirements that were not met, or inadequate bedding materials were more likely to be non-compliant with at least one of the animal-based measures. The checklists should be improved to better capture animal-based welfare outcomes, and benchmarking of risk and trends over time is recommended. Keywords: animal-based measures, animal welfare, circus, epidemiology, legislation, zoo Introduction The welfare of animals has become increasingly important in today’s society. Circuses and zoos are in the spotlight, with animal welfare scientists increasing their efforts to assess the welfare of animals kept under these conditions (Whitham & Wielebnowski 2013). The World Association of Zoos and Aquariums (WAZA) encourages its members to implement policies and procedures that exceed the national minimum legal standards. WAZA now have a new welfare strategy, based on promoting zoos and aquariums as centres for animal welfare (Mellor, et al. 2015). This strategy promotes application of a model based on the ‘Five Domains’ (Mellor & Beausoleil 2015). The ‘Five Domains’ model is an expansion of earlier models that includes assessment of both positive and negative states of animal welfare. It explains how the physical and functional domains (nutrition, environment, physical health, behaviour) bring about positive and negative experiences within the fifth domain (mental or affective state), combining to give the welfare status of the animal (Mellor & Beausoleil 2015, Mellor, et al. 2015). Advances in animal welfare science have pointed to animal-based measures (i.e. physical, behavioral, and mental) being key (Carlstead, et al. 2013, EFSA Panel on Animal Health and Welfare 2012), though historically, assessment of animal

2
welfare has involved recording a combination of resource- and management-based measures (Hubbard & Scott 2011). Resource- and management-based measures are important in order to identify risk factors that are associated with poor animal welfare in epidemiological analyses (EFSA Panel on Animal Health and Welfare 2012), but they do not indicate the welfare status of the animal. The issue here is that in circuses and zoos the number of animals of each species is often too small to conduct sufficiently powered epidemiological studies for identification of risk factors. Thus multi-facility epidemiological studies using animal-based welfare measures are advocated, for example as carried out in the Elephant Welfare Project (Carlstead, et al. 2013), but such studies can be difficult to implement, not least because of the lack of standardised animal-based measures. In Sweden, the Swedish Board of Agriculture (Jordbruksverket; JV) requires that all operations using animals in performances at circuses, variety shows or other public entertainment (from here on in referred to as ‘circuses’) and at zoological parks and gardens or public exhibitions (‘zoos’) be registered and inspected. Inspections according to standardised checklists are conducted by official animal welfare control inspectors on behalf of the County Administrative Boards and results have been recorded in a database since 2009. These checklists contain control points (CPs) that cover the minimum standards regarding how animals should be kept and managed, as outlined by the Animal Welfare Act (1988) and the Animal Protection Ordinance (1988). Circuses and zoos may display animals similar to each other, however in circuses certain species (e.g. monkeys, exotic predators) are not permitted to perform (Djurskyddsförordning 1988). Circuses on tour are required to be inspected every year (Djurskyddsmyndigheten 2007), and those that are not touring come under regulations for the appropriate domestic or production animal species or under the regulations for exotic and non-domesticated animals in zoos (Djurskyddsmyndigheten 2004). This study describes five years of data on assessment of resource-, management- and animal-based measures at circuses and zoos in Sweden. We identify measures for which non-compliance is most frequently found, detect correlated measures, discuss the adequacy of current animal-based measures, and provide evidence that continued recording of data could be used in future epidemiological studies to identify risk factors for poor circus or zoo animal welfare. Methods Data sources Complete data from official animal welfare controls in all 21 counties of Sweden from 1 January 2010 to 31 December 2014 were provided by JV. The official animal welfare control database consists of data from standardised checklists and has been detailed previously (Hitchens et al., submitted). Data pertaining to compliance with legislative requirements for animals used in circuses and zoos (Djurskyddsmyndigheten 2004, Djurskyddsmyndigheten 2007) were extracted from this database for analysis. The data were collected by trained inspectors (n=26 inspectors at circuses; n=96 inspectors at zoos), employed by the County Administrative Boards, during inspections of premises that keep animals (control sites) according to Regulation (EC) 882/2004. There were 18 control points (CP) on the circus checklist (Supplementary Table 1) and 31 CPs on the zoo checklist (Supplementary Table 2). We categorised CPs related to the physical state of the animals and their provision of social contact (i.e. group housing for birds and mammals) as animal-based (circus CP-3 to 5; zoo CP-4 to 7). CPs that related to the holding of a permit for commercial operation, sufficiency of personnel, supervision, care, enrichment, conditions during performance, documentation, buildings and accommodation, feed and water, veterinary care, and other deficiencies, were categorised as resource- and management-based measures of welfare. For each of the CPs, the inspection result was recorded as compliant, non-compliant, no control carried out, or not applicable.

3
Data specific to each circus and zoo included its location, information on the type of animal species kept and any other animal-related activities conducted at the site besides the keeping of animals for performance or display. We calculated the total number of different animal-related activities. We had intended also to calculate the total number of animal species, but we did not have information on each individual exotic species. However, because most circuses and many zoos do not keep exotic animals (e.g. petting zoos), we did calculate the total number of domestic and production animal species at the site. We analysed data specific to each inspection including the year of inspection and the control type (reason for inspection). Control type was categorised into four groups: (1) normal or routine inspections, that included circuses and zoos selected based on random sampling, risk of non-compliance, or directed by the County Administrative Board; (2) complaint inspections, which were conducted as a result of complaint by e.g. a veterinarian or the general public; (3) follow-up inspections, including return visits to check on deficiencies identified at previous inspections; and (4) application inspections, which were related, for example, to an application for a permit to conduct a commercial activity. Statistical analysis To investigate associations between the animal-based CPs and other potential risk factors, including the resource- and management-based CPs, we conducted univariable logistic regressions. Odds ratios (OR) and their 95% confidence intervals (CI), adjusting for clustering on circus or zoo (to account for multiple inspections), are presented. The level of statistical significance was set at 5%. For this analysis, we created an aggregate animal-based measure as the binary outcome in the models: (0) if the inspection complied with all controlled animal-based CPs or (1) if the inspection did not comply with one or more of the animal-based CPs. We conducted a power analysis to estimate how many years of data would be required in order to produce a multivariable model for the circus and zoo data. For the zoo data only, risk factors from univariable analyses with 20% statistical significance or less were entered into a multivariable model using backward stepwise elimination and retained if they were statistically significant at 5%. Linearity for continuous variables was assessed by generating Box-Tidwell power transformations. Model diagnostics conducted included the Hosmer-Lemeshow's goodness-of-fit test, link test, and variance inflation factor (VIF<10). We also performed a principal component analysis (PCA) to investigate whether the resource- and management-based CPs were correlated, and to identify groups of key composite variables. We obtained pairwise tetrachoric correlation estimates of the binary compliance data (0=compliant; 1=non-compliant)(Edwards & Edwards 1984), and then conducted the PCA on the correlation matrix (StataCorp 2013). The scree test, Kaiser criterion and proportion of variance were used to determine the number of meaningful principal components. A varimax orthogonal rotation was used to maximise the sum of variances of the squared loadings (Kaiser 1958). Absolute value loadings greater than 0.30 were considered for inclusion on the component. Statistical analyses were conducted using Stata, version 13.1 (StataCorp, College Station, Texas, USA). Results Site and inspection characteristics A total of 52 circuses and 224 zoos were registered with the Swedish Board of Agriculture. During the 4-year study period, there were 42 inspections at 38 (73.1%) of the registered circuses and 318 inspections at 179 (79.9%) of the registered zoos. The reasons for inspections were normal (n=14 and 61; circus and zoo animal inspections, respectively), because of a complaint (n=11 and 89), follow-up on deficiencies identified at a previous inspection (n=6 and 55), and application for a permit

4
to conduct commercial activities (n=11 and 113). Multiple inspections were conducted on some control sites over the four years; there was one inspection at 35 circuses and 117 zoos, two inspections at 2 circuses and 35 zoos, three inspections at one circus and 13 zoos, and four or more inspections at 14 zoos. Descriptors of all control types are presented in Table 1. In addition to the keeping of circus animals, other activities reported to be conducted at circuses were the keeping (n=6) or selling (n=1) of companion animals, the keeping of horses used professionally (n=3) or for leisure purposes (n=1), and transporting animals other than when moving locations during a circus tour (n=3). The most frequently reported activities at zoos, apart from the keeping of zoo animals, included public demonstrations or exhibitions (n=231), an animal park (n=43) or wildlife reserve (n=21), the keeping of poultry (n=36) or animals for meat production (n=33), the keeping (n=31) or selling (n=8) of companion animals, keeping horses used professionally (n=13) or for leisure purposes (n=27), transporting animals (n=9) and education (n=5). Non-compliance at inspections Supplementary Tables 1 and 2 present the outcome of all official animal welfare controls of circuses and zoos, respectively. For normal (routine) inspections only (i.e. those that were not follow-up or due to a complaint) and at circuses and zoos respectively, 9.1% and 14.3% did not comply with requirements for general care of hooves/claws and coat of the animals, 10.0% and 8.6% for the animals’ body condition, and 0% and 1.7% for their cleanliness. In addition, the zoo checklist assessed whether social contact was appropriate or not, finding 17.0% non-compliant inspections. Using the results from all visits, we found no correlation between these animal-based measures for circuses, but a strong correlation between non-compliance with three of the four animal-based measures (general care, body condition, and cleanliness) at zoos (rho=0.66-0.77, P < 0.05). The most frequent non-compliances with resource- and management-based control points in circuses during normal (routine) inspections were for space (41.7%), exercise (38.5%), and transport (16.7%) requirements. For zoos, 29.4% of normal (routine) inspections did not comply with space requirements, followed by non-compliance with enrichment (28.8%), and enclosure design to minimise the risk of injury (16.0%). Each checklist has a CP for ‘other deficiencies’ (circuses CP-18, zoo CP-31) that did not relate to any of the other more detailed CPs that had to be checked. Six other deficiencies were identified during circus inspections and 61 other deficiencies during the zoo inspections. For circuses these related to non-disclosure of all animal species being exhibited, environmental enrichment (a CP that is included in assessments of zoos, but not circuses), and animal-based welfare measures such as aggression and behavioural problems. For zoos, inspectors provided additional details for only 26 (42.6%) of the 61 other deficiencies. This is because comments in the database were not compulsory before 2012. However, the types of other deficiencies that were recorded on multiple occasions at zoos included lack of permanent identification of animals (e.g. tags, brands), activities conducted or species obtained that had not been authorised by JV, lack of documentation on species, their maintenance procedures and inadequate biosecurity precautions. Power analysis We conducted a power analysis to determine whether we had sufficient data to identify risk factors for poor welfare at circuses and zoos in a multivariable logistic regression model. Based on the mean compliance results for the resource- and management based control points, and using a conservative estimate, we assumed that the probability of the inspection being non-compliant with at least one of the animal-based CPs when the risk factor is at the mean was 10% and one standard

5
Table 1. Descriptors of circuses and zoos inspected as part of official animal welfare control, Sweden in 2010-2014, stratified by type of inspection Normal Complaint Monitoring Application1 Total2
Directed Risk Random Unwarranted
Veterinarian, general public, other
Previous normal
Previous notification
Circus Public exhibition
Circuses Inspections (n) 11 2 1 7 4 5 1 9 1 42 Control sites (n) 11 2 1 7 4 5 1 8 1 383 Inspections per site
median (IQR)
1 (1-1)
1 (1-1)
1 (1-1)
1 (1-1)
1 (1-1)
1 (1-1)
1 (1-1)
1 (1-1)
1 (1-1)
1 (1-1)
Species per site4 median (IQR) 2 (1-4) 1 (1-1) 3 (3-3)
1 (1-2) 1.5 (1-2.5)
1 (1-1) 1 (1-1)
1.5 (0-3) 5 (5-5) 2 (1-3)
Activities per site
median (IQR) 1 (1-1) 1 (1-1) 1 (1-1)
1 (1-2) 1 (1-1.5)
1 (1-1) 1 (1-1)
1 (0-1.5) 1 (1-1) 1 (1-1) Zoos Inspections (n) 44 16 1 37 52 26 29 - 109 318 Control sites (n) 40 13 1 29 42 21 17 - 87 1793 Inspections per site
median (IQR) 1 (1-1) 1 (1-1) 1 (1-1) 1 (1-1) 1 (1-1)
1 (1-1) 1 (1-2)
- 1 (1-1) 1 (1-1) Species per site4
median (IQR) 2.5 (1-5) 4.5 (2-
9) 3 (3-3)
2 (1-5) 1 (1-4)
4 (1-8) 3 (1-4)
- 3 (1-6) 3 (1-6) Activities per site
median (IQR) 1 (1-1) 1.5 (1-
2) 1 (1-1)
1 (1-1) 1 (1-2)
1 (1-1) 1 (1-2)
- 1 (1-2) 1 (1-2) For continuous variables, the median and interquartile range (IQR) are presented. 1 Application to JV to conduct a circus event or public exhibition 2 Total includes inspection types that have not been detailed here – Application for an operating permit (circus, n=1; zoo, n=1) and other public inspection (zoo, n=3). 3 The row total does not equal the total number of premises because multiple inspections were conducted at the same premises for differing reasons. 4 Only information on domestic and production animal species are collected.
6
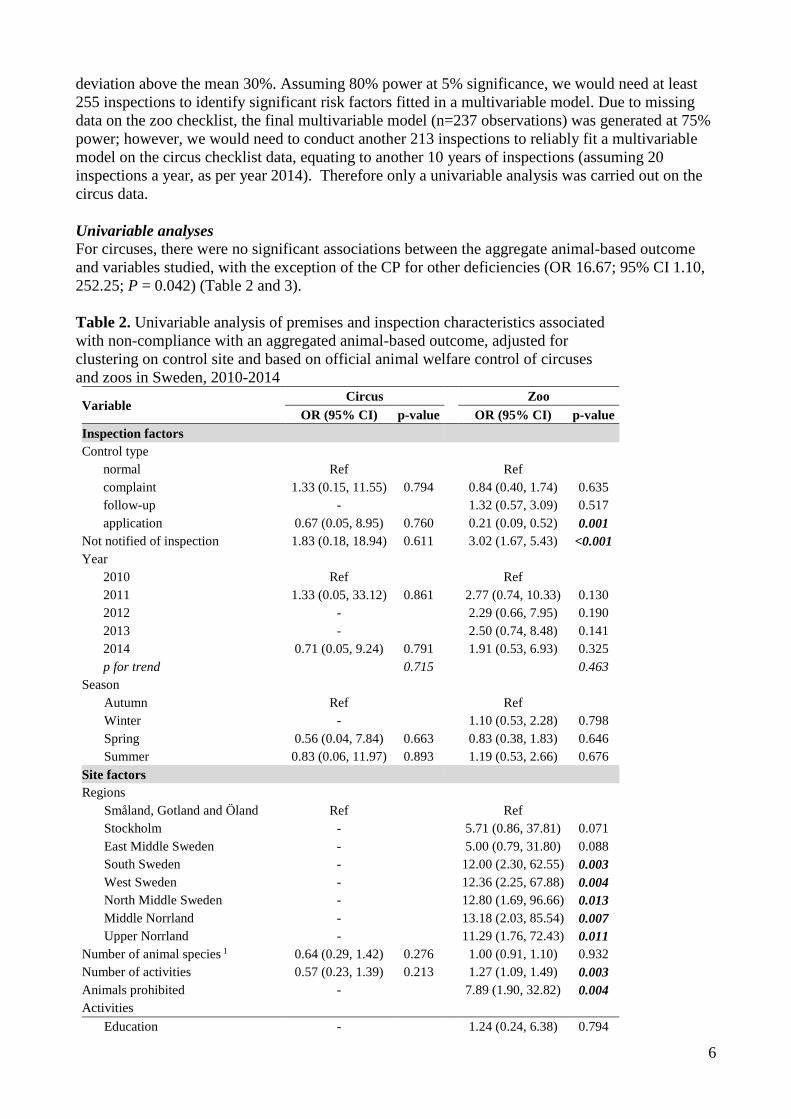
deviation above the mean 30%. Assuming 80% power at 5% significance, we would need at least 255 inspections to identify significant risk factors fitted in a multivariable model. Due to missing data on the zoo checklist, the final multivariable model (n=237 observations) was generated at 75% power; however, we would need to conduct another 213 inspections to reliably fit a multivariable model on the circus checklist data, equating to another 10 years of inspections (assuming 20 inspections a year, as per year 2014). Therefore only a univariable analysis was carried out on the circus data. Univariable analyses For circuses, there were no significant associations between the aggregate animal-based outcome and variables studied, with the exception of the CP for other deficiencies (OR 16.67; 95% CI 1.10, 252.25; P = 0.042) (Table 2 and 3). Table 2. Univariable analysis of premises and inspection characteristics associated with non-compliance with an aggregated animal-based outcome, adjusted for clustering on control site and based on official animal welfare control of circuses and zoos in Sweden, 2010-2014
Variable Circus Zoo
OR (95% CI) p-value OR (95% CI) p-value Inspection factors Control type normal Ref Ref complaint 1.33 (0.15, 11.55) 0.794 0.84 (0.40, 1.74) 0.635 follow-up - 1.32 (0.57, 3.09) 0.517 application 0.67 (0.05, 8.95) 0.760 0.21 (0.09, 0.52) 0.001 Not notified of inspection 1.83 (0.18, 18.94) 0.611 3.02 (1.67, 5.43) <0.001 Year 2010 Ref Ref 2011 1.33 (0.05, 33.12) 0.861 2.77 (0.74, 10.33) 0.130 2012 - 2.29 (0.66, 7.95) 0.190 2013 - 2.50 (0.74, 8.48) 0.141 2014 0.71 (0.05, 9.24) 0.791 1.91 (0.53, 6.93) 0.325 p for trend 0.715 0.463 Season
Autumn Ref Ref Winter - 1.10 (0.53, 2.28) 0.798 Spring 0.56 (0.04, 7.84) 0.663 0.83 (0.38, 1.83) 0.646 Summer 0.83 (0.06, 11.97) 0.893 1.19 (0.53, 2.66) 0.676
Site factors Regions
Småland, Gotland and Öland Ref Ref Stockholm - 5.71 (0.86, 37.81) 0.071 East Middle Sweden - 5.00 (0.79, 31.80) 0.088 South Sweden - 12.00 (2.30, 62.55) 0.003 West Sweden - 12.36 (2.25, 67.88) 0.004 North Middle Sweden - 12.80 (1.69, 96.66) 0.013 Middle Norrland - 13.18 (2.03, 85.54) 0.007 Upper Norrland - 11.29 (1.76, 72.43) 0.011
Number of animal species 1 0.64 (0.29, 1.42) 0.276 1.00 (0.91, 1.10) 0.932 Number of activities 0.57 (0.23, 1.39) 0.213 1.27 (1.09, 1.49) 0.003 Animals prohibited - 7.89 (1.90, 32.82) 0.004 Activities
Education - 1.24 (0.24, 6.38) 0.794

7
Variable Circus Zoo
OR (95% CI) p-value OR (95% CI) p-value Animal park - 1.61 (0.69, 3.77) 0.274 Wildlife reserve - 1.18 (0.40, 3.46) 0.768 Public exhibition of animals - 0.68 (0.36, 1.28) 0.227 Other animal display - 2.29 (1.28, 4.12) 0.005 Pet shop 0.74 (0.08, 6.98) 0.792 Pet/companion animal - 1.89 (0.67, 5.39) 0.231 Keeps hobby horses - 2.59 (1.11, 6.04) 0.028 Professional horse establishment 1.92 (0.60, 6.10) 0.269 Poultry keeping - 2.68 (1.24, 5.81) 0.012 Egg production - 5.24 (3.86, 7.11) <0.001 Meat production - 1.92 (0.81, 4.57) 0.138
1 Domestic and production animal species only. Table 3. Univariable analysis of control points on the circus checklist associated with non-compliance with an aggregate animal-based outcome, adjusted for clustering on control site, and based on official animal welfare inspections of circuses in Sweden from 2010 to 2014
Control points Aggregate animal-based outcome
Compliant Non-compliant OR (95% CI) p-value Space (CP-8)
Compliant 21 2 Ref Non-compliant 9 2 2.33 (0.28, 19.41) 0.433
Exercise (CP-10) Compliant 24 2 Ref Non-compliant 7 2 3.43 (0.39, 30.49) 0.269
Interior design (CP-15) Compliant 27 1 Ref Non-compliant 4 2 13.50 (0.90, 202.97) 0.060
Transport (CP-17) Compliant 13 2 Ref Non-compliant 6 1 1.08 (0.08, 14.64) 0.952
Other deficiency (CP-18) Compliant 25 1 Ref Non-compliant 3 2 16.67 (1.10, 252.25) 0.042
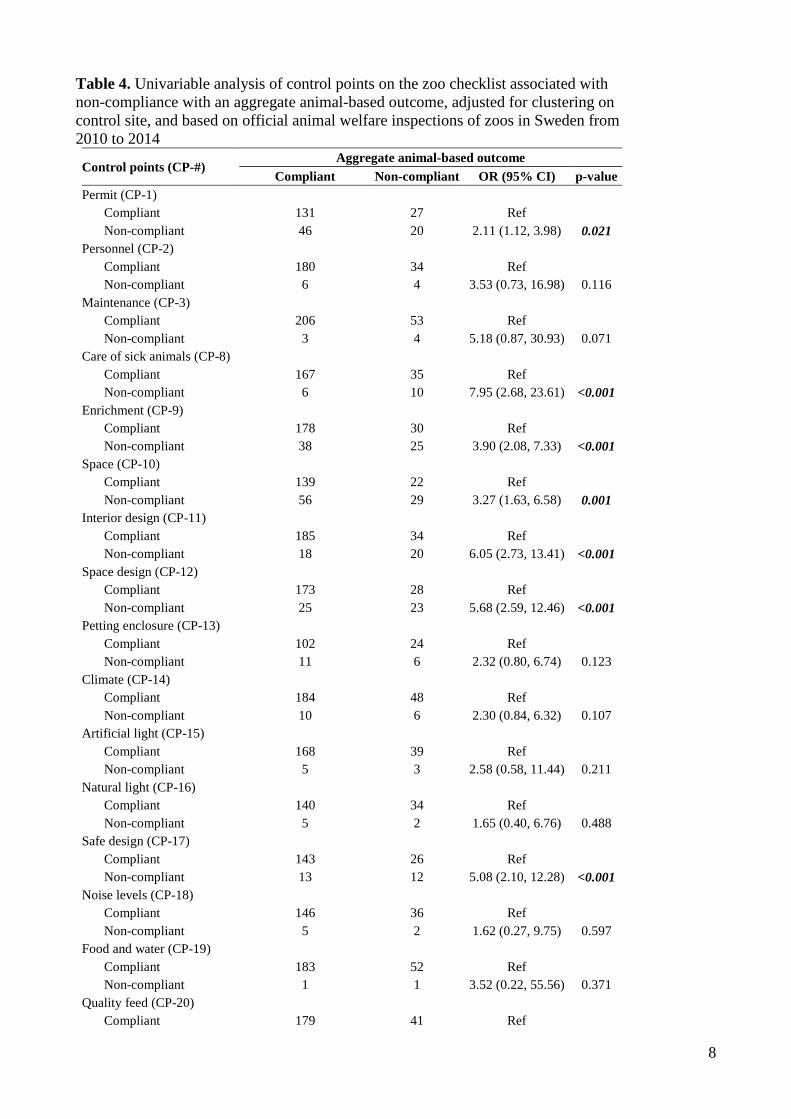
ORs are not presented where the CP predicted the failure or success of the outcome perfectly. For zoos, risk factors significantly associated with non-compliance with at least one of the animal-based outcome measures at inspection were geographic location, not being notified of the inspection, a greater number of other animal-related activities, using animals for other types of display e.g. advertising, keeping prohibited animals, keeping poultry and keeping horses for leisure purposes. Inspections for the purposes of an application were less likely to be non-compliant with animal-based outcomes compared to normal inspections (Table 2). Resource- and management-based CPs associated with non-compliance with the aggregate animal-based outcome measure were non-compliance with requirements for a permit, inadequate facilities or care for sick or injured animals, lack of enrichment, inadequate space and design of facilities, nutritional and water requirements not met, poor cleanliness and hygiene, inadequate bedding and lack of outdoor access or exercise (Table 4).
8
Table 4. Univariable analysis of control points on the zoo checklist associated with non-compliance with an aggregate animal-based outcome, adjusted for clustering on control site, and based on official animal welfare inspections of zoos in Sweden from 2010 to 2014
Control points (CP-#) Aggregate animal-based outcome
Compliant Non-compliant OR (95% CI) p-value Permit (CP-1)
Compliant 131 27 Ref Non-compliant 46 20 2.11 (1.12, 3.98) 0.021
Personnel (CP-2) Compliant 180 34 Ref Non-compliant 6 4 3.53 (0.73, 16.98) 0.116
Maintenance (CP-3) Compliant 206 53 Ref Non-compliant 3 4 5.18 (0.87, 30.93) 0.071
Care of sick animals (CP-8) Compliant 167 35 Ref Non-compliant 6 10 7.95 (2.68, 23.61) <0.001
Enrichment (CP-9) Compliant 178 30 Ref Non-compliant 38 25 3.90 (2.08, 7.33) <0.001
Space (CP-10) Compliant 139 22 Ref Non-compliant 56 29 3.27 (1.63, 6.58) 0.001
Interior design (CP-11) Compliant 185 34 Ref Non-compliant 18 20 6.05 (2.73, 13.41) <0.001
Space design (CP-12) Compliant 173 28 Ref Non-compliant 25 23 5.68 (2.59, 12.46) <0.001
Petting enclosure (CP-13) Compliant 102 24 Ref Non-compliant 11 6 2.32 (0.80, 6.74) 0.123
Climate (CP-14) Compliant 184 48 Ref Non-compliant 10 6 2.30 (0.84, 6.32) 0.107
Artificial light (CP-15) Compliant 168 39 Ref Non-compliant 5 3 2.58 (0.58, 11.44) 0.211
Natural light (CP-16) Compliant 140 34 Ref Non-compliant 5 2 1.65 (0.40, 6.76) 0.488
Safe design (CP-17) Compliant 143 26 Ref Non-compliant 13 12 5.08 (2.10, 12.28) <0.001
Noise levels (CP-18) Compliant 146 36 Ref Non-compliant 5 2 1.62 (0.27, 9.75) 0.597
Food and water (CP-19) Compliant 183 52 Ref Non-compliant 1 1 3.52 (0.22, 55.56) 0.371
Quality feed (CP-20) Compliant 179 41 Ref

9
Control points (CP-#) Aggregate animal-based outcome
Compliant Non-compliant OR (95% CI) p-value Non-compliant 3 7 10.19 (2.53, 41.00) 0.001
Quality water (CP-21) Compliant 170 47 Ref Non-compliant 3 9 10.85 (2.92, 40.36) <0.001
Storage (CP-22) Compliant 190 43 Ref Non-compliant 6 11 8.10 (3.18, 20.63) <0.001
Bedding (CP-23) Compliant 164 33 Ref Non-compliant 8 11 6.83 (2.35, 19.90) <0.001
Cleaning (CP-24) Compliant 123 25 Ref Non-compliant 1 2 9.84 (2.20, 43.91) 0.003
Outdoors (CP-25) Ref Compliant 130 36 Non-compliant 13 11 3.06 (1.23, 7.58) 0.016
Exercise (CP-26) Compliant 135 34 Ref Non-compliant 6 9 5.96 (2.17, 16.36) 0.001
Other deficiency (CP-31) Compliant 149 35 Ref Non-compliant 33 21 2.71 (1.39, 5.28) 0.003
ORs are not presented where the CP predicted the failure or success of the outcome perfectly. There were no significant differences across years in occurrence of non-compliance with the aggregate animal-based measures for either circuses or for zoos (Table 2), however, for zoos non-compliance with cleanliness decreased to zero in 2013 and 2014 (P = 0.01). Multivariable analysis Risk factors associated with poor zoo animal welfare at inspection included type of inspection, where inspections that were due to a complaint (OR 0.30; 95% CI 0.10, 0.94; P = 0.039) or application (OR 0.08; 95% CI 0.02, 0.29; P < 0.001) had lower odds compared to normal inspections; inadequate housing design and space (OR 6.38; 95% CI 2.27, 17.98; P < 0.001); unsafe design of housing (OR 6.47; 95% CI 1.93, 21.77; P = 0.003); nutritional requirements not met (OR 10.48; 95% CI 1.85, 59.54; P = 0.008); inadequate bedding materials (OR 5.01; 95% CI 1.07, 23.53; P = 0.041); and other deficiencies reported (OR 3.63; 95% CI 1.68, 7.86; P = 0.001). The finding that poor welfare was more likely to be observed at inspections conducted on premises where there was no notification of the impending inspection did not remain in the multivariable analysis because it was confounded by control type. Most inspections due to a complaint were not notified (88%) while most application inspections were notified (4% not notified). To test this relationship further, we generated models stratified by control type and found that not being notified of the inspection was not significant in all models. Principal component analysis For the PCA on the circus inspection results, five components with eigenvalues greater than one accounted for 97.9% of the total variance. Component 1 included space and exercise requirements (24.6% of the variance); component 2 included waste collection, bedding quality, interior design of facilities, and adequate ventilation (negatively loaded; 19.9%); component 3 included yearly inspections (negatively loaded) and transportation requirements (18.0%); component 4 included documentation requirements (negatively loaded; 17.7%); and component 5 included tethering of

10
animals (17.7%). Other deficiencies loaded almost equally across components 1, 3 and 5 (Supplementary Table 3). For the PCA on the zoo inspection results, five components with eigenvalues greater than one accounted for 79.4% of the total variance. Component 1 included enrichment, space requirements and design, bedding, and cleaning (33.2% of the variance); component 2 included water quality, storage requirements, and outdoor access (16.9%); component 3 included holding of a permit, interior design of facilities, outdoor access and exercise, and cleaning (negatively loaded; 11.8%); component 4 included safe design of housing and nutritional requirements (negatively loaded; 9.1%); and component 5 included care of sick and injured animals and other deficiencies (8.5%) (Supplementary Table 4). Discussion The two main findings in this study were the prevalence of the different welfare problems in zoos and circuses and the identification of the main risk factors for these welfare problems. We discuss these results in the context of those reported in Britain (Draper, et al. 2013, Draper & Harris 2012) as well as the feasibility of using data gathered by official animal welfare inspectors for benchmarking trends. We highlight the importance of collaboration on data collection, especially from circuses, and consider the general potential of the approach developed in this paper for future multi-facility animal welfare epidemiological studies. In zoos, the lack of appropriate social contact was the most frequent animal-based measure of welfare that was found to be non-compliant according to the Swedish legislation (Djurskyddsförordning 1988, Djurskyddslagen 1988), but this measure is not included at all in the assessment of circus animals. Non-compliance with the requirements for adequacy of general condition (i.e. hooves, claws, coat, wool) and body condition of the animals was also high at routine inspections. Non-compliance with requirements for cleanliness of animals was rare, and this is likely because both circuses and zoos display animals to the public. The only animal-based measure from the British zoo inspections asked whether “all animals on display to the public appear to be in good health?” and found that only 3% of zoos assessed by government-appointed inspectors answered in the negative. Additionally and although not an animal-based measure and so not directly comparable with our study, 9% of the British zoos did not provide animals with an environment well adapted to meet their physical, psychological and social needs (Draper & Harris 2012). These difficulties comparing results highlight the need for consensus, so that at least some of the criteria being assessed by official government inspectors in different countries are the same. This would greatly facilitate benchmarking of key welfare issues as well as facilitate multi-facility studies of circuses and zoos. In this study, the four animal-based measures assessed clearly do not cover all aspects of welfare, with the most notable omissions being assessment for illness and injury, and for behavioural abnormalities (e.g. stereotypies, aggression). Additional animal-based measures were only partially captured in the CP for ‘other deficiencies’. Improvements to the checklists so that they better capture the physical health, behaviour, and mental state elements of the ‘Five Domains’ (Mellor & Beausoleil 2015) are needed. But with official controls, as opposed to in-depth experimental studies, the measures must be simple and non-invasive to be feasible. Feasible examples from the WAZA Animal Welfare Strategy include absence of disease and injury, evidence of impact of temperature extremes, changes in behaviour (e.g. vocalisation), as well as presence of positive indicators such as behavioural expression (e.g. playfulness, curiosity, vitality, calmness)(Mellor, et al. 2015). The Elephant Welfare Project (Carlstead, et al. 2013) has defined seven welfare outcomes that were adapted from Welfare Quality, a project that developed practical and validated measures for production animals (Blokhuis, et al. 2013). They have also recommended assessing positive emotional states in elephants (Carlstead, et al. 2013), with play, affiliative behaviours and some

11
vocalisations perhaps the most convenient indicators to employ (Boissy, et al. 2007) in a circus or zoo setting. Risk factors for poor animal welfare were assessed. In the multivariable analysis, zoos more likely to be non-compliant with at least one of the animal-based CPs were those that had inadequate housing design and space, unsafe design of housing, inadequate bedding materials, and nutritional requirements not met. Several of these were also important risk factors for non-compliance with at least one of the animal-based CPs in the univariable analysis of the circus data. The insight that it will take another 10 years before a multivariable analysis of data from Swedish circuses could be carried out, argues strongly for international collaboration around animal welfare inspections of circuses. The occurrence of ‘other deficiencies’ as an important risk factor for poor welfare at both circuses and zoos illustrates that also the inspectors themselves regarded the current checklists as lacking important criteria. The circus and zoo animal checklists comprise primarily resource- and management-based measures. Even if we suggest that there are risk factors missing, the findings of our PCA suggest that there is potential for reducing some of these important resource- and management-based CPs. This may make the inspections less time consuming. For example, component 1 (enrichment, space, design, bedding, and cleaning) explained a third of the information on non-compliance with resource- and management-based measures on the zoo checklist, and three of the five of these factors on the component were associated with poor zoo animal welfare in the multivariable analysis. Given that these measures are already known to be important for welfare of exotic species such as primates, big cats, and elephants (Carlstead, et al. 2013, Clubb & Mason 2007, Whitham & Wielebnowski 2013), we can only speculate that the reasons for high rates of non-compliance in these areas is due to the financial implications of designing larger and better facilities, the limited possibilities for expanding enclosures due to space restrictions, and/or the lack of knowledge of those running the circuses and zoos. Official animal welfare control can be used to monitor welfare at circuses and zoos; however some improvements would increase the value of the database. The next steps are to further standardise inspections by increasing objectivity of the criteria used to assess each CP. With a relatively large number of inspectors conducting the visits, limiting the number of inspectors to those trained specifically to assess the welfare of circus and zoo animals would also be beneficial because of the tendency for different inspectors to vary significantly in their assessments (Keeling 2009). Establishing consistency between inspectors was also a major outcome from the study of formal inspections at British zoos (Draper, et al. 2013). The checklists for circus and zoo animals differ from the checklists for companion and production animals in that they are not species specific. Information on the number and type of exotic animal species should therefore be included, and CPs should be modified so that they are directly applicable to the varying exotic animal species; for example, by giving more objective measurements on the animal-based measures for like-species (e.g. for big cats, for large mammals, for birds). Lastly, the findings in this study could be used to develop a more efficient checklist by reducing resource- and management-based measures to those that are most important, along with expanding the animal-based measures (both positive and negative) to better assess the welfare status of circus and zoo animals. Animal welfare implications Analysis of routinely collected data from official inspections can help us to determine areas that should be targeted in order to improve the welfare of circus and zoo animals. Our study suggests that strategies focussed on improving housing design, space, bedding, and nutrition are likely to

12
have the greatest impact on zoo animal welfare; with the measuring of success of such intervention strategies made possible through benchmarking of trends in welfare status. Acknowledgements The authors thank the Formas, the Swedish Research Council for Environment, Agricultural Sciences and Spatial Planning for financial support, and the Swedish Board of Agriculture and county administrative boards for providing animal welfare control data. The project is part of the Centre of Excellence in Animal Welfare Science, a Swedish collaborative research platform. References Blokhuis HJ, Miele M, Veissier I, and Jones B 2013 Improving farm animal welfare: science and
society working together: the welfare quality approach. Wageningen Academic Publishers: Netherlands.
Boissy A, Manteuffel G, Jensen MB, Moe RO, Spruijt B, Keeling LJ, Winckler C, Forkman B, Dimitrov I, Langbein J, Bakken M, Veissier I, and Aubert A 2007 Assessment of positive emotions in animals to improve their welfare. Physiology & Behavior 92: 375-397.
Carlstead K, Mench JA, Meehan C, and Brown JL 2013 An epidemiological approach to welfare research in zoos: The Elephant Welfare Project. Journal of Applied Animal Welfare Science 16: 319-337.
Clubb R, and Mason GJ 2007 Natural behavioural biology as a risk factor in carnivore welfare: How analysing species differences could help zoos improve enclosures. Applied Animal Behaviour Science 102: 303-328.
Djurskyddsförordning (Animal Welfare Ordinance) (1988:539), Sweden. Djurskyddslagen (Animal Welfare Act) (1988: 534). DL 2-4, 9 §§. Sweden. Djurskyddsmyndigheten 2004 Djurskyddsmyndighetens föreskrifter om djurhållning i djurparker
mm (DFS 2004:19). Saknr L108. Sweden Djurskyddsmyndigheten 2007 Djurskyddsmyndighetens föreskrifter och allmänna råd om
cirkusdjur (DFS 2007:3). Saknr L116. Sweden Draper C, Browne W, and Harris S 2013 Do formal inspections ensure that British zoos meet and
improve on minimum animal welfare standards? Animals 3: 1058-1072. Draper C, and Harris S 2012 The assessment of animal welfare in British zoos by Government-
appointed inspectors. Animals 2: 507-528. Edwards JH, and Edwards AWF 1984 Approximating the tetrachoric correlation coefficient.
Biometrics 40: 563-563. EFSA Panel on Animal Health and Welfare (AHAW) 2012 Statement on the use of animal-based
measures to assess the welfare of animals. EFSA Journal 10: 2767 [29 pp.]. Hubbard C, and Scott K 2011 Do farmers and scientists differ in their understanding and
assessment of farm animal welfare? Animal Welfare 20: 79-87. Kaiser HF 1958 The varimax criterion for analytic rotation in factor analysis. Psychometrika 23:
187-200. Keeling L 2009 An analysis of animal-based versus resource-based comments in official animal
welfare inspection reports from organic and conventional farms in Sweden. Animal Welfare 18: 391-397.
Mellor D, and Beausoleil N 2015 Extending the'Five Domains' model for animal welfare assessment to incorporate positive welfare states. Animal Welfare 24: 241-253.
Mellor DJ, Hunt S, and Gusset Me 2015 Caring for Wildlife: The World Zoo and Aquarium Animal Welfare Strategy, p87: Gland: WAZA Executive Office, Switzerland.
StataCorp L 2013 Stata multivariate statistics reference manual: Release 13. StataCorp LP: College Station, Texas.
Whitham JC, and Wielebnowski N 2013 New directions for zoo animal welfare science. Applied Animal Behaviour Science 147: 247-260.

Supplementary Table 1. Outcome of official animal welfare controls of circuses in Sweden, 2010-2014
Inspection outcome %
Non-compliant1
Control
point
Variable Description Not
applicable
No control Compliant Non-
compliant
Total
Inspections
1 yearlycontrol An inspection has been made
under 36a § of the Animal
Welfare Ordinance - A circus
that exhibits animals to the
public shall be controlled once
a year
1 0 30 2 33 6.3%
2 wastecollection
Collection of waste in animal
areas is satisfactory
1 3 37 1 42 2.6%
3 generalcondition
The requirements for the care
of animals (hooves, claws
grooming, etc.) are met
1 4 33 4 42 10.8%
4 bodycondition
Animal body condition is
acceptable
1 1 30 1 33 3.2%
5 cleanliness
The animals are kept
satisfactorily clean
1 1 31 0 33 0.0%
6 sickanimals Sick / injured animals treated
appropriately. Animals need
special care can be taken care
of in a designated area
2 8 23 0 33 0.0%
7 documentation
Requirements record keeping
are met
1 19 20 2 42 9.1%
8 space Spaces for animals under
current measurement
regulations
1 7 23 11 42 32.4%
9 tethering The requirements around the
tethering of animals are met
11 6 24 1 42 4.0%

10 exercise
The requirements for the
exercise area of the animals is
met
1 6 26 9 42 25.7%
11 stabling Requirements of stables /
display space is met
1 23 18 0 42 0.0%
12 shelter
Animals can get protection
against cold, heat, sunlight,
rain and wind
1 4 37 0 42 0.0%
13 beddingquality The requirements for the use
bedding and bedding quality
are met
1 6 33 2 42 5.7%
14 ventilation
Ventilation requirements are
met.
5 12 24 1 42 4.0%
15 interiordesign
The requirements for the
design of the interior regarding
injury risks etc are met
1 7 28 6 42 17.6%
16 foodwater
The requirements for food and
water are met
1 5 36 0 42 0.0%
17 transport
Transport requirements are met 1 19 15 7 42 31.8%
18 otherdeficiency
No other deficiencies found
during inspection
0 0 27 6 33 18.2%
Total 32 131 495 53 711 9.7%
CP-3, 4, and 5 written in bold are animal-based. a The percentage of non-compliance was calculated as the number of non-compliant inspections divided by the number of both
compliant and non-compliant inspections, multiplied by 100.

Supplementary Table 2. Outcome of official animal welfare controls of zoos in Sweden, 2010-2014
Control outcome %
Non-compliant
Controlsa
Control
point
Variable Description Not
applicable
No control Compliant Non-
compliant
Total
Inspections
1 permit Holds a permit to exhibit animals
at the facility under 37 § Animal
Welfare Ordinance.
45 24 173 76 318 30.5%
2 personnel Personnel responsible for animal
husbandry and care of the
animals have adequate
training and/or experience in
relevant species: Veterinarian,
Zoologist
18 60 229 11 318 4.6%
3 maintenance Daily supervision and
maintenance provided for all
animals
1 34 273 10 318 3.5%
4 socialcontact The requirement for social
contact including mammals and
birds kept in groups is met
54 37 189 38 318 16.7%
5 generalcondition Hooves, claws and wool are
regularly inspected and trimmed
/ cut as needed.
68 69 162 19 318 10.5%
6 bodycondition The animals’ body condition is
acceptable
9 66 230 13 318 5.3%
7 cleanliness The animals are kept
satisfactorily clean
19 44 251 4 318 1.6%
8 sickanimals Sick / injured animals are treated
appropriately. Animals need
special care can be taken care of
in designated area
20 71 211 16 318 7.0%
9 enrichment The animals are kept in an 2 18 225 73 318 24.5%
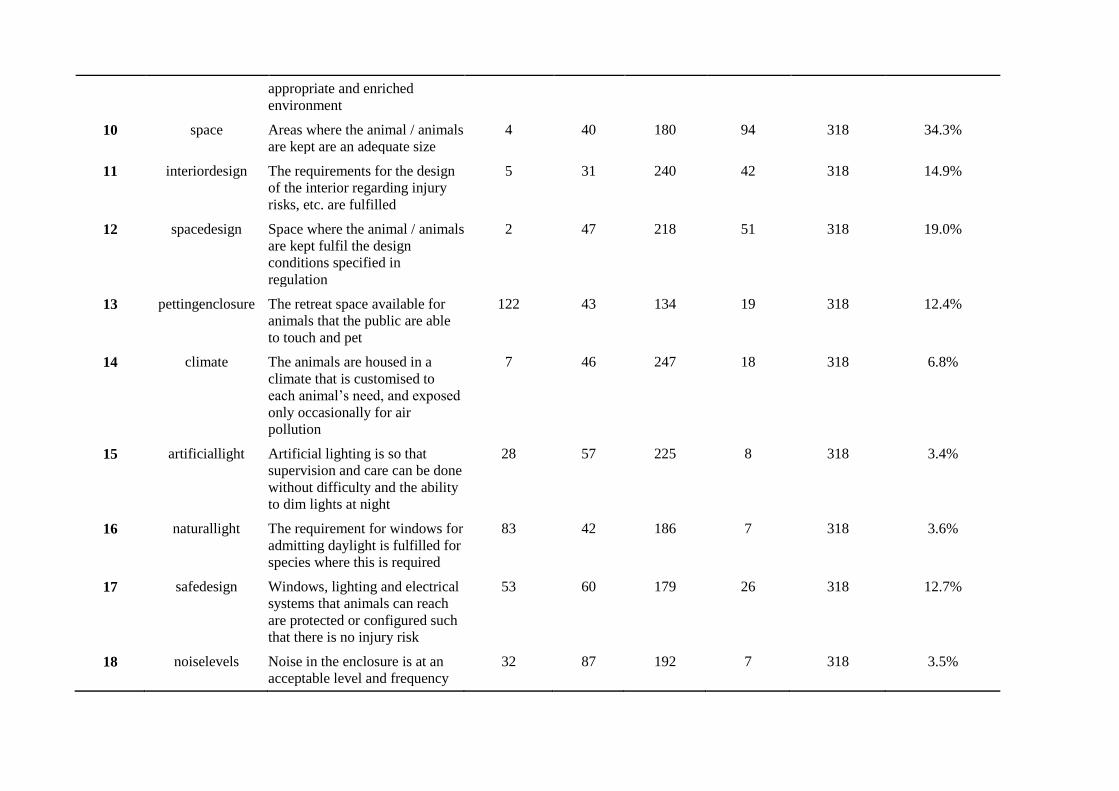
appropriate and enriched
environment
10 space Areas where the animal / animals
are kept are an adequate size
4 40 180 94 318 34.3%
11 interiordesign The requirements for the design
of the interior regarding injury
risks, etc. are fulfilled
5 31 240 42 318 14.9%
12 spacedesign Space where the animal / animals
are kept fulfil the design
conditions specified in
regulation
2 47 218 51 318 19.0%
13 pettingenclosure The retreat space available for
animals that the public are able
to touch and pet
122 43 134 19 318 12.4%
14 climate The animals are housed in a
climate that is customised to
each animal’s need, and exposed
only occasionally for air
pollution
7 46 247 18 318 6.8%
15 artificiallight Artificial lighting is so that
supervision and care can be done
without difficulty and the ability
to dim lights at night
28 57 225 8 318 3.4%
16 naturallight The requirement for windows for
admitting daylight is fulfilled for
species where this is required
83 42 186 7 318 3.6%
17 safedesign Windows, lighting and electrical
systems that animals can reach
are protected or configured such
that there is no injury risk
53 60 179 26 318 12.7%
18 noiselevels Noise in the enclosure is at an
acceptable level and frequency
32 87 192 7 318 3.5%

19 feedwater The animals are given the
opportunity for peaceful and
natural intake of feed and water
3 71 242 2 318 0.8%
20 qualityfeed The animals are given feed that
ensure adequate, comprehensive
and balanced nutrition
6 73 229 10 318 4.2%
21 qualitywater The requirements for drinking
water are met
29 52 223 14 318 5.9%
22 storage The storage areas are kept
satisfactorily clean and
manure handling / cleaning is
done so that good hygiene is
maintained
14 36 247 21 318 7.8%
23 bedding The requirements for bedding
and nesting materials are met
35 52 209 22 318 9.5%
24 cleaning Cleaning of equipment, etc. is
done so that the spread of
infection is prevented
22 138 155 3 318 1.9%
25 outdoors The requirements for keeping
animals outdoors are met
90 31 171 26 318 13.2%
26 exercise The requirements for pasture,
exercise areas, ground surfaces,
driving routes and driving,
movement and fencing are met
85 42 175 16 318 8.4%
27 wingclipping The requirements for clipped
wings of birds is met
201 99 18 0 318 0.0%
28 surgery Surgical procedures are
performed in an acceptable
manner
51 157 110 0 318 0.0%
29 breeding Animals involved in breeding do
not suffer
78 139 99 2 318 2.0%
30 performance Animals in performances are not 209 76 33 0 318 0.0%
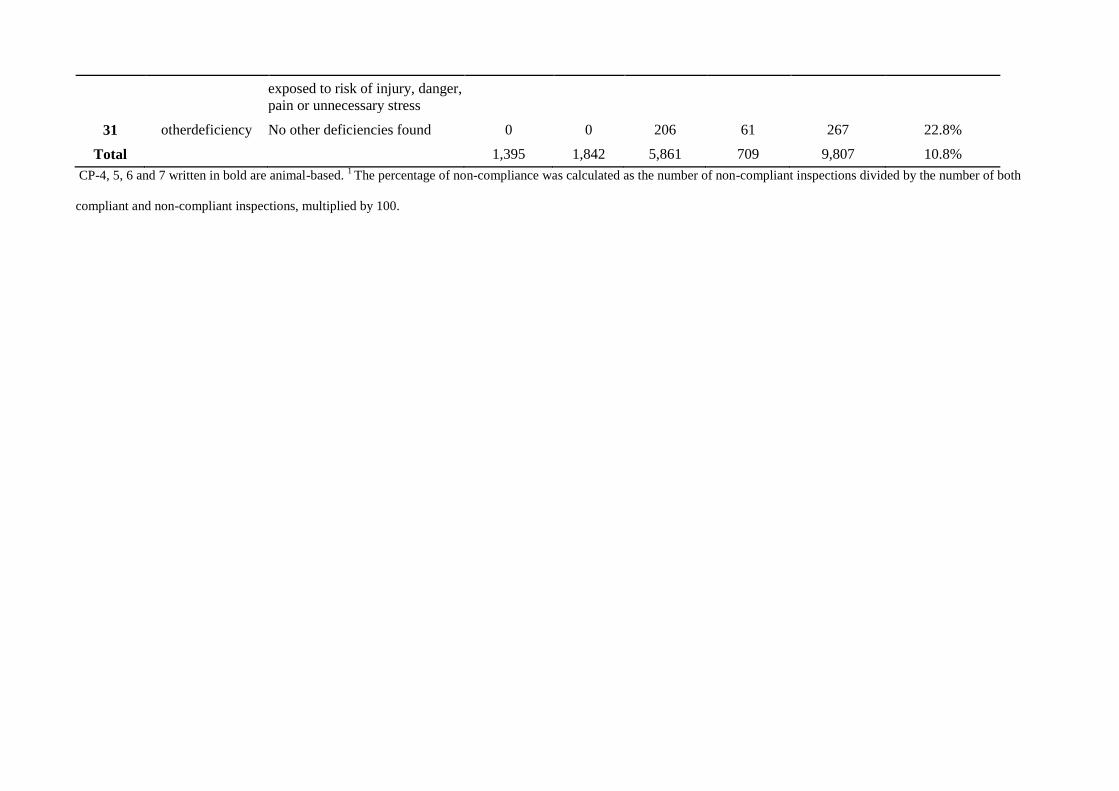
exposed to risk of injury, danger,
pain or unnecessary stress
31 otherdeficiency No other deficiencies found 0 0 206 61 267 22.8%
Total 1,395 1,842 5,861 709 9,807 10.8%
CP-4, 5, 6 and 7 written in bold are animal-based. 1 The percentage of non-compliance was calculated as the number of non-compliant inspections divided by the number of both
compliant and non-compliant inspections, multiplied by 100.

Supplementary Table 3. Principal component analysis of resource- and management-based
control points, with orthogonal varimax rotation, based on official animal welfare inspections
of circuses in Sweden, 2010-2014 (blanks are absent (loading) <0.3)
Variable Component 1 Component 2 Component 3 Component 4 Component 5
space 0.6066
exercise 0.5954
yearlycontrol -0.7307
transport 0.4663
wastecollection 0.3774
beddingquality 0.4762
ventilation -0.6472
interiordesign 0.4061
documentation -0.7574
tethering -0.7786
otherdeficiency 0.3311 -0.3314 0.3400

Supplementary Table 4. Principal component analysis of resource- and management-based
control points, with orthogonal varimax rotation, based on official animal welfare inspections
of zoos in Sweden, 2010-2014 (blanks are absent (loading) <0.3)
Variable Component 1 Component 2 Component 3 Component 4 Component 5
enrichment 0.4123
space 0.3605
spacedesign 0.5360
bedding 0.4134
cleaning 0.3041 -0.3888
qualitywater 0.6381
storage 0.4841
outdoors 0.3130 0.3094
exercise 0.5739
permit 0.4529
interiordesign 0.3691
systemaccess 0.6168
qualityfeed -0.6720
sickanimals 0.6090
otherdeficiency 0.5842