cirp 2002 the american freshmen survey of the cooperative institutional research program
Post on 19-Dec-2015
214 views
TRANSCRIPT

CIRP 2002
The American Freshmen Survey of the Cooperative Institutional
Research Program

The American freshmen survey asks students questions regarding:
• Biographic and demographic data• High school background• Career plans• Educational aspirations• Financial arrangements• High school activities• Current attitudes

Ethnicity/Race
• White/Caucasian: 82%• Asian American/Asian: 7%• Mexican/Puerto Rican/Other Latino: 7% • African American/Black: 3%• American Indian: 2%• Other: 4%• Note: Percentages are rounded and will add up to more than 100%

Anticipated Living Arrangements
• 50% of respondents planned on living on campus
• 32% planned on living at home or with friends/relatives
• 17% planned on private living arrangement• 2% planned other living arrangements such
as fraternities, sororities, or other campus housing

Financial Consideration
• Financing a college education is a deciding factor for many students. Some of these deciding factors are:
• Parental Financial Support• Employment• Savings• Loans• Gift Aid/Financial Assistance• Other Resources

Own or Family Sources
• Overall 80% of students expected to receive financial assistance from parents, family or friends.
• 30% of students expected this assistance to exceed $3,000 during their freshmen year.
• 67% of students expected to use savings, income, or work study to finance college.
• 10% of students expected this assistance to exceed $3,000 during their freshmen year

Gift Aid/Financial Assistance
• 78% expected to receive some gift aid• 39% expected to receive gift aid in excess
of $3,000 during their freshmen year• Gift Aid/Financial Assistance was the
reason given by 62% of students for choosing the University of Nevada, Reno

Loans
• 19% of students expected to receive loans to pay for college as opposed to 40% of students nationally
• 6% of respondents expected to receive more than $3,000 in loans during their freshmen year as opposed to 21% nationally

Educational Goals
• 23% planned to obtain a bachelors degree• 59% planned to obtain their bachelors
degree from the University of Nevada, Reno
• 76% planned to obtain some advanced degree
• 37% planned to obtain their advanced degree from the University of Nevada, Reno

Motivation for Attending CollegeReasons listed as important
• To learn more about things that interest me 79%• To be able to make more money 75%• To be able to get a better job 71%• To get training for a specific career 71%• To gain a general education and appreciation of
ideas 66%• To prepare myself for graduate or professional
school 57%
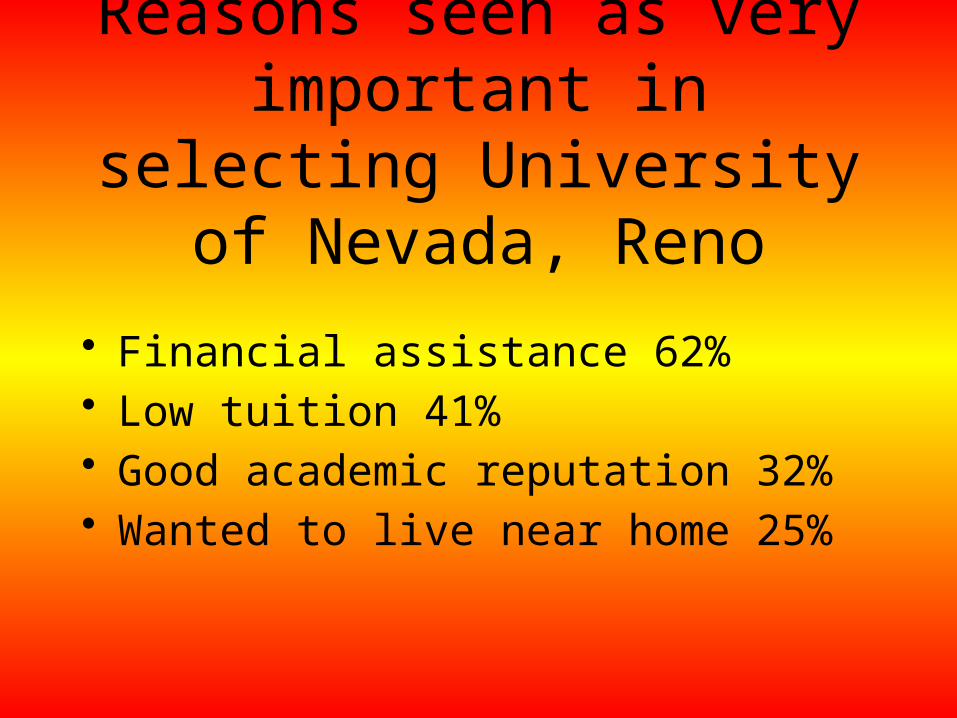
Reasons seen as very important in selecting
University of Nevada, Reno
• Financial assistance 62% • Low tuition 41%• Good academic reputation 32%• Wanted to live near home 25%

Behaviors and Activities Continued
• Used the internet for research or homework 79%• Communicated via email 63%• Drank wine or liquor 56%• Visited art gallery or museum 56%• Performed community service as part of a class
55%• Drank beer 51%

Political and Social AttitudesStudent were most likely to agree that:
• The federal government should do more to control the sale of handguns.
• Abortion should be legal.• There is too much concern in the courts for
the rights of criminals.• Same sex couples should have the right to
legal marital status.

Political and Social AttitudesStudent were most likely to disagree that:
• The death penalty should be abolished.• People should not obey laws which violate
their personal values.• Racial discrimination is no longer a
problem in America• The activities of married women are best
confined to home and family.

Personal ObjectivesObjectives rated most important by students
• Being very well off financially• Raising a family• Becoming an authority in my own field• Helping others who are in difficulty

Expected Personal ActivitiesPercentages of students who expect to:
• Work to supplement college expenses 55%• Participate in student clubs or groups 37%• Participate in volunteer or community
service 21%• Work fulltime to pay for college 10%• Join fraternity or sorority 8% • Play varsity or intercollegiate sports 7%

Students’ Probable CareerMost frequently listed careers
• Medicine (nursing, pharmacist, physician) 13%
• Engineering 11%• Business (clerical, owner/proprietor,
management, or sales/buying) 10% • Education (elementary, secondary, or
administration) 8%

The End
Thank You