cis report ashish kukreja 08xpgdm11
TRANSCRIPT
8/8/2019 CIS Report Ashish Kukreja 08Xpgdm11
http://slidepdf.com/reader/full/cis-report-ashish-kukreja-08xpgdm11 1/26
Research Project on
Identification and Priority of Job Attributes:A study among management graduates
Ashish Kukreja (08XPGDM11)

8/8/2019 CIS Report Ashish Kukreja 08Xpgdm11
http://slidepdf.com/reader/full/cis-report-ashish-kukreja-08xpgdm11 2/26
Executive Summary:
The allocation of an independent research project was a great opportunity for me to learn,understand and use the dynamics of research techniques to identify the most important attributesthat a job aspirant looks for. In trying to do so we undertook a research with a fixed goal/purposein mind. A short summary of our project is given below.
I n order to accomplish our research purpose we targeted management students seeking
placements and working executives to fill an online survey. Such an approach allowed us
to get views of varied groups sitting and operating from different sides.

8/8/2019 CIS Report Ashish Kukreja 08Xpgdm11
http://slidepdf.com/reader/full/cis-report-ashish-kukreja-08xpgdm11 3/26
ACKNOWLEDGEMENT
Let us begin our acknowledgements by thanking our faculty member for providing proper guidance and moral support. I am greatly thankful to our Professor Arvind Chaturvedi for enlightening us with concepts involved in the making of this project.

8/8/2019 CIS Report Ashish Kukreja 08Xpgdm11
http://slidepdf.com/reader/full/cis-report-ashish-kukreja-08xpgdm11 4/26
Table Of Contents:1) Introduction2) Research Proposal, scope and objectives.3) Review of literature4) Research Plan
a. Research Designb. Sampling Planc. Data collection pland. Data analysis Plan
5) Findings of the study6) Interpretation of the findings7) Limitations8) Bibliography9) Questionnaire used in the study
8/8/2019 CIS Report Ashish Kukreja 08Xpgdm11
http://slidepdf.com/reader/full/cis-report-ashish-kukreja-08xpgdm11 5/26
1) Introduction:
The main purpose behind choosing the topic to understand the important attributes that a job seeker or a working executive considers for a desirable job. Results from this studycan be shared with IMI placement cell and PGDMHR group to understand behavior of Job seeker and working professionals. In this domain many studies have been conductedin United States of America. I am using the same study pattern on a different set of respondents. I believe that job attributes within India will differ from job seeker¶s outsideIndia.
2) Research Objectives: 1) What all attributes they consider important for a desirable job.2) Is there is a difference in preferences on the basis of Gender, age and Pastqualification.3) Assess different preferences for different segments.
3) Review of Literature:
Previous research done in this area:
Many authors have noted the understanding on how job-choice decisions are made while anapplicant applies for a job.
The research done by Wendy R. Boswell, Mark V. Roehling (2003) found in the literature bytracking job seekers through the job search and choice process. This study attempts todemonstrate the job attributes that are most likely to attract the desirable applicants for aparticular job. It also tries to reflect the important recruitment practices that generally impact theacceptance or Rejection decision by an applicant. This study was conducted in several phases,where an applicant was interviewed before getting and after getting a job offer. This study tried to
check the difference in importance that applicants put in before getting a job and after getting a job.
Experiment done by R.W. MCQUAID, M. GREIG, AND J. ADAMS (2001) explains the job seeker attitude towards potential travel to work times. This study attempts to demonstrate a model of factors influencing an applicant¶s decision to travel for a potential new job. R.W. MCQUAID, M.GREIG, AND J. ADAMS (2001) suggests support for spatial mismatch hypothesis and showsdifferent accessibilty to employment opportunities for certain types of unemployed people. Thisstudy bulit in an emperical relation:
K = ( Z, w , B, N, E,Q,U ,Ti ,Tp ,A,Ur , V, O)where K represents the job seeker¶s stated travel-to-work time, which takes any one of four distinct values; less than 30 minutes to and from work each day,between 30 and 45 minutes,
between 46 minutes and one hour, and over one hour.Z is a set of demographic variables, w represents the expectedweekly post-tax wage that individual can expect to receive, B theunemployment benefit (welfare), N the level of non-earned income (excluding welfare), Ti theavailability of private transport and Tp the availability of public transit. The accessibility of centersof employment from the job seeker¶s home is represented by A. O represents any other factor thought likely to influence
8/8/2019 CIS Report Ashish Kukreja 08Xpgdm11
http://slidepdf.com/reader/full/cis-report-ashish-kukreja-08xpgdm11 6/26
Experiment done by Beverly A. Browne1 (1997) explains the difference between men and womencareer path selection and the rates of advancement. This study attempts to demonstate thedifferent attributes importance that a man and a woman emphasise before choosing a career path.
Experiment done by Carl D'Arcy, John Syrotuik and C. M. Siddique 1984 considered tries to
explain the importance of perceived
job attributes in accounting for gender differences in jobsatisfaction and psychological distress. This study attempts to discuss in terms of female
expectations regarding employment and the importance of role-related stress in accounting for
sex differences in psychological morbidity.
Significant discoveries, key concepts, arguments, and/or theories that scholars have putforward:
The research papers discussed above have made the following significant discoveries:
1) Wendy R. Boswell, Mark V. Roehling (2003) states that Company culture, Advancementopportunities, Nature of work, Training, and Work-non work balance as the top 5 attributes ratedby the applicants. The majority of respondents indicated the company culture and work profile as
one of importants factors before getting in a job. However new factors also emerged in their prefrence list such as: Location, Company reputation and Industry. So this suggests that as jobseekers progress through jobs, important factors influencing their decisions become more salient.
2) Wendy R. Boswell, Mark V. Roehling (2003) also explored whether the factors associated withaccepting a job differ from those rejecting a job. Here an applicant was again interviewed after itsinteraction with recruiter. Here Work, Location and Company culture was mentioned as animportant factor that an applicant considers after meeting a recruiter.
However Wendy R. Boswell, Mark V. Roehling (2003) also gave a significant finding, wherereasons for accepting a job offer did diverge from reasons given for rejecting an offer. Such as:opportunity for promotion or advancement appears to be an important reason for accepting anoffer, while concerns over compensation was a common reason for rejection. Site visit was also
cited as an important attribute for rejecting an offer.
3) Wendy R. Boswell, Mark V. Roehling (2003) also analyzed the role of job deadlines on theacceptance or rejection of a job by an applicant. Respondents recieveing the deadlines was takenas an example of poor treatment during the recruitment practices. Many of the respondents, whowere not able to extend the deadline actually turned down the offer, however there is littleevidence that strict deadlines cause employers to lose interested candidates.
4) R.W. MCQUAID, M. GREIG, AND J. ADAMS (2001) revealed that there exists a degree of intra-regional spatial mismatch, with certain groups of unemployed people being less likely totravel for long periods to new jobs. The demographic and human capital factors were mostclosely associated with variances in potential travel-to-work time. Overall, socio-economic factorsappear to be more significant than purely spatial ones.In particular, years of education and manual workers were positivelycorrelated with willingness to travel longer periods to work, the former giving support to thehuman capital hypothesis. Female gender, dependant children, and residence in the Bathgatearea were negatively correlated, giving support to the household responsibility hypothesis.
Manual labor is expected to travel longer than its non-manual counterparts. Years of educationalso have a positive relation, which means that expectation of job specialization being associatedwith greater human capital in terms of education level. Length of unemployment. Where as in
8/8/2019 CIS Report Ashish Kukreja 08Xpgdm11
http://slidepdf.com/reader/full/cis-report-ashish-kukreja-08xpgdm11 7/26
gender, female also have shorter travel to work journeys. It also explained that householdresponsibilities leads to a part time work prefrence.
5) Beverly A. Browne1 (1997) explained the women's lesser career progression in comparisonwith men are differences in work attitudes and preferred work attributes. They suggested thatwomen place greater importance on working conditions that make them less valuable in the work
force.
6) Carl D'Arcy, John Syrotuik and C. M. Siddique (1984)indicated that, male ratings of jobsatisfaction
were equivalent to those of females, while
women scored higher than men on a
measure of psychological distress. However, when job attribute perceptions
were held constant,
female job satisfaction was significantly higher than that of males
and there were no sex
differences in levels of psychololgical distress
The research papers mentioned above have concentrated on the job attributes that an applicantconsiders while searching a job.
We can use the research same topic with different parameters on Management gradates of India,which will help us to gauge their preferences in the current scenario.Our research will try to answer:
a) What all attributes they consider important.b) How much far they are willing for travel for work.c) Is there is a difference in preferences on the basis of Gender, age and Past qualification.
I have considered four research papers, which are close to our research topic.
INDIVIDUAL JOB-CHOICE DECISIONS AND THEIMPACT OF JOB ATTRIBUTES ANDRECRUITMENT PRACTICES: A LONGITUDINAL FIELD STUDY by (Wendy R. Boswell, Mark V.Roehling 2003), Marcie A. LePine, and Lisa M. Moynihan.
Study two: Unemployed Job Seeker Attitudes towardsPotential Travel-to-Work Times´ by R.W. MCQUAID, M. GREIG, AND J. ADAMS (2001).
Study three: Gender and Preferences for Job Attributes: ACross Cultural Comparison by Beverly A. Browne1 (1997)
Study four: Perceived Job Attributes, Job Satisfaction, and Psychological Distress: A Comparisonof Working Men and Women by Carl D'Arcy, John Syrotuik and C . M . Siddique 1984
8/8/2019 CIS Report Ashish Kukreja 08Xpgdm11
http://slidepdf.com/reader/full/cis-report-ashish-kukreja-08xpgdm11 8/26
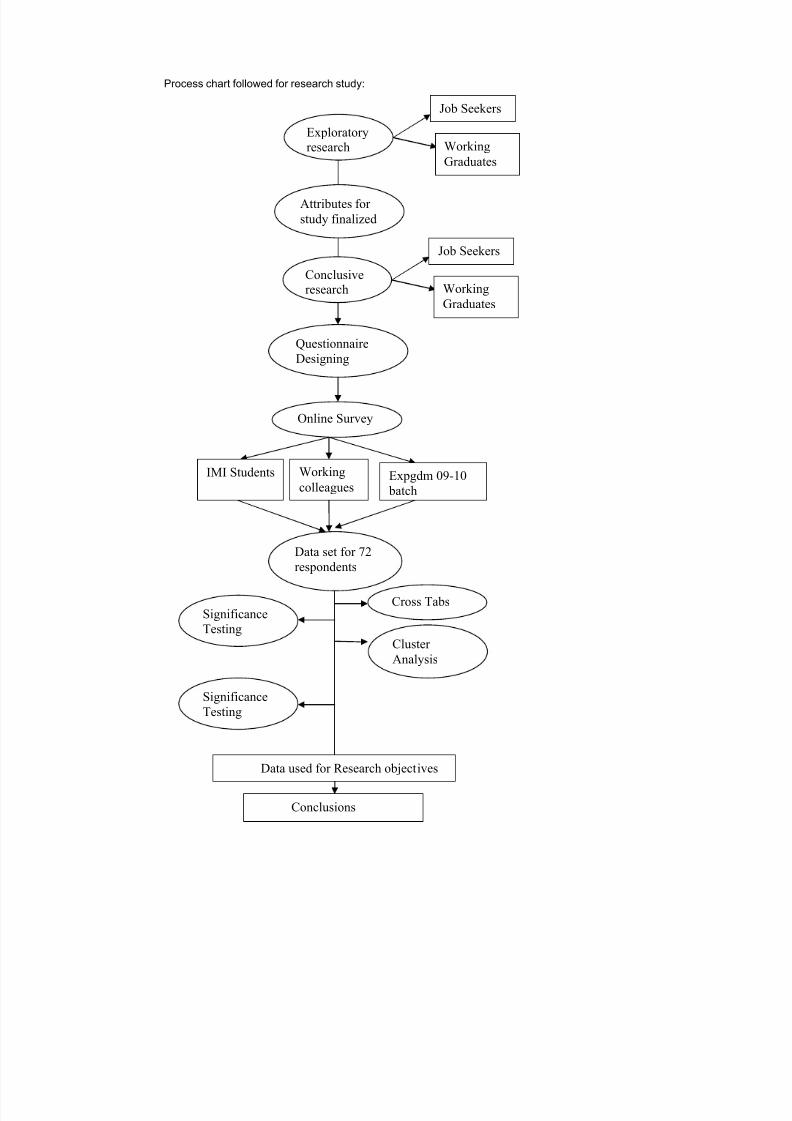
Process chart followed for research study:
Exploratoryresearch
Job Seekers
Working
Graduates
Attributes for
study finalized
Conclusiveresearch
Job Seekers
Working
Graduates
Questionnaire
Designing
Online Survey
IMI Students Working
colleaguesExpgdm 09-10
batch
Data set for 72
respondents
Cross Tabs
Cluster
Analysis
Significance
Testing
Significance
Testing
Data used for Research objectives
Conclusions
8/8/2019 CIS Report Ashish Kukreja 08Xpgdm11
http://slidepdf.com/reader/full/cis-report-ashish-kukreja-08xpgdm11 9/26
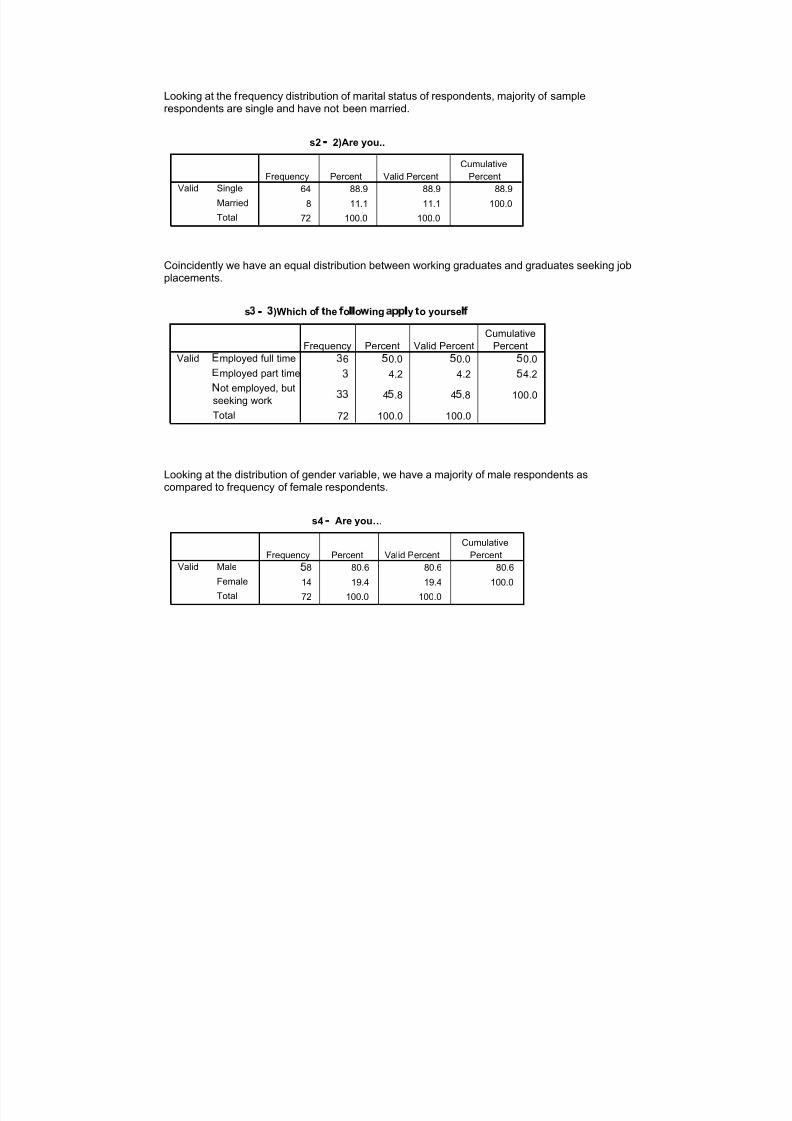
4) Research Plan:
4.1 Research Design: We will use both types of research designs.a) Exploratory research: This research will enable us with the major attributes that arespondent considers before applying for a desirable job. The output of this research willact as an input into our conclusive research. It will specify the attributes that should beused in our study.Survey of approximately 5 individuals was taken to find the major attributes:
User segments that were used for our exploratory research are as follows:
o Job Seekers: Job seekers are the current management students who are currentlyseeking for placements.
o Working executives: These are the management graduates who have got placed and arecurrently working in their respective companies,
b) Conclusive Research: We will use Cross sectional design, as the data will becollected only once. We will be using Multiple Cross sectional designs, as there are twoor more samples of population. This research will prioritize the attributes needs for different segments of management graduates. It will help us to understand the differentpreferences for different set of groups.
4.2 Sampling Plan:We are planning to collect data for 2 segments each of 50 respondents. These 2segments are defined below.
User Segments: The user segments which would be covered in this study are:
Job Seekers: Job seekers are the current management students who arecurrently seeking for placements. (50 Respondents)
Working executives: These are the management graduates who have got placedand are currently working in their respective companies, (50Respondents)
4.3 Data Collection Plan:1) An online survey was designed to collect the dataset. An email invite had been sent to
potential respondent with a set of user name and password. As per the Pilot survey, average complete time for each survey was10 to 12 minutes.
2) Soft copy of Questionnaire: Soft copy of questionnaire was mailed to respondents inXPGDM (2009-10) batch.
4.4 Data Analysis Plan: Data Analysis will take place using the following techniques:
a) Frequencies: Frequencies will help us to understand the nature of sample used for survey.b) Cross tabulation: It will help us to test the significance of a categorical variable used
within the study.c) Significance testing: This test will help us to test the influence of any categoricalvariable over attributes preference.d) Cluster Analysis: This test will help us to identify different heterogeneous sampleswithin the data set, where respondents within one cluster will be homogenous to eachother.e) Factor Analysis: This test will help us to relate the attributes that are correlated witheach other.
8/8/2019 CIS Report Ashish Kukreja 08Xpgdm11
http://slidepdf.com/reader/full/cis-report-ashish-kukreja-08xpgdm11 10/26
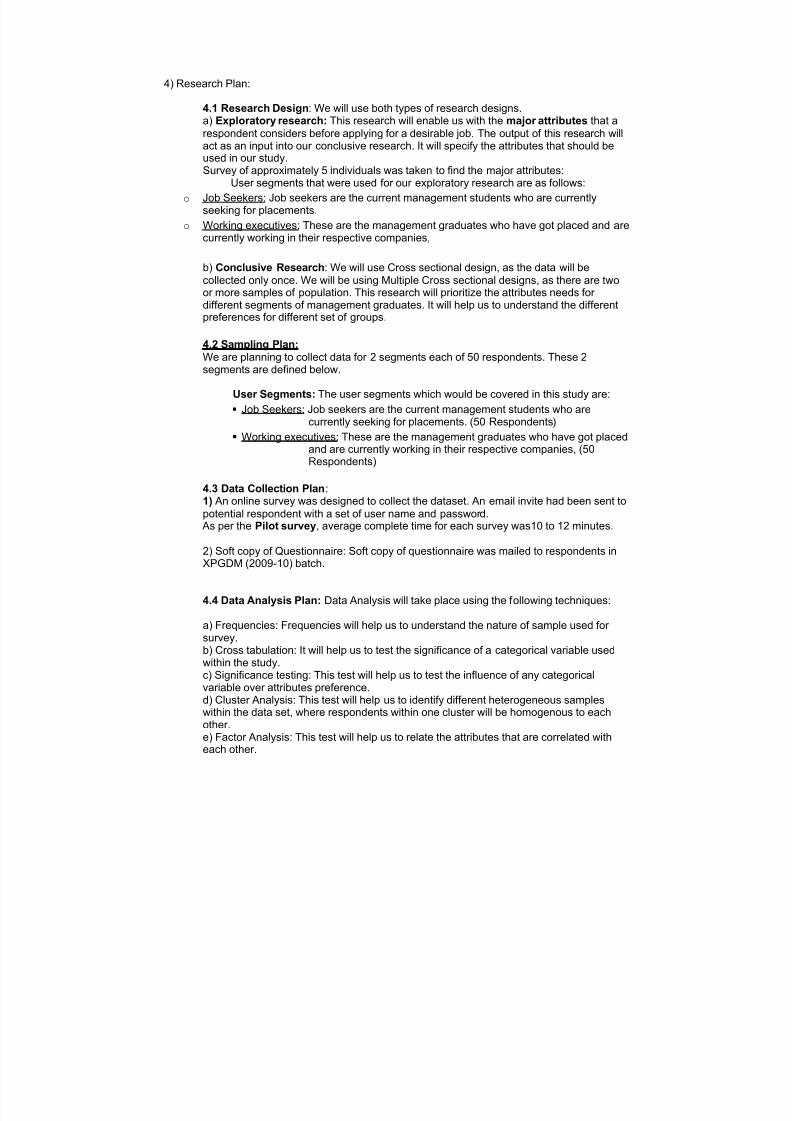
5) Findings of the study:
Out of 400 emails sent to respondents, we achieved a response rate of 24%. 96 respondents replied to the survey.
Out of these 96 respondents,20 Respondents left the survey incomplete.4 additional complete respondents were eliminated as there survey complete time wasless than the acceptable range. We achieved this range from the pilot study conductedover 5 genuine respondents.Finally we have got the complete data set for 72 respondents.
72
4
20
0
10
20
30
40
50
60
70
80
Completes Disqualified Incompletes
Going further with the data set,
We have a balanced sample with respondent¶s age ranging between 21 -31 years.
s1 - 1)Please mar
your age group.
23 31.9 31.9 31.9
29 40.3 40.3 72.2
20 27.8 27.8 100.0
72 100.0 100.0
21 to 24 years
25 to 27 years
27 to 31 years
¡ otal
¢ alid
Frequency £ ercent ¢ alid £ ercent
Cumulative
£ ercent
8/8/2019 CIS Report Ashish Kukreja 08Xpgdm11
http://slidepdf.com/reader/full/cis-report-ashish-kukreja-08xpgdm11 11/26
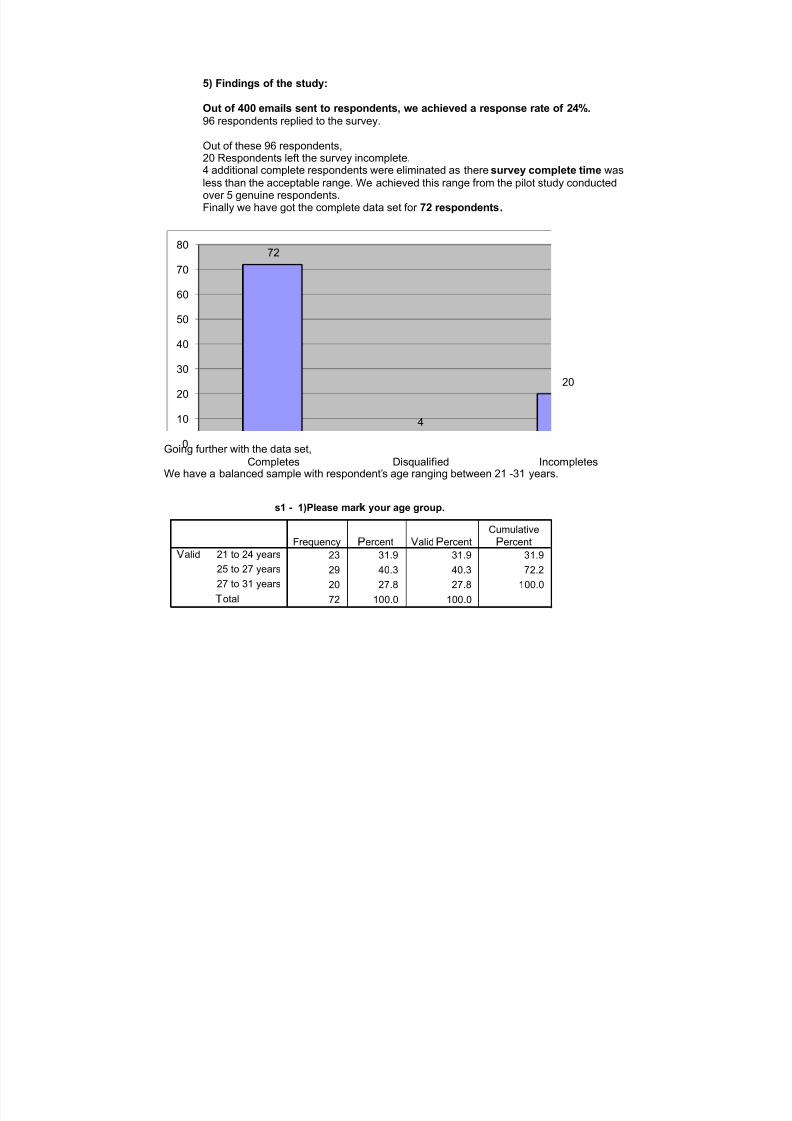
Looking at the frequency distribution of marital status of respondents, majority of samplerespondents are single and have not been married.
s2 ¤ 2)Are you..
64 88.9 88.9 88.9
8 11.1 11.1 100.0
72 100.0 100.0
Single
Married
Total
Valid
Frequency Percent Valid PercentCumulative
Percent
Coincidently we have an equal distribution between working graduates and graduates seeking jobplacements.
s¥
¤
¥ )Which o
¦
§
he¦
o¨ ̈
o©
ing
̈
y§
o yourse ̈
¦
6
0.0
0.0
0.0
4.2 4.2
4.2
4
.8 4
.8 100.0
72 100.0 100.0
mployed full time
mployed part time
ot employed, but
seeking work
Total
Valid
Frequency Percent Valid Percent
Cumulative
Percent
Looking at the distribution of gender variable, we have a majority of male respondents ascompared to frequency of female respondents.
s4 ¤ Are you«
8 80.6 80.6 80.6
14 19.4 19.4 100.0
72 100.0 100.0
Male
Female
Total
Valid
Frequency Percent Valid Percent
Cumulative
Percent
8/8/2019 CIS Report Ashish Kukreja 08Xpgdm11
http://slidepdf.com/reader/full/cis-report-ashish-kukreja-08xpgdm11 12/26
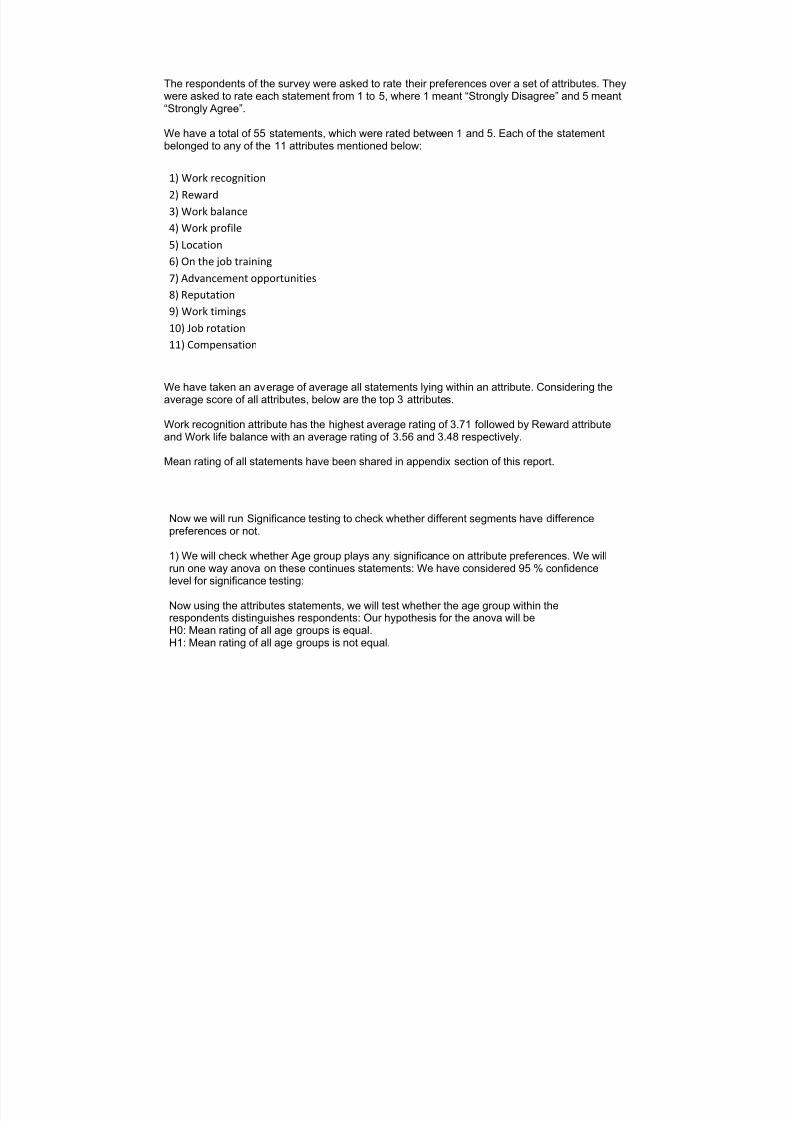
The respondents of the survey were asked to rate their preferences over a set of attributes. Theywere asked to rate each statement from 1 to 5, where 1 meant ³Strongly Disagree´ and 5 meant³Strongly Agree´.
We have a total of 55 statements, which were rated between 1 and 5. Each of the statementbelonged to any of the 11 attributes mentioned below:
1) Work recognition
2) Reward
3) Work balance
4) Work profile
5) Location
6) On the job training
7) Advancement opportunities
8) Reputation
9) Work timings
10) Job rotation11) Compensation
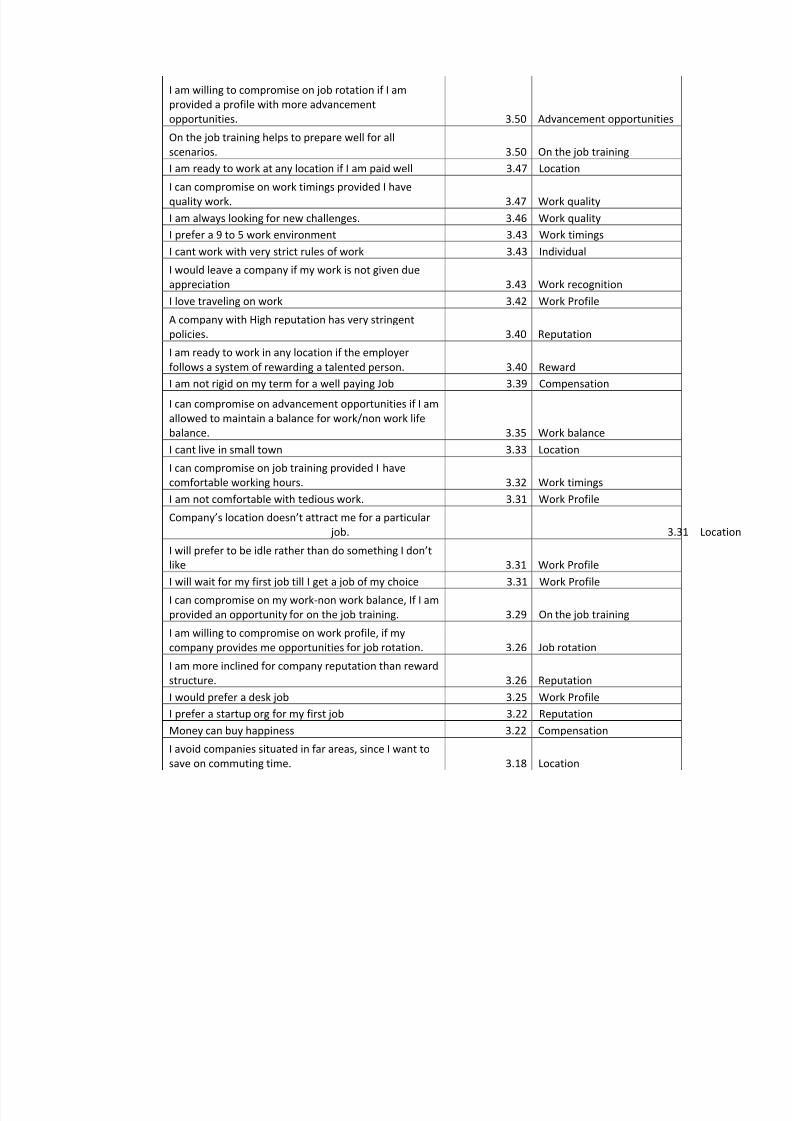
We have taken an average of average all statements lying within an attribute. Considering theaverage score of all attributes, below are the top 3 attributes.
Work recognition attribute has the highest average rating of 3.71 followed by Reward attributeand Work life balance with an average rating of 3.56 and 3.48 respectively.
Mean rating of all statements have been shared in appendix section of this report.
Now we will run Significance testing to check whether different segments have differencepreferences or not.
1) We will check whether Age group plays any significance on attribute preferences. We willrun one way anova on these continues statements: We have considered 95 % confidencelevel for significance testing:
Now using the attributes statements, we will test whether the age group within therespondents distinguishes respondents: Our hypothesis for the anova will beH0: Mean rating of all age groups is equal.H1: Mean rating of all age groups is not equal.
8/8/2019 CIS Report Ashish Kukreja 08Xpgdm11
http://slidepdf.com/reader/full/cis-report-ashish-kukreja-08xpgdm11 13/26
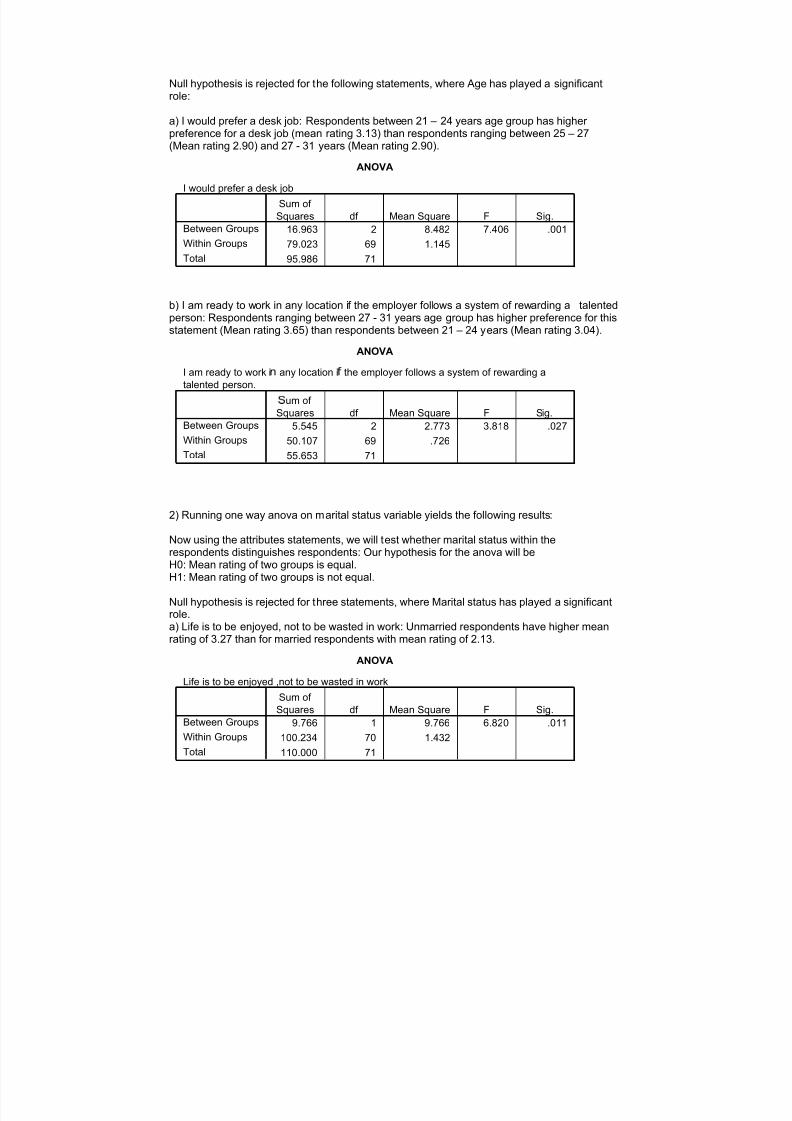
Null hypothesis is rejected for the following statements, where Age has played a significantrole:
a) I would prefer a desk job: Respondents between 21 ± 24 years age group has higher preference for a desk job (mean rating 3.13) than respondents ranging between 25 ± 27(Mean rating 2.90) and 27 - 31 years (Mean rating 2.90).
ANOVA
I would prefer a desk job
16.963 2 8.482 7.406 .001
79.023 69 1.145
95.986 71
Between Groups
Within Groups
Total
Sum of
Squares df Mean Square F Sig.
b) I am ready to work in any location if the employer follows a system of rewarding a talentedperson: Respondents ranging between 27 - 31 years age group has higher preference for this
statement (Mean rating 3.65) than respondents between 21 ± 24 years (Mean rating 3.04).
ANOVA
I am ready to work i
any location i
the employer follows a system of rewarding a
talented person.
5.545 2 2.773 3.818 .027
50.107 69 .726
55.653 71
Between Groups
Within Groups
Total
um of
Squares df Mean Square F Sig.
2) Running one way anova on marital status variable yields the following results:
Now using the attributes statements, we will test whether marital status within therespondents distinguishes respondents: Our hypothesis for the anova will beH0: Mean rating of two groups is equal.H1: Mean rating of two groups is not equal.
Null hypothesis is rejected for three statements, where Marital status has played a significantrole.a) Life is to be enjoyed, not to be wasted in work: Unmarried respondents have higher meanrating of 3.27 than for married respondents with mean rating of 2.13.
ANOVA
Life is to be enjoyed ,not to be wasted in work
9.766 1 9.766 6.820 .011
100.234 70 1.432
110.000 71
Between Groups
Within Groups
Total
Sum of
Squares df Mean Square F Sig.
8/8/2019 CIS Report Ashish Kukreja 08Xpgdm11
http://slidepdf.com/reader/full/cis-report-ashish-kukreja-08xpgdm11 14/26
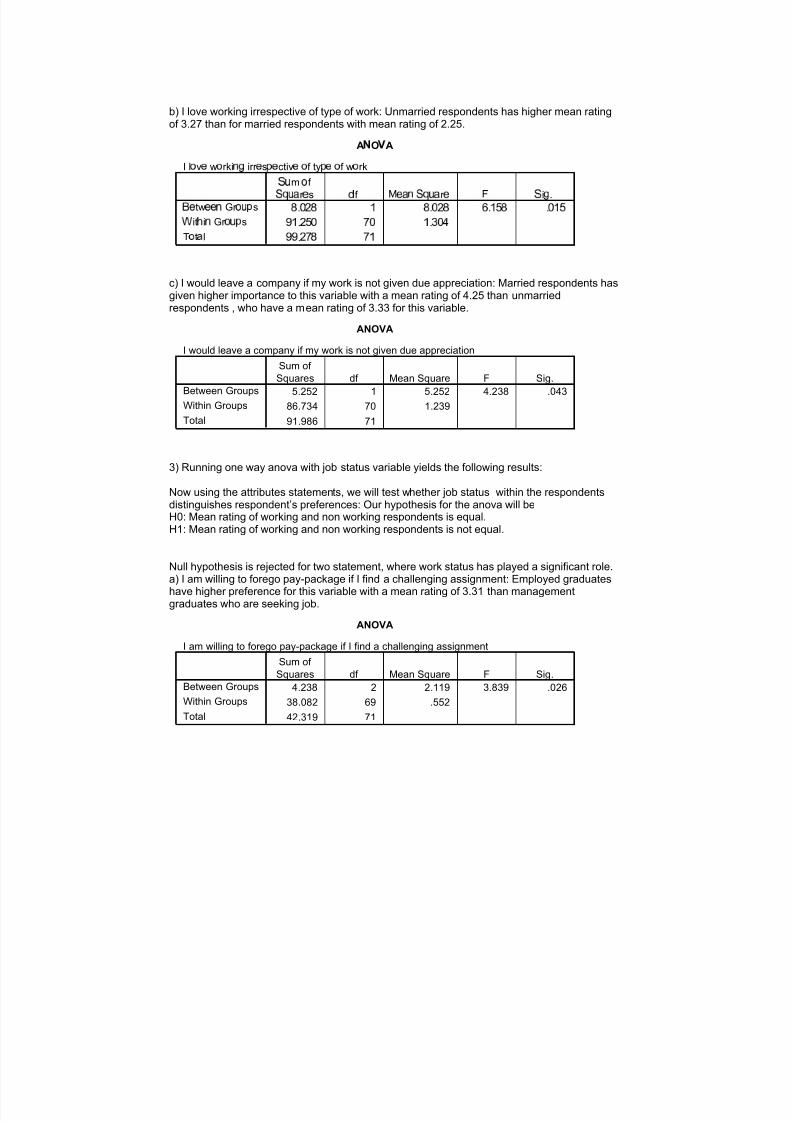
b) I love working irrespective of type of work: Unmarried respondents has higher mean ratingof 3.27 than for married respondents with mean rating of 2.25.
A O!
A
I l"
v # w"
rki$
% irr # s & # ctiv # "
f ty & # "
f w"
rk
' .
( ) ' 0 '
.( ) '
1
.0
2
' .
( 0
2
3 0
.)
2
( 4 ( 0
.5 ( 6
3 3 .
) 4 ' 4 0
7 # tw
# #
$
Gr "
8
& s
9 it@ i$
Gr "
8
& s
T"
tA l
B
8
m"
f
B C
8
A r # sD
f E # A
$
B C
8
A r # F B
i% .
c) I would leave a company if my work is not given due appreciation: Married respondents hasgiven higher importance to this variable with a mean rating of 4.25 than unmarriedrespondents , who have a mean rating of 3.33 for this variable.
ANOVA
I would leave a company if my work is not given due appreciation
5.252 1 5.252 4.238 .043
86.734 70 1.239
91.986 71
Between Groups
Within Groups
Total
Sum of
Squares df Mean Square F Sig.
3) Running one way anova with job status variable yields the following results:
Now using the attributes statements, we will test whether job status within the respondentsdistinguishes respondent¶s preferences: Our hypothesis for the anova will beH0: Mean rating of working and non working respondents is equal.H1: Mean rating of working and non working respondents is not equal.
Null hypothesis is rejected for two statement, where work status has played a significant role.a) I am willing to forego pay-package if I find a challenging assignment: Employed graduateshave higher preference for this variable with a mean rating of 3.31 than managementgraduates who are seeking job.
ANOVA
I am willing to forego pay-package if I find a challenging assignment
4.238 2 2.119 3.839 .026
38.082 69 .552
42.319 71
Between Groups
Within Groups
Total
Sum of Squares df Mean Square F Sig.
8/8/2019 CIS Report Ashish Kukreja 08Xpgdm11
http://slidepdf.com/reader/full/cis-report-ashish-kukreja-08xpgdm11 15/26
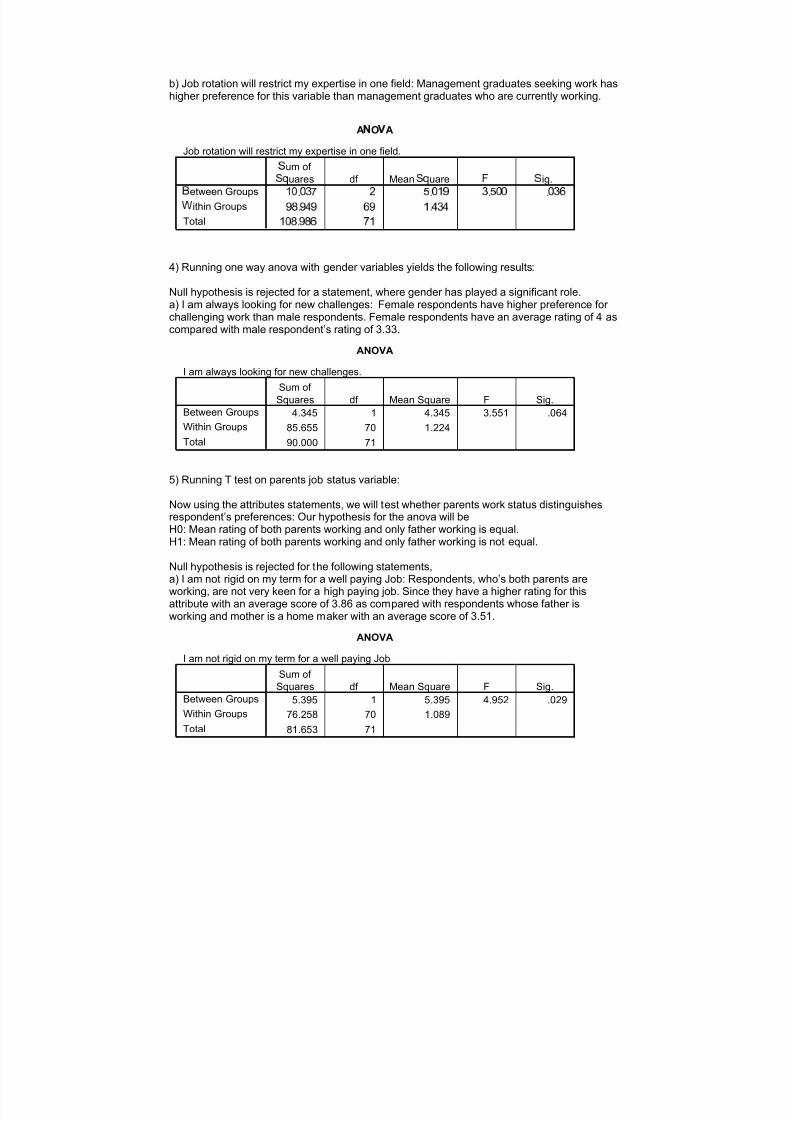
b) Job rotation will restrict my expertise in one field: Management graduates seeking work hashigher preference for this variable than management graduates who are currently working.
A G OH
A
Job rotation will restrict my expertise in one field.
I P .P
Q R
S
T .P I U
Q
.T P P
.P
Q
V
U W .U
X
U V U I .
X Q X
I P W
.U W V
R
I
Y etween Groups
̀ ithin Groups
Total
a um of a b
uares df Meana b
uarec a
ig.
4) Running one way anova with gender variables yields the following results:
Null hypothesis is rejected for a statement, where gender has played a significant role.a) I am always looking for new challenges: Female respondents have higher preference for challenging work than male respondents. Female respondents have an average rating of 4 as
compared with male respondent¶s rating of 3.33.
ANOVA
I am always looking for new challenges.
4.345 1 4.345 3.551 .064
85.655 70 1.224
90.000 71
Between Groups
Within Groups
Total
Sum of
Squares df Mean Square F Sig.
5) Running T test on parents job status variable:
Now using the attributes statements, we will test whether parents work status distinguishesrespondent¶s preferences: Our hypothesis for the anova will beH0: Mean rating of both parents working and only father working is equal.H1: Mean rating of both parents working and only father working is not equal.
Null hypothesis is rejected for the following statements,a) I am not rigid on my term for a well paying Job: Respondents, who¶s both parents areworking, are not very keen for a high paying job. Since they have a higher rating for thisattribute with an average score of 3.86 as compared with respondents whose father isworking and mother is a home maker with an average score of 3.51.
ANOVA
I am not rigid on my term for a well paying Job
5.395 1 5.395 4.952 .029
76.258 70 1.089
81.653 71
Between Groups
Within Groups
Total
Sum of
Squares df Mean Square F Sig.
8/8/2019 CIS Report Ashish Kukreja 08Xpgdm11
http://slidepdf.com/reader/full/cis-report-ashish-kukreja-08xpgdm11 16/26
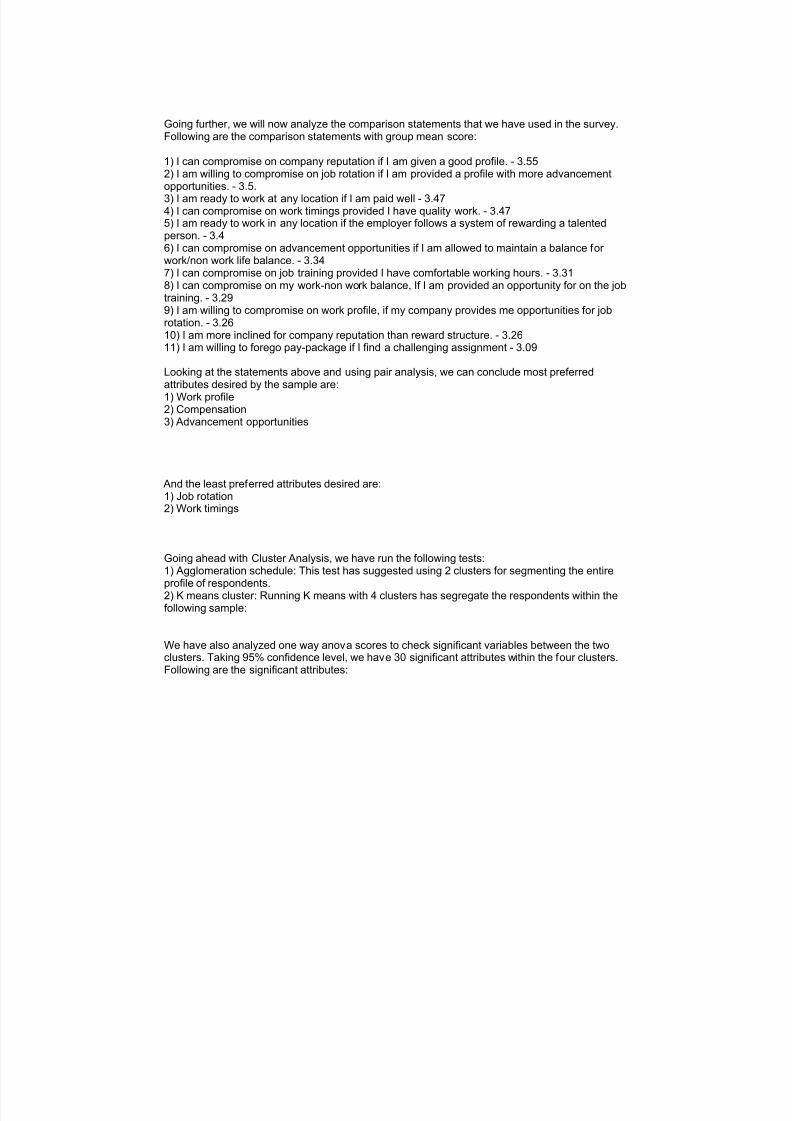
Going further, we will now analyze the comparison statements that we have used in the survey.Following are the comparison statements with group mean score:
1) I can compromise on company reputation if I am given a good profile. - 3.552) I am willing to compromise on job rotation if I am provided a profile with more advancementopportunities. - 3.5.3) I am ready to work at any location if I am paid well - 3.474) I can compromise on work timings provided I have quality work. - 3.475) I am ready to work in any location if the employer follows a system of rewarding a talentedperson. - 3.46) I can compromise on advancement opportunities if I am allowed to maintain a balance for work/non work life balance. - 3.347) I can compromise on job training provided I have comfortable working hours. - 3.318) I can compromise on my work-non work balance, If I am provided an opportunity for on the jobtraining. - 3.299) I am willing to compromise on work profile, if my company provides me opportunities for jobrotation. - 3.2610) I am more inclined for company reputation than reward structure. - 3.2611) I am willing to forego pay-package if I find a challenging assignment - 3.09
Looking at the statements above and using pair analysis, we can conclude most preferredattributes desired by the sample are:1) Work profile2) Compensation3) Advancement opportunities
And the least preferred attributes desired are:
1) Job rotation2) Work timings
Going ahead with Cluster Analysis, we have run the following tests:1) Agglomeration schedule: This test has suggested using 2 clusters for segmenting the entireprofile of respondents.2) K means cluster: Running K means with 4 clusters has segregate the respondents within thefollowing sample:
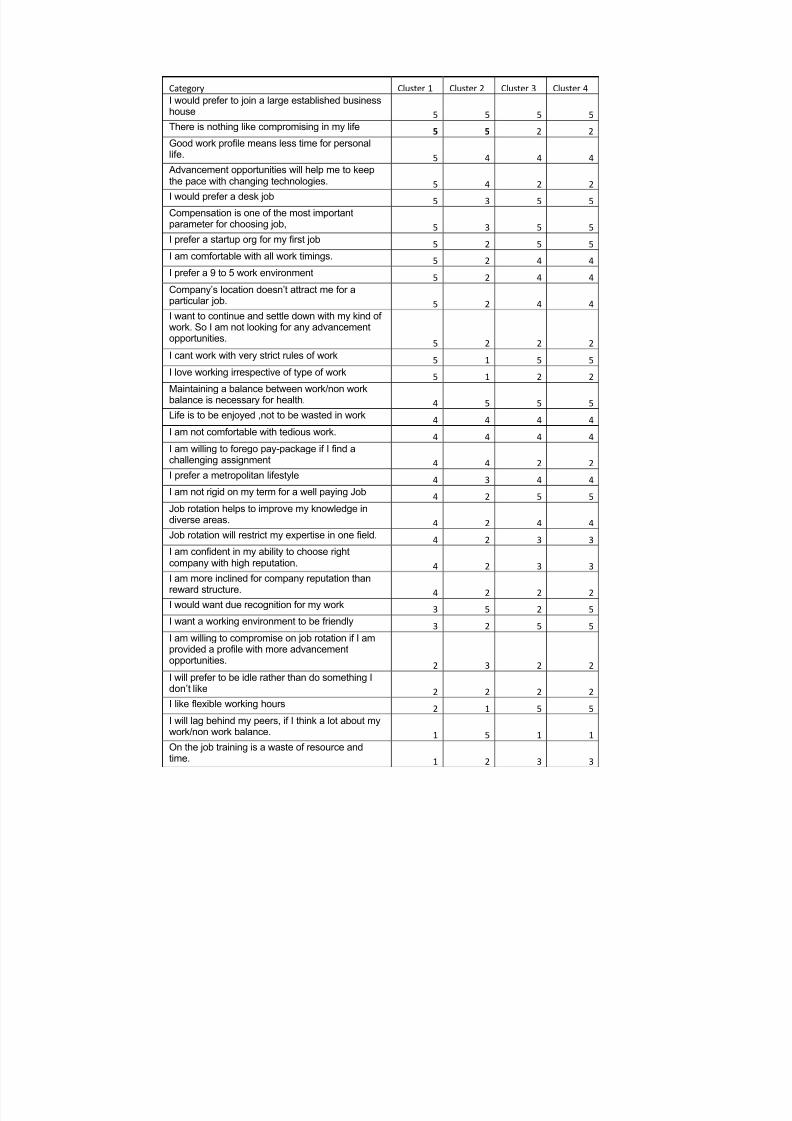
We have also analyzed one way anova scores to check significant variables between the two
clusters. Taking 95% confidence level, we have 30 significant attributes within the four clusters.Following are the significant attributes:
8/8/2019 CIS Report Ashish Kukreja 08Xpgdm11
http://slidepdf.com/reader/full/cis-report-ashish-kukreja-08xpgdm11 17/26
Category Cluster 1 Cluster 2 Cluster 3 Cluster 4
I would prefer to join a large established businesshouse 5 5 5 5
There is nothing like compromising in my life5 5 2 2
Good work profile means less time for personallife. 5 4 4 4
Advancement opportunities will help me to keepthe pace with changing technologies. 5 4 2 2
I would prefer a desk job 5 3 5 5
Compensation is one of the most importantparameter for choosing job, 5 3 5 5
I prefer a startup org for my first job5 2 5 5
I am comfortable with all work timings. 5 2 4 4
I prefer a 9 to 5 work environment5 2 4 4
Company¶s location doesn¶t attract me for aparticular job. 5 2 4 4
I want to continue and settle down with my kind of
work. So I am not looking for any advancementopportunities.
5 2 2 2
I cant work with very strict rules of work5 1 5 5
I love working irrespective of type of work 5 1 2 2
Maintaining a balance between work/non workbalance is necessary for health. 4 5 5 5
Life is to be enjoyed ,not to be wasted in work4 4 4 4
I am not comfortable with tedious work.4 4 4 4
I am willing to forego pay-package if I find achallenging assignment 4 4 2 2
I prefer a metropolitan lifestyle 4 3 4 4
I am not rigid on my term for a well paying Job 4 2 5 5Job rotation helps to improve my knowledge indiverse areas. 4 2 4 4
Job rotation will restrict my expertise in one field.4 2 3 3
I am confident in my ability to choose rightcompany with high reputation. 4 2 3 3
I am more inclined for company reputation thanreward structure. 4 2 2 2
I would want due recognition for my work 3 5 2 5
I want a working environment to be friendly3 2 5 5
I am willing to compromise on job rotation if I amprovided a profile with more advancement
opportunities. 2 3 2 2
I will prefer to be idle rather than do something Idon¶t like 2 2 2 2
I like flexible working hours2 1 5 5
I will lag behind my peers, if I think a lot about mywork/non work balance. 1 5 1 1
On the job training is a waste of resource andtime. 1 2 3 3
8/8/2019 CIS Report Ashish Kukreja 08Xpgdm11
http://slidepdf.com/reader/full/cis-report-ashish-kukreja-08xpgdm11 18/26
Looking at these significant variables,Cluster 1 can be renamed as: Company reputation oriented respondents1) They are more inclined to company reputation.2) They prefer a 9 to 5 highly challenging job profile.3) They are looking for advancement opportunities.
Cluster 2 respondents can be renamed as: Work profile oriented respondents1) They are higher preference towards their work profile.2) They do not have any preference for 9 ± 5 job.3) They can work with strict rules in an organization.4) They do not want to lag behind their peers.
Cluster 3 and cluster 4 respondents have almost same preferences except one attribute wherecluster 4 respondents are very keen for work recognition than cluster 3 respondents.
Cluster 3 respondents can be renamed as: Balance life oriented respondents1) They prefer flexible working hours.2) They do not prefer a strict rules organization.3) They prefer work friendly work environment.4) They prefer a balanced work life.
Cluster 4 respondents can be renamed as: Work recognition oriented respondents:1) They want recognition for their work.2) They prefer flexible working hours.3) They do not prefer a strict rules organization.4) They prefer work friendly work environment.5) They prefer a balanced work life.
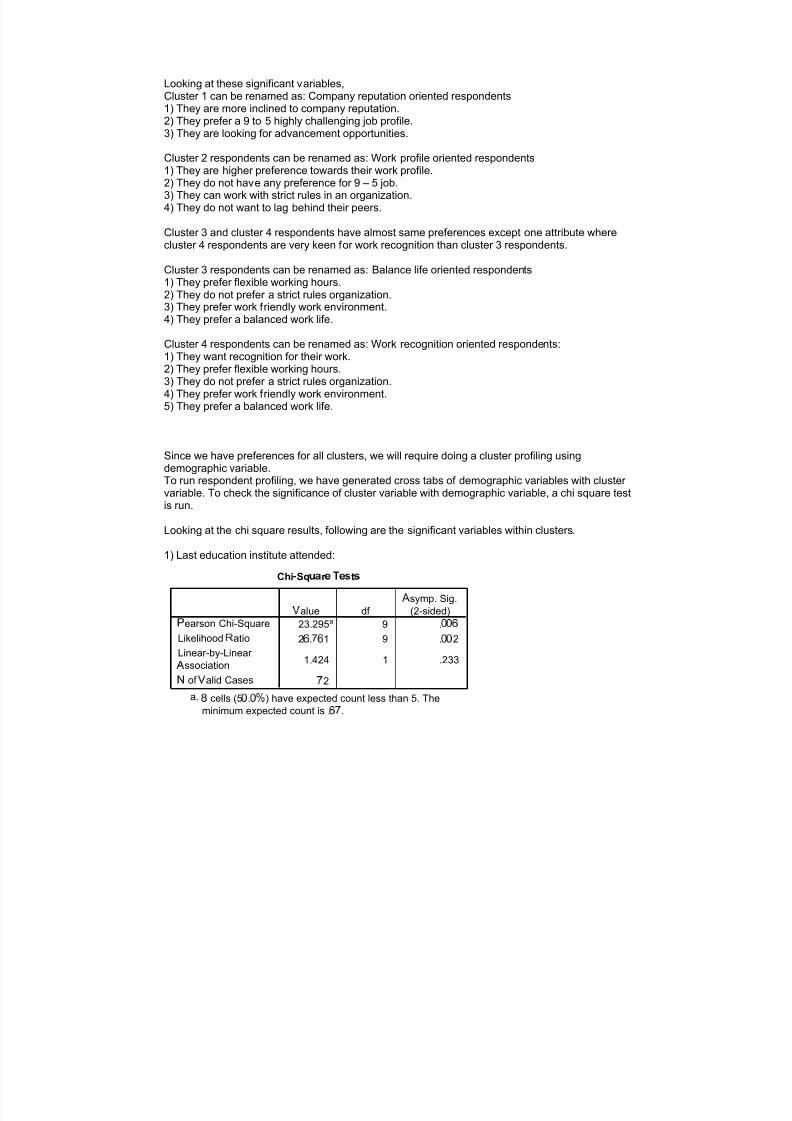
Since we have preferences for all clusters, we will require doing a cluster profiling usingdemographic variable.To run respondent profiling, we have generated cross tabs of demographic variables with cluster
variable. To check the significance of cluster variable with demographic variable, a chi square testis run.
Looking at the chi square results, following are the significant variables within clusters.
1) Last education institute attended:
Chi d Sq e
f
r g
h
g i
ti
23.295a 9 .p p q
2q .r q
1 9 .p p
2
1.424 1 .233
r 2
s earson Chi-Square
Likelihoodt
atio
Linear-by-Linear
u ssociation
v of w
alid Cases
w
alue df
u symp. Sig.
(2-sided)
x cells (5p .p y
) have expected count less than 5. The
minimum expected count is .q r
.
a.
8/8/2019 CIS Report Ashish Kukreja 08Xpgdm11
http://slidepdf.com/reader/full/cis-report-ashish-kukreja-08xpgdm11 19/26
Cr
t
6 0 8 5
31.6% .0% 42.1% 26.3% 100.0
30.0% .0% 25.0% 31.3% 26.4
6 1 8 3
33.3% 5.6% 44.4% 16.7% 100.0
30.0% 25.0% 25.0% 18.8% 25.0
7 2 14 0
30.4% 8.7% 60.9% .0% 100.0
35.0% 50.0% 43.8% .0% 31.9
1 1 2 8
8.3% 8.3% 16.7% 66.7% 100.0
5.0% 25.0% 6.3% 50.0% 16.7
20 4 32 16
27.8% 5.6% 44.4% 22.2% 100.0
100.0% 100.0% 100.0% 100.0% 100.0
Count
% within s4b2 -
ast education
institute attended
% within Cluster
u ber of Case
Count
% within s4b2 -
ast education
institute attended
% within Cluster
u ber of Case
Count
% within s4b2 -
ast educationinstitute attended
% within Cluster
u ber of Case
Count
% within s4b2 -
ast education
institute attended
% within Cluster
u ber of Case
Count
% within s4b2 -
ast educationinstitute attended
% within Cluster
u ber of Case
Autono ous
niversity
over ent institution
Pvt institution
s4b2 -
ast
education
institute attended
Total
1 2 3 4
Cluster
u ber of Case
Tota
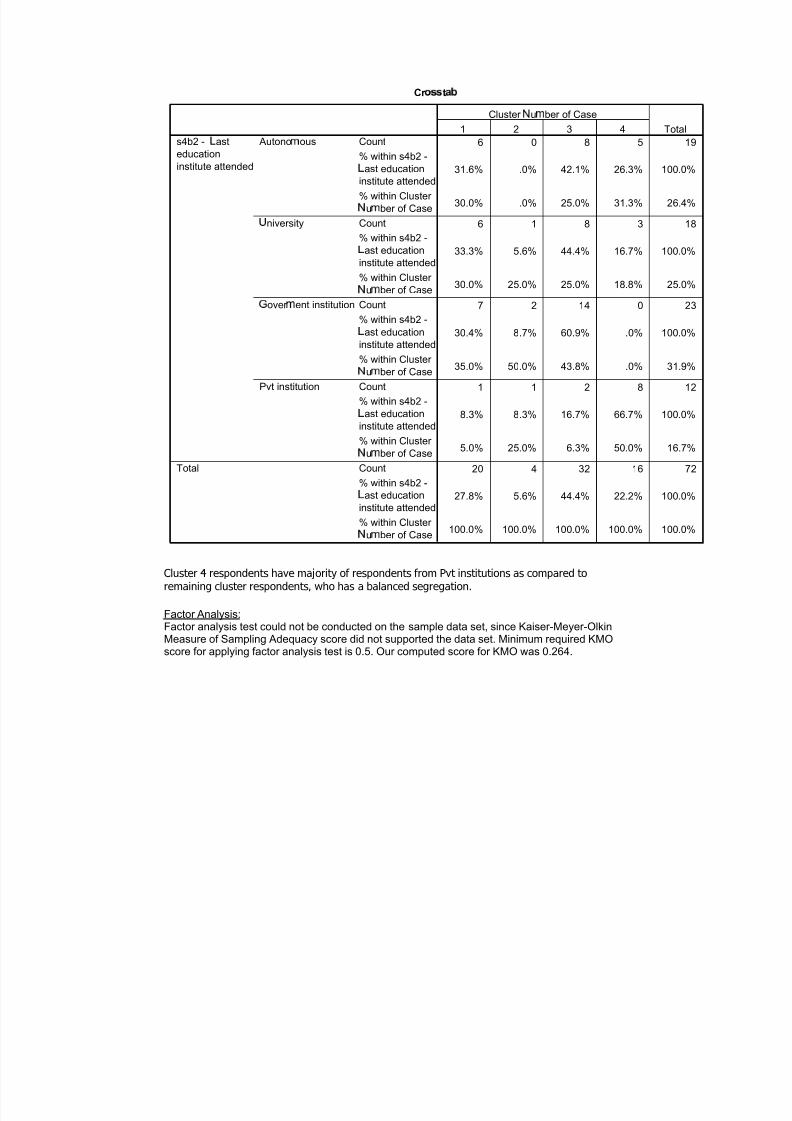
Cluster 4 respondents have majority of respondents from Pvt institutions as compared toremaining cluster respondents, who has a balanced segregation.
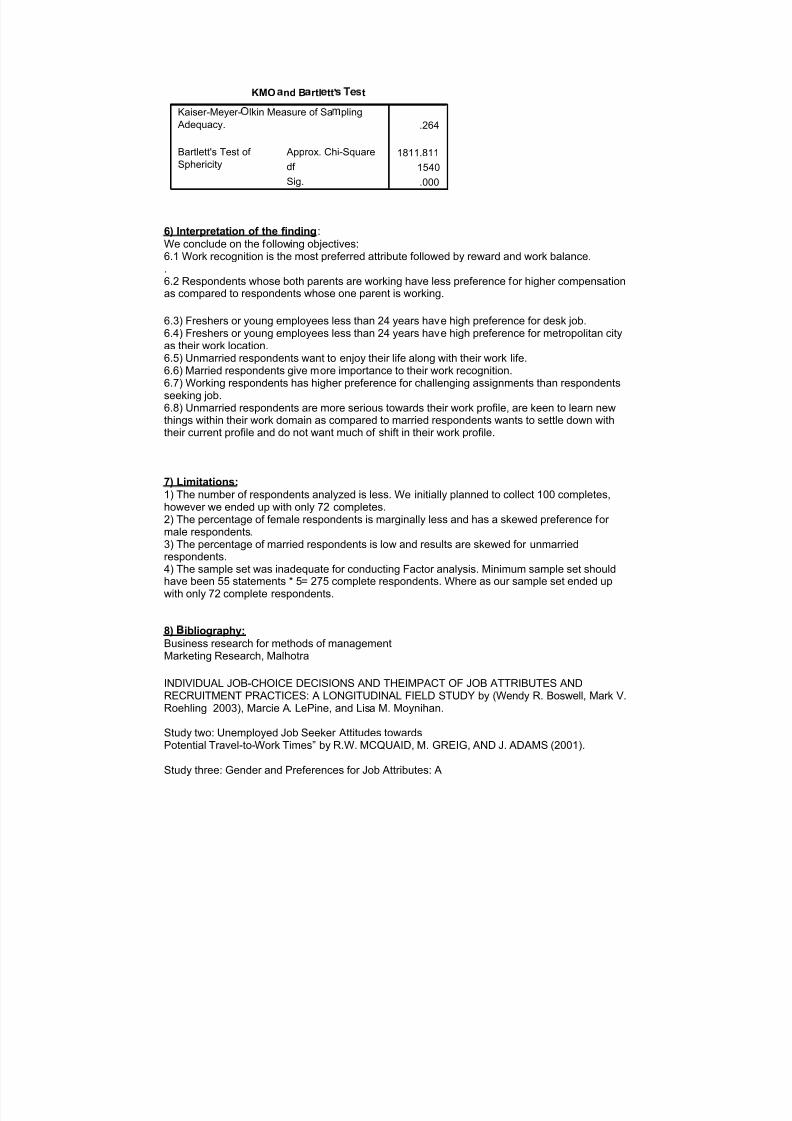
Factor Analysis:Factor analysis test could not be conducted on the sample data set, since Kaiser-Meyer-OlkinMeasure of Sampling Adequacy score did not supported the data set. Minimum required KMOscore for applying factor analysis test is 0.5. Our computed score for KMO was 0.264.
8/8/2019 CIS Report Ashish Kukreja 08Xpgdm11
http://slidepdf.com/reader/full/cis-report-ashish-kukreja-08xpgdm11 20/26
KMO
nd B
rtl
tt'
t
.264
1811.811
1540
.000
Kaiser-Meyer- lkin Measur e of Sa
pling
Adequacy.
Appr ox. Chi-Squar e
df
Sig.
Bartlett's Test of
Sphericity
6) Interpretation of the finding:We conclude on the following objectives:6.1 Work recognition is the most preferred attribute followed by reward and work balance..6.2 Respondents whose both parents are working have less preference for higher compensationas compared to respondents whose one parent is working.
6.3) Freshers or young employees less than 24 years have high preference for desk job.
6.4) Freshers or young employees less than 24 years have high preference for metropolitan cityas their work location.6.5) Unmarried respondents want to enjoy their life along with their work life.6.6) Married respondents give more importance to their work recognition.6.7) Working respondents has higher preference for challenging assignments than respondentsseeking job.6.8) Unmarried respondents are more serious towards their work profile, are keen to learn newthings within their work domain as compared to married respondents wants to settle down withtheir current profile and do not want much of shift in their work profile.
7) Limitations:
1) The number of respondents analyzed is less. We initially planned to collect 100 completes,however we ended up with only 72 completes.2) The percentage of female respondents is marginally less and has a skewed preference for male respondents.3) The percentage of married respondents is low and results are skewed for unmarriedrespondents.4) The sample set was inadequate for conducting Factor analysis. Minimum sample set shouldhave been 55 statements * 5= 275 complete respondents. Where as our sample set ended upwith only 72 complete respondents.
8) ibliography:Business research for methods of management
Marketing Research, Malhotra
INDIVIDUAL JOB-CHOICE DECISIONS AND THEIMPACT OF JOB ATTRIBUTES ANDRECRUITMENT PRACTICES: A LONGITUDINAL FIELD STUDY by (Wendy R. Boswell, Mark V.Roehling 2003), Marcie A. LePine, and Lisa M. Moynihan.
Study two: Unemployed Job Seeker Attitudes towardsPotential Travel-to-Work Times´ by R.W. MCQUAID, M. GREIG, AND J. ADAMS (2001).
Study three: Gender and Preferences for Job Attributes: A
8/8/2019 CIS Report Ashish Kukreja 08Xpgdm11
http://slidepdf.com/reader/full/cis-report-ashish-kukreja-08xpgdm11 21/26
Cross Cultural Comparison by Beverly A. Browne1 (1997)
Study four: Perceived Job Attributes, Job Satisfaction, and Psychological Distress: A Comparisonof Working Men and Women by Carl D'Arcy, John Syrotuik and C . M . Siddique 1984
9) Appendix: Attached is the final data set used for the study. Along with the study I have
included the spss syntaxes that were used for data preparation.
Fina l da ta .sav 1) Value labels.sps 2) Recode.sps
Mean analysis for 55 statements:
Statement Mean Rating Mapped attribute
I would love to work with an employee, who
consistently rewards employees for excellence in work. 4.21 Reward
Compensation is one of the most important parameter
for choosing job, 4.18 Compensation
Maintaining a balance between work/non work balance
is necessary for health. 3.78 Work balance
I am confident in my ability to choose right company
with high reputation. 3.72 Reputation
I would want due recognition for my work 3.71 Work recognition
I want a working environment to be friendly 3.64 Work balance
Work profile is one of the most important parameter
for selecting a job. 3.61 Work Profile
I like flexible working hours 3.60 Work timings
Job rotation helps to improve my knowledge in diverse
areas. 3.57 Job rotation
Advancement opportunities will help me to keep the
pace with changing technologies. 3.57 Advancement opportunities
I prefer a metropolitan lifestyle 3.56 Location
If the work is challenging ,I am comfortable working in a
small organization 3.56 Work Profile
I can compromise on company reputation if I am given
a good profile. 3.56 Work Profile
I would prefer to join a large established business house 3.53 Reputation
I am a disciplined worker 3.53 Individual
8/8/2019 CIS Report Ashish Kukreja 08Xpgdm11
http://slidepdf.com/reader/full/cis-report-ashish-kukreja-08xpgdm11 22/26
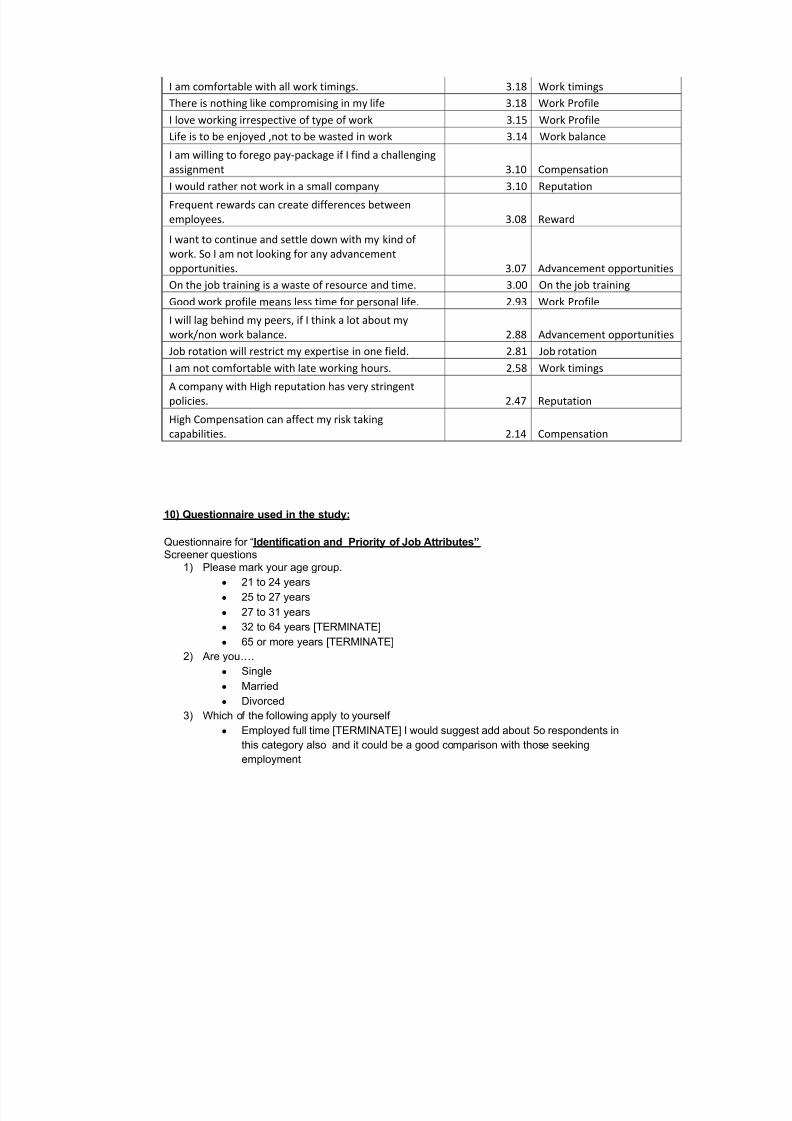
I am willing to compromise on job rotation if I am
provided a profile with more advancement
opportunities. 3.50 Advancement opportunities
On the job training helps to prepare well for all
scenarios. 3.50 On the job training
I am ready to work at any location if I am paid well 3.47 Location
I can compromise on work timings provided I have
quality work. 3.47 Work quality
I am always looking for new challenges. 3.46 Work quality
I prefer a 9 to 5 work environment 3.43 Work timings
I cant work with very strict rules of work 3.43 Individual
I would leave a company if my work is not given due
appreciation 3.43 Work recognition
I love traveling on work 3.42 Work Profile
A company with High reputation has very stringent
policies. 3.40 Reputation
I am ready to work in any location if the employer
follows a system of rewarding a talented person. 3.40 Reward
I am not rigid on my term for a well paying Job 3.39 Compensation
I can compromise on advancement opportunities if I am
allowed to maintain a balance for work/non work life
balance. 3.35 Work balance
I cant live in small town 3.33 Location
I can compromise on job training provided I have
comfortable working hours. 3.32 Work timings
I am not comfortable with tedious work. 3.31 Work Profile
Companys location doesnt attract me for a particular
job. 3.31
I will prefer to be idle rather than do something I dont
like 3.31 Work Profile
I will wait for my first job till I get a job of my choice 3.31 Work Profile
I can compromise on my work-non work balance, If I am
provided an opportunity for on the job training. 3.29 On the job training
I am willing to compromise on work profile, if my
company provides me opportunities for job rotation. 3.26 Job rotation
I am more inclined for company reputation than reward
structure. 3.26 Reputation
I would prefer a desk job 3.25 Work Profile
I prefer a startup org for my first job 3.22 Reputation
Money can buy happiness 3.22 Compensation
I avoid companies situated in far areas, since I want to
save on commuting time. 3.18 Location
8/8/2019 CIS Report Ashish Kukreja 08Xpgdm11
http://slidepdf.com/reader/full/cis-report-ashish-kukreja-08xpgdm11 23/26
8/8/2019 CIS Report Ashish Kukreja 08Xpgdm11
http://slidepdf.com/reader/full/cis-report-ashish-kukreja-08xpgdm11 24/26
y Employed part time
y Not employed, but seeking work
y Retired [TERMINATE]
4) Are you«
y Male
y Female
5) About your parents ..
a. Father working, Mother Home maker
b. Both working
6) Siblings
a. Brother(s)«.
b. Sister(s)«.
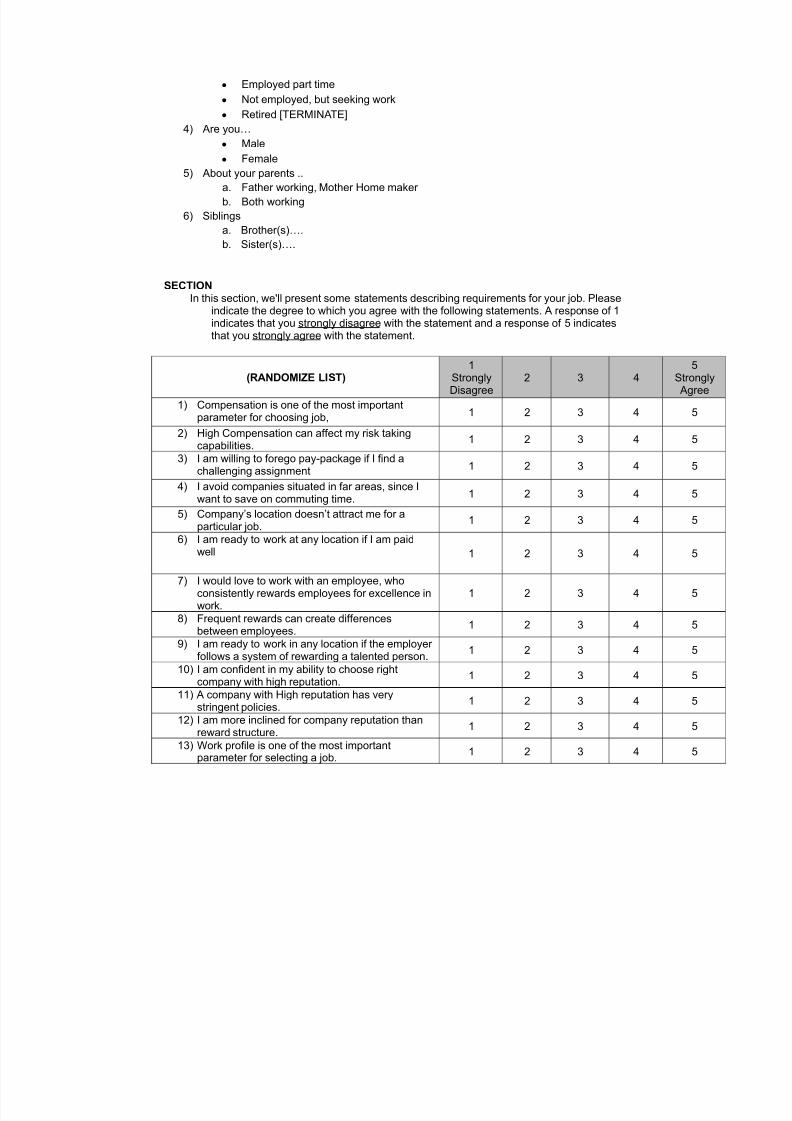
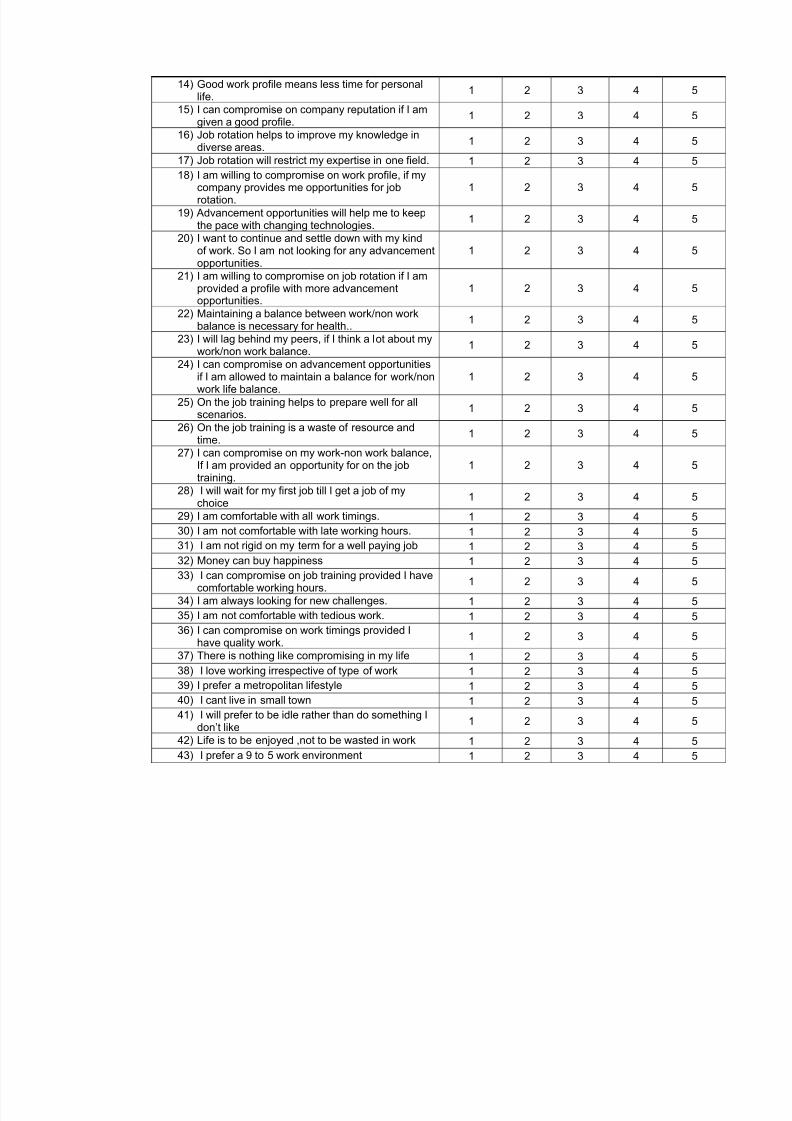
SECTIONIn this section, we'll present some statements describing requirements for your job. Please
indicate the degree to which you agree with the following statements. A response of 1indicates that you strongly disagree with the statement and a response of 5 indicatesthat you strongly agree with the statement.
(RANDOMIZE LIST) 1
StronglyDisagree
2 3 4 St A
1) Compensation is one of the most importantparameter for choosing job, 1 2 3 4
2) High Compensation can affect my risk takingcapabilities.
1 2 3 4
3) I am willing to forego pay-package if I find achallenging assignment 1 2 3 4
4) I avoid companies situated in far areas, since Iwant to save on commuting time. 1 2 3 4
5) Company¶s location doesn¶t attract me for aparticular job.
1 2 3 4
6) I am ready to work at any location if I am paidwell 1 2 3 4
7) I would love to work with an employee, whoconsistently rewards employees for excellence inwork.
1 2 3 4
8) Frequent rewards can create differencesbetween employees.
1 2 3 4
9) I am ready to work in any location if the employer
follows a system of rewarding a talented person.
1 2 3 4
10) I am confident in my ability to choose rightcompany with high reputation.
1 2 3 4
11) A company with High reputation has verystringent policies.
1 2 3 4
12) I am more inclined for company reputation thanreward structure.
1 2 3 4
13) Work profile is one of the most importantparameter for selecting a job.
1 2 3 4
8/8/2019 CIS Report Ashish Kukreja 08Xpgdm11
http://slidepdf.com/reader/full/cis-report-ashish-kukreja-08xpgdm11 25/26
8/8/2019 CIS Report Ashish Kukreja 08Xpgdm11
http://slidepdf.com/reader/full/cis-report-ashish-kukreja-08xpgdm11 26/26
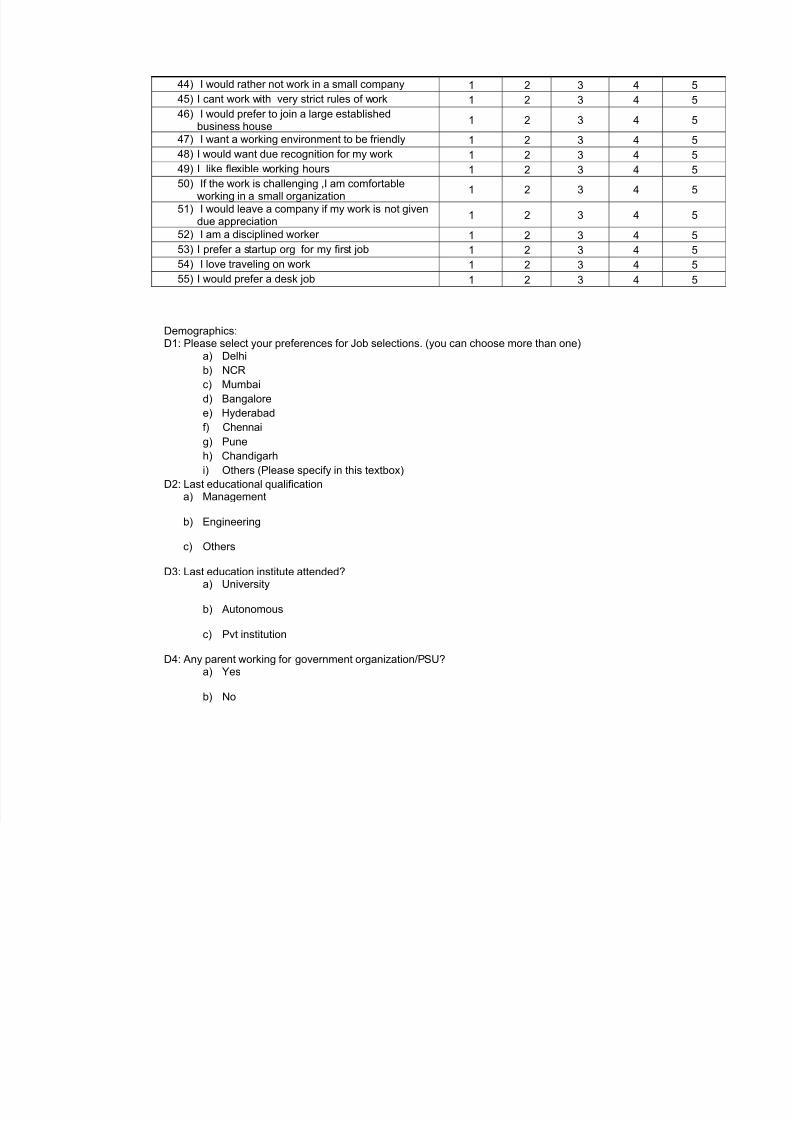
44) I would rather not work in a small company 1 2 3 4
45) I cant work with very strict rules of work 1 2 3 4
46) I would prefer to join a large establishedbusiness house
1 2 3 4
47) I want a working environment to be friendly 1 2 3 4
48) I would want due recognition for my work 1 2 3 4
49) I like flexible working hours 1 2 3 4
50) If the work is challenging ,I am comfortableworking in a small organization
1 2 3 4
51) I would leave a company if my work is not givendue appreciation
1 2 3 4
52) I am a disciplined worker 1 2 3 4
53) I prefer a startup org for my first job 1 2 3 4
54) I love traveling on work 1 2 3 4
55) I would prefer a desk job 1 2 3 4
Demographics:D1: Please select your preferences for Job selections. (you can choose more than one)
a) Delhi
b) NCR
c) Mumbai
d) Bangalore
e) Hyderabad
f) Chennai
g) Pune
h) Chandigarh
i) Others (Please specify in this textbox)
D2: Last educational qualification
a) Management
b) Engineering
c) Others
D3: Last education institute attended?a) University
b) Autonomous
c) Pvt institution
D4: Any parent working for government organization/PSU?a) Yes
b) No