citibank international limited - rns · pdf filecitibank international limited...
TRANSCRIPT
CITIBANK INTERNATIONAL LIMITED (formerly CITIBANK INTERNATIONAL PLC)
(Registered Number: 1088249)
ANNUAL REPORT AND FINANCIAL STATEMENTS
for the year ended 31 December 2014

CITIBANK INTERNATIONAL LIMITED
DIRECTORS’ REPORT for the year ended 31 December 2014
2
The Directors present their Report and the audited financial statements of Citibank International Limited (formerly
Citibank International Plc) (the Company or CIL) and its subsidiaries (the Group) for the year ended 31 December
2014.
Business environment
The Company is a wholly-owned indirect subsidiary of Citigroup Inc. and is authorised by the Prudential
Regulation Authority (PRA) and regulated by both the Financial Conduct Authority (FCA) and the PRA. The
words “Citigroup” and “Citi” are used interchangeably throughout this document and both refer to Citigroup Inc.
The Group provides corporate and investment banking, private banking and consumer banking products and
services in the United Kingdom (UK) and Continental Europe through its branches. The Group’s headquarters are
in London and it currently has sixteen branches in other European financial centres, including two support service
centres in Hungary and Poland. These Citigroup Service Centres (CSCs) have increased in size significantly over
the past few years and now employ 77% of total headcount of the Group. They provide primarily operational and
global functions support to the Group and other Citigroup entities.
Change of name
On 31 October 2014 the Company, formerly registered as a public limited company under the name of Citibank
International Plc, re-registered under the Companies Act 2006 as a private limited company incorporated under the
name of Citibank International Limited. The re-registration of the Company as a private limited company was
made in order to facilitate the group reorganisation below.
Change of parent
As part of an intra-group reorganisation of its holding structure, the Company’s parent changed from Citi Holdings
Bahamas Limited (CHBL) to Citi Overseas Holdings Bahamas Limited (COHBL). The reorganisation was
achieved via the following stages:
Citibank Overseas Investment Corporation (COIC), an indirect subsidiary of Citigroup Inc., formed
COHBL on 1 August 2014;
On 24 November 2014, Citi Holdings Bahamas Limited (CHBL) distributed 30% of its shares in the
Company to Citi Investments Bahamas Limited (CIBL) and 70% of its shares in the Company to COIC;
On the same day, COIC contributed 70% of its shares in the Company to CIBL;
CIBL contributed its shares in the Company to COHBL.
Going concern basis
The financial statements have been prepared on a going concern basis taking into account its existing capital and
liquidity strengths and the ultimate reliance on support from the Group’s parent. The Directors acknowledge the
risk that extreme circumstances might adversely impact the Group’s ability to continue trading and are satisfied
that the Group has the resources to continue in business for the foreseeable future. In making this assessment, the
Directors have considered a wide range of information relating to present and future conditions. Given the
Group’s ultimate reliance on the support of the parent, please refer to the risk factors impacting Citigroup Inc.
from its 2014 annual report, on form 10-K at http://www.citigroup.com/citi/investor/sec.htm.
Further information relevant to this assessment is provided in the following sections of these financial statements:
principal activities, strategic direction and challenges and uncertainties are described in the business review
section of the Strategic Report on pages 6 to 16;
a financial summary, including the income statement and balance sheet, is provided in the financial results
section on pages 18 to 27; and
objectives, policies and processes for managing market, liquidity, credit risk and operational risk, and the
Group’s approach to capital management and allocation, are described in Note 37 – ‘Financial instruments
and risk management’ on pages 87 to 112.
Dividends
The Company paid no dividends during the year (2013: none).

CITIBANK INTERNATIONAL LIMITED
DIRECTORS’ REPORT for the year ended 31 December 2014
3
Other matters
The Group will prepare unaudited interim accounts at 30 June 2015 under the European Union Transparency
Directive.
Risk Management
The Group has elected to include information on financial risk management as per Schedule 7.6(1) (a) and (b) of
the “Large and Medium-sized Companies and Groups Regulations 2008” in the Strategic Report, as the Directors
consider financial risk management to be of strategic importance to the Group.
Statement of Directors' Responsibilities
The Directors are responsible for preparing the Strategic Report and the Directors’ Report and the financial
statements in accordance with applicable law and regulations.
Company law requires the Directors to prepare group and parent company financial statements for each financial
year. Under that law they have elected to prepare both the group and the parent company financial statements in
accordance with International Financial Reporting Standards (IFRS) as adopted by the European Union (EU) and
applicable law.
Under company law the Directors must not approve the financial statements unless they are satisfied that they give
a true and fair view of the state of affairs of the group and parent company and of their profit or loss for that
period. In preparing each of the group and parent company financial statements, the Directors are required to:
select suitable accounting policies and then apply them consistently;
make judgments and estimates that are reasonable and prudent;
state whether they have been prepared in accordance with IFRS as adopted by the EU; and
prepare the financial statements on a going concern basis unless it is inappropriate to assume that the group
and the parent company will continue in business.
The Directors are responsible for keeping adequate accounting records that are sufficient to show and explain the
parent company's transactions, disclose with reasonable accuracy at any time the financial position of the parent
company, and enable them to ensure that its financial statements comply with the Companies Act 2006. They
have general responsibility for taking such steps as are reasonably open to them to safeguard the assets of the
Company and to prevent and detect fraud and other irregularities.
Legislation in the UK governing the preparation and dissemination of financial statements may differ from
legislation in other jurisdictions.
CITIBANK INTERNATIONAL LIMITED
DIRECTORS’ REPORT for the year ended 31 December 2014
4
Directors
The Directors who held office during the year ended 31 December 2014 were:
Non-Executive
J P Asquith (Chair)
D J Challen (resigned 31 March 2014)
S H Dean
M L Jones (appointed on 8 September 2014)
D L Taylor
Executive
J Bardrick (appointed on 7 March 2014)
J C Cowles
A M Duffell (resigned on 27 February 2015)
P McCarthy
M N B Thompson (resigned on 27 March 2014)
G J Von Lehmden (resigned on 27 February 2015)
Directors’ indemnity
Throughout the year and at the date of this report the Company is party to a group-wide indemnity policy which
benefits all of its current Directors and is a qualifying third party indemnity provision for the purpose of section
236 of the Companies Act 2006.
Employee involvement
The Group places a high value on its employees and seeks to promote their involvement in the business wherever
possible. It has continued its previous practice of keeping employees informed by written communications and
meetings on matters affecting them as employees and on the various factors affecting the performance of the
Group and of Citigroup as a whole. Employees are encouraged to present their suggestions and views to the
Group through various channels including an employee representative body and the annual Voice of the Employee
survey. Qualifying employees participate in performance-based incentive schemes.
Employment of disabled people
The Group is committed to a policy of recruitment and promotion on the basis of aptitude and ability without
discrimination of any kind. Applications for employment by disabled persons are fully and fairly considered
having regard to the aptitudes and abilities of each applicant. Efforts are made to enable any employees who
become disabled during employment to continue their careers within the Group. Training, career development and
promotion of disabled persons are all, as far as possible, identical to those available to other employees who are
not disabled.
Diversity
At Citi diversity is recognised as one of its key values. Therefore, the Group has made it a priority to foster a
culture where the best people want to work, where people are promoted on their merits, where respect for others is
demanded and valued and where opportunities to develop are widely available to all – regardless of differences.
The Group fosters a workplace with different backgrounds, perspectives and ideas and provides employees with a
wide range of experiences and skills to develop to their full potential. Citi’s code of conduct prohibits
discrimination and harassment.

CITIBANK INTERNATIONAL LIMITED
STRATEGIC REPORT for the year ended 31 December 2014
6
The Directors present the Strategic Report of Citibank International Limited (formerly Citibank International Plc)
(the Company) and its subsidiaries (the Group) for the year ended 31 December 2014.
Overview, principal activities and governance
The Group is Citigroup’s pan-European bank established to take advantage of the opportunities provided by the
European Economic Area (EEA).
The Group is headquartered in London and it currently operates in seventeen countries through a network of
European branches and subsidiaries. The Company is authorised by the PRA and regulated by the FCA and PRA.
Pursuant to its authorisation by the PRA and FCA, the Company is passported under the EU Banking
Consolidation Directive and accordingly is permitted to conduct a broad range of banking and financial services
activities across the EEA through branches and on a cross-border basis. The Company’s overseas passported
branches are located in Austria, Belgium, Denmark, Finland, France, Greece, Ireland, Italy, Luxembourg,
Netherlands, Norway, Portugal, Spain and Sweden.
In addition to the overseas passported branches, the Company has Citigroup Service Centres (CSCs) in Hungary
and Poland that provide key operation and technology support services to other Citigroup affiliates. The Group
also has two subsidiaries that had historically undertaken lease financing activities.
The Group has two reporting segments, Citicorp and Citi Holdings, consistent with the reporting segments of
Citigroup Inc. The Group’s strategy has been in line with that of Citigroup, which continues to be to wind down
Citi Holdings as soon as practicable in an economically rational manner, while working to generate long-term
profitability and growth from Citicorp, which comprises its core franchise. The Group made significant progress
in executing its strategy in 2014 via the disposal of its Consumer Banking business in Greece (see below).
Citicorp consists of the Institutional Clients Group (ICG) and the Global Consumer Bank (GCB), whilst Citi
Holdings incorporates the Local Consumer Lending (LCL) businesses together with a Special Asset Pool.
Citicorp
Institutional Clients Group (ICG)
The Group’s ICG business comprises Capital Markets Origination, Corporate and Investment Banking, Markets,
Securities Services (SS) and Treasury and Trade Solutions (TTS) and Citi Private Bank (CPB).
Capital Markets Origination, Corporate and Investment Banking, Markets
These business lines allow the Group to provide corporations, governments, institutions and investors with a broad
range of investment banking products and services, including investment banking, debt trading, advisory services,
foreign exchange, structured products, derivatives and lending. The Group has a well-developed loan book,
focusing primarily on those jurisdictions requiring an EEA passport as described above.
The Group does not typically hold outright price risk positions, other than in commercial paper. The vehicles of
preference for market making and customer facilitation activities in the EMEA region are Citibank, N.A. London
branch and Citigroup Global Markets Limited (CGML). Where such transactions are arranged through the Group,
it will retain the associated counterparty risk for which it will receive some on-going remuneration but may back
out market risk to other Citi entities. As a loan provider the Group engages in credit risk in conformity with
Citigroup’s Global Credit Policy and Procedures.
Securities Services and Treasury and Trade Solutions
The Group is the main vehicle for Citigroup’s Western Europe direct custody and clearing and local cash
clearing. The Group undertakes fiduciary and custody services in the UK and eight branches, Belgium, France,
Greece, Netherlands, Ireland, Luxembourg, Spain and Sweden. These branches provide fiduciary and custody
services predominantly to third party managed collective investment funds, with prime responsibility to safe-keep
the funds’ assets and to protect the interests of the investors in the funds.
The Group offers Wrap Administration services to Investor clients and their underlying retail customers. Wrap
servicing includes many of the facets of transfer agency such as record keeping, transaction processing, cash and
stock reconciliations and reporting.
CITIBANK INTERNATIONAL LIMITED
STRATEGIC REPORT for the year ended 31 December 2014
7
Overview & Principal activities (continued)
Citicorp (continued)
Institutional Clients Group (ICG) (continued)
Citi Private Bank (CPB)
Citi Private Bank provides investment advice, financial planning and personalised wealth management products to
high net worth clients.
CPB’s strategy is to provide the full range of its Private Banking products and services through the Group’s
extensive branch network. Marketing within the EEA is conducted generally on a cross-border basis from the UK
using the Banking Consolidation Directive passport. CPB has dedicated employees in the Group’s Spain branch
and uses the Group to book client accounts primarily for EU residents.
Global Consumer Bank (GCB)
The Group offers customer deposits (both current accounts and time deposits), savings accounts, and market
linked time deposits.
In addition, the GCB offers two further businesses through the Group, being the International Personal Bank (IPB)
and the Non-Resident Indian (NRI) business. The IPB business caters to higher net worth customers who may be
international or based in the UK while the NRI business caters for the Indian Diaspora in the UK. The products
offered by the IPB & NRI business include deposits, loan facilities, transactions in managed investments such as
unit trusts and custodian services.
Citi Holdings
Local Consumer Lending (LCL) The Group’s Local Consumer Lending business has been subject to a number of disposals and reorganisations in
recent years, in line with Citigroup’s strategy to wind down Citi Holdings. The principal remaining business was
the Group’s Greek branch which covered, amongst others, the retail, card and consumer finance businesses.
On 30 September 2014, the Group completed the sale of its Consumer banking business in Greece to Alpha Bank.
The Group’s Consumer banking business in Greece has been classified as a discontinued operation, the details of
which are presented in Note 11 ‘Discontinued operations’. The disposal is in line with the Group’s strategy as
already detailed.
Other
The Group also has a portfolio of held-to-maturity mortgage backed securities within the Special Asset Pool which
are overseen by Risk Treasury and divested when predetermined criteria are met.
Apart from the disposal of the Consumer Banking business in Greece, as mentioned above, there was no
substantial change or reorganisation in the principal activities of the Group during the financial year.
CITIBANK INTERNATIONAL LIMITED
STRATEGIC REPORT for the year ended 31 December 2014
8
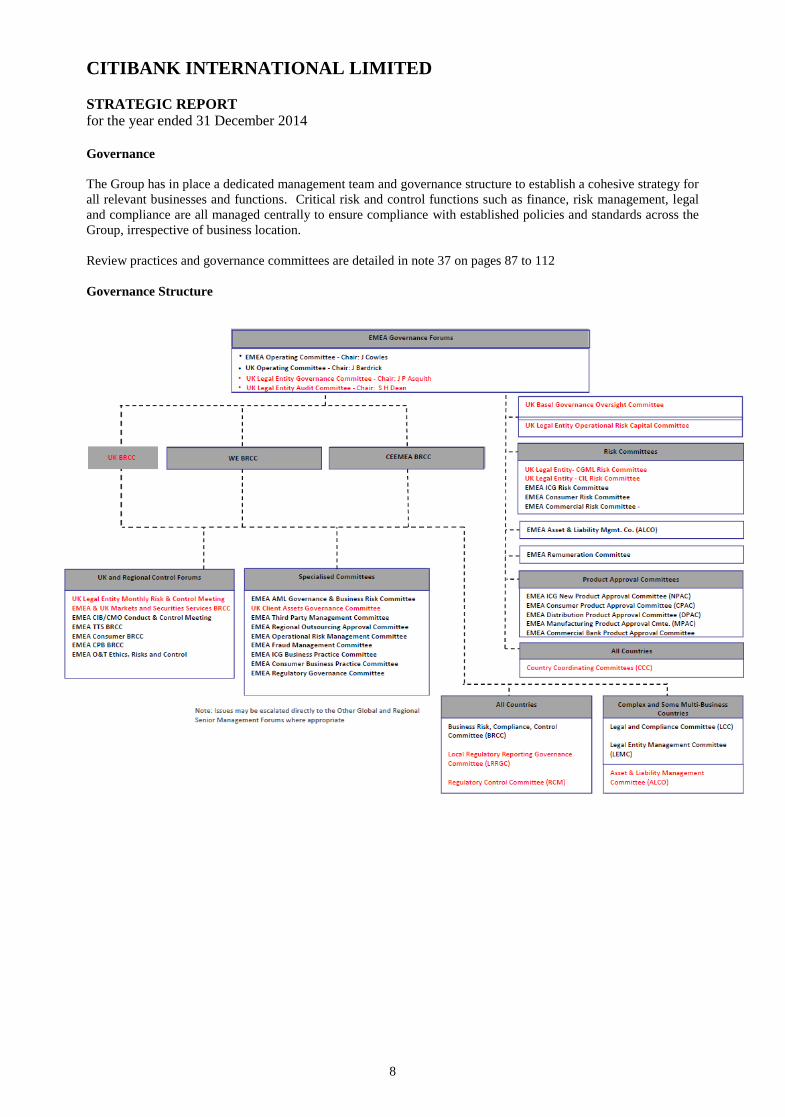
Governance
The Group has in place a dedicated management team and governance structure to establish a cohesive strategy for
all relevant businesses and functions. Critical risk and control functions such as finance, risk management, legal
and compliance are all managed centrally to ensure compliance with established policies and standards across the
Group, irrespective of business location.
Review practices and governance committees are detailed in note 37 on pages 87 to 112
Governance Structure
CITIBANK INTERNATIONAL LIMITED
STRATEGIC REPORT for the year ended 31 December 2014
9
Business review and financial results
2014 was a year of notable economic developments. The global recovery remained weak and uneven with an
increase in downside risks to economic revival throughout the year. Advanced economies grappled with crisis
legacies, including high private and public debt and unemployment, along with low potential growth, by keeping
monetary policy highly accommodative. This included measures such as Quantitative Easing and fiscal
adjustment attuned to supporting long-term growth. The outlook for advanced countries continued to bifurcate as
the economic recoveries in the United States and the United Kingdom strengthened while the Euro area and Japan
sputtered amid rising uncertainty. In the Euro area, with growth faltering and deflation risks looming, the focus of
the European Central Bank (ECB) and national policies was on improving growth prospects and fighting the risk
of deflation.
The Group’s 2014 results reflect the challenging operating environment for the Group and its businesses, both
locally and across the region. These challenges include the impact of macroeconomic uncertainty on the markets,
trading environment and customer activity and of a continued low interest rate environment. The Group expects
the operating environment in 2015 to remain challenging. Short term interest rates are likely to remain low for
some time and therefore spread compression could continue to impact the Group during the year. The key focus
of management is to ensure the stability and profitability of the Group’s ongoing activities.
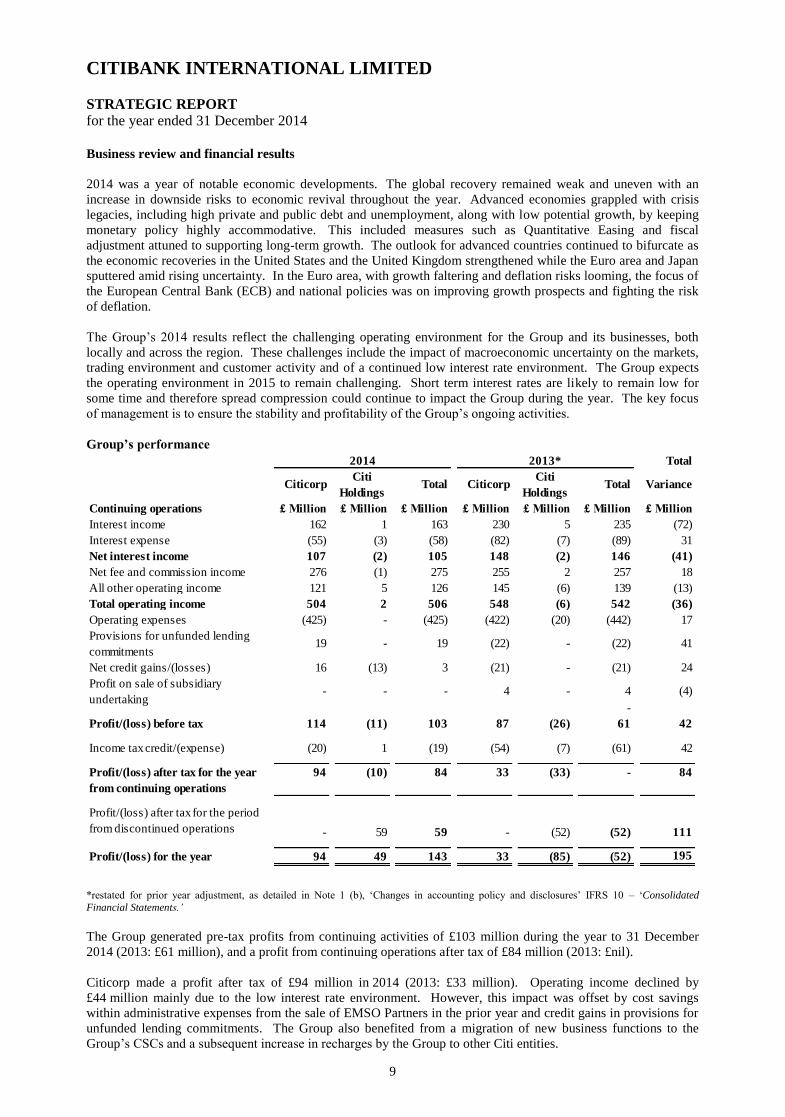
Group’s performance
Total
CiticorpCiti
HoldingsTotal Citicorp
Citi
HoldingsTotal Variance
Continuing operations £ Million £ Million £ Million £ Million £ Million £ Million £ Million
Interest income 162 1 163 230 5 235 (72)
Interest expense (55) (3) (58) (82) (7) (89) 31
Net interest income 107 (2) 105 148 (2) 146 (41)
Net fee and commission income 276 (1) 275 255 2 257 18
All other operating income 121 5 126 145 (6) 139 (13)
Total operating income 504 2 506 548 (6) 542 (36)
Operating expenses (425) - (425) (422) (20) (442) 17
Provisions for unfunded lending
commitments 19 - 19 (22) - (22) 41
Net credit gains/(losses) 16 (13) 3 (21) - (21) 24
Profit on sale of subsidiary
undertaking - - - 4 - 4 (4)
-
Profit/(loss) before tax 114 (11) 103 87 (26) 61 42
Income tax credit/(expense) (20) 1 (19) (54) (7) (61) 42
Profit/(loss) after tax for the year
from continuing operations
94 (10) 84 33 (33) - 84
Profit/(loss) after tax for the period
from discontinued operations - 59 59 - (52) (52) 111
Profit/(loss) for the year 94 49 143 33 (85) (52) 195
2014 2013*
*restated for prior year adjustment, as detailed in Note 1 (b), ‘Changes in accounting policy and disclosures’ IFRS 10 – ‘Consolidated
Financial Statements.’
The Group generated pre-tax profits from continuing activities of £103 million during the year to 31 December
2014 (2013: £61 million), and a profit from continuing operations after tax of £84 million (2013: £nil).
Citicorp made a profit after tax of £94 million in 2014 (2013: £33 million). Operating income declined by
£44 million mainly due to the low interest rate environment. However, this impact was offset by cost savings
within administrative expenses from the sale of EMSO Partners in the prior year and credit gains in provisions for
unfunded lending commitments. The Group also benefited from a migration of new business functions to the
Group’s CSCs and a subsequent increase in recharges by the Group to other Citi entities.

CITIBANK INTERNATIONAL LIMITED
STRATEGIC REPORT for the year ended 31 December 2014
10
Business review and financial results (continued)
Group’s performance (continued)
Citi Holdings generated a profit after tax of £49 million in 2014 (2013: £85 million loss), mainly due to the profit
realised on the sale of the Group’s Consumer Banking business in Greece and related net credit gains included
within discontinued operations.
Income
Operating income on continuing operations of £506 million was down from £542 million in the prior year.
Citicorp’s performance was negatively affected by lower revenues in the corporate banking and fixed income
businesses. The lower interest rate environment contributed to a £41 million decrease in net interest income. This
was partially offset by an increase in net fee and commission income of £18 million.
Furthermore, as mentioned above, a migration of new functions to the Group’s CSCs has resulted in an increase of
recharges to other Citi entities recognised in other operating income. A significant portion of expenses within the
Group originate from services provided by the CSCs to other Citi entities, both globally and regionally. These
costs are allocated out to businesses and legal entities based on a number of drivers. The Group both pays and
recovers expenses. All of these transfer pricing agreements are reviewed regularly for appropriateness. Further
details on the Group’s related party expenses can be seen in Note 34 – ‘Related Party Transactions.’ This increase
in income was offset by losses on items measured at fair value through profit and loss included within all other
operating income above.
From a business perspective the Group’s Citicorp income is predominantly driven by four core businesses:
Securities Services (SS) revenues of £93 million were £7 million higher than 2013, driven by higher
direct custody and clearing revenues from new clients.
Treasury and Trade Solutions (TTS) revenues of £85 million were £1 million higher than 2013, driven by
increased volume.
Banking revenues of £97 million were £32 million lower than 2013, driven by mark to market losses in
the Corporate Loans Portfolio.
Fixed income revenues of £72 million were £32 million lower than 2013, predominantly driven by lower
credit trading revenues on account of volatile market conditions.
Expenses
The Group is committed to executing on the Citigroup Inc. communicated priorities of efficient resource allocation
and disciplined expense management. Group management actively monitors expenses, carefully managing
expense reduction exercises while taking account of investment necessary for the future.
Headcount has increased from 4,580 to 4,795 on an average basis. However, overall compensation expenses have
remained stable reflecting the move of headcount concentration from higher to lower cost locations, in line with
Citigroup’s on-going effort to leverage lower cost locations within the region.
The disposal of EMSO Partners in the prior year resulted in a decrease of £40 million in administrative expenses
year on year.
During the year the Group released provisions on undrawn loan commitments as a result of counterparty upgrades
and lower loss norm ratios. This resulted in a recovery of £19 million to the Group, an improvement of £41
million over 2013. Net credit losses have improved from a loss of £21 million to a gain of £3 million. This was
primarily driven by counterparty upgrades and lower loss norm ratios on account of improving credit quality
across Europe.

CITIBANK INTERNATIONAL LIMITED
STRATEGIC REPORT for the year ended 31 December 2014
11
Business review and financial results (continued)
Discontinued operations
The Group’s discontinued operations relate to the Consumer Banking business in Greece, a Citi Holdings
Business, the disposal of which generated a profit after tax for the year of £59 million (2013: £52 million loss) (see
Note 11 ‘Discontinued operations’). Although the business recorded a profit before tax of £81 million (2013: £82
million loss), the pre-tax profit was driven by the profit generated on the disposal of the business of £105 million
whereas the disposal of a loan and mortgage portfolio in the prior year resulted in a £45 million loss.
The Group’s position at 31 December
2014
£ Million
2013*
£ Million
2014
£ Million
2013*
£ Million
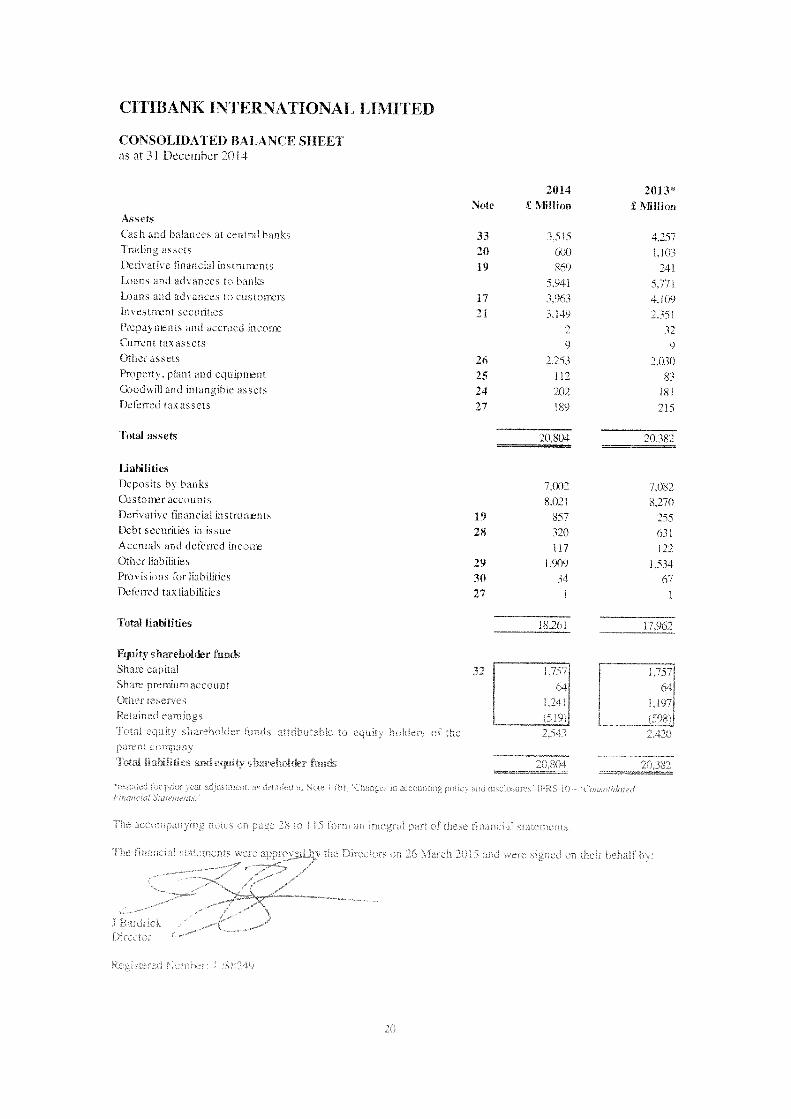
Assets Liabilities
Cash and balances at central banks 3,515 4,257 Deposits by banks 7,002 7,082
Trading assets 600 1,103 Customer accounts 8,021 8,270
Loans and advances to banks 5,941 5,771 All other liabilities 3,238 2,610
Loans and advances to customers 3,963 4,109
Investment securities 3,149 2,351 Total liabilities 18,261 17,962
All other assets 3,636 2,791
Total equity shareholder funds
attributable to equity holders 2,543 2,420
Total assets 20,804 20,382 Total liabilities and equity
shareholder funds 20,804 20,382
*restated for prior year adjustment, as detailed in Note 1 (b), ‘Changes in accounting policy and disclosures’ IFRS 10 – ‘Consolidated
Financial Statements.’
Total assets of £20.8 billion (2013: £20.4 billion), remained consistent compared with the prior year.
Cash and balances at central banks fell by £742 million compared to the prior year as the Group reduced its
balances with the Netherlands Central Bank, owing to the negative interest rates during the year. The funds were
used to invest in UK Treasury Gilts to maintain a stable liquid asset buffer as is evidenced by the increase in
Investment securities. Trading assets fell by £503 million mainly driven by a decrease in corporate bonds,
European Commercial Paper (ECP) and trading loans. Derivative assets and liabilities increased by £628 million
and £602 million respectively, driven by an increase in Foreign Exchange Forwards, Swaps and Interest Rate
Swap contracts. A part of this increase is a consequence of Dodd Frank regulations, whereby the Group has been
offered as an alternate legal vehicle for some transactions. Movements in other assets and other liabilities are due
to increased ECP trading volumes around the year end.
The Group’s UK LCL business has never sold Payment Protection Insurance (PPI) and therefore does not have a
provision for future PPI claims at 31 December 2014.
In recognition of potential claims relating to the mis-selling of credit card protection products by Card Protection
Plan (CPP), the Group has recognised a provision of £0.7 million (2013: £1.0 million) in relation to its limited
exposure.
Key performance indicators
In addition to the financial results of the Group, senior management also consider the monitoring of the following
key financial and non-financial items critical to the Group’s future: regulatory capital and liquidity requirements.

CITIBANK INTERNATIONAL LIMITED
STRATEGIC REPORT for the year ended 31 December 2014
12
Business review and financial results (continued)
Regulatory capital
The Group’s regulatory capital resources at 31 December were as follows:
2014 2013
£ Million £ Million
Tier 1 capital 2,462 2,423
Tier 2 capital 53 138
2,515 2,561
Deductions (256) (218)
Total regulatory capital 2,259 2,343
Throughout the year, the Group’s regulatory minimum capital requirements, as set by the PRA, were comfortably
met by its available capital resources.
Tier 1 capital comprises tangible shareholders’ funds less certain capital deductions. Management maintains a
sufficient strong and stable capital balance in excess of the regulatory capital requirement and monitors the Tier 1
capital balance to ensure an excess is maintained at all times. The increase in capital deductions in 2014 is driven
by intangible assets.
Details of the Group’s capital management are given in Note 37 – ‘Financial instruments and risk management’.
Liquidity requirements
The Group reports its liquidity position by reference to Individual Liquidity Guidance (ILG) stipulated by the
PRA.
The Group also monitors its position against anticipated Basel 3 liquidity metrics – the Liquidity Coverage Ratio
(LCR) and the Net Stable Funding Ratio (NSFR). The LCR is designed to promote short term resilience of an
entity’s liquidity risk profile by ensuring that it has sufficient high quality liquid resources to survive an acute
stress scenario lasting 30 days. The NSFR has a time horizon of one year and has been developed to promote a
sustainable maturity structure of assets and liabilities.
Further details on how the Group and the Company manage their liquidity position and requirements are shown in
further detail in Note 37 – ‘Financial instruments and risk management.’ The Group and the Company met their
liquidity requirements during the year.
Risk management – overview
The Group utilises Citigroup’s risk management model and organisation, with its multi-dimensional risk oversight
and its people, processes and systems to ensure robust oversight of entity risks. In addition, the Group deploys
entity specific risk management and controls, to ensure local challenge to risk taking and to ensure the approach is
appropriate for the Group.
Citigroup, and the Group, believe that effective risk management is of primary importance to its overall
operations. Accordingly, Citi’s risk management process has been designed to monitor, evaluate and manage the
principal risks it assumes in conducting its activities. Specifically, the activities that the Group engages in, and the
risks those activities generate, must be consistent with an underlying commitment to the principles of
“Responsible Finance”.
Stress Test PRA ILG Basel 3 LCR Basel 3 NSFR
Time Horizon 3 months 30 days 1 year
CalculationLiquid assets to net cash
outflows
Liquid assets to net cash
outflows
Stable funding resources to stable
funding requirements

CITIBANK INTERNATIONAL LIMITED
STRATEGIC REPORT for the year ended 31 December 2014
13
Risk management – overview (continued)
“Responsible Finance” means conduct that is transparent, prudent and dependable, and that delivers better
outcomes for Citi’s clients and society. In order to achieve these principles, Citi establishes and enforces
expectations for its risk-taking activities through its risk culture, defined roles and responsibilities, and through its
supporting policies, procedures and processes that enforce these standards.
While the management of risk is the collective responsibility of all employees, Citi, and the Group, assign
accountability into three lines of defence:
first line of defence: The business owns all of its risks, and is responsible for the management of those
risks;
second line of defence: The Group’s control functions (e.g., Risk, Finance, Compliance, etc.) establish
standards for the management of risks and effectiveness of controls; and
third line of defence: Citi’s Internal Audit function independently provides assurance, based on a risk-
based audit plan, that processes are reliable, and governance and controls are effective.
Risk Culture
The Group’s risk management framework is designed to balance business ownership and accountability for risks
with well defined independent risk management oversight and responsibility. The Group applies Citi’s global risk
management framework based on the following principles established by the Chief Risk Officer:
a defined risk appetite, aligned with business strategy;
accountability through a common framework to manage risks;
risk decisions based on transparent, accurate and rigorous analytics;
a common risk capital model to evaluate risks;
expertise, stature, authority and independence of risk managers; and
risk managers empowered to make decisions and escalate issues.
Significant focus has been placed on fostering a risk culture based on a policy of taking Intelligent Risk with
Shared Responsibility, without forsaking Individual Accountability:
taking intelligent risk means that the Group must identify, measure and aggregate risks and it must
establish risk tolerances based on a full understanding of concentrations and “tail risk”;
shared responsibility means that all individuals collectively bear responsibility to seek input and leverage
knowledge across and within the “Three Lines of Defence”; and
individual accountability means that all individuals must actively manage risk, identify issues, and make
fully informed decisions that take into account all risks to the Group.
Roles and responsibilities
The Group’s risk management framework aims to recognise the diversity of the Group’s business activities by
combining corporate oversight with independent risk management functions within each business. The
independent risk managers at the business level are responsible for establishing and implementing risk
management policies and practices within their business, for overseeing the risk in their business, and for
responding to the needs and issues of their business. This ensures the active management of the principal risks of
the Group.
Since the financial crisis in 2008, both Citigroup and the Group’s risk management and internal governance
processes have undergone significant improvements on all major fronts, including more rigorous credit
assessments and credit review of obligors, heightened controls over business and reporting processes through an
Manger’s Control Assessment (MCA) process, implementation of a formalised operational risk scenario analysis
process and enhancement of comprehensive entity stress testing. Entity specific risk management and oversight
has been put in place and control and governance processes continue to evolve in line with best practices specific
to the risk space.
Review practices and governance committees are detailed in Note 37 on pages 87 to 112

CITIBANK INTERNATIONAL LIMITED
STRATEGIC REPORT for the year ended 31 December 2014
14
Risk management – overview (continued)
Risk management – principal risks
The Group’s principal risks arise from its lending activity to consumer and corporate clients within the EU, mainly
in Western and Southern Europe, and include both financial and non-financial risks. The main risks covered by
the Group’s risk management framework are market risk, funding and liquidity risk, credit risk (including country
and concentration risk), operational risk (including franchise and reputational risk) and regulatory risks and
developments.
A number of these risks are discussed further below.
Market risk
Price risk losses arise from fluctuations in the market value of trading and non-trading positions resulting from
changes in interest rates, credit spreads, foreign exchange rates and equity prices, and in their implied volatilities.
Each business initiating client facing transactions is required to establish, with approval from Citi’s market risk
management, a market risk limit framework for identified risk factors that clearly defines approved risk profiles
and is within the parameters of the Group’s risk tolerance and that of its ultimate parent. These limits are
monitored by independent market risk, Citi’s country and business Asset and Liability Committees and the
Citigroup Asset and Liability Committee. In all cases, the businesses are ultimately responsible for the market
risks taken and for remaining within their defined limits.
Funding and Liquidity Risk
Adequate liquidity and sources of funding are essential to Citi’s businesses. Funding and liquidity risks arise from
several factors, many of which Citi cannot control, such as disruptions in the financial markets, changes in key
funding sources, credit spreads, changes in Citi’s credit ratings and political and economic conditions in certain
countries.
Citi’s funding and liquidity objectives are to maintain adequate liquidity to (i) fund its existing asset base; (ii)
grow its core businesses in Citicorp; (iii) maintain sufficient excess liquidity, structured appropriately, so that it
can operate under a wide variety of market conditions, including market disruptions for both short- and long-term
periods; and (iv) satisfy regulatory requirements. These primary liquidity objectives are adhered to both by the
Group at legal entity level as well as in aggregate at Citigroup level.
Credit risk
Credit risk is the potential for financial loss resulting from the failure of a borrower or counterparty to honour its
financial or contractual obligations.
Credit risk arises predominantly from Group’s lending activities as well as the limited activities that it carries out
in the derivatives trading and repurchase agreements and securities borrowing and lending markets.
Credit risk also arises from settlement and clearing activities, when the Group transfers an asset in advance of
receiving its counter-value or advances funds to settle a transaction on behalf of a client. Concentration risk,
within credit risk, is the risk associated with having credit exposure concentrated within a specific client, industry,
region or other category.
Credit risk is one of the most significant risks the Group faces as a financial intermediary. As a result, Citi has a
well established framework in place for managing credit risk across all businesses. This includes a defined risk
appetite, credit limits and credit policies, both at the business level as well as at the firm-wide level. Citi’s credit
risk management also includes processes and policies with respect to problem recognition, including “watch lists,”
portfolio review, updated risk ratings and classification triggers.
CITIBANK INTERNATIONAL LIMITED
STRATEGIC REPORT for the year ended 31 December 2014
15
Risk management – principal risks (continued)
GIIPS exposure and country concentration
The Group’s activities are intrinsically linked to the economic developments of the region in which it operates.
As Citi’s pan-European bank, passported under the European Union’s Banking Consolidation Directive, the Group
is predominantly oriented towards the large corporate sector in Western Europe. As a result of the Group’s
lending activities in the region, the Group has a concentration of exposure to France primarily through lending to
large utility, healthcare, media and auto companies, and to Spain primarily through lending to large utility,
telecommunication companies and local banks. The Risk function continues to monitor and manage these
exposures, employing appropriate mitigation techniques.
The Group’s long history in Greece has led to a large corporate, primarily shipping industry based presence in the
country and prior to 2014 a consumer presence. Primarily this relates to international shipping where risk is
deemed to be offshore and not related to the strength of the domestic economy. During 2014, Citi sold its
consumer banking business and Diners Club of Greece credit card operations in Greece.
The economic and fiscal situations of several European countries remain fragile, and geopolitical tensions
throughout the region, including in Russia, have added to the uncertainties. Fiscal and monetary actions, or
expected actions, throughout the region have further impacted the global financial markets. While concerns
relating to sovereign defaults or a partial or complete break-up of the European Monetary Union (EMU), including
potential accompanying redenomination risks and uncertainties, have not yet abated.
Operational risk
Operational risk is the risk of loss resulting from inadequate or failed internal processes, human factors, systems or
from external events. It includes the reputation and franchise risk associated with business practices or market
conduct in which Citi is involved.
In recent years there has been an increased focus internally and from the public and regulators with regard to the
identification, measurement and management of the operational risk of large financial institutions. This focus was
underpinned by the disruptions that the industry witnessed during the financial crisis of 2008 as well as a number
of public revelations of misconduct within the financial industry. Citigroup has an operational risk management
framework, which continues to evolve to reflect industry best practice and the external environment.
Citi’s operational risk is managed through an overall framework designed to balance strong corporate oversight
with well defined independent risk management. This framework includes:
• recognised ownership of the risk by the businesses;
• oversight by Citi’s independent control functions; and
• independent assessment by Citi’s Internal Audit function.
The goal is to keep operational risk at appropriate levels relative to the characteristics of Citigroup’s businesses,
the markets in which it operates, its capital and liquidity, and the competitive, economic and regulatory
environment.
To anticipate, mitigate and control operational risk, Citigroup maintains a system of policies and has established a
consistent framework for monitoring, assessing and communicating operational risks and the overall effectiveness
of the internal control environment across Citigroup. As part of this framework, Citigroup has established a MCA
program to help managers self-assess key operational risks and controls and identify and address weaknesses in
the design and/or effectiveness of internal controls that mitigate significant operational risks. MCAs are in place
for all the major business lines and control areas impacting the Group.

CITIBANK INTERNATIONAL LIMITED
CONSOLIDATED INCOME STATEMENT
for the year ended 31 December 2014
18
Note
2014
£ Million
2013*
£ Million
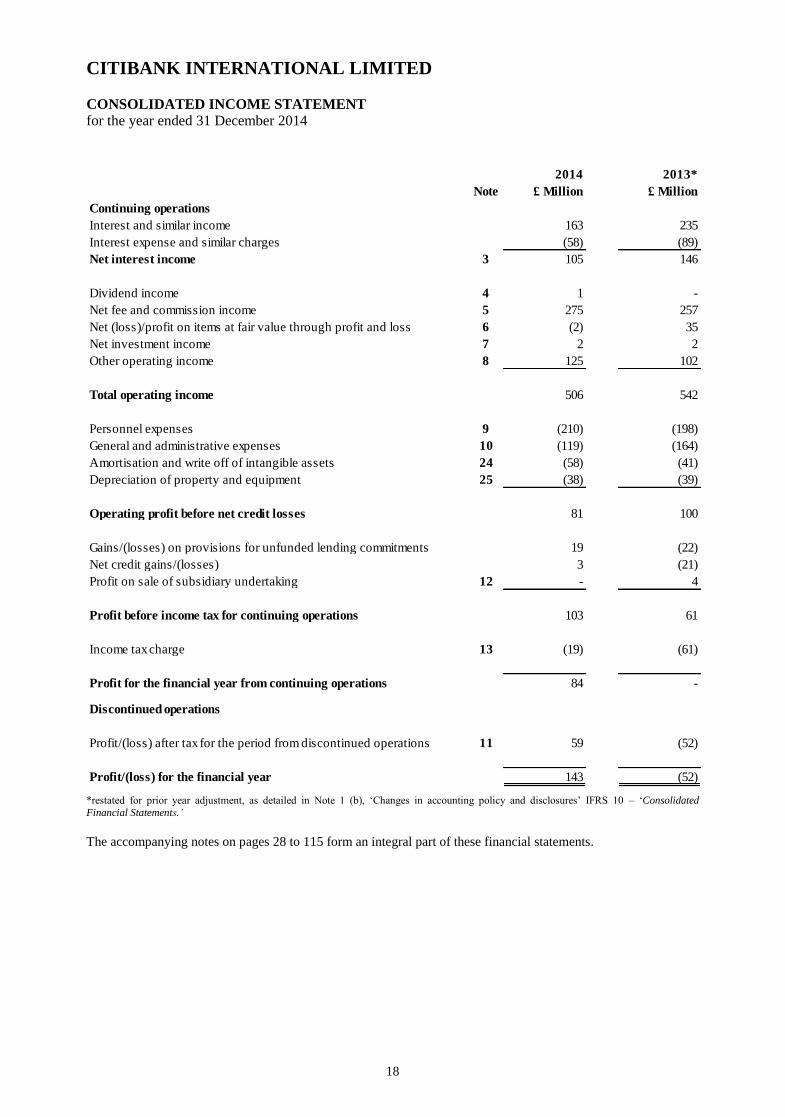
Continuing operations
Interest and similar income 163 235
Interest expense and similar charges (58) (89)
Net interest income 3 105 146
Dividend income 4 1 -
Net fee and commission income 5 275 257
Net (loss)/profit on items at fair value through profit and loss 6 (2) 35
Net investment income 7 2 2
Other operating income 8 125 102
Total operating income 506 542
Personnel expenses 9 (210) (198)
General and administrative expenses 10 (119) (164)
Amortisation and write off of intangible assets 24 (58) (41)
Depreciation of property and equipment 25 (38) (39)
Operating profit before net credit losses 81 100
Gains/(losses) on provisions for unfunded lending commitments 19 (22)
Net credit gains/(losses) 3 (21)
Profit on sale of subsidiary undertaking 12 - 4
Profit before income tax for continuing operations 103 61
Income tax charge 13 (19) (61)
Profit for the financial year from continuing operations 84 -
Discontinued operations
Profit/(loss) after tax for the period from discontinued operations 11 59 (52)
Profit/(loss) for the financial year 143 (52)
*restated for prior year adjustment, as detailed in Note 1 (b), ‘Changes in accounting policy and disclosures’ IFRS 10 – ‘Consolidated
Financial Statements.’
The accompanying notes on pages 28 to 115 form an integral part of these financial statements.
CITIBANK INTERNATIONAL LIMITED
CONSOLIDATED STATEMENT OF COMPREHENSIVE INCOME
for the year ended 31 December 2014
19
Note
2014
£ Million
2013*
£ Million
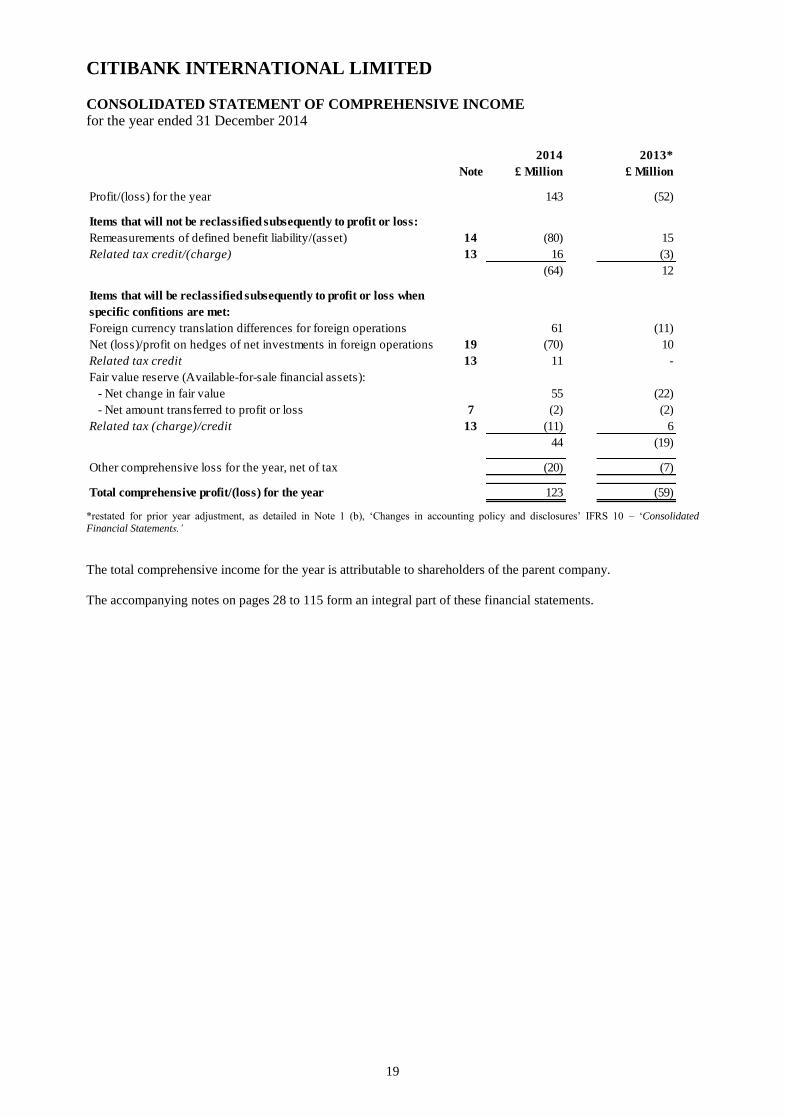
Profit/(loss) for the year 143 (52)
Items that will not be reclassified subsequently to profit or loss:
Remeasurements of defined benefit liability/(asset) 14 (80) 15
Related tax credit/(charge) 13 16 (3)
(64) 12
Items that will be reclassified subsequently to profit or loss when
specific confitions are met:
Foreign currency translation differences for foreign operations 61 (11)
Net (loss)/profit on hedges of net investments in foreign operations 19 (70) 10
Related tax credit 13 11 -
Fair value reserve (Available-for-sale financial assets):
- Net change in fair value 55 (22)
- Net amount transferred to profit or loss 7 (2) (2)
Related tax (charge)/credit 13 (11) 6
44 (19)
Other comprehensive loss for the year, net of tax (20) (7)
Total comprehensive profit/(loss) for the year 123 (59)
*restated for prior year adjustment, as detailed in Note 1 (b), ‘Changes in accounting policy and disclosures’ IFRS 10 – ‘Consolidated
Financial Statements.’
The total comprehensive income for the year is attributable to shareholders of the parent company.
The accompanying notes on pages 28 to 115 form an integral part of these financial statements.
CITIBANK INTERNATIONAL LIMITED
CONSOLIDATED STATEMENT OF CHANGES IN EQUITY
as at 31 December 2014
21
Share
capital
Share
premium
Capital
reserve
Translation
reserve
Fair value
reserve
Equity
reserve
Retained
earnings Total
£ Million £ Million £ Million £ Million £ Million £ Million £ Million £ Million
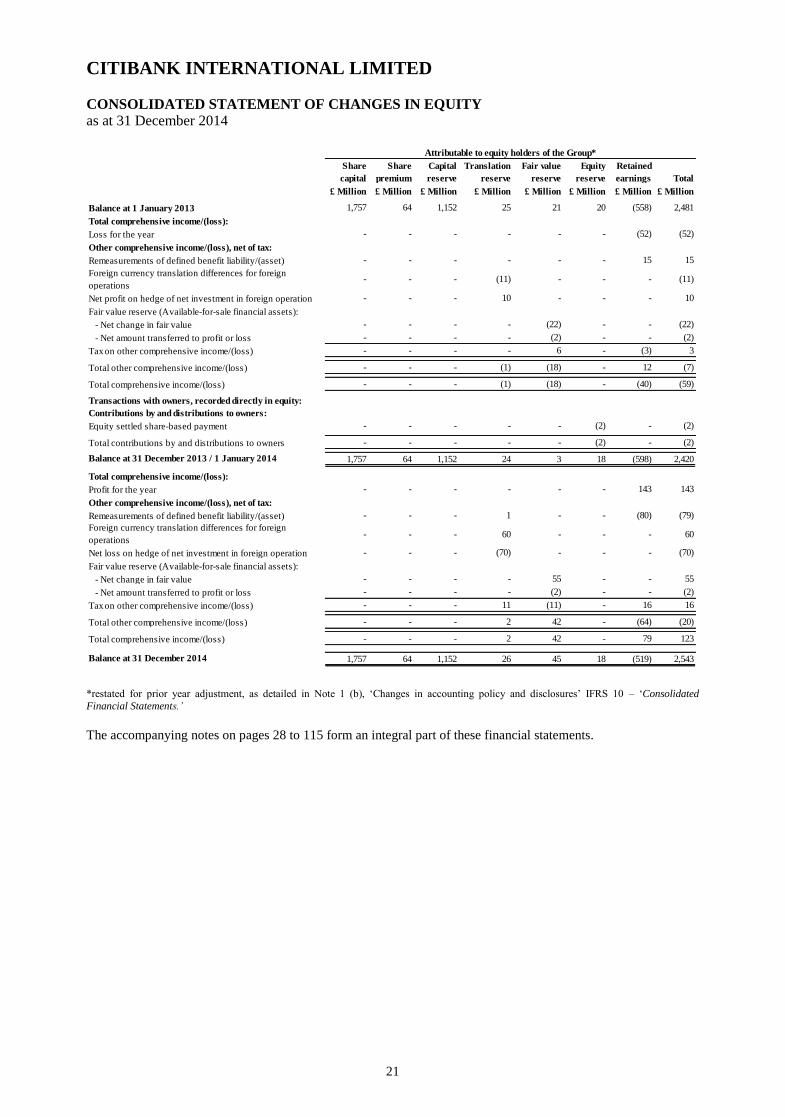
Balance at 1 January 2013 1,757 64 1,152 25 21 20 (558) 2,481
Total comprehensive income/(loss):
Loss for the year - - - - - - (52) (52)
Other comprehensive income/(loss), net of tax:
Remeasurements of defined benefit liability/(asset) - - - - - - 15 15
Foreign currency translation differences for foreign
operations - - - (11) - - - (11)
Net profit on hedge of net investment in foreign operation - - - 10 - - - 10
Fair value reserve (Available-for-sale financial assets):
- Net change in fair value - - - - (22) - - (22)
- Net amount transferred to profit or loss - - - - (2) - - (2)
Tax on other comprehensive income/(loss) - - - - 6 - (3) 3
Total other comprehensive income/(loss) - - - (1) (18) - 12 (7)
Total comprehensive income/(loss) - - - (1) (18) - (40) (59)
Transactions with owners, recorded directly in equity:
Contributions by and distributions to owners:
Equity settled share-based payment - - - - - (2) - (2)
Total contributions by and distributions to owners - - - - - (2) - (2)
Balance at 31 December 2013 / 1 January 2014 1,757 64 1,152 24 3 18 (598) 2,420
Total comprehensive income/(loss):
Profit for the year - - - - - - 143 143
Other comprehensive income/(loss), net of tax:
Remeasurements of defined benefit liability/(asset) - - - 1 - - (80) (79)
Foreign currency translation differences for foreign
operations - - - 60 - - - 60
Net loss on hedge of net investment in foreign operation - - - (70) - - - (70)
Fair value reserve (Available-for-sale financial assets):
- Net change in fair value - - - - 55 - - 55
- Net amount transferred to profit or loss - - - - (2) - - (2)
Tax on other comprehensive income/(loss) - - - 11 (11) - 16 16
Total other comprehensive income/(loss) - - - 2 42 - (64) (20)
Total comprehensive income/(loss) - - - 2 42 - 79 123
Balance at 31 December 2014 1,757 64 1,152 26 45 18 (519) 2,543
Attributable to equity holders of the Group*
*restated for prior year adjustment, as detailed in Note 1 (b), ‘Changes in accounting policy and disclosures’ IFRS 10 – ‘Consolidated
Financial Statements.’
The accompanying notes on pages 28 to 115 form an integral part of these financial statements.
CITIBANK INTERNATIONAL LIMITED
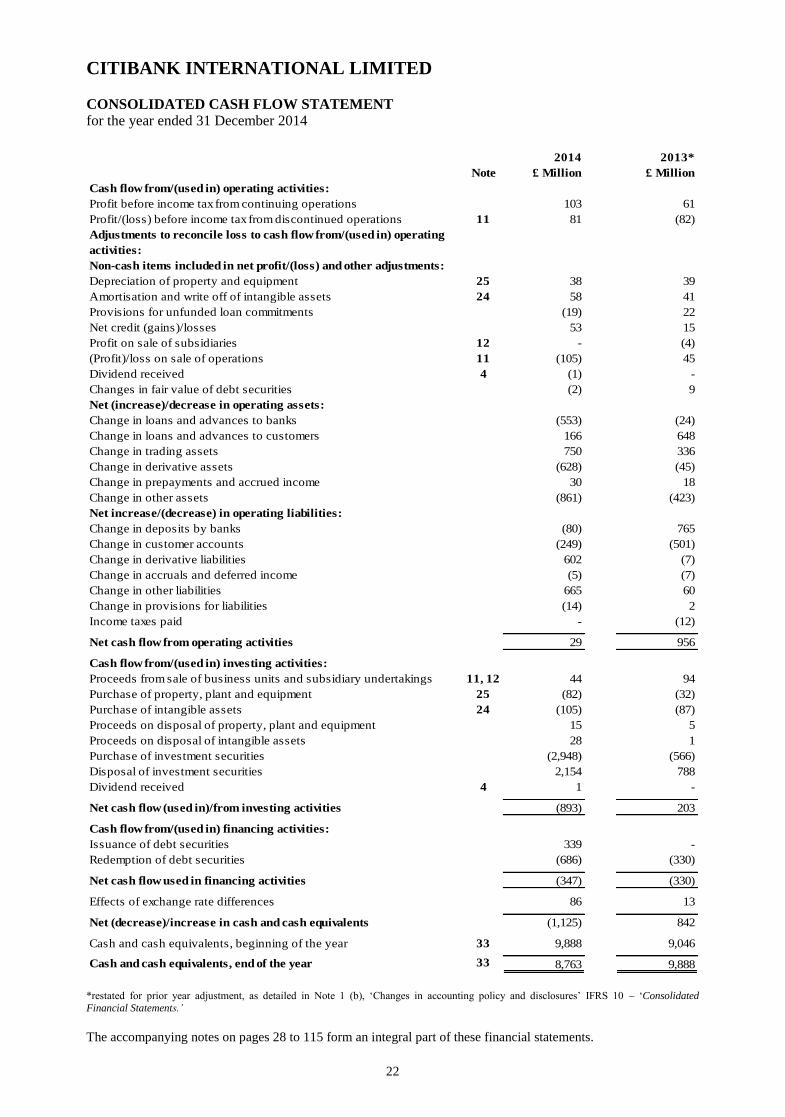
CONSOLIDATED CASH FLOW STATEMENT
for the year ended 31 December 2014
22
Note
2014
£ Million
2013*
£ Million
Cash flow from/(used in) operating activities:
Profit before income tax from continuing operations 103 61
Profit/(loss) before income tax from discontinued operations 11 81 (82)
Adjustments to reconcile loss to cash flow from/(used in) operating
activities:
Non-cash items included in net profit/(loss) and other adjustments:
Depreciation of property and equipment 25 38 39
Amortisation and write off of intangible assets 24 58 41
Provisions for unfunded loan commitments (19) 22
Net credit (gains)/losses 53 15
Profit on sale of subsidiaries 12 - (4)
(Profit)/loss on sale of operations 11 (105) 45
Dividend received 4 (1) -
Changes in fair value of debt securities (2) 9
Net (increase)/decrease in operating assets:
Change in loans and advances to banks (553) (24)
Change in loans and advances to customers 166 648
Change in trading assets 750 336
Change in derivative assets (628) (45)
Change in prepayments and accrued income 30 18
Change in other assets (861) (423)
Net increase/(decrease) in operating liabilities:
Change in deposits by banks (80) 765
Change in customer accounts (249) (501)
Change in derivative liabilities 602 (7)
Change in accruals and deferred income (5) (7)
Change in other liabilities 665 60
Change in provisions for liabilities (14) 2
Income taxes paid - (12)
Net cash flow from operating activities 29 956
Cash flow from/(used in) investing activities:
Proceeds from sale of business units and subsidiary undertakings 11, 12 44 94
Purchase of property, plant and equipment 25 (82) (32)
Purchase of intangible assets 24 (105) (87)
Proceeds on disposal of property, plant and equipment 15 5
Proceeds on disposal of intangible assets 28 1
Purchase of investment securities (2,948) (566)
Disposal of investment securities 2,154 788
Dividend received 4 1 -
Net cash flow (used in)/from investing activities (893) 203
Cash flow from/(used in) financing activities:
Issuance of debt securities 339 -
Redemption of debt securities (686) (330)
Net cash flow used in financing activities (347) (330)
Effects of exchange rate differences 86 13
Net (decrease)/increase in cash and cash equivalents (1,125) 842
Cash and cash equivalents, beginning of the year 33 9,888 9,046
Cash and cash equivalents, end of the year 33 8,763 9,888
*restated for prior year adjustment, as detailed in Note 1 (b), ‘Changes in accounting policy and disclosures’ IFRS 10 – ‘Consolidated
Financial Statements.’
The accompanying notes on pages 28 to 115 form an integral part of these financial statements.
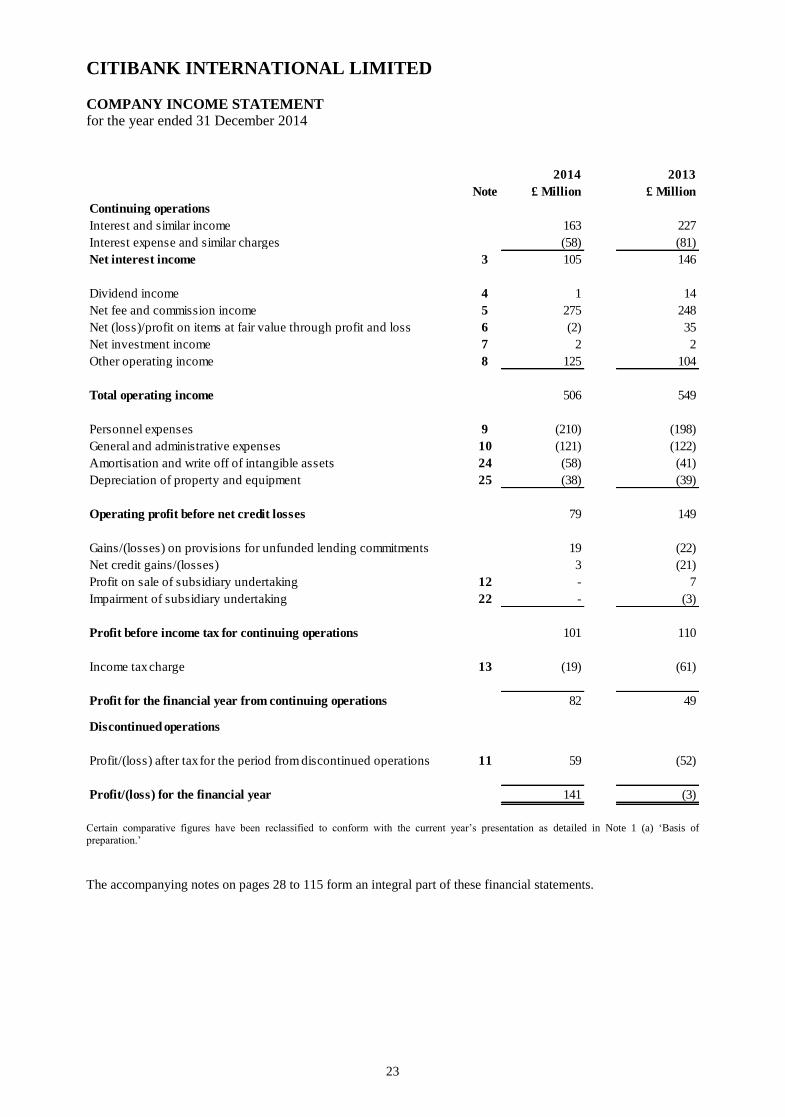
CITIBANK INTERNATIONAL LIMITED
COMPANY INCOME STATEMENT
for the year ended 31 December 2014
23
Note
2014
£ Million
2013
£ Million
Continuing operations
Interest and similar income 163 227
Interest expense and similar charges (58) (81)
Net interest income 3 105 146
Dividend income 4 1 14
Net fee and commission income 5 275 248
Net (loss)/profit on items at fair value through profit and loss 6 (2) 35
Net investment income 7 2 2
Other operating income 8 125 104
Total operating income 506 549
Personnel expenses 9 (210) (198)
General and administrative expenses 10 (121) (122)
Amortisation and write off of intangible assets 24 (58) (41)
Depreciation of property and equipment 25 (38) (39)
Operating profit before net credit losses 79 149
Gains/(losses) on provisions for unfunded lending commitments 19 (22)
Net credit gains/(losses) 3 (21)
Profit on sale of subsidiary undertaking 12 - 7
Impairment of subsidiary undertaking 22 - (3)
Profit before income tax for continuing operations 101 110
Income tax charge 13 (19) (61)
Profit for the financial year from continuing operations 82 49
Discontinued operations
Profit/(loss) after tax for the period from discontinued operations 11 59 (52)
Profit/(loss) for the financial year 141 (3)
Certain comparative figures have been reclassified to conform with the current year’s presentation as detailed in Note 1 (a) ‘Basis of
preparation.’
The accompanying notes on pages 28 to 115 form an integral part of these financial statements.

CITIBANK INTERNATIONAL LIMITED
COMPANY STATEMENT OF COMPREHENSIVE INCOME
for the year ended 31 December 2014
24
Note
2014
£ Million
2013
£ Million
Profit/(loss) for the year 141 (3)
Items that will not be reclassified subsequently to profit or loss:
Remeasurements of defined benefit liability/(asset) 14 (80) 15
Related tax credit/(charge) 13 16 (3)
(64) 12
Items that will be reclassified subsequently to profit or loss when
specific confitions are met:
Foreign currency translation differences for foreign operations 61 (13)
Net (loss)/profit on hedges of net investments in foreign operations 19 (70) 10
Related tax credit 13 11 -
Fair value reserve (Available-for-sale financial assets):
- Net change in fair value 55 (22)
- Net amount transferred to profit or loss 7 (2) (2)
Related tax (charge)/credit 13 (11) 6
44 (21)
Other comprehensive loss for the year, net of tax (20) (9)
Total comprehensive profit/(loss) for the year 121 (12)
The total comprehensive income for the year is attributable to shareholders of the parent company.
The accompanying notes on pages 28 to 115 form an integral part of these financial statements.


CITIBANK INTERNATIONAL LIMITED
COMPANY STATEMENT OF CHANGES IN EQUITY
as at 31 December 2014
26
Share
capital
Share
premium
Capital
reserve
Translation
reserve
Fair value
reserve
Equity
reserve
Retained
earnings Total
£ Million £ Million £ Million £ Million £ Million £ Million £ Million £ Million
Balance at 1 January 2013 1,757 64 1,168 11 21 20 (618) 2,423
Total comprehensive income/(loss):
Loss for the year - - - - - - (3) (3)
Other comprehensive income/(loss), net of tax:
Remeasurements of defined benefit liability/(asset) - - - - - - 15 15
Foreign currency translation differences for foreign
operations - - - (13) - - - (13)
Net profit on hedge of net investment in foreign operation - - - 10 - - - 10
Fair value reserve (Available-for-sale financial assets):
- Net change in fair value - - - - (22) - - (22)
- Net amount transferred to profit or loss - - - - (2) - - (2)
Tax on other comprehensive income/(loss) - - - - 6 - (3) 3
Total other comprehensive income/(loss) - - - (3) (18) - 12 (9)
Total comprehensive income/(loss) - - - (3) (18) - 9 (12)
Transactions with owners, recorded directly in equity:
Contributions by and distributions to owners:
Equity settled share-based payment - - - - - (2) - (2)
Total contributions by and distributions to owners - - - - - (2) - (2)
Balance at 31 December 2013 / 1 January 2014 1,757 64 1,168 8 3 18 (609) 2,409
Total comprehensive income/(loss):
Profit for the year - - - - - - 141 141
Other comprehensive income/(loss), net of tax:
Remeasurements of defined benefit liability/(asset) - - - 1 - - (80) (79)
Foreign currency translation differences for foreign
operations - - - 60 - - - 60
Net loss on hedge of net investment in foreign operation - - - (70) - - - (70)
Fair value reserve (Available-for-sale financial assets):
- Net change in fair value - - - - 55 - - 55
- Net amount transferred to profit or loss - - - - (2) - - (2)
Tax on other comprehensive income/(loss) - - - 11 (11) - 16 16
Total other comprehensive income/(loss) - - - 2 42 - (64) (20)
Total comprehensive income/(loss) - - - 2 42 - 77 121
Balance at 31 December 2014 1,757 64 1,168 10 45 18 (532) 2,530
Attributable to equity holders of the Company
The accompanying notes on pages 28 to 115 form an integral part of these financial statements.
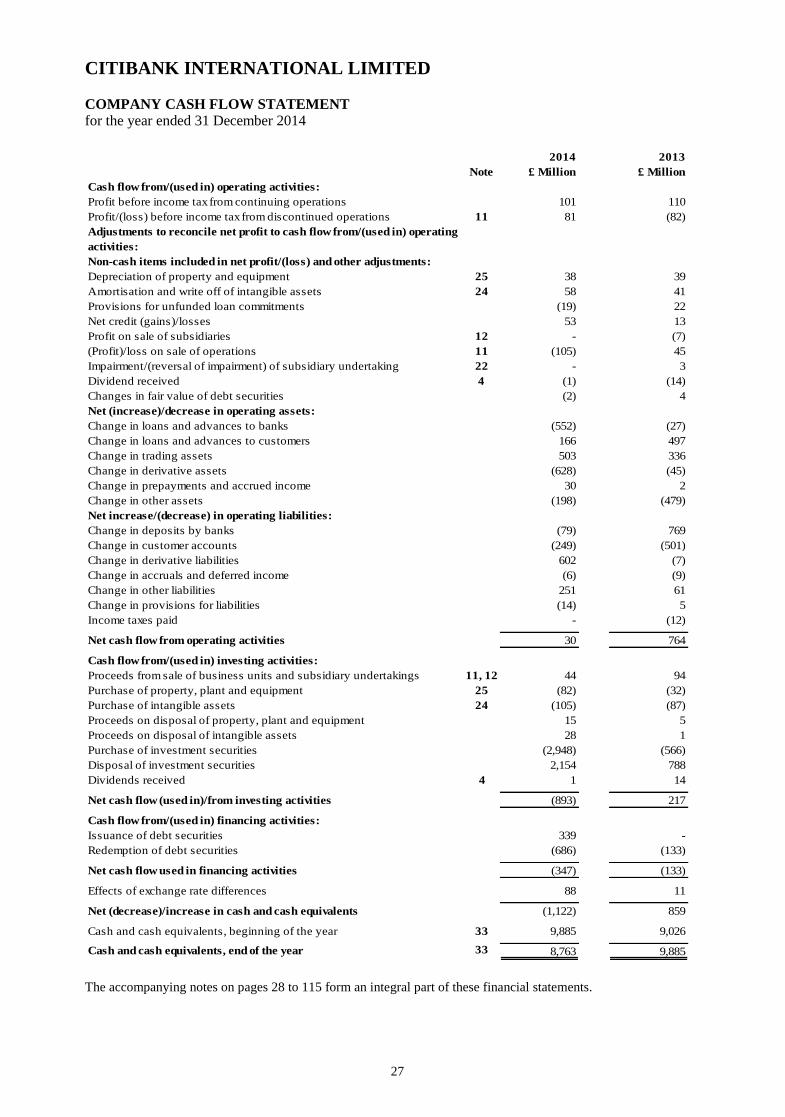
CITIBANK INTERNATIONAL LIMITED
COMPANY CASH FLOW STATEMENT
for the year ended 31 December 2014
27
Note
2014
£ Million
2013
£ Million
Cash flow from/(used in) operating activities:
Profit before income tax from continuing operations 101 110
Profit/(loss) before income tax from discontinued operations 11 81 (82)
Adjustments to reconcile net profit to cash flow from/(used in) operating
activities:
Non-cash items included in net profit/(loss) and other adjustments:
Depreciation of property and equipment 25 38 39
Amortisation and write off of intangible assets 24 58 41
Provisions for unfunded loan commitments (19) 22
Net credit (gains)/losses 53 13
Profit on sale of subsidiaries 12 - (7)
(Profit)/loss on sale of operations 11 (105) 45
Impairment/(reversal of impairment) of subsidiary undertaking 22 - 3
Dividend received 4 (1) (14)
Changes in fair value of debt securities (2) 4
Net (increase)/decrease in operating assets:
Change in loans and advances to banks (552) (27)
Change in loans and advances to customers 166 497
Change in trading assets 503 336
Change in derivative assets (628) (45)
Change in prepayments and accrued income 30 2
Change in other assets (198) (479)
Net increase/(decrease) in operating liabilities:
Change in deposits by banks (79) 769
Change in customer accounts (249) (501)
Change in derivative liabilities 602 (7)
Change in accruals and deferred income (6) (9)
Change in other liabilities 251 61
Change in provisions for liabilities (14) 5
Income taxes paid - (12)
Net cash flow from operating activities 30 764
Cash flow from/(used in) investing activities:
Proceeds from sale of business units and subsidiary undertakings 11, 12 44 94
Purchase of property, plant and equipment 25 (82) (32)
Purchase of intangible assets 24 (105) (87)
Proceeds on disposal of property, plant and equipment 15 5
Proceeds on disposal of intangible assets 28 1
Purchase of investment securities (2,948) (566)
Disposal of investment securities 2,154 788
Dividends received 4 1 14
Net cash flow (used in)/from investing activities (893) 217
Cash flow from/(used in) financing activities:
Issuance of debt securities 339 -
Redemption of debt securities (686) (133)
Net cash flow used in financing activities (347) (133)
Effects of exchange rate differences 88 11
Net (decrease)/increase in cash and cash equivalents (1,122) 859
Cash and cash equivalents, beginning of the year 33 9,885 9,026
Cash and cash equivalents, end of the year 33 8,763 9,885
The accompanying notes on pages 28 to 115 form an integral part of these financial statements.

CITIBANK INTERNATIONAL LIMITED
NOTES TO THE FINANCIAL STATEMENTS
28
1. Principal accounting policies
(a) Basis of preparation
The Company and Group financial statements have both been prepared and approved by the Directors in accordance
with International Financial Reporting Standards (IFRS) as endorsed by the EU.
These financial statements have been prepared under the historical cost convention as modified to include the fair
value of certain financial instruments to the extent required or permitted under the accounting standards and as set out
in the relevant accounting policies. The consolidated Group and Company financial statements are presented in
Pound Sterling (£) and all values are rounded to the nearest million pounds, except where otherwise indicated.
The financial statements have been prepared on a going concern basis taking into account the ultimate reliance on
support from the Group’s parent. The risks and uncertainties identified by the Group are discussed further in the
Strategic Report on pages 6 to 16. Taking these risk factors into account the Directors acknowledge and accept the
intent and ability of Citigroup to provide support to the Group if required and consequently present these financial
statements on a going concern basis. Given the Group’s ultimate reliance on the support of our parent, please refer to
the risk factors impacting Citigroup Inc. from its 2014 annual report, on form 10-K at
http://www.citigroup.com/citi/investor/sec.htm.
Certain comparative figures have been reclassified to conform with the current year’s presentation and for changes in
accounting policies as detailed in Note 1(b), ‘Changes in accounting policy and disclosures’ IFRS 10 – ‘Consolidated
Financial Statements,’ and Note 1(d) ‘Discontinued operations.’ Furthermore, ‘Services for other Citigroup
companies’ have been reclassified as ‘Other operating income’ from ‘General and administrative expenses’ in
accordance with IAS 1 - ‘Presentation of financial statements’.
(b) Changes in accounting policy and disclosures
New and amended standards and interpretations
In preparing these accounts the Group has adopted the following amendments to standards for the first time:
IFRS 10 – Consolidated Financial Statements. The EU endorsed standard became effective for annual
periods beginning on or after 1 January 2014. It replaces the requirements of IAS 27 – Consolidated and
Separate Financial Statements that address the accounting for consolidated financial statements and SIC 12
Consolidation – Special Purpose Entities. What remains in IAS 27 is limited to accounting and disclosure
requirements for subsidiaries, jointly controlled entities, and associates in separate financial statements.
IFRS 10 introduces a new control model that focuses on whether the Group has power over an investee,
exposure or rights to variable returns from its involvement with the investee and the ability to use its power
to affect those returns.
The new standard deals with the divergence in practice in applying IAS 27 and SIC-12 in regards to the
application of the concept of control. IAS 27 required the consolidation of entities that are controlled by a
reporting entity, and it defined control as the power to govern the financial and operating policies of an entity
so as to obtain benefits from its activities. SIC-12, which interpreted the requirements of IAS 27 in the
context of special purpose entities, placed greater emphasis on risks and rewards.
Due to a reassessment of control under IFRS 10, certain special purpose entities or structured entities (SEs)
are no longer consolidated as part of the Group (definition to a structured entity can be found in Note 1(c) -
Consolidation). The Group recorded a charge of £3 million to the prior year’s income statement, net of tax,
for the initial adoption of this standard, as it was concluded that the Group lost control of the SE ‘Europrop
(EMC) S.A.’ in the prior period.
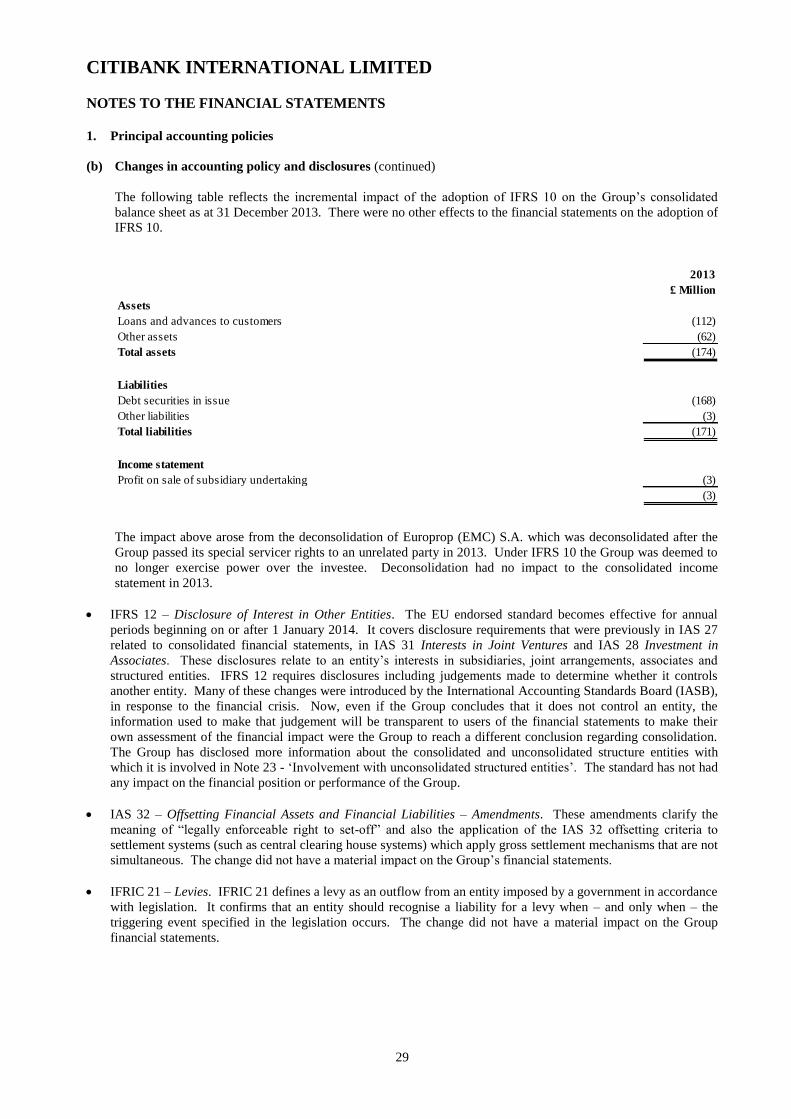
CITIBANK INTERNATIONAL LIMITED
NOTES TO THE FINANCIAL STATEMENTS
29
1. Principal accounting policies
(b) Changes in accounting policy and disclosures (continued)
The following table reflects the incremental impact of the adoption of IFRS 10 on the Group’s consolidated
balance sheet as at 31 December 2013. There were no other effects to the financial statements on the adoption of
IFRS 10.
2013
£ Million
Assets
Loans and advances to customers (112)
Other assets (62)
Total assets (174)
Liabilities
Debt securities in issue (168)
Other liabilities (3)
Total liabilities (171)
Income statement
Profit on sale of subsidiary undertaking (3)
(3)
The impact above arose from the deconsolidation of Europrop (EMC) S.A. which was deconsolidated after the
Group passed its special servicer rights to an unrelated party in 2013. Under IFRS 10 the Group was deemed to
no longer exercise power over the investee. Deconsolidation had no impact to the consolidated income
statement in 2013.
IFRS 12 – Disclosure of Interest in Other Entities. The EU endorsed standard becomes effective for annual
periods beginning on or after 1 January 2014. It covers disclosure requirements that were previously in IAS 27
related to consolidated financial statements, in IAS 31 Interests in Joint Ventures and IAS 28 Investment in
Associates. These disclosures relate to an entity’s interests in subsidiaries, joint arrangements, associates and
structured entities. IFRS 12 requires disclosures including judgements made to determine whether it controls
another entity. Many of these changes were introduced by the International Accounting Standards Board (IASB),
in response to the financial crisis. Now, even if the Group concludes that it does not control an entity, the
information used to make that judgement will be transparent to users of the financial statements to make their
own assessment of the financial impact were the Group to reach a different conclusion regarding consolidation.
The Group has disclosed more information about the consolidated and unconsolidated structure entities with
which it is involved in Note 23 - ‘Involvement with unconsolidated structured entities’. The standard has not had
any impact on the financial position or performance of the Group.
IAS 32 – Offsetting Financial Assets and Financial Liabilities – Amendments. These amendments clarify the
meaning of “legally enforceable right to set-off” and also the application of the IAS 32 offsetting criteria to
settlement systems (such as central clearing house systems) which apply gross settlement mechanisms that are not
simultaneous. The change did not have a material impact on the Group’s financial statements.
IFRIC 21 – Levies. IFRIC 21 defines a levy as an outflow from an entity imposed by a government in accordance
with legislation. It confirms that an entity should recognise a liability for a levy when – and only when – the
triggering event specified in the legislation occurs. The change did not have a material impact on the Group
financial statements.
CITIBANK INTERNATIONAL LIMITED
NOTES TO THE FINANCIAL STATEMENTS
30
1. Principal accounting policies
(b) Changes in accounting policy and disclosures (continued)
Standards issued but not yet endorsed by the EU
There are a number of accounting standards and interpretations that have been issued by the IASB, but which are not
yet effective for the Company and Group financial statements, the Group does not plan on early adoption of these
standards, they include:
IFRS 9 – Financial Instruments. The IASB completed the final element of its comprehensive response to the
financial crisis with the publication of IFRS 9 in July 2014. The improved standard includes a logical model for
classification and measurement, a single, forward-looking ‘expected loss’ impairment model and a substantially-
reformed approach to hedge accounting. The standard replaces the existing guidance in IAS 39 – Financial
Instruments: Recognition and Measurement and carries forward the guidance on recognition and derecognition
of financial instruments from IAS 39. IFRS 9 is effective for annual reporting periods beginning on or after 1
January 2018, with early adoption permitted. The Group is assessing the potential impact on its consolidated
financial statements resulting from the application of IFRS 9. Given the nature of the Group’s operations, the
standard is expected to have a significant impact on the Group’s financial statements. In particular, the
calculation of the impairment of financial instruments on an expected credit loss basis could result in an increase
in the overall level of allowances for loans and advances.
IFRS 15 – Revenue from Contracts with Customers. IFRS 15 establishes a comprehensive framework for
determining whether, how much and when revenue is recognised. It replaces existing revenue recognition
guidance, including IAS 18 Revenue, IAS 11 Construction Contracts and IFRIC 13 Customer Loyalty
Programmes. IFRS 15 is effective for annual reporting periods beginning on or after 1 January 2017, with early
adoption permitted. The Group is assessing the potential impact on its consolidated financial statements
resulting from the application of IFRS 15.
CITIBANK INTERNATIONAL LIMITED
NOTES TO THE FINANCIAL STATEMENTS
31
1. Principal accounting policies (continued)
(c) Consolidation
Subsidiary undertakings that are directly or indirectly controlled by the Group are consolidated. Subsidiary
undertakings are fully consolidated from the date on which control is obtained by the Group. The Group defines
control over a subsidiary undertaking to be when it is exposed to, or has rights to, variable returns from its
involvement with the investee and has the ability to affect those returns through its power over the investee. The
Group reassesses whether it has control if there are changes to one or more of the elements of control. They are de-
consolidated from the date that control ceases. When the Group loses control over a subsidiary, it derecognises the
assets and liabilities of the subsidiary, and any related non-controlling interests and other components of equity. The
Group uses the purchase method of accounting to account for the acquisition of a subsidiary undertaking.
Inter-company transactions, balances and unrealised gains or losses on transactions between group companies are
eliminated. The Group’s accounting policies have been consistently applied for the purposes of preparing the
consolidated accounts.
The Group only consolidates SEs if the substance of its relationship with them indicates that it has control over them.
In assessing whether an entity is a SE, management first assess what the relevant activities are within the entity and
then consider whether the relevant activities are controlled by voting or similar rights. A SE often has some or all of
the following features or attributes, generally meeting any two of the criteria would make the entity a SE:
restricted activities;
a narrow and well defined objective;
insufficient equity to permit the SE to finance its activities without subordinated financial support;
financing in the form of multiple contractually linked instruments to investors that create concentrations of credit
or other risks (tranches).
The following circumstances may indicate a relationship in which, in substance, the Group controls and consequently
consolidates an SE:
the activities of the SE are being conducted on behalf of the Group according to its specific business needs so that
the group obtains variable benefits from the SE’s operation;
the Group has the decision-making powers to obtain the majority of the benefits of the activities of the SE or, by
setting up an ‘autopilot’ mechanism, the Group has delegated these decision-making powers;
the Group has rights to obtain the majority of the benefits of the SE and therefore may be exposed to risks
incidental to the activities of the SE;
the Group retains the majority of the residual or ownership risk related to the SE or its assets in order to obtain
benefits from its activities.
The assessment of whether the Group has control over an SE is carried out at inception and no further reassessment of
control is carried out in the absence of changes in the structure or terms of the SE, additional transactions between the
Group and the SE or change in relevant accounting standards. Day-to-day changes in market conditions do not lead to
a reassessment of control. However, sometimes changes in market conditions may alter the substance of the
relationship between the Group and the SE and in such instances the Group determines whether the change warrants
reassessment of control based on the specific facts and circumstances. Where the Group’s voluntary actions, such as
lending amounts in excess of existing liquidity facilities or extending terms beyond those established originally,
change the relationship between the Group and an SE, the Group performs a reassessment of control over the SE.
After a reassessment following the adoption of IFRS 10, the Group no longer consolidates any SEs.
The Group’s results are consolidated in the financial statements of its ultimate parent company, Citigroup Inc., which
are made available to the public annually.

CITIBANK INTERNATIONAL LIMITED
NOTES TO THE FINANCIAL STATEMENTS
32
1. Principal accounting policies (continued)
(d) Discontinued operations
As mentioned in the Directors’ Report, during the year the Group sold its Greece Consumer banking business to a
third party. These operations contributed significantly to the Citi Holdings segment of the Group and represented a
separate cash generating unit under IFRS. As such, the Greece Consumer banking business has been classified as a
discontinued operation under IFRS 5, ‘Non-current Assets Held for Sale and Discontinued Operations.’
The results of discontinued operations have been disclosed separately as a single amount in the income statement for
the relevant periods presented, comprising the post-tax profit or loss of discontinued operations and the post- tax gain
or loss recognised on measurement to fair value less costs to sell. Prior period disclosures have been updated to
distinguish between continuing and discontinued operations. Please refer to Note 11 ‘Discontinued operations’ for
further information.
(e) Segmental reporting
An operating segment is a component of the Group, which earns revenues and incurs expenses, whose results are
regularly reviewed by management and for which discrete financial information is available. The Group is organised
into two operating segments; Citicorp and Citi Holdings. This organisational structure is the basis upon which the
Group reports its primary segment information. There are two geographic segments for which management review
the operations of the Group – the United Kingdom; and Western Europe. Segment income, segment expenses and
segment performance include transfers between business segments, which are conducted at arm’s length.
(f) Foreign currencies
The Group and Company financial statements are presented in Pounds Sterling (£), which is the presentational
currency of the Group and Company. Transactions in foreign currencies are measured in each of the Group’s
branches or entities using their functional currency, being the functional currency of the primary economic
environment in which they operate. The principal functional currencies are Pounds Sterling and Euro.
At the balance sheet date monetary assets and liabilities are translated at the year-end rates of exchange and translation
differences are included in the income statement. Non-monetary assets and liabilities measured at historical cost are
translated at the exchange rate at the date of the transaction. Non-monetary assets and liabilities that are classified as
“held for trading” or “designated at fair value” are translated at the year-end spot rate. Any exchange profits and
losses on non-monetary items remeasured through other comprehensive income are taken directly to the statement of
comprehensive income.
On consolidation, the assets and liabilities of the Group’s foreign entities are translated at year end rates of exchange
to the presentational currency. Income and expense items are translated at the average exchange rates to
presentational currency. Exchange differences arising on the retranslation of opening net investments in foreign
entities at year end exchange rates and arising from the translation of the results of these overseas subsidiaries and
branches at the average exchange rate are taken directly to equity.
(g) Net interest income
Interest income and expense on financial assets and liabilities is recognised in the income statement using the
effective interest rate method. Fees and direct costs relating to loan origination, re-financing or restructuring and to
loan commitments are deferred and amortised to interest earned on loans and advances using the effective interest
method. The effective interest rate (EIR) is the rate that exactly discounts the estimated future cash payments and
receipts through the expected life of the financial assets or liability to the carrying amount of the financial asset or
liability. When calculating the effective interest rate, the Group estimates future cash flows considering all
contractual terms of the financial instrument, but not future credit losses.
CITIBANK INTERNATIONAL LIMITED
NOTES TO THE FINANCIAL STATEMENTS
33
1. Principal accounting policies (continued)
(h) Fees and commissions
Fees and commissions income and expenses that are integral to the effective interest rate on a financial asset or
liability are included in the measurement of the effective interest rate.
Fees and commissions income not integral to effective interest arising from negotiating, or participating in the
negotiation of a transaction from a third party, such as securities or cash clearing or the purchase or sale of businesses,
are recognised on an accruals basis as the service is provided. Portfolio and other management advisory and service
fees are recognised based on the applicable service contracts. Non-performance based asset management fees are
recognised over the period in which the services are rendered. Performance based asset management fees, income
from wealth management and custody services are recognised when the amount of revenue can be measured reliably
and it is probable that such fees will flow to the Group.
Other fees and commission expenses are recognised as the services to which they relate are received.
(i) Dividend income
Dividend income is recognised when the right to receive payment is established which is the ex-dividend date for
equity securities.
(j) Net income on items at fair value through profit and loss
Net income on items at fair value through profit and loss comprises all gains less losses related to trading assets and
liabilities and financial instruments designated at fair value, and includes all realised and unrealised fair value
changes, together with related interest, dividends and foreign exchange differences.
(k) Derivative contracts
Derivatives are initially recognised at fair value on the date on which a derivative contract is entered into and are
subsequently re-measured at their fair value. Fair values are obtained from quoted market prices in active markets,
including recent market transactions, and valuation techniques, including discounted cash flow models and options
pricing models, as appropriate. All derivatives are carried as assets when fair value is positive and as liabilities when
fair value is negative. Changes in fair value are recognised in net income.
Derivatives may be embedded in another contractual arrangement (a “host contract”). The Group accounts for
embedded derivatives separately from the host contract when the host contract is not itself carried at fair value through
profit or loss, and the characteristics of the embedded derivative are not closely related to the host contract.
When a derivative instrument or a non-derivative financial liability is designated as the hedging instrument in a hedge
of a net investment in a foreign operation, the effective portion of changes in the fair value of the hedging instrument
is recognised in other comprehensive income in the translation reserve. Any ineffective portion of the changes in the
fair value of the derivative is recognised immediately in profit or loss. The amount recognised in other
comprehensive income is reclassified to profit or loss as a reclassification adjustment on disposal of the foreign
operation.
(l) Other financial assets and liabilities
Trading assets
The Group’s trading assets are acquired principally for the purpose of selling in the near term, or form part of a
portfolio of financial instruments that are managed together and for which there is evidence of short-term profit
taking. Trading assets are initially and subsequently measured at fair value. Gains and losses realised on disposal or
redemption and unrealised gains and losses from changes in fair value are reported in net income on items at fair value
through profit and loss. The Group uses trade date accounting when recording trading assets.
CITIBANK INTERNATIONAL LIMITED
NOTES TO THE FINANCIAL STATEMENTS
34
1. Principal accounting policies (continued)
(l) Other financial assets and liabilities (continued)
Investment securities
Investment securities are recognised on a trade date basis and are classified as either Held-to-maturity,
Available-for-sale or Designated at Fair Value.
Held-to-maturity investment securities are non-derivative financial assets with fixed or determinable payments and
fixed maturities that the Group’s management has the positive intention and ability to hold to maturity.
Held-to-maturity investment securities are initially recognised at fair value, including directly attributable costs, and
subsequently measured at amortised cost using the effective interest method less any impairment losses. A sale or
reclassification of any held-to-maturity investments would result in the reclassification of all held-to-maturity
investments as available for sale, and would prevent the Group from classifying investment securities as held to
maturity for the current and the following two financial years. Sales or reclassification is allowed in any of the
following circumstances:
sales or reclassifications that are so close to maturity that changes in the market rate of interest would not have a
significant effect on the financial asset’s fair value;
sales or reclassifications after the entity has collected substantially all of the asset’s original principal; or
sales or reclassifications attributable to non-recurring isolated events beyond the entity’s control that could not
have been reasonably anticipated.
Available-for-sale investment securities are those intended to be held for an indefinite period of time, which may be
sold in response to needs for liquidity or changes in interest rates, exchange rates or equity prices. Available-for-sale
investment securities are initially recognised at fair value including directly attributable costs and subsequently
measured at fair value with the changes in the fair value reported in the statement of comprehensive income.
The translation of gains and losses on foreign currency debt securities is taken directly through the income statement.
When available-for-sale debt securities are sold the cumulative gain or loss previously recognised in the statement of
comprehensive income is transferred to the income statement and disclosed within investment income.
When available for sale debt securities are impaired the impairment is recognised in the income statement. The Group
uses trade date accounting when recording investment securities.
Loans and receivables
Loans and receivables consist of non-derivative financial assets with fixed or determinable payments that are not
quoted in an active market, not classified as available-for-sale and the Group does not intend to sell them immediately
or in the near term. They are initially recognised at fair value, which is the cash given to originate the loan, including
any directly attributable transaction costs less fees received and subsequently measured at amortised cost using the
effective interest rate method, less any impairment charges. Loans are recognised when cash is advanced to
borrowers and are derecognised when the rights to receive cash flows have expired or the Group has transferred
substantially all the risks and rewards of ownership.
The Group may enter into certain lending commitments for which an off balance sheet undrawn commitment is
recognised. Where the loan, on drawdown, is expected to be retained by the Group, the commitment is only
recognised on balance sheet when it is an onerous contract that is likely to give rise to a loss. See Note 36 –
‘Contingent liabilities and commitments’ for further details.
During the year, the Group executed the legal sale of a commercial real estate loan that it originated, where the buyers
become legal lenders of record (“lenders”) and parties to the loan agreement. These sales were executed on a non-
recourse basis. The lenders executed an agreement among themselves (“inter-creditor agreement”) under which
certain lenders have agreed to subordinate their rights to the cash flows of the loan in exchange for the right to receive
a higher interest rate. The Group has retained a portion of the senior loan. Under IAS 39, the portions of the loan
legally sold do not qualify for derecognition as the portions do not represent a fully proportionate share of the cash
flows of the loan, due to the inter-creditor agreement. Further, the entire loan does not qualify for derecognition as the
Group has not transferred its rights to receive cash flows from the entire financial asset. Accordingly, the amounts of
the loan legally sold have not been derecognised from the Group’s balance sheet.

CITIBANK INTERNATIONAL LIMITED
NOTES TO THE FINANCIAL STATEMENTS
35
1. Principal accounting policies (continued)
(l) Other financial assets and liabilities (continued)
Financial instruments designated at fair value
The Group may designate financial instruments at fair value through profit and loss when:
i) this will eliminate or significantly reduce measurement or recognition inconsistencies that would otherwise arise
from measuring financial assets or financial liabilities, or recognising gains and losses on them, on different
bases;
ii) groups of financial assets, financial liabilities or combinations thereof are managed, and their performance
evaluated, on a fair value basis in accordance with a documented risk management or investment strategy, and
where information about groups of financial instruments is reported to management on that basis; or
iii) financial instruments containing one or more embedded derivatives that significantly modify the cash flows
resulting from those financial instruments.
The Group has designated as at fair value through profit and loss certain investment securities and customer loans and
advances on the basis that these securities are managed and their performance evaluated on a fair value basis and
certain debt securities on the basis that these contain one or more embedded derivatives. See Note 16 – ‘Financial
assets and liabilities’ for further details.
Financial liabilities
Deposits, customer accounts, debt securities in issue, subordinated loans and derivative financial liabilities are initially
recognised and measured at fair value net of transaction costs at trade date. Subsequently, they are measured at
amortised cost using the effective interest rate method, except for derivative financial liabilities and any liabilities
designated on initial recognition as at fair value through profit and loss.
The Group has designated as at fair value through profit and loss a number of issued debt securities that contain
embedded equity, interest rate and credit derivatives that would otherwise be required to be split and separately
accounted for at fair value. The fair value of issued debt securities also takes into account an allowance for the
Group’s own credit risks. See Note 16 – ‘Financial assets and liabilities’ for further details.
Reverse repurchase agreements
When the Group purchases a financial asset and simultaneously enters into an agreement to resell the asset or a
substantially similar asset at a fixed price on a future date, the arrangement is accounted for as a loan or advance, and
the underlying asset is not recognised in the Group`s financial statements.
Offsetting financial instruments
Financial assets and liabilities are offset and the net amount is reported in the balance sheet when there is a legally
enforceable right to offset the recognised amounts and there is an intention to settle on a net basis, or realise the asset
and settle the liability simultaneously.
(m) Impairment of financial assets
The Group assesses at each balance sheet date whether there is objective evidence that a financial asset or a portfolio
of financial assets is impaired. A financial asset or portfolio of financial assets is impaired and impairment losses are
incurred if, and only if, there is objective evidence of impairment as a result of one or more loss events that occurred
after the initial recognition of the asset and prior to the balance sheet date (“a loss event”) and that loss event or events
has had an impact on the estimated future cash flows of the financial asset or the portfolio that can be reliably
estimated. Objective evidence that a financial asset or a portfolio is impaired includes observable data that comes to
the attention of the Group about the following loss events:
significant financial difficulty of the issuer or obligor;
a breach of contract, such as a default or delinquency in interest or principal payments;
it becomes probable that the borrower will enter bankruptcy or other financial reorganisation;
the disappearance of an active market for that financial asset because of financial difficulties; or
observable data indicating that there is a measurable decrease in the estimated future cash flows from a portfolio
of financial assets since the initial recognition of those assets, although the decrease cannot yet be identified with
the individual financial assets in the portfolio, including:
i) adverse changes in the payment status of borrowers in the portfolio; and
ii) national or local economic conditions that correlate with defaults on the assets in the portfolio.
CITIBANK INTERNATIONAL LIMITED
NOTES TO THE FINANCIAL STATEMENTS
36
1. Principal accounting policies (continued)
(m) Impairment of financial assets (continued)
The Group first assesses whether objective evidence of impairment exists individually for financial assets that are
individually significant and individually or collectively for financial assets that are not individually significant. Assets
that are individually assessed for impairment and for which an impairment loss is or continues to be recognised are
not included in a collective assessment of impairment.
For loans and advances and for assets held-to-maturity the amount of impairment loss is measured as the difference
between the asset's carrying amount and the present value of estimated future cash flows considering collateral,
discounted at the asset's original effective interest rate. The amount of the loss is recognised in a separate account
Allowances for loans and advances and the amount of the loss is included in the income statement. Financial assets
not individually impaired are grouped together to assess impairment collectively and are shown in Allowances for
loans and advances. The collective assessment includes an assessment of losses:
that have been incurred but not yet identified taking into account historical loss experience and the estimated
period between impairment occurring and loss being identified;
based on statistical analysis of historical data and the Group’s experience of delinquency and default; and
from the impact of other risk factors including unemployment rates, bankruptcy trends, economic conditions and
the current level of write offs.
For the purposes of the collective evaluation of impairment, financial assets are grouped on the basis of similar credit
risk characteristics by using a grading process that considers obligor type, industry, geographical location, collateral
type, past-due status and other relevant factors. These characteristics are relevant to the estimation of future cash
flows for groups of such assets by being indicative of the likelihood of receiving all amounts due under a facility
according to the contractual terms of the assets being evaluated.
Future cash flows in a group of financial assets that are collectively evaluated for impairment are estimated on the
basis of the contractual cash flows of the assets in the group and historical loss experience for assets with credit risk
characteristics similar to those in the Group.
When a loan is un-collectable, it is written off against the related provision for loan impairment. Such loans are
written off after all the necessary procedures have been completed and the amount of the loss has been determined.
If, in a subsequent period, the amount of the impairment loss decreases and the decrease can be related objectively to
an event occurring after the impairment was recognised, the previously recognised impairment loss is reversed by
adjusting the allowance account. The amount of the reversal is recognised in the income statement.
In certain circumstances the Group will grant customers concessionary modifications to the terms of their loans or
advances. In the event of default, the Group seeks to restructure loans rather than to take possession of collateral. This
may involve extending the payment arrangements and the agreement of new loan conditions. Once the terms have
been renegotiated, any impairment is measured using the original EIR as calculated before the modification of terms
and the loan is no longer considered past due. Management regularly reviews renegotiated loans to ensure that all
criteria are met and that future payments are likely to occur. The loans continue to be subject to an individual or
collective impairment assessment, calculated using the loan’s original EIR. In such cases the loans or advances are no
longer considered past due, but are considered to be current once the minimum number of payments is received or
agreed criteria are met. Consequently the risk profile of such loans and advances mirror that of other unaltered loans
and advances in the same delinquency state as long as they adhere to revised payment terms. For wholesale loans
which are subject to renegotiation and constitute part of remedial management of underperforming assets, the Group
remedial management policy permits the relevant business responsible for that debt to enter into the renegotiation of a
facility to an obligor or relationship experiencing financial difficulty by modifying the underlying contract and/or
granting certain types of concessions.
In the case of equity instruments classified as available for sale, a significant or prolonged decline in the fair value of
the security below its cost is objective evidence that an impairment exists. In the case of debt instruments classified as
available for sale, impairment is assessed based on the same criteria as for assets held at amortised cost. An
impairment is recognised by reclassifying the accumulated loss in other comprehensive income to profit and loss.

CITIBANK INTERNATIONAL LIMITED
NOTES TO THE FINANCIAL STATEMENTS
37
1. Principal accounting policies (continued)
(m) Impairment of financial assets (continued)
Subsequent increases in the fair value of available for sale debt securities are recognised in other comprehensive
income, unless the increase can be objectively related to an event occurring after the impairment loss was recognised
in which case the impairment is reversed through the income statement. Reversals of impairment of available for sale
equity securities are not recognised in the income statement. Increases in the fair value of equity shares after
impairment are recognised directly in other comprehensive income.
(n) Derecognition of financial assets and liabilities
Financial assets are derecognised when the right to receive cash flows from assets has expired or the Group has
transferred its contractual right to receive the cash flows of the financial assets and either substantially all the risks and
rewards of ownership have been transferred or substantially all the risks and rewards have neither been retained nor
transferred but control is not retained.
Financial liabilities are derecognised when they are extinguished, that is, when the obligation is discharged, cancelled,
expired, modified or exchanged.
In transactions in which the Group neither retains nor transfers substantially all the risks and rewards of ownership of
a financial asset and it retains control over the asset, the Group continues to recognise the asset to the extent of its
continuing involvement, determined by the extent to which it is exposed to changes in the value of the transferred
assets.
(o) Goodwill and intangible assets
Goodwill
Acquired goodwill represents the excess of the cost of an acquisition over the fair value of the Group’s share of the
net identifiable assets of the acquired subsidiary undertaking at the date of acquisition. Gains and losses on the
disposal of an entity include the carrying amount of goodwill relating to the entity sold. Goodwill is stated at cost less
any accumulated impairment losses.
Other intangible assets
Intangible assets that are acquired by the Group are stated at cost less accumulated amortisation and impairment
losses. Amortisation is charged to the income statement using the methods that best reflect the economic benefits
over their estimated useful economic lives. The estimated useful lives are as follows:
Acquired computer software licenses 3 - 5 years
Computer software development 1 - 3 years
Computer software development:
Costs associated with developing or maintaining computer software programs are recognised as an expense as
incurred. Costs that are directly associated with the production of identifiable and unique software products
controlled by the Group and that will probably generate economic benefits exceeding costs beyond one year are
recognised as intangible assets. The cost of developed software includes directly attributable internal and external
costs.
Client intangibles:
Client intangibles are identifiable assets and are recognised at their present value based on cash flow forecasts on
acquired contractual rights over customer relationships.

CITIBANK INTERNATIONAL LIMITED
NOTES TO THE FINANCIAL STATEMENTS
38
1. Principal accounting policies (continued)
(p) Property, plant and equipment
Items of property, plant and equipment are stated at cost, less accumulated depreciation and impairment losses
(see below). Depreciation is provided to write off the cost, less the estimated residual value of each asset, on a
straight-line basis over their estimated useful lives. Land is not depreciated. Estimated useful lives are as follows:
Freehold buildings 50 years
Leasehold property lease term
Leasehold improvements shorter of lease term and 10 years
Vehicles, furniture and equipment between 1 and 10 years
Leased assets between 1 and 20 years
Subsequent costs are included in the asset’s carrying amount or recognised as a separate asset, as appropriate, only
when it is probable that future economic benefits associated with the item will flow to the Group and the cost of the
item can be measured reliably. All other repairs and maintenance are charged to the income statement during the
financial period during which they are incurred.
Property and equipment is derecognised on disposal or when no future economic benefits are expected from its use.
Any gain or loss arising on derecognition of the asset (calculated as the difference between the net disposal proceeds
and the carrying amount of the asset) is recognised in other operating income in the income statement in the year the
asset is derecognised.
(q) Impairment of goodwill, intangible assets and property, plant and equipment
At each reporting date, the Group assesses whether there is any indication that its intangible assets or property, plant
and equipment are impaired. Goodwill is tested for impairment annually or more frequently if events or changes in
circumstance indicate that it might be impaired. Goodwill is allocated to cash generating units for the purpose of
impairment testing. Impairment losses in respect of goodwill are not reversed. Please refer to Note 24 – ‘Goodwill
and intangible assets’ for further details on impairment testing for cash generating units containing goodwill,
including the key assumptions underlying recoverable amounts.
(r) Finance and operating leases
Where the Group leases out equipment and there is a transfer of substantially all of the risks and rewards of ownership
to the lessee, the lease is accounted for as a finance lease. Operating leases are leases other than finance leases.
Finance and operating leases – as lessee
Assets held under finance leases and hire purchase contracts are capitalised and depreciated as described in
Note 1(p) above. Finance charges are allocated to accounting periods so as to produce a constant periodic rate of
interest on the remaining balance of the obligation for each accounting period. Rentals payable under operating leases
are charged to the income statement on a straight line basis over the lease term and are included within “General and
administrative expenses”.
Finance and operating leases – as lessor
The net investment in finance leases is included in “Loans and advances to customers”. The gross earnings over the
period of the lease are allocated to give a constant periodic rate of return on the net investment. Direct costs of
initiating leases are added to the initial recognition amount of the lease receivable. Rentals receivable are included
within “Interest and similar income”.
Assets held for the purpose of leasing to third parties under operating leases are included in “Property, plant and
equipment” and depreciated on a straight-line basis over their estimated useful lives. Rentals receivable are accounted
for on a straight-line basis over the period of the lease and are included within “Other operating income”.
CITIBANK INTERNATIONAL LIMITED
NOTES TO THE FINANCIAL STATEMENTS
39
1. Principal accounting policies (continued)
(r) Finance and operating leases (continued)
Residual values
Residual value exposure occurs due to the uncertain nature of the value of an asset at the end of an agreement.
Throughout the life of an asset its residual value will fluctuate because of the uncertainty of the future market and
technological changes or product enhancements as well as general economic conditions.
Residual values are set at the commencement of the lease based upon management’s expectations of future values.
During the course of the lease residual values are reviewed on an annual basis so as to identify any potential
impairment. Any reduction in the residual value that leads to an impairment of a leased asset is identified within such
reviews and recognised immediately.
(s) Shares in subsidiary undertakings
The Group’s shares in subsidiary undertakings, comprising unlisted securities, are shown at cost less allowance for
impairment.
Amounts receivable from the liquidation of subsidiary undertakings are included within “Other assets”.
The Group determines whether it is necessary to recognise an impairment loss on its investment in shares in
subsidiary undertakings by comparing the carrying value of the investment with the net asset value of the subsidiary
undertaking at the reporting date.
(t) Income taxes
Income tax payable on profits is recognised as an expense based on the applicable tax laws in each jurisdiction in the
period in which profits arise.
Deferred tax assets and liabilities are recognised for taxable and deductible temporary differences between the tax
bases of assets and liabilities and their carrying amounts in the financial statements. Deferred tax assets are
recognised to the extent that it is probable that there will be sufficient profits available against which these differences
can be utilised.
Deferred tax assets and liabilities are measured at the tax rates that are expected to apply in the period in which the
asset will be realised or the liability will be settled based on tax rates that are enacted or substantively enacted at the
balance sheet date.
Deferred tax relating to remeasurements on defined benefits plans is recognised in other comprehensive income.
Deferred tax relating to share-based payment transactions is recognised directly in equity to the extent that the amount
of the estimated future tax deduction exceeds the amount of the related cumulative remuneration expense. Deferred
tax relating to fair value re-measurements of available-for-sale investments and cash flow hedging instruments which
are charged or credited directly to other comprehensive income, is also charged or credited to other comprehensive
income and is subsequently recognised in the income statement when the deferred fair value gain or loss is recognised
in the income statement.
Income tax comprises current tax and deferred tax. Income tax is recognised in the income statement except to the
extent that it relates to items recognised in other comprehensive income or directly in equity, in which case it is
recognised in the same statement in which the related item appears.
CITIBANK INTERNATIONAL LIMITED
NOTES TO THE FINANCIAL STATEMENTS
40
1. Principal accounting policies (continued)
(u) Retirement benefit obligations
The Group participates in and operates state and non-state run defined contribution pension schemes for its
employees, both in the UK and locally overseas. The charge against profit is the contributions payable in respect of
the service provided during the year.
The Group also participates in and continues to operate defined benefit pension schemes for employees in Spain,
Norway, Italy, Netherlands, Austria, Belgium and Greece. Staff do not make contributions for basic pensions. For its
overseas defined benefit plans, the net liability recognised in the balance sheet is the actuarially calculated present
value of the defined benefit obligation at the balance sheet date, less the fair value of the plan assets.
The defined benefit obligation is calculated annually by independent actuaries using the projected unit credit method.
The present value of the defined benefit obligation is determined by discounting the estimated future cash outflows
using interest rates of high-quality corporate bonds that are denominated in the currency in which the benefits will be
paid and that have terms to maturity approximating to the terms of the related pension liability. Actuarial gains and
losses are recognised immediately in the statement of comprehensive income. Current and prior service costs and net
interest costs are recognised in the income statement.
A surplus is recognised on the balance sheet where an economic benefit is available as a reduction in future
contributions or as a refund of monies to the Group.
(v) Share-based incentive plans
The Group participates in a number of Citigroup Inc. (“Citigroup”) share-based incentive plans under which Citigroup
grants shares to the Group’s employees. Pursuant to a separate Stock Plans Affiliate Participation Agreement
(SPAPA) the Group makes a cash settlement to Citigroup for the fair value of the share-based incentive awards
delivered to the Group’s employees under these plans.
The Group uses equity-settled accounting for its share-based incentive plans, with separate accounting for its
associated obligations to make payments to Citigroup. The Group recognises the fair value of the awards at grant date
as a compensation expense over the vesting period with a corresponding credit in the equity reserve as a capital
contribution from Citigroup. All amounts paid to Citigroup and the associated obligations under the SPAPA are
recognised in the equity reserve over the vesting period. Subsequent changes in the fair value of all unexercised
awards and the SPAPA are reviewed annually and any changes in value are recognised in the equity reserve, again
over the vesting period.
For Citigroup’s share-based incentive plans that have a graded vested period each “tranche” of the award is treated as
a separate award, where a plan has a cliff vest the award only has a single “tranche”. The expense is recognised in the
first year of deferral.
Vesting period of award Year 1 Year 2 Year 3 Year 4
2 Years (2 Tranches) 75% 25%
2 Years (1 Tranche) 50% 50%
3 Years (3 Tranches) 61% 28% 11%
3 years (1 Tranche) 33% 33% 33%
4 Years (4 Tranches) 52% 27% 15% 6%
4 Years (1 Tranche) 25% 25% 25% 25%
% of expense recognised
However, employees who meet certain age plus years of service requirements (retirement eligible employees) may
terminate active employment and continue vesting in their awards provided they comply with specified non-compete
provisions. The cost of share based incentive plans are recognised over the requisite service period. For awards
granted to retiree eligible employees, the services are provided prior to grant date, and subsequently the costs are
accrued in the year prior to the grant date.

CITIBANK INTERNATIONAL LIMITED
NOTES TO THE FINANCIAL STATEMENTS
41
1. Principal accounting policies (continued)
(w) Provisions
Provisions are recognised when it is probable that an outflow of economic benefits will be required to settle a current
legal or constructive obligation as a result of past events, and a reliable estimate can be made of the amount of the
obligation. This includes where the Group has undrawn loan commitments and a provision is made for expected
losses.
(x) Cash and cash equivalents
For the purposes of the cash flow statement, cash and cash equivalents comprise balances with original maturity of
less than three months, including: cash and non-restricted balances with central banks, government securities, loans
and advances to banks and amounts due from other banks.
(y) Fiduciary activities
The Group commonly acts as trustee and in other fiduciary capacities that result in the holding or placing of assets on
behalf of individuals, trusts, retirement benefit plans and other institutions. In acting in this capacity, the Group has
concluded that it acts as an agent, therefore such assets and incomes arising thereon are excluded from these financial
statements, as they are not assets of the Group.
(z) Financial guarantees and loan commitments
Financial guarantees are contracts that require the Group to make specified payments to reimburse the holder for a loss
it incurs because a specified debtor fails to make payment when due in accordance with the terms of a debt
instrument. Loan commitments are firm commitments to provide credit under pre-specified terms and conditions.
Liabilities arising from financial guarantees or commitments to provide a loan at below-market interest rate are
initially measured at fair value and the initial fair value is amortised over the life of the guarantee or the commitment.
The liability is subsequently carried at the higher of this amortised amount and the present value of any expected
payment to settle the liability when a payment under the contracts has become probable. Financial guarantees and
commitments to provide a loan at a below-market interest rate are included within other liabilities.

CITIBANK INTERNATIONAL LIMITED
NOTES TO THE FINANCIAL STATEMENTS
42
2. Use of assumptions estimates and judgements
The results of the Group are sensitive to the accounting policies, assumptions and estimates that underlie the
preparation of its consolidated financial statements. The accounting policies used in the preparation of the
consolidated financial statements are described in detail above.
The preparation of financial statements requires management to make judgements, estimates and assumptions that
affect the application of accounting policies and the reported amounts of assets, liabilities, income and expenses.
Actual results may differ from these estimates.
Estimates and underlying assumptions are reviewed on an ongoing basis. Revisions to accounting estimates are
recognised in the period in which the estimate is revised and in any future periods affected.
In particular, information about significant areas of estimation, uncertainty and critical judgements in applying
accounting policies that have the most significant effect on the amount recognised in the financial statements are:
Estimates and assumptions
The key assumptions concerning the future and other key sources of estimation uncertainty at the reporting date, that
have a significant risk of causing a material adjustment to the carrying amounts of assets and liabilities within the next
financial year, are described below. The Group based its assumptions and estimates on parameters available when the
consolidated financial statements were prepared. Existing circumstances and assumptions about future developments,
however, may change due to market changes or circumstances beyond the control of the Group.
Such changes are reflected in the assumptions when they occur.
Impairment of loans and timing of loss recognition
The Group’s accounting policy for losses in relation to the impairment of loans and advances to customers and banks
is described in Note 1(m). In determining whether an impairment loss should be recorded in the income statement,
the Group makes judgements as to whether there is any observable data indicating that there is a measurable decrease
in the estimated future cash flows from a portfolio of loans before the decrease can be identified with an individual
loan in that portfolio. Management uses estimates based on historical loss experience and experience of losses that
have been incurred but not yet identified for assets with credit risk characteristics and objective evidence of
impairment similar to those in the portfolio when estimating its future cash flows. Note 18 – ‘Allowances for loans
and advances’ details the movement in the impairment provision for the year.
Provisions
The Group’s accounting policy for recognising provisions is described in Note 1(w). Note 30 – ‘Provisions for
liabilities’ discloses the categories of provisions recognised.
“Other Provisions” include provisions for undrawn loan commitments. A similar approach to allowances for loans
and advances is used for calculating a provision for the expected losses related to unfunded loan commitments. See
‘Impairment of loans and timing of loss recognition’ above for a further description of the approach for recognising
losses in relation to the impairment of loans and advances to customers.
Valuation of financial instruments
The Group’s accounting policy for valuation of financial instruments is included in Note 1(k) and Note 1(l). The fair
values of financial instruments that are not quoted in active markets are determined by using valuation techniques.
To the extent practical, models use only observable data, where this is not possible management may be required to
make estimates. Note 16 – ‘Financial assets and liabilities’ further discusses the valuation of financial instruments.
The Group uses the overnight indexed swap (OIS) curves as fair value measurement inputs for the valuation of certain
collateralised interest-rate related derivatives. Citi uses the relevant benchmark curve for the currency of the
derivative (e.g., the London Interbank Offered Rate for U.S. dollar derivatives) as the discount rate for
uncollateralized derivatives. As referenced below, during the third quarter of 2014, Citi incorporated FVA into the
fair value measurements due to what it believes to be an industry migration toward incorporating the market’s view of
funding risk premium in OTC derivatives. Citi’s FVA methodology leverages the existing CVA methodology to
estimate a funding exposure profile. The calculation of this exposure profile considers collateral agreements where the
terms do not permit the firm to reuse the collateral received, including where counterparties post collateral to third-
party custodians.

CITIBANK INTERNATIONAL LIMITED
NOTES TO THE FINANCIAL STATEMENTS
43
2. Use of assumptions estimates and judgements (continued)
Impairment of goodwill, intangible assets and property, plant and equipment
The Group’s accounting policy for assessing whether there is any indication that its intangible assets or property, plant
and equipment are impaired is described in Note 1(q).
Please refer to Note 24 – ‘Goodwill and intangible assets’ for further details on impairment testing for cash generating
units containing goodwill, including the key assumptions underlying recoverable amounts.
Retirement benefit obligation
The Group participates in locally operated defined benefit schemes for its European branches. Defined benefit
schemes are measured on an actuarial basis, with the key assumptions being inflation, discount rate, mortality, and
investment returns. Under the revised IAS 19 the expected return on plan assets is calculated by applying the AA
corporate bond yield discount rate. Inflation rates are selected by reference to the European Central Bank target for
inflation. Mortality assumptions are based upon the relevant standard industry and national mortality tables. Discount
rates are based on specific corporate bond indices which reflect the underlying yield curve of each scheme.
Management judgement is required in estimating the rate of future salary growth. All assumptions are unbiased,
mutually compatible and based upon market expectations at the reporting date. The sensitivity of key assumptions is
discussed in Note 14 – ‘Retirement benefit obligations.’
Deferred tax asset
The Group’s accounting policy for the recognition of deferred tax assets is described in Note 1(t). A deferred tax
asset is recognised to the extent that it is probable that suitable future taxable profits will be available against which
deductible temporary differences can be utilised. The recognition of a deferred tax asset relies on management’s
judgements surrounding the probability and sufficiency of suitable future taxable profits, future reversals of existing
taxable temporary differences and planning strategies.
The amount of the deferred tax asset recognised is based on the evidence available about conditions at the balance
sheet date, and requires significant judgements to be made by management, especially those based on management’s
projections of business growth, credit losses and the timing of a general economic recovery.
Management’s judgement takes into account the impact of both negative and positive evidence, including historical
financial results and projections of future taxable income, on which the recognition of the deferred tax asset is mainly
dependent. Note 27 – ‘Deferred income tax’ further discusses deferred tax.
Management’s forecasts support the assumption that it is probable that the future results of the Group will generate
sufficient suitable taxable income to utilise the deferred tax assets.
Share-based incentive plans
Awards granted through Citigroup's Stock Option Program are measured by applying an option pricing model, taking
into account the terms and conditions of the program. Analysis of past exercise behaviour, Citigroup's dividend
history and historical volatility are inputs to the valuation model.
Credit value adjustment, Funding valuation adjustment and Debt valuation adjustment
Credit valuation adjustments (CVA) and, effective in the third quarter of 2014, funding valuation adjustments (FVA),
are applied to over-the-counter (OTC) derivative instruments in which the base valuation generally discounts expected
cash flows using the relevant base interest rate curve for the currency of the derivative (e.g., LIBOR for
uncollateralized U.S. dollar derivatives). As not all counterparties have the same credit risk as that implied by the
relevant base curve, a CVA is necessary to incorporate the market view of both counterparty credit risk and Citi’s own
credit risk in the valuation. FVA reflects a market funding risk premium inherent in the uncollateralized portion of
derivative portfolios, and in collateralized derivatives where the terms of the agreement do not permit the reuse of the
collateral received.
Citi’s CVA methodology is composed of two steps. First, the credit exposure profile for each counterparty is
determined using the terms of all individual derivative positions and a Monte Carlo simulation or other quantitative
analysis to generate a series of expected cash flows at future points in time. The calculation of this exposure profile
considers the effect of credit risk mitigants, including pledged cash or other collateral and any legal right of offset that
exists with counterparty through arrangements such as netting agreements. Individual derivative contracts that are
subject to an enforceable master netting agreement with a counterparty are aggregated for this purpose, since it is
those aggregate net cash flows that are subject to nonperformance risk.

CITIBANK INTERNATIONAL LIMITED
NOTES TO THE FINANCIAL STATEMENTS
44
2. Use of assumptions estimates and judgements (continued)
Credit value adjustment and Debt valuation adjustment (continued)
This process identifies specific, point-in-time future cash flows that are subject to nonperformance risk, rather than
using the current recognized net asset or liability as a basis to measure the CVA. Second, market-based views of
default probabilities derived from observed credit spreads in the credit default swap (CDS) market are applied to the
expected future cash flows determined in step one. Citi’s own-credit CVA is determined using Citi-specific CDS
spreads for the relevant tenor. Generally, counterparty CVA is determined using CDS spread indices for each credit
rating and tenor. For certain identified netting sets where individual analysis is practicable (e.g., exposures to
counterparties with liquid CDSs), counterparty-specific CDS spreads are used.
The CVA and FVA are designed to incorporate a market view of the credit and funding risk, respectively, inherent in
the derivative portfolio. However, most unsecured derivative instruments are negotiated bilateral contracts and are
not commonly transferred to third parties. Derivative instruments are normally settled contractually or, if terminated
early, are terminated at a value negotiated bilaterally between the counterparties. Thus, the CVA and FVA may not be
realized upon a settlement or termination in the normal course of business. In addition, all or a portion of these
adjustments may be reversed or otherwise adjusted in future periods in the event of changes in the credit or funding
risk associated with the derivative instruments.
Own Debt valuation adjustments (DVA) are recognised on debt securities in issue that are designated at fair value
using Citigroup’s credit spreads observed in the bond market. Accordingly, the fair value of debt securities in issue is
impacted by the narrowing or widening of Citigroup’s credit spreads.
CVA and DVA may not be realised upon a settlement or termination in the normal course of business. In addition, all
or a portion of the credit valuation adjustments may be reversed or otherwise adjusted in future periods in the event of
changes in the credit risk of Citigroup or its counterparties, or changes in the credit mitigants (collateral and netting
agreements) associated with the derivative instruments.
The Group has designated various debt instruments at fair value through profit or loss. Under IAS 39, the Group is
required to incorporate its own-credit risk in the fair value for these liabilities.
During 2014, the Group recorded CVA/FVA/DVA loss of approximately £11 million (2013: loss of £10 million).

CITIBANK INTERNATIONAL LIMITED
NOTES TO THE FINANCIAL STATEMENTS
45
3. Net interest income
2014
£ Million
2013
£ Million
2014
£ Million
2013
£ Million
Interest and similar income
Cash and balances at central banks 2 3 2 3
Loans and advances to banks 33 64 33 64
Loans and advances to customers 66 103 66 95
Investment securities 37 37 37 37
Other interest income 25 28 25 28
163 235 163 227
Interest expense and similar charges
Deposits by banks 30 47 30 47
Customer accounts 18 14 18 14
Debt securities in issue 9 21 9 13
Other interest paid 1 7 1 7
58 89 58 81
Net interest income 105 146 105 146
Group Company
Net interest income on items not at fair value is £42 million (2013: £111 million) for the Group and £42 million
(2013: £110 million) for the Company.
4. Dividend income
2014
£ Million
2013
£ Million
2014
£ Million
2013
£ Million
Dividend income 1 - 1 14
1 - 1 14
Company Group
In the prior year EMSO Partners Limited paid an interim dividend of £11 million to the Company and Diners Club
UK Limited paid an interim dividend of £3 million.
5. Net fee and commission income
2014
£ Million
2013
£ Million
2014
£ Million
2013
£ Million
Fee and commission income 302 275 302 265
Fee and commission expense (27) (18) (27) (17)
275 257 275 248
Company Group
Included within fee and commission income for the Group is £58 million (2013: £64 million) of fee income arising
from trust and fiduciary activities. Expenses of £48 million (2013: £89 million) relating to these activities are
included within the Group’s fee and commission expense and the Group’s general and administrative expenses.
Net fee and commission income for the Group includes £213 million (2013: £258 million) relating to financial assets
and liabilities not carried at fair value. Net fee and commission income of the Company includes £213 million
(2013: £249 million) relating to financial assets and liabilities not carried at fair value.
CITIBANK INTERNATIONAL LIMITED
NOTES TO THE FINANCIAL STATEMENTS
46
6. Net profit/(loss) on items at fair value through profit and loss
2014
£ Million
2013
£ Million
(15) -
Net trading income 13 35
(2) 35
Net loss on financial instruments designated at fair value
Group and Company
7. Net investment income
Available-for-sale
2014
£ Million
2013
£ Million
Debt securities 2 2
2 2
Group and Company
8. Other operating income
2014
£ Million
2013
£ Million
2014
£ Million
2013
£ Million
Services for other Citigroup companies 124 96 124 96
Other 1 6 1 8
125 102 125 104
Company Group
A significant portion of expenses within the Group originate from services provided by the CSCs to other Citi entities,
both globally and regionally. These costs are allocated out to businesses and legal entities based on a number of
drivers. All of these transfer pricing agreements are reviewed regularly for appropriateness. These recoveries are
recognised in Other operating income.
9. Personnel expenses
2014
£ Million
2013
£ Million
Wages and salaries 165 149
Social security costs 30 29
Share based incentive expenses (Note 15) 4 5
Pensions and post retirement benefits:
- Defined contribution plans 6 6
- Defined benefit plans (Note 14) 5 8
Restructuring costs - 1
210 198
Group and Company
The average number of persons employed by the Group during the year was 4,795 (2013: 4,580).

CITIBANK INTERNATIONAL LIMITED
NOTES TO THE FINANCIAL STATEMENTS
47
10. General and administrative expenses
2014
£ Million
2013
£ Million
2014
£ Million
2013
£ Million
Administrative expenses 119 164 121 122
119 164 121 122
Group Company
Group administrative expenses in 2013 included costs arising from EMSO Partners Limited, a subsidiary disposed
during the prior year.
Included within administrative expenses is auditors’ remuneration as follows:
2014
£ Million
2013
£ Million
2014
£ Million
2013
£ Million
Audit of these financial statements 0.5 0.7 0.5 0.7
Amounts receivable by the Group's auditor and
its associates in respect of:
Audit of the financial statements of subsidiaries
of the Company 0.1 0.1 - -
All other services 0.1 0.1 0.1 0.1
0.7 0.9 0.6 0.8
Group Company
The Financial Services Compensation Scheme (FSCS) has provided compensation to consumers following the
collapse of a number of deposit takers. The compensation paid out to consumers is currently funded through loans
from the Bank of England and HM Treasury which at 31 December 2014 stood at approximately £16 billion. In order
to repay the loan principal that is not expected to be recovered, the FSCS levies participating financial institutions. In
January 2015, the FSCS announced that the expected levy on participating financial institutions for Scheme Year
2015/2016 would be £347 million (2014/15: £399 million). Currently, the Management Expenses Levy paid by the
Group represents its share of the capital and interest on these borrowings. The Group could be liable to pay a further
proportion of the outstanding borrowings that the FSCS has borrowed from HM Treasury.
The accrual as at 31 December 2014 was £3.4 million (2013: £2.6 million) which represents £1.7 million for 2014 and
£1.7 million for 2013. This amount is included within administrative expenses.
The ultimate FSCS levy to the industry as a result of the collapse of the deposit takers cannot currently be estimated
reliably as it is dependent on various uncertain factors including the potential recoveries of assets by the FSCS and
changes in the interest rate and level of protected deposits and the population of FSCS members at the time.

CITIBANK INTERNATIONAL LIMITED
NOTES TO THE FINANCIAL STATEMENTS
48
11. Discontinued operations
2014 2013
£ Million £ Million
Total operating income 34 57
Expenses (61) (93)
Net credit gains/(losses) 3 (1)
Profit/(loss) on disposal of operations (see below) 105 (45)
Profit/(loss) before tax from discontinued operations 81 (82)
Tax attributable to discontinued operations (4) 30
Tax attributable to disposal of operation (18) -
Profit/(loss) after tax from discontinued operations 59 (52)
The net cash flows incurred by the Consumer Banking business in Greece were as follows:
2014 2013
£ Million £ Million
Operating (257) (74)
Investing 44 75
Financing - -
Net cash (outflow)/ inflow (213) 1
Disposal of the Consumer Banking business in Greece in 2014
On 30 September 2014, the Group completed the sale of its Consumer banking business in Greece to Alpha Bank.
The Group’s Consumer Banking business in Greece has been classified as a discontinued operation. The disposal is
in line with the Group’s strategy, which continues to wind down Citi Holdings as soon as practicable, in an
economically rational manner, while working to generate long-term profitability and growth from Citicorp, which
comprises its core franchise. The sale was for a consideration of £44 million (€55 million) and resulted in a profit of
£105 million (€130 million) to the Group with a release of allowances of loans and advances of £73 million
(€90 million) being recognised as a net credit gain on disposal.
Disposal of Consumer Banking portfolios in Greece in 2013
On 28 May 2013, the Group sold its non written off personal instalment loan portfolio and its closed credit card
portfolio in Greece for a total consideration of £19 million (€22 million), resulting in a loss of £8 million (€9 million).
On 19 December 2013, the Group sold its mortgage portfolio in Greece for a total consideration of £56 million
(€66 million), resulting in a loss of £37 million (€43 million).
Profit / (loss) on disposal of operations
2014 2013
£ Million £ Million
44 75
- (120)
Net credit gain on disposal 73 -
(12) -
105 (45)
Group and Company
Proceeds
Less:
Carrying value of business/portfolio
Expenses directly related to disposal
Profit/(loss) on sale
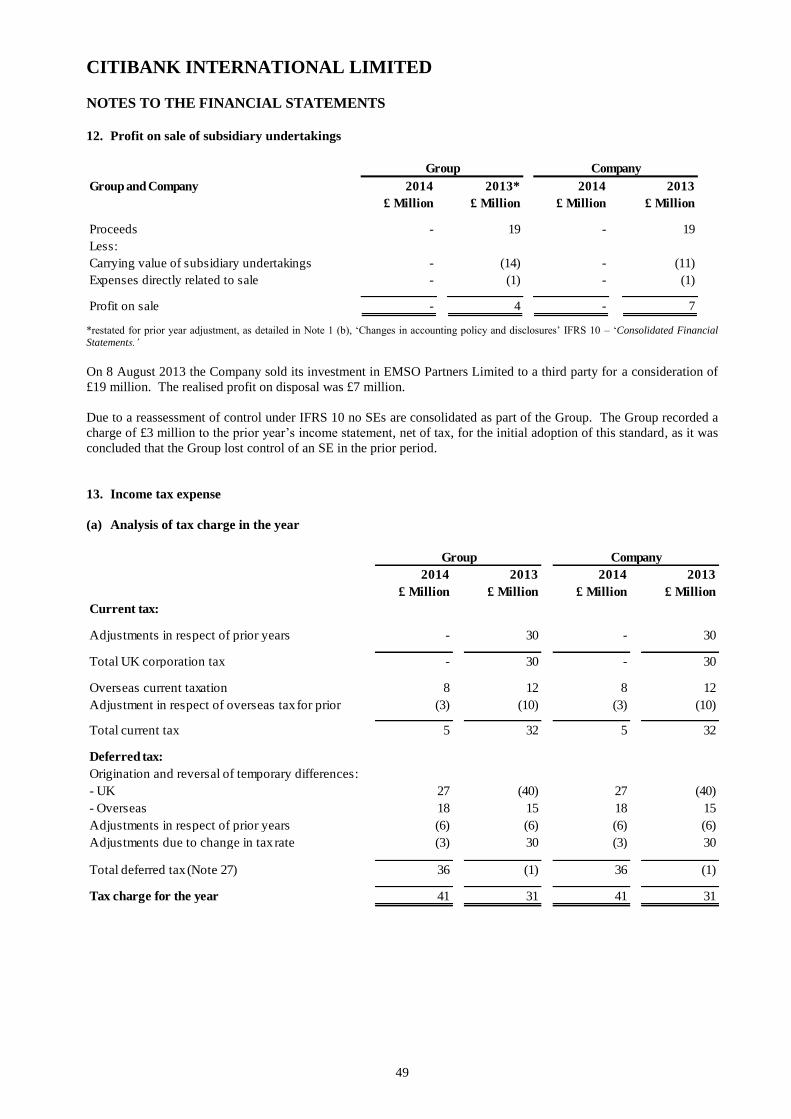
CITIBANK INTERNATIONAL LIMITED
NOTES TO THE FINANCIAL STATEMENTS
49
12. Profit on sale of subsidiary undertakings
Group and Company 2014 2013* 2014 2013
£ Million £ Million £ Million £ Million
Proceeds - 19 - 19
Less:
Carrying value of subsidiary undertakings - (14) - (11)
Expenses directly related to sale - (1) - (1)
Profit on sale - 4 - 7
Group Company
*restated for prior year adjustment, as detailed in Note 1 (b), ‘Changes in accounting policy and disclosures’ IFRS 10 – ‘Consolidated Financial Statements.’
On 8 August 2013 the Company sold its investment in EMSO Partners Limited to a third party for a consideration of
£19 million. The realised profit on disposal was £7 million.
Due to a reassessment of control under IFRS 10 no SEs are consolidated as part of the Group. The Group recorded a
charge of £3 million to the prior year’s income statement, net of tax, for the initial adoption of this standard, as it was
concluded that the Group lost control of an SE in the prior period.
13. Income tax expense
(a) Analysis of tax charge in the year
2014
£ Million
2013
£ Million
2014
£ Million
2013
£ Million
Current tax:
Adjustments in respect of prior years - 30 - 30
Total UK corporation tax - 30 - 30
Overseas current taxation 8 12 8 12
Adjustment in respect of overseas tax for prior (3) (10) (3) (10)
Total current tax 5 32 5 32
Deferred tax:
Origination and reversal of temporary differences:
- UK 27 (40) 27 (40)
- Overseas 18 15 18 15
Adjustments in respect of prior years (6) (6) (6) (6)
Adjustments due to change in tax rate (3) 30 (3) 30
Total deferred tax (Note 27) 36 (1) 36 (1)
Tax charge for the year 41 31 41 31
Group Company

CITIBANK INTERNATIONAL LIMITED
NOTES TO THE FINANCIAL STATEMENTS
50
13. Income tax expense (continued)
(b) Factors affecting tax charge for the year
The main rate of corporation tax for the year beginning 1 April 2014 reduced from 23% to 21% which results in a
weighted average tax rate of 21.49% for 2014 (2013: 23.25%). The differences are explained below:
2014
£ Million
2013
£ Million
2014
£ Million
2013
£ Million
Profit before tax from continuing operations 103 61 101 110
Profit/(loss) before tax from discontinued operations 81 (82) 81 (82)
Profit/(loss) multiplied by the standard rate of
corporation tax in the UK of 21.49% 39 (4) 39 7
Effects of: -
Dividend income - - - (3)
Amounts written off investments - (1) - -
Foreign tax deductions (2) (2) (2) (2)
Other (income) / expenses not deductible for tax
purposes 7 (26) 7 (26)
Group relief surrendered for no consideration - 7 - -
Overseas tax in respect of European branch
operations 9 12 9 12
Adjustment due to change in tax rate (3) 30 (3) 30
Adjustment to tax charge in relation to prior years (9) 15 (9) 13
Tax charge for the year 41 31 41 31
Income tax attributable to discontinued operations (22) 30 (22) 30
19 61 19 61
Group Company
The aggregate tax credit for the Group and Company relating to items that are charged to equity at 31 December 2014
was £16 million (2013: £4 million).
2014
£ Million
2013
£ Million
2014
£ Million
2013
£ Million
Change in fair value on Available-for-sale assets 11 (6) 11 (6)
Net profit on hedge of net investment in operation (11) - (11) -
Actuarial (losses)/gains on retirement benefits (16) 3 (16) 3
(16) (3) (16) (3)
Items taken directly to equity - Share based
compensation - (1) - (1)
(16) (4) (16) (4)
Group Company
The UK Government announced that the corporation tax rate will reduce to 20% from 1 April 2015. The reduction in
corporation tax rate to 20% was enacted in July 2013. Deferred tax in the UK has been recognised at 20% which was
the rate substantively enacted at 31 December 2014.
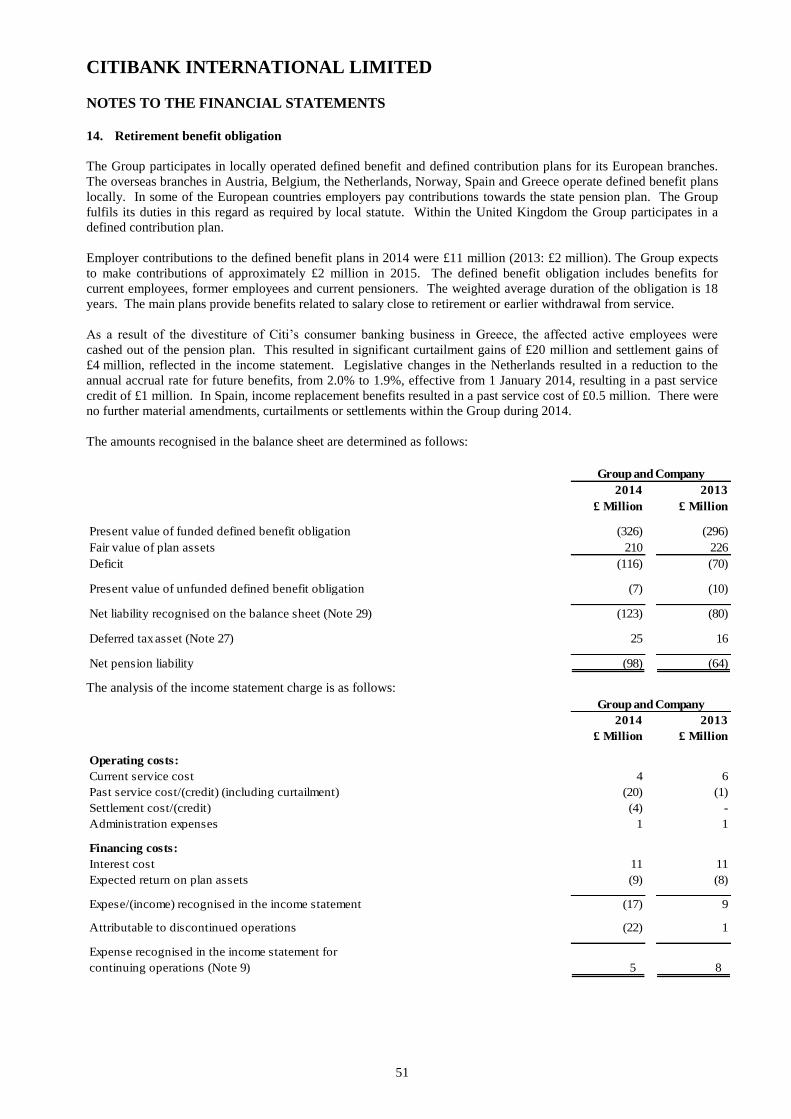
CITIBANK INTERNATIONAL LIMITED
NOTES TO THE FINANCIAL STATEMENTS
51
14. Retirement benefit obligation
The Group participates in locally operated defined benefit and defined contribution plans for its European branches.
The overseas branches in Austria, Belgium, the Netherlands, Norway, Spain and Greece operate defined benefit plans
locally. In some of the European countries employers pay contributions towards the state pension plan. The Group
fulfils its duties in this regard as required by local statute. Within the United Kingdom the Group participates in a
defined contribution plan.
Employer contributions to the defined benefit plans in 2014 were £11 million (2013: £2 million). The Group expects
to make contributions of approximately £2 million in 2015. The defined benefit obligation includes benefits for
current employees, former employees and current pensioners. The weighted average duration of the obligation is 18
years. The main plans provide benefits related to salary close to retirement or earlier withdrawal from service.
As a result of the divestiture of Citi’s consumer banking business in Greece, the affected active employees were
cashed out of the pension plan. This resulted in significant curtailment gains of £20 million and settlement gains of
£4 million, reflected in the income statement. Legislative changes in the Netherlands resulted in a reduction to the
annual accrual rate for future benefits, from 2.0% to 1.9%, effective from 1 January 2014, resulting in a past service
credit of £1 million. In Spain, income replacement benefits resulted in a past service cost of £0.5 million. There were
no further material amendments, curtailments or settlements within the Group during 2014.
The amounts recognised in the balance sheet are determined as follows:
2014
£ Million
2013
£ Million
Present value of funded defined benefit obligation (326) (296)
Fair value of plan assets 210 226
Deficit (116) (70)
Present value of unfunded defined benefit obligation (7) (10)
Net liability recognised on the balance sheet (Note 29) (123) (80)
Deferred tax asset (Note 27) 25 16
Net pension liability (98) (64)
Group and Company
The analysis of the income statement charge is as follows:
2014
£ Million
2013
£ Million
Operating costs:
Current service cost 4 6
Past service cost/(credit) (including curtailment) (20) (1)
Settlement cost/(credit) (4) -
Administration expenses 1 1
Financing costs:
Interest cost 11 11
Expected return on plan assets (9) (8)
Expese/(income) recognised in the income statement (17) 9
Attributable to discontinued operations (22) 1
Expense recognised in the income statement for
continuing operations (Note 9) 5 8
Group and Company
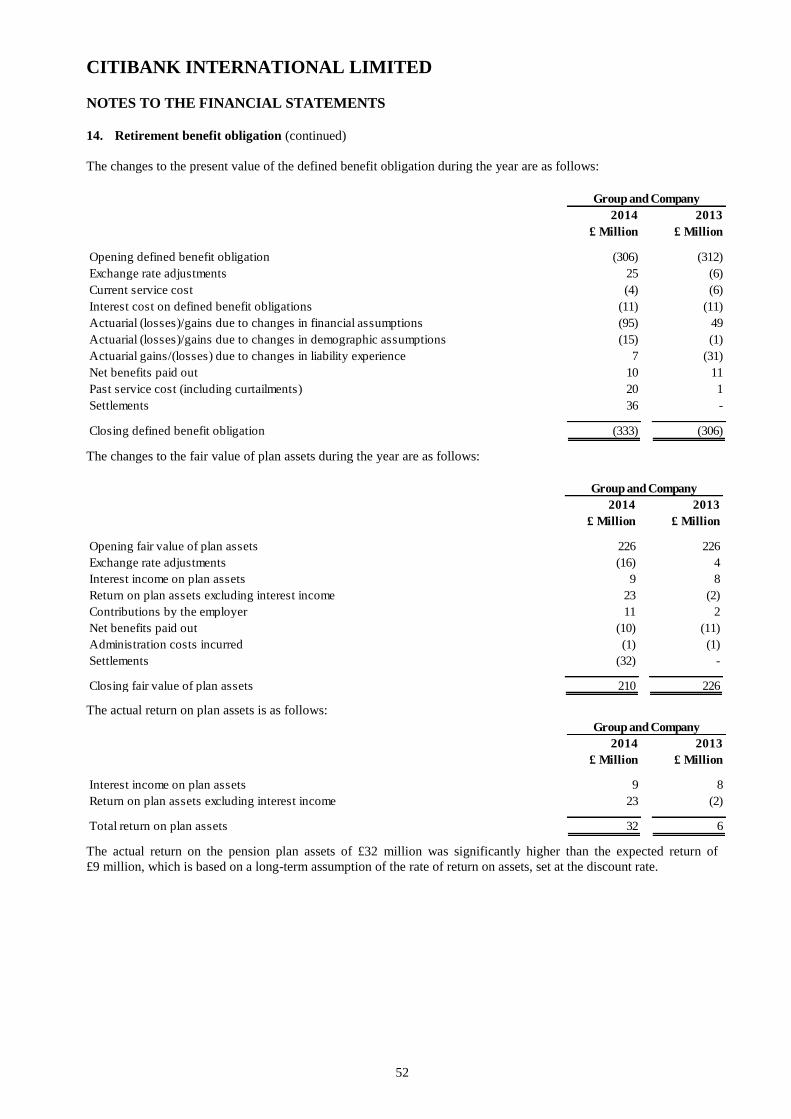
CITIBANK INTERNATIONAL LIMITED
NOTES TO THE FINANCIAL STATEMENTS
52
14. Retirement benefit obligation (continued)
The changes to the present value of the defined benefit obligation during the year are as follows:
2014
£ Million
2013
£ Million
(306) (312)
25 (6)
(4) (6)
(11) (11)
(95) 49
(15) (1)
7 (31)
Net benefits paid out 10 11
Past service cost (including curtailments) 20 1
Settlements 36 -
Closing defined benefit obligation (333) (306)
Interest cost on defined benefit obligations
Actuarial (losses)/gains due to changes in financial assumptions
Actuarial (losses)/gains due to changes in demographic assumptions
Actuarial gains/(losses) due to changes in liability experience
Group and Company
Opening defined benefit obligation
Exchange rate adjustments
Current service cost
The changes to the fair value of plan assets during the year are as follows:
2014
£ Million
2013
£ Million
Opening fair value of plan assets 226 226
Exchange rate adjustments (16) 4
Interest income on plan assets 9 8
Return on plan assets excluding interest income 23 (2)
Contributions by the employer 11 2
Net benefits paid out (10) (11)
Administration costs incurred (1) (1)
Settlements (32) -
Closing fair value of plan assets 210 226
Group and Company
The actual return on plan assets is as follows:
2014
£ Million
2013
£ Million
Interest income on plan assets 9 8
Return on plan assets excluding interest income 23 (2)
Total return on plan assets 32 6
Group and Company
The actual return on the pension plan assets of £32 million was significantly higher than the expected return of
£9 million, which is based on a long-term assumption of the rate of return on assets, set at the discount rate.
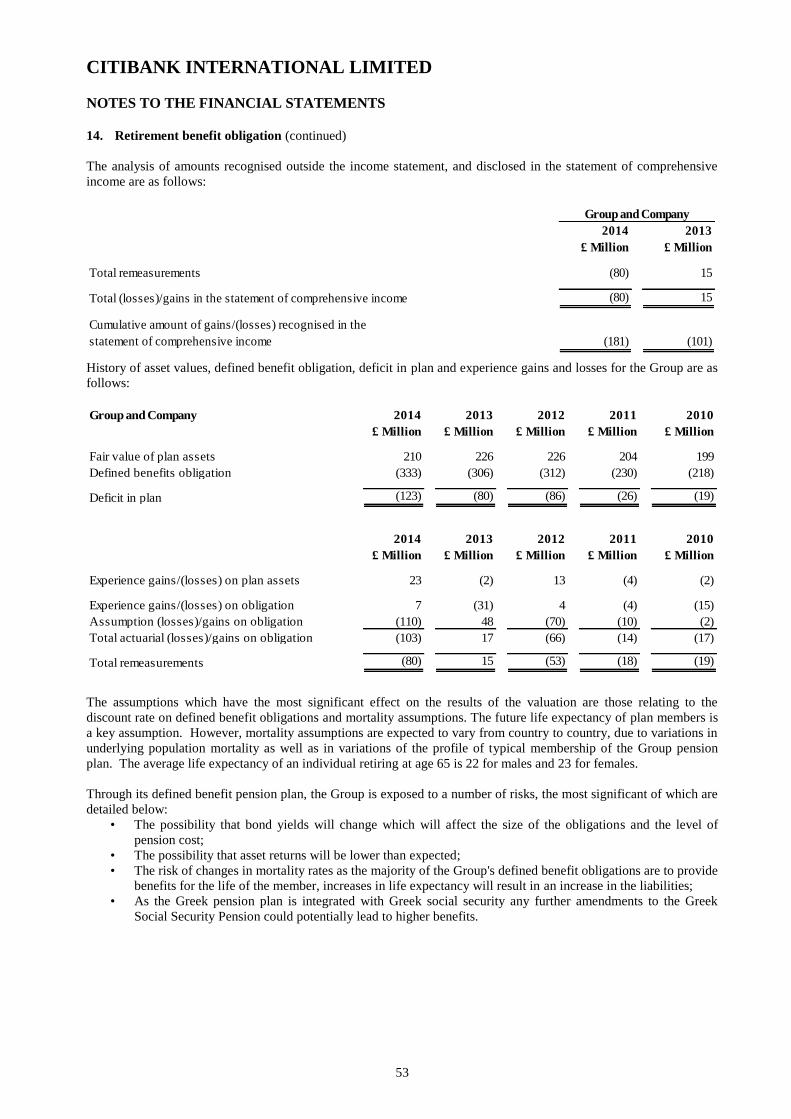
CITIBANK INTERNATIONAL LIMITED
NOTES TO THE FINANCIAL STATEMENTS
53
14. Retirement benefit obligation (continued)
The analysis of amounts recognised outside the income statement, and disclosed in the statement of comprehensive
income are as follows:
2014
£ Million
2013
£ Million
(80) 15
(80) 15
Cumulative amount of gains/(losses) recognised in the
statement of comprehensive income (181) (101)
Total (losses)/gains in the statement of comprehensive income
Total remeasurements
Group and Company
History of asset values, defined benefit obligation, deficit in plan and experience gains and losses for the Group are as
follows:
Group and Company 2014
£ Million
2013
£ Million
2012
£ Million
2011
£ Million
2010
£ Million
Fair value of plan assets 210 226 226 204 199
Defined benefits obligation (333) (306) (312) (230) (218)
Deficit in plan (123) (80) (86) (26) (19)
2014
£ Million
2013
£ Million
2012
£ Million
2011
£ Million
2010
£ Million
23 (2) 13 (4) (2)
7 (31) 4 (4) (15)
(110) 48 (70) (10) (2)
(103) 17 (66) (14) (17)
(80) 15 (53) (18) (19)
Experience gains/(losses) on plan assets
Experience gains/(losses) on obligation
Total actuarial (losses)/gains on obligation
Assumption (losses)/gains on obligation
Total remeasurements
The assumptions which have the most significant effect on the results of the valuation are those relating to the
discount rate on defined benefit obligations and mortality assumptions. The future life expectancy of plan members is
a key assumption. However, mortality assumptions are expected to vary from country to country, due to variations in
underlying population mortality as well as in variations of the profile of typical membership of the Group pension
plan. The average life expectancy of an individual retiring at age 65 is 22 for males and 23 for females.
Through its defined benefit pension plan, the Group is exposed to a number of risks, the most significant of which are
detailed below:
• The possibility that bond yields will change which will affect the size of the obligations and the level of
pension cost;
• The possibility that asset returns will be lower than expected;
• The risk of changes in mortality rates as the majority of the Group's defined benefit obligations are to provide
benefits for the life of the member, increases in life expectancy will result in an increase in the liabilities;
• As the Greek pension plan is integrated with Greek social security any further amendments to the Greek
Social Security Pension could potentially lead to higher benefits.

CITIBANK INTERNATIONAL LIMITED
NOTES TO THE FINANCIAL STATEMENTS
54
14. Retirement benefit obligation (continued)
The financial weighted average assumptions used in calculating defined benefit obligation as at 31 December 2014 are
as follows:
2014
£ Million
2013
£ Million
Effect of decreasing the discount rate assumption by 1% on liabilities (66) (55)
Effect of participants living one extra year than expected on liabilities (11) (9)
Effect of increasing the pension increase rate by 1% on liabilities (21) (15)
Group and Company
The fair values of the plan assets are as follows:
Total fair
value
Of which
not
quoted in
active
market
Total fair
value
Of which
not
quoted in
active
market
Total fair
value
Of which
not quoted
in active
market
Equities 32 - 45 - 39 -
Property 1 - 5 - 4 -
Government bonds 100 - 94 - 130 -
Corporate bonds 68 - 71 - 42 -
Other 9 2 11 3 11 3
Total fair value of assets 210 2 226 3 226 3
2014 2013 2012
Group and Company
£ Million
The key assumption used for IAS 19 is the discount rate although the results are also sensitive, but to a lesser extent to
other assumptions. If different assumptions were used, there could be a material effect on the results disclosed. The
sensitivity analyses are based on a change in one assumption while holding all other assumptions constant.
The sensitivity of key assumptions used to value the obligation is as follows:
2014
£ Million
2013
£ Million
Effect of decreasing the discount rate assumption by 1% on liabilities (66) (55)
Effect of participants living one extra year than expected on liabilities (11) (9)
Effect of increasing the pension increase rate by 1% on liabilities (21) (15)
Group and Company
The projected future benefits expected to be paid from pension plans are as follows:
2015
£ Million
2016
£ Million
2017
£ Million
2018
£ Million
2019
£ Million
2020-2024
£ Million
Expected benefit payments 13 10 11 12 11 59
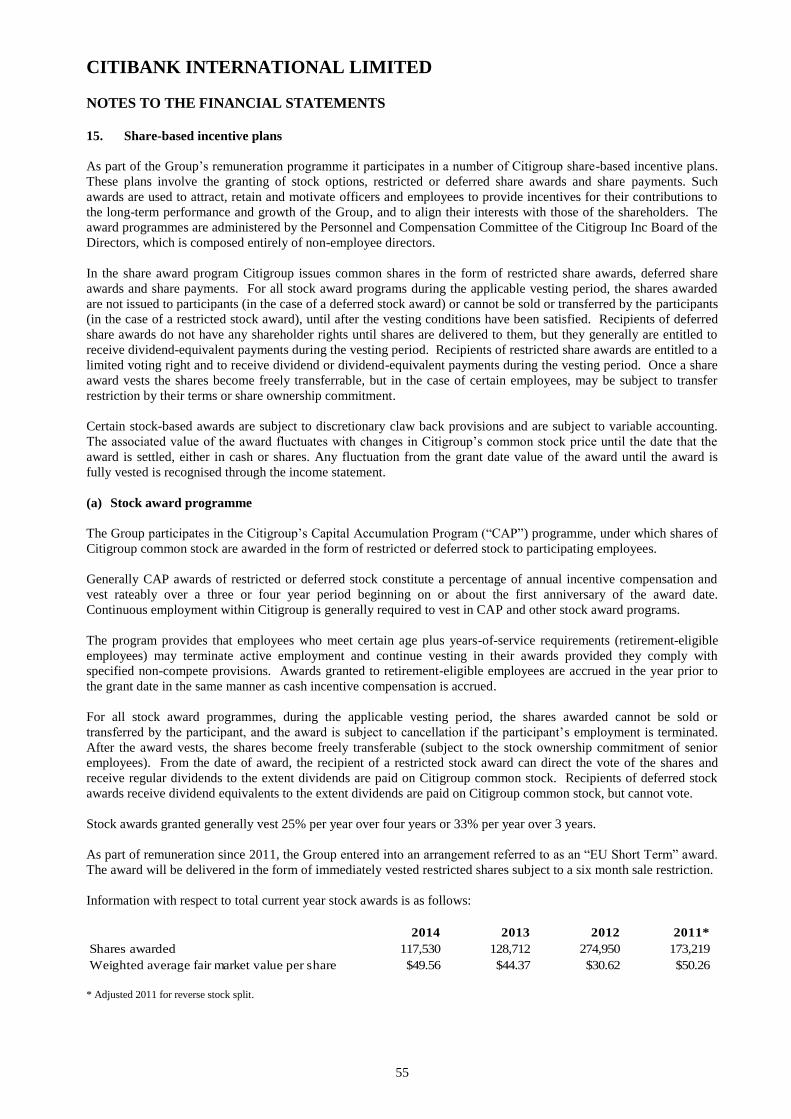
CITIBANK INTERNATIONAL LIMITED
NOTES TO THE FINANCIAL STATEMENTS
55
15. Share-based incentive plans
As part of the Group’s remuneration programme it participates in a number of Citigroup share-based incentive plans.
These plans involve the granting of stock options, restricted or deferred share awards and share payments. Such
awards are used to attract, retain and motivate officers and employees to provide incentives for their contributions to
the long-term performance and growth of the Group, and to align their interests with those of the shareholders. The
award programmes are administered by the Personnel and Compensation Committee of the Citigroup Inc Board of the
Directors, which is composed entirely of non-employee directors.
In the share award program Citigroup issues common shares in the form of restricted share awards, deferred share
awards and share payments. For all stock award programs during the applicable vesting period, the shares awarded
are not issued to participants (in the case of a deferred stock award) or cannot be sold or transferred by the participants
(in the case of a restricted stock award), until after the vesting conditions have been satisfied. Recipients of deferred
share awards do not have any shareholder rights until shares are delivered to them, but they generally are entitled to
receive dividend-equivalent payments during the vesting period. Recipients of restricted share awards are entitled to a
limited voting right and to receive dividend or dividend-equivalent payments during the vesting period. Once a share
award vests the shares become freely transferrable, but in the case of certain employees, may be subject to transfer
restriction by their terms or share ownership commitment.
Certain stock-based awards are subject to discretionary claw back provisions and are subject to variable accounting.
The associated value of the award fluctuates with changes in Citigroup’s common stock price until the date that the
award is settled, either in cash or shares. Any fluctuation from the grant date value of the award until the award is
fully vested is recognised through the income statement.
(a) Stock award programme
The Group participates in the Citigroup’s Capital Accumulation Program (“CAP”) programme, under which shares of
Citigroup common stock are awarded in the form of restricted or deferred stock to participating employees.
Generally CAP awards of restricted or deferred stock constitute a percentage of annual incentive compensation and
vest rateably over a three or four year period beginning on or about the first anniversary of the award date.
Continuous employment within Citigroup is generally required to vest in CAP and other stock award programs.
The program provides that employees who meet certain age plus years-of-service requirements (retirement-eligible
employees) may terminate active employment and continue vesting in their awards provided they comply with
specified non-compete provisions. Awards granted to retirement-eligible employees are accrued in the year prior to
the grant date in the same manner as cash incentive compensation is accrued.
For all stock award programmes, during the applicable vesting period, the shares awarded cannot be sold or
transferred by the participant, and the award is subject to cancellation if the participant’s employment is terminated.
After the award vests, the shares become freely transferable (subject to the stock ownership commitment of senior
employees). From the date of award, the recipient of a restricted stock award can direct the vote of the shares and
receive regular dividends to the extent dividends are paid on Citigroup common stock. Recipients of deferred stock
awards receive dividend equivalents to the extent dividends are paid on Citigroup common stock, but cannot vote.
Stock awards granted generally vest 25% per year over four years or 33% per year over 3 years.
As part of remuneration since 2011, the Group entered into an arrangement referred to as an “EU Short Term” award.
The award will be delivered in the form of immediately vested restricted shares subject to a six month sale restriction.
Information with respect to total current year stock awards is as follows:
2014 2013 2012 2011*
Shares awarded 117,530 128,712 274,950 173,219
Weighted average fair market value per share $49.56 $44.37 $30.62 $50.26 * Adjusted 2011 for reverse stock split.
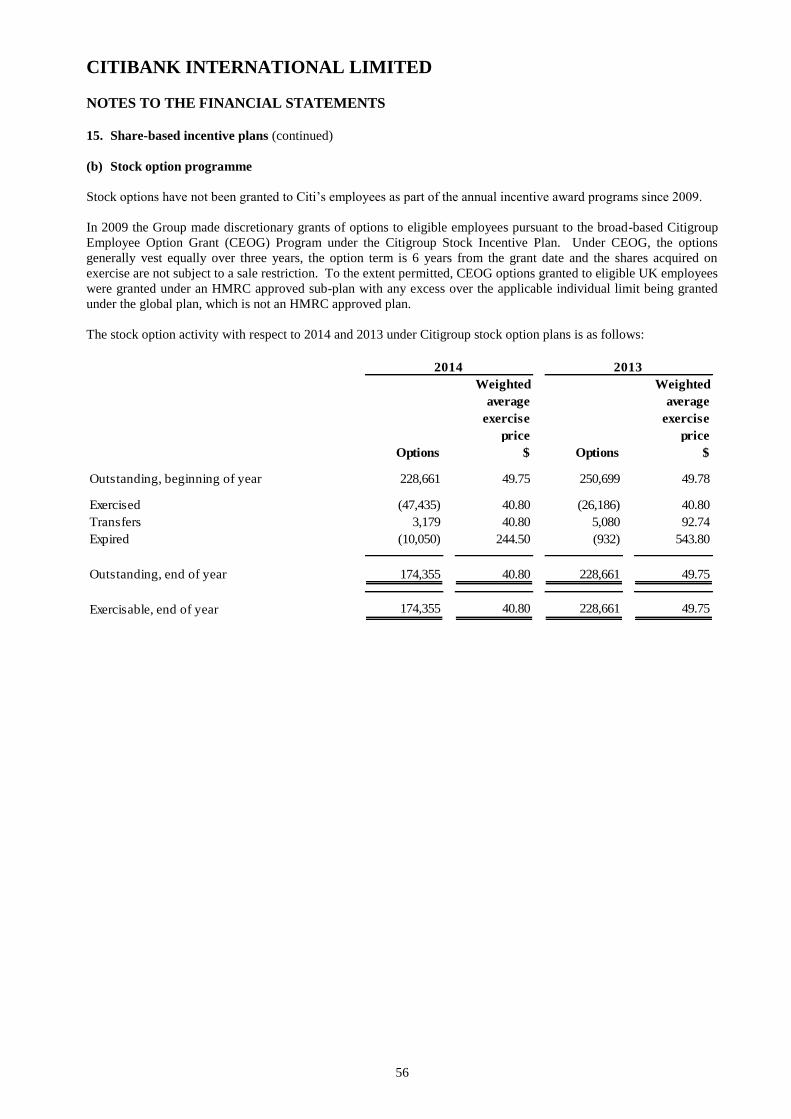
CITIBANK INTERNATIONAL LIMITED
NOTES TO THE FINANCIAL STATEMENTS
56
15. Share-based incentive plans (continued)
(b) Stock option programme
Stock options have not been granted to Citi’s employees as part of the annual incentive award programs since 2009.
In 2009 the Group made discretionary grants of options to eligible employees pursuant to the broad-based Citigroup
Employee Option Grant (CEOG) Program under the Citigroup Stock Incentive Plan. Under CEOG, the options
generally vest equally over three years, the option term is 6 years from the grant date and the shares acquired on
exercise are not subject to a sale restriction. To the extent permitted, CEOG options granted to eligible UK employees
were granted under an HMRC approved sub-plan with any excess over the applicable individual limit being granted
under the global plan, which is not an HMRC approved plan.
The stock option activity with respect to 2014 and 2013 under Citigroup stock option plans is as follows:
Weighted
average
exercise
price
Weighted
average
exercise
price
Options $ Options $
228,661 49.75 250,699 49.78
(47,435) 40.80 (26,186) 40.80
3,179 40.80 5,080 92.74
(10,050) 244.50 (932) 543.80
174,355 40.80 228,661 49.75
174,355 40.80 228,661 49.75
Outstanding, beginning of year
Exercised
Transfers
Expired
Outstanding, end of year
Exercisable, end of year
2014 2013
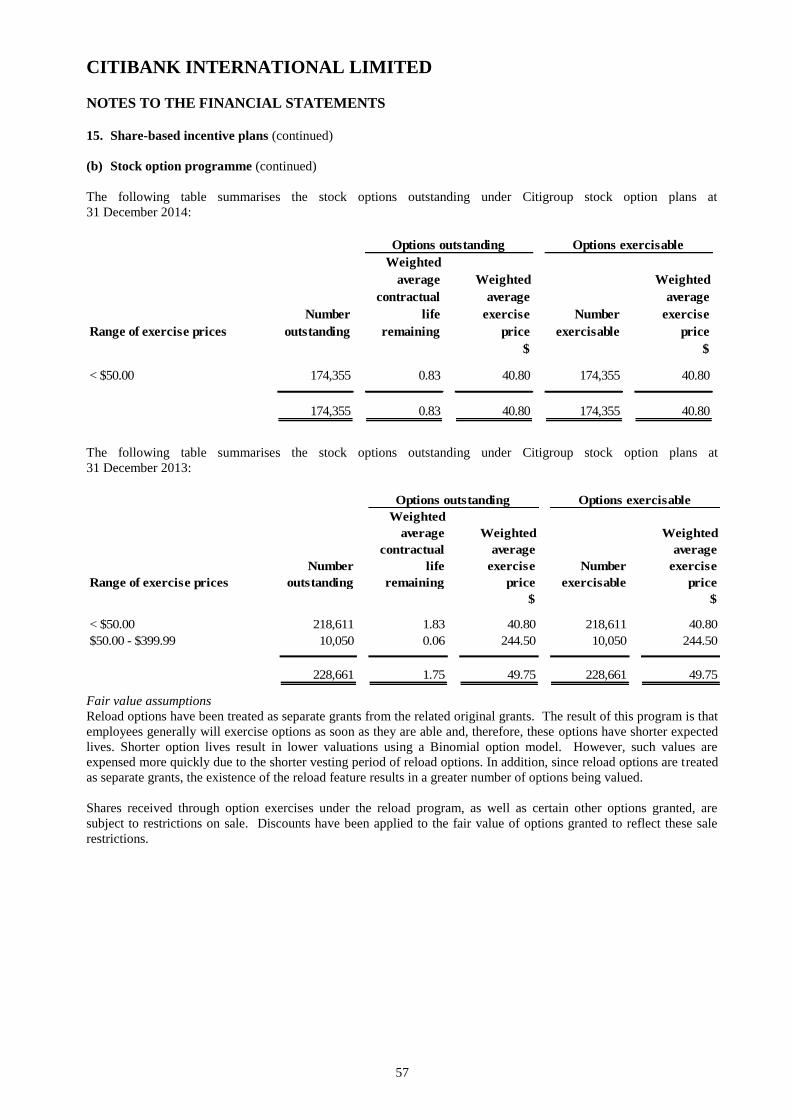
CITIBANK INTERNATIONAL LIMITED
NOTES TO THE FINANCIAL STATEMENTS
57
15. Share-based incentive plans (continued)
(b) Stock option programme (continued)
The following table summarises the stock options outstanding under Citigroup stock option plans at
31 December 2014:
Range of exercise prices
Number
outstanding
Weighted
average
contractual
life
remaining
Weighted
average
exercise
price
Number
exercisable
Weighted
average
exercise
price
$ $
< $50.00 174,355 0.83 40.80 174,355 40.80
174,355 0.83 40.80 174,355 40.80
Options outstanding Options exercisable
The following table summarises the stock options outstanding under Citigroup stock option plans at
31 December 2013:
Range of exercise prices
Number
outstanding
Weighted
average
contractual
life
remaining
Weighted
average
exercise
price
Number
exercisable
Weighted
average
exercise
price
$ $
< $50.00 218,611 1.83 40.80 218,611 40.80
$50.00 - $399.99 10,050 0.06 244.50 10,050 244.50
228,661 1.75 49.75 228,661 49.75
Options outstanding Options exercisable
Fair value assumptions
Reload options have been treated as separate grants from the related original grants. The result of this program is that
employees generally will exercise options as soon as they are able and, therefore, these options have shorter expected
lives. Shorter option lives result in lower valuations using a Binomial option model. However, such values are
expensed more quickly due to the shorter vesting period of reload options. In addition, since reload options are treated
as separate grants, the existence of the reload feature results in a greater number of options being valued.
Shares received through option exercises under the reload program, as well as certain other options granted, are
subject to restrictions on sale. Discounts have been applied to the fair value of options granted to reflect these sale
restrictions.

CITIBANK INTERNATIONAL LIMITED
NOTES TO THE FINANCIAL STATEMENTS
58
15. Share-based incentive plans (continued)
(b) Stock option programme (continued)
Additional valuation and related assumption information for Citigroup option plans is presented below. Citigroup
used a binomial model to value stock options. Volatility has been estimated by taking the historical volatility in
traded Citigroup options and adjusting where there are known factors that may affect future volatility.
2014 2013
Weighted average fair value at year end for options granted during the year
Option $0.00 $0.00
Weighted average expected life
Option life 1 year 2 years
Valuation assumptions
Expected volatility 35.69% 37.23%
Risk-free interest rate 0.35% 0.45%
Expected dividend yield 0.08% 0.08%
Expected annual forfeitures 9.62% 9.62%
(c) Impact of share-based incentive plans on the financial statements
The table below details the financial statements impact of the share based incentive plans:
2014 2013
£ Million £ Million
Awards granted in 2014
Stock awards 2.3 -
Awards granted in 2013
Stock awards 0.8 2.4
Awards granted in 2012
Stock awards 0.5 1.3
Awards granted in 2011
Stock awards 0.2 0.6
Awards granted in 2010 or earlier
Stock awards - 0.2
Expenses accrued 0.3 0.5
Total expense 4.1 5.0
2014
£ Million
2013
£ Million
Compensation cost charged to earnings 4.0 5.0
Fair value adjustments recorded to equity 0.1 3.0
Total carrying amount of equity-settled transaction liability 11.5 13.0
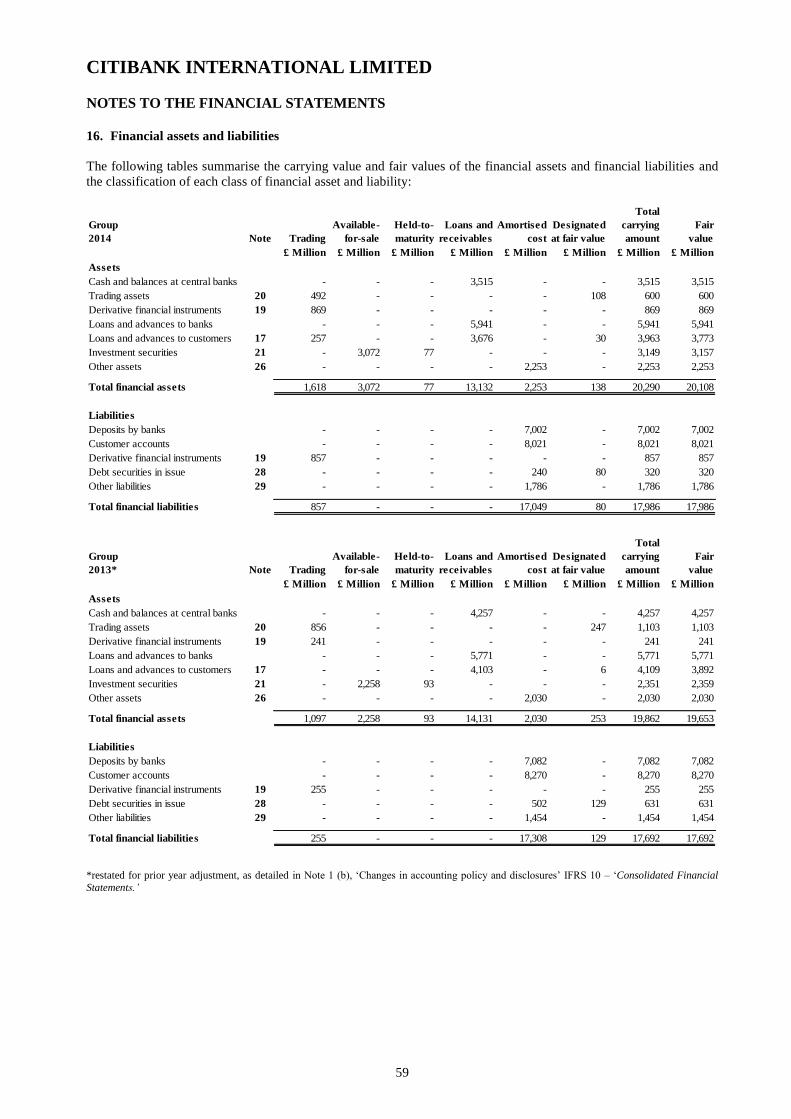
CITIBANK INTERNATIONAL LIMITED
NOTES TO THE FINANCIAL STATEMENTS
59
16. Financial assets and liabilities
The following tables summarise the carrying value and fair values of the financial assets and financial liabilities and
the classification of each class of financial asset and liability:
Group
2014 Note Trading
Available-
for-sale
Held-to-
maturity
Loans and
receivables
Amortised
cost
Designated
at fair value
Total
carrying
amount
Fair
value
£ Million £ Million £ Million £ Million £ Million £ Million £ Million £ Million
Assets
Cash and balances at central banks - - - 3,515 - - 3,515 3,515
Trading assets 20 492 - - - - 108 600 600
Derivative financial instruments 19 869 - - - - - 869 869
Loans and advances to banks - - - 5,941 - - 5,941 5,941
Loans and advances to customers 17 257 - - 3,676 - 30 3,963 3,773
Investment securities 21 - 3,072 77 - - - 3,149 3,157
Other assets 26 - - - - 2,253 - 2,253 2,253
Total financial assets 1,618 3,072 77 13,132 2,253 138 20,290 20,108
Liabilities
Deposits by banks - - - - 7,002 - 7,002 7,002
Customer accounts - - - - 8,021 - 8,021 8,021
Derivative financial instruments 19 857 - - - - - 857 857
Debt securities in issue 28 - - - - 240 80 320 320
Other liabilities 29 - - - - 1,786 - 1,786 1,786
Total financial liabilities 857 - - - 17,049 80 17,986 17,986
Group
2013* Note Trading
Available-
for-sale
Held-to-
maturity
Loans and
receivables
Amortised
cost
Designated
at fair value
Total
carrying
amount
Fair
value
£ Million £ Million £ Million £ Million £ Million £ Million £ Million £ Million
Assets
Cash and balances at central banks - - - 4,257 - - 4,257 4,257
Trading assets 20 856 - - - - 247 1,103 1,103
Derivative financial instruments 19 241 - - - - - 241 241
Loans and advances to banks - - - 5,771 - - 5,771 5,771
Loans and advances to customers 17 - - - 4,103 - 6 4,109 3,892
Investment securities 21 - 2,258 93 - - - 2,351 2,359
Other assets 26 - - - - 2,030 - 2,030 2,030
Total financial assets 1,097 2,258 93 14,131 2,030 253 19,862 19,653
Liabilities
Deposits by banks - - - - 7,082 - 7,082 7,082
Customer accounts - - - - 8,270 - 8,270 8,270
Derivative financial instruments 19 255 - - - - - 255 255
Debt securities in issue 28 - - - - 502 129 631 631
Other liabilities 29 - - - - 1,454 - 1,454 1,454
Total financial liabilities 255 - - - 17,308 129 17,692 17,692
*restated for prior year adjustment, as detailed in Note 1 (b), ‘Changes in accounting policy and disclosures’ IFRS 10 – ‘Consolidated Financial
Statements.’
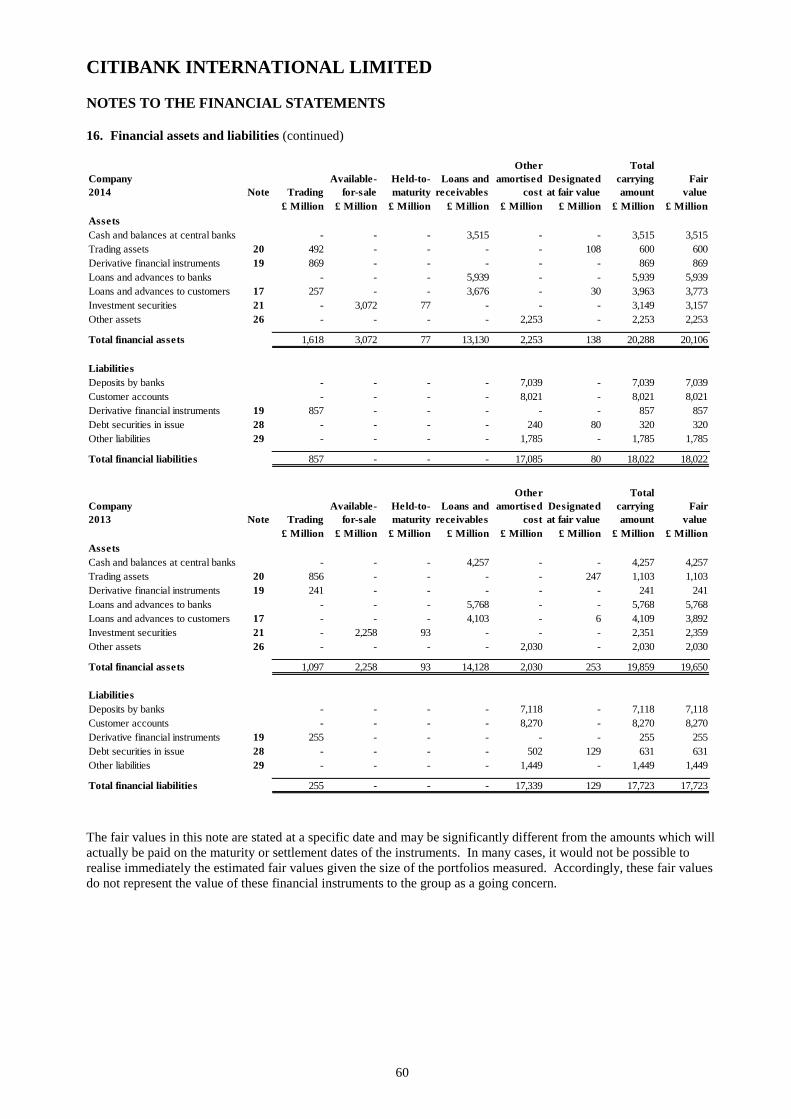
CITIBANK INTERNATIONAL LIMITED
NOTES TO THE FINANCIAL STATEMENTS
60
16. Financial assets and liabilities (continued)
Company
2014 Note Trading
Available-
for-sale
Held-to-
maturity
Loans and
receivables
Other
amortised
cost
Designated
at fair value
Total
carrying
amount
Fair
value
£ Million £ Million £ Million £ Million £ Million £ Million £ Million £ Million
Assets
Cash and balances at central banks - - - 3,515 - - 3,515 3,515
Trading assets 20 492 - - - - 108 600 600
Derivative financial instruments 19 869 - - - - - 869 869
Loans and advances to banks - - - 5,939 - - 5,939 5,939
Loans and advances to customers 17 257 - - 3,676 - 30 3,963 3,773
Investment securities 21 - 3,072 77 - - - 3,149 3,157
Other assets 26 - - - - 2,253 - 2,253 2,253
Total financial assets 1,618 3,072 77 13,130 2,253 138 20,288 20,106
Liabilities
Deposits by banks - - - - 7,039 - 7,039 7,039
Customer accounts - - - - 8,021 - 8,021 8,021
Derivative financial instruments 19 857 - - - - - 857 857
Debt securities in issue 28 - - - - 240 80 320 320
Other liabilities 29 - - - - 1,785 - 1,785 1,785
Total financial liabilities 857 - - - 17,085 80 18,022 18,022
Company
2013 Note Trading
Available-
for-sale
Held-to-
maturity
Loans and
receivables
Other
amortised
cost
Designated
at fair value
Total
carrying
amount
Fair
value
£ Million £ Million £ Million £ Million £ Million £ Million £ Million £ Million
Assets
Cash and balances at central banks - - - 4,257 - - 4,257 4,257
Trading assets 20 856 - - - - 247 1,103 1,103
Derivative financial instruments 19 241 - - - - - 241 241
Loans and advances to banks - - - 5,768 - - 5,768 5,768
Loans and advances to customers 17 - - - 4,103 - 6 4,109 3,892
Investment securities 21 - 2,258 93 - - - 2,351 2,359
Other assets 26 - - - - 2,030 - 2,030 2,030
Total financial assets 1,097 2,258 93 14,128 2,030 253 19,859 19,650
Liabilities
Deposits by banks - - - - 7,118 - 7,118 7,118
Customer accounts - - - - 8,270 - 8,270 8,270
Derivative financial instruments 19 255 - - - - - 255 255
Debt securities in issue 28 - - - - 502 129 631 631
Other liabilities 29 - - - - 1,449 - 1,449 1,449
Total financial liabilities 255 - - - 17,339 129 17,723 17,723
The fair values in this note are stated at a specific date and may be significantly different from the amounts which will
actually be paid on the maturity or settlement dates of the instruments. In many cases, it would not be possible to
realise immediately the estimated fair values given the size of the portfolios measured. Accordingly, these fair values
do not represent the value of these financial instruments to the group as a going concern.
CITIBANK INTERNATIONAL LIMITED
NOTES TO THE FINANCIAL STATEMENTS
61
16. Financial assets and liabilities (continued)
Fair Value Measurement
IFRS 13 – Fair Value Measurement, defines fair value, establishes a framework for measuring fair value and requires
disclosures about fair value measurements. Fair value is defined as the price that would be received to sell an asset or
paid to transfer a liability in an orderly transaction between market participants at the measurement date. Among
other things, the standard requires the Group to maximise the use of observable inputs and minimise the use of
unobservable inputs when measuring fair value.
Under IFRS 13, the probability of default of a counterparty is factored into the valuation of derivative positions and
includes the impact of Group’s own credit risk on derivatives and other liabilities measured at fair value.
Fair Value Hierarchy
IFRS 13 specifies a hierarchy of inputs based on whether the inputs are observable or unobservable. Observable
inputs reflect market data obtained from independent sources, while unobservable inputs reflect the Group’s market
assumptions. These two types of inputs have created the following fair value hierarchy:
Level 1: Quoted prices for identical instruments in active markets.
Level 2: Quoted prices for similar instruments in active markets; quoted prices for identical or similar
instruments in markets that are not active; and model-derived valuations in which all significant inputs and
significant value drivers are observable in active markets.
Level 3: Valuations derived from valuation techniques in which one or more significant inputs or significant
value drivers are unobservable.
This hierarchy requires the use of observable market data when available. The Group considers relevant and
observable market prices in its valuations where possible. The frequency of transactions and the size of the bid-ask
spread when comparing similar transactions are all factors in determining the liquidity of markets and the relevance of
observed prices in those markets.
The Group’s policy with respect to transfers between levels of the fair value hierarchy is to recognise transfers into
and out of each level as of the end of the reporting period.
Determination of Fair Value
As set out in Note 1(l), when available, the Group generally uses quoted market prices in an active market to calculate
the fair value of a financial asset or liability and classifies such items as Level 1. In some cases where a market price
is available, the Group will make use of acceptable practical expedients (such as matrix pricing) to calculate fair
value, in which case the items are classified as Level 2.
If quoted market prices are not available, fair values are based upon internally developed valuation techniques that
use, where possible, current market-based or independently sourced market parameters such as interest rates, currency
rates and option volatilities. Items valued using such internally generated valuation techniques are classified
according to the lowest level input or value driver that is significant to the valuation.
Where available, the Group may also make use of quoted prices for recent trading activity in positions with the same
or similar characteristics to that being valued. The frequency and size of transactions and the amount of the bid-ask
spread are among the factors considered in determining the liquidity of markets and the relevance of observed prices
from those markets. If relevant and observable prices are available, those valuations would be classified as Level 2.
If prices are not available, other valuation techniques would be used and the item would be classified as Level 3.

CITIBANK INTERNATIONAL LIMITED
NOTES TO THE FINANCIAL STATEMENTS
62
16. Financial assets and liabilities (continued)
Determination of Fair Value (continued)
Fair value estimates from internal valuation techniques are verified, where possible, to prices obtained from
independent vendors or brokers. Vendors and brokers’ valuations may be based on a variety of inputs ranging from
observed prices to proprietary valuation models.
The Group uses the following procedures to determine the fair value of financial assets and financial liabilities
irrespective of whether they are “held for trading” or have been “designated at fair value” including an indication of
the level in the fair value hierarchy in which each financial instrument is generally classified. Where appropriate, the
description includes details of the valuation models, the key inputs to those models and any significant assumptions.
Market valuation adjustments
Liquidity adjustments are applied to items in Level 2 and Level 3 of the fair value hierarchy to ensure that the fair
value reflects the liquidity or illiquidity of the market. The liquidity reserve may utilise the bid-ask spread for an
instrument as one of the factors.
Counterparty credit-risk adjustments are applied to derivatives, such as over-the-counter uncollateralised derivatives,
where the base valuation uses market parameters based on the relevant base interest rate curves. Not all
counterparties have the same credit risk as that implied by the relevant base curve, so it is necessary to consider the
market view of the credit risk of a counterparty in order to estimate the fair value of such an item.
Bilateral or “own” credit-risk adjustments are applied to reflect the Group’s own credit risk when valuing derivatives
and liabilities measured at fair value. Counterparty and own credit adjustments consider the expected future cash
flows between the Group and its counterparties under the terms of the instrument and the effect of credit risk on the
valuation of those cash flows, rather than a point-in-time assessment of the current recognised net asset or liability.
Furthermore, the credit-risk adjustments take into account the effect of credit-risk mitigants, such as pledged collateral
and any legal right of offset (to the extent such offset exists) with a counterparty through arrangements such as netting
agreements.
Generally, the unit of account for a financial instrument is the individual financial instrument. The Group applies
market valuation adjustments that are consistent with the unit of account, which does not include adjustment due to
the size of the Group’s position, except as follows. IFRS 13 permits an exception, through an accounting policy
election, to measure the fair value of a portfolio of financial assets and financial liabilities on the basis of the net open
risk position when certain criteria are met. Citi has elected to measure certain portfolios of financial instruments, such
as derivatives, that meet those criteria on the basis of the net open risk position. The Group applies market valuation
adjustments, including adjustments to account for the size of the net open risk position, consistent with market
participant assumptions and in accordance with the unit of account.
Derivatives
The majority of derivatives entered into by the Group are executed over the counter and are valued using a
combination of external prices and internal valuation techniques, including benchmarking to pricing vendor services.
The valuation techniques and inputs depend on the type of derivative and the nature of the underlying instrument.
The principal techniques used to value these instruments are industry wide approaches including discounted cash
flows, modelling and numerical approaches.
The type of inputs may include interest rate yield curves, credit spreads, foreign exchange rates, volatilities and
correlations.
The Group uses the overnight indexed swap (OIS) curves as fair value measurement inputs for the valuation of certain
collateralised interest-rate related derivatives. Citi uses the relevant benchmark curve for the currency of the
derivative (e.g., the London Interbank Offered Rate for U.S. dollar derivatives) as the discount rate for
uncollateralized derivatives. During the third quarter of 2014, Citi incorporated FVA into the fair value measurements
due to what it believes to be an industry migration toward incorporating the market’s view of funding risk premium in
OTC derivatives. Citi’s FVA methodology leverages the existing CVA methodology to estimate a funding exposure
profile. The calculation of this exposure profile considers collateral agreements where the terms do not permit the firm
to reuse the collateral received, including where counterparties post collateral to third-party custodians.

CITIBANK INTERNATIONAL LIMITED
NOTES TO THE FINANCIAL STATEMENTS
63
16. Financial assets and liabilities (continued)
Trading assets
Where available, the Group uses quoted market prices to determine the fair value of trading assets; such items are
classified as Level 1 of the fair value hierarchy. Examples include government bonds. For corporate bonds, European
commercial papers and loans the Group generally determines the fair value utilising internal valuation techniques.
Fair value estimates from internal valuation techniques are verified, where possible, to prices obtained from
independent vendors. Vendors compile prices from various sources and may apply matrix pricing for similar bonds or
loans where no price is observable. If available, the Group may also use quoted prices for recent trading activity of
assets with similar characteristics to the bond or loan being valued. Government bonds, corporate bonds, European
commercial papers or loans priced using such methods are generally classified as Level 2.
However, when less liquidity exists, a quoted price is stale or prices from independent sources vary, they are generally
classified as Level 3.
Investment securities
Investment securities classified as available-for-sale, held to maturity or designated at fair value, through profit and
loss, are measured at fair value by reference to quoted market price. In these is instances they will be classified as
Level 1.
If quoted market prices are not available, then fair values are estimated based on other recognised valuation
techniques. The key inputs depend upon the type of investment security and the nature of inputs to the valuation
technique. The item is placed in either Level 2 or Level 3 depending on the observability of the significant inputs to
the model.
Loans and Advances and other Lending
The fair value for loans and advances and other lending are estimated using internal valuation techniques such as
discounted cash flow analyses. Cash flows are discounted using LIBOR and EURIBOR rates. If available, the Group
may also use quoted prices for recent trading activity of assets with similar characteristics to the loan being valued.
The items are placed in Level 2 or Level 3 depending on the observability of the significant inputs to the model. In
certain cases the fair value approximates carrying value because the instruments are short term in nature or reprice
frequently.
Debt securities in issue
The fair value of debt securities in issue is estimated using discounted cash flows applying LIBOR and EURIBOR
rates. The items are placed in Level 2 or Level 3 depending on the observability of the significant inputs to the model.
Own debt valuation adjustments are recognized on the Group’s liabilities for which the fair value option has been
elected using Citi’s credit spreads observed in the bond market. The fair value of liabilities for which the fair value
option is elected (other than non-recourse and similar liabilities) is impacted by the narrowing or widening of the
Group’s credit spreads.
Other financial assets and liabilities
Fair values of customer account deposit liabilities, subordinated loans, other assets and other liabilities are estimated
using discounted cash flows, applying market rates where practicable. Where market rates are used an adjustment is
made for the Citigroup credit spread.
The carrying amount of cash and balances at central banks is a reasonable approximation of fair value due to the short
term nature of the balances.
Valuation process for Level 3 Fair Value Measurements
Price verification procedures and related internal control procedures are governed by the Citigroup Pricing and Price
Verification Policy and Standards, which is jointly owned by Finance and Risk Management. Finance has
implemented the ICG Securities and Banking Pricing and Price Verification Standards and Procedures to facilitate
compliance with this policy.
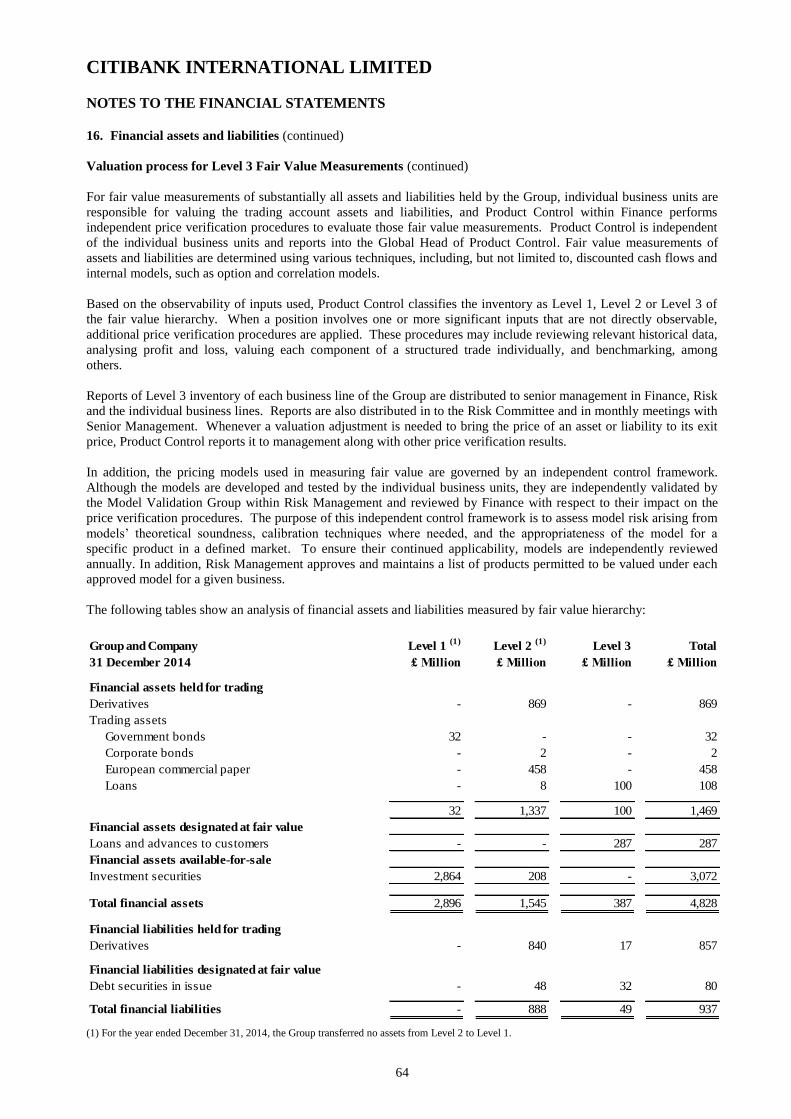
CITIBANK INTERNATIONAL LIMITED
NOTES TO THE FINANCIAL STATEMENTS
64
16. Financial assets and liabilities (continued)
Valuation process for Level 3 Fair Value Measurements (continued)
For fair value measurements of substantially all assets and liabilities held by the Group, individual business units are
responsible for valuing the trading account assets and liabilities, and Product Control within Finance performs
independent price verification procedures to evaluate those fair value measurements. Product Control is independent
of the individual business units and reports into the Global Head of Product Control. Fair value measurements of
assets and liabilities are determined using various techniques, including, but not limited to, discounted cash flows and
internal models, such as option and correlation models.
Based on the observability of inputs used, Product Control classifies the inventory as Level 1, Level 2 or Level 3 of
the fair value hierarchy. When a position involves one or more significant inputs that are not directly observable,
additional price verification procedures are applied. These procedures may include reviewing relevant historical data,
analysing profit and loss, valuing each component of a structured trade individually, and benchmarking, among
others.
Reports of Level 3 inventory of each business line of the Group are distributed to senior management in Finance, Risk
and the individual business lines. Reports are also distributed in to the Risk Committee and in monthly meetings with
Senior Management. Whenever a valuation adjustment is needed to bring the price of an asset or liability to its exit
price, Product Control reports it to management along with other price verification results.
In addition, the pricing models used in measuring fair value are governed by an independent control framework.
Although the models are developed and tested by the individual business units, they are independently validated by
the Model Validation Group within Risk Management and reviewed by Finance with respect to their impact on the
price verification procedures. The purpose of this independent control framework is to assess model risk arising from
models’ theoretical soundness, calibration techniques where needed, and the appropriateness of the model for a
specific product in a defined market. To ensure their continued applicability, models are independently reviewed
annually. In addition, Risk Management approves and maintains a list of products permitted to be valued under each
approved model for a given business.
The following tables show an analysis of financial assets and liabilities measured by fair value hierarchy:
Group and Company Level 1 (1)
Level 2 (1)
Level 3 Total
31 December 2014 £ Million £ Million £ Million £ Million
Financial assets held for trading
Derivatives - 869 - 869
Trading assets
Government bonds 32 - - 32
Corporate bonds - 2 - 2
European commercial paper - 458 - 458
Loans - 8 100 108
32 1,337 100 1,469
Financial assets designated at fair value
Loans and advances to customers - - 287 287
Financial assets available-for-sale
Investment securities 2,864 208 - 3,072
Total financial assets 2,896 1,545 387 4,828
Financial liabilities held for trading
Derivatives - 840 17 857
Financial liabilities designated at fair value
Debt securities in issue - 48 32 80
Total financial liabilities - 888 49 937
(1) For the year ended December 31, 2014, the Group transferred no assets from Level 2 to Level 1.
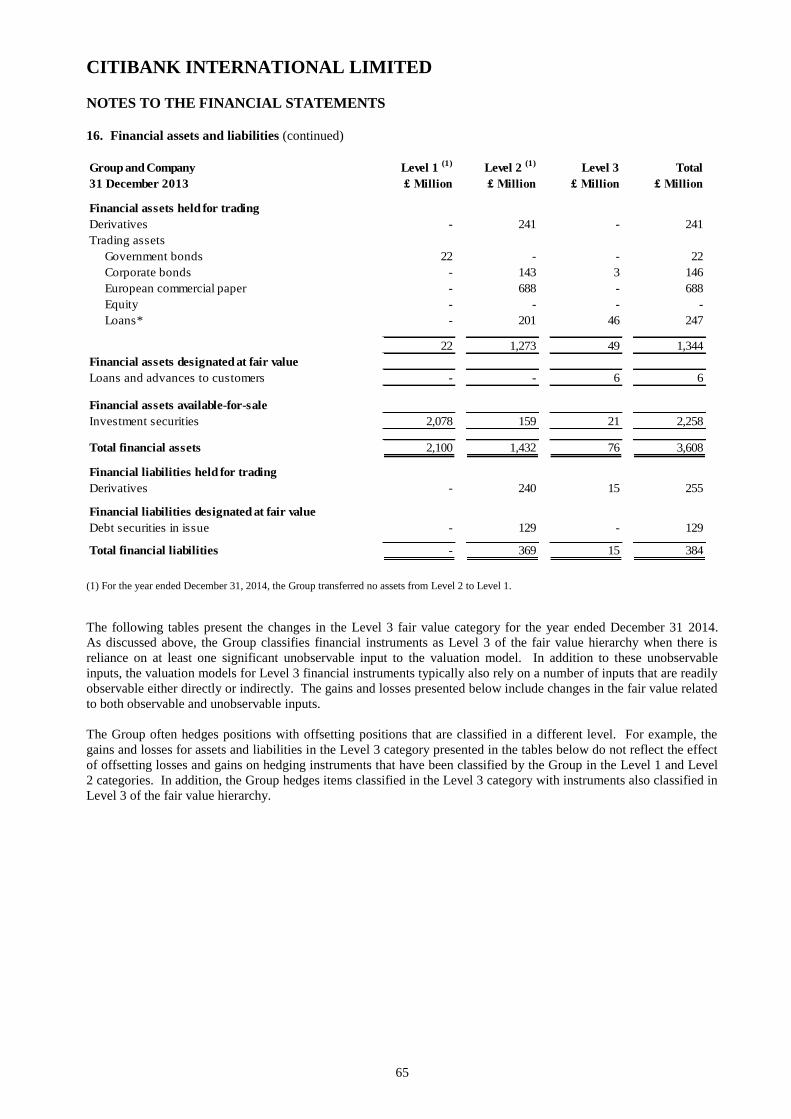
CITIBANK INTERNATIONAL LIMITED
NOTES TO THE FINANCIAL STATEMENTS
65
16. Financial assets and liabilities (continued)
Group and Company Level 1 (1)
Level 2 (1)
Level 3 Total
31 December 2013 £ Million £ Million £ Million £ Million
Financial assets held for trading
Derivatives - 241 - 241
Trading assets
Government bonds 22 - - 22
Corporate bonds - 143 3 146
European commercial paper - 688 - 688
Equity - - - -
Loans* - 201 46 247
22 1,273 49 1,344
Financial assets designated at fair value
Loans and advances to customers - - 6 6
Financial assets available-for-sale
Investment securities 2,078 159 21 2,258
Total financial assets 2,100 1,432 76 3,608
Financial liabilities held for trading
Derivatives - 240 15 255
Financial liabilities designated at fair value
Debt securities in issue - 129 - 129
Total financial liabilities - 369 15 384
(1) For the year ended December 31, 2014, the Group transferred no assets from Level 2 to Level 1.
The following tables present the changes in the Level 3 fair value category for the year ended December 31 2014.
As discussed above, the Group classifies financial instruments as Level 3 of the fair value hierarchy when there is
reliance on at least one significant unobservable input to the valuation model. In addition to these unobservable
inputs, the valuation models for Level 3 financial instruments typically also rely on a number of inputs that are readily
observable either directly or indirectly. The gains and losses presented below include changes in the fair value related
to both observable and unobservable inputs.
The Group often hedges positions with offsetting positions that are classified in a different level. For example, the
gains and losses for assets and liabilities in the Level 3 category presented in the tables below do not reflect the effect
of offsetting losses and gains on hedging instruments that have been classified by the Group in the Level 1 and Level
2 categories. In addition, the Group hedges items classified in the Level 3 category with instruments also classified in
Level 3 of the fair value hierarchy.

CITIBANK INTERNATIONAL LIMITED
NOTES TO THE FINANCIAL STATEMENTS
66
16. Financial assets and liabilities (continued)
The effects of these hedges are presented gross in the following tables:
Group and Company
Income
statement Equity
£ Million £ Million £ Million £ Million £ Million £ Million £ Million £ Million £ Million £ Million
Trading assets
Corporate bonds 3 - - - (4) 1 - - - - -
Loans 46 3 - 57 (59) 53 - - - 100 -
49 3 - 57 (63) 54 - - - 100 -
6 - - - - - 287 (6) - 287 -
Investment securities 21 - - - - - - (21) - - -
Total financial assets 76 3 - 57 (63) 54 287 (27) - 387 -
Derivatives 15 1 - - - - - - 1 17 (11)
Debt securities in issue - 2 - - - - 30 - - 32 -
Total financial liabilities 15 3 - - - - 30 - 1 49 (11)
Group and Company
Income
statement Equity
£ Million £ Million £ Million £ Million £ Million £ Million £ Million £ Million £ Million £ Million
Derivatives 10 (10) - - - - - - - - -
Trading assets
Corporate bonds 22 - - 3 (3) - - (19) - 3 2
Loans 103 (25) - - (83) 57 - (6) - 46 -
135 (35) - 3 (86) 57 - (25) - 49 2
6 - - - - - - - - 6 -
Investment securities 41 - 3 - - - - (23) - 21 -
Total financial assets 182 (35) 3 3 (86) 57 - (48) - 76 2
Derivatives 33 (26) - 1 (1) - - - 8 15 8
Debt securities in issue 39 - - - - - - - (39) - -
Total financial liabilities 72 (26) - 1 (1) - - - (31) 15 8
Sales Settlements
At 31
December
Unrealised
gains/
(losses) still
held
2014
At
1 January
Net realised / unrealised
gains (losses) included in
Transfers
into Level 3
Transfers
out of
Level 3 Purchases
Unrealised
gains/
(losses) still
held
Transfers
out of
Level 3 Purchases Sales Settlements
At 31
December
2013
Issuances
Issuances
Financial liabilities
designated at fair value
Financial assets
designated at fair value
Financial liabilities held
for trading
Financial assets
available-for-sale
Financial assets held for
trading
Loans and advances to
customers
Net realised / unrealised
gains (losses) included in
At
1 January
Transfers
into Level 3
Financial liabilities
Financial assets held for
trading
Financial assets
designated at fair value
Loans and advances to
customers
Financial assets
Financial liabilities held
for trading
Financial instruments may move to lower levels in the fair value hierarchy when factors, such as, liquidity or the
observability of input parameters change. As conditions around these factors improve, financial instruments may
transfer higher up the fair value hierarchy.

CITIBANK INTERNATIONAL LIMITED
NOTES TO THE FINANCIAL STATEMENTS
67
16. Financial assets and liabilities (continued)
Level 3 positions
The key contributor to the Level 3 inventory movement during 2014 was in relation to loans and advances to
customers where the Group has originated loans that it intends to sell in the near term.
Transfers between Level 3 and Level 2 were driven by movements in loans within the Emerging Markets Credit
Trading business. Specifically structured emerging markets corporate loans, driven, in part, by the changes in
liquidity over the year, and the uncertainty across Russia and Ukraine as we moved into Q4 2014. This limited the
availability of observable broker prices, which (in certain instances) resulted in a transfer from Level 2 to Level 3.
Unobservable inputs
During the year, total changes in fair value representing a loss of £nil (2013: £9 million loss) were recognised in the
profit and loss account relating to items where fair value was estimated using a valuation technique that uses one or
more significant inputs that were based on unobservable market data. As these valuation techniques are based upon
assumptions, changing the assumptions will change the estimate of fair value. The potential impact of using
reasonably possible alternative assumptions for the valuation techniques including unobservable market data has been
quantified as approximately £1.7 million (2013: £0.8 million).
Valuation uncertainty is computed on a quarterly basis across all financial instruments in which one or more of the
significant input parameters are unobservable. The methodology used to derive the impact across each product is
determined by applying adjustments to the price or significant model input parameters used in the valuation.
The adjustments are typically computed with reference to proxy analysis using third party data. Examples of the
approach used to derive sensitivity adjustments are outlined below:
- Equity Derivatives: Valuation uncertainty is gauged from a combination of consensus market data and proxy
analysis using third party data providers.
- Credit and Securitised Markets: Valuation uncertainty is gauged from a combination of consensus market data,
brokers and proxy analysis using third party data providers.
2014 Fair value
£ Million Methodology Input Low High
Assets
Loans 100 Price-based Price 89.5 104.0
Liabilities
Debt securities in issue 32 Price-based Price 38.0 76.6
Derivatives
Interest rate contracts 17 Price-based Price 99.5 100.1

CITIBANK INTERNATIONAL LIMITED
NOTES TO THE FINANCIAL STATEMENTS
68
16. Financial assets and liabilities (continued)
2013 Fair value
£ Million Methodology Input Low High
Assets
Corporate bonds 3 Price-based Price 0.0 109.0
Loans 46 Price-based Price 80.0 100.5
Investment securities 21 Price-based Price 99.5 99.5
Liabilities
Derivatives
Interest rate contracts 15 Model-based Price 106.4 106.4
Price-based Price 99.2 99.7
Sensitivity to unobservable inputs and interrelationships between unobservable inputs
The impact of key unobservable inputs on the Level 3 fair value measurements may not be independent of one
another. In addition, the amount and direction of the impact on a fair value measurement for a given change in an
unobservable input depends on the nature of the instrument as well as whether the Group holds the instrument as an
asset or a liability. For certain instruments, the pricing hedging and risk management are sensitive to the correlation
between various inputs rather than on the analysis and aggregation of the individual inputs.
The following section describes the sensitivities and interrelationships of the most significant unobservable inputs
used by the Group in Level 3 fair value measurements.
Yield Adjusted yield is generally used to discount the projected future principal and interest cash flows on instruments, such
as loans. Adjusted yield is impacted by changes in the interest rate environment and relevant credit spreads.
In some circumstances, the yield of an instrument is not observable in the market and must be estimated from
historical data or from yields of similar securities. This estimated yield may need to be adjusted to capture the
characteristics of the security being valued. In other situations, the estimated yield may not represent sufficient
market liquidity and must be adjusted as well. Whenever the amount of the adjustment is significant to the value of
the security, the fair value measurement is classified as Level 3.
Qualitative discussion of the ranges of significant unobservable inputs
The following section describes the ranges of the most significant unobservable inputs used by the Group in Level 3
fair value measurements. The level of aggregation and the diversity of instruments held by the Group lead to a wide
range of unobservable inputs that may not be evenly distributed across the Level 3 inventory.
Yield Ranges for the yield inputs vary significantly depending upon the type of security. For example, securities that
typically have lower yields, such as municipal bonds, will fall on the lower end of the range, while more illiquid
securities or securities with lower credit quality, such as certain residual tranche asset-backed securities, will have
much higher yield inputs.
Price The price input is a significant unobservable input for certain fixed income instruments. For these instruments, the
price input is expressed as a percentage of the notional amount, with a price of 100 meaning that the instrument is
valued at par. For most of these instruments, the price varies between zero to 100, or slightly above 100. Relatively
illiquid assets that have experienced significant losses since issuance, such as certain asset-backed securities, are at the
lower end of the range, whereas most investment grade corporate bonds will fall in the middle to the higher end of the
range. The price input is also a significant unobservable input for certain equity securities; however, the range of
price inputs varies depending on the nature of the position, the number of shares outstanding and other factors.
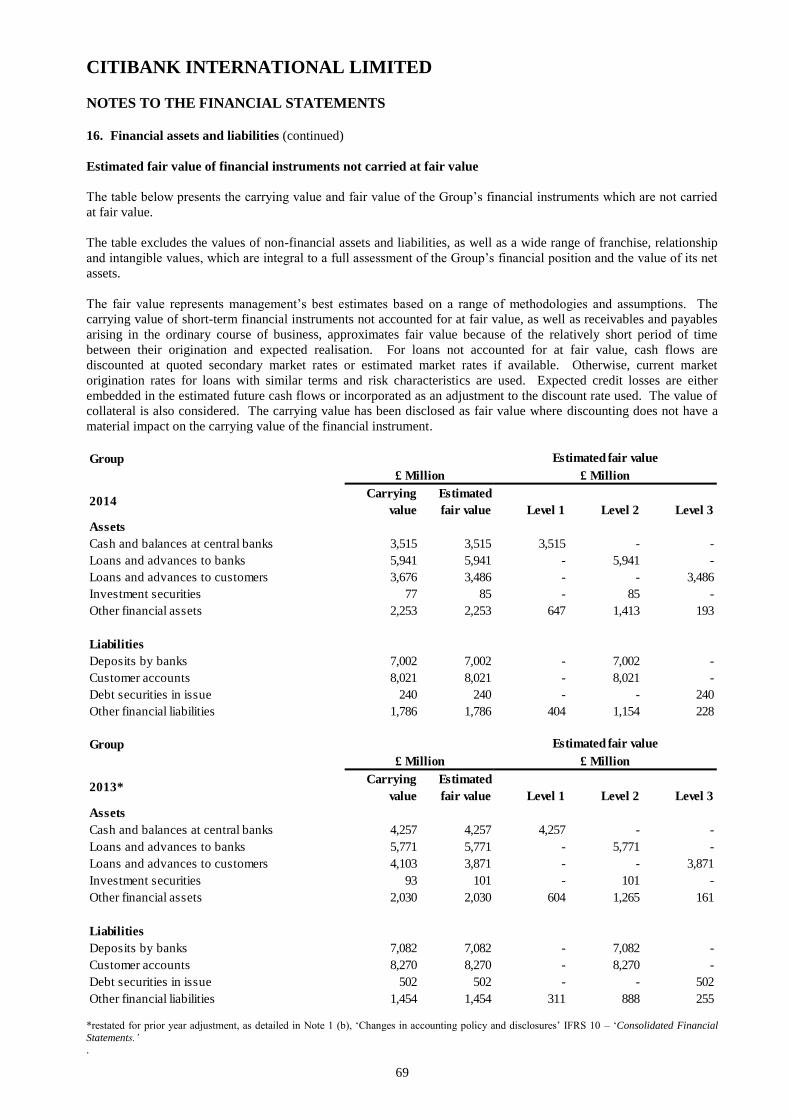
CITIBANK INTERNATIONAL LIMITED
NOTES TO THE FINANCIAL STATEMENTS
69
16. Financial assets and liabilities (continued)
Estimated fair value of financial instruments not carried at fair value
The table below presents the carrying value and fair value of the Group’s financial instruments which are not carried
at fair value.
The table excludes the values of non-financial assets and liabilities, as well as a wide range of franchise, relationship
and intangible values, which are integral to a full assessment of the Group’s financial position and the value of its net
assets.
The fair value represents management’s best estimates based on a range of methodologies and assumptions. The
carrying value of short-term financial instruments not accounted for at fair value, as well as receivables and payables
arising in the ordinary course of business, approximates fair value because of the relatively short period of time
between their origination and expected realisation. For loans not accounted for at fair value, cash flows are
discounted at quoted secondary market rates or estimated market rates if available. Otherwise, current market
origination rates for loans with similar terms and risk characteristics are used. Expected credit losses are either
embedded in the estimated future cash flows or incorporated as an adjustment to the discount rate used. The value of
collateral is also considered. The carrying value has been disclosed as fair value where discounting does not have a
material impact on the carrying value of the financial instrument.
Group
Carrying Estimated
value fair value
Assets
Cash and balances at central banks 3,515 3,515 3,515 - -
Loans and advances to banks 5,941 5,941 - 5,941 -
Loans and advances to customers 3,676 3,486 - - 3,486
Investment securities 77 85 - 85 -
Other financial assets 2,253 2,253 647 1,413 193
Liabilities
Deposits by banks 7,002 7,002 - 7,002 -
Customer accounts 8,021 8,021 - 8,021 -
Debt securities in issue 240 240 - - 240
Other financial liabilities 1,786 1,786 404 1,154 228
Estimated fair value
2014Level 1 Level 2 Level 3
£ Million £ Million
Group
Carrying Estimated
value fair value
Assets
Cash and balances at central banks 4,257 4,257 4,257 - -
Loans and advances to banks 5,771 5,771 - 5,771 -
Loans and advances to customers 4,103 3,871 - - 3,871
Investment securities 93 101 - 101 -
Other financial assets 2,030 2,030 604 1,265 161
Liabilities
Deposits by banks 7,082 7,082 - 7,082 -
Customer accounts 8,270 8,270 - 8,270 -
Debt securities in issue 502 502 - - 502
Other financial liabilities 1,454 1,454 311 888 255
Estimated fair value
2013*
£ Million £ Million
Level 1 Level 2 Level 3
*restated for prior year adjustment, as detailed in Note 1 (b), ‘Changes in accounting policy and disclosures’ IFRS 10 – ‘Consolidated Financial
Statements.’ .

CITIBANK INTERNATIONAL LIMITED
NOTES TO THE FINANCIAL STATEMENTS
70
16. Financial assets and liabilities (continued)
Company
Carrying Estimated
value fair value
Assets
Cash and balances at central banks 3,515 3,515 3,515 - -
Loans and advances to banks 5,939 5,939 - 5,939 -
Loans and advances to customers 3,676 3,486 - - 3,486
Investment securities 77 85 - 85 -
Other financial assets 2,253 2,253 647 1,413 193
Liabilities
Deposits by banks 7,039 7,039 - 7,039 -
Customer accounts 8,021 8,021 - 8,021 -
Debt securities in issue 240 240 - - 240
Other financial liabilities 1,785 1,785 404 1,154 227
Estimated fair value
£ Million £ Million
2014Level 1 Level 2 Level 3
Company Estimated fair value
£ Million £ Million
2013 Carrying Estimated
value fair value
Assets
Cash and balances at central banks 4,257 4,257 4,257 - -
Loans and advances to banks 5,768 5,768 - 5,768 -
Loans and advances to customers 4,103 3,871 - - 3,871
Investment securities 93 101 - 101 -
Other financial assets 2,030 2,030 604 1,265 161
Liabilities
Deposits by banks 7,118 7,118 - 7,118 -
Customer accounts 8,270 8,270 - 8,270 -
Debt securities in issue 502 502 - - 502
Other financial liabilities 1,449 1,449 311 888 250
Level 1 Level 2 Level 3
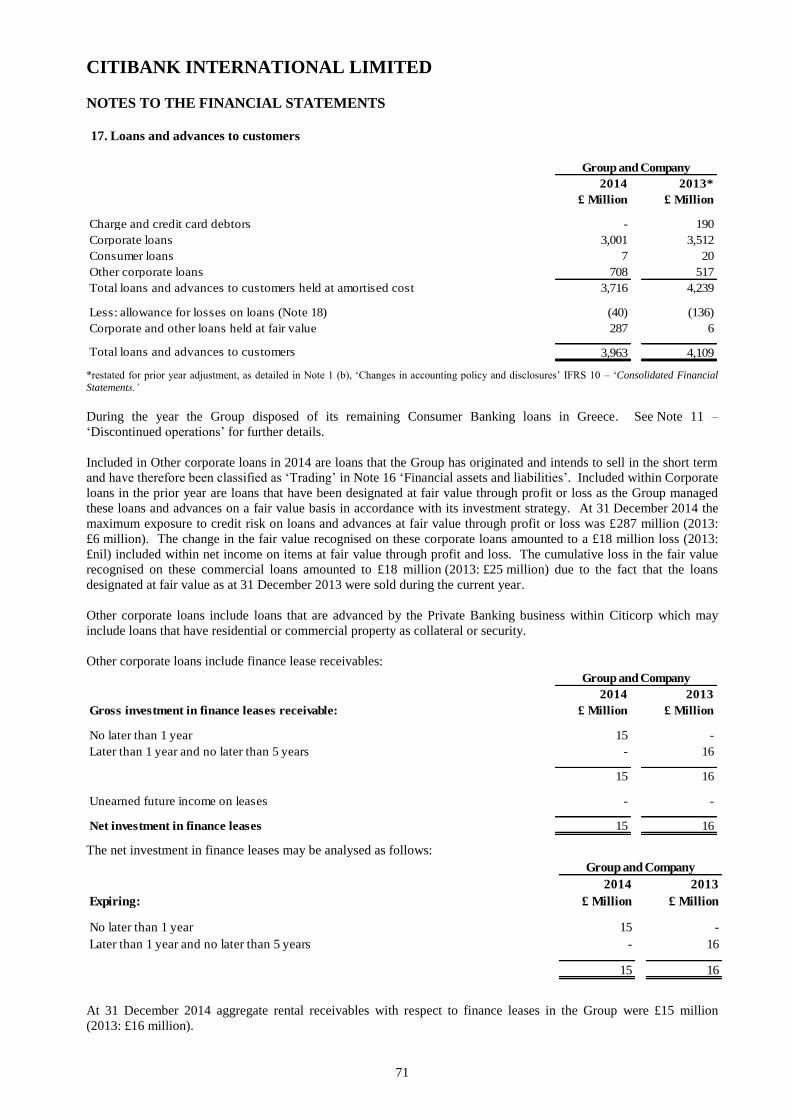
CITIBANK INTERNATIONAL LIMITED
NOTES TO THE FINANCIAL STATEMENTS
71
17. Loans and advances to customers
2014
£ Million
2013*
£ Million
Charge and credit card debtors - 190
Corporate loans 3,001 3,512
Consumer loans 7 20
Other corporate loans 708 517
Total loans and advances to customers held at amortised cost 3,716 4,239
Less: allowance for losses on loans (Note 18) (40) (136)
Corporate and other loans held at fair value 287 6
Total loans and advances to customers 3,963 4,109
Group and Company
*restated for prior year adjustment, as detailed in Note 1 (b), ‘Changes in accounting policy and disclosures’ IFRS 10 – ‘Consolidated Financial
Statements.’
During the year the Group disposed of its remaining Consumer Banking loans in Greece. See Note 11 –
‘Discontinued operations’ for further details.
Included in Other corporate loans in 2014 are loans that the Group has originated and intends to sell in the short term
and have therefore been classified as ‘Trading’ in Note 16 ‘Financial assets and liabilities’. Included within Corporate
loans in the prior year are loans that have been designated at fair value through profit or loss as the Group managed
these loans and advances on a fair value basis in accordance with its investment strategy. At 31 December 2014 the
maximum exposure to credit risk on loans and advances at fair value through profit or loss was £287 million (2013:
£6 million). The change in the fair value recognised on these corporate loans amounted to a £18 million loss (2013:
£nil) included within net income on items at fair value through profit and loss. The cumulative loss in the fair value
recognised on these commercial loans amounted to £18 million (2013: £25 million) due to the fact that the loans
designated at fair value as at 31 December 2013 were sold during the current year.
Other corporate loans include loans that are advanced by the Private Banking business within Citicorp which may
include loans that have residential or commercial property as collateral or security.
Other corporate loans include finance lease receivables:
2014
£ Million
2013
£ Million
No later than 1 year 15 -
Later than 1 year and no later than 5 years - 16
15 16
Unearned future income on leases - -
Net investment in finance leases 15 16
Group and Company
Gross investment in finance leases receivable:
The net investment in finance leases may be analysed as follows:
Expiring:
2014
£ Million
2013
£ Million
No later than 1 year 15 -
Later than 1 year and no later than 5 years - 16
15 16
Group and Company
At 31 December 2014 aggregate rental receivables with respect to finance leases in the Group were £15 million
(2013: £16 million).

CITIBANK INTERNATIONAL LIMITED
NOTES TO THE FINANCIAL STATEMENTS
72
18. Allowances for loans and advances
2014
£ Million
2013
£ Million
2014
£ Million
2013
£ Million
At 1 January 136 232 136 234
Write-offs (13) (25) (13) (25)
Net credit (gains)/losses (7) 40 (7) 38
Disposals (73) (117) (73) (117)
Foreign currency translation adjustments (3) 6 (3) 6
At 31 December 40 136 40 136
Individual assessment 10 19 10 19
Collective assessment 30 117 30 117
40 136 40 136
Group Company
Net credit losses in the above table exclude write offs and recoveries that are recognised directly in the income
statement.
19. Derivative financial instruments
Group and Company
Asset Liability Asset Liability
£ Million £ Million £ Million £ Million
Exchange rate related contracts
Forwards and futures 383 352 106 84
Currency swaps 254 261 116 124
Options 1 1 2 2
638 614 224 210
Interest rate related contracts
Interest rate swaps 220 233 14 30
Options 9 9 - -
229 242 14 30
Equity related contracts
Options 1 1 1 1
Swaps 1 - 2 14
2 1 3 15
Total derivative contracts 869 857 241 255
Fair valueFair value
2014 2013

CITIBANK INTERNATIONAL LIMITED
NOTES TO THE FINANCIAL STATEMENTS
73
19. Derivative financial instruments (continued)
Net investment hedges
The Group uses forward exchange contracts to hedge the foreign currency translation risk on its net investment in the
Greece branch. The fair value of derivatives designated as net investment hedges is as follows:
Asset Liability Asset Liability
£ Million £ Million £ Million £ Million
Instrument type
Foreign exchange - 24 - 10
- 24 - 10
Fair value Fair value
2014 2013
The ineffectiveness recognised in profit or loss that arises from hedges of net investments in foreign operations was
£nil in the year (2013: £nil).
20. Trading assets
Group and Company 2014
£ Million
2013
£ Million
Government bonds 32 22
Corporate bonds 2 146
European commercial paper 458 688
Loans 108 247
600 1,103
21. Investment securities
Group and Company 2014
£ Million
2013
£ Million
Debt securities - at fair value:
- listed 1,575 2,242
- unlisted 1,484 -
Equity securities - at fair value:
- unlisted 13 16
3,072 2,258
Debt securities - at amortised value:
- listed 77 93
77 93
Total investment securities 3,149 2,351
Held-to-maturity
Available-for-sale
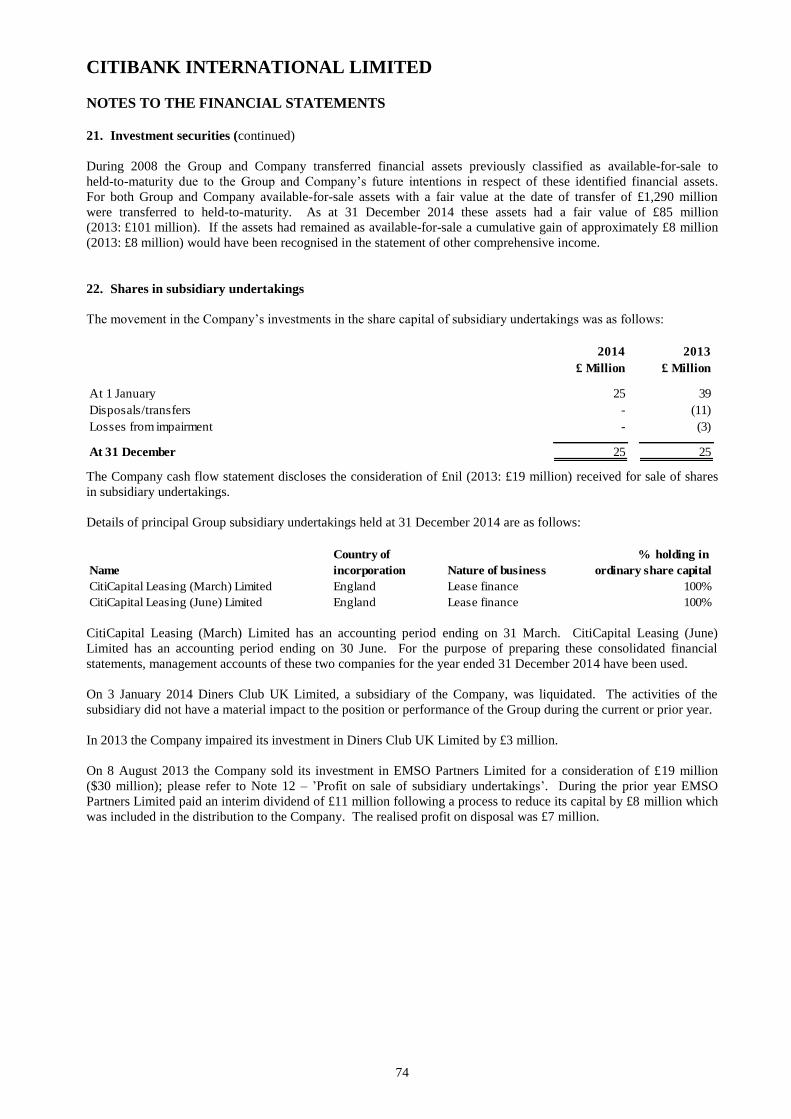
CITIBANK INTERNATIONAL LIMITED
NOTES TO THE FINANCIAL STATEMENTS
74
21. Investment securities (continued)
During 2008 the Group and Company transferred financial assets previously classified as available-for-sale to
held-to-maturity due to the Group and Company’s future intentions in respect of these identified financial assets.
For both Group and Company available-for-sale assets with a fair value at the date of transfer of £1,290 million
were transferred to held-to-maturity. As at 31 December 2014 these assets had a fair value of £85 million
(2013: £101 million). If the assets had remained as available-for-sale a cumulative gain of approximately £8 million
(2013: £8 million) would have been recognised in the statement of other comprehensive income.
22. Shares in subsidiary undertakings
The movement in the Company’s investments in the share capital of subsidiary undertakings was as follows:
2014
£ Million
2013
£ Million
At 1 January 25 39
Disposals/transfers - (11)
Losses from impairment - (3)
At 31 December 25 25
The Company cash flow statement discloses the consideration of £nil (2013: £19 million) received for sale of shares
in subsidiary undertakings.
Details of principal Group subsidiary undertakings held at 31 December 2014 are as follows:
Country of % holding in
Name incorporation Nature of business ordinary share capital
CitiCapital Leasing (March) Limited England Lease finance 100%
CitiCapital Leasing (June) Limited England Lease finance 100%
CitiCapital Leasing (March) Limited has an accounting period ending on 31 March. CitiCapital Leasing (June)
Limited has an accounting period ending on 30 June. For the purpose of preparing these consolidated financial
statements, management accounts of these two companies for the year ended 31 December 2014 have been used.
On 3 January 2014 Diners Club UK Limited, a subsidiary of the Company, was liquidated. The activities of the
subsidiary did not have a material impact to the position or performance of the Group during the current or prior year.
In 2013 the Company impaired its investment in Diners Club UK Limited by £3 million.
On 8 August 2013 the Company sold its investment in EMSO Partners Limited for a consideration of £19 million
($30 million); please refer to Note 12 – ’Profit on sale of subsidiary undertakings’. During the prior year EMSO
Partners Limited paid an interim dividend of £11 million following a process to reduce its capital by £8 million which
was included in the distribution to the Company. The realised profit on disposal was £7 million.

CITIBANK INTERNATIONAL LIMITED
NOTES TO THE FINANCIAL STATEMENTS
75
23. Involvement with unconsolidated structured entities
The table below describes the types of structured entities (SE) that the Group does not consolidate but which it holds
an interest.
Type of structured entity Nature and purpose Interest held by the Group Total assets
£ million
Asset-Based Financing Aircraft Financing 486
These vehicles are funded via a
sydnicate of lenders
Non-Agency-Sponsored
Mortgage Securitizations
Securitisation vehicle for loans
and advances
85
These vehicles are financed
through the issue of notes to
investors
- Investment in Capital
- Fees
- Commitment to lend
Invesments in notes issued
by the vehicles
The table below sets out an analysis of carrying amounts of interests held by the Group in unconsolidated structured
entities and the maximum exposure to loss.
Carrying amount Loans and
Advances to
Customers
Total funded
exposure
Unfunded
exposure
31 December 2014 £ Million £ Million £ Million
389 389 -
- - -
Total 389 389 -
Non-Agency-Sponsored Mortgage Securitizations
Asset-Based Financing
During the year no financial support was provide to an unconsolidated SE.
The asset balances for unconsolidated SEs where the Group has significant involvement represent the most current
information available to the Group. In most cases, the asset balances represent an amortised cost basis without regard
to impairments in fair value, unless fair value information is readily available to the Group.
The maximum funded exposure represents the balance sheet carrying amount of the Group’s investment in the SE. It
reflects the initial amount of cash invested in the SE adjusted for any accrued interest and cash principal payments
received. The carrying amount may also be adjusted for increases or declines in fair value or any impairment in value
recognised in the income statement. The maximum exposure of unfunded positions represents the remaining undrawn
committed amount, including liquidity and credit facilities provided by the Group.
Asset Based Financing
The Group provides loans and other forms of financing to SEs that hold assets. Those loans are subject to the same
credit approvals as all other loans originated or purchased by the Group. The Group does not have the power to direct
the activities that most significantly impact these SEs economic performance, and thus it does not consolidate them.
Non-Agency-Sponsored Mortgage Securitisation
Non-agency sponsored mortgage securitisations are where the Group has securitised mortgage loans via a private-
label (rather than government sponsored). The Group does not consolidate the non agency sponsored securitisation as
it is not the servicer with the power to direct the significant activities of the entity.
The Group does not consider itself to be a sponsor to any SE’s at the year end.
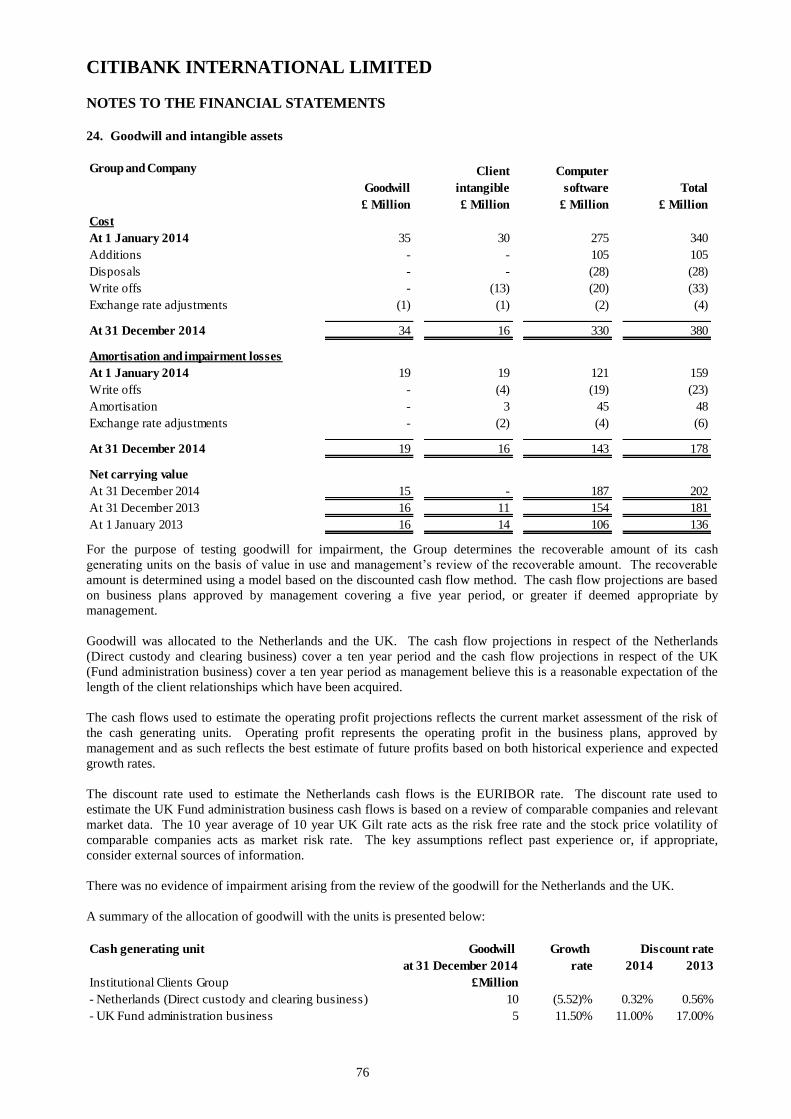
CITIBANK INTERNATIONAL LIMITED
NOTES TO THE FINANCIAL STATEMENTS
76
24. Goodwill and intangible assets
Group and Company
Goodwill
£ Million
Client
intangible
£ Million
Computer
software
£ Million
Total
£ Million
Cost
At 1 January 2014 35 30 275 340
Additions - - 105 105
Disposals - - (28) (28)
Write offs - (13) (20) (33)
Exchange rate adjustments (1) (1) (2) (4)
At 31 December 2014 34 16 330 380
Amortisation and impairment losses
At 1 January 2014 19 19 121 159
Write offs - (4) (19) (23)
Amortisation - 3 45 48
Exchange rate adjustments - (2) (4) (6)
At 31 December 2014 19 16 143 178
Net carrying value
At 31 December 2014 15 - 187 202
At 31 December 2013 16 11 154 181
At 1 January 2013 16 14 106 136
For the purpose of testing goodwill for impairment, the Group determines the recoverable amount of its cash
generating units on the basis of value in use and management’s review of the recoverable amount. The recoverable
amount is determined using a model based on the discounted cash flow method. The cash flow projections are based
on business plans approved by management covering a five year period, or greater if deemed appropriate by
management.
Goodwill was allocated to the Netherlands and the UK. The cash flow projections in respect of the Netherlands
(Direct custody and clearing business) cover a ten year period and the cash flow projections in respect of the UK
(Fund administration business) cover a ten year period as management believe this is a reasonable expectation of the
length of the client relationships which have been acquired.
The cash flows used to estimate the operating profit projections reflects the current market assessment of the risk of
the cash generating units. Operating profit represents the operating profit in the business plans, approved by
management and as such reflects the best estimate of future profits based on both historical experience and expected
growth rates.
The discount rate used to estimate the Netherlands cash flows is the EURIBOR rate. The discount rate used to
estimate the UK Fund administration business cash flows is based on a review of comparable companies and relevant
market data. The 10 year average of 10 year UK Gilt rate acts as the risk free rate and the stock price volatility of
comparable companies acts as market risk rate. The key assumptions reflect past experience or, if appropriate,
consider external sources of information.
There was no evidence of impairment arising from the review of the goodwill for the Netherlands and the UK.
A summary of the allocation of goodwill with the units is presented below:
Cash generating unit Goodwill Growth
at 31 December 2014 rate 2014 2013
Institutional Clients Group £Million
- Netherlands (Direct custody and clearing business) 10 (5.52)% 0.32% 0.56%
- UK Fund administration business 5 11.50% 11.00% 17.00%
Discount rate
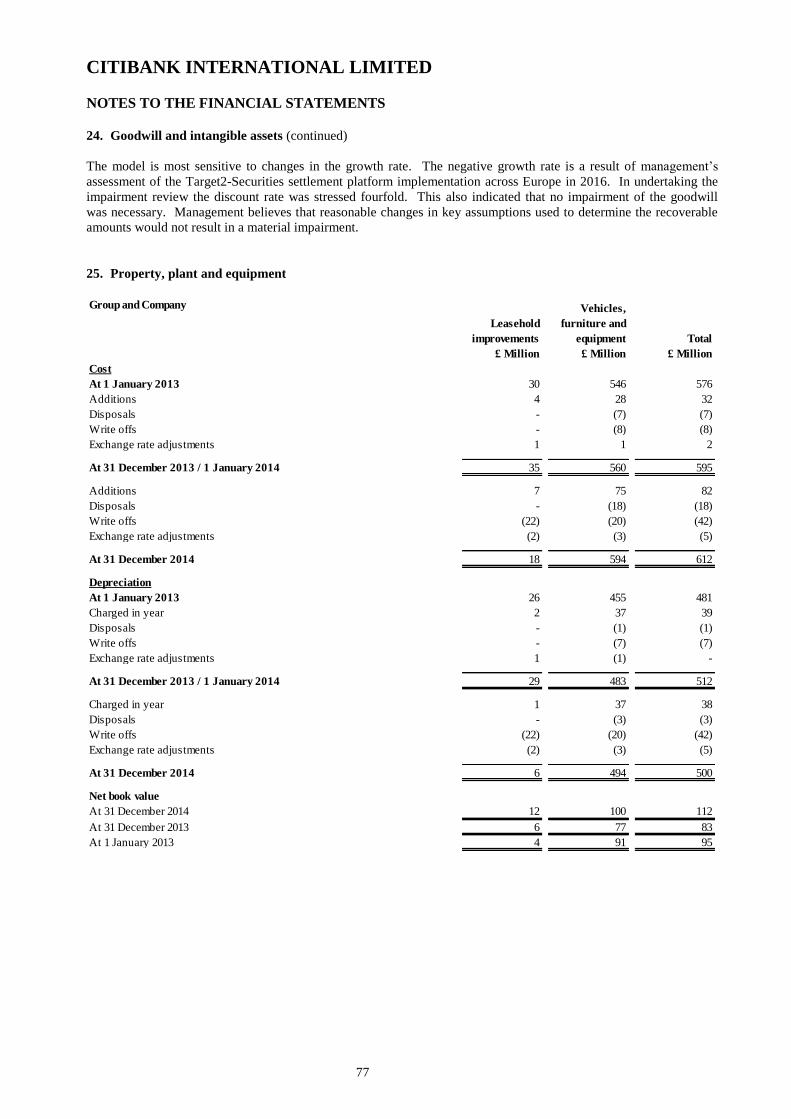
CITIBANK INTERNATIONAL LIMITED
NOTES TO THE FINANCIAL STATEMENTS
77
24. Goodwill and intangible assets (continued)
The model is most sensitive to changes in the growth rate. The negative growth rate is a result of management’s
assessment of the Target2-Securities settlement platform implementation across Europe in 2016. In undertaking the
impairment review the discount rate was stressed fourfold. This also indicated that no impairment of the goodwill
was necessary. Management believes that reasonable changes in key assumptions used to determine the recoverable
amounts would not result in a material impairment.
25. Property, plant and equipment
Group and Company
Leasehold
improvements
£ Million
Vehicles,
furniture and
equipment
£ Million
Total
£ Million
Cost
At 1 January 2013 30 546 576
Additions 4 28 32
Disposals - (7) (7)
Write offs - (8) (8)
Exchange rate adjustments 1 1 2
At 31 December 2013 / 1 January 2014 35 560 595
Additions 7 75 82
Disposals - (18) (18)
Write offs (22) (20) (42)
Exchange rate adjustments (2) (3) (5)
At 31 December 2014 18 594 612
Depreciation
At 1 January 2013 26 455 481
Charged in year 2 37 39
Disposals - (1) (1)
Write offs - (7) (7)
Exchange rate adjustments 1 (1) -
At 31 December 2013 / 1 January 2014 29 483 512
Charged in year 1 37 38
Disposals - (3) (3)
Write offs (22) (20) (42)
Exchange rate adjustments (2) (3) (5)
At 31 December 2014 6 494 500
Net book value
At 31 December 2014 12 100 112
At 31 December 2013 6 77 83
At 1 January 2013 4 91 95
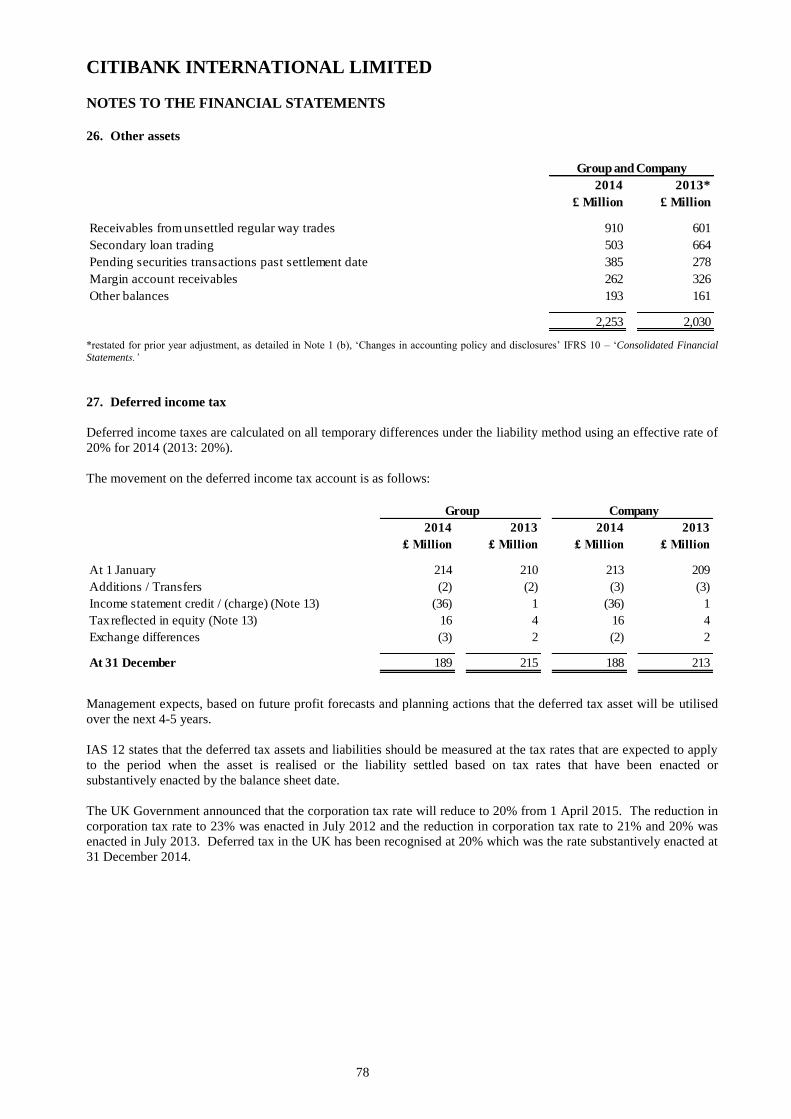
CITIBANK INTERNATIONAL LIMITED
NOTES TO THE FINANCIAL STATEMENTS
78
26. Other assets
2014
£ Million
2013*
£ Million
Receivables from unsettled regular way trades 910 601
Secondary loan trading 503 664
Pending securities transactions past settlement date 385 278
Margin account receivables 262 326
Other balances 193 161
2,253 2,030
Group and Company
*restated for prior year adjustment, as detailed in Note 1 (b), ‘Changes in accounting policy and disclosures’ IFRS 10 – ‘Consolidated Financial
Statements.’
27. Deferred income tax
Deferred income taxes are calculated on all temporary differences under the liability method using an effective rate of
20% for 2014 (2013: 20%).
The movement on the deferred income tax account is as follows:
2014
£ Million
2013
£ Million
2014
£ Million
2013
£ Million
At 1 January 214 210 213 209
Additions / Transfers (2) (2) (3) (3)
Income statement credit / (charge) (Note 13) (36) 1 (36) 1
Tax reflected in equity (Note 13) 16 4 16 4
Exchange differences (3) 2 (2) 2
At 31 December 189 215 188 213
Group Company
Management expects, based on future profit forecasts and planning actions that the deferred tax asset will be utilised
over the next 4-5 years.
IAS 12 states that the deferred tax assets and liabilities should be measured at the tax rates that are expected to apply
to the period when the asset is realised or the liability settled based on tax rates that have been enacted or
substantively enacted by the balance sheet date.
The UK Government announced that the corporation tax rate will reduce to 20% from 1 April 2015. The reduction in
corporation tax rate to 23% was enacted in July 2012 and the reduction in corporation tax rate to 21% and 20% was
enacted in July 2013. Deferred tax in the UK has been recognised at 20% which was the rate substantively enacted at
31 December 2014.
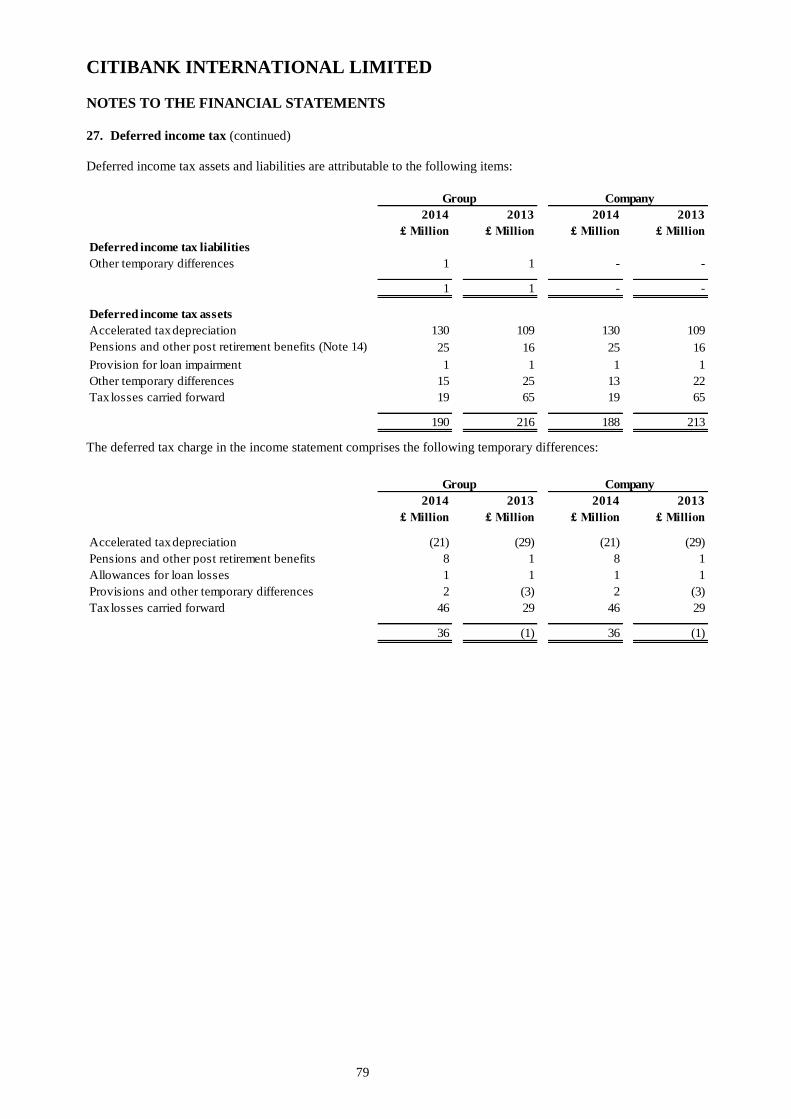
CITIBANK INTERNATIONAL LIMITED
NOTES TO THE FINANCIAL STATEMENTS
79
27. Deferred income tax (continued)
Deferred income tax assets and liabilities are attributable to the following items:
2014
£ Million
2013
£ Million
2014
£ Million
2013
£ Million
Deferred income tax liabilities
Other temporary differences 1 1 - -
1 1 - -
Deferred income tax assets
Accelerated tax depreciation 130 109 130 109
Pensions and other post retirement benefits (Note 14) 25 16 25 16
Provision for loan impairment 1 1 1 1
Other temporary differences 15 25 13 22
Tax losses carried forward 19 65 19 65
190 216 188 213
Group Company
The deferred tax charge in the income statement comprises the following temporary differences:
2014
£ Million
2013
£ Million
2014
£ Million
2013
£ Million
Accelerated tax depreciation (21) (29) (21) (29)
Pensions and other post retirement benefits 8 1 8 1
Allowances for loan losses 1 1 1 1
Provisions and other temporary differences 2 (3) 2 (3)
Tax losses carried forward 46 29 46 29
36 (1) 36 (1)
Group Company
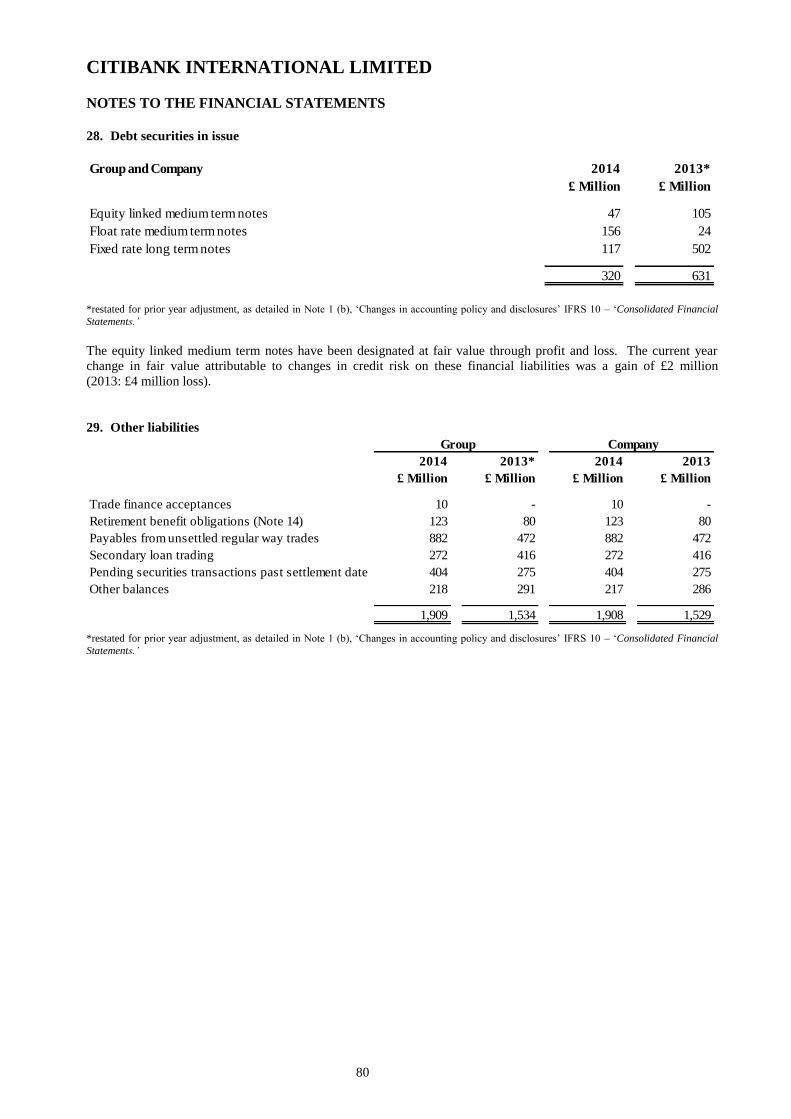
CITIBANK INTERNATIONAL LIMITED
NOTES TO THE FINANCIAL STATEMENTS
80
28. Debt securities in issue
Group and Company 2014
£ Million
2013*
£ Million
Equity linked medium term notes 47 105
Float rate medium term notes 156 24
Fixed rate long term notes 117 502
320 631
*restated for prior year adjustment, as detailed in Note 1 (b), ‘Changes in accounting policy and disclosures’ IFRS 10 – ‘Consolidated Financial
Statements.’
The equity linked medium term notes have been designated at fair value through profit and loss. The current year
change in fair value attributable to changes in credit risk on these financial liabilities was a gain of £2 million
(2013: £4 million loss).
29. Other liabilities
2014
£ Million
2013*
£ Million
2014
£ Million
2013
£ Million
Trade finance acceptances 10 - 10 -
Retirement benefit obligations (Note 14) 123 80 123 80
Payables from unsettled regular way trades 882 472 882 472
Secondary loan trading 272 416 272 416
Pending securities transactions past settlement date 404 275 404 275
Other balances 218 291 217 286
1,909 1,534 1,908 1,529
Group Company
*restated for prior year adjustment, as detailed in Note 1 (b), ‘Changes in accounting policy and disclosures’ IFRS 10 – ‘Consolidated Financial
Statements.’
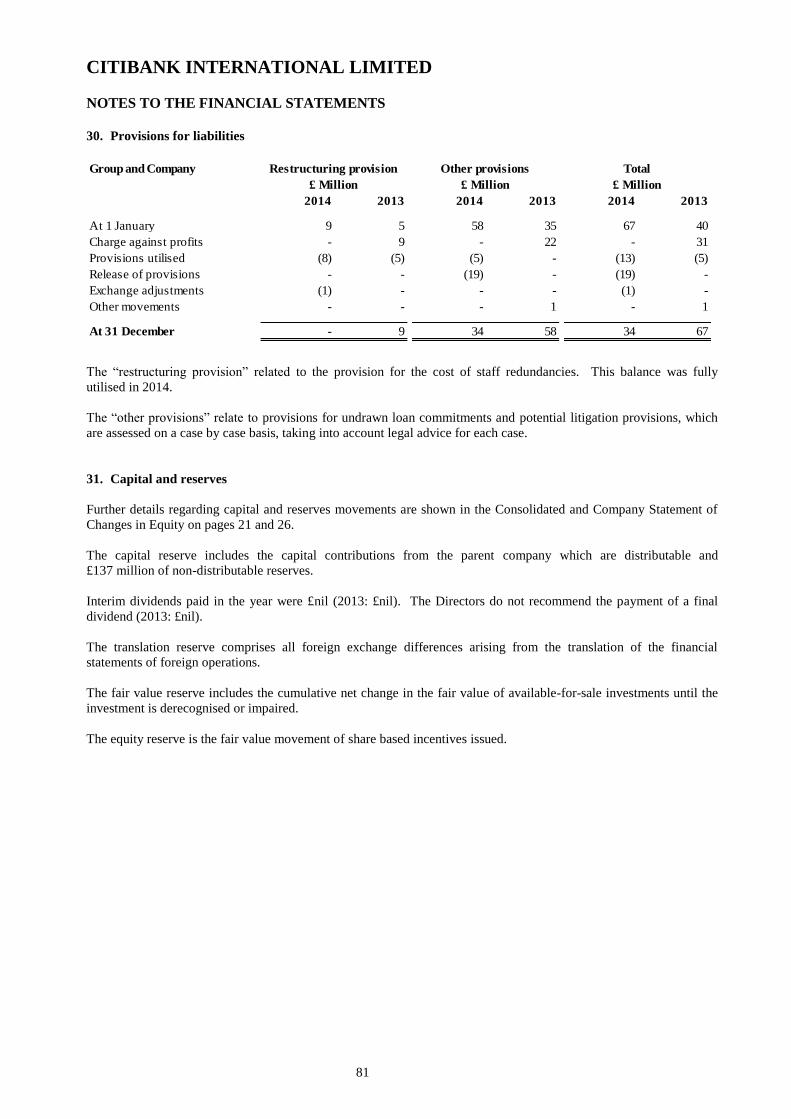
CITIBANK INTERNATIONAL LIMITED
NOTES TO THE FINANCIAL STATEMENTS
81
30. Provisions for liabilities
Group and Company
2014 2013 2014 2013 2014 2013
At 1 January 9 5 58 35 67 40
Charge against profits - 9 - 22 - 31
Provisions utilised (8) (5) (5) - (13) (5)
Release of provisions - - (19) - (19) -
Exchange adjustments (1) - - - (1) -
Other movements - - - 1 - 1
At 31 December - 9 34 58 34 67
Restructuring provision
£ Million
Other provisions
£ Million
Total
£ Million
The “restructuring provision” related to the provision for the cost of staff redundancies. This balance was fully
utilised in 2014.
The “other provisions” relate to provisions for undrawn loan commitments and potential litigation provisions, which
are assessed on a case by case basis, taking into account legal advice for each case.
31. Capital and reserves
Further details regarding capital and reserves movements are shown in the Consolidated and Company Statement of
Changes in Equity on pages 21 and 26.
The capital reserve includes the capital contributions from the parent company which are distributable and
£137 million of non-distributable reserves.
Interim dividends paid in the year were £nil (2013: £nil). The Directors do not recommend the payment of a final
dividend (2013: £nil).
The translation reserve comprises all foreign exchange differences arising from the translation of the financial
statements of foreign operations.
The fair value reserve includes the cumulative net change in the fair value of available-for-sale investments until the
investment is derecognised or impaired.
The equity reserve is the fair value movement of share based incentives issued.

CITIBANK INTERNATIONAL LIMITED
NOTES TO THE FINANCIAL STATEMENTS
82
32. Share capital
Allotted, called-up and fully paid 2014
£ Million
2013
£ Million
1,757,011,711 sterling ordinary shares of £1 each 1,757 1,757
Ordinary shares of £1 each 2014
Shares
2013
Shares
At 1 January and 31 December 1,757,011,711 1,757,011,711
All ordinary shares confer identical rights in respect of capital, dividends, voting and otherwise.
33. Cash and cash equivalents
For the purposes of the cash flow statement, cash and cash equivalents comprise the following balances with original
maturity of less than three months:
2014
£ Million
2013
£ Million
2014
£ Million
2013
£ Million
Cash and balances at central banks 3,515 4,257 3,515 4,257
Loans and advances to banks mature within 3 months 5,248 5,631 5,248 5,628
8,763 9,888 8,763 9,885
Company Group
34. Related party transactions
The Company is a wholly owned subsidiary undertaking of COHBL, which is incorporated in the Bahamas.
The largest group in which the results of the Group are consolidated is that headed by Citigroup Inc. which is
incorporated in the United States. The Group and Company define related parties as the Board of Directors, their
close family members, parent and fellow subsidiaries and associated companies.
A number of arm’s length transactions are entered into with related parties.
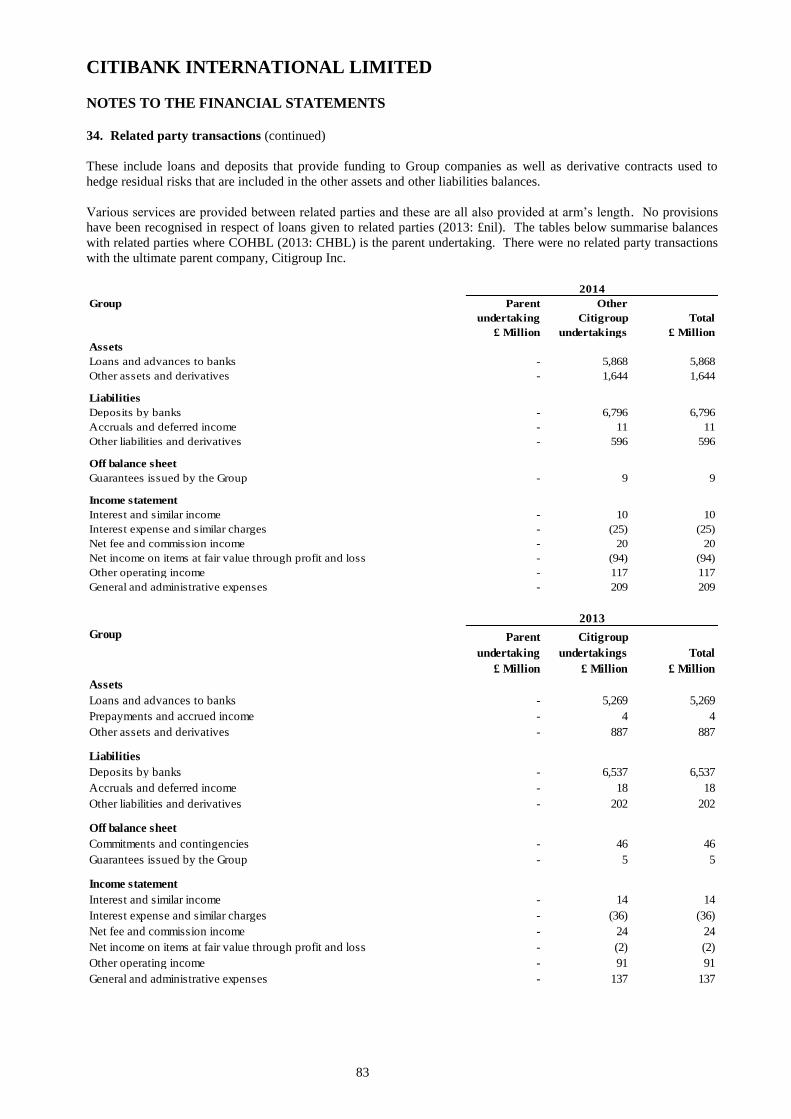
CITIBANK INTERNATIONAL LIMITED
NOTES TO THE FINANCIAL STATEMENTS
83
34. Related party transactions (continued)
These include loans and deposits that provide funding to Group companies as well as derivative contracts used to
hedge residual risks that are included in the other assets and other liabilities balances.
Various services are provided between related parties and these are all also provided at arm’s length. No provisions
have been recognised in respect of loans given to related parties (2013: £nil). The tables below summarise balances
with related parties where COHBL (2013: CHBL) is the parent undertaking. There were no related party transactions
with the ultimate parent company, Citigroup Inc.
Group Parent
undertaking
£ Million
Other
Citigroup
undertakings
Total
£ Million
Assets
Loans and advances to banks - 5,868 5,868
Other assets and derivatives - 1,644 1,644
Liabilities
Deposits by banks - 6,796 6,796
Accruals and deferred income - 11 11
Other liabilities and derivatives - 596 596
Off balance sheet
Guarantees issued by the Group - 9 9
Income statement
Interest and similar income - 10 10
Interest expense and similar charges - (25) (25)
Net fee and commission income - 20 20
Net income on items at fair value through profit and loss - (94) (94)
Other operating income - 117 117
General and administrative expenses - 209 209
2014
Group
Parent
undertaking
£ Million
Other
Citigroup
undertakings
£ Million
Total
£ Million
Assets
Loans and advances to banks - 5,269 5,269
Prepayments and accrued income - 4 4
Other assets and derivatives - 887 887
Liabilities
Deposits by banks - 6,537 6,537
Accruals and deferred income - 18 18
Other liabilities and derivatives - 202 202
Off balance sheet
Commitments and contingencies - 46 46
Guarantees issued by the Group - 5 5
Income statement
Interest and similar income - 14 14
Interest expense and similar charges - (36) (36)
Net fee and commission income - 24 24
Net income on items at fair value through profit and loss - (2) (2)
Other operating income - 91 91
General and administrative expenses - 137 137
2013
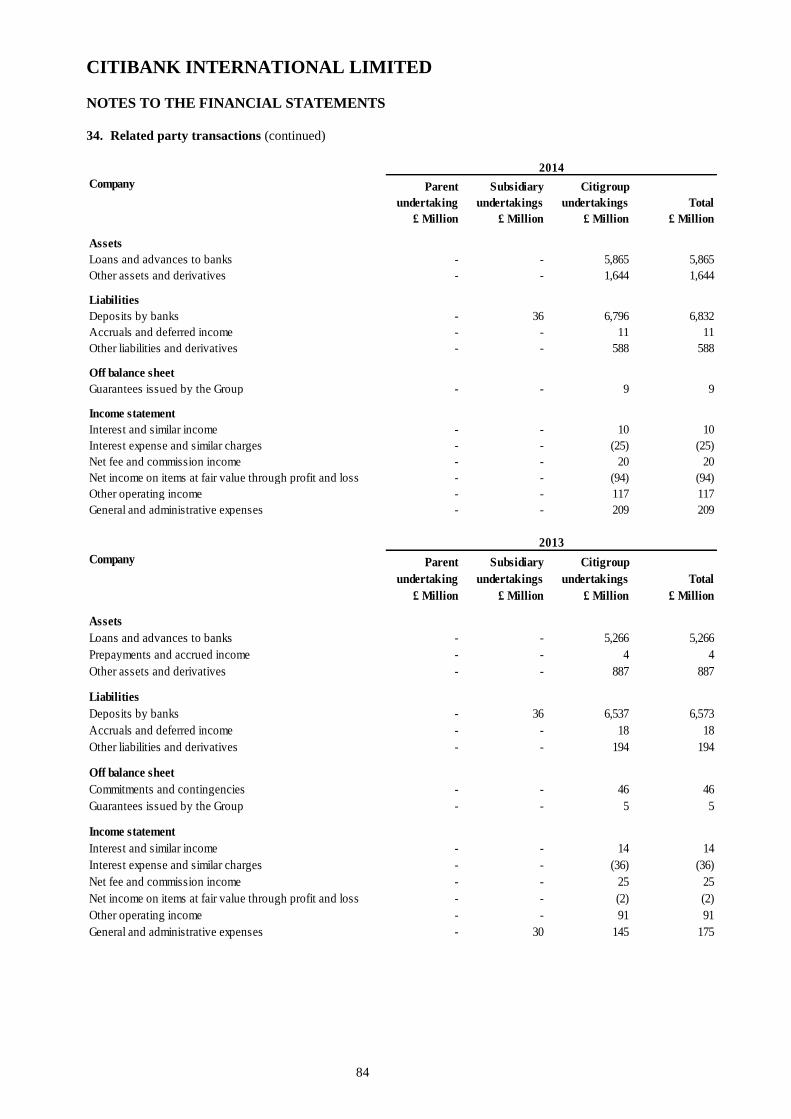
CITIBANK INTERNATIONAL LIMITED
NOTES TO THE FINANCIAL STATEMENTS
84
34. Related party transactions (continued)
Company Parent
undertaking
£ Million
Subsidiary
undertakings
£ Million
Other
Citigroup
undertakings
£ Million
Total
£ Million
Assets
Loans and advances to banks - - 5,865 5,865
Other assets and derivatives - - 1,644 1,644
Liabilities
Deposits by banks - 36 6,796 6,832
Accruals and deferred income - - 11 11
Other liabilities and derivatives - - 588 588
Off balance sheet
Guarantees issued by the Group - - 9 9
Income statement
Interest and similar income - - 10 10
Interest expense and similar charges - - (25) (25)
Net fee and commission income - - 20 20
Net income on items at fair value through profit and loss - - (94) (94)
Other operating income - - 117 117
General and administrative expenses - - 209 209
2014
Company Parent
undertaking
£ Million
Subsidiary
undertakings
£ Million
Other
Citigroup
undertakings
£ Million
Total
£ Million
Assets
Loans and advances to banks - - 5,266 5,266
Prepayments and accrued income - - 4 4
Other assets and derivatives - - 887 887
Liabilities
Deposits by banks - 36 6,537 6,573
Accruals and deferred income - - 18 18
Other liabilities and derivatives - - 194 194
Off balance sheet
Commitments and contingencies - - 46 46
Guarantees issued by the Group - - 5 5
Income statement
Interest and similar income - - 14 14
Interest expense and similar charges - - (36) (36)
Net fee and commission income - - 25 25
Net income on items at fair value through profit and loss - - (2) (2)
Other operating income - - 91 91
General and administrative expenses - 30 145 175
2013

CITIBANK INTERNATIONAL LIMITED
NOTES TO THE FINANCIAL STATEMENTS
85
34. Related party transactions (continued)
Directors’ remuneration
Directors’ compensation for the year comprises:
2014
£ 000's
2013
£ 000's
Salaries and other short-term benefits 942 1,072
Post-employment benefits 27 38
Share-based payments 632 847
1,601 1,957
Contributions to defined benefit and money purchase schemes are accruing to six of the Directors (2013: seven).
Eight of the Directors (2013: eight) of the Company participate in Citigroup share and share option plans and during
the year none of the Directors (2013: none) exercised options. The emoluments for the highest paid Director were
£687,145 (2013: £896,685) with £403,147 (2013: £546,973) being share based compensation and accrued pension of
£2,494 (2013: £2,417). During the year the highest paid Director did not exercise share options. The Directors
benefit from qualifying third party indemnity provisions in place during the financial year and at the date of this
report.
Directors’ emoluments are allocated based on the apportionment of time incurred by the Directors for services to the
Group. When Directors are employed by other Citigroup companies, the Group does not incur any charge for these
costs.
35. Pledged assets
Group and Company
Financial assets pledged to secure liabilities
The total carrying value of financial assets that have been pledged as collateral for liabilities at 31 December 2014
was £747 million (2013: £993 million). These transactions are conducted under terms that are usual and customary to
standard lending activities and include assets pledged to ECB as part of the Long Term Repo Operations (LTRO).
Collateral accepted as security for assets
The fair value of assets accepted as security for lending activities at 31 December 2014 was £5,313 million
(2013: £4,297 million). The fair value of the collateral that has been repledged at 31 December 2014 was
£1,330 million (2013: £799 million). These transactions are generally conducted under terms that are usual and
customary for standard secured lending activities. The Group, as the secured party, has the right to sell or repledge
such collateral, subject to the Group returning equivalent securities upon completion of the transaction. This right is
used primarily to cover short sales, securities loaned and securities sold under repurchase agreements.
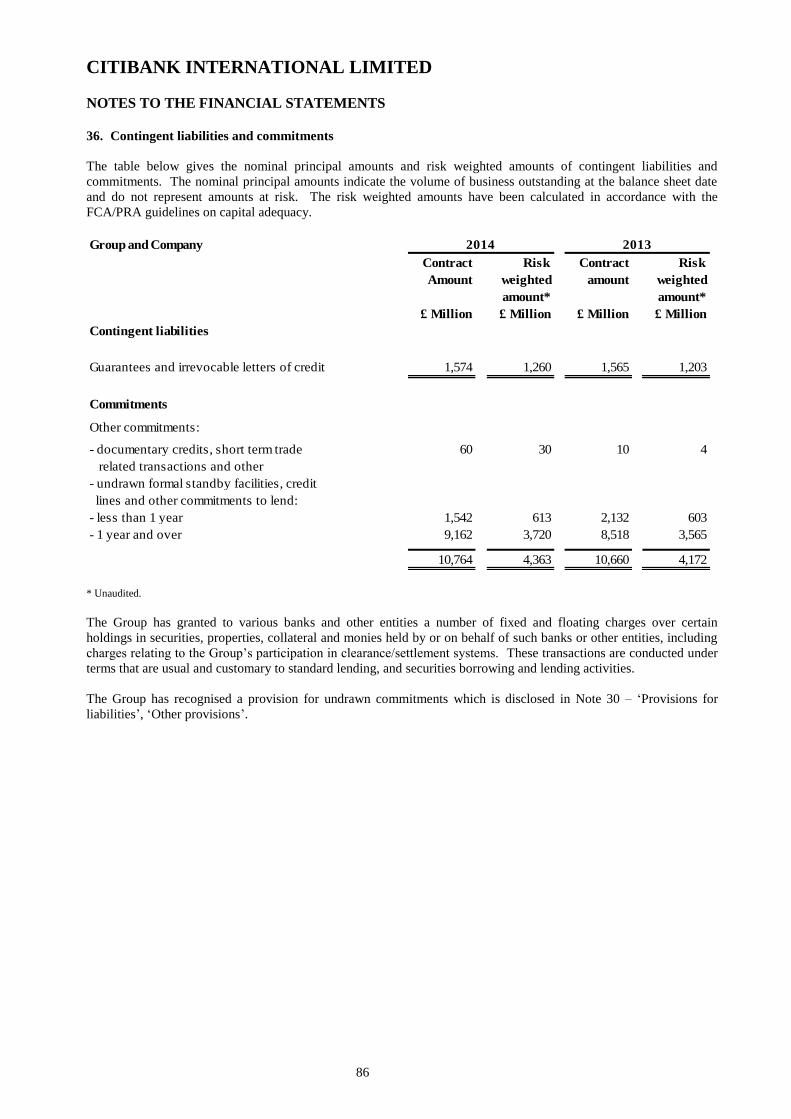
CITIBANK INTERNATIONAL LIMITED
NOTES TO THE FINANCIAL STATEMENTS
86
36. Contingent liabilities and commitments
The table below gives the nominal principal amounts and risk weighted amounts of contingent liabilities and
commitments. The nominal principal amounts indicate the volume of business outstanding at the balance sheet date
and do not represent amounts at risk. The risk weighted amounts have been calculated in accordance with the
FCA/PRA guidelines on capital adequacy.
Group and Company
Contract Risk Contract Risk
Amount weighted amount weighted
amount* amount*
£ Million £ Million £ Million £ Million
Contingent liabilities
Guarantees and irrevocable letters of credit 1,574 1,260 1,565 1,203
Commitments
Other commitments:
- documentary credits, short term trade 60 30 10 4
related transactions and other
- undrawn formal standby facilities, credit
lines and other commitments to lend:
- less than 1 year 1,542 613 2,132 603
- 1 year and over 9,162 3,720 8,518 3,565
10,764 4,363 10,660 4,172
2014 2013
* Unaudited.
The Group has granted to various banks and other entities a number of fixed and floating charges over certain
holdings in securities, properties, collateral and monies held by or on behalf of such banks or other entities, including
charges relating to the Group’s participation in clearance/settlement systems. These transactions are conducted under
terms that are usual and customary to standard lending, and securities borrowing and lending activities.
The Group has recognised a provision for undrawn commitments which is disclosed in Note 30 – ‘Provisions for
liabilities’, ‘Other provisions’.

CITIBANK INTERNATIONAL LIMITED
NOTES TO THE FINANCIAL STATEMENTS
87
37. Financial instruments and risk management
Objectives, policies and strategies
The provision of credit, together with transacting in financial instruments is fundamental to the Group’s business.
The risks associated with financial instruments and the credit exposures from lending are significant components of
the overall risks faced by the Group.
The purpose for which the Group holds or issues financial instruments can be classified into four main categories:
Customer loans and deposits: Customer loans and deposits (both retail and institutional) form a large part of
the Group’s business. The Group has detailed policies and strategies in respect of its customer loans and
deposits that seek to minimise the risks associated with these financial instruments.
Investment securities: The Group holds securities, excluding strategic investments, for use on a continuing
basis in the Group’s activities. The objective of holding such financial instruments is primarily to support
collateral requirements of cash and securities clearing and to support liquidity management.
Finance: Financial instruments are used to manage the Group’s balance sheet in terms of minimising market
risk and to support liquidity management. Responsibility for overseeing and implementing balance sheet
management lies with the Group’s Treasury department. In prior years the Group has also issued financial
instruments to fund that portion of the Group’s assets not funded by customer deposits.
Hedging: Where financial instruments form part of the Group’s interest rate management strategy, they are
classified as economic hedges. The objective for holding financial instruments as hedges is to match or
minimise the risk arising from adverse movements in interest rates, exchange rates, credit or equity prices.
Cash products are the main instruments used for economically hedging the balance sheet.
In the normal course of business, the Group enters into a variety of derivative transactions principally in the interest
rate, foreign exchange, credit and equity markets. They are used principally to provide financial services to
customers. Derivatives are also used to economically hedge or modify risk exposures arising on the balance sheet
from a variety of activities, including lending and securities investment. Most of the counterparties to the Group’s
derivative transactions are banks and other financial institutions.
The risks involved in activities mentioned above include market, credit, liquidity and operational risk which form the
object of the Citigroup’s risk management framework. The latter is defined by the Chief Risk Officer and is designed
to balance corporate oversight with clearly defined independent risk management functions, to monitor, evaluate and
manage the principal risks, with appropriate consideration at a subsidiary level.
The past year has seen a continuation of the challenging operating environment as macroeconomic concerns in the
Eurozone affected market confidence which continued to impact the Group’s business and the results of its operations.
The performance of the UK and European economies influences liquidity and pricing, counterparty demand for credit,
and the risk of delinquency or default, all of which can negatively impact the Group’s credit exposure. Although
credit exposures are regularly reviewed, in these market circumstances default risk may arise from events or
circumstances that are difficult to foresee.
Market uncertainty places additional importance on the risk management policies and procedures which are outlined
below. The Group believes that effective risk management is of primary importance to its overall operations.
Accordingly, the Group seeks to maintain a comprehensive risk management process to monitor, evaluate and manage
the principal risks it assumes in conducting its activities.
CITIBANK INTERNATIONAL LIMITED
NOTES TO THE FINANCIAL STATEMENTS
88
37. Financial instruments and risk management (continued)
Objectives, policies and strategies (continued)
Citigroup’s and intrinsically the Group’s risk management framework is based on the following principles:
a defined risk appetite, aligned with business strategy;
accountability through a common framework to manage risks;
risk decisions based on transparent, accurate and rigorous analytics;
a common risk capital model to evaluate risks;
expertise, stature, authority and independence of risk managers; and
risk managers empowered to make decisions and escalate issues.
Risk management
Citigroup manages risk across three dimensions; businesses, regions and critical products. Each of the major business
groups has a Business Chief Risk Officer who is the focal point for risk decisions (such as setting risk limits or
approving transactions) in the business.
There are also Regional Chief Risk Officers, accountable for the risks in their geographic area and who are the
primary risk contact for the regional business heads and local regulators. In addition, there are Product Risk Officers
for those areas of critical importance to Citigroup such as real estate and fundamental credit. The Product Risk
Officers are accountable for the risks within their Specialty and they focus on Specific areas across businesses and
regions. The Product Risk Officers serve as a resource to the Chief Risk Officer, as well as to the Business and
Regional Chief Risk Officers, to better enable the Business and Regional Chief Risk Officers to focus on the
day-to-day management of risks and respond in a timely fashion to business needs. Risk management within the
Group is overseen by the Regional Risk Manager along with the Risk Managers for the different risk types within the
region, such as credit risk, market risk, liquidity risk and operational risk.
The Citigroup risk organisation also includes a Business Management team who seek to ensure that the risk
organisation has the appropriate infrastructure, processes and management reporting. This team, which supports risk
management within the Group, includes:
the risk capital group, which continues to enhance the risk capital model so that it is consistent across all
business activities;
the risk architecture group, which seeks to ensure integrated systems and common metrics, and thereby
facilitates aggregation and stress testing of exposures across the institution;
the enterprise risk management group, which focuses on improving the effectiveness of existing controls
while increasing accountability and eliminating redundancy; and
the office of Strategic Regulatory Relationships and the Chief Administrative Officer, which focuses on
critical regulatory relationships as well risk communications.
The Group utilises Citigroup’s risk management model and organisation, with its multi-dimensional risk oversight and
its people, processes and systems to ensure robust oversight of entity risks. In addition, the Group has entity specific
risk management and controls, to ensure local challenge to risk taking and ensuring that the global Citigroup approach
is appropriate for the Group.
Risk aggregation and stress testing
The Citigroup Chief Risk Officer, as noted above, is responsible for monitoring and controlling major risk exposures
and concentrations across the organisation. This means aggregating risks, within and across businesses, as well as
subjecting those risks to alternative stress scenarios in order to assess the potential economic impact they may have on
the Citigroup. This aggregation is also performed at a Group level.
CITIBANK INTERNATIONAL LIMITED
NOTES TO THE FINANCIAL STATEMENTS
89
37. Financial instruments and risk management (continued)
Risk management (continued)
Stress tests are undertaken across Citigroup and the Group which includes mark-to-market, available-for-sale and
amortised cost portfolios. These firm-wide stress reports measure the potential impact to Citigroup, the Group and its
component businesses, including the risk of very large movements in a number of key risk factors (e.g. interest rates,
credit spreads), as well as the potential impact of a range of historical and hypothetical forward-looking systemic
stress scenarios.
Supplementing the stress testing described above, Risk Management provides periodic updates to senior management
and the Board of Directors on significant potential exposures of the Group arising from risk concentrations, financial
market participants and other systemic issues. These risk assessments are forward-looking exercises, intended to
inform senior management and the Board of Directors about the potential economic impacts to Citigroup and the
Group that may occur directly or indirectly, as a result of hypothetical scenarios, based on judgmental analysis from
independent risk managers.
The stress testing and risk assessment exercises are a supplement to the standard limit-setting and risk capital
exercises described later in this section, as these processes incorporate events in the marketplace and within the Group
that impact the firm’s view of the form, magnitude, correlation and timing of identified risks that may arise. In
addition to enhancing awareness and understanding of potential exposures within the Group, the results of these
processes serve as the starting point for developing risk management and mitigation strategies.
A Citi-wide (including an EMEA-based) Business Practices Committee (BPC) reviews practices involving potentially
significant reputational or franchise issues. These committees review whether Citi’s business practices have been
designed and implemented in a way that meets the highest standards of professionalism, integrity and ethical
behaviour.
Additional committees ensure that product risks are identified, evaluated and determined to be appropriate for Citi and
its customers, including the existence of necessary approvals, controls and accountabilities.
The New Product Approval Committee (NPAC) is designed to ensure that significant risks, including reputation and
franchise risks, in a new ICG product or service or complex transaction, are identified and evaluated, determined to be
appropriate, properly recorded for risk aggregation purposes, effectively controlled, and have accountabilities in place.
The Consumer Product Approval Committee (CPAC) approves new products, services, channels or geographies for
GCB. Each region has a regional CPAC, and a global CPAC addresses initiatives with high anti-money-laundering
(AML) risk or cross-border elements.
The Investment Products Risk (IPR) Committee oversees two product approval committees that facilitate analysis and
discussion of new retail investment products and services created and/or distributed by Citi. The Manufacturing
Product Approval Committee is responsible for reviewing new or modified products or transactions created by Citi
that are distributed to individual investors as well as third-party retail distributors. The Distribution Product Approval
Committee (DPAC) approves new investment products and services, including those created by third parties as part of
Citi’s “open architecture” distribution model, before they are offered to individual investors via Citi distribution
businesses (e.g., private bank, consumer, etc.).
In October 2014 a CIL Risk Committee was established, with the aim to assist the Board in fulfilling its responsibility
with respect to oversight of the risks the Group faces in managing its credit, market, liquidity, operational and certain
other risks and their alignment with the Group’s strategy, capital adequacy and the macroeconomic environment and
development of a strategy to manage these risks. This was pursued in order to strengthen local risk governance and
ensure necessary prioritisation of local risk and regulatory objectives of the Group, at the same time maintaining their
alignment with Citi’s global risk strategy. The CIL Risk Committee meets not less than quarterly.
Along with the processes described above, the following sections summarise the processes that were in place during
2014 for managing the Group’s major risks.
CITIBANK INTERNATIONAL LIMITED
NOTES TO THE FINANCIAL STATEMENTS
90
37. Financial instruments and risk management (continued)
Market risk
Market risk (and namely the price risk component) is the risk to earnings or capital from adverse changes in market
factors such as interest rates, foreign exchange rates, credit, equity and commodity prices, as well as their implied
volatilities and other higher order factors. Price risk is measured using various tools including, Interest Rate Gap
Analysis, Interest Rate Exposure (IRE) limits, stress and scenario analysis which are applied to interest rate risk
arising in the non-trading portfolios and factor sensitivity limits, Value-at-Risk (VaR) and stress and scenario analysis
which are applied to the trading portfolios. At the discretion of Market Risk Management, VaR can sometimes be
applied to the non-trading portfolio as a complementary measure.
Independent Risk Management is tasked to establish an effective risk management process, including defining
policies and procedures and appropriate market risk controls and limits taking into account where appropriate business
considerations. It is supplemented by appropriate senior Business and Corporate management risk oversight.
The market risk limit structure clearly defines approved risk profiles and follows the principles and parameters of
Citigroup's global as well as the Group's overall risk appetite.
In addition the Group has a defined risk appetite framework supplemented by a daily VaR limit with monthly and
quarterly reporting to the senior management and the Boards of Directors respectively. The CIL legal entity VaR
reports are circulated daily for monitoring of the VaR usage against the overall VaR limit. Exposure that approaches
or exceeds the limit is escalated within market risk management and to the CIL Market Risk Manager and the CIL
Legal Entity Risk Manager, with necessary actions taken.
Management of this process begins with the professionals who work most closely with the specific customers,
products and markets and extends up to the senior executives who manage these businesses with complementary
aggregation up to the country level. In all cases, the businesses are ultimately responsible for the market risks they
take and for remaining within their defined limits.
VaR methodology
VaR estimates the potential decline in the value of a position or a portfolio, under normal market conditions, over a
Specified holding period and confidence level. The VaR methodology developed and applied at Citigroup global
level is also used at subsidiary level, including the Group. The Citigroup standard is a one-day holding period, at a
99% confidence level. The VaR methodology incorporates the factor sensitivities of the trading portfolio and the
volatilities and correlations of those factors.
A VaR limit is in place for the Group to ensure that any excesses are discussed and resolved between risk officers and
the business and entity management. In addition, the European Commercial Paper (ECP) desk is subject to formal
limits on interest rate and issuer exposures that are closely monitored by Risk Management and senior business
management.
Although a valuable guide to risk, VaR should always be viewed in context of its limitations:
the use of historical data as a proxy for estimating future events may not encompass all potential events,
particularly those of an extreme nature;
the use of a one day holding period assumes that all positions can be liquidated or the risks offset in one day.
This may not fully reflect the market risk arising at times of severe illiquidity, when a one day holding period
may be insufficient to fully liquidate or hedge positions;
the use of a 99% confidence level, by definition does not take into account losses that might occur beyond
this confidence level;
VaR is calculated on the basis of exposures outstanding at close of business therefore does not necessarily
reflect intra-day exposures; and
VaR is unlikely to reflect loss potential on exposures that only arise under significant market movements.
CITIBANK INTERNATIONAL LIMITED
NOTES TO THE FINANCIAL STATEMENTS
91
37. Financial instruments and risk management (continued)
Market risk (continued)
Stress testing is performed on portfolios on a regular basis to estimate the impact of extreme market movements.
Stress testing is performed on individual portfolios, as well as on aggregations of portfolios and businesses, as
appropriate. It is the responsibility of independent market risk management, in conjunction with the businesses, to
develop stress scenarios, review the output of periodic stress testing exercises, and use the information to make
judgments as to the on-going suitability of exposure levels and limits.
The following table summarises market risk by disclosing the Group’s average and peak VaR during the reporting
period, together with the VaR as at 31 December:
At 31 December
£ Million
Average
£ Million
Peak during
the year
£ Million
2014
Equity risk - - -
Interest rate risk 0.50 0.12 0.47
FX risk 0.01 0.01 0.01
Credit risk 1.17 2.16 2.72
Overall 1.68 2.29 3.20
2013*
Equity risk - 0.10
Interest rate risk 0.02 0.03
FX risk - 0.01
Credit Risk 2.44 1.65
Overall 2.46 1.79
*The 2013 VaR balances have been restated, and both years have been calculated using month-end values to correct for data quality issues with the
interest rate, equity and credit risk populations.
Interest rate risk in the banking book
Interest rate risk in the non-trading portfolios is measured using Interest Rate Gap Analysis, IRE limits and stress and
scenario analysis. Interest Rate Gap Analysis utilises the maturity or re-pricing schedules of balance sheet items to
determine interest rate exposures within given tenor buckets. IRE measures the potential earnings impact, over a
Specified reporting period, from a defined standard set of parallel shifts in the curve. IRE is calculated separately for
each currency and reflects the re-pricing gaps in the position, as well as option positions, both explicit and embedded.
Limits are set for the country and business activity, of which the Group is a part. Market Risk Management monitors
these limits.
The IRE measures the potential change in expected net interest earnings over an accounting horizon of 12 months,
5 years and 10 years and has been broken down into the main currencies on the Group’s balance sheet.
The following table shows the IRE measures for the Group at 31 December assuming a parallel upward shift of
interest rates by 100 basis points. A positive IRE indicates a potential increase of earnings while a negative IRE
indicates a potential decline of earnings.
£ Million 12 Months 5 Years 10 Years 12 Months 5 Years 10 Years
USD 2 17 17 5 23 22
EUR (4) (8) (11) 3 11 5
GBP 11 42 43 10 40 40
2014 2013
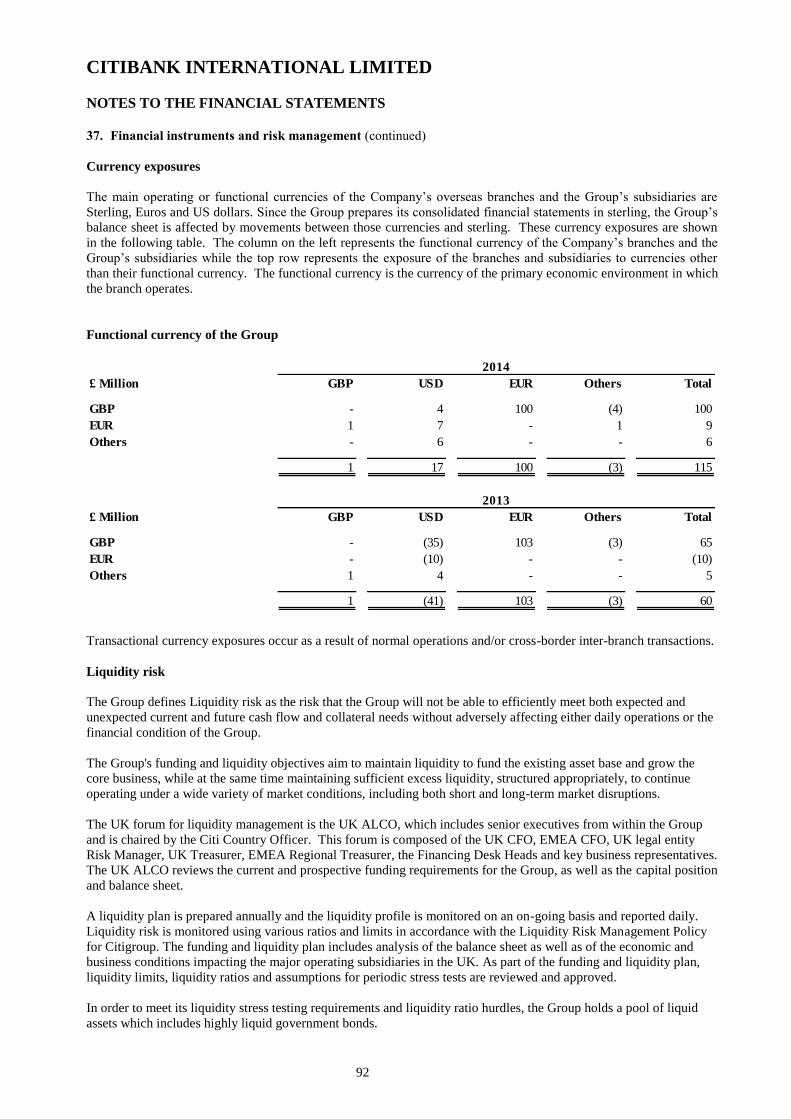
CITIBANK INTERNATIONAL LIMITED
NOTES TO THE FINANCIAL STATEMENTS
92
37. Financial instruments and risk management (continued)
Currency exposures
The main operating or functional currencies of the Company’s overseas branches and the Group’s subsidiaries are
Sterling, Euros and US dollars. Since the Group prepares its consolidated financial statements in sterling, the Group’s
balance sheet is affected by movements between those currencies and sterling. These currency exposures are shown
in the following table. The column on the left represents the functional currency of the Company’s branches and the
Group’s subsidiaries while the top row represents the exposure of the branches and subsidiaries to currencies other
than their functional currency. The functional currency is the currency of the primary economic environment in which
the branch operates.
Functional currency of the Group
£ Million GBP USD EUR Others Total
GBP - 4 100 (4) 100
EUR 1 7 - 1 9
Others - 6 - - 6
1 17 100 (3) 115
£ Million GBP USD EUR Others Total
GBP - (35) 103 (3) 65
EUR - (10) - - (10)
Others 1 4 - - 5
1 (41) 103 (3) 60
2014
2013
Transactional currency exposures occur as a result of normal operations and/or cross-border inter-branch transactions.
Liquidity risk
The Group defines Liquidity risk as the risk that the Group will not be able to efficiently meet both expected and
unexpected current and future cash flow and collateral needs without adversely affecting either daily operations or the
financial condition of the Group.
The Group's funding and liquidity objectives aim to maintain liquidity to fund the existing asset base and grow the
core business, while at the same time maintaining sufficient excess liquidity, structured appropriately, to continue
operating under a wide variety of market conditions, including both short and long-term market disruptions.
The UK forum for liquidity management is the UK ALCO, which includes senior executives from within the Group
and is chaired by the Citi Country Officer. This forum is composed of the UK CFO, EMEA CFO, UK legal entity
Risk Manager, UK Treasurer, EMEA Regional Treasurer, the Financing Desk Heads and key business representatives.
The UK ALCO reviews the current and prospective funding requirements for the Group, as well as the capital position
and balance sheet.
A liquidity plan is prepared annually and the liquidity profile is monitored on an on-going basis and reported daily.
Liquidity risk is monitored using various ratios and limits in accordance with the Liquidity Risk Management Policy
for Citigroup. The funding and liquidity plan includes analysis of the balance sheet as well as of the economic and
business conditions impacting the major operating subsidiaries in the UK. As part of the funding and liquidity plan,
liquidity limits, liquidity ratios and assumptions for periodic stress tests are reviewed and approved.
In order to meet its liquidity stress testing requirements and liquidity ratio hurdles, the Group holds a pool of liquid
assets which includes highly liquid government bonds.

CITIBANK INTERNATIONAL LIMITED
NOTES TO THE FINANCIAL STATEMENTS
93
37. Financial instruments and risk management (continued)
Liquidity risk (continued)
Stress testing and scenario analyses are intended to quantify the potential impact of a liquidity event on the Group’s
balance sheet and liquidity position, and to identify viable funding alternatives that can be utilised. These scenarios
include potential significant changes in key funding sources, market triggers (such as credit rating downgrades), uses
of funding and political and economic conditions, including standard and stressed market conditions as well as firm-
specific events. Some tests span liquidity events over a full year, while others may cover a more intense shock over a
shorter period such as one month. These potential liquidity events can identify potential mismatches between
liquidity sources and uses over a variety of time horizons, and liquidity limits are set accordingly. To monitor the
liquidity of a unit, these stress tests and potential mismatches may be calculated with varying frequencies, with several
important tests performed daily.
Given the range of potential stresses, Citigroup maintains a series of contingency funding plans on a consolidated
basis as well as for individual entities, including the Group. The plans specify a wide range of readily available
actions under a variety of adverse market conditions or idiosyncratic disruptions.
The following table assigns the Group’s assets and liabilities to relevant maturity groupings based on the remaining
period from the balance sheet date to the contractual maturity date. Note that in managing liquidity risk, management
use certain assumptions based on a combination of contractual and behavioural maturity profiles which may differ
from the contractual maturity dates shown below:
Group
2014
1 year or less
£ Million
> 1 year and <
5 years
£ Million
Greater than
5 years
£ Million
Total
£ Million
Assets
Cash and balances at central banks 3,515 - - 3,515
Loans and advances to banks 5,921 20 - 5,941
Loans and advances to customers 1,839 1,383 741 3,963
Derivative financial instruments 115 448 306 869
Trading assets 234 179 187 600
Investment securities 2,147 806 196 3,149
All other assets 2,263 190 314 2,767
Total assets 16,034 3,026 1,744 20,804
2013* total assets 15,691 2,884 1,807 20,382
Liabilities
Deposits by banks 6,532 268 202 7,002
Customer accounts 8,016 5 - 8,021
Derivative financial instruments 97 452 308 857
Debt securities in issue 62 186 72 320
All other liabilities and equity 1,930 10 2,664 4,604
Total liabilities and equity 16,637 921 3,246 20,804
2013* total liabilities and equity 15,656 2,008 2,718 20,382
2014 net liquidity gap (603) 2,105 (1,502) -
2013 net liquidity gap 35 876 (911) - *restated for prior year adjustment, as detailed in Note 1 (b), ‘Changes in accounting policy and disclosures’ IFRS 10 – ‘Consolidated Financial
Statements.’

CITIBANK INTERNATIONAL LIMITED
NOTES TO THE FINANCIAL STATEMENTS
94
37. Financial instruments and risk management (continued)
Liquidity risk (continued)
The following table analyses the Company’s assets and liabilities into relevant maturity groupings based on the
remaining period from the balance sheet date to the contractual maturity date:
Company
2014 1 year or less
£ Million
> 1 year and <
5 years
£ Million
Greater than
5 years
£ Million
Total
£ Million
Assets
Cash and balances at central banks 3,515 - - 3,515
Loans and advances to banks 5,919 20 - 5,939
Loans and advances to customers 1,839 1,383 741 3,963
Derivative financial instruments 115 448 306 869
Trading assets 234 179 187 600
Investment securities 2,147 806 196 3,149
All other assets 2,262 215 314 2,791
Total assets 16,031 3,051 1,744 20,826
2013 total assets 15,712 2,884 1,806 20,402
Liabilities
Deposits by banks 6,567 269 203 7,039
Customer accounts 8,016 5 - 8,021
Derivative financial instruments 97 452 308 857
Debt securities in issue 13 269 38 320
All other liabilities and equity 1,929 10 2,650 4,589
Total liabilities and equity 16,622 1,005 3,199 20,826
2013 total liabilities and equity 15,685 2,008 2,709 20,402
2014 net liquidity gap (591) 2,046 (1,455) -
2013 net liquidity gap 27 876 (903) -
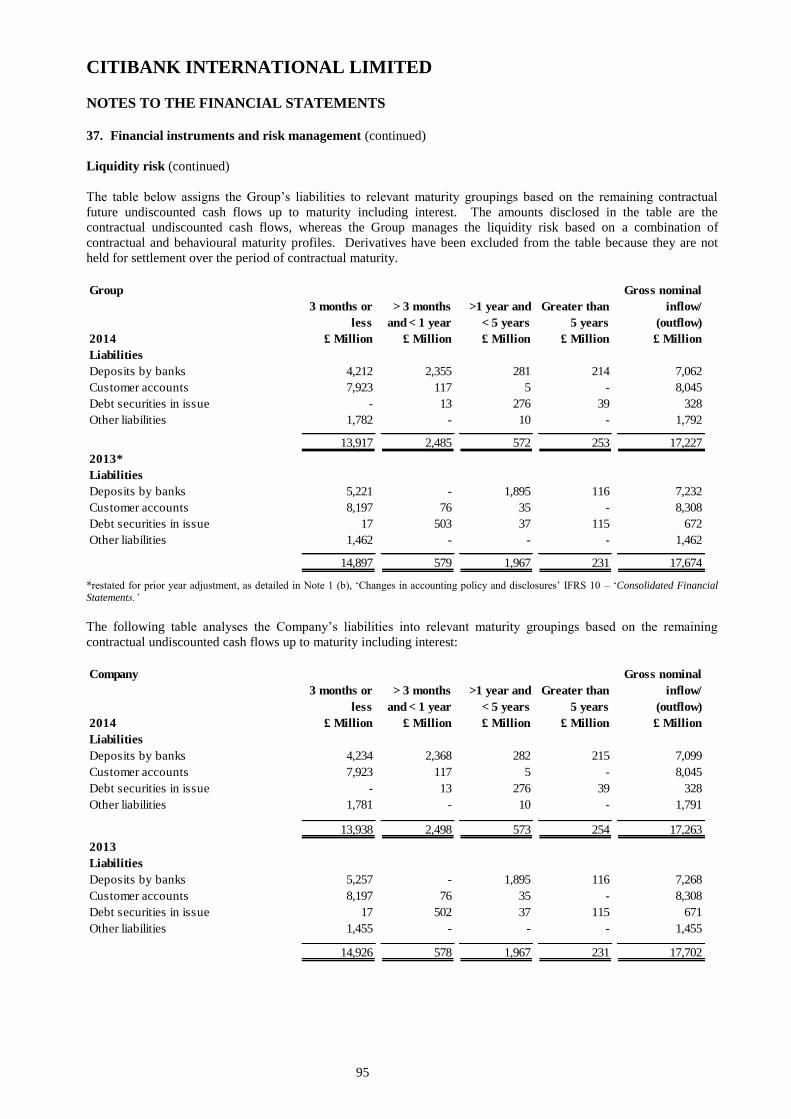
CITIBANK INTERNATIONAL LIMITED
NOTES TO THE FINANCIAL STATEMENTS
95
37. Financial instruments and risk management (continued)
Liquidity risk (continued)
The table below assigns the Group’s liabilities to relevant maturity groupings based on the remaining contractual
future undiscounted cash flows up to maturity including interest. The amounts disclosed in the table are the
contractual undiscounted cash flows, whereas the Group manages the liquidity risk based on a combination of
contractual and behavioural maturity profiles. Derivatives have been excluded from the table because they are not
held for settlement over the period of contractual maturity.
Group
2014
3 months or
less
£ Million
> 3 months
and < 1 year
£ Million
>1 year and
< 5 years
£ Million
Greater than
5 years
£ Million
Gross nominal
inflow/
(outflow)
£ Million
Liabilities
Deposits by banks 4,212 2,355 281 214 7,062
Customer accounts 7,923 117 5 - 8,045
Debt securities in issue - 13 276 39 328
Other liabilities 1,782 - 10 - 1,792
13,917 2,485 572 253 17,227
2013*
Liabilities
Deposits by banks 5,221 - 1,895 116 7,232
Customer accounts 8,197 76 35 - 8,308
Debt securities in issue 17 503 37 115 672
Other liabilities 1,462 - - - 1,462
14,897 579 1,967 231 17,674
*restated for prior year adjustment, as detailed in Note 1 (b), ‘Changes in accounting policy and disclosures’ IFRS 10 – ‘Consolidated Financial Statements.’
The following table analyses the Company’s liabilities into relevant maturity groupings based on the remaining
contractual undiscounted cash flows up to maturity including interest:
Company
2014
3 months or
less
£ Million
> 3 months
and < 1 year
£ Million
>1 year and
< 5 years
£ Million
Greater than
5 years
£ Million
Gross nominal
inflow/
(outflow)
£ Million
Liabilities
Deposits by banks 4,234 2,368 282 215 7,099
Customer accounts 7,923 117 5 - 8,045
Debt securities in issue - 13 276 39 328
Other liabilities 1,781 - 10 - 1,791
13,938 2,498 573 254 17,263
2013
Liabilities
Deposits by banks 5,257 - 1,895 116 7,268
Customer accounts 8,197 76 35 - 8,308
Debt securities in issue 17 502 37 115 671
Other liabilities 1,455 - - - 1,455
14,926 578 1,967 231 17,702

CITIBANK INTERNATIONAL LIMITED
NOTES TO THE FINANCIAL STATEMENTS
96
37. Financial instruments and risk management (continued)
Credit risk
Credit risk is the potential for financial loss resulting from the failure of a borrower or counterparty to honour its
financial or contractual obligations. Credit risk arises in many of the Group’s business activities, including:
lending;
sales and trading;
derivatives;
securities transactions;
settlement; and
when Citigroup acts as an intermediary on behalf of its clients and other third parties.
The Citigroup credit process is grounded in a series of fundamental policies, including:
joint business and independent risk management responsibility for managing credit risks;
a single centre of control for each credit relationship to coordinate credit activities with that client;
a requirement for a minimum of two authorised-credit-officer signatures on extensions of credit, one of which
must be from a sponsoring credit officer in the business and the other from a credit officer in independent
credit risk management;
consistent risk rating standards, applicable to every Citigroup obligor and facility;
consistent standards for credit origination documentation and remedial management; and
portfolio limits to ensure diversification and maintain risk/capital alignment.
The Group leverages Citigroup’s process, as outlined above, with appropriate local governance and management.
Corporate Loans
Corporate loans are identified as impaired when it is determined that the payment of interest or principal is doubtful or
when interest or principal is past due for 90 days or more, unless the loan is well secured and in the process of
collection. Impaired corporate loans are written down to the extent that the principal is judged to be uncollectible.
Impaired collateral-dependent loans are written down to the lower of cost or collateral value, less disposal costs.
The Group structures the level of credit risk it undertakes by placing limits on the amount of risk accepted in relation
to one borrower, or group of borrowers, and to geographical and industry segments. Such risks are monitored on a
revolving basis and subject to an annual or more frequent review.
The exposure to any one borrower is further restricted by sub-limits covering on- and off-balance sheet exposures.
Actual exposures against limits are monitored daily. Exposure to credit risk is managed through regular analysis of
the ability of borrowers and potential borrowers to meet interest and capital repayment obligations and by changing
these lending limits where appropriate. Exposure to credit risk is also managed in part by obtaining collateral and
corporate and personal guarantees, but a significant portion is lending where no such facilities can be obtained.
CIL large exposure limit reports are circulated daily that show CIL’s largest exposure to counterparties as a proportion
of CIL’s own capital. Within a certain percentage below the maximum permitted level, the Regulatory Reporting
group conducts initial analysis and provides a breakdown of exposures to credit risk management. Approaching
maximum permitted level, the credit risk management team takes action and escalates to the front office in order to
reduce exposure to that counterparty to bring exposure back within permitted levels.
The Group’s corporate loan counterparties are typically investment grade global customers who are not required to
furnish significant amounts of collateral for the facilities provided. Where collateral is supplied, this usually takes the
form of cash, marketable securities and charges over property, plant and equipment.
The Group’s credit exposure is represented by the financial assets presented on the balance sheet and, additionally,
off-balance sheet items disclosed in Note 36 – ’Contingent liabilities and commitments’.
CITIBANK INTERNATIONAL LIMITED
NOTES TO THE FINANCIAL STATEMENTS
97
37. Financial instruments and risk management (continued)
Credit risk (continued)
Derivatives
The Group maintains strict control limits on net open derivative positions by both amount and term. At any one time,
the amount subject to credit risk is limited to the current fair value of instruments that are favourable to the Group
(i.e. assets where their fair value is positive). This represents only a small fraction of the contract, or notional, value
of derivatives which is used to express the volume of instruments outstanding. In addition to this current fair value,
the credit risk includes the potential exposures from future market movements and the combination of these is
managed as part of the overall lending limits with customers.
Wrong-way risk is an aggravated form of concentration risk and arises when there is a strong correlation between the
counterparty’s probability of default and the mark-to-market value of the underlying transaction. Citigroup uses a
range of procedures to monitor and control wrong-way risk, including requiring entities to obtain prior approval
before undertaking wrong-way risk transactions outside pre-agreed guidelines and these are implemented and
monitored at the Group level. Wrong-way risk is mitigated through the use of enforceable netting agreements and
margining.
The Group seeks to restrict its exposure to credit losses by entering into master netting arrangements with most
counterparties with which it undertakes a significant volume of transactions. Master netting arrangements do not
generally result in an offset of balance sheet assets and liabilities, as transactions are usually settled on a gross basis.
However, the credit risk associated with favourable contracts is reduced by a master netting arrangement to the extent
that if an event of default occurs, all amounts with the counterparty are terminated and settled on a net basis. Many of
these arrangements also provide for the calling and posting of variation margin or collateral, further reducing the
Group’s exposures. The internal measurement of exposure on each credit facility takes into account legally
enforceable netting and margining arrangements – both in terms of current exposure and in terms of the simulated
calculation of potential future exposure.
Off balance sheet credit-related commitments
The primary purpose of these instruments is to ensure that funds are available to a customer as required. Guarantees
and standby letters of credit – which represent irrevocable assurances that the Group will make payments in the event
that a customer cannot meet its obligations to third parties – carry the similar credit risk as loans. Documentary and
commercial letters of credit – which are written undertakings by the Group on behalf of a customer authorising a third
party to draw drafts on the Group up to a stipulated amount under specific terms and conditions – are collateralised by
the underlying shipments of goods to which they relate and therefore carry less risk than a direct borrowing.
Commitments to extend credit represent unused portions of authorisations to extend credit in the form of loans,
guarantees or letters of credit. With respect to credit risk on commitments to extend credit, the Group is potentially
exposed to loss in an amount equal to the total unused commitments. The Group monitors the term to maturity of
credit commitments because longer-term commitments generally have a greater degree of credit risk than shorter-term
commitments.
Management of credit risk
Credit risk is measured by total facilities and an exposure measurement, which consists of outstanding and unused
committed facility amounts. There are five exposure types: direct, contingent, counterparty, settlement and clearing.
Facilities must be approved by the appropriate independent risk and Business Credit Officers. Facilities are re-
assessed annually and are as a result either re-approved or terminated. Extension of credit is governed by limits based
on an obligor's risk rating. The requirement for collateral is also determined by the Business Credit Officer.
The quality of the collateral received is one of the factors included in the determination of facility risk ratings.
Credit risk is captured in the Group’s defined risk appetite framework, which is supplemented by regular monitoring
of exposures with monthly and quarterly reporting to the senior management and the Board of Directors respectively.
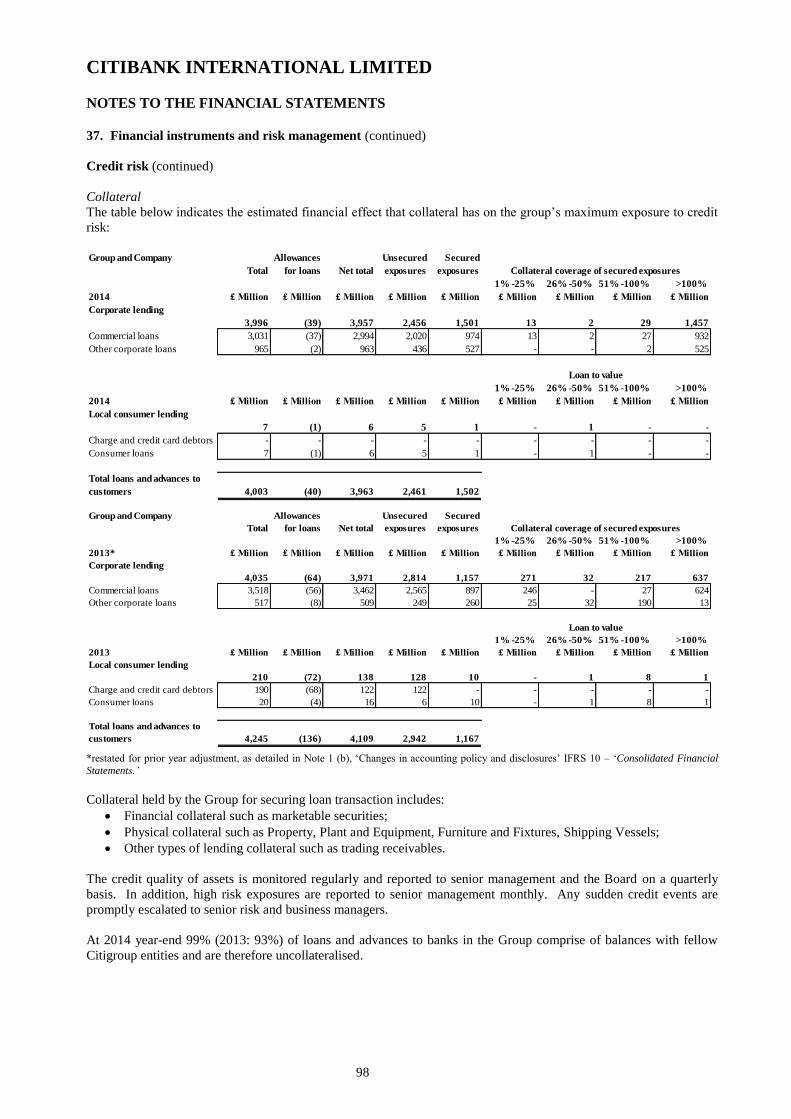
CITIBANK INTERNATIONAL LIMITED
NOTES TO THE FINANCIAL STATEMENTS
98
37. Financial instruments and risk management (continued)
Credit risk (continued)
Collateral
The table below indicates the estimated financial effect that collateral has on the group’s maximum exposure to credit
risk:
Group and Company
Total
Allowances
for loans Net total
Unsecured
exposures
Secured
exposures
1% -25% 26% -50% 51% -100% >100%
2014 £ Million £ Million £ Million £ Million £ Million £ Million £ Million £ Million £ Million
Corporate lending
3,996 (39) 3,957 2,456 1,501 13 2 29 1,457
Commercial loans 3,031 (37) 2,994 2,020 974 13 2 27 932
Other corporate loans 965 (2) 963 436 527 - - 2 525
1% -25% 26% -50% 51% -100% >100%
2014 £ Million £ Million £ Million £ Million £ Million £ Million £ Million £ Million £ Million
Local consumer lending
7 (1) 6 5 1 - 1 - -
Charge and credit card debtors - - - - - - - - -
Consumer loans 7 (1) 6 5 1 - 1 - -
Total loans and advances to
customers 4,003 (40) 3,963 2,461 1,502
Collateral coverage of secured exposures
Loan to value
Group and Company
Total
Allowances
for loans Net total
Unsecured
exposures
Secured
exposures
1% -25% 26% -50% 51% -100% >100%
2013* £ Million £ Million £ Million £ Million £ Million £ Million £ Million £ Million £ Million
Corporate lending
4,035 (64) 3,971 2,814 1,157 271 32 217 637
Commercial loans 3,518 (56) 3,462 2,565 897 246 - 27 624
Other corporate loans 517 (8) 509 249 260 25 32 190 13
1% -25% 26% -50% 51% -100% >100%
2013 £ Million £ Million £ Million £ Million £ Million £ Million £ Million £ Million £ Million
Local consumer lending
210 (72) 138 128 10 - 1 8 1
Charge and credit card debtors 190 (68) 122 122 - - - - -
Consumer loans 20 (4) 16 6 10 - 1 8 1
Total loans and advances to
customers 4,245 (136) 4,109 2,942 1,167
Collateral coverage of secured exposures
Loan to value
*restated for prior year adjustment, as detailed in Note 1 (b), ‘Changes in accounting policy and disclosures’ IFRS 10 – ‘Consolidated Financial
Statements.’
Collateral held by the Group for securing loan transaction includes:
Financial collateral such as marketable securities;
Physical collateral such as Property, Plant and Equipment, Furniture and Fixtures, Shipping Vessels;
Other types of lending collateral such as trading receivables.
The credit quality of assets is monitored regularly and reported to senior management and the Board on a quarterly
basis. In addition, high risk exposures are reported to senior management monthly. Any sudden credit events are
promptly escalated to senior risk and business managers.
At 2014 year-end 99% (2013: 93%) of loans and advances to banks in the Group comprise of balances with fellow
Citigroup entities and are therefore uncollateralised.

CITIBANK INTERNATIONAL LIMITED
NOTES TO THE FINANCIAL STATEMENTS
99
37. Financial instruments and risk management (continued)
Credit risk (continued)
Credit quality – Trading portfolio
The credit quality of the Group’s financial assets is maintained by adherence to Citigroup policies on the provision of
credit to counterparties. The Group monitors the credit ratings of its counterparties with the table below presenting an
analysis of the Group’s trading portfolio of European commercial paper, Corporate bonds and Government bonds by
rating agency designation based on Standard & Poor’s or Moody’s ratings as at 31 December:
Trading portfolio
Loans and
advances to
customers
European
commercial
paper
Corporate
bonds
Government
bonds
%
2014
%
2014
%
2014
%
2014
AAA to AA- - 99 44 -
A+ to A- - 1 53 -
Lower than A- - - 3 100
Unrated 100 - - -
100 100 100 100
2013 2013 2013 2013
AAA to AA- - 84 37 -
A+ to A- - 16 19 -
Lower than A- - - 15 100
Unrated 100 - 29 -
100 100 100 100
In 2014 derivative financial assets comprise 82% (2013: 94%) graded within AA+ to A-.
Credit quality – Corporate lending
Citigroup has established a risk management process to monitor, evaluate and manage the principal risks associated
with its corporate loan portfolio. The Business Credit Officer, as part of the approval and monitoring of a facility, has
responsibility for assessing the need for and the quality of any collateral provided.
As part of its risk management process, Citigroup assigns numeric risk ratings to its Corporate loan facilities based on
quantitative and qualitative assessments of the obligor and facility. These risk ratings are reviewed at least annually
or more often if material events related to the obligor or facility.
Factors considered in assigning the risk ratings include:
financial condition of the obligor;
qualitative assessment of management and strategy;
amount and sources of repayment;
amount and type of collateral and guarantee arrangements;
amount and type of any contingencies associated with the obligor; and
the obligor’s industry and geography.
The obligor risk ratings are defined by ranges of default probabilities. The facility risk ratings are defined by ranges
of loss norms, which are the product of the probability of default and the loss given default. The investment grade
rating categories are similar to the category BBB-/Baa3 and above as defined by S&P and Moody’s. Loans classified
according to the US bank regulatory definitions as special mention, substandard and doubtful will have risk ratings
within the non-investment grade categories.
CITIBANK INTERNATIONAL LIMITED
NOTES TO THE FINANCIAL STATEMENTS
100
37. Financial instruments and risk management (continued)
Credit risk (continued)
Forbearance, standstill, reservation of rights and similar agreements are put in place in certain circumstances where
Citi and the borrower are negotiating a loan restructuring. Once completed, Citi will assess whether the restructuring
is a Troubled Debt Restructuring (TDR).
The restructuring of a facility is considered to be a TDR when the debtor is experiencing financial difficulties and Citi
grants a concession to the debtor that it would not otherwise consider. A TDR may result from a variety of actions
taken by Citi, such as the receipt of assets or a new or restructured facility in partial or full satisfaction of a facility or
a modification of the terms of the existing facility. Citi has granted a concession to a debtor for example, if the yield
of the modified facility is lower than the contractual yield prior to the restructuring and/or the yield on the modified
loan is below a market yield for the relevant tenor and credit risk.
TDR excludes loans that have been granted a temporary concession, restructured loans with new terms equal or more
beneficial to Citigroup, renegotiated loans subject to conditions that have not been met as at 31 December and those
loans renegotiated prior to the process for accounting for troubled debt restructuring was established. Within the
Corporate lending assets there are £nil (2013: £nil) of loans which are “past due” but have not been impaired.
For disclosure purposes the bank regulatory definitions have been used, formulated on the facility risk ratings
described above. A description of the classifications is provided below.
Pass A pass facility has no evident weakness, marginal risk or low loss severity and is adequately
protected by the obligor’s current sound worth and paying capacity of the obligor.
Special mention A Special mention asset has potential weaknesses that deserve management’s close attention.
Substandard The substandard classification is made up of three sub categories:
- Substandard A substandard asset is inadequately protected by the current worth and paying capacity of the
obligor or of the collateral pledged, if any.
- Doubtful An asset classified doubtful has all the weaknesses inherent in one classified substandard
with the added characteristic that the weaknesses make collection or liquidation in full, on the
basis of currently existing facts, conditions, and values, highly questionable and improbable.
- Loss Assets classified “loss” are considered uncollectible and of such little value that their
continuance as bankable assets is not warranted.
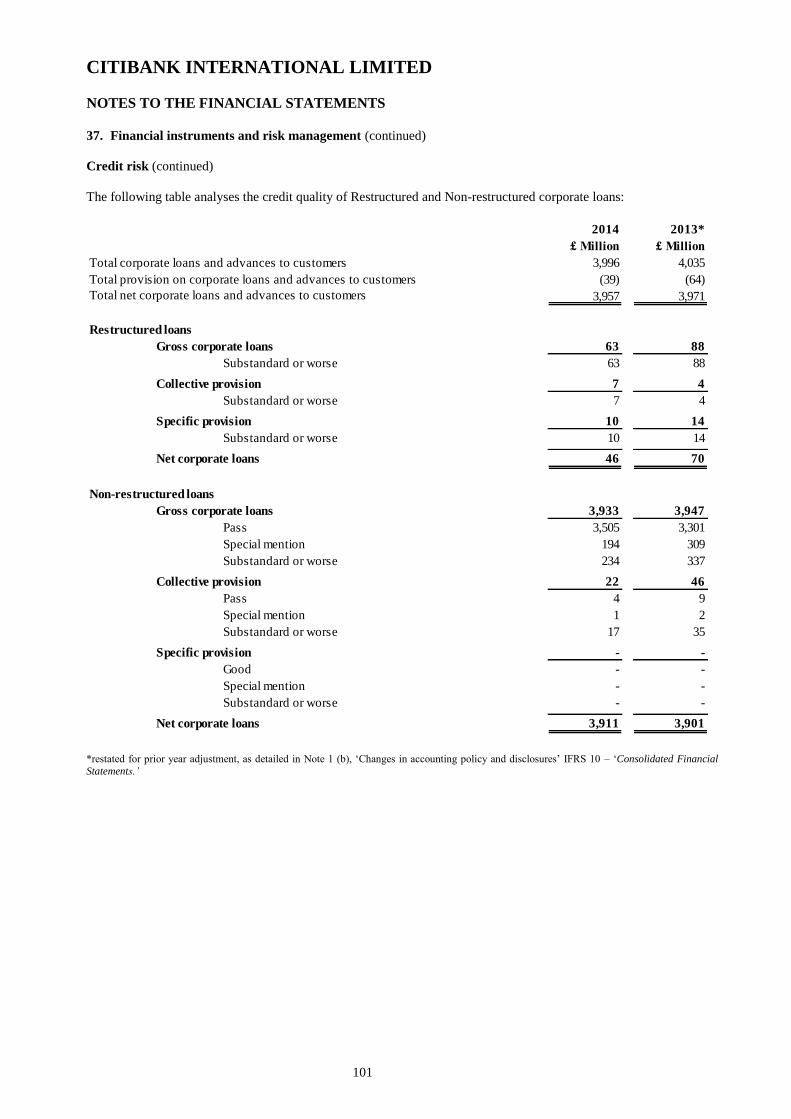
CITIBANK INTERNATIONAL LIMITED
NOTES TO THE FINANCIAL STATEMENTS
101
37. Financial instruments and risk management (continued)
Credit risk (continued)
The following table analyses the credit quality of Restructured and Non-restructured corporate loans:
2014
£ Million
2013*
£ Million
Total corporate loans and advances to customers 3,996 4,035
Total provision on corporate loans and advances to customers (39) (64)
Total net corporate loans and advances to customers 3,957 3,971
Restructured loans
Gross corporate loans 63 88
Substandard or worse 63 88
Collective provision 7 4
Substandard or worse 7 4
Specific provision 10 14
Substandard or worse 10 14
Net corporate loans 46 70
Non-restructured loans
Gross corporate loans 3,933 3,947
Pass 3,505 3,301
Special mention 194 309
Substandard or worse 234 337
Collective provision 22 46
Pass 4 9
Special mention 1 2
Substandard or worse 17 35
Specific provision - -
Good - -
Special mention - -
Substandard or worse - -
Net corporate loans 3,911 3,901
*restated for prior year adjustment, as detailed in Note 1 (b), ‘Changes in accounting policy and disclosures’ IFRS 10 – ‘Consolidated Financial
Statements.’
CITIBANK INTERNATIONAL LIMITED
NOTES TO THE FINANCIAL STATEMENTS
102
37. Financial instruments and risk management (continued)
Credit risk (continued)
Credit quality – Consumer lending
Credit authority levels, the delegation process, approval processes for portfolios, product approvals, and other types of
required approvals and responsibilities are defined in Global Consumer Credit and Fraud Risk Policies. These
policies establish a consistent set of standards for the appointment of Credit Officers and Senior Credit Officers,
streamline the approval process, create auditable policies, and seek to ensure the accountability and responsibility of
risk management staff. The Country Credit Officer prepares credit strategy in collaboration with the Country
Business Manager, which is reviewed by the Regional Senior Credit Officer.
There is an established set of measures, procedures and policies that aims at monitoring results of consumer
portfolios. These include:
comparison of indicators to past performance;
country Credit Officer reviews;
stress tests; and
mandates and approval authorities.
In addition to these procedures, each business has credit benchmarks that set out its short and long-term expectations.
The credit quality of Local Consumer Lending assets is measured and reported on a days past due model. This model
identifies the gross value of balances which are current (i.e. are not yet past due) and those balances which are past
due depending on how many days past due the balance is.

CITIBANK INTERNATIONAL LIMITED
NOTES TO THE FINANCIAL STATEMENTS
103
37. Financial instruments and risk management (continued)
Credit risk (continued)
Group and Company
Charge and
credit card
debtors
Consumer
loans Total
Charge and
credit card
debtors
Consumer
loans Total
£ Million £ Million £ Million £ Million £ Million £ Million
Gross amount - 7 7 190 20 210
Carrying amount - 6 6 122 16 138
Individually assessed
1 - 119 days past due - - - 2 4 6
120 - 179 days past due - - - - - -
Gross amount - - - 2 4 6
Individually assessed allowance for
loans and advances - - - (1) (3) (4)
Carrying amount - - - 1 1 2
Collectively assessed
Current - 6 6 161 11 172
1 - 119 days past due - - - 23 5 28
120 - 180 days past due - - - 4 - 4
Gross amount - 6 6 188 16 204
Collectively assessed allowance for
loans and advances - (1) (1) (67) (1) (68)
Carrying amount - 5 5 121 15 136
Neither past due nor impaired
Current - 1 1 - - -
Total carrying amount - 6 6 122 16 138
2014 2013
The past due model shows that 100% (2013: 82%) of the gross balance is current, nil% (2013: 16%) is 1 – 119 days
past due, and nil% (2013: 2%) is greater than 120 days past due.
Current loans in the table above are considered neither past due nor impaired.
Due to the sale of the Greece Consumer Business there is no longer any collectively assessed allowance for loans and
advances (2013: £55 million) for loans in Greece where significant uncertainty and challenges persist in the operating
environment.
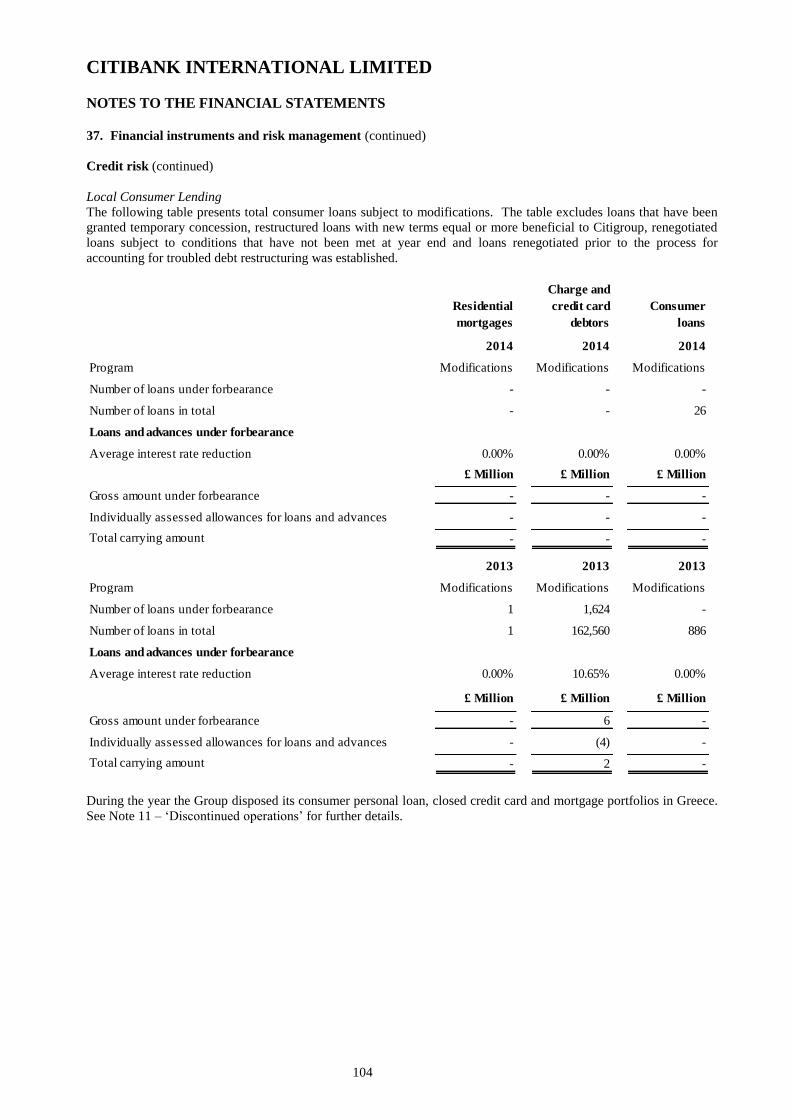
CITIBANK INTERNATIONAL LIMITED
NOTES TO THE FINANCIAL STATEMENTS
104
37. Financial instruments and risk management (continued)
Credit risk (continued)
Local Consumer Lending
The following table presents total consumer loans subject to modifications. The table excludes loans that have been
granted temporary concession, restructured loans with new terms equal or more beneficial to Citigroup, renegotiated
loans subject to conditions that have not been met at year end and loans renegotiated prior to the process for
accounting for troubled debt restructuring was established.
Residential
mortgages
Charge and
credit card
debtors
Consumer
loans
2014 2014 2014
Program Modifications Modifications Modifications
Number of loans under forbearance - - -
Number of loans in total - - 26
Loans and advances under forbearance
Average interest rate reduction 0.00% 0.00% 0.00%
£ Million £ Million £ Million
Gross amount under forbearance - - -
Individually assessed allowances for loans and advances - - -
Total carrying amount - - -
2013 2013 2013
Program Modifications Modifications Modifications
Number of loans under forbearance 1 1,624 -
Number of loans in total 1 162,560 886
Loans and advances under forbearance
Average interest rate reduction 0.00% 10.65% 0.00%
£ Million £ Million £ Million
Gross amount under forbearance - 6 -
Individually assessed allowances for loans and advances - (4) -
Total carrying amount - 2 -
During the year the Group disposed its consumer personal loan, closed credit card and mortgage portfolios in Greece.
See Note 11 – ‘Discontinued operations’ for further details.
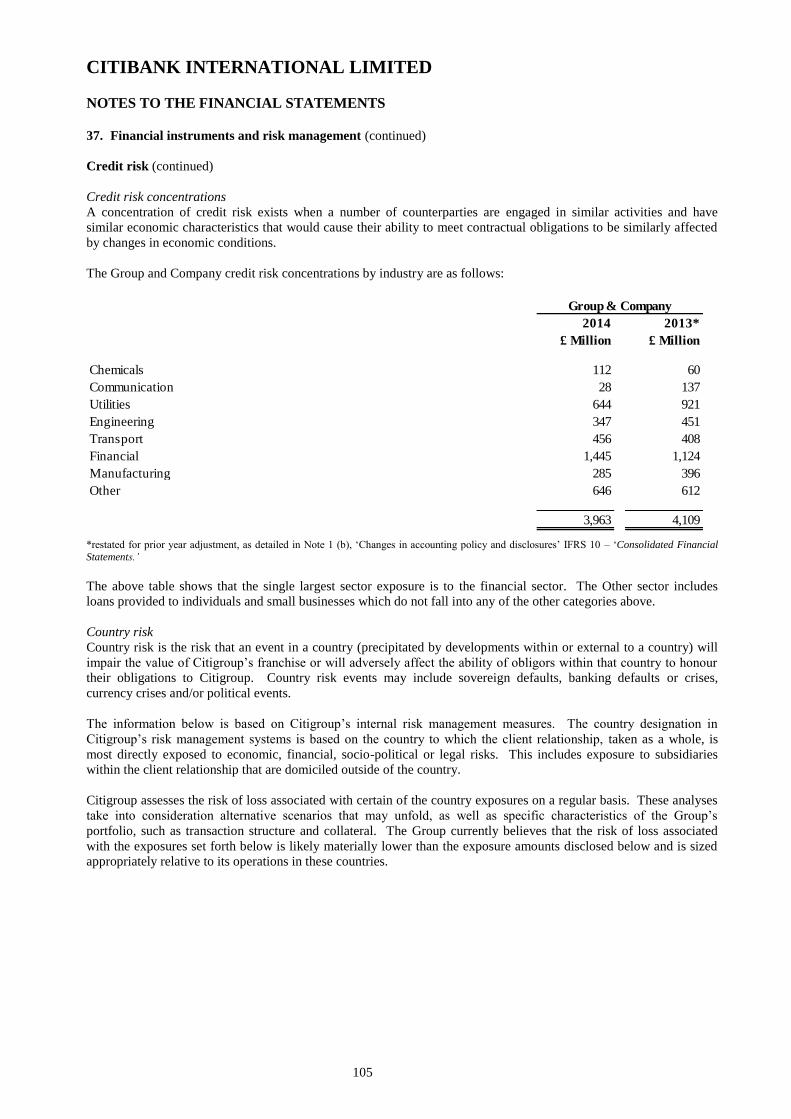
CITIBANK INTERNATIONAL LIMITED
NOTES TO THE FINANCIAL STATEMENTS
105
37. Financial instruments and risk management (continued)
Credit risk (continued)
Credit risk concentrations
A concentration of credit risk exists when a number of counterparties are engaged in similar activities and have
similar economic characteristics that would cause their ability to meet contractual obligations to be similarly affected
by changes in economic conditions.
The Group and Company credit risk concentrations by industry are as follows:
2014
£ Million
2013*
£ Million
Chemicals 112 60
Communication 28 137
Utilities 644 921
Engineering 347 451
Transport 456 408
Financial 1,445 1,124
Manufacturing 285 396
Other 646 612
3,963 4,109
Group & Company
*restated for prior year adjustment, as detailed in Note 1 (b), ‘Changes in accounting policy and disclosures’ IFRS 10 – ‘Consolidated Financial
Statements.’
The above table shows that the single largest sector exposure is to the financial sector. The Other sector includes
loans provided to individuals and small businesses which do not fall into any of the other categories above.
Country risk
Country risk is the risk that an event in a country (precipitated by developments within or external to a country) will
impair the value of Citigroup’s franchise or will adversely affect the ability of obligors within that country to honour
their obligations to Citigroup. Country risk events may include sovereign defaults, banking defaults or crises,
currency crises and/or political events.
The information below is based on Citigroup’s internal risk management measures. The country designation in
Citigroup’s risk management systems is based on the country to which the client relationship, taken as a whole, is
most directly exposed to economic, financial, socio-political or legal risks. This includes exposure to subsidiaries
within the client relationship that are domiciled outside of the country.
Citigroup assesses the risk of loss associated with certain of the country exposures on a regular basis. These analyses
take into consideration alternative scenarios that may unfold, as well as specific characteristics of the Group’s
portfolio, such as transaction structure and collateral. The Group currently believes that the risk of loss associated
with the exposures set forth below is likely materially lower than the exposure amounts disclosed below and is sized
appropriately relative to its operations in these countries.
CITIBANK INTERNATIONAL LIMITED
NOTES TO THE FINANCIAL STATEMENTS
106
37. Financial instruments and risk management (continued)
Credit risk (continued)
As Citi’s pan-European bank, passported under the European Union’s Banking Consolidation Directive, the Group is
predominantly oriented towards the large corporate sector in Western Europe. As a result of the Group’s lending
activities in the region, the Group has a concentration of exposure to France primarily through lending to large utility,
healthcare, media and auto companies, and to Spain primarily through lending to large utility, telecommunication
companies and local banks. Risk management continues to monitor and manage these exposures, employing
appropriate mitigation techniques.
The Group’s long history in Greece has led to a large corporate, primarily shipping industry based presence in the
country and prior to 2014 a consumer presence. Primarily this relates to international shipping where risk is deemed
to be offshore and not related to the strength of the domestic economy. During 2014, Citi sold its consumer banking
business and Diners Club of Greece credit card operations in Greece.
The sovereign entities of all the GIIPS countries as well as the financial institutions and corporations domiciled in
these countries, are important clients both to the Group and to the global Citigroup franchise. Citigroup fully expects
to maintain its presence in these markets to service all of its global customers. The Group’s exposure in these
countries may therefore vary over time, based upon its franchise, client needs and transaction structures.
The economic and fiscal situations of several European countries remain fragile, and geopolitical tensions throughout
the region, including in Russia, have added to the uncertainties. Fiscal and monetary actions, or expected actions,
throughout the region have further impacted the global financial markets. While concerns relating to sovereign
defaults or a partial or complete break-up of the European Monetary Union (EMU), including potential accompanying
redenomination risks and uncertainties, seemed to have abated during 2014, such concerns have resurfaced with the
election of a new government in Greece in January 2015.
Russia's engagement in recent events in Ukraine has continued to be a cause of concern to investors in Russian assets
and parties doing business in Russia or with Russian entities. There is a potential risk of wider repercussions on the
Russian economy and trade and investment as well as the imposition of additional sanctions, such as asset freezes,
involving Russia or against Russian entities, business sectors, individuals or otherwise.
The tables below outline the Group’s exposures to the large corporate sector in these focus countries as of
31 December, excluding retail, small businesses and Citi Private Bank exposures:
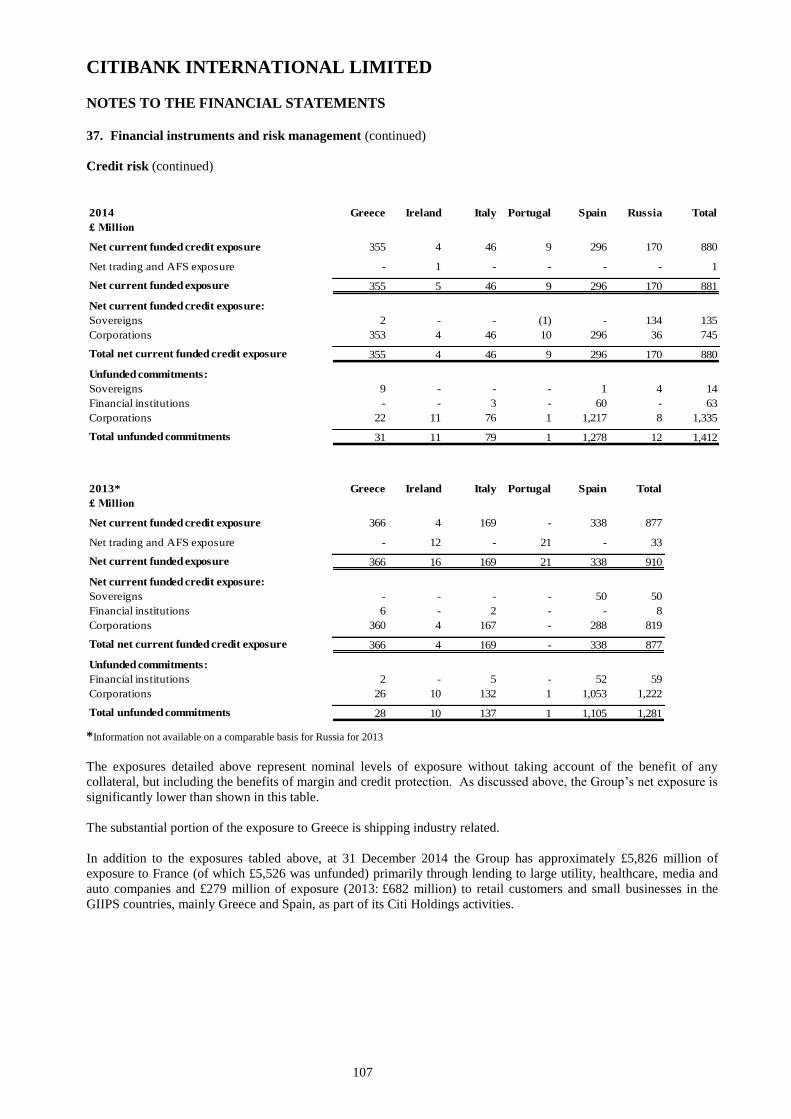
CITIBANK INTERNATIONAL LIMITED
NOTES TO THE FINANCIAL STATEMENTS
107
37. Financial instruments and risk management (continued)
Credit risk (continued)
2014 Greece Ireland Italy Portugal Spain Russia Total
£ Million
Net current funded credit exposure 355 4 46 9 296 170 880
Net trading and AFS exposure - 1 - - - - 1
Net current funded exposure 355 5 46 9 296 170 881
Net current funded credit exposure:
Sovereigns 2 - - (1) - 134 135
Corporations 353 4 46 10 296 36 745
Total net current funded credit exposure 355 4 46 9 296 170 880
Unfunded commitments:
Sovereigns 9 - - - 1 4 14
Financial institutions - - 3 - 60 - 63
Corporations 22 11 76 1 1,217 8 1,335
Total unfunded commitments 31 11 79 1 1,278 12 1,412
2013* Greece Ireland Italy Portugal Spain Total
£ Million
Net current funded credit exposure 366 4 169 - 338 877
Net trading and AFS exposure - 12 - 21 - 33
Net current funded exposure 366 16 169 21 338 910
Net current funded credit exposure:
Sovereigns - - - - 50 50
Financial institutions 6 - 2 - - 8
Corporations 360 4 167 - 288 819
Total net current funded credit exposure 366 4 169 - 338 877
Unfunded commitments:
Financial institutions 2 - 5 - 52 59
Corporations 26 10 132 1 1,053 1,222
Total unfunded commitments 28 10 137 1 1,105 1,281
*Information not available on a comparable basis for Russia for 2013
The exposures detailed above represent nominal levels of exposure without taking account of the benefit of any
collateral, but including the benefits of margin and credit protection. As discussed above, the Group’s net exposure is
significantly lower than shown in this table.
The substantial portion of the exposure to Greece is shipping industry related.
In addition to the exposures tabled above, at 31 December 2014 the Group has approximately £5,826 million of
exposure to France (of which £5,526 was unfunded) primarily through lending to large utility, healthcare, media and
auto companies and £279 million of exposure (2013: £682 million) to retail customers and small businesses in the
GIIPS countries, mainly Greece and Spain, as part of its Citi Holdings activities.
CITIBANK INTERNATIONAL LIMITED
NOTES TO THE FINANCIAL STATEMENTS
108
37. Financial instruments and risk management (continued)
Credit risk (continued)
The overall exposure to GIIPS countries has seen a significant decrease over the last year both within the wholesale
and retail sectors as described above.
Operational risk (unaudited)
Operational risk is the risk of loss resulting from inadequate or failed internal processes, systems or human factors, or
from external events. It includes the reputation and franchise risk associated with business practices or market
conduct in which Citigroup is involved. Operational risk is inherent in the Group’s business activities, as well as its
internal processes that support those business activities, and can result in losses arising from events related to the
following, among others:
fraud, theft and unauthorised activities;
employment practices and workplace environment;
clients, products and business practices;
physical assets and infrastructure; and
execution, delivery and process management.
Where applicable, losses stemming from fines and regulatory penalties are included in the relevant categories above,
which are consistent with the Basel framework.
Framework
Citigroup’s global operational risk is managed through an overall framework designed to balance strong corporate
oversight with well-defined independent risk management. This framework includes:
recognised ownership of the risk by the businesses;
oversight by Citigroup’s independent risk management and control functions; and
independent assessment by Citigroup’s Internal Audit function.
The goal is to keep operational risk at appropriate levels relative to the characteristics of the Group’s businesses, the
markets in which it operates, its capital and liquidity, and the competitive, economic and regulatory environment.
To anticipate, mitigate and control operational risk, Citigroup maintains a system of policies and has established a
consistent framework for monitoring, assessing and communicating operational risks and the overall effectiveness of
the internal control environment across Citigroup. As part of this framework, Citigroup has established a “Manager’s
Control Assessment” (MCA) program to help managers’ self-assess key operational risks and controls and identify
and address weaknesses in the design and/or effectiveness of internal controls that mitigate significant operational
risks. MCAs are in place for all the major business lines and control areas impacting the Group.
As noted above, each major business segment must implement an operational risk process consistent with the
requirements of this framework. The process for operational risk management includes the following steps:
identify and assess key operational risks;
design controls to mitigate identified risks;
establish key risk and control indicators;
implement a process for early problem recognition and timely escalation;
produce a comprehensive operational risk report; and
ensure that sufficient resources are available to actively improve the operational risk environment and mitigate
emerging risks.
As new products and business activities are developed, processes are designed, modified or sourced through
alternative means and operational risks are considered.
In addition, Operational Risk Management, within Citi’s Franchise Risk and Strategy group, proactively assists the
businesses, operations and technology and the other independent control groups in enhancing the effectiveness of
controls and managing operational risks across products, business lines and regions, and facilitates the management of
operational risk at a Citigroup and Group level.
CITIBANK INTERNATIONAL LIMITED
NOTES TO THE FINANCIAL STATEMENTS
109
37. Financial instruments and risk management (continued)
Operational risk (unaudited) (continued)
Operational risk is part of the Group’s defined risk appetite framework supplemented with regular reporting and
updates to the senior management and the Board of Directors.
Measurement
To support advanced capital modelling and management, each business is required to capture relevant operational risk
event information. An enhanced version of the Citigroup risk capital model for operational risk has been developed
and applied across the major business segments. The PRA has approved this model, including the associated capital
allocation, for use within the Group as an “Advanced Measurement Approach.” It uses a combination of internal and
external loss data to support statistical modelling of capital requirement estimates, which are then adjusted to
incorporate qualitative aspects of the operational risk and control environment.
To enhance its operational risk management the Group has implemented a forward looking scenario analysis to
identify and quantify emerging operational risks, through a systematic process of obtaining opinions from business
managers and risk management experts to devise reasoned assessments of the likelihood and loss impact of plausible,
high severity operational risk losses. This development has been integrated into the operational risk capital assessment
for the Group.
Anti Money Laundering and Sanctions
Local and international AML (Anti-Money Laundering) and Sanctions requirements impact the activities carried out
by CIL and their clients. To facilitate Citi’s overall compliance with these requirements, including recent and
upcoming changes, Citi has developed an enhanced control infrastructure around activities that may be affected by
applicable Sanctions regimes; Regulatory expectations on CIL with respect to Anti Money Laundering controls may
continue to cause elevated costs to CIL, particularly those associated with customer due diligence and suspicious
activity monitoring, as Citi continues to implement enhancements in these programme areas.
Conduct Risk
Conduct risk is the risk that Citi’s employees or agents may – intentionally or through negligence – harm customers,
clients, or the integrity of the markets, and thereby the integrity of the firm. Conduct risk is not limited to specific
businesses or functions, but rather spans all conduct and behaviour at the firm. Consistent with Citi’s commitment to
elevate the focus on conduct risks Citi has continued to enhance the MCA process to enrich conduct risk
considerations. In 2014, Citi proactively established a global Conduct Risk Program which is designed to identify,
manage, minimize and mitigate Citi’s exposure to conduct risk and resulted in issuance of a Citi-wide Conduct Risk
Policy. The Conduct Risk Policy describes framework through which Citi manages, minimizes, and mitigates its
significant conduct risks, and the responsibilities of each of the three lines of defence for complying with the policy.
Client Assets Sourcebook (CASS)
The FCA’s Client Assets Sourcebook (CASS) sets out the requirements with which firms must comply when holding
or controlling client assets (client money and safe custody assets). Due to recent market activity and high profile
insolvencies the FCA has published changes to its CASS rules, which all firms are expected to implement and be fully
compliant with by 1 June 2015.
The UK rules are designed to help ensure that clients’ assets are protected and returned to clients within a reasonable
timeframe in the event of a firm’s failure and that the UK market is regarded as a safe place to conduct business. The
rules also prescribe requirements around organisational arrangements, controls and governance. In line with this, Citi
has a CASS Oversight Officer and continues to develop CASS governance arrangements and is working towards the
implementation of the new CASS rules coming into force on 1 June 2015, which may result in elevated costs to the
Group.

CITIBANK INTERNATIONAL LIMITED
NOTES TO THE FINANCIAL STATEMENTS
110
37. Financial instruments and risk management (continued)
Operational risk (unaudited) (continued)
Operations of Shared Service Centres
The operations of a number of Citi’s business support functions, including Finance, Risk Architecture, Treasury,
Information Technology Support of various systems and Middle Office Settlements are based at two Citigroup
Service Centres (CSCs) established by Citi in Poland and Hungary, the staff of which are employed by the Group.
The growth in the CSCs is closely monitored due to the potential operational risks caused by disruption in timely
reporting, flow of information, high rate of attrition or other issues.
The growth in the CSCs is closely monitored due to the potential operational risks caused by disruption in timely
reporting, flow of information, high rate of attrition or other issues.
The accountability of the management of the CSC is ensured through their reporting into the Country Business Risk,
Compliance and Controls Committee (BRCC) as well as a dedicated Group’s Service Centre BRCC. The operation of
the Regional Outsourcing Oversight Committee and Regional Outsourcing Approvals Committee also support the
management of the CSCs.
Outsourcing Risk
Third parties with which Citi does business may also be sources of cybersecurity or other technological risks. Citi
outsources certain functions, such as uploading content on customer-facing websites, and developing software for new
products and services. These relationships allow for the storage and processing of customer information by third-
party hosting of or access to Citi websites, which could result in service disruptions or website defacements, and the
potential to introduce vulnerable code, resulting in security breaches impacting Citi customers. While Citi engages in
certain actions to reduce the exposure resulting from outsourcing, such as performing onsite security control
assessments, limiting third-party access to the least privileged level necessary to perform job functions and restricting
third-party processing to systems stored within Citi’s data centres, ongoing threats may result in unauthorized access,
loss or destruction of data or other cyber incidents with increased costs and consequences to Citi such as those
discussed above.
Furthermore, because financial institutions are becoming increasingly interconnected with central agents, exchanges
and clearing houses, including as a result of the derivatives reforms over the last few years, Citi has increased
exposure to operational failure or cyber attacks through third parties.
Information about operational risk, historical losses and the control environment, is reported and summarised for the
Audit Committee, Risk Committee, senior management and Directors.
Regulatory risk and developments
Regulatory risk is the risk of failing to comply with regulatory requirements, regulatory change or regulators’
expectations. Failing to properly manage regulatory risk may result in regulatory sanctions and increased reputational
and franchise risk.
As the regulatory environment continues to evolve, Citigroup and the Group remain committed to implementing new
regulations and to ensuring continuous compliance with forthcoming regulatory requirements. The most significant
developments assessed by the Group are:
Capital Requirements Directive (CRD IV);
Bank Recovery and Resolution Directive;
European Market Infrastructure regulation (EMIR).

CITIBANK INTERNATIONAL LIMITED
NOTES TO THE FINANCIAL STATEMENTS
111
37. Financial instruments and risk management (continued)
Operational risk (unaudited) (continued)
Implementation of CRD IV
The EU CRD IV legislative package includes the Capital Requirements Regulation (CRR) and the Capital
Requirements Directive (CRD) as approved by the European Parliament on 16 April 2013 and is directly applicable to
banks and financial firms which are prudentially regulated in the United Kingdom. It became effective on 1 January
2014 and has introduced significant quantitative and qualitative changes to capital adequacy and the related
governance processes throughout the financial sector in the European Union. The quantitative implications of this
include higher capital requirements associated with counterparty credit risk and the introduction of additional capital
buffers to cover cyclical and systemic risks as well as capital conservation concerns. A number of these requirements
will be introduced on a phased basis between 2014 and 2019. There are also qualitative implications, such as more
reliance on higher quality capital and expectations of improved risk management processes.
Bank Recovery and Resolution Directive
There is an increased focus from local regulators on ensuring that subsidiaries and branches of large international
financial services companies are adequately capitalised and managed locally, such that in the event of a local market
disruption they would be able to sustain their business and cover any losses incurred without an exaggerated reliance
on offshore parental financial aid.
As of 1 January 2015 all EU Member States have to apply a single rulebook for the resolution of banks and large
investment firms, as prescribed by the Bank Recovery and Resolution Directive, designed to harmonise and improve
the tools for dealing with bank crises across the EU.
Additionally, the Group has been identified as a Material Legal Entity in Citigroup’s Resolution Plan. Citigroup
defines Material Legal Entities as those legal entities, including subsidiaries and foreign offices, with business lines,
including associated operations, services, functions and support that upon failure would result in a material loss of
revenue, profit or franchise value of Citi. Citigroup’s Resolution Plan, which can be found at
http://www.federalreserve.gov/bankinforeg/resolution-plans.htm.
European Market Infrastructure Regulation (EMIR)
Similarly to the Dodd-Frank Act in the US, the EU’s EMIR regulation introduces mandatory central clearing of
transactions with certain counterparties that will impact the Group, with potential liquidity, expense and capital
considerations. The regulation requires all counterparties to report details of contracts to an authorised trade repository
(TR). Exposure to Central Counterparty Clearing Houses will need to be carefully monitored and managed as any
other relationship within the Group’s credit risk management framework. Final rules for client clearing of OTC
derivatives and the implications of mandatory margin requirements for derivatives not cleared will continue to be
closely monitored. The Group is currently engaged in system developments to ensure implementation readiness once
the final phases of the regulation come into effect.
Capital management
The Group's approach to capital management is driven by strategic and organisational requirements, taking into
account the regulatory, economic and commercial environment.
It is the Group’s objective to maintain a strong capital base to support the business and meet regulatory capital
requirements at all times. The composition and amount of capital held will be commensurate with the regulations in
force, including the new Capital Requirements Directive IV (CRD IV) which came into effect on 1 January 2014.
Capital forecasts are prepared and take into account strategic growth plans, the Internal Capital Adequacy Assessment
Process (ICAAP), seasonal activity, the capital plan for the Group and changes in the future regulatory environment.
Capital forecasts are updated monthly, and reviewed monthly through the UK ALCO and quarterly at the Basel
Governance Oversight Committee meetings.
The Group maintains an internal capital buffer in excess of the PRA’s minimum regulatory capital requirements.
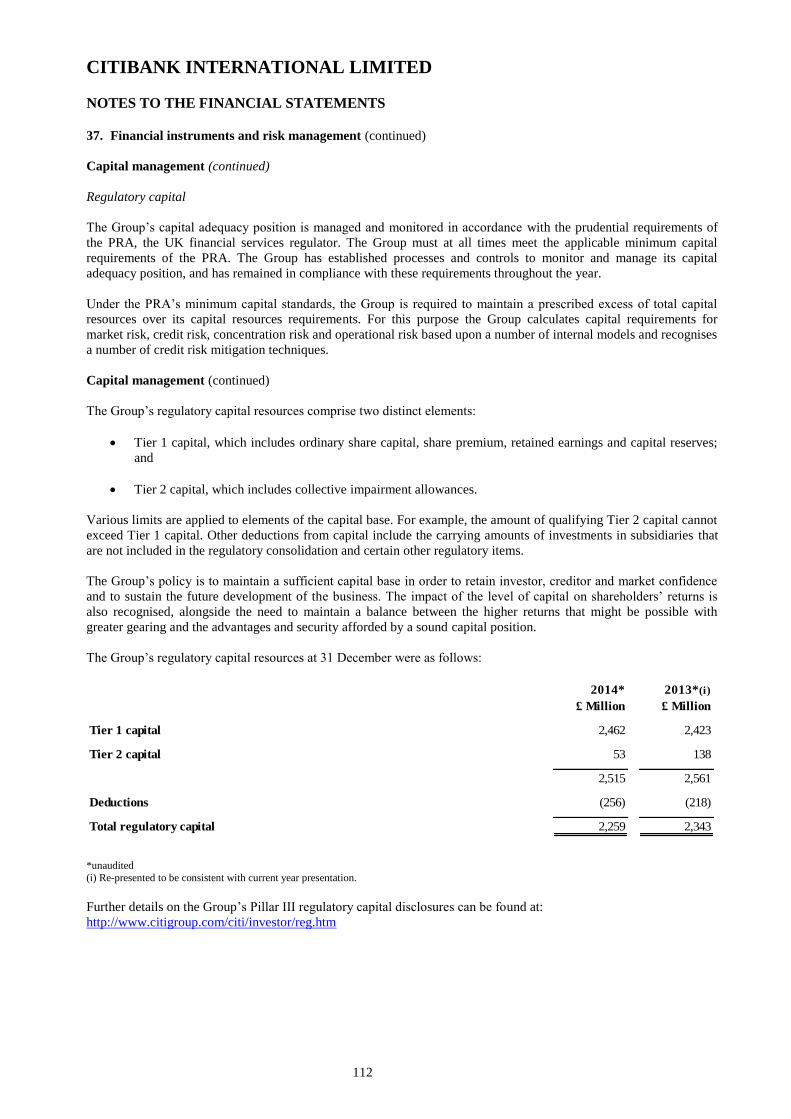
CITIBANK INTERNATIONAL LIMITED
NOTES TO THE FINANCIAL STATEMENTS
112
37. Financial instruments and risk management (continued)
Capital management (continued)
Regulatory capital
The Group’s capital adequacy position is managed and monitored in accordance with the prudential requirements of
the PRA, the UK financial services regulator. The Group must at all times meet the applicable minimum capital
requirements of the PRA. The Group has established processes and controls to monitor and manage its capital
adequacy position, and has remained in compliance with these requirements throughout the year.
Under the PRA’s minimum capital standards, the Group is required to maintain a prescribed excess of total capital
resources over its capital resources requirements. For this purpose the Group calculates capital requirements for
market risk, credit risk, concentration risk and operational risk based upon a number of internal models and recognises
a number of credit risk mitigation techniques.
Capital management (continued)
The Group’s regulatory capital resources comprise two distinct elements:
Tier 1 capital, which includes ordinary share capital, share premium, retained earnings and capital reserves;
and
Tier 2 capital, which includes collective impairment allowances.
Various limits are applied to elements of the capital base. For example, the amount of qualifying Tier 2 capital cannot
exceed Tier 1 capital. Other deductions from capital include the carrying amounts of investments in subsidiaries that
are not included in the regulatory consolidation and certain other regulatory items.
The Group’s policy is to maintain a sufficient capital base in order to retain investor, creditor and market confidence
and to sustain the future development of the business. The impact of the level of capital on shareholders’ returns is
also recognised, alongside the need to maintain a balance between the higher returns that might be possible with
greater gearing and the advantages and security afforded by a sound capital position.
The Group’s regulatory capital resources at 31 December were as follows:
2014* 2013*(i)
£ Million £ Million
Tier 1 capital 2,462 2,423
Tier 2 capital 53 138
2,515 2,561
Deductions (256) (218)
Total regulatory capital 2,259 2,343
*unaudited
(i) Re-presented to be consistent with current year presentation.
Further details on the Group’s Pillar III regulatory capital disclosures can be found at:
http://www.citigroup.com/citi/investor/reg.htm
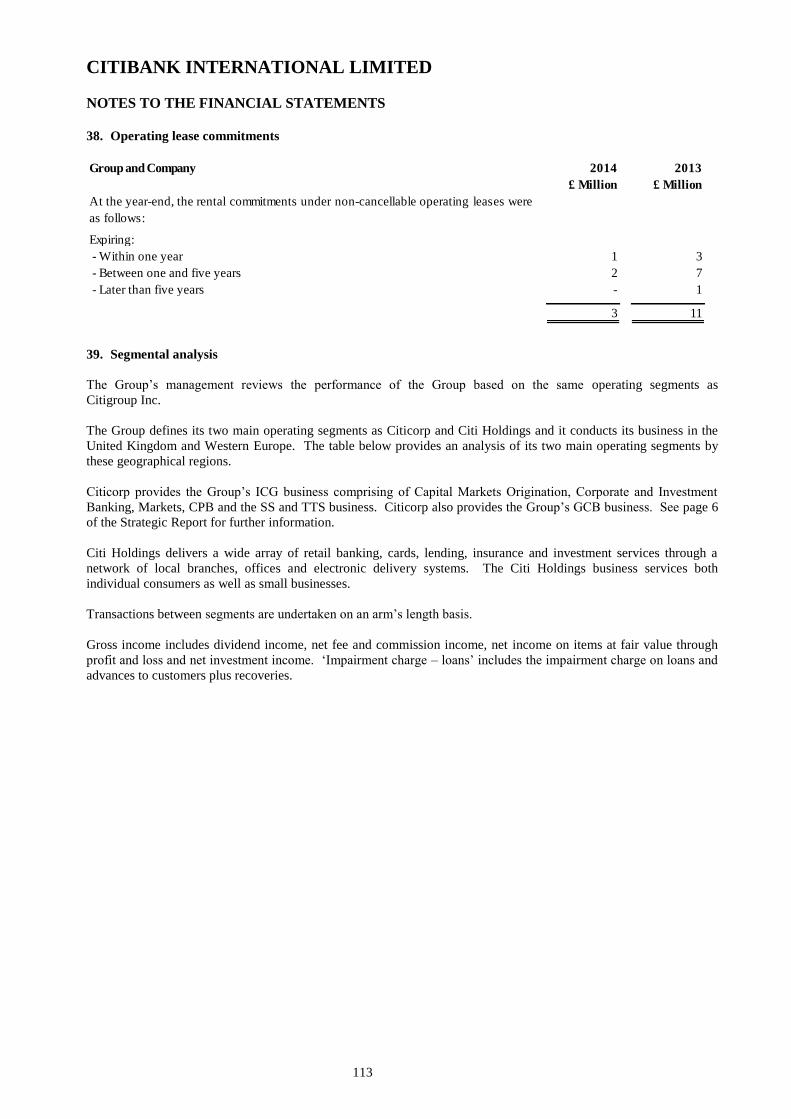
CITIBANK INTERNATIONAL LIMITED
NOTES TO THE FINANCIAL STATEMENTS
113
38. Operating lease commitments
Group and Company 2014
£ Million
2013
£ Million
At the year-end, the rental commitments under non-cancellable operating leases were
as follows:
Expiring:
- Within one year 1 3
- Between one and five years 2 7
- Later than five years - 1
3 11
39. Segmental analysis
The Group’s management reviews the performance of the Group based on the same operating segments as
Citigroup Inc.
The Group defines its two main operating segments as Citicorp and Citi Holdings and it conducts its business in the
United Kingdom and Western Europe. The table below provides an analysis of its two main operating segments by
these geographical regions.
Citicorp provides the Group’s ICG business comprising of Capital Markets Origination, Corporate and Investment
Banking, Markets, CPB and the SS and TTS business. Citicorp also provides the Group’s GCB business. See page 6
of the Strategic Report for further information.
Citi Holdings delivers a wide array of retail banking, cards, lending, insurance and investment services through a
network of local branches, offices and electronic delivery systems. The Citi Holdings business services both
individual consumers as well as small businesses.
Transactions between segments are undertaken on an arm’s length basis.
Gross income includes dividend income, net fee and commission income, net income on items at fair value through
profit and loss and net investment income. ‘Impairment charge – loans’ includes the impairment charge on loans and
advances to customers plus recoveries.

CITIBANK INTERNATIONAL LIMITED
NOTES TO THE FINANCIAL STATEMENTS
114
39. Segmental analysis (continued)
United
Kingdom
Western
Europe Total
United
Kingdom
Western
Europe Total
United
Kingdom
Western
Europe Total
£ Million £ Million £ Million £ Million £ Million £ Million £ Million £ Million £ Million
Gross income 300 259 559 5 - 5 305 259 564
Interest income 142 20 162 1 - 1 143 20 163
Interest expense (48) (7) (55) (3) - (3) (51) (7) (58)
Profit/(loss) before tax and
discontinued operations 128 (14) 114 (11) - (11) 117 (14) 103
Income tax (expense)/credit (17) (3) (20) - 1 1 (17) (2) (19)
Profit/(loss) for the year for
continuing operations 111 (17) 94 (11) 1 (10) 100 (16) 84
Segment assets 15,484 5,219 20,703 93 8 101 15,577 5,227 20,804
Total assets 15,484 5,219 20,703 93 8 101 15,577 5,227 20,804
Segment liabilities 11,545 6,604 18,149 1 111 112 11,546 6,715 18,261
Total liabilities 11,545 6,604 18,149 1 111 112 11,546 6,715 18,261
Other segment items excluding discontinued operations:
Gross income from third parties 373 107 480 1 - 1 374 107 481
Capital expenditure (69) (13) (82) - - - (69) (13) (82)
Depreciation 34 4 38 - - - 34 4 38
Impairment (gain)/charge - (16) - (16) 13 - 13 (3) - (3)
Amortisation of intangibles 47 1 48 - - - 47 1 48
2014
Citicorp Citi Holdings Total
United
Kingdom
Western
Europe Total
United
Kingdom
Western
Europe Total
United
Kingdom
Western
Europe Total
£ Million £ Million £ Million £ Million £ Million £ Million £ Million £ Million £ Million
Gross income 369 261 630 (1) 2 1 368 263 631
Interest income 193 37 230 5 - 5 198 37 235
Interest expense (74) (8) (82) (7) - (7) (81) (8) (89)
Profit/(loss) before tax and
discontinued operations 104 (17) 87 (18) (8) (26) 86 (25) 61
Income tax (expense)/credit (54) - (54) (2) (5) (7) (56) (5) (61)
Profit/(loss) for the year for
continuing operations 50 (17) 33 (20) (13) (33) 30 (30) -
Segment assets 13,493 6,366 19,859 213 310 523 13,706 6,676 20,382
Total assets 13,493 6,366 19,859 213 310 523 13,706 6,676 20,382
Segment liabilities 10,953 5,528 16,481 478 1,003 1,481 11,431 6,531 17,962
Total liabilities 10,953 5,528 16,481 478 1,003 1,481 11,431 6,531 17,962
Other segment items excluding discontinued operations:
Gross income from third parties 369 121 490 - 3 3 369 124 493
Capital expenditure (27) (5) (32) - - - (27) (5) (32)
Depreciation 36 3 39 - - - 36 3 39
Impairment charge - loans 10 5 15 6 - 6 16 5 21
Amortisation of intangibles 40 1 41 - - - 40 1 41
Citicorp Citi Holdings Total
2013*
*restated for prior year adjustment, as detailed in Note 1 (b), ‘Changes in accounting policy and disclosures’ IFRS 10 – ‘Consolidated Financial Statements.’
CITIBANK INTERNATIONAL LIMITED
NOTES TO THE FINANCIAL STATEMENTS
115
40. Parent companies
The Company is a wholly owned subsidiary of COHBL, which is incorporated in the Bahamas.
The largest group in which the results of the Group are consolidated is that headed by Citigroup Inc. The audited
consolidated financial statements of Citigroup Inc. are made available to the public annually in accordance with
Securities and Exchange Commission regulations and may be obtained from
www.citigroup.com/citi/corporategovernance/ar.htm.
41. Country-by-country reporting
The information relating to Country-by-Country reporting required by Article 89 of Directive 2013/36/EU (‘Capital
Requirements Directive’), will be published at http://www.citigroup.com/citi/investor/reg.htm.