cities and stability - stanford universityweb.stanford.edu/class/polisci440d/wallace.pdf · cities...
TRANSCRIPT
Cities and Stability: Directing Urbanization, Defining Unrest, and
Distributing Transfers in China
Jeremy Wallace Ph.D. Candidate
Stanford University [email protected]
[This chapter builds on the theory and empirical work presented in the previous chapter, entitled “Cities and Stability: Redistribution, Urbanization, and Autocratic Regime Survival”.] ABSTRACT Recently, the Chinese government has begun subsidizing rural areas after 50 years of taxing them. Most developing non-democratic regimes, on the other hand, are urban-biased, in response to the threat of urban unrest. This chapter demonstrates support for the theory presented in chapter 1 that these pro-rural policies are being implemented in part to mitigate urbanization using Chinese qualitative and quantitative data. First, I present a case study of the Chinese government’s policies to direct and control urbanization from 1949 to the 2005, showing that stability, especially in cities, has long been a dominant concern. Second, I analyze the allocation of fiscal transfers using new sub-national data on instability and migration patterns. I find that transfers are directed to unstable areas and to areas that export labor. Comments are welcome. This is a work in progress. I would like to thank Jean Oi, Jim Fearon, and Matthew Levendusky for assistance. Previous versions of this paper have been presented at the Graduate Student Conference at the Universities Service Centre at the Chinese University of Hong Kong as well as the annual meeting of the American Political Science Association 2007. All errors remain my own.
Wallace – Directing Urbanization, Defining Unrest, and Distributing Transfers in China 1
Introduction
Chongqing was the scene of a traffic accident in December 2005 that took the
lives of three girls. While two families were given RMB 200,000 as compensation for
their loss, the third was only offered RMB 58,000.1 The discrepancy is due to the
family’s household registration or hukou. Despite living in the city for over 10 years, the
third family officially remained rural residents; as compensation in such cases is
determined by average income in one’s official residence, the rewards differed
dramatically.2
As unjust as this may be, it is perhaps not surprising. Social science knows that
policies in developing countries tend to be biased towards urban areas (Lipton 1977;
Bates 1981). This bias makes political sense as city residents – due to their proximity to
each other and to the seat of government – can more easily threaten the government than
people who live in the countryside. Hukou-based discrimination of people from rural
areas in China fits in this framework.
Although the hukou system remains mostly intact, China has recently changed its
fiscal policy to address rural problems, moving away from urban bias. Since 2002, China
has expanded spending on agriculture and rural areas, while at the same time reducing the
tax burden on farmers, addressing the problems of the “three rural issues” (san nong
1 Around US$25,000 and US$7,000 respectively at the time, with a conversion rate at the time of near 8 yuan or RMB (renminbi) to the US dollar. 2 Compensation is based on “average disposable income” in urban areas and “average net income” in rural areas. The facts of the story are from Wang and Zhou 2006. The discrimination is not inherent to the hukou system, that is, various other government departments give differential benefits and services based on one’s hukou status. For simplicity, the text uses the phrase “hukou-based discrimination” to describe this phenomenon.

Wallace – Directing Urbanization, Defining Unrest, and Distributing Transfers in China 2
wenti).3 Provision of free education and health coverage has rapidly expanded in the
countryside. The agricultural tax, which had existed in various forms for millennia, was
eliminated. Local governments have received transfers from the center to make up for
this loss of revenue. Why is the government simultaneously discriminating against
farmers in the city and subsidizing them in the countryside?
I argue these policies that seem at cross purposes comprise key elements of
China’s attempt to manage social stability and the process of urbanization. Both the
hukou system and changes in fiscal policy reduce the incentives for farmers to move to
cities. Managing urbanization is fundamental to the government’s strategy to maximize
stability – in both urban and rural areas – over the long term. Most of the focus on the
recent shift towards pro-rural policies has been, perhaps naturally, on their effect on the
countryside. However, I argue that their effect on urban areas was an important concern
during their formation.4
In the previous chapter, I show that controlling for level of economic
development, urbanization substantially increases the likelihood of regime collapse in
developing non-democracies.5 This finding illustrates a secondary effect of urban bias
that has been neglected in the literature: it encourages urbanization, leading to larger
cities in the future. By encouraging migration from rural to urban areas, urban bias
undermines the original intent of preferential treatment to cities. Rather than reducing the
risk to the regime by placating urban residents, urban bias actually increases the long-
term risk to the regime by generating larger cities. Despite this, bias towards cities
3 The “three rurals” (san nong) of the “three rural issues” (san nong wenti) are agriculture, villages, and farmers (nongye, nongcun, and nongmin). 4 Thanks to Allen Hicken for clarifying on this point. 5 Wallace 2007. Note that the finding is not that authoritarianism collapses, but authoritarian regimes collapse; that is, authoritarian-to-authoritarian transitions are included in the dataset.

Wallace – Directing Urbanization, Defining Unrest, and Distributing Transfers in China 3
remains endemic in developing non-democracies, as most governments do not have the
luxury of avoiding these long-term costs due to short-term threats.
While most regimes respond to the threat of urban unrest by biasing policies to
favor cities, China has focused on slowing the pace of migration to unstable cities and
even begun subsidizing rural areas. The Chinese government fears “Latin
Americanization”—slums, crime, and regime instability—and hopes to moderate
movement to cities by making agriculture more economically attractive.6 Thus, the
Chinese government uses fiscal policy as a tool to maintain social stability.
This chapter proceeds as follows. I show support for the argument in two
empirical sections. First, a narrative of Chinese urbanization and reform policy shows
that stability, especially in cities, has been a dominant concern for Chinese policymakers.
Second, analysis of Chinese fiscal transfer statistics shows that the government directs
fiscal transfers to areas that are unstable and that export laborers. This finding is based on
new estimates of sub-national social instability and migration patterns that I describe in
this chapter.
China’s Management of Urbanization
Despite being home to the largest cities on the planet for much of human history,
China today has a relatively low level of urbanization given its level of economic
development. On average, countries with purchasing power parity per capita income of
US$5,000 have over 50% of their populations living in urban areas. China, despite
passing this level of development in 2003, has only 43% of its people living in urban
6 e.g. Wen Tiejun quoted by Lang 2006.

Wallace – Directing Urbanization, Defining Unrest, and Distributing Transfers in China 4
areas as of 2005.7 Thailand is the only major country as developed as China with a lower
percentage of its population living in urban areas.8 This is a result of a series of policy
choices by the PRC government, most particularly the hukou system.
The Communists were from the beginning of their reign worried about the
possibility of urban unrest. The government decided to ensure that urban workers and
unemployed were fed. In 1950, Mao Zedong directed the Central Committee to “set aside
two billion catties of grain to solve the problem of feeding the unemployed workers.”9
More directly addressing the problem of potential urban instability were policies pushing
people to leave cities and move to rural locations. Hundreds of thousands if not millions
were moved, tempted in part by land grants and subsidies for leaving major metropolises
(Cheng & Selden 1994).
The development plan of the 1950s followed the Soviet model; it focused on
strengthening the heavy industry sector. China extracted surplus from rural areas and
invested the proceeds in urban industry (Bernstein 1984; Oi 1989). As the benefits of
policies were concentrated in urban areas, without migration restrictions, the government
feared that massive “blind flows” (mang liu) of people from the countryside would
overwhelm urban social services (Cheng & Selden 1994). China established its hukou
system in the 1950s and began using it to seriously restrict freedom of movement within
the country in 1960.10 As economic planning became more comprehensive, markets
evaporated. Ration coupons for food and other necessities were often only good in their
7 The 43% figure is the estimate from the 2005 1% Population Random Survey Sample. 8 World Development Indicators. This excludes countries with under two million people. 9 Mao Zedong in Kau and Leung 1986. Quoted by Cheng and Selden 1994. 10 Cheng and Selden 1994; Chan and Zhang 1999. The system combined aspects of the baojia system of imperial China, Japanese and Kuomintang (guomindang) policies, and the Soviet passbook system, Cheng and Selden 1994. Hukou started in cities in 1951 and the countryside in 1955, and with official legislation arriving in 1958.

Wallace – Directing Urbanization, Defining Unrest, and Distributing Transfers in China 5
locality of origin.11 Illegal migration could be punished as a crime but was usually dealt
with by returning the violator to his home territory (Chan & Zhang 1999).
The ability of the system to limit urbanization was impressive. From 1964 to 1982
China’s urban population essentially held steady, moving from 18.3% to 20.9%.12 It
should be noted that only flows from low density to higher density localities were
restricted. Movement of city residents to the countryside was unrestricted, as was moving
from a large city to a smaller one (Chan & Zhang 1999).
In the early 1980s, China’s reform and opening up led to the emergence of
markets around the fringes of the planned economy, meaning that one could buy food or
other goods without a locality-determined ration coupon, partially dismantling the
invisible walls around cities (Chan 1994). With the increased opportunity to move to
cities, millions have moved.13 The order of reforms – that is, their chronological
arrangement – points to the government being interested in preserving social stability
generally, but especially preventing urban instability. However, this does not mean that
reforms were solely focused on the urban sector, in fact, quite the opposite.
Initial reforms took place in the countryside. Land was decollectivized – but not
privatized – and agricultural production soared as a result, due to improved incentives
and higher prices (Oi 1989; Brandt et al. 2002). In addition to promoting agricultural
development, policies were put into place that encouraged rural industrialization, led by
companies controlled by local governments, known as township and village enterprises or
11 Cheng and Selden 1994. In particular, see pp. 657-8. 12 2006 China Statistical Yearbook. 13 Accurate numbers of migrants are not available for the 1980s. The Chinese National Bureau of Statistics until 2000 used hukou-based lists for its survey. As such, migrants often went undocumented and uncounted. By 2005, over 147 million people were counted as part of the moving or “floating” population. 2005 1% Population Random Sample Survey.

Wallace – Directing Urbanization, Defining Unrest, and Distributing Transfers in China 6
TVEs (Oi 1999).14 While during the era of the planned economy, local governments were
principally funded by the center, each according to its needs, the era of soft budget
constraints came to an end with fiscal reforms in the 1980s (Oksenberg & Tong 1991; Oi
1999). Local governments were left to fend for themselves. Many seized the opportunity
to produce consumer goods and other lightly manufactured products which were
undersupplied throughout the planned years (Oi 1999). Initial reforms improved rural
economic performance, thereby encouraging both rural stability and decreasing the
incentives to migrate to cities.
At the same time, the lack (or delay) of reform in cities shows the high place that
the potential for urban instability had in the hierarchy of concerns the Chinese
government faced. Urban state-owned enterprises (SOEs) were hemorrhaging funds, yet
the government was unwilling to allow managers to fire workers and thereby improve
efficiency (Naughton 1996).15 This policy points to the government being interested in
maintaining control of the economic levers in key sectors (petroleum and other fuels,
electricity, telecommunications, etc) but also that concentrated large-scale layoffs were a
concern that the leadership wanted to postpone as long as possible. In the mid-1990s,
there is a call to grasp the large SOEs and let the small and medium ones go (zhuada
fangxiao). It is only in the mid-to-late 1990s that significant reforms of large-scale SOEs
occurred (Lee 1999). Even at this late data, restructuring rather than privatization was the
reform of choice, in large part due to the problem of laid-off worker unrest (Oi 2005). By
this time the non-planned economy had developed to the extent that foreign observers
14 It is only in the 1990s that private enterprises became significant in terms of output and profits. 15 The SOEs were also institutionally powerful, see Shirk 1993. However, the argument that institutional power led to delay, I argue, is not an alternative expalanation. Rather the choice to grant these enterprises institutional and political power comes precisely from recognition of their significance in the political economy of the state, especially in terms of urban social stability.

Wallace – Directing Urbanization, Defining Unrest, and Distributing Transfers in China 7
described China’s reform strategy as a successful attempt to “grow out of the plan”
(Naughton 1996). Thus, the fear of massive migration to urban areas led to reforms in
agriculture while the fear of urban unemployment delayed SOE reform in the cities.
China has substantially urbanized in the reform period but between the order of
the economic reforms described above and the hukou system, urbanization has been
managed. The hukou system still offers constraints and imposes costs on migrants (Wang,
F.-L. 2004). It has slowed labor market integration and increased inequities (Au &
Henderson 2002). In a major move in 2001, the government lowered the bar for access to
urban hukou but only for small and medium sized cities (Wang, F.-L. 2004). That is, the
regulatory hurdles necessary to migrate to a small or medium city became substantially
easier to overcome. Yet until the infamous case of Sun Zhigang who was beaten to death
after not producing his registration permit in Guangzhou in March 2003, Chinese could
be deported to the countryside simply for forgetting to have their documentation on their
person at all times.16 There exists a market for large city hukou but prices remain outside
of the range of all but the extremely wealthy.17 As the introductory example of the
vehicle accident in Chongqing above demonstrates, despite professing to be a party of the
peasants, the CCP-led government continues to differentiate its citizens by hukou and
discriminates against those with rural hukou.
In changes described by Premier Wen Jiabao as having “epoch-making
significance,” over the past ten years the fiscal extraction from Chinese agriculture has
been simplified, cut, and replaced with subsidies.18 China’s current policy goal of
“industry feeding agriculture in turn” was enunciated in the early 2000s. The abolition of
16 “Temporary Residence Permit System Illegal” China Daily. 2006.12.27. 17 Wang 2004. Referred to as “blue stamp hukou”. 18 Xinhua 2006b.

Wallace – Directing Urbanization, Defining Unrest, and Distributing Transfers in China 8
agricultural taxes and increase in transfers to the countryside began, as do many of
China’s reforms, as experimental projects in an area of the country. In the case of these
pro-rural reforms, China’s Northeast (Dongbei) was a primary test bed (Lu & Weimer
2005). Not coincidentally, nearly two million of “laid off workers” (xiagang) were
concentrated there when SOE reform finally began moving forward in the late 1990s.19
SOEs were concentrated in Dongbei – Heilongjiang, Jilin, and Liaoning – taking
advantage of the industrial investments the Japanese made there when they held it during
WWII.20
The central government spending on agriculture, rural areas, and farmers was
reported as 297.5 billion yuan in 2005 a 30% real increase from 2003.21 The abolition of
agricultural taxes and fees is estimated as a total reduction of the peasant burden of 125
billion yuan a year.22 Budgeted spending from central coffers on rural compulsory
education by 2010 is 125 billion yuan.23 The New Cooperative Medical System (NCMS)
is expanding medical coverage in the countryside. Begun in 2003, by 2006 it covered
40% of China’s counties and is to cover the entirety of the countryside by 2010.24 Some
find that in the past 5 years China has increasingly focused village level investments in
public goods projects and locating such projects in poor and minority areas.25 Two
features in Figure 1 below illustrate the shift. First, there is a clear move from a
regressive pattern of transfers, that is, richer areas receive more transfers, in 1998 to a
non-regressive point in 2002. This shift can be seen in the change in the slope of the
19 2005 Labor Statistics Yearbook, p. 162. 20 World Bank 2006. 21 CPI data from the China Statistical Yearbook, 2005. The 2005 data is Xinhua 2006a. 22 Xinhua 2006c. 23 Xinhua 2006d. 24 Yan, Zhang, Wang, and Rozelle 2006. Also see Xinhua 2005. 25 Rozelle et al 2006.

Wallace – Directing Urbanization, Defining Unrest, and Distributing Transfers in China 9
regression line from strongly positive in 1998 to essentially horizontal in 2002. Second,
the scale of transfers per capita increases dramatically. Whereas in 1998, the largest per
capita transfer is Shanghai’s at 661 per person, by 2002 twelve provinces received
transfers that large with the largest per capita transfer, Qinghai’s 1860 yuan per person,
nearly tripling the previous high.
Figure 1. Illustrating the Fiscal Shift Transfers per Capita (in yuan) in 1998 and 2002 by Log(GDP per Capita)26
26 Transfers data is from the 1999 and 2003 Government Finance Yearbook (Caizheng Nianjian) and 1998 and 2002 Local Government Fiscal Statistics (Difang Caizheng Tongji Ziliao). Calculated as (transfers from center less system remittances)/population. It also should be noted that Tibet is excluded from this data; as seen below in Figure 4, Tibet is a extreme outlier in terms of transfers per capita due to its small population, minority status, and unique political position.

Wallace – Directing Urbanization, Defining Unrest, and Distributing Transfers in China 10
These changes have been implemented on the ground. Every county that I visited
during my field work from 2005 to 2007 had eliminated agricultural taxes and instituted
subsidies for seeds, fertilizers, and agricultural machinery. Individuals that used to have
to pay hundreds of yuan in taxes and fees every year are now receiving subsidies,
sometimes on the order of hundreds of yuan.27 Given that rural income per capita is
usually estimated at less than RMB3000, this shift represents a dramatic change in the
economic calculus of potential migrants.
Figure 2. National Level Mass Incidents, 1993-2003
Figure is from Tanner 2005.
These “populist social policies” are clearly being sold by the state as efforts to
combat inequality (Yang 2006). From 1991 to 2001, tax revenue from agriculture
exceeded 374 billion yuan;28 the government is trumpeting the abolition of these taxes.
Such policies are in part a response to a social situation that appears to be increasingly
27 Heilongjiang interview, May 2007. 28 2002 China Government Finance Yearbook. p. 353. Included are the agriculture tax, special products tax, arable land use tax, forest products and contract taxes. (nongye geshui baokuo nongye shui, gengdi zhanyong shui, nongye techan shui, he qi shui) The figure is in real 2001 yuan, CPI data from 2005 China Statistical Yearbook.
Wallace – Directing Urbanization, Defining Unrest, and Distributing Transfers in China 11
dire. The number of “mass incidents” (quntixing shijian) increased dramatically in the
decade prior to 2003, when the last annual number was announced. Figure 2 above from
Tanner 2006 shows the dramatic trend. The slogans of “people-centered” (yi ren wei ben)
development and increased focus on the three agricultures are part of the attempt to
address this situation. However, the stability situation is more complicated than the
simple image figure 2 depicts.
Social Stability
Chinese social instability is often discussed but little understood in popular media.
The Western press frequently trumpets that over 200 protests/day occur in China as
evidence that the country is falling apart, with regime change, and thus democratization,
just around the corner.29 Simultaneously, the same papers and others portray China as a
behemoth barreling towards its future as a superpower with little chance that the rule of
the Chinese Communist Party (CCP) will be derailed.30 The former are too dire in their
predictions while the latter underestimate the social upheaval and associated political
difficulties of China in this era of reform and opening up.
In 2003, villagers from Shengyou Village, Dingzhou, Hebei began building huts
on 387 mu (25.8 hectares) of land that had been requisitioned by the Hebei Guohua
Dingzhou Power Plant as they were unhappy with the lack of transparency and the
compensation they were offered.31 The power plant was interested in using the land for a
coal ash storage facility.32 The conflict escalated. On April 21, 2005, around 20 people
29 e.g. Kahn 2006. 30 e.g. Mann 2007. 31 Original reporting by the Beijing News (Xinjingbao), including field notes translated by Ronald Soong at the EastSouthWestNorth blog. Other helpful news stories were filed by Philip Pan at the Washington. Pan 2005; Soong 2005; Xinjingbao 2005. 32 Pan 2005.
Wallace – Directing Urbanization, Defining Unrest, and Distributing Transfers in China 12
arrived to move the villagers off of the land. They were prepared to use violence. The
villagers fought them off, even capturing one who had been recruited from his job as a
waiter in Beijing with an offer of 100 yuan (around $12).
Less than two months later, a much larger force tried again. In the early morning
on the 11th of June, two to three hundred young men, wearing helmets and combat
fatigues and armed with guns, flares, and homemade pikes, attacked the villagers. The
assault killed 6 and left well over a hundred villagers wounded.33 Villagers told reporters
that they “hope the central government will come and investigate. We believe in party
central, but we don’t believe in the local police.”34 News reports and a video showing the
explosive melee appeared shortly after. Within days the Dingzhou party secretary had
been fired, and in February 2006, he was sentenced to life in prison and four conspirators
were given death sentences.
The Dingzhou incident is obviously atypical in numerous ways, yet it
dramatically illustrates many salient features of popular unrest in China. The “mass
incident” occurred in rural areas on the basis of a land dispute. The conflict pitted local
government officials against those they are supposed to govern. Villagers pray that the
central government will come to their aid. The fight was over a construction project, a
coal power plant, suggestive both of the infrastructure development generally seen as key
to the country’s economic growth and the dark side of that development, its massive
environmental problems. The willingness of someone working in Beijing to come to this
area two hundred kilometers from that city for 100 yuan to take on dangerous ‘work’
33 One of the attackers was killed as well. 34 Pan 2005.
Wallace – Directing Urbanization, Defining Unrest, and Distributing Transfers in China 13
shows how cheaply labor can be purchased, for any purpose. Both the extreme violence
of the situation and the punishment doled out to the officials are rare.
Connecting these trends to Chinese social stability statistics is not a simple task.
Chinese statistics generally and especially in the area of stability are not transparent. In
this section, I lay out the national level official data related to social stability. Variables
discussed include protests, unemployment, labor disputes, and crimes.
The official website of the “most authoritative” Party-controlled newspaper in
China, People’s Daily Net (Renmin Wang), has a recurring headline: “China by the
Numbers.” As reported by the Party’s mouthpiece, the figures tend to illustrate China’s
tremendous economic progress. Writers in the West also marshal nearly unfathomable
statistics in their attempts to help their readers understand China. One such statistic is the
number of public protests, usually given as 74,000 in 2004 or 87,000 in 2005.35 This
figure is then divided by 365 to come up with the 200+ protests per day figure cited
earlier. The usage is unfortunate as drawing conclusions from aggregate data is difficult
when it is unclear precisely what these events entail.
The sources of these numbers are multiple press conferences by officials in the
ministry of public security.36 These figures are part of two separate data series measuring
similar but distinct phenomena, “mass incidents” (quntixing shijian) and “public order
disturbances” (raoluan gonggong zhixu fanzui anjian). Figure 2 above from Tanner
charts the mass incident data series, which begins in 1994 and stops in 2004. The 87,000
figure that is often cited in the press is from the second series, public order disturbances.
35 Google News Archive Search for “87,000 protests” AND China finds 76 articles, “74,000 protests” AND China finds 88 stories. Search conducted 2007.08.04. 36 http://www.mps.gov.cn/cenweb/brjlCenweb/jsp/common/article.jsp?infoid=ABC000000000 00001018

Wallace – Directing Urbanization, Defining Unrest, and Distributing Transfers in China 14
The press conference announcing the 2005 figure stated that it represented a 6.6%
increase from the previous year, implying a 2004 figure of 81,600. While this is close to
the 74,000 mass incidents given by the Minister of Public Security, Zhou Yongkang on
July 6, 2005, it is clear sign that these are two distinct data series.
Further complicating matters is that what constitutes a mass incident or public
order disturbance remains less than perfectly clear. Certainly public protests are included;
however, many other kinds of incidents also are part of these figures (Yang 2002; Chen
2004). The website of the Jiangsu Public Security Division defines a mass incident as one
of over a dozen different illegal actions and distinguishes between extraordinarily
important (tebie zhongda) and important (zhongda) mass incidents (Soong 2005). Public
order disturbances can include printing counterfeit currency, impersonating a police
officer, or hacking a government webpage (Soong 2005). Perhaps in response to Western
newspaper reports portraying China as a country run amok, the Ministry of Public
Security referenced a third data series also called “mass incidents” which in 2005 only
numbered 30,700 and in 2006 declined to 23,000.37 The range of events counted as “mass
incidents” in the new series remains hazy.
If each of these 23,000 cases were mass rallies against the CCP leadership in
Beijing, then this number would be portend considerable danger to the regime, if nothing
else as having the potential to serve as the source of an informational cascade similar to
that preceding the collapse of the communist ruled states in Europe in 1989-90 (Kuran
1991; Lohmann 1994). However, few of these incidents—protests or otherwise—actually
target the central government. Protests such as those violently suppressed in June 1989 or
37 Annualized based on a nine month figure of 17,900 for 2006 and that the 2006 number was a drop of 22.1% from 2005 for the same period. Reuters 2006.

Wallace – Directing Urbanization, Defining Unrest, and Distributing Transfers in China 15
the Falun Gong demonstration in front of Zhongnanhai’s Xinhua gate in 1999 are rare
exceptions (Li & O'Brien 1996; Cai 2002, 2004). The vast majority of protests are like
the Shengyou case: aimed at local business or government decisions and calling on the
center for assistance (Hurst & O'Brien 2002). In fact, the central government uses public
complaints as part of its strategy to monitor local governments. This is explicit in the
Chinese xinfang, or Letters and Visits system, where local officials are punished if too
many complaints are registered. Public protests also seem to follow this logic but as the
government does not encourage (in fact, it outlaws) such protests, the strategy is apparent
but unstated (O'Brien 1996; Lorentzen 2006).
These caveats aside, the trend of such incidents is clearly not reflective of an
increasingly stable social situation. The seven-fold increase in mass incidents over a
decade shows that despite enormous economic growth, discontent has grown. The call for
a “harmonious society” by the Hu Jintao-Wen Jiabao administration shows the high
priority given to stability in recent years.
Although mass incidents may be the activity most directly related to threats to
continued government rule, they alone does not encompass social stability. Inflation is
often seen as a proximate cause of social unrest, both in China as well as other countries
(Bates 1981; Tanner 2004). Along with inflation, unemployment is a key economic factor
for predicting instability. Related is the issue of labor disputes. Similarly, crime and
corruption are negative indicators of stability. I address Chinese national level trends in
each of these in turn.
Chinese unemployment data has generally been seen as not reflecting the total
labor situation in the country, or even in urban areas (Solinger 2001). Strides have been

Wallace – Directing Urbanization, Defining Unrest, and Distributing Transfers in China 16
made recently to improve the collection of unemployment data (Zhang et al. 2005). The
official data on unemployment is “officially registered urban unemployment,” which as
its name implies requires registration. For those not eligible for unemployment benefits,
registration comes with no tangible benefits, and so it is generally accepted that the
registered unemployment figures offer an overly rosy picture of the Chinese labor
situation (Solinger 2001; Giles et al. 2005). The trend line of the data at the national level
resembles that of the mass incident data series. From 2000 to 2004 year-end officially
registered urban unemployment increased over 38%.38 Interpreting this increase is
difficult as changing data collection methods mix with the changing real world situation.
The criticisms of the unemployment data are that the levels are too low and with
improved data quality, expectations are that the reported level of unemployment would
increase, even if the conditions on the ground remained the same. As long as the
methodology is consistent across provinces in a given year and does higher levels of the
official statistics represent areas with more unemployment, these statistics can be usefully
employed in a measure of instability.
National crime statistics also have increased dramatically since the late 1990s.
Registered crimes and “public order cases” (zhian anjian) also increase dramatically over
the past decade, but their trend is different from the mass incident pattern tracked by
Tanner presented above.39 The series are presented below in Figure 3. There is a dramatic
increase in cases of both kinds from 1999 to 2001. After this period, the series diverge,
with criminal cases remaining around the 2001 level through 2005 while by 2005 the
38 Labor Statistics Yearbook, various years. 39 Public order cases are yet another different category and are not the same as “public order disturbances.”

Wallace – Directing Urbanization, Defining Unrest, and Distributing Transfers in China 17
number of public disorder cases had increased 29% over its 2001 level and continues an
upward trajectory.
Figure 3: National Public Disorder & Criminal Activity40 Millions of registered cases
1
2
3
4
5
6
7
8
1995 1996 1997 1998 1999 2000 2001 2002 2003 2004 2005
A final variable at the national level that I have collected is collective labor
disputants. The Ministry of Labor and Social Security compiles and publishes a labor
dispute series that includes “organized work stoppage, strikes, sit-ins and demonstrations
by workers and retired workers” starts from 1992.41 This series also includes a
breakdown of collective versus individual incidents as well as the number of workers
40 Millions of registered cases. China Statistical Yearbook, various years. Public disorder cases are the higher series, with markers shaped as diamonds. The criminal activity series, with the dotted line and square-shaped markers, lies below the public disorder series in all years. 41 Chung, Lai, and Xia 2006.

Wallace – Directing Urbanization, Defining Unrest, and Distributing Transfers in China 18
involved. The trend is similar to the mass incident and crime statistics already presented
in Figure 3.42
Estimating Provincial Instability
The above discussion focused on national trends in different data series related to
social stability. In order to understand if and how policies respond to stability threats,
disaggregated data is needed. In this section, I describe an estimate that I have created
that combines data from different series into a single estimate of instability for each
province-year from 1999 to 2004.
The instability variable is created by principle components factor analysis,
combining data on collective labor disputants per capita, petitions (xinfang) per capita,
and the unemployment rate in a given province year. The collective labor disputants and
unemployment data have been described above. National level data on petitions are not
published, and provincial level data are not readily available. The most consistent
estimate of provincial level petitions is data combining county, city, and provincial level
petitions data for a given province and reported in that province’s yearbook.43 I have
collected such data from 16 provinces.44 These provinces are similar in character to the
overall set of provinces; they include rich and poor areas, autonomous minority regions,
municipalities, areas that export and that import labor, and unstable and stable areas. I
impute missing values using Stata 8.2. Xinfang trends for selected provinces are
42 See the appendix for a depiction of the national collective disputants trend. 43 N.b. As is the case with most Chinese yearbooks, year X’s data is in the yearbook from X+1, that is, 2004 data is printed in the 2005 yearbook. 44 Anhui, Guangxi, Henan, Jiangsu, Jilin, Shandong, Shanghai, Sichuan, and Yunnan have complete coverage. I also have partial data from Fujian, Hebei, Heilongjiang, Jiangxi, Tianjin, Xinjiang, and Zhejiang.

Wallace – Directing Urbanization, Defining Unrest, and Distributing Transfers in China 19
presented in the appendix. Factor analysis is used to extract information contained in each
of the three series into a single estimate of the latent variable social stability.
Table 1. Top Ten Unstable Provinces, Average Instability Score 1999-200445
Rank Province
1. Shanghai 2. Liaoning 3. Guangdong 4. Jilin 5. Zhejiang 6. Heilongjiang 7. Ningxia 8. Tianjin 9. Fujian 10. Jiangsu
Table 1 lists the top ten provinces in terms of their average instability score for
the course of the data. While the fact that three of the top six slots are the provinces of the
Northeast is to be expected, Shanghai’s inclusion at the top of the list is a bit surprising,
as it is often seen as a paragon of China’s development. It arises from Shanghai’s
extremely high levels of per capita government petitions (averaging 379 per 10,000
versus a national average of 105 per 10,000). Two non-stability related factors may
potentially help account for this result. First, the petitions data includes only petitions at
the county and above. As an urban area, access to one’s county level government office is
relatively easy, and so petitions that might be taken to a village or township office and
not enter the dataset are instead taken to the county-level office and are included as part
of Shanghai’s total. Second, Chinese population data in the past has been biased in a way
that undercounts migrants (Chan & Zhang 1999). As China tended to systematically
45 In the appendix, another table of instability by province based on one month’s data according to a dissident website purporting to have a leaked report, from Chung, Lai, and Xia 2006.

Wallace – Directing Urbanization, Defining Unrest, and Distributing Transfers in China 20
undercount in-migrant populations in their official statistics, provinces (like Shanghai and
Guangdong) that are large labor importers have population estimates that are smaller than
their true values. This affects the petitions per capita variable by under-estimating the true
population and hence over-estimating petitions per capita, leading to perhaps an
overstatement of instability in those locations.
Data
This section of the paper utilizes the new estimate of provincial instability to try
to account for variation in center-to-province fiscal transfers. Focus on transfers is
appropriate as they account for nearly half of local fiscal resources in the data. In 23 of
the 31 provinces,46 transfers provided more than half of the total.47 In particular, the
analysis focuses on ad hoc transfers rather than ruled-based ones as only with the former
is discretion allowed. The theory generates the following four hypotheses regarding the
distribution of center-to-province ad hoc fiscal transfers.
H1: Transfers are directed towards areas with instability issues. H2: Fiscal transfers are directed to areas that export workers. H3: Transfers target urban areas as urban instability is weighed more heavily than rural instability.
A number of control variables that have been suggested by previous works are
included in the analysis. Minority status, natural disasters, and political representation
score are expected to be positively associated with transfers (Wang, S. 2004; Naoi 2006;
Shih & Qi 2007). Expectations of the relationship between GDP per capita and the
transfers differ depending on the type of transfer being analyzed. Level of economic
development positively affects returned taxes and negatively affects ad hoc transfers. Full 46 China claims 34 provincial level units, including Taiwan, Hong Kong, and Macau, which are always excluded from my analysis. The remaining 31 are comprised of 2X provinces, 4 municipalities, and X minority autonomous regions. 47 2005 China Government Finance Yearbook.

Wallace – Directing Urbanization, Defining Unrest, and Distributing Transfers in China 21
transfers are expected to be positively associated with GDP per capita as richer provinces
have more bargaining power with the center.48 Ad hoc transfers might be similarly
affected by bargaining power and so positively correlated with income, or progressive
transfers may dominate, leading to a negative predicted relationship.
The dependent variable of the analysis is ad hoc center-to-province transfers per
capita. The independent variables of interest are instability, migration, and urbanization.
Control variables include central committee representation of the region, natural disasters,
and minority status.49
The transfer data comes from two annual sources, the Government Finance
Yearbook (Caizheng Nianjian) and the Local Government Finance Statistical Data
(Difang Caizheng Tongji Ziliao). The ad hoc transfer data series is created by removing
various rule-based transfers from a total transfer figure. The figure on total transfers
comes from the relevant province’s budget in the Government Finance Yearbook.
Returned taxes and old system subsidies, found in the Local Government Finance
Statistical Data, are removed.50 This remainder is the “other transfers” figure. The final
transformation is to divide the transfer by the provincial population.
When examining the data, it becomes clear that Tibet is a very distant outlier.
Tibet’s average per capita ad hoc transfer is over 2100 yuan per capita, more than twice
the second largest average transfer (Qinghai at 1018 yuan per capita). Tibet’s
observations hold such leverage that when included they dilute the rest of the analysis
48 Shirk 1994, Wang 2005. 49 Future iterations of the paper will include FDI and/or trade statistics as recent papers have suggested that they might have some affect on the distribution of transfers. 50 The Local Government Fiscal Statistical Data series has year X’s data in year X’s edition.

Wallace – Directing Urbanization, Defining Unrest, and Distributing Transfers in China 22
and thus are omitted for the rest of the analysis.51 The boxplot in Figure 4 below shows
how distant of an outlier Tibet is on the dependent variable.
Figure 4: Tibet as Outlier 0
1,00
02,
000
3,00
0Yu
an
1999 2000 2001 2002 2003 2004
n.b. Tibet is the highest value in all yearsBoxplot of Ad Hoc Per Capita Transfers
The primary independent variable is a new provincial level estimate of instability
described above. The second independent variable of interest is migration. The sources
for this population data are the 2000 census and the 2005 1% Census Random Sample
Survey. Both sources provide a snapshot of the population distribution within the country
including migrants and migration patterns and are free from the traditional problem of
undercounting migrants. Census data is not used for judging cadres and so is relatively
free of bias (Chan & Zhang 1999). Net emigration is measured as the population from
51 For example, a previous iteration of the paper used collective labor disputants per capita as a proxy for instability. With Tibet, the raw correlation between ad hoc transfers per capita and disputants per capita was 0.47. After omitting Tibet, the correlation fell to 0.093. However, the results found in the models below do mostly part hold with Tibet included.
Wallace – Directing Urbanization, Defining Unrest, and Distributing Transfers in China 23
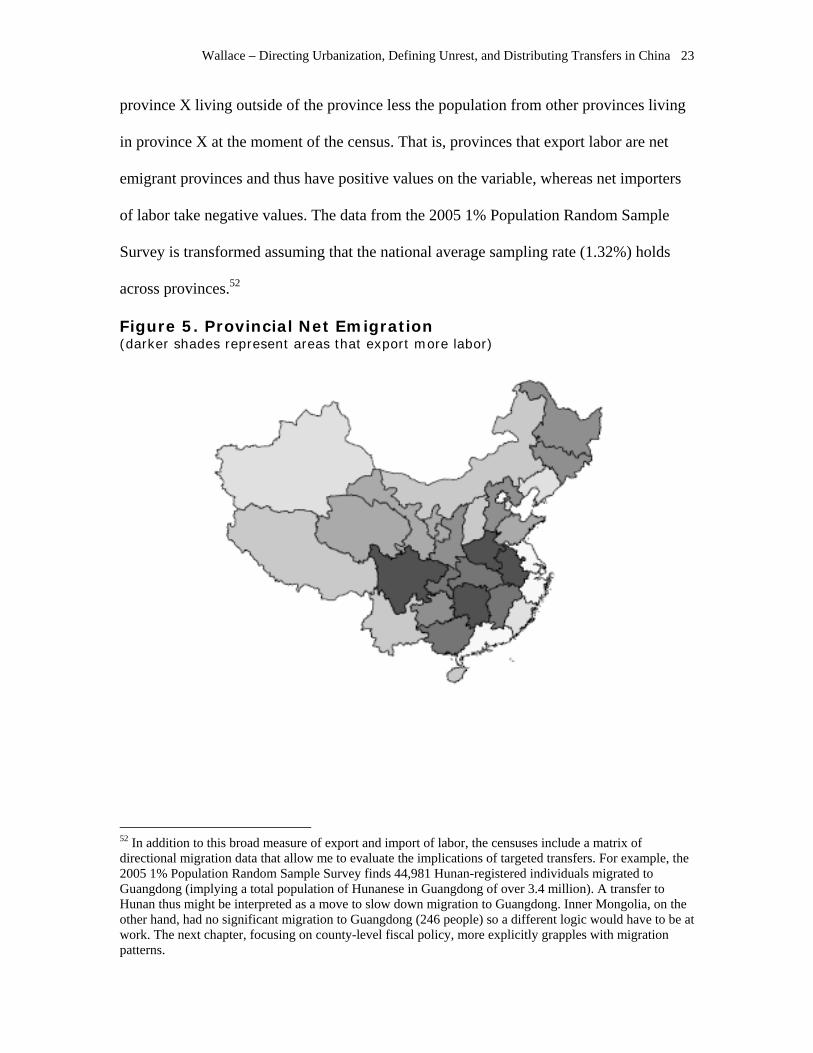
province X living outside of the province less the population from other provinces living
in province X at the moment of the census. That is, provinces that export labor are net
emigrant provinces and thus have positive values on the variable, whereas net importers
of labor take negative values. The data from the 2005 1% Population Random Sample
Survey is transformed assuming that the national average sampling rate (1.32%) holds
across provinces.52
Figure 5. Provincial Net Emigration (darker shades represent areas that export more labor)
52 In addition to this broad measure of export and import of labor, the censuses include a matrix of directional migration data that allow me to evaluate the implications of targeted transfers. For example, the 2005 1% Population Random Sample Survey finds 44,981 Hunan-registered individuals migrated to Guangdong (implying a total population of Hunanese in Guangdong of over 3.4 million). A transfer to Hunan thus might be interpreted as a move to slow down migration to Guangdong. Inner Mongolia, on the other hand, had no significant migration to Guangdong (246 people) so a different logic would have to be at work. The next chapter, focusing on county-level fiscal policy, more explicitly grapples with migration patterns.
Wallace – Directing Urbanization, Defining Unrest, and Distributing Transfers in China 24
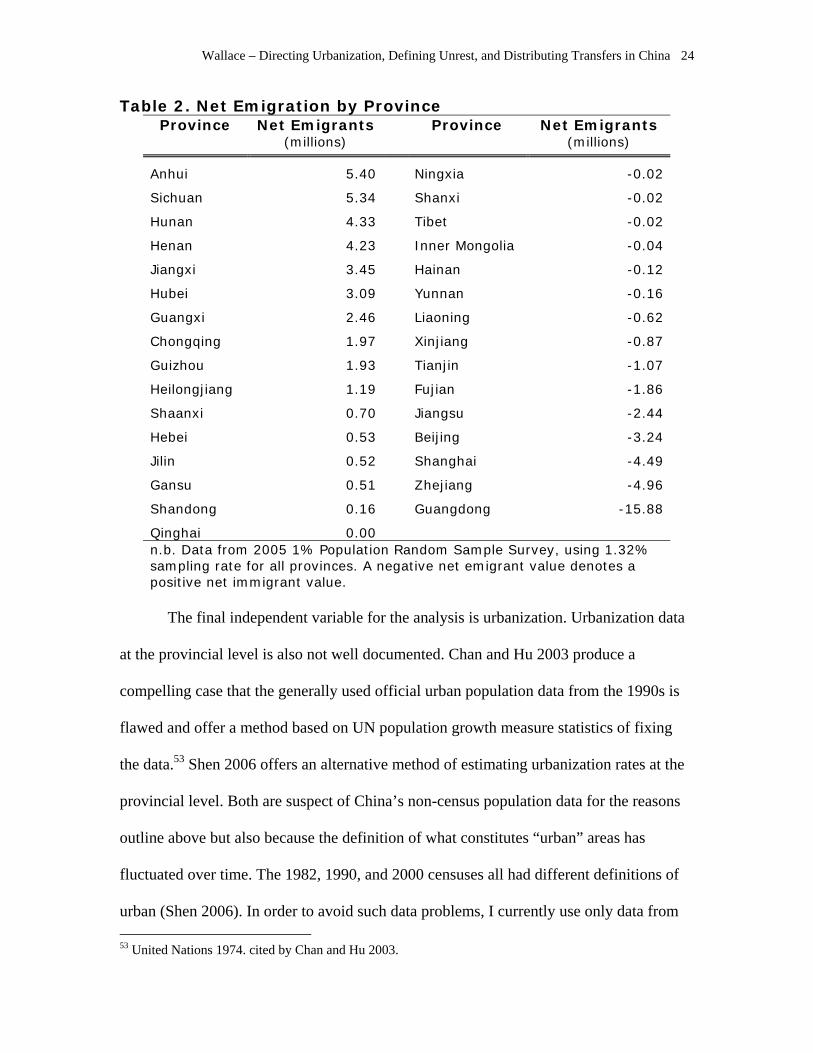
Table 2. Net Emigration by Province Province Net Emigrants
(millions) Province Net Emigrants
(millions)
Anhui 5.40 Ningxia -0.02
Sichuan 5.34 Shanxi -0.02
Hunan 4.33 Tibet -0.02
Henan 4.23 Inner Mongolia -0.04
Jiangxi 3.45 Hainan -0.12
Hubei 3.09 Yunnan -0.16
Guangxi 2.46 Liaoning -0.62
Chongqing 1.97 Xinjiang -0.87
Guizhou 1.93 Tianjin -1.07
Heilongjiang 1.19 Fujian -1.86
Shaanxi 0.70 Jiangsu -2.44
Hebei 0.53 Beijing -3.24
Jilin 0.52 Shanghai -4.49
Gansu 0.51 Zhejiang -4.96
Shandong 0.16 Guangdong -15.88
Qinghai 0.00 n.b. Data from 2005 1% Population Random Sample Survey, using 1.32% sampling rate for all provinces. A negative net emigrant value denotes a positive net immigrant value.
The final independent variable for the analysis is urbanization. Urbanization data
at the provincial level is also not well documented. Chan and Hu 2003 produce a
compelling case that the generally used official urban population data from the 1990s is
flawed and offer a method based on UN population growth measure statistics of fixing
the data.53 Shen 2006 offers an alternative method of estimating urbanization rates at the
provincial level. Both are suspect of China’s non-census population data for the reasons
outline above but also because the definition of what constitutes “urban” areas has
fluctuated over time. The 1982, 1990, and 2000 censuses all had different definitions of
urban (Shen 2006). In order to avoid such data problems, I currently use only data from 53 United Nations 1974. cited by Chan and Hu 2003.

Wallace – Directing Urbanization, Defining Unrest, and Distributing Transfers in China 25
the 2000 census and 2005 1% Population Random Sample Survey, connecting their
estimates over time by linear interpolation.
In addition to the independent variables associated with the hypotheses derived
from the theory, a number of control variables are used in the analysis. The Central
Committee Representation of a province in a given year is the number of members in the
Central Committee (CC) that work for or are stationed in that province.54 The data series
tracks the 15th and 16th Central Committees. Scores for 2002 follow the membership in
the 15th CC as the transition to the 16th CC occurred late in the year (November 7 to
November 15, 2002). The data uses an inclusive coding of the data. Government officials
that transition away from or to a province during the year are counted as part of that
province’s CC Representation. It is possible (and does occur in the data) that one official
will contribute to multiple provinces’ scores in the same year.55
Table 3. Summary Statistics of Variables
Variable Mean Std. Dev.
Min Max
Total Transfers per capita (yuan) 695 436.70 186.45 2406.74 Ad hoc Transfers per capita (yuan) 340 245.27 25.93 1360.90 Instability 1 0.57 0.17 4.57 Net Emigration (millions) 0 3.89 -15.88 5.40 Urbanization 42 16.15 22.30 91.60 GDP per capita (100s of yuan) 99 67.41 24.58 427.69 Disasters (hectares affected) 163 127.11 0.10 665.90 Central Committee (CC) Representation 2 1.18 0 6 Autonomous Region (dummy) 4 of 30 0 1 n.b. net emigration is positive, net immigration is negative n = 180 for all variables
54 The exception being Beijing. Officials that work in Beijing but for the central government rather than the municipal government of Beijing are coded as “center” and do not contribute to any province’s political representation score from this analysis. 55 I have also coded the political representation variable “exclusively,” that is, government officials do not contribute to a provinces score in the year that the transition into or away from a province. There is also some discussion in the literature that officials direct resources to the provinces of their birth; future iterations of the analysis will account for this possibility.

Wallace – Directing Urbanization, Defining Unrest, and Distributing Transfers in China 26
Disasters data come from the Civil Affairs Statistical Yearbook and China
Agricultural Yearbook. They are the number of hectares lost in a given year to natural
calamities. I also include a dummy variable for autonomous regions, which are 4 of the
remaining 30 provincial-level units after Tibet is omitted. Many have argued that these
minority regions receive additional funds from the center (Wang, S. 2004).
Analysis
The models support the principal contentions of the theory. Instability, net
emigration, and urbanization all lead to increased levels of ad hoc fiscal transfers as
expected. GDP per capita is negatively associated with transfers. I describe the results of
the different models in more detail below.
The first three models are of one form. All use panel-corrected standard errors as
well as a time trend to reduce the chances that the independent variables are credited with
accounting for some of the variation that is actually structurally in the data. The time
trend variable – Year – is always strongly significant, both substantively and statistically,
in a positive direction.
The results from Model 1 show the basic results. Transfers are directed towards
areas with instability problems, lending support for H1. A one standard deviation increase
in instability translates into 34.5 yuan more in expected ad hoc transfers per capita.
Similarly, ceterus paribus, provinces that send workers out receive more than provinces
that receive workers, as predicted in H2. The effect of moving from a province that has
received around 1.86 million workers (Fujian) to a province that exports around as many
(Chongqing, 1.97) leads to an expected increase in ad hoc transfers of 29 yuan per capita.
Note that the potential problems in Chinese population data series discussed above would

Wallace – Directing Urbanization, Defining Unrest, and Distributing Transfers in China 27
bias results against this finding. Ad hoc transfers per capita are likely over-estimated for
net emigrant provinces and under-estimated for net immigrant provinces; that is, if there
were no relationship between net emigration and ad hoc transfers, the potential data bias
could lead to a negative estimated coefficient. That the effect overcomes this potential
source of bias strengthens confidence in the result. Even after accounting for these
variables, the four autonomous regions receive substantially more, over 236 yuan per
capita, than do other provinces. In Xinjiang, with a population of nearly 20 million, this
translates into a subsidy of over 4 billion yuan per year.
Model 2 shows similar results. Instability, net emigration, and minority regions all
have positive coefficients of similar magnitude to model 1. Model 2 differs in that it also
includes urbanization and GDP per capita. While these two variables are highly
correlated (0.89), their coefficients point in opposite directions.56 A one standard
deviation move towards higher urbanization translates into an expected increase in ad hoc
transfers of 223 yuan per capita. For example, moving from Shaanxi (average
urbanization of 33.5%) to Jilin (average urbanization of 50.4%), approximately a one
standard deviation move, leads to an expected increase in ad hoc transfers per capita of
233 yuan. On the other hand, those provinces have substantially different average income
levels. As areas with higher per capita incomes receive fewer transfers, all else equal, that
same move from Shaanxi to Jilin leads to an expected reduction in ad hoc transfers of 92
yuan per capita. In net terms, the urbanization factor dominates the progressivity of the
system. The interpretation of this pattern is that controlling for level of economic
56 This holds even if they are added alone to Model 1. GDP per capita is always statistically significant and negative, and urbanization is always statistically significant and positive. When added individually, however, they do mitigate the effect of net emigration and can even reverse the sign.

Wallace – Directing Urbanization, Defining Unrest, and Distributing Transfers in China 28
development and instability, transfers are generally directed to urban areas demonstrating
support for H3.
Table 4. Regression Models.57 Dependent Variable: Ad Hoc Fiscal Transfers Per Capita
Variable Model 1 Model 2 Model 3 Model 4 Model 5
Instability 60.5*** 68.2*** 93.2*** 45.0* 57.3** 20.7 17.0 18.2 26.3 25.4
Net Emigration 7.6*** 6.6*** 6.1* (millions) 1.7 2.5 3.5
Autonomous Region 236.2*** 198.4*** 213.4*** (dummy) 43.7 37.2 26.7
Urbanization 13.8*** 13.8*** (percentage) 1.9 2.3
GDP per capita -3.6*** -3.8*** -2.2*** (100s of yuan) 0.5 0.6 0.6
Disasters -0.4*** (hectares affected) 0.1
CC Representation -35.6** 17.9
Year 37.5*** 61.5*** 50.5*** 39.3*** 61.6*** 9.9 9.9 10.7 5.5 7.9
Constant 116.8*** -185.2*** -4.0 157.4*** 283.1*** 38.7 54.7 69.7 23.5 40.1
R-Squared 0.23 0.40 0.43 0.10 0.12 within 0.40 0.45 between 0.01 0.05
Type of Regression PCSE PCSE PCSE Fixed
Effects Fixed
Effects
n = 180 for all models. Coefficients in boldface, standard errors below. * p < 0.1, ** p < 0.05, *** p < 0.01. PSCE is Panel-Corrected Standard Errors. Analysis run in Stata 8.2.
Model 3 shows the results when including control variables suggested by others,
namely disasters and political representation. The general results showing support for the
57 This is a work in progress. The results hold for these and most other specifications, as discussed in the text, but other robustness checks remain to be performed.

Wallace – Directing Urbanization, Defining Unrest, and Distributing Transfers in China 29
theory continue to hold but the coefficients on the controls of disasters and political
representation are negative when the opposite is expected. As these findings are
extremely counter-intuitive and add little to the explanatory power to the model (Model
3’s R-squared is only 0.03 more than that of Model 2), I do not focus on these results.
Models 4 and 5 use fixed-effects rather than the panel-corrected standard errors
formulation found in the previous models. As many of the independent variables in the
analysis do not vary over time (namely Net Emigration, Autonomous Region), they are
omitted from the analysis.58 Instability continues to be positively associated with ad hoc
transfers per capita whether or not GDP per capita is present.
The results of the models provide evidence in support of the hypotheses;
instability, exporting workers, and urbanization all lead to increases in transfers.
Transfers are directed towards areas with higher levels of instability, as predicted in H1.
This finding is robustly supported in every model, including models controlling for fixed
effects. H2 is supported as transfers are directed towards areas that export workers. All
else equal, the more workers that a province exports, the more transfers per capita it is
expected to receive. Finally, H3 finds endorsement as urban areas receive more transfers.
The results strongly suggest that the Chinese government uses its fiscal system to
maintain stability and manage urbanization.
Conclusion
Most developing countries implement policies that favor urban areas, as regimes
are vulnerable to urban revolts and riots. Often such favoritism takes the form of price
ceilings on grain financed by extraction from agriculture. The government of the PRC has
58 Urbanization actually does show minor variation over time but in narrow bands.

Wallace – Directing Urbanization, Defining Unrest, and Distributing Transfers in China 30
for most of its reign enacted such policies, most notably its hukou policies which
discriminated against those from rural areas. Recently, China has begun moving away
from such urban-biased policies. I argue that the government has done so evaluating
long-term threats to its survival. Urban bias has a self-undermining secondary effect of
encouraging urbanization, which, in the long-run, is destabilizing for non-democratic
regimes. By subsidizing rural areas, the Chinese government is attempting to use fiscal
policy as part of its strategy of managing urbanization and maintaining stability.
Examination of China’s policy choices and development path support the
argument. Reform of large SOEs was delayed until the economy could absorb the shock
of millions of laid off workers. The hukou system of migration restrictions makes
movement to large cities relatively unattractive. Agriculture is now subsidized. Analysis
of Chinese center-to-province fiscal transfers finds support for the argument. Transfers
are directed towards areas that are relatively unstable and urbanized, and that export
migrants.
These findings lend support to the argument presented in the first chapter.
Pairings the results here with those in the cross-national tests increases our confidence
that authoritarian governments interested in extending their rule have an incentive to
manage urbanization due to the destabilizing prospect of urban unrest. The next chapter
digs yet deeper into the Chinese sub-national government structure to examine transfers
to counties. Analyses at that level show that transfers are directed to counties near
unstable cities, consistent with a strategy to decrease migration flows into these trouble
spots by making remaining in the countryside a more viable economic alternative.

Wallace – Directing Urbanization, Defining Unrest, and Distributing Transfers in China 31
Appendix
Table 4. Taxing to Subsidizing Agriculture, Various Outcomes Number Proximate Outcome
1 Reduction in peasant burdens 2 Cutting funding to township governments 3 Decrease the number of officials at the township level 4 Increasing the control of higher levels 5 Transfer wealth from the urban to rural areas 6 Increase grain production 7 Slow down urbanization 8 Reduce rural unrest
The current set of “san nong” policies seems to have eight proximate outcomes which are listed above in Table 4. Alternative policy choices which were not selected (or are only a part of the total package of policies) are listed below in Table 5.
Table 5. Alternative Policy Options and Related Outcomes Policy Option Outcomes Privatize rural land 2, 3, 6, 8 Forgive township debts 1, 5, 8 Increase transfers to countryside without tax abolition
4, 5, 6, 7, 8
Crackdown on arbitrary charges and fees in the countryside
1, 2, 3, 4, 8
Abolish the township level of government 2, 3, 4 Strengthen migration restrictions 6, 7 Subsidize agricultural production 1, 4, 5, 6, 7, 8
Table 6. Provincial Protest Rankings, May 2004 data Rank Frequency Participants Participants per Protest
1 Henan Henan Hubei 2 Shandong Hubei Heilongjiang 3 Shanxi Anhui Henan 4 Hunan Hunan Anhui 5 Anhui Sichuan Hunan 6 Shaanxi Liaoning Liaoning 7 Hubei Shaanxi Sichuan 8 Sichuan Heilongjiang Chongqing 9 Jiangsu Hebei Zhejiang 10 Guangdong Jiangsu Jilin
n.b. Data from (Lin 2004). Table recreated from (Chung et al. 2006).

Wallace – Directing Urbanization, Defining Unrest, and Distributing Transfers in China 32
National Collective Labor Disputants (Thousands of disputants)
0
100
200
300
400
500
600
1996 1997 1998 1999 2000 2001 2002 2003 2004 2005
Collective Labor Disputants Selected Provinces
0
20000
40000
60000
80000
100000
120000
140000
160000
180000
200000
2000 2001 2002 2003 2004 2005
Liaoning
Jilin
Jiangxi
Shandong
Guangdong
Tibet

Wallace – Directing Urbanization, Defining Unrest, and Distributing Transfers in China 33
Petitions (xinfang ) - Selected Provinces in thousands
0
100
200
300
400
500
600
700
800
900
1995 1996 1997 1998 1999 2000 2001 2002 2003 2004
Sichuan
Guangxi
Shandong
Henan
Jiangsu
Jilin
(Zhongguo Various Years.) (Zhongguo 2006) (Zhongguo Various Years-b) (Zhongguo Various Years-a)

Wallace – Directing Urbanization, Defining Unrest, and Distributing Transfers in China 34
Bibliography Au, C.-C. and J. V. Henderson. (2002). "How Migration Restrictions Limit
Agglomeration and Productivity in China." NBER working paper series Bates, R. H. (1981). Markets and States in Tropical Africa. Berkeley, University of
California Press. Bernstein, T. (1984). "Stalinism, Famine, and Chinese Peasants." Theory and Society 13,
3: 339-377. Brandt, L., J. Huang, G. Li, and S. Rozelle (2002). "Land Rights in Rural China: Facts,
Fictions and Issues." The China Journal, 47: 67-97. Cai, Y. (2002). "The Resistance of Chinese Laid-Off Workers in the Reform Period." The
China Quarterly, 170: 327-344. Cai, Y. (2004). "Managed Participation in China." Political Science Quarterly 119, 3:
425-451. Chan, K. W. (1994). Cities with Invisible Walls: Reinterpreting Urbanization in Post-
1949 China. Hong Kong, New York. Chan, K. W. and Y. Hu (2003). "Urbanization in China in the 1990s: New Definition,
Different Series, and Revised Trends." The China Review 3, 2: 49-71. Chan, K. W. and L. Zhang (1999). "The Hukou System and Rural-Urban Migration in
China: Processes and Changes." The China Quarterly, 160: 818-855. Chen, J. (2004). Quntixing Shijian Yanjiu Baogao (Mass Incident Research Report).
Beijing, Qunzhong Press. Cheng, T. and M. Selden (1994). "The Origins and Social Consequences of China's
Hukou System." The China Quarterly, 139: 644-668. Chung, J. H., H. Lai, and M. Xia (2006). "Mounting Challenges to Governance in China:
Surveying Collective Protestors, Religious Sects and Criminal Organizations." The China Journal, 56: 1-31.
Giles, J., A. Park, and J. Zhang (2005). "What Is China’s True Unemployment Rate?" China Economic Review 16, 2: 149-170.
Hurst, W. and K. O'Brien (2002). "China's Contentious Pensioners." China Quarterly: 345-360.
Kahn, J. (2006). "Pace and Scope of Protest in China Accelerated in '05." The New York Times. 2006.01.20.
Kau, M. Y. M. and J. K. Leung (1986). The Writings of Mao Zedong: 1949-1976, ME Sharpe.
Kuran, T. (1991). "Now out of Never: The Element of Surprise in the East European Revolution of 1989." World Politics 44, 1: 7-48.
Lang, X. (2006). "Building of New Socialist Countryside and Urbanization: Advocacies and Arguments." Beijing Lilun Qianyan. 2006.09.01.
Lee, C. K. (1999). "From Organized Dependence to Disorganized Despotism: Changing Labour Regimes in Chinese Factories." The China Quarterly, 157: 44-71.
Li, L. and K. O'Brien (1996). "Villagers and Popular Protest in Contemporary China." Modern China 22, 1: 28-61.
Lin, L. (2004). "This Year's May Protesters - over 1.5 Million." Renminbao. 2004.06.21. Lipton, M. (1977). Why Poor People Stay Poor: Urban Bias in World Development.
Cambridge, Harvard University Press.
Wallace – Directing Urbanization, Defining Unrest, and Distributing Transfers in China 35
Lohmann, S. (1994). "The Dynamics of Informational Cascades: The Monday Demonstrations in Leipzig, East Germany, 1989-91." World Politics 47, 1: 42-101.
Lorentzen, P. (2006). "Regularized Rioting: The Strategic Toleration of Public Protest in China." Manuscript.
Lu, M. and C. Weimer (2005). "An End to China’s Agriculture Tax." China: An International Journal 3, 2: 320-329.
Mann, J. (2007). The China Fantasy: How Our Leaders Explain Away Chinese Repression. New York, Viking Adult.
Naoi, M. (2006). "China: Economic Openness and Representation as Endogenous Forces." Manuscript.
Naughton, B. (1996). Growing out of the Plan: Chinese Economic Reform, 1978-1993. Cambridge (England), New York.
O'Brien, K. (1996). "Rightful Resistance." World Politics 49, 1: 31-55. Oi, J. (1989). State and Peasant in Contemporary China. Berkeley, University of
California Press. Oi, J. C. (1999). Rural China Takes Off: Institutional Foundations of Economic Reform.
Berkeley, University of California Press. Oi, J. C. (2005). "Patterns of Corporate Restructuring in China: Political Constraints on
Privatization." The China Journal, 53. Oksenberg, M. and J. Tong (1991). "The Evolution of Central-Provincial Fiscal Relations
in China, 1971-1984: The Formal System." The China Quarterly, 125: 1-32. Pan, P. (2005). "Chinese Peasants Attacked in Land Dispute." The Washington Post.
2005.06.15. Reuters (2006). "China Says Protests, Riots Down a Fifth This Year." 2006.11.06. Shen, J. (2006). "Estimating Urbanization Levels in Chinese Provinces in 1982-2000."
International Statistical Review 74, 1: 89-107. Shih, V. and Z. Qi (2007). "Who Receives Subsidis? A Look at the County Level in Two
Time Periods." in Paying for Progress in China. V. Shue and C. Wong, eds. London, Routledge.
Shirk, S. (1993). Political Logic of Economic Reform in China. Solinger, D. J. (2001). "Research Report: Why We Cannot Count the "Unemployed"."
The China Quarterly, 167: 671. Soong, R. (2005). The Shengyou Reporter's Field Notes. Eswn. Tanner, M. S. (2004). "China Rethinks Unrest." The Washington Quarterly 27, 3: 137–
156. United Nations (1974). Methods for Projections of Urban and Rural Population. Wallace, J. (2007). "Cities and Stability: Managing Urbanization in China." Manuscript. Wang, F.-L. (2004). "Reformed Migration Control and New Targeted People: China's
Hukou System in the 2000s." The China Quarterly: 115-132. Wang, S. (2004). "For National Unity: The Political Logic of Fiscal Transfer in China."
Nationalism, Democracy and National Integration in China, London: RoutledgeCurzon.
Wang, Z. and L. Zhou (2006). "Hukou Blamed for Compensation Discrepancy." China Daily. 2006.01.27.
Wallace – Directing Urbanization, Defining Unrest, and Distributing Transfers in China 36
World Bank (2006). China: Revitalizing the Northeast -- Towards a Development Strategy.
Xinhua (2005). "China to Promote Rural Cooperative Medical System." People's Daily Online. 2005.08.11.
Xinhua (2006a). "China's Cpi up 1.8% in 2005." People's Daily Online. 2006.01.26. Xinhua (2006b). "China to Spend 14% More in Building 'New Countryside'." Gov.cn.
2006.03.05. Xinhua (2006c). "Full Text: Report on China's Central and Local Budgets - Ii." People's
Daily Online. 2006.03.15. Xinhua (2006d). "Zhongyang He Difang Caizheng Jiang Xinzeng Nongcun Yiwu Jiaoyu
Jingfei 2182 Yi Yuan (Central and Local Budgets Newly Add 218 Billion on Rural Compulsory Education)." Gov.cn. 2006.03.06.
Xinjingbao (2005). "Shubai Ren Chi Zhuqiang Goudao Xiji Dingzhou Cunmin Duo 6 Ming (Hundreds Attack Villagers in Dingzhou with Guns and Knives, 6 Lives Lost)." Xinjingbao (The Beijing News). 2005.06.13.
Yan, Y., L. Zhang, H. H. Wang, and S. Rozelle (2006). "Insuring Rural China's Health? An Empirical Analysis of China's New Cooperatie Medical System." Manuscript.
Yang, D. L. (2006). "Economic Transformation and Its Political Discontents in China: Authoritarianism, Unequal Growth, and the Dilemmas of Political Development." Annual Review of Political Science 9, 1: 143-164.
Yang, H., ed. (2002). Quntixing Shijian Yanjiu (Mass Incident Research). Beijing, Chinese People's Public Security University Press.
Zhang, W., X. Li, and H. Cui (2005). China's Inter-Census Survey in 2005, National Bureau of Statistics.
Zhongguo Caizheng Bu (Chinese Ministry of Finance). Various Years-a. Difang Caizheng Tongji Ziliao (Local Government Finance Statistics). Beijing, Chinese Statistics Press.
Zhongguo Caizheng Bu (Chinese Ministry of Finance). Various Years-b. Zhongguo Caizheng Nianjian (Government Finance Yearbook). Beijing, Chinese Statistics Press.
Zhongguo Tongji Bu (Chinese National Bureau of Statistics). 2006. 2005 Quanguo 1% Renkou Chouyang Diaocha Ziliao (2005 1% Population Random Sample Survey). Beijing, Chinese Statistics Press.
Zhongguo Tongji Bu (Chinese National Bureau of Statistics). Various Years. Zhongguo Tongji Nianjian (China Statistical Yearbook). Beijing, Chinese Statistics Press.