citizen science in gis - tpingel.comtpingel.com/documents/presentations/pingel. 2015-02-21....
TRANSCRIPT

Citizen Science with Open Source GIS
Thomas J. PingelDepartment of GeographyNorthern Illinois University
30th Annual Illinois Lakes Management Conference, DeKalb, IL, 19-21 February 2015

Agenda
• New opportunities for citizen scientists
• An introduction to Geographic Information Systems
• Open Source tools for GIS
• Hands-on activities• Working with an open source
GIS (QGIS)• Capturing data with
smartphones

Citizen Science
• Term just added to the Oxford English Dictionary in June 2014• “Scientific work undertaken by
members of the general public, often in collaboration with or under the direction of professional scientists and scientific institutions.”
• Citizen Scientists• Provide experimental data
• Raise new questions
• Co-create scientific culture
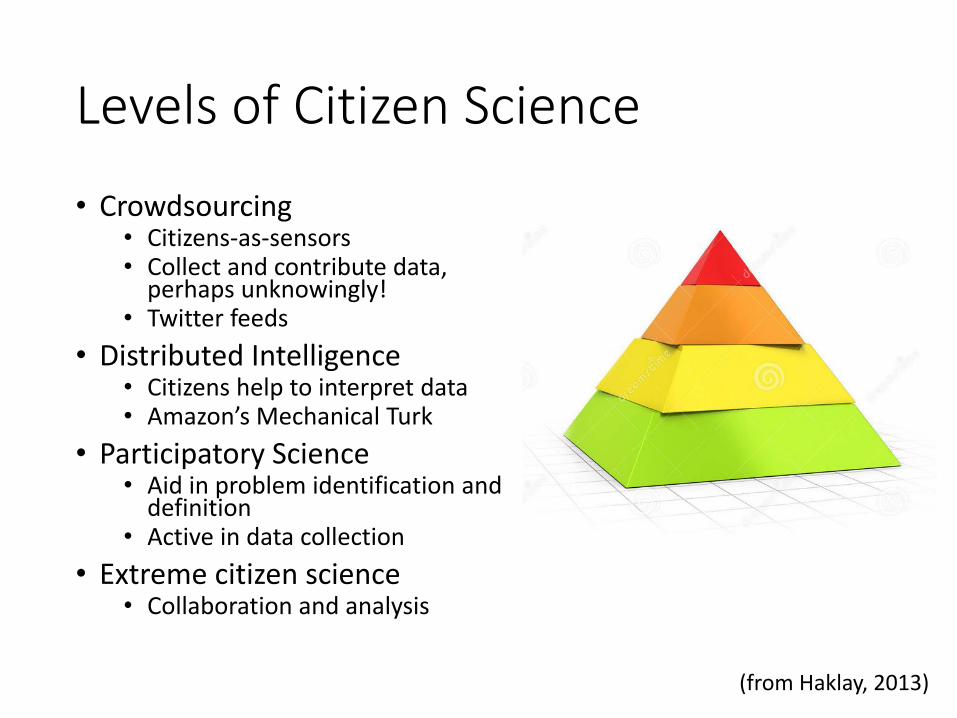
Levels of Citizen Science
• Crowdsourcing• Citizens-as-sensors• Collect and contribute data,
perhaps unknowingly!• Twitter feeds
• Distributed Intelligence• Citizens help to interpret data• Amazon’s Mechanical Turk
• Participatory Science• Aid in problem identification and
definition• Active in data collection
• Extreme citizen science• Collaboration and analysis
(from Haklay, 2013)

The GIS community has been interested in citizen participation for a long time.

OpenStreetMap is an organization devoted to helping citizens build maps of their communities.
http://www.openstreetmap.org/
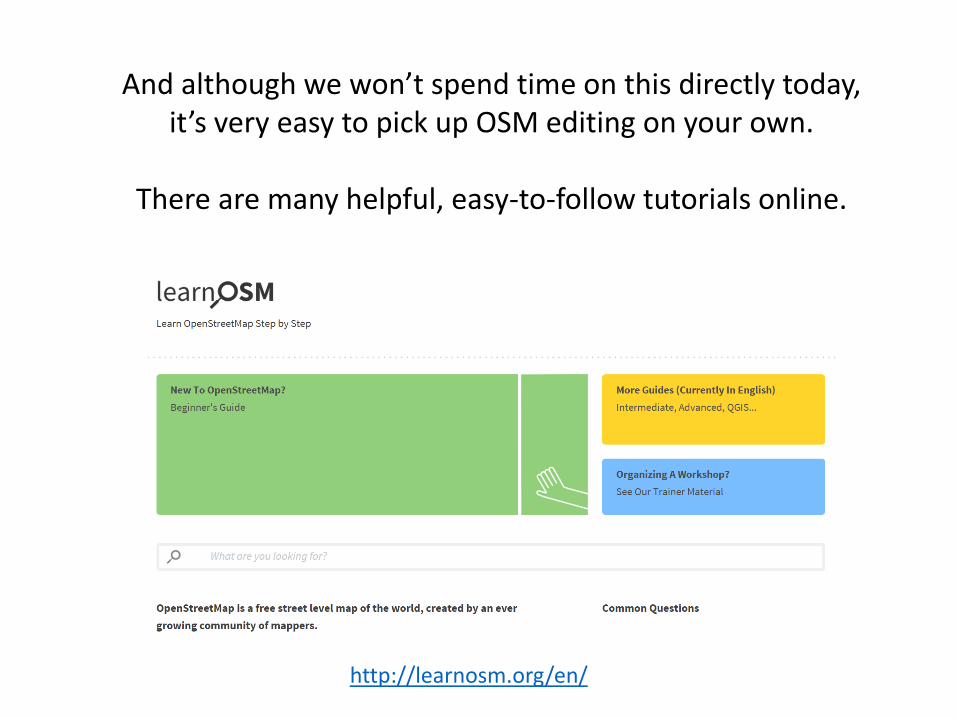
And although we won’t spend time on this directly today, it’s very easy to pick up OSM editing on your own.
There are many helpful, easy-to-follow tutorials online.
http://learnosm.org/en/

http://hot.openstreetmap.org/
The Humanitarian OpenStreetMap Team (HOT) takes this a step further by helping to aid in disaster
mapping and preparedness worldwide.

One of the most promising developments for citizen geoscience is the development of a very good, open source, free GIS:
QGIS(formerly Quantum GIS)

QGIS allows for more than just mapping.
It puts the tools for visualization and analysisin your hands.

However, GIS is a big topic.
The tool requires some basic knowledge of how geographic information is created, manipulated, stored, and represented.
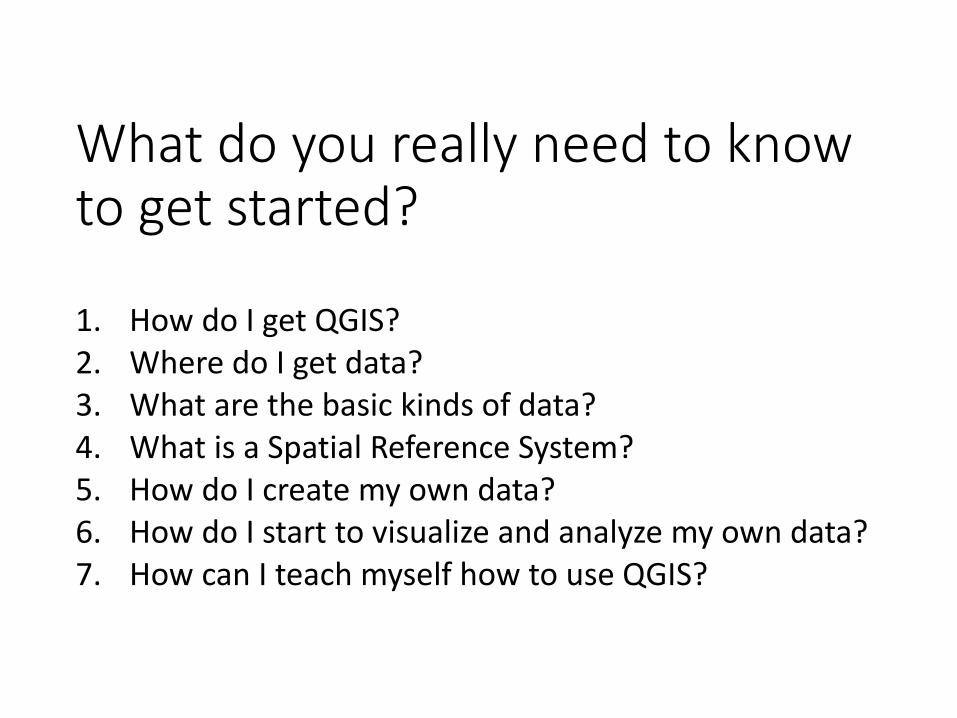
What do you really need to know to get started?
1. How do I get QGIS?2. Where do I get data?3. What are the basic kinds of data?4. What is a Spatial Reference System?5. How do I create my own data?6. How do I start to visualize and analyze my own data?7. How can I teach myself how to use QGIS?
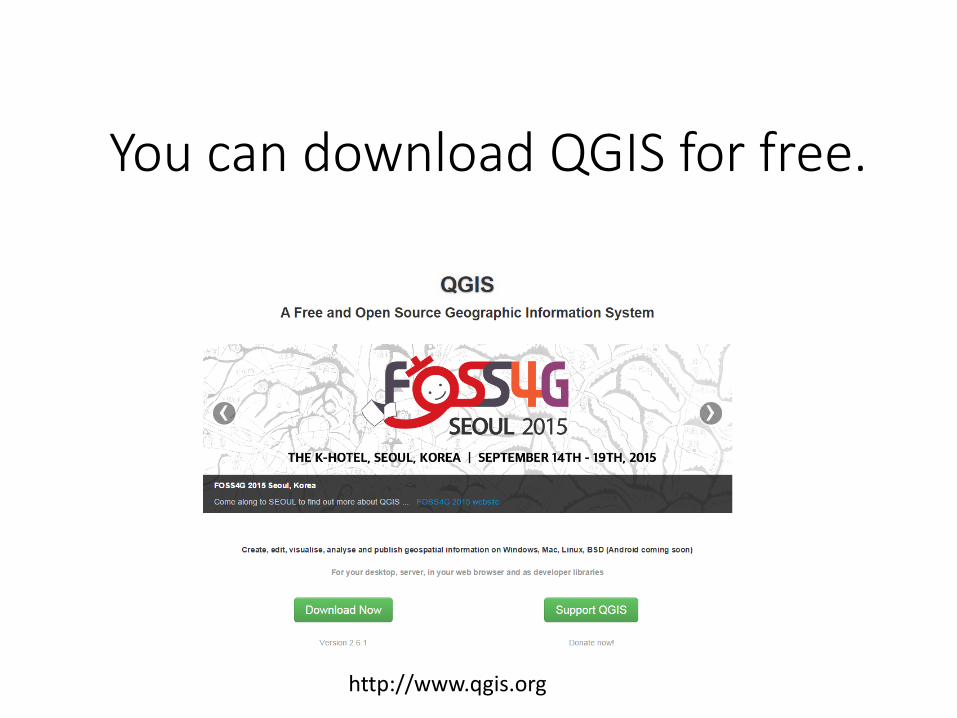

Versions exist for most platforms.
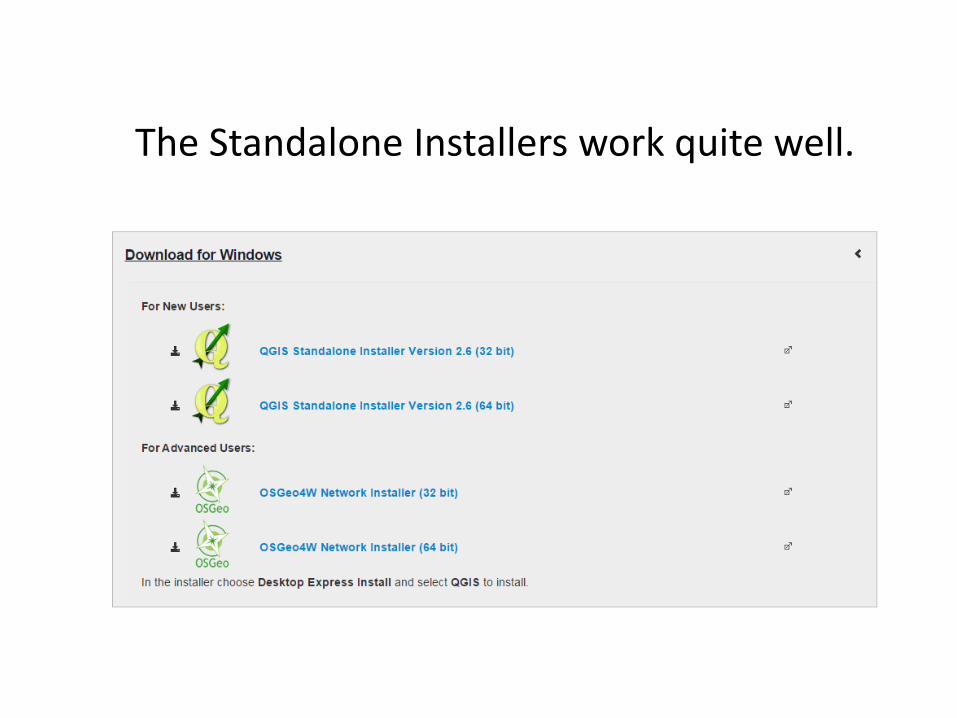
The Standalone Installers work quite well.
There are four good places to start looking for data.
1. Most counties in Illinois have a GIS department with locally relevant layers of data.
2. The National Map will have many layers of interest, including hydrology, elevation information, and aerial imagery.
3. Natural Earth contains many larger features and context data (e.g., administrative boundaries) that you might want.
4. Plug-ins exist for QGIS to include some layers (such as OpenStreetMap data)

http://www.cookcountyil.gov/cook-county-gis/
A simple Google search will often be enough to get you started.
Example search: Cook County GIS

The National Map is often a great first-stop.
Much of the data has been aggregated for you.
It can also be difficult to navigate, but gets easier once you get the hang of the process.
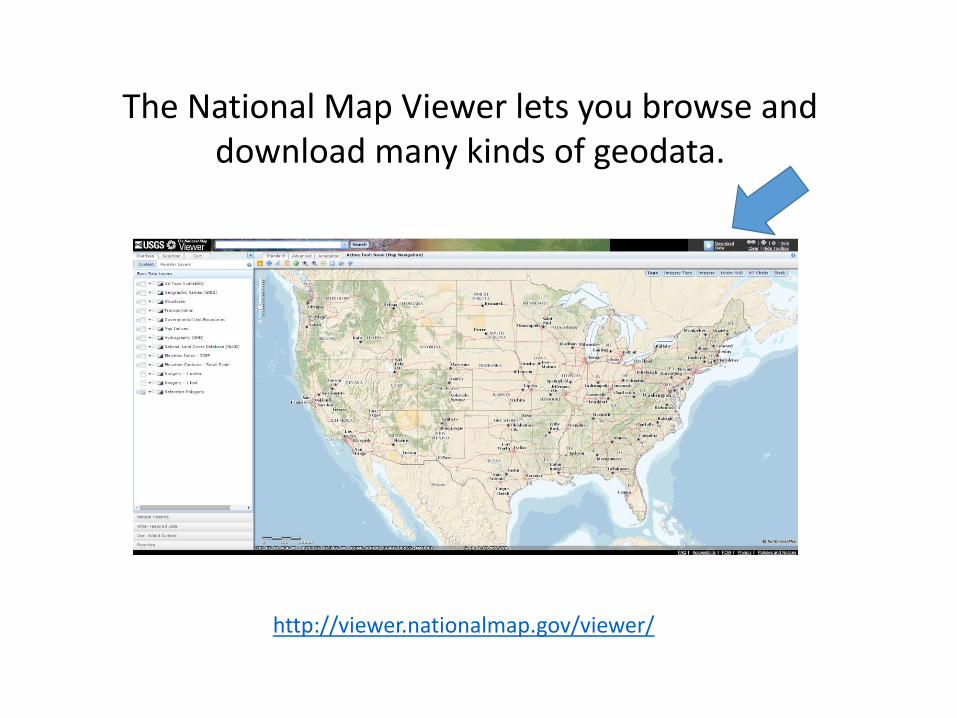
http://viewer.nationalmap.gov/viewer/
The National Map Viewer lets you browse and download many kinds of geodata.


On the next dialog, you’ll be asked to choose which kind of data you are interested in.
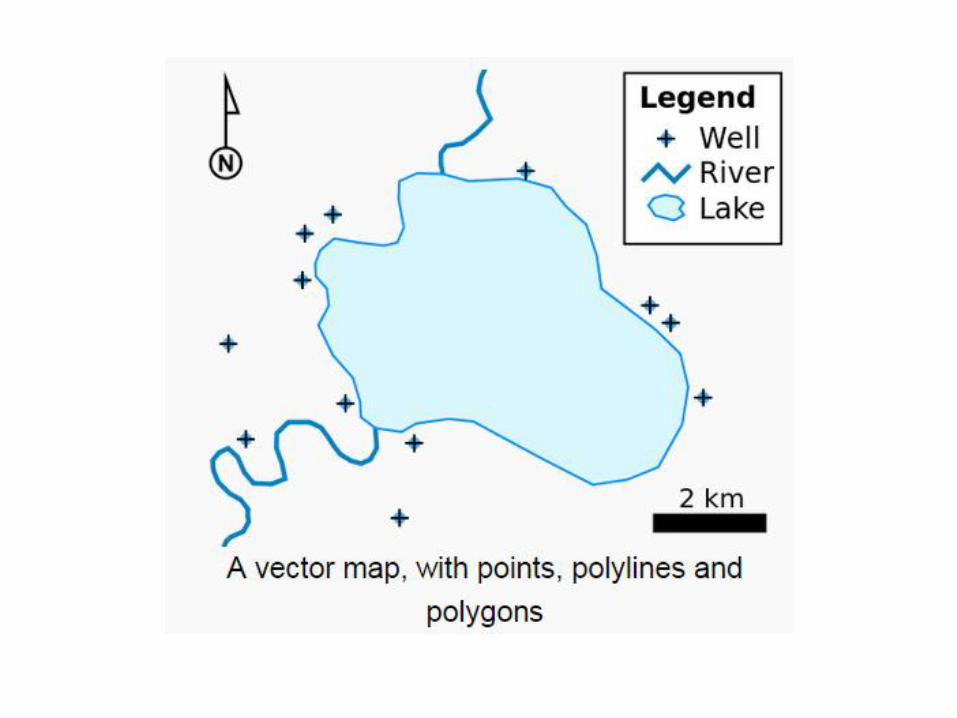
These come in three different formats.

You are interested in shapefiles, which are a common way to exchange vector geodata.
Vector data contains points, lines, and polygons.
raster vector
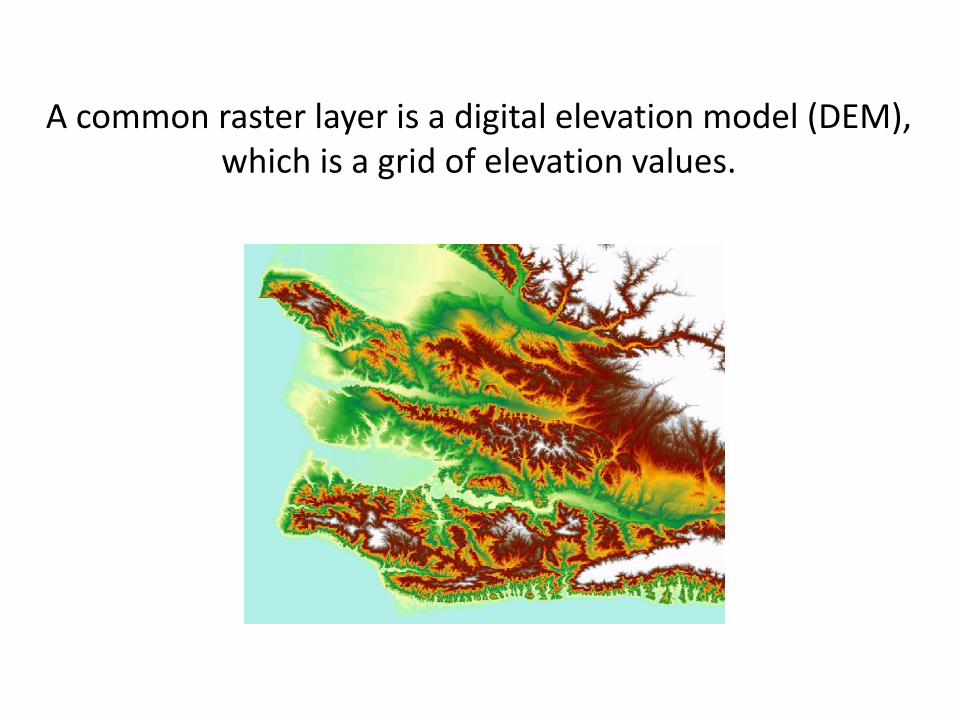
A common raster layer is a digital elevation model (DEM), which is a grid of elevation values.
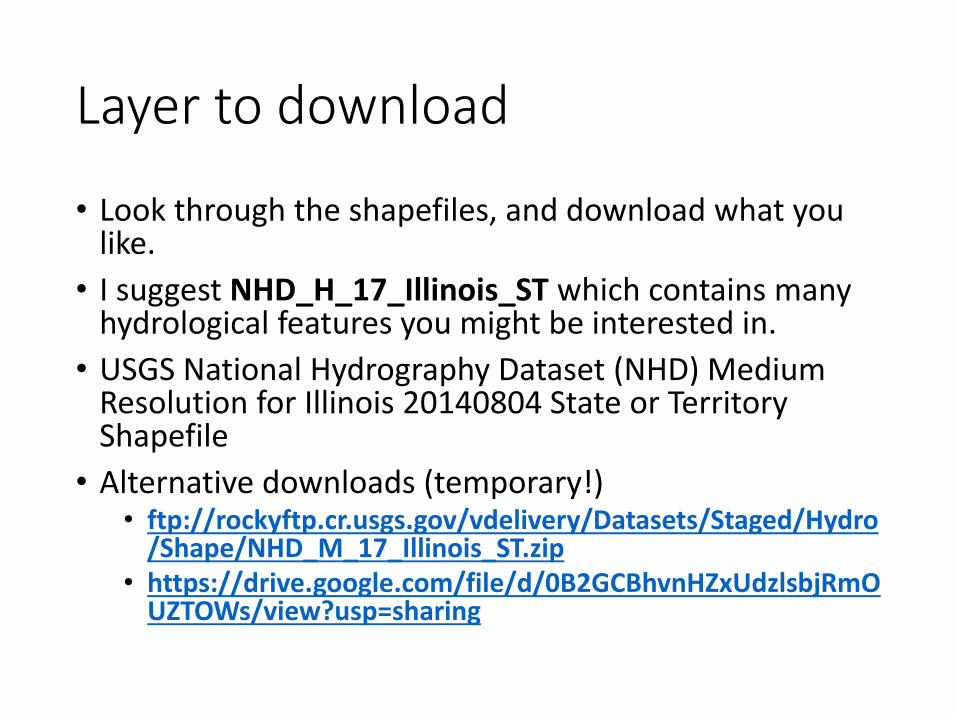
Layer to download
• Look through the shapefiles, and download what you like.
• I suggest NHD_H_17_Illinois_ST which contains many hydrological features you might be interested in.
• USGS National Hydrography Dataset (NHD) Medium Resolution for Illinois 20140804 State or Territory Shapefile
• Alternative downloads (temporary!)• ftp://rockyftp.cr.usgs.gov/vdelivery/Datasets/Staged/Hydro
/Shape/NHD_M_17_Illinois_ST.zip• https://drive.google.com/file/d/0B2GCBhvnHZxUdzlsbjRmO
UZTOWs/view?usp=sharing
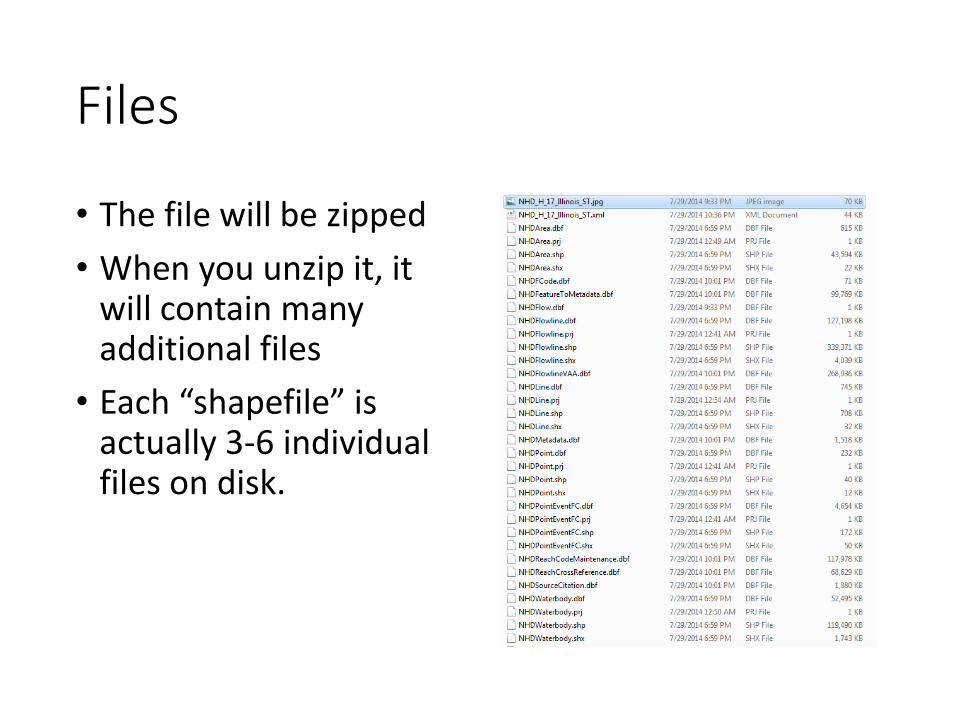
Files
• The file will be zipped
• When you unzip it, it will contain many additional files
• Each “shapefile” is actually 3-6 individual files on disk.

A GIS isn’t like Google Maps.When you start, the map window is generally blank.

QGIS features a plug-in system that extends the base functionality.
One great plug-in is OpenLayers, which allows you to load many basemaps.

You can install them from the Plugins Manager.

Once installed, you can find the OpenLayersplugin under the web menu.

But before we start adding layers, let’s talk about Spatial Referencing Systems.

Latitude and Longitude you probably already know.
But these depend on an estimation of the size of the Earth, and those estimates have changed over time.
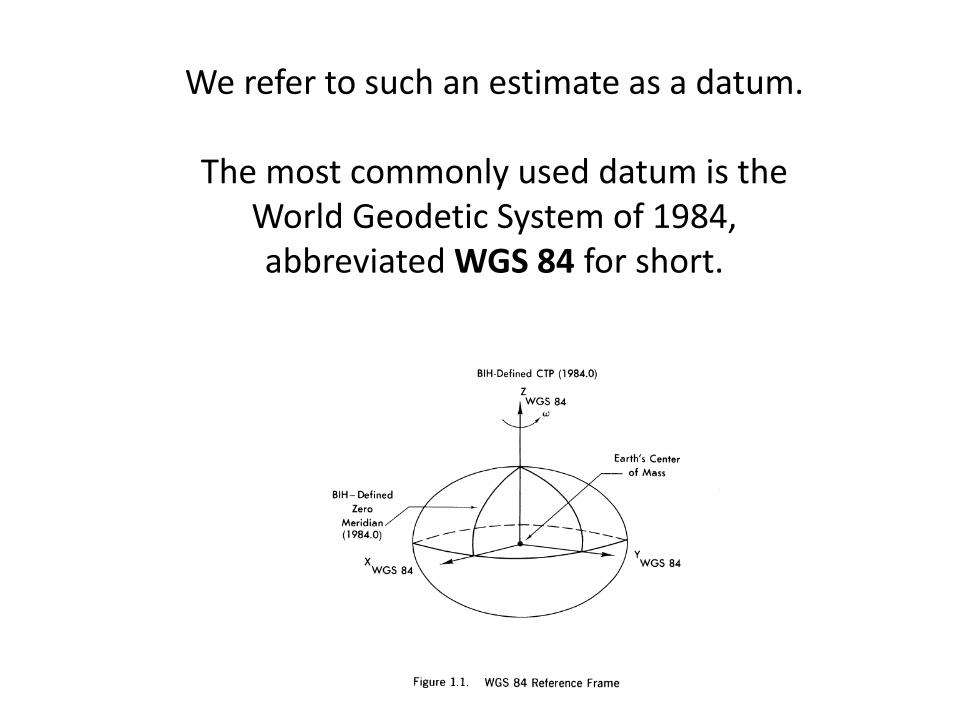
We refer to such an estimate as a datum.
The most commonly used datum is the World Geodetic System of 1984, abbreviated WGS 84 for short.

Web maps, including Google Earth, almost always use projected data because it helps preserve shape.
Most web maps use a Web Mercator Projection.
Why do we care?
• Because two geographic datasets that use different referencing systems will have different coordinates
• As a result, they may not line up correctly in the GIS
• GIS are supposed to handle this in the background, but that only works if the geodata was tagged correctly.
• In practice, this is uncertain.

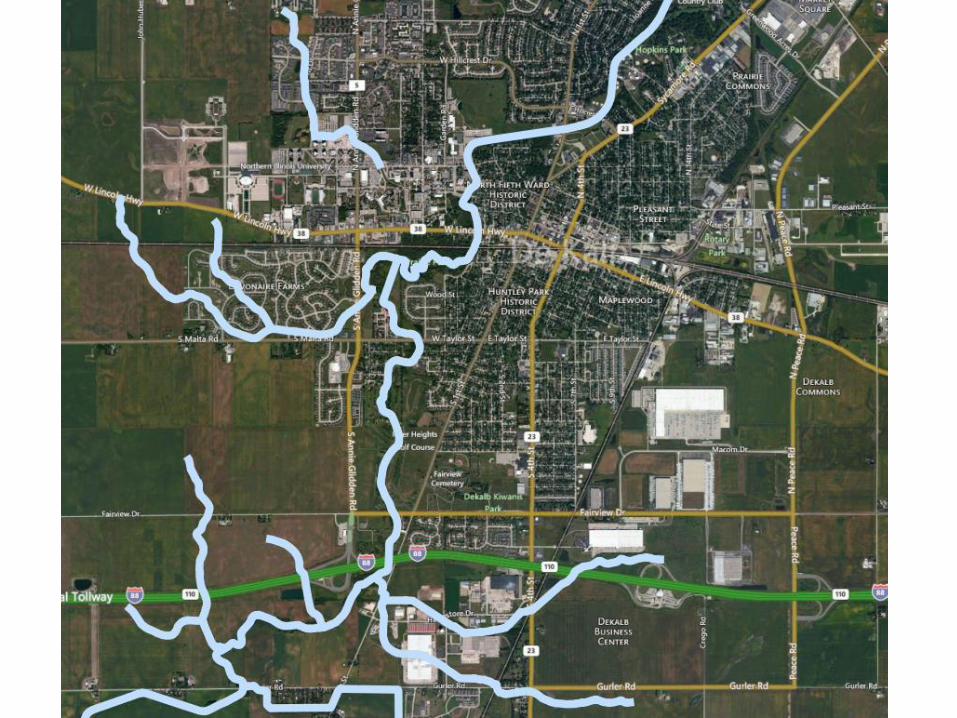
These are flow lines from the National Hydrological Dataset.
Note the coordinates are longitude, latitude.
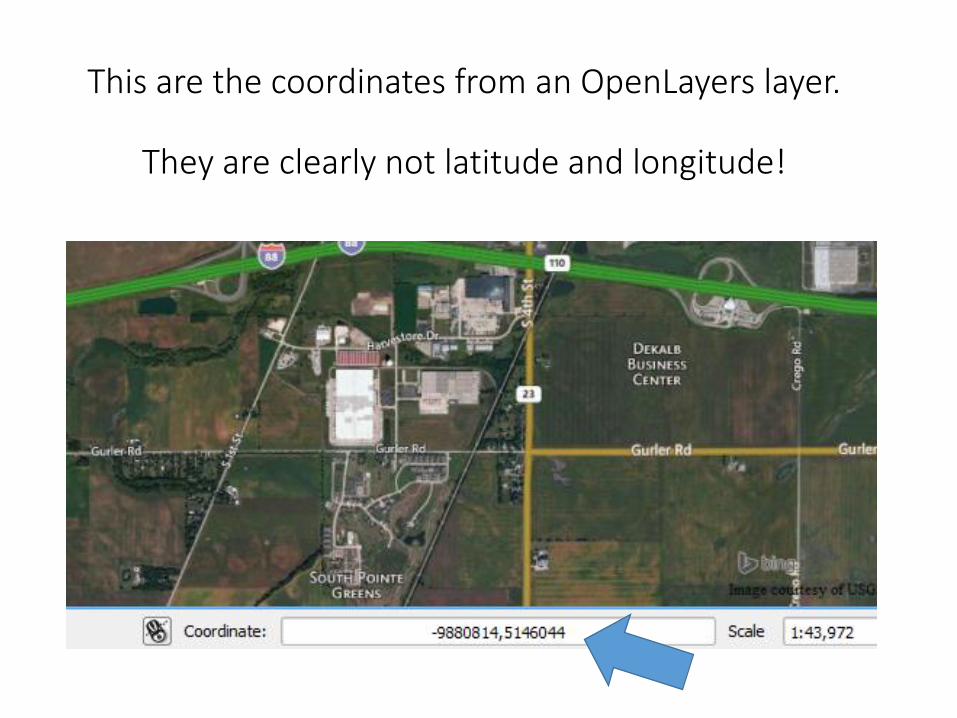
This are the coordinates from an OpenLayers layer.
They are clearly not latitude and longitude!

If you run into trouble, you can declare the SRS explicitly in Project Properties.
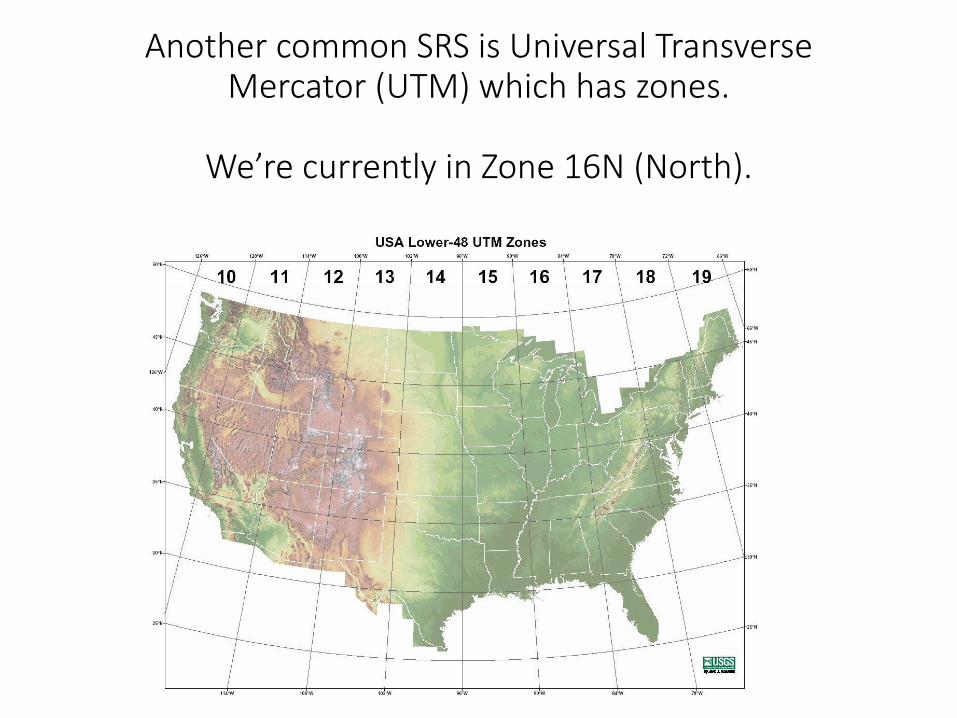
Another common SRS is Universal Transverse Mercator (UTM) which has zones.
We’re currently in Zone 16N (North).
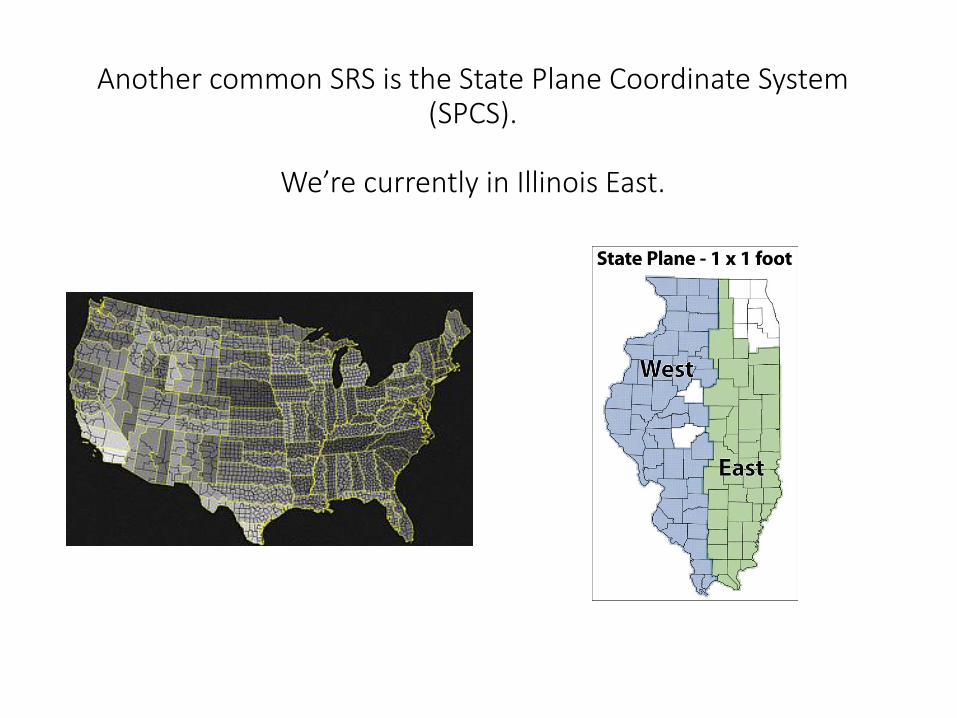
Another common SRS is the State Plane Coordinate System (SPCS).
We’re currently in Illinois East.

Getting your data on the map
• Layers can be created in GIS• Digitizing lake boundaries from an aerial photo
• Layers can be created with GPS and uploaded• We’ll try this after we work with QGIS in lab.
• Many smartphones have applications to handle this
• Many formats of data• KML – Keyhole Markup Language for Google Earth / Maps
• CSV – Comma Separated Values
• GPX – Very common GPS format
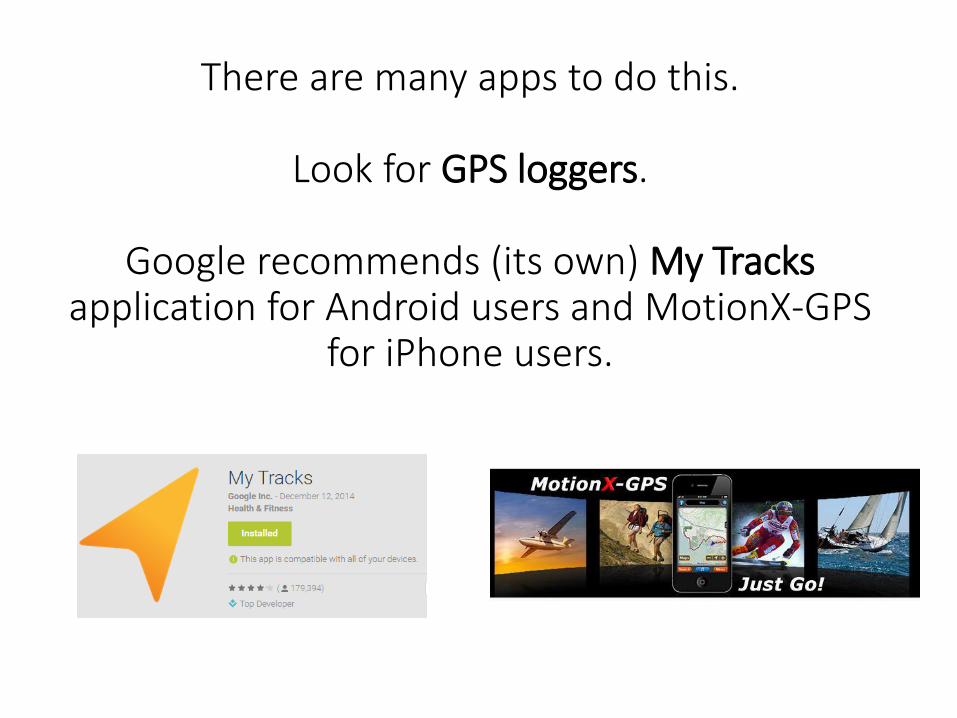
There are many apps to do this.
Look for GPS loggers.
Google recommends (its own) My Tracksapplication for Android users and MotionX-GPS
for iPhone users.

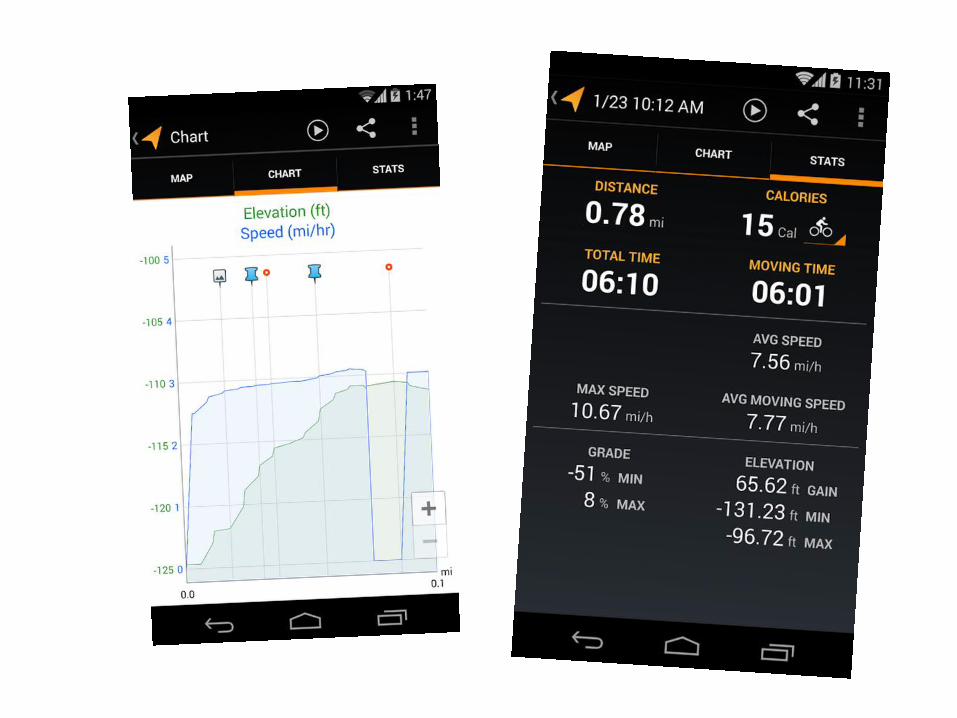

Once recorded, tracks can be exported to disk (I recommend as GPX) and shared (emailed).
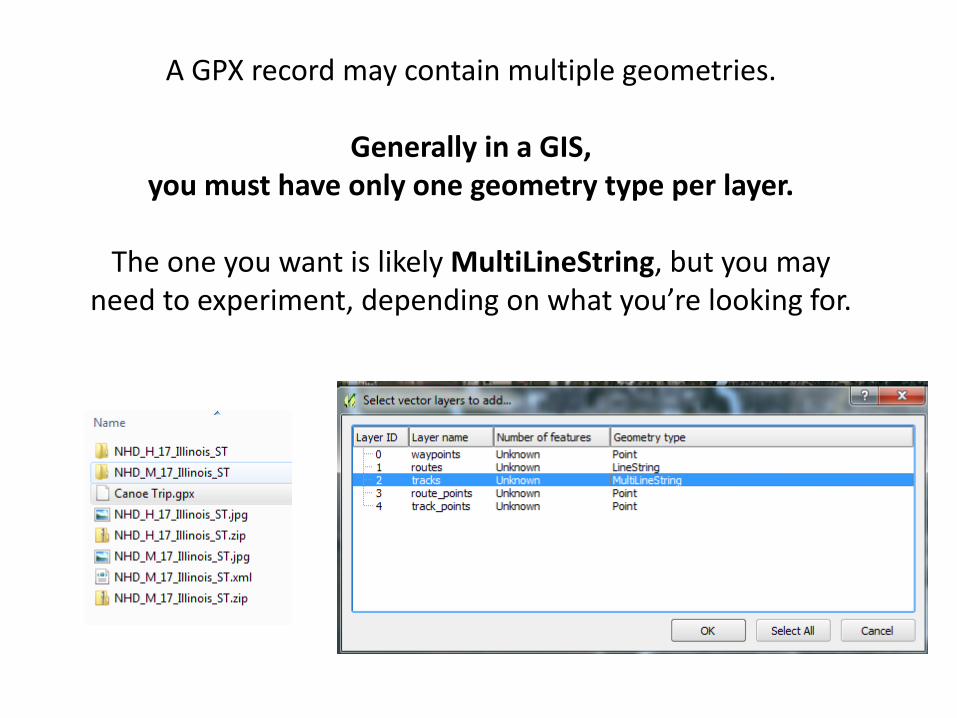
A GPX record may contain multiple geometries.
Generally in a GIS, you must have only one geometry type per layer.
The one you want is likely MultiLineString, but you may need to experiment, depending on what you’re looking for.
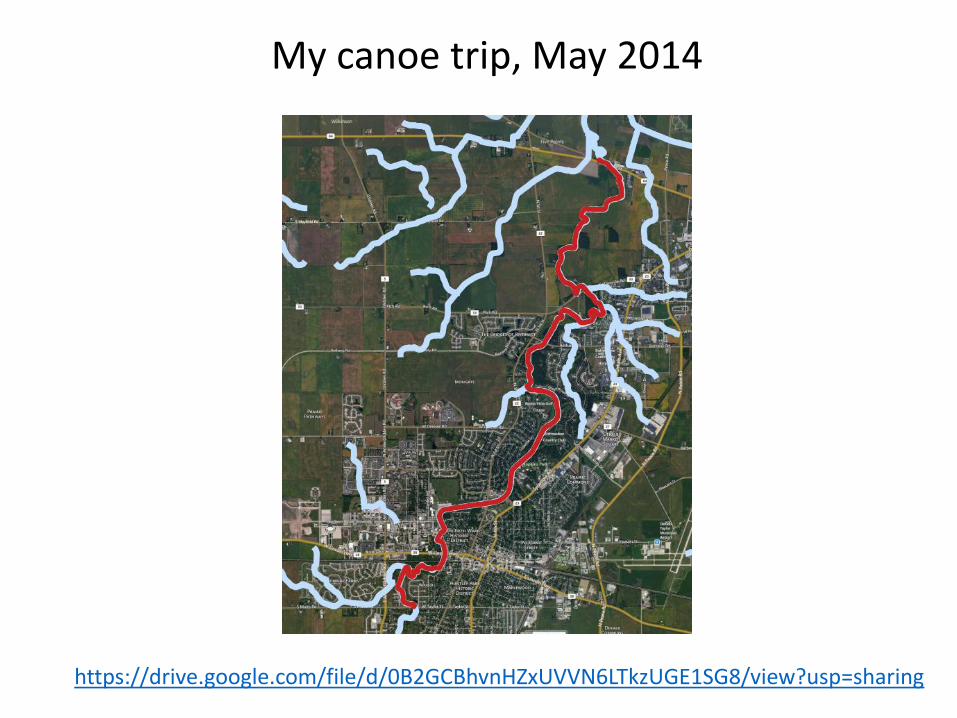
My canoe trip, May 2014
https://drive.google.com/file/d/0B2GCBhvnHZxUVVN6LTkzUGE1SG8/view?usp=sharing
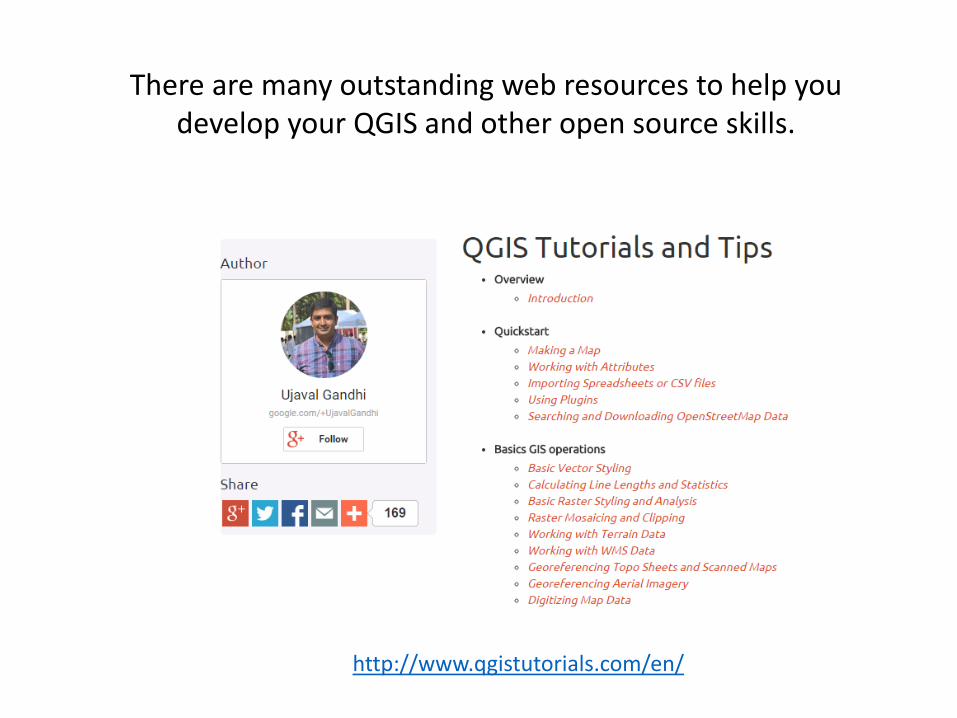
There are many outstanding web resources to help you develop your QGIS and other open source skills.
http://www.qgistutorials.com/en/

Thanks for you attention!
• Now, let’s give it a try.
• We’ll work in lab for the next hour or so to download the data and work with it in QGIS.
• Then, we’ll head outside to gather our own track data.
• And finally, load that track data back inside.
• Thanks to Dustin Bergman and Kyle Whalley, NIU Geography Graduate Students

Alternative Links
• Canoe Trip
• NHD_H_17_Illinois