citizens property insurance corporation - florida's department
TRANSCRIPT

1

2
FWUA (Florida Windstorm Underwriting Association)
created in 1972 to provide wind-only coverage in coastal regions.
and the
FRPCJUA (Florida Residential Property and Casualty Joint Underwriting Association)
created in December, 1992 following Hurricane Andrew for hundreds of thousands of Floridians unable to find homeowners insurance.
merged in 2002, creating
Citizens Property Insurance CorporationOffers wind-only and all-perils property insurance coverage to Floridians without private
insurance options
Creation of Citizens Property Insurance CorporationCreation of Citizens Property Insurance Corporation

3
Citizens is an Important Safety Net for FloridiansCitizens is an Important Safety Net for Floridians
• Citizens is required by law to accept all applicants who are otherwise insurable but cannot find coverage in the voluntary market.
• Citizens, like most state residual market facilities is required to accept business (on an individual and aggregate basis) that voluntary insurers will not write.
• Citizens requires applicants and agents to sign an affidavit on the application that they do not have a voluntary insurer that will insure them.

4
Citizens is Required to Insure More Loss Exposure Than Any PrivaCitizens is Required to Insure More Loss Exposure Than Any Private te Insurer Would Ever Consider:Insurer Would Ever Consider:
Voluntary Insurers PortfolioCitizens High Risk Account Risk
Total Insurance in Force = $116B
Insurance in Forcemillions
Less than $850$850 to $2,500
$2,500 to $6,000$6,000 to $15,000Greater than $15,000
Total Insurance in Force = $116B
Insurance in Forcemillions
Less than $108$108 to $600$600 to $1,200
$1,200 to $2,000Greater than $2,000

5
Citizens Ends Up Insuring the Citizens Ends Up Insuring the ““ToughestToughest”” RisksRisks
• This is especially true in the HRA for hurricane exposure
• Coastal Concentration
• Older Homes
• Manufactured Housing and Mobile Homes
• Sinkholes

6
• Excluding processing from outsource vendor McNeil group, Citizens processed the following number of applications and policy changes inin oneone monthmonth (June, 2005):
Personal Lines Account (PLA) :Applications – 10,278Endorsements – 2,617Cancellations – 7,610Reinstatements – 6,781
Commercial Lines Account (CLA, residential):Applications – 277Endorsements – 130
High Risk Account (HRA):Applications – 9,295Endorsements – 18,446
• For the month of June, 2005 the call volume in Citizens’ Agent Assistance Call Center (TRC) was approximately 79,400 incoming calls from agents and policy holders.
Operating Statistics Operating Statistics –– Sample Month, June 2005Sample Month, June 2005

7
CitizensCitizens’’ 2004 Deficit and Assessment 2004 Deficit and Assessment -- PerspectivePerspective
8
CitizensCitizens’’ 2004 Deficit and Assessment 2004 Deficit and Assessment -- PerspectivePerspective
• The previous slide looked catastrophic, didn’t it?
• It represents a two-block region of Walton County.
• It represents $50 million in potential insured losses.
• Walton County is not even in Citizens’ Top 10 exposed counties.

9
History of AssessmentsHistory of Assessments
•The two predecessor organizations (FRPCJUA and FWUA) have collectively levied 11 regular assessments.
•Below is a listing of the assessment percentage by year:NOTE: The HRA did not cover Dade, Broward, or Palm Beach Counties until after Hurricane Andrew struck.
Year Account Principal Storm(s) Assessment Amount1998 HRA
1995 PLA Hurricane Opal 22.8 million
HRA
HRA
1994 PLA Non-hurricane 17.7 million
HRA
HRA
HRA
HRA
Hurricane George and Tropical Storm Mitch $100.0 million
1995 Hurricane Opal 84.0 million
1995 Hurricane Erin 33.0 million
1993 Winter Storm 3.2 million
**1992 Hurricane Andrew 16.2 million
1985 Hurricane Elena 3.2 million
1975 Hurricane Eloise 5.0 million

10
Recent HeadlinesRecent Headlines
AFTER KATRINA, THREE STATES’ HIGH-RISK POOLS ARE LIKELY
TO ASSESS (BESTWIRE)
MISSISSIPPI LAST RESORT INSURER ISSUES $10 MILLION ASSESSMENT (BESTWIRE)
UPDATED RITA DAMAGE FORECAST: UP TO $6 BILLION
Insured damage total would make hurricane one of 10 costliest in U.S. (MSNBC)

11
Assessment Assessment –– Questions AnsweredQuestions Answered
• What is an assessment and why is it needed? As a result of last year’s unprecedented storms, Citizens Property Insurance Corporation incurred more than $1.8 billion in losses to its High Risk Account. Because of these losses, Citizens now has a shortfall of approximately $516 million. Under Florida law this amount must be recouped by a one-time assessment on property insurance companies statewide, to ensure Citizens is able to pay claims in the event of future storms.
• May insurance companies pass this cost on to their customers? Yes. Insurance companies must file with OIR to be able to add a one-time surcharge to their policyholders’ annual premium. Companies may only recoup what was paid to Citizens.
• How much will the average consumer pay?
On average, the surcharge will be 6.8 percent of the annual premium. A consumer with an annual premium of $1,000 will pay a surcharge of approximately $70. An consumer with an annual $1,500 premium would receive a surcharge of around $100.
• Are Citizens’ policyholders subject to a surcharge?
Yes. In order to ensure Citizens’ policyholders are treated the same as other Floridians, Citizens will add a surcharge of approximately 6.8 percent to all new and renewal policies. Citizens plans to request this surcharge before the end of 2005.

12
2004 Losses at2004 Losses at--aa--glanceglance
Total Paid &
PLA/CLA Total Incurred Remaining Case Reserves
As of 12/31/04 As of 07/31/05
Charley 134,208,738 144,732,959
Frances 268,205,489 270,604,305
Ivan 44,656,468 51,835,133
Jeanne 154,485,526 129,609,963
Total $601,556,221 $596,782,360
Total Paid &
HRA Total Incurred Remaining Case Reserves
As of 12/31/04 As of 07/31/05
Charley 295,849,717 340,877,017
Frances 683,322,929 758,976,621
Ivan 563,733,383 669,563,033
Jeanne 263,099,347 279,111,531
Total $1,806,005,376 $2,048,528,202

13
The effect of highThe effect of high--value home losses on Citizensvalue home losses on Citizens’’ 2004 deficit2004 deficit
• Of the $1.8 billion in HRA account losses, approximately $24.4 million can be attributed to claims on residential properties insured for more than $1 million.
• This represents a little more than 1 percent of Citizens’ total HRA losses in 2004.
– Going forward,
• Citizens insures around 5,500 homes valued at $1 million or more, which represents a sizeable portion or our overall exposure. In total, there are currently 421,000 policies now in Citizens’ HRA.
• In 2004, only 768 high-value homes experienced losses, primarily due to the geographic impact of last year’s storms.

14
2005 Catastrophe Claims Results2005 Catastrophe Claims Results
Dennis Claims Status Katrina Claims StatusReported Closed % Closed Reported Closed % Closed
PLA 1,039 909 87.5% PLA 9,907 3,259 32.9%
HRA Residential 4,366 3,797 87.0% HRA Residential 10,505 4,114 39.2%
HRA Commercial 397 293 73.8% HRA Commercial 900 437 48.6%
CLA (8/31/05) 22 7 31.8% CLA (8/31/05) 221 3 1.4%
Note: PLA and HRA results are as of September 26, 2005

15
2005 Catastrophe Claims Improvements2005 Catastrophe Claims ImprovementsFollowing last year’s devastating hurricanes…
• Citizens made a number of changes to its infrastructure, including significantly expanding Catastrophe Claims Department.
• Citizens changed its adjuster management philosophy. Prior to last year’s storm season, Citizens relied solely on outside, contractual adjusters to handle all aspects of hurricane claims, including customer service. Beginning with the 2005 storm season, Citizens directly manages both company employees and adjusting firms in the processing and payment of claims. Under this new system, Citizens’Catastrophe Team will provide more efficient claims handling and better overall customer service.
• Citizens will establish a regional claims service office in Miami-Dade County this year, with additional offices expected to come online in 2006. Nearly 25 percent of all Citizens policyholders are located in Miami-Dade County.
• Citizens has added enhanced technology and increased customer service staff levels for its consumer hotline. Citizens’ hurricane claims reporting hotline is 1-866-411-2742.

16
2005 Cat Plan Overview2005 Cat Plan Overview• Transition to a Traditional IA Model
– Increased Adjusting Capacity– Elimination of Subcontractor Relationships– Mitigation of Operation Issues– Utilization of Non-Traditional Resources– Improved File Quality– Reduced Complaint Ratio– Improved Management of Indemnity and LAE
Dollars
• Acquisition of Key Catastrophe Resources– New Model– Planning and Preparedness– Direct Supervision of Field Adjusters– Development of Administration Plan– Modifications to Operations Plan– Catastrophe Office Staffing
• Vendor Solicitation, Selection and Contracting– New Model– Performance Based Contracts– Training– Non Catastrophe Claim Handling
• Operational Plan Modifications– Utilization of Regional Offices– Utilization of Non-Catastrophe Claims Staff– Agent Involvement– Claims Administration Plan – Claims Guide Changes
• Claim Tracking System
• Development of Administrative Plan
•Dispatch •File Review
•Accounting •Fast Track
•Claims Administration •SIU
•Underwriting •Litigation
•Adjuster Licensing •Mediation
•Orientation •Utilization
•Temporary Staff Utilization
•Complaints
•Training Guides •Resolutions
•Facilities

17
Citizens Policy Counts by Year and AccountCitizens Policy Counts by Year and Account
ACCOUNT/
YEAR
PLA CLA HRA Total
1996* 936,837 0 465,739 1,402,576
2001 102,792 198 414,123 517,113
2002 205,256 2,356 397,676 605,288
2003 383,280 3,919 433,056 820,255
2004 416,529 3,702 453,765 873,996
2005** 350,796 3,315 421,119 775,230
* Highest ever policy count for PLA.** As of August 31, 2005

18
HRA Exposure and Policy Count by County (6/05)HRA Exposure and Policy Count by County (6/05)

19
PLA/CLA Exposure and Policy Count by County(6/05)PLA/CLA Exposure and Policy Count by County(6/05)

20
The Success of Takeout Programs Since 1996The Success of Takeout Programs Since 1996
Number of takeout companies that removed bonus eligible policies: 30
Net number of policies funded in escrow: 1,389,869
Net bonus amount funded in escrow: $205,763,726

21
• Citizens is required by Florida law to design incentive programs and make every best effort to encourage licensed insurance companies to assume policies, thereby returning its policyholders to the private market. The following incentive programs have been approved to assist in depopulation.
• Under all incentive programs, takeout companies must remove a percentage of selected policies from Miami-Dade, Broward or Palm Beach Counties. The assumption company must also retain policies for a minimum of three years to qualify for a bonus.
DepopulationDepopulation
PLA
HRA
Takeout Incentive Program A 10,000 40% 12.50%Takeout Incentive Program B 30,000 60% 15.00%Takeout Incentive Program C 50,000 80% 17.00%Takeout Incentive Program D 20,000 50% 25.00%
Miami, Broward, and Palm Beach*
Maximum Bonusas % of Premium
* Must cover residential properties with HO2 and HO3, and Dwelling Fire Policies located in Miami-Dade, Broward or Palm Beach Counties.
ProgramMinimum
Polices

22
Company Name TypePLA/HRA01/18/05
PLA/HRA02/02/05
PLA/HRA03/01/05
PLA/HRA04/05/05
PLA05/03/05
HRA05/18/05
PLA05/25/05
HRA06/29/05
PLA06/29/05
PLA/HRA08/02/05
PLA/HRA09/06/05
2005Total
To Date
Argus Fire & Casualty Ins Co PLA 7,912 3,710 11,622
Atlantic Preferred Ins Co PLA 4,584 5,258 4,164 14,006
First Home Ins Co PLA 24,480 4,598 881 29,959
Florida Peninsula Ins Co HRA 29,252 9,474 38,726
Gulfstream Property & Casualty Ins Co PLA 58,893 18,212 77,105
Security First Ins Co PLA 4,225 2,717 6,942
Service Ins Co PLA 200 257 457
Southern Fidelity Ins Co PLA 21,469 1,610 23,079
Southern Oak Ins Co PLA 8,833 2,364 4,388 1,395 1,824 16,980
United Property & Casualty Ins Co PLA 9,228 5,346 9,261 23,835
Total Actual Assumptions To Date 63,477 18,061 25,834 5,346 8,552 29,252 58,086 9,474 23,491 1,138 1,824 242,711
2005 Depopulation2005 Depopulation

23
Takeout Programs Since 2003Takeout Programs Since 2003
Name of Companies –PLA Number of Policies
Assumed
Escrowed Bonus Amount
Argus Fire and Casualty Ins. Co.Atlantic Preferred Ins. Co.Federated National Ins. Co.First Home Ins. Co.Gulfstream Property & Casualty Ins. Co.Security First Ins. Co.Service Ins. Co.Southern Fidelity Ins. Co.Southern Oak Ins Co.United Property & Casualty Universal Ins Co. Total
Name of Companies -HRA Number of Policies
Assumed
Escrowed Bonus Amount
Atlantic Preferred Ins. Co.Florida Peninsula Ins. Co. Total
11,622101,12613,81429,95977,1056,942457
23,00016,98063,37432,951
377,330
2,169,20530,455,9692,989,9215,976,21711,398,381
000
1,968,16620,507,0502,790,968
78,255,877
12,45738,72651,183
02,223,1592,223,159

24
Unless more premium is charged for policies that cost more in claim dollars, those policies will be subsidized by all the other policyholders. Some areas of subsidization that currently may exist include:
– Age of Home– Sinkhole– Coastal/Inland
Rate SubsidizationRate Subsidization

25
• Our age of home distribution shows that most of our policies are homes over 20 years old. (PLA data)
• Newer homes have better loss experience than older homes. Newer homes are subsidizing older homes.
Age of HomeAge of Home

26
Age of HomeAge of Home
These loss ratios do not include
catastrophe and sinkhole loss rations.
These loss ratios do not include
catastrophe and sinkhole loss rations.
0.0%
5.0%
10.0%
15.0%
20.0%
25.0%
30.0%
35.0%
40.0%
45.0%
50.0%
Loss
Rat
io
0 to 20 21 to 35 36 and up
Age of Home in Years
Loss Ratios by Age of Home
Loss Ratio by Age Loss Ratio All Ages
27
• Some geographic areas have had substantially worse sinkhole experience than the rest of the state. Besides claim costs, there are significant inspection expenses. Loss adjustment expenses are 12% for non-catastrophe, non-sinkhole claims but 20% for sinkhole claims.
• Pasco County accounts for over 65% of sinkhole claim dollars. (Wind exclusion policies)
• If Pasco County premiums do not cover these losses, policyholders in other parts of the state are subsidizing sinkhole losses and expenses. Current indications are that Pasco County premiums require additional increases.
SinkholesSinkholes

28
Policy Growth in Sinkhole AreasPolicy Growth in Sinkhole Areas
• Sinkholes have contributed significantly to policy growth especially in the Tampa Bay area, which includes Hernando, Hillsborough, Pasco and Pinellas counties.
• In addition, sinkhole claims have increased loss costs on multi-peril polices.
• Chart below reflects the growth patterns associated with sinkhole properties throughout Florida.
Area 12/31/2001 12/31/2002 12/31/2003 12/31/2004 Change
Tampa Bay 1,012 18,550 95,051 140,171 13751%
Dade, Broward, PB 100,723 140,193 239,441 205,644 104%
All Other 1,057 5,530 48,769 70,678 6587%
Policies in Forces, as of
29
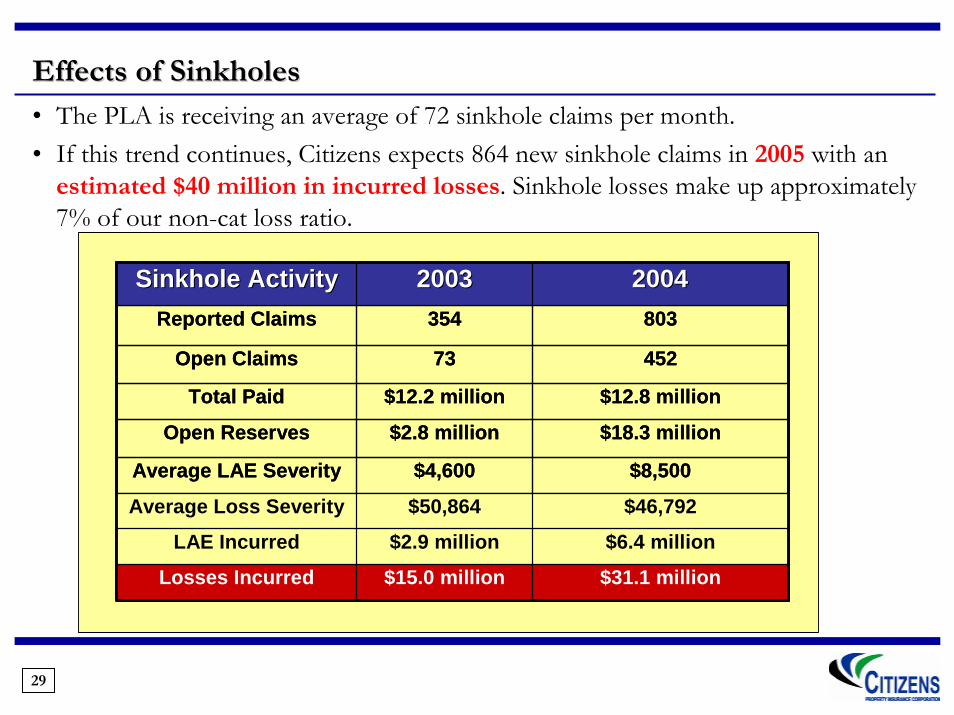
Effects of Sinkholes Effects of Sinkholes • The PLA is receiving an average of 72 sinkhole claims per month.• If this trend continues, Citizens expects 864 new sinkhole claims in 2005 with an
estimated $40 million in incurred losses. Sinkhole losses make up approximately 7% of our non-cat loss ratio.
$31.1 million$15.0 millionLosses Incurred
$6.4 million$2.9 millionLAE Incurred
Average Loss Severity
Average LAE Severity
Open Reserves
Total Paid
Open Claims
Reported Claims
Sinkhole ActivitySinkhole Activity
$8,500$4,600
$46,792$50,864
$18.3 million$2.8 million
$12.8 million$12.2 million
45273
803354
2004200420032003

30
Citizens HRA Account Citizens HRA Account –– A Reality CheckA Reality Check
1996 1997 1998 1999 2000 2001 2002 2003 2004(in thousands)
PML 2,856,247 4,756,839 5,567,641 5,343,868 4,699,000 4,995,000 5,148,000 6,574,983 7,563,805Net Income 1,789 48,783 17,220 41,081 95,915 139,906 217,486 341,923 (1,430,489)
Accumulated Surplus 3,162 51,825 64,570 88,301 173,818 335,809 536,366 877,937 (551,980)

31
Balance Sheet Balance Sheet –– July 31, 2005 July 31, 2005 -- Statutory Basis Statutory Basis (unaudited)(unaudited)
(in thousands)5Consolidated PLA CLA HRA
AssetsCash and invested assets $ 3,195,545 $ 601,742 $ 132,179 $ 2,461,624
Premium receivable, net 9,438 7,916 (246) 1,768 Due from takeout companies 8,587 6,189 - 2,398 Accrued investment income 19,477 3,007 446 16,024
Other assets 52 52 - -Inter-account receivable (payable) 140 97,787 (11,309) (86,338)Total Assets $ 3,233,239 $ 716,693 $ 121,070 $ 2,395,476
LiabilitiesLoss reserves $ 402,797 $ 161,230 $ 32,756 $ 208,811
Loss expense reserves 78,157 27,533 4,052 46,572 Unearned premiums, net 461,797 170,049 22,638 269,110 Reinsurance premiums payable 212,305 55,624 4,634 152,047 Advance premiums & suspended cash 99,446 30,286 1,541 67,619
Notes payable 2,148,801 91,179 12,631 2,044,991 Interest payable 41,303 177 459 40,667 Taxes and fees payable 29,328 2,151 204 26,973 Federal income tax payable 54,899 - - 54,899 Other liabilities 28,711 19,959 526 8,226
Total Liabilities 3,557,544 558,188 79,441 2,919,915
Surplus (Deficit)Beginning surplus (deficit) (373,825) 153,710 24,148 (551,683)Change in non-admitted assets (12,708) (12,380) (205) (123)Net Income 62,228 17,175 17,686 27,367 Ending surplus (deficit) (324,305) 158,505 41,629 (524,439)
Total Liabilities & Surplus(Deficit) $ 3,233,239 $ 716,693 $ 121,070 $ 2,395,476

32
Statement of Operations Statement of Operations –– July 31, 2005 July 31, 2005 -- Statutory BasisStatutory Basis ((unauditedunaudited))
(in thousands)Consolidated PLA CLA HRA
Net earned premiums:Direct earned premiums $ 867,727 $ 379,075 $ 28,658 $ 459,994 Ceded earned premiums (194,113) (137,344) (1,544) (55,225)
Net earned premiums 673,614 241,731 27,114 404,769
Underwriting expense:Losses incurred 421,034 144,154 6,716 270,164 Loss adjustment expense incurred 42,317 16,751 690 24,876 Producer commissions 77,764 26,968 3,245 47,551 Ceded commissions (20,022) (17,836) - (2,186)Taxes and assessments 17,204 7,826 651 8,727 Administrative 38,954 25,664 889 12,401
Total underwriting expenses 577,251 203,527 12,191 361,533
Net underwriting income 96,363 38,204 14,923 43,236
Other income (expense)Investments income 73,765 16,713 2,763 54,289 Interest expense (70,801) (3,260) - (67,541)Financing costs (429) (35) - (394)Takeout bonuses (36,670) (34,447) - (2,223)
Total other income (expense) (34,135) (21,029) 2,763 (15,869)
Net income (loss) $ 62,228 $ 17,175 $ 17,686 $ 27,367

33
Forms and RatesForms and Rates
• Citizens utilizes a variety of resources to develop rates, forms, and underwriting rules. Our staff actuary is working with Citizens’ Actuarial Committee members, outside actuarial firms, OIR actuaries, and modeling firms to ensure that Citizens’ rates are actuarially sound and not competitive with the voluntary market. A team of underwriting analysts works to create and maintain forms and rules that comply with Florida Law and meet the needs of our agents and policyholders.
• Changes to Citizens’ rates, forms or underwriting rules require Committee, Board and OIR approval. Each change involves developing appropriate communication to agents and internal Citizens staff.

34
Cumulative Rate Change ComparisonCumulative Rate Change Comparison
Cumulative PLA Rate Changes 2003 - 2005
0%
20%
40%
60%
80%
100%
120%
140%
8/1/2003 4/1/2004 2/15/2005 4/15/2005
Effective Date of Change
Cum
ulat
ive
Cha
nge
Statewide Averages Pasco, Remainder Palm Beach, Remainder Dade, Coastal Broward, Coastal
HRA Cumulative Rate Changes 2003 - 2005
0%
20%
40%
60%
80%
100%
120%
140%
160%
180%
200%
7/1/2003 7/1/2004 4/1/2005
Effective Date of Change
Cum
ulat
ive
Perc
ent o
f Cha
nge
Statewide Averages Indian River Dade, Coastal Broward, Coastal Palm Beach
Pasco County leads all other counties in cumulative rate increases for the past three years for Personal Lines, 88.4%
above the state average.
Pasco County leads all other counties in cumulative rate increases for the past three years for Personal Lines, 88.4%
above the state average.
Indian River County lead Florida in HRA cumulative rate increases, 130.9% above the state
average.
Indian River County lead Florida in HRA cumulative rate increases, 130.9% above the state
average.

35
New Applications by Line of BusinessNew Applications by Line of Business
Dwelling Homeowners Mobile Home Total
May
Number 8,375 9,648 3,052 21,075
% of Total New Business 39.74% 45.78% 14.48% 100%
June
Number 10,016 12,327 3,918 26,261
% of Total New Business 38.14% 46.94% 14.92% 100%
July
Number 10,711 13,311 4,255 28,277
% of Total New Business 37.88% 47.07% 15.05% 100%
August
Number 12,012 14,639 4,844 31,495
% of Total New Business 38.14% 46.48% 15.38% 100%

36
Company ApprovedCompany Approved 20,000 policies selected20,000 policies selected 20,000 policies assumed20,000 policies assumed
Company ApprovedCompany Approved
20,000 policies selected
20,000 policies selected
Company provides approved data file to
Citizens
Company provides approved data file to
Citizens
Company must
contact 3000-4,000
agents
Company must
contact 3000-4,000
agents
Company assumes approx. 17,000 policies
Company assumes approx. 17,000 policies
Citizens Assumption W/O Consumer ChoiceCitizens Assumption W/O Consumer Choice
Consumer Choice?Consumer Choice?
Citizens Assumption With Consumer ChoiceCitizens Assumption With Consumer Choice
37
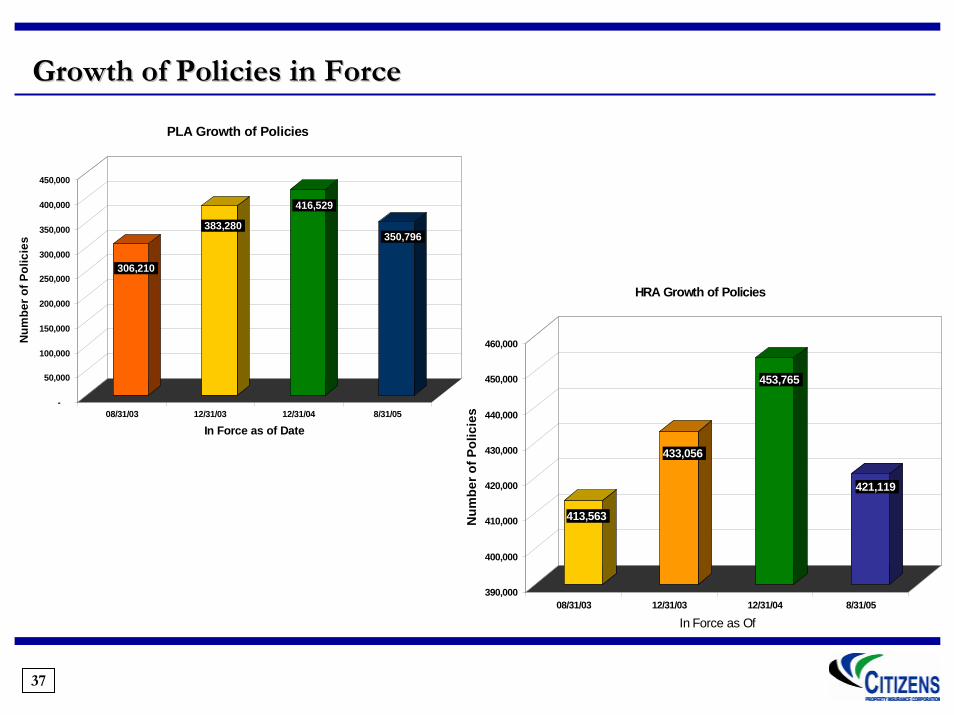
Growth of Policies in ForceGrowth of Policies in Force
413,563
433,056
453,765
421,119
390,000
400,000
410,000
420,000
430,000
440,000
450,000
460,000
Num
ber o
f Pol
icie
s
08/31/03 12/31/03 12/31/04 8/31/05
In Force as Of
HRA Growth of Policies
306,210
383,280
416,529
350,796
-
50,000
100,000
150,000
200,000
250,000
300,000
350,000
400,000
450,000
Num
ber o
f Pol
icie
s
08/31/03 12/31/03 12/31/04 8/31/05
In Force as of Date
PLA Growth of Policies

38
Top 5 Counties with Policies in ForceTop 5 Counties with Policies in Force
Rank County PIF % of TOTAL1 Dade 82,802 23.6%2 Pinellas 56,849 16.2%3 Pasco 39,462 11.2%4 Broward 39,313 11.2%5 Palm Beach 25,517 7.3%
PLA Top Five PIF Total 243,943 69.54%PLA Total PIF 350,796 100.00%
Rank County PIF % of TOTAL1 Dade 95,666 22.7%2 Broward 72,869 17.3%3 Palm Beach 64,429 15.3%4 Sarasota 28,952 6.9%5 Monroe 28,157 6.7%
HRA Top Five PIF Total 290,073 68.88%HRA Total PIF 421,119 100.00%

39
PLA Rank County PIF Increase
1 Pinelllas 4,0982 Pasco 3,7993 Lee 1,9164 Manatee 1,6375 Hernando 1,563
13,013
HRARank County PIF Increase
1 Sarasota 1,2552 Volusia 8843 Walton 1684 Flagler 1645 Pasco 142
2,613

40
Concluding RemarksConcluding Remarks
Citizens is a critically important safety net for the residents of the state of Florida.
Florida is the most catastrophe-exposed state in the world; Citizens is by law the most concentrated property insurer in the most catastrophe-exposed state in the world.
Citizens will continue to face financial and operational challenges without significant systemic changes to the Florida homeowners insurance market.
We look forward to working with this Task Force and the Florida Legislature to seek changes to the Florida homeowners insurance market – which will help shrink the size and exposure of Citizens Property Insurance Corporation.