citric acid as a functional supplement in diets for
TRANSCRIPT
Contents lists available at ScienceDirect
Aquaculture
journal homepage: www.elsevier.com/locate/aquaculture
Citric acid as a functional supplement in diets for juvenile turbot,Scophthalmus maximus L.: Effects on phosphorus discharge, growthperformance, and intestinal health
Jihong Daia,1, Yanxian Lia,1, Pei Yanga, Yang Liua, Zhichu Chena, Weihao Oua, Qinghui Aia,Wenbing Zhanga, Yanjiao Zhanga,b,⁎, Kangsen Maia,b
a The Key Laboratory of Aquaculture Nutrition and Feed (Ministry of Agriculture) & the Key Laboratory of Mariculture (Ministry of Education), Ocean University of China,Qingdao 266003, Chinab Laboratory for Marine Fisheries Science and Food Production Processes, Qingdao National Laboratory for Marine Science and Technology, Qingdao 266237, China
A R T I C L E I N F O
Keywords:Citric acidPhosphorusGrowth performanceIntestinal healthTurbot
A B S T R A C T
The present study was conducted to investigate the suitability of citric acid as a feed additive for juvenile turbot(Scophthalmus maximus) to reduce phosphorus (P) excretion. A practical diet with similar profile as commercialdiet was used as the positive control (C-P). C-P diet had no inorganic P supplementations, which was used as thenegative control (C-0). Two citric acid supplemented diets, C-1.5 and C-3.0, were formulated by incorporating1.5% and 3.0% citric acid into the C-0 diet, respectively. Each diet was fed to triplicate groups of 30 fish. Thefeeding trial lasted for 12 weeks. Turbot fed different diets showed similar growth performance, feed utilizationefficiency and whole-body composition. Compared with group C-0, the pH of stomach contents in group C-3.0was significantly lower while the pepsin activity and apparent digestibility coefficient of P in this group werenotably higher. Diet C-3.0 resulted in the highest P retention, which was significantly higher compared to diet C-P but not to diet C-0. Compared to both control diets, citric acid supplemented diets significantly increased theactivity of pepsin. No diet-related difference was observed in the blood biochemistry, nor in the histology andbacterial community profile of distal intestine. In summary, dietary inclusion of 3% citric acid markedly im-proved the bioavailability of P, without compromising intestinal function and health of fish. Citric acid seemedto be a promising feed additive for aqua-feeds to reduce P discharge into environment.
1. Introduction
Aqua-feed industry has undergone rapid growth in last decades withthe rapid growth of aquaculture. However, phosphorus (P) has been alimiting nutrient in either fishmeal-based or plant protein-based fishfeed. P exists as tricalcium phosphate and hydroxyapatite in fishmeal(Sarker et al., 2005) and its bioavailability varies considerably from fishto fish, ranging from 0% to 74% (Ogino, 1979; Watanabe et al., 1980;Yone and Toshima, 1979). In plant ingredients, P exists in phytic acid,which dramatically decreased the P bioavailability (Erdman, 1979;Nelson, 1967; Reddy et al., 1982; Ravindran et al., 1994). Moreover, toprevent P deficiency, inorganic P is often supplemented to the com-mercial diet, but the unavailable dietary P within either fish meal orplant ingredient would inevitably escalates the P emission into en-vironment (Coloso et al., 2003; Hung et al., 2015). For example, a
loading of 8.7 g total phosphorus was generated when 1 kg of turbot (S.maximus) fed with a commercial diet was produced, and the P retentionof turbot was 42% (Mallekh et al., 1999). Therefore, a large amount ofthe unutilized dietary phosphorus could be excreted considering thehuge biomass of farmed turbot industry. Excessive P discharge into theculture waters results in P loss from recycling in food production, inaddition to a series of negative ecological impacts such as oxygen de-ficiencies and eutrophication (Ling et al., 2007). Many feed processingtechniques have been developed to deal with the issue such as the ad-dition of phytase and organic acids (Biswas et al., 2007; Li et al., 2015;Liebert and Portz, 2005). Since monogastric or agastric aquatic animalslack intestinal phytases, exogenous phytase can help hydrolyze the in-digestible phytate in dietary ingredients to improve P utilization (Caoet al., 2007). Organic acids could lower the pH and subsequently resultin higher dissociation of mineral compounds, which aids P absorption
https://doi.org/10.1016/j.aquaculture.2018.04.004Received 25 December 2017; Received in revised form 4 April 2018; Accepted 4 April 2018
⁎ Corresponding author at: The Key Laboratory of Aquaculture Nutrition and Feed (Ministry of Agriculture) & the Key Laboratory of Mariculture (Ministry of Education), OceanUniversity of China, Qingdao 266003, China.
1 Jihong Dai and Yanxian Li contributed equally to this work.E-mail address: [email protected] (Y. Zhang).
Aquaculture 495 (2018) 643–653
Available online 06 April 20180044-8486/ © 2018 Published by Elsevier B.V.
T
(Pandey and Satoh, 2008; Sugiura et al., 1998).The positive effect of organic acids on P bioavailability in feed was
well documented in terrestrial animals (Boling et al., 2000; Kemmeet al., 1999; Kirchgessner and Roth, 1982). Several possible actionmodes involved in this effect have been indicated. A lower pH broughtabout by the organic acids supplementation could directly increase thesolubility of phytate and improve P utilization in the intestine (Canibeet al., 2005). Alternatively, organic acids can promote P absorption bychelating calcium (Ca) to reduce the antagonistic interactions betweenthem (Sugiura et al., 1998).
The optimization of protein digestion plays a key role in reachinghigh fish performances in aquaculture. The main gastric protease,pepsin, is strictly dependent on a low-enough environment pH(Márquez et al., 2012), and the optimum pH for protease activity in thestomach of turbot was 2.2 (Chen et al., 2006), while for the Atlanticsalmon (Salmo salar) and rainbow trout (Oncorhynchus mykiss) the op-timum pH was 3 and 1.5, respectively (Hidalgo et al., 1999; Krogdahlet al., 2015a). However, the postprandial pH observed in the stomach ofrainbow trout increased by more than two full units and the increasedpH maintained for 8 h following feeding (Bucking and Wood, 2009).The increase of pH in stomach negatively affects the activation ofpepsin, and possibly decreases the protein digestion capability in fish(Luckstadt, 2008; Márquez et al., 2012). In pig, providing acidifiers inthe feed addressed this problem and aided in feed digestion (Thaelaet al., 1998). Similarly, citric acid improved gastrointestinal digestiveenzyme activities in red drum (Sciaenops ocellatus) and tilapia (Or-eochromis niloticus×Oreochromis aureus) (Castillo et al., 2014; Li et al.,2009).
The intestinal microbiota plays critical roles in stimulating intestinalcell proliferation and nutrient uptake, protects gastrointestinal (GI)tract from infectious agents, regulates immune system in the GI tract,and produces enzymes which might have significant roles in digestion(Wang et al., 2017). Organic acid has been used in swine diets fordecades and appears to have some antimicrobial effects (Dibner andButtin, 2002). In aqua-feeds, use of organic acid is expected to sig-nificantly increase in the coming years due to global regulatory controlson the use of antibiotics. The most obvious mode of actions of theseacidifiers is via acidification of the extracellular pH thorough dis-sociating into ions and releasing protons to the surrounding mediums,since many pathogens are unable to grow under acidic conditions (Ngand Koh, 2016). However, the general consensus is that the anti-microbial efficacy of organic acid is mainly due to their ability topassively diffuse through a bacterium's semi-permeable membrane anddissociate in the pH neutral cytoplasm (Booth and Stratford, 2003;Cherrington et al., 1991). Accumulation of the protons released by or-ganic acids within cell will lower the cytoplasmic pH, interfere the cellmetabolism, suppress transport of nutrients, lead to depletion of cel-lular ATP, inhibit the synthesis of macromolecules, and eventually re-sult in cell death (Cherrington et al., 1990; Dibner and Buttin, 2002;Ricke, 2003; Warth, 1991). The acidification by organic acids couldfavor the growth of acidophilic lactobacilli and exert an anti-adherenceeffect on Escherichia coli as observed in the gastro-ileal region in pig(Partanen and Mroz, 1999). In aquatic animals, organic acids blend andpotassium diformate were able to markedly reduce total bacteria infeces and shift the fecal population of A. hydrophila in red hybrid tilapia(Oreochromis sp.), potentially preventing diseases caused by Aeromonas(Ng et al., 2010). A blend of organic acids and essential oil enhancedthe bacteria diversity and richness and beneficially affect intestinalmicroflora in Pacific white shrimp (Litopenaeus vannamei) (He et al.,2017). Among the organic acids, citric acid has been widely used interrestrial animals for its good flavor and high buffer capacity. In fish,citric acid has been reported to increase the P availability in rainbowtrout (Pandey and Satoh, 2008), red sea bream (Pagrus major) (Hossainet al., 2007), beluga (Huso huso) (Khajepour and Hosseini, 2012), rohu(Labeo rohita) (Baruah et al., 2007) and yellowtail (Seriola quinquer-adiata) (Sarker et al., 2012). It has been proposed as a promising feed
additive to reduce P loading in aquaculture. Therefore, the presentstudy was conducted to test the effectiveness of citric acid applicationin turbot, which is a major aquaculture species all over the world.
Because of its delicious meat, high disease resistance, and rapidgrowth, turbot is of high economic value, and has been widely farmedin Europe and East Asia. In China, especially, turbot has been a domi-nant farming species in the northern part. To our knowledge, there hasnot yet studies evaluating the P utilization efficiency for turbot. Thepresent study aimed at evaluating the P retention in turbot fed apractical diet similar to commercial diet in composition, and the suit-ability of citric acid as a feed additive to improve P utilization efficiencyin this fish.
2. Materials and methods
2.1. Experimental diets
A total of 4 isonitrogenous and isolipidic experimental diets dif-fering only in P and citric acid supplementations were made. The firstdiet was a positive control diet without citric acid but was supple-mented with phosphorus (C-P), which was similar to commercial for-mulations. The second diet was a negative control without citric acid orP supplementations (C-0). The third and fourth diets had no P supple-mentations but had citric acid levels of 1.5 (C-1.5) and 3.0% (C-3.0),respectively. The dietary formulations (basal diet) among the diets werethe same, with the exception of P and citric acid supplementations.Additionally, 1 g kg−1 yttrium oxide (Y2O3) was used as an inert tracerin each diet for determination of apparent digestibility coefficient ofnutrients.
Diet ingredients were ground into fine powder to pass through320 μm mesh. All ingredients were thoroughly mixed with fish oil andsoybean oil, and water was added to produce a stiff dough. The doughwas then extruded with an experimental single-screw feed granulater.The die diameter was 3mm and the screw-speed 90 rpm. Producttemperature at the end of the barrel was 50–55 °C (F-26, South ChinaUniversity of Technology, China). After being pelleted, the feeds weredried for about 12 h in a ventilated oven at 55 °C and stored in a freezerat −20 °C.
2.2. Fish husbandry
Apparently healthy juvenile turbot were obtained from a commer-cial fish farm in Laizhou, China. Before the start of feeding trial, theywere fed a commercial diet (Great seven Bio-Tech, Qingdao, China) for2 weeks to acclimate to the experimental conditions. Then fish withsimilar sizes (initial mean weight 8.2 ± 0.22 g) were randomly dis-tributed to 12 fiberglass tanks (300 L) with 30 fish per tank. Each dietwas randomly assigned to triplicate groups of fish. They were fed toapparent satiation twice daily (08:00 and 17:00) for 12 weeks. Uneatenfeeds were collected from the tank outlets and dried for the calculationof feed intake. Sea water was pumped from the adjacent coast to theexperiment base, passed through sand filters, froth separator and bio-filter in turn, and finally flowed into each tank at a rate of 2 Lmin−1.This system water was exchanged at 50% each day with new water.Continuous aeration was supplied with a single air-stone connected to acentral air blower. During the feeding trial, the water temperatureranged from 15 °C to 18 °C; salinity varied from 30‰ to 33‰; dissolvedoxygen was higher than 7mg L−1; and NH4-N was lower than0.4 mg L−1.
2.3. Sample collection
Two hours after feeding, apparently intact feces were siphoned intoa string bag made of three layers of gauze, then artificially scraped in toa 10mL tube, stored at −20 °C before analysis. At day 84, the biomassin each tank was measured before the evening feeding. At day 85, 2 h
J. Dai et al. Aquaculture 495 (2018) 643–653
644

after the morning feeding, 6 fish per tank were randomly selected tocollect contents in the stomach, which were then immediately snappedfrozen in liquid nitrogen. Five hours after the morning feeding, guts of 6fish per tank were excised and divided into proximal and distal gutusing a clamp, as suggested by Li et al. (2016). The digesta in each gutcompartment was collected into 2mL tubes and snapped frozen in li-quid nitrogen right away. For the analysis of intestinal microflora,hindguts with contents of 5 fish per tank were collected. In brief, theabdomen surface of fish was decontaminated with 70% ethanol, afterwhich the hindgut was dissected with sterile anatomic tools near analcohol burner, transferred to 2mL sterile tubes, and immersed in liquidN2. Before dissection, blood was withdrawn from the caudal vein using1mL syringe from the above fish and allowed to stay at 4 °C until itclotted. Serum was obtained after centrifugation (3000g for 10min at4 °C) and frozen at once. The carcasses were kept to obtain skeletonsamples. The feeding was stopped after the above sampling events toempty the gut contents. The next morning, five fish were randomlyselected from each tank and stored at −20 °C for the analysis of prox-imate composition. A short segment (about 1 cm in length) of thehindgut of another five fish per tank were cut and immersed in theBouin's fixative solution. After fixation for 24 h, the gut tissues weretransferred to 70% ethanol awaiting further process. All fish were an-esthetized with eugenol (1:10000) before handling and euthanized by asharp blow to the head before sampling.
2.4. Chemical analysis
Proximate composition of feed ingredients, diets, feces and wholefish were analyzed following the standard methods (AOAC, 1995): drymatter (DM) was measured by drying samples to a constant weight at105 °C; crude protein by the Kjeldahl method (2300- Auto-analyzer,FOSS Tecator, Höganäs, Sweden); crude lipid by the Soxhlet method (B-811, BUCHI, Flawil, Switzerland) and ash by combustion at 550 °C.
The concentration of yttrium (Y), P and Ca in the diets and feces,and P content of the carcass and skeleton were determined using aninductively coupled plasma-atomic emission spectrophotometer (ICP-OES; VISTA-MPX, Varian, America) after perchloric acid digestion (Maiet al., 2006). To measure bone P content, the whole fish was boiled for20min, then flesh was stripped off from vertebrae and the remainingwas removed by slightly brushing the bone. Rinsed clean by deionizedwater, the vertebrae was dried at 110 °C for 6 h, immersed into ethylether for 7 h, pulverized and dried again (Baruah et al., 2005). After-wards, the whole skeleton was ground into fine powder for perchloricacid digestion. For the determination of water-soluble P in the feeds andstomach contents, 0.2 g freeze-dried material was weighed accuratelyand homogenized with 20mL 2mol L−1 KCl. The homogenate was thenshaken for 18 h at 37 °C and the supernatant containing soluble P wascollected after centrifugation (5000g for 10min) (Lu et al., 2014). So-luble P was determined via its reaction with molybdic acid to formmolybdenum blue, which has an absorption maximum at 660 nm, usinga commercial kit (Nanjing Jiancheng Bioengineering Institute, Nanjing,China; Catalog NO., C006-3). The concentration of soluble P was cal-culated as follows: P content in samples= [(OD of supernatants−ODof blank control) / (OD of P standard−OD of blank control)]× Pconcentration of the standard (0.5 mmol L−1)× dilution factor.
2.5. pH measurement
The pH of experimental diets and gastrointestinal contents wasmeasured following the method of Castillo et al. (2014). Briefly, 1 gfreeze-dried feeds or digesta were homogenized with 5mL cold ddH2O(1:5, w v−1) on ice. Then pH of the homogenates was measured by a pHMeter (PHS-3C, Leici, Shanghai).
2.6. Digestive enzyme activity
After pH measurement, the homogenate of digesta was further di-luted (1:20, v v−1) with cold ddH2O and shaken gently for 10min at4 °C to extract digestive enzyme. The enzyme extract was obtained aftercentrifugation (13,000g for 10min at 4 °C), and stored as aliquots at−80 °C until analysis. Enzyme assays were performed using commer-cial kits (Nanjing Jiancheng Bioengineering, Nanjing, China), and theenzyme activity was normalized to the weight of digesta on a DM basis.Pepsin activity was analyzed using casein as substrate and one unit ofactivity is defined as 1 μg tyrosine liberated by hydrolyzing protein at37 °C for 1min (catalog No., A080-1) (Cupp-Enyard, 2008). Trypsinactivity was measured using N-benzoyl-L-arginine-ethylester (BAEE) assubstrate and one unit of activity is defined as producing ΔA253 of 0.003per min at 37 °C (catalog No., A080-2) (Erlanger et al., 1961). Amylaseactivity was determined using starch as substrate and one unit of ac-tivity is defined as the amount of enzyme that decomposes 10mg ofstarch in 30min at 37 °C (catalog No., C016-1) (Bernfeld, 1951).
2.7. Histology
Distal intestine tissue was dehydrated in ethanol, equilibrated inxylene and embedded in paraffin wax according to standard histolo-gical procedures. Tissue sections with thickness of 7 μm were preparedfor hematoxylin and eosin (H&E) staining and examined blindly to thereviewer under a microscope equipped with a camera (E600, Nikon,Tokyo, Japan) and an image acquiring software (CellSens Standard,Olympus, Tokyo, Japan), following the criteria suggested by Krogdahlet al. (2015b). Additionally, micrographs were analyzed using theimage analysis software Image Pro Plus® (Media Cybernetics, SilverSpring, MD, USA) to determine the perimeter ratio (PR, arbitrary unitsAU) between the internal and external perimeter of the gut lumen(Dimitroglou et al., 2009). A higher PR value indicates larger absorptivesurface area resulting from increased villi height and/or mucosalfolding.
2.8. Blood biochemistry
Total protein, total cholesterol, triglyceride, glucose, alanine aminotransferase, aspartate transaminase, alkaline phosphatase, urea andcreatinine in serum were determined by an automatic biochemicalanalyzer (HITACHI 7600, Tokyo, Japan) at the hematology center ofAffiliated Hospital of Medical College, Qingdao University (Qingdao,China).
2.9. Intestinal microbiota profiling
The bacterial DNA was extracted using the QIAamp DNA Stool MiniKit (Qiagen, Hilden, Germany) as described by Li et al. (2017) exceptthat both intestinal mucosal tissue and contents were collected, mixedand homogenized for the DNA extraction. The library construction andsequencing of 16s rRNA V4 region on Illumina Hiseq 2500 were per-formed by Beijing Novogene Genomics Technology Co. Ltd. (Tianjin,China) as described by Yao et al. (2016).
The raw sequence data was deposited in the BIG Data Center (BIGD,Beijing Institute of Genomics) under the accession id CRA000567.QIIME 2 (version 2017.8) pipeline was used for the data analysis andvisualization (Caporaso et al., 2010). The pair-ended reads were trun-cated to a constant length of 150 bp based on the sequence quality plotand denoised by DADA2 to infer exact sequence variants (SVs)(Callahan et al., 2016). The result was a feature table with SVs insteadof OTUs that cluster sequences based on certain sequence similarity cutoff value (usually 97%). The representative sequences were thenaligned by MAFFT (Katoh and Standley, 2013) and a phylogenetic treewas generated from the masked alignment using FastTree (Price et al.,2010). The taxonomic assignment was performed by a pre-trained
J. Dai et al. Aquaculture 495 (2018) 643–653
645

Naive Bayes classifier (available at the Data resources of QIIME2website) trained on the Greengenes 13_8 99% OTUs, which have beentrimmed to only include the V4 region. Taxa identified as Cyano-bacteria were excluded from the analysis (Baldo et al., 2015). Ad-ditionally, features accounting for< 0.005% of the total sequences oronly present in one sample were filtered as well, due to technical,statistical and biological considerations (Bokulich et al., 2013; Dhariwalet al., 2017). The resulting count data was normalized by rarefying thetotal sequence number of each sample to 11,755, which was theminimum count number found in the samples after data filtering (Weisset al., 2017). Afterwards, Faith's phylogenetic diversity (PD), observedOTUs, Shannon's index and Pielou's evenness were computed for thealpha diversity estimation. The dissimilarity between microbial com-munities was evaluated by unweighted-UniFrac distance (Lozupone andKnight, 2005) based principal coordinate analysis (PCoA) and visua-lized by EMPeror (Vazquez-Baeza et al., 2013), followed by permuta-tional multivariate analysis of variance (PERMANOVA, 999 times ofpermutations) (Anderson, 2001). ANCOM (analysis of composition ofmicrobiomes) (Mandal et al., 2015), which accounts for compositionalconstraints of microbiome data, was employed to identify differentiallyabundant taxa between the negative control group and citric acidsupplemented groups. The differential abundance testing was restrictedto taxa observed in at least 25% of the samples as low frequency OTUsare difficult to interpret statistically.
2.10. Calculations
The following variables were calculated:
= ×Survival (%) 100 final number of fish/initial number of fish
= × −
−Specific growth rate (SGR,%day )100 (Ln final weight Ln initial weight)/days
1
= −Feed efficiency (FE) (final weight initial weight)/feed consumed
= ×
+
−Feed intake (FI,%day ) 100 feed intake
/[(initial weight final weight)/2]/days
1
= × ×
×
Apparent digestibility coefficient (ADC) of nutrients (%)
100 [1–(%Y in diet %nutrient in feces)
/(%Y in feces %nutrient in diet)]
= ×Available P (%diet, DM basis) ADC of P total P in the diet
= −Fecal P (%diet, DM basis) total P in the diet available P in the diet
=P liberated via digestion (%diet, DM basis) available P of the diet
–soluble P in the diet
=
−
×
Nutrients retention (%) [(Final body nutrient content
initial body nutrient content)]
/nutrient intake] 100
= × −
×
−Nutrients excretion (kg t )
[(FCR nutrient in diet (g) nutrient retained in fish (g))
/production (t)] 1000
1
2.11. Statistical analysis
Statistical software SPSS 22.0 for Windows (IBM SPSS corporation,Chicago,USA) was used for the data analysis. All data were subjected tonormality test (Shapiro-Wilk test) and Levene's test for equal variancebefore the one-way ANOVA was performed. Tukey's multiple-range testwas used for the multiple comparisons of group means. Alternatively,
Kruskal-Wallis H test was used when needed. Pearson's correlationanalysis was carried out to quantify the strength of any relationshipbetween the measured parameters and dietary treatments. When ne-cessary, multiple comparisons were corrected by the Benjamini-Hochberg procedure. Differences were regarded as significant whenp < 0.05.
3. Results
3.1. Growth performance and feed utilization
No significant difference was found in the survival, specific growthrate, feed efficiency or feed intake among all dietary groups (P > 0.05,Table 2). Turbot fed different diets showed similar whole-body prox-imate composition (Table S1).
3.2. pH of the diets and gastrointestinal contents
Diets C-0 and C-3.0 reduced pH of the negative control diet from
Table 1Formulations and chemical analyses of the experimental diets (% dry matter).
Ingredients (%) C-P C-0 C-1.5 C-3.0
Fishmeala 36.00 36.00 36.00 36.00Soybean meala 15.68 15.68 15.68 15.68Corn glutena 8.00 8.00 8.00 8.00Wheat glutena 5.12 5.12 5.12 5.12Peanut meala 3.20 3.20 3.20 3.20Bear yeasta 2.50 2.50 2.50 2.50Wheat floura 15.63 16.13 14.63 13.13Taurine 1.00 1.00 1.00 1.00DL-Methionine 0.26 0.26 0.26 0.26L-Threonine 0.18 0.18 0.18 0.18L-Histidine 0.19 0.19 0.19 0.19L-Lysine 0.74 0.74 0.74 0.74Fish oil 8.00 8.00 8.00 8.00Soybean lecithin 1.00 1.00 1.00 1.00Vitamin premixb 1.00 1.00 1.00 1.00Mineral premixc 0.50 0.50 0.50 0.50Choline chloride 0.25 0.25 0.25 0.25Ethoxyquin 0.05 0.05 0.05 0.05Calcium propionate 0.10 0.10 0.10 0.10Y2O3 0.10 0.10 0.10 0.10Ca(H2PO4)2d 0.50 0.00 0.00 0.00Citric acide 0.00 0.00 1.50 3.00
Chemical analysisCrude protein (CP) 52.22 52.30 52.05 51.80Crude lipid (CL) 14.18 14.19 14.16 14.13pH 5.94 6.07 5.34 4.90Total P 1.66 1.46 1.47 1.44Total Ca 1.61 1.54 1.49 1.44
Formulations and chemical analyses of the experimental diets (% DM).a Fishmeal (DM, %): CP 72.94, CL 10.85; soybean meal (DM, %): CP 53.67,
CL 2.81; corn gluten (DM, %): CP 64.92, CL 3.03; wheat gluten (DM, %): CP83.94, CL 1.34; peanut meal (DM, %): CP 55.62, CL 3.69; beer yeast (DM, %):CP 51.02, CL 2.90; wheat flour (DM, %): CP 16.82, CL 2.11.
b Vitamin premix (mg kg−1 diet): retinyl acetate, 32; vitamin D3, 5; DL-α-tocopherol acetate, 240; vitamin K3, 10; thiamin, 25; riboflavin (80%), 45;pyridoxine hydrochloride, 20; vitamin B12 (1%), 10; L-ascorbyl-2-monopho-sphate-Na (35%), 2000; calcium pantothenate, 60; nicotinic acid, 200; inositol,800; biotin (2%), 60; folic acid, 20; choline chloride (50%), 2500; cellulose,6740; antioxidants, 3.
c Mineral premix (mg kg−1 diet): FeSO4·H2O, 80; ZnSO4·H2O, 50;CuSO4·5H2O, 10; MnSO4·H2O, 45; KI, 60; CoCl2·6H2O (1%), 50; Na2SeO3 (1%),20; MgSO4·7H2O, 1200; calcium propionate, 1000; zeolite, 2485.
d Calcium phosphate: analytical grade (Fulin Biochemical Co., Ltd., Qingdao,Shandong, China).
e Citric acid: food grade (Ensign Industry Co., Ltd., Weifang, Shandong,China).
J. Dai et al. Aquaculture 495 (2018) 643–653
646

6.07 to 5.34 and 4.90, respectively (Table 1). The reduction of pH wasalso observed in the stomach contents in but not in the digesta from theanterior and posterior intestine of the citric acid supplemented groups,(Fig. 1). The pH of experimental diets was positively correlated withthat of stomach contents (P=0.04, R2= 0.96) and was negativelycorrelated with soluble P content in the diets (P=0.03, R2=−1.0).
3.3. Nutrient digestibility
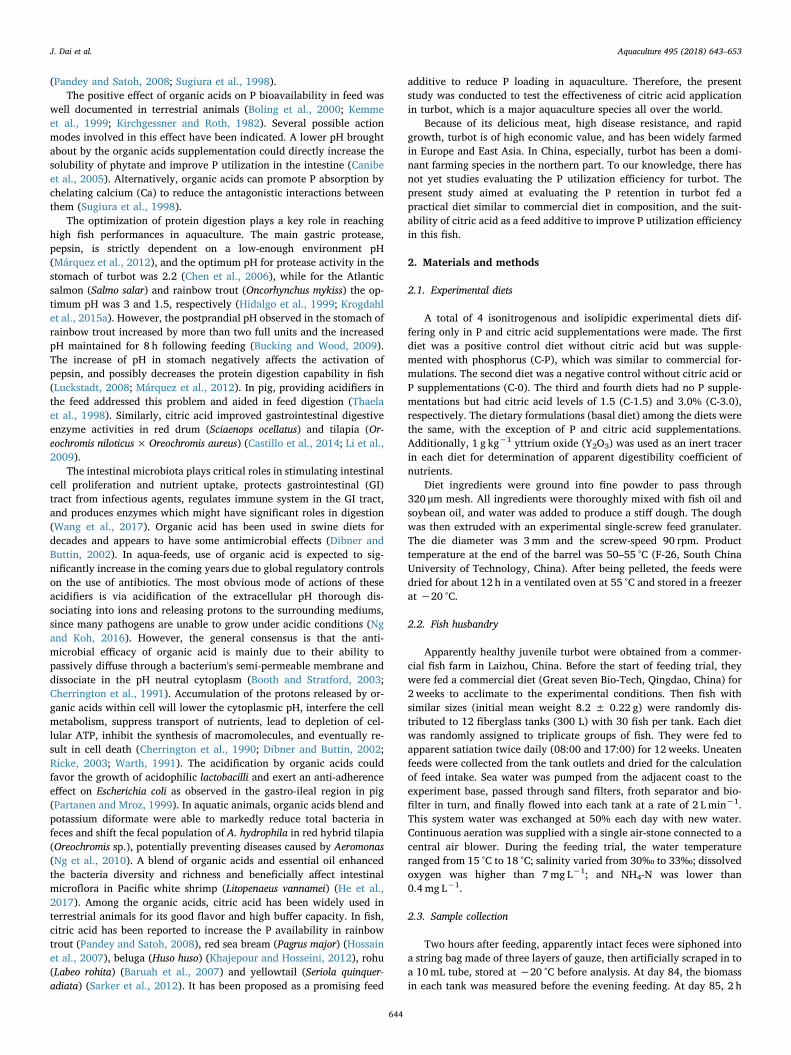
Turbot fed the C-3.0 diet showed the highest apparent digestibilitycoefficient (ADC) of DM, P and Ca, which were significantly differentfrom those in groups C-0 and C-1.5 (P < 0.05, Fig. 2). ADC of proteinwas not affected by the addition of citric acid (P > 0.05). The ADC of Pwas positively correlated with that of Ca (P=0.01, R2= 0.99).
3.4. Phosphorus utilization
Compared with the C-0 diet, citric acid supplementation increased
the soluble P content in both diets and stomach contents, with a sig-nificant increment in the C-3.0 diet (P < 0.05) (Table 3). The soluble Pcontent within the stomach was positively correlated with the dietarysoluble P content (P= 0.02, R2= 0.98), but there was no correlationwith the stomach content pH (P= 0.17, R2=−0.97).
The P utilization efficiency was evaluated in terms of fecal P con-tent, available P content, P retention and P excretion. Compared withthe C-0 diet, dietary supplementation of 3% citric acid significantlyimproved the available P content in the diet and reduced the fecal Pcontent, which is concurrent with significantly higher soluble P contentin the feed (Table 3 and Fig. 3A). The available P content in the C-3.0diet was close to that in diet C-P with inorganic P supplementation inabsolute amount. When assessed as the proportion of total dietary Pcontent (Fig. 3B), however, available P content in the C-3.0 diet was the
Fig. 1. Effects of phosphorus and citric acid supplementations on pH of gas-trointestinal contents of juvenile turbot. Sto, stomach; AI, anterior intestine; PI,posterior intestine. Error bars of columns indicate standard error of means(n=3) and different letters within each variable denote significant differencesas evaluated by Tukey's HSD test (P < 0.05).
Table 2Effects of phosphorus and citric acid supplementations on growth performanceand feed utilization in turbot.a
C-P C-0 C-1.5 C-3.0 Pooled SEM P
Initial body weight (g) 8.25 8.22 8.24 8.22 0.01 0.17Final body weight (g) 68.14 66.74 67.93 63.38 3.52 0.76Survival (%) 97.78 96.67 97.78 100.00 1.94 0.65SGR (% day−1) 2.13 2.10 2.13 2.05 0.06 0.76FE 1.02 1.04 1.03 1.06 0.06 0.98FI (% bw day−1) 1.49 1.46 1.47 1.41 0.08 0.89
a Values represent means of three replicate tanks.
Table 3Effects of phosphorus and citric acid supplementations on P utilization in turbot.a1
C-P C-0 C-1.5 C-3.0 Pooled SEM P
Soluble P in diet (% DM) 0.54ab 0.43a 0.57ab 0.67b 0.01 0.00Soluble P in stomach contents (% DM) 0.45ab 0.38a 0.45ab 0.49b 0.02 0.02Available P in diet (% DM) 0.98b 0.83a 0.86ab 0.96b 0.03 0.00Soluble P in diet/available P in diet (%) 55.27a 52.23a 66.81b 69.67b 2.20 0.00Available P in diet/total P in diet (%) 59.21ab 56.86a 58.02a 66.97b 2.03 0.04Fecal P (% DM) 0.68b 0.63b 0.61b 0.48a 0.03 0.00Total P of whole fish (% DM) 2.43 2.42 2.45 2.53 0.07 0.63Total P in bone (% DM) 9.92 10.04 10.25 10.60 0.16 0.18P retention (%) 32.36a 35.66ab 36.81ab 38.95b 1.58 0.03P excretion (kg t−1) 11.04b 9.22ab 9.14ab 8.33a 0.58 0.03
1 Values represent means of three replicate tanks. Different superscript letters within a row denote significant differences as evaluated by Tukey's HSD test(P < 0.05).
Table 4Effects of phosphorus and citric acid supplementations on digestive enzymeactivities in turbot.1
Parameter C-P C-0 C-1.5 C-3.0 Pooled SEM P
Pepsin (U g−1 DM) 214.80a 176.58a 318.36b 328.22b 21.84 0.00Trypsin (Umg−1
DM)40.06 39.67 40.37 39.87 0.50 0.82
Amylase (U kg−1
DM)97.30 101.20 115.10 96.70 1.01 0.10
1 Values represent means of three replicate tanks. Different superscript let-ters within a row denote significant differences as evaluated by Tukey's HSDtest (P < 0.05). Stomach content was used for the analysis of pepsin, and in-testinal content was used for the analysis of trypsin and amylase. DM: drymatter.
Table 5Effects of phosphorus and citric acid supplementations on the serum bio-chemistry and enzymes in turbot.1
C-P C-0 C-1.5 C-3.0 Pooled SEM P
Total protein (g L−1) 26.65 26.41 28.22 25.53 1.14 0.45Total cholesterol
(mmol L−1)2.96 2.51 2.73 2.66 0.16 0.33
Triglyceride (mmol L−1) 9.47 8.04 9.07 8.46 0.73 0.55Glucose (mmol L−1) 1.70 1.86 1.72 1.68 0.18 0.90Alamine amino transferase
(IU L−1)2.33 2.66 2.00 2.33 0.29 0.49
Aspartate transaminase(IU L−1)
15.50 14.67 8.50 16.33 3.02 0.39
Alkaline phosphatase(IU L−1)
12.67 11.67 11.00 12.00 0.85 0.60
Urea (mmol L−1) 1.34 1.69 1.45 1.61 0.11 0.16Creatinine (umol L−1) 15.00 16.33 17.33 17.00 2.03 0.85
1 Values represent means of three replicate tanks. Different superscript let-ters within a row denote significant differences as evaluated by Tukey's HSDtest (P < 0.05).
J. Dai et al. Aquaculture 495 (2018) 643–653
647
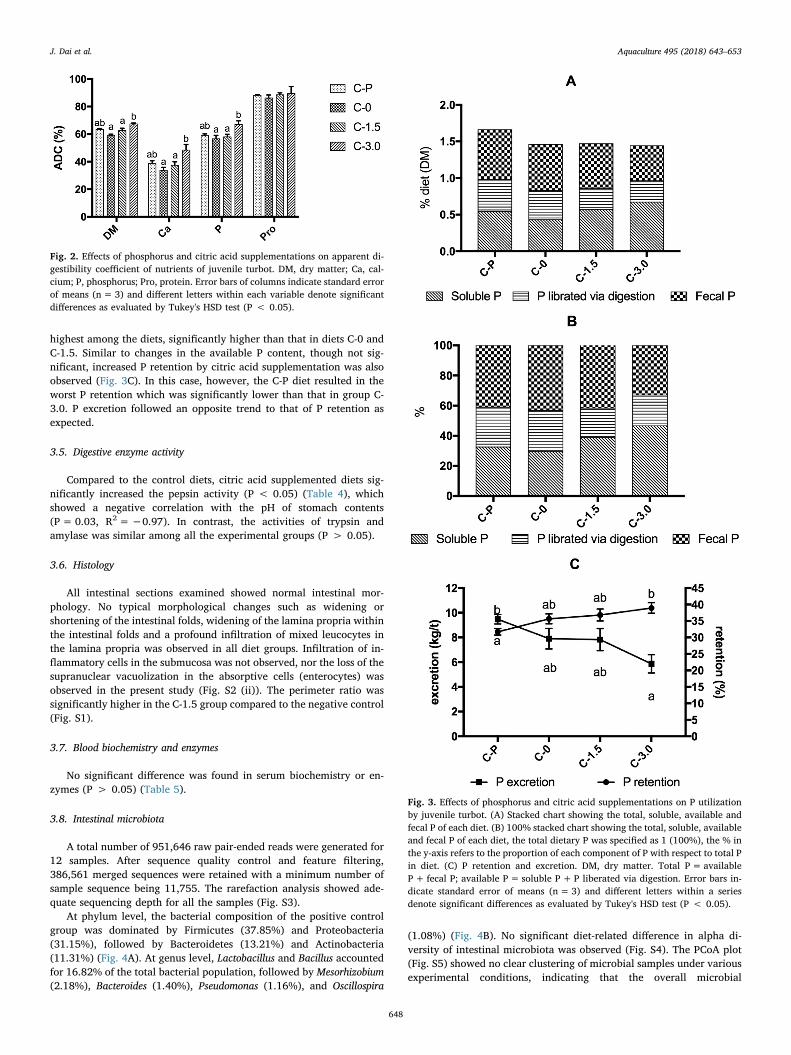
highest among the diets, significantly higher than that in diets C-0 andC-1.5. Similar to changes in the available P content, though not sig-nificant, increased P retention by citric acid supplementation was alsoobserved (Fig. 3C). In this case, however, the C-P diet resulted in theworst P retention which was significantly lower than that in group C-3.0. P excretion followed an opposite trend to that of P retention asexpected.
3.5. Digestive enzyme activity
Compared to the control diets, citric acid supplemented diets sig-nificantly increased the pepsin activity (P < 0.05) (Table 4), whichshowed a negative correlation with the pH of stomach contents(P= 0.03, R2=−0.97). In contrast, the activities of trypsin andamylase was similar among all the experimental groups (P > 0.05).
3.6. Histology
All intestinal sections examined showed normal intestinal mor-phology. No typical morphological changes such as widening orshortening of the intestinal folds, widening of the lamina propria withinthe intestinal folds and a profound infiltration of mixed leucocytes inthe lamina propria was observed in all diet groups. Infiltration of in-flammatory cells in the submucosa was not observed, nor the loss of thesupranuclear vacuolization in the absorptive cells (enterocytes) wasobserved in the present study (Fig. S2 (ii)). The perimeter ratio wassignificantly higher in the C-1.5 group compared to the negative control(Fig. S1).
3.7. Blood biochemistry and enzymes
No significant difference was found in serum biochemistry or en-zymes (P > 0.05) (Table 5).
3.8. Intestinal microbiota
A total number of 951,646 raw pair-ended reads were generated for12 samples. After sequence quality control and feature filtering,386,561 merged sequences were retained with a minimum number ofsample sequence being 11,755. The rarefaction analysis showed ade-quate sequencing depth for all the samples (Fig. S3).
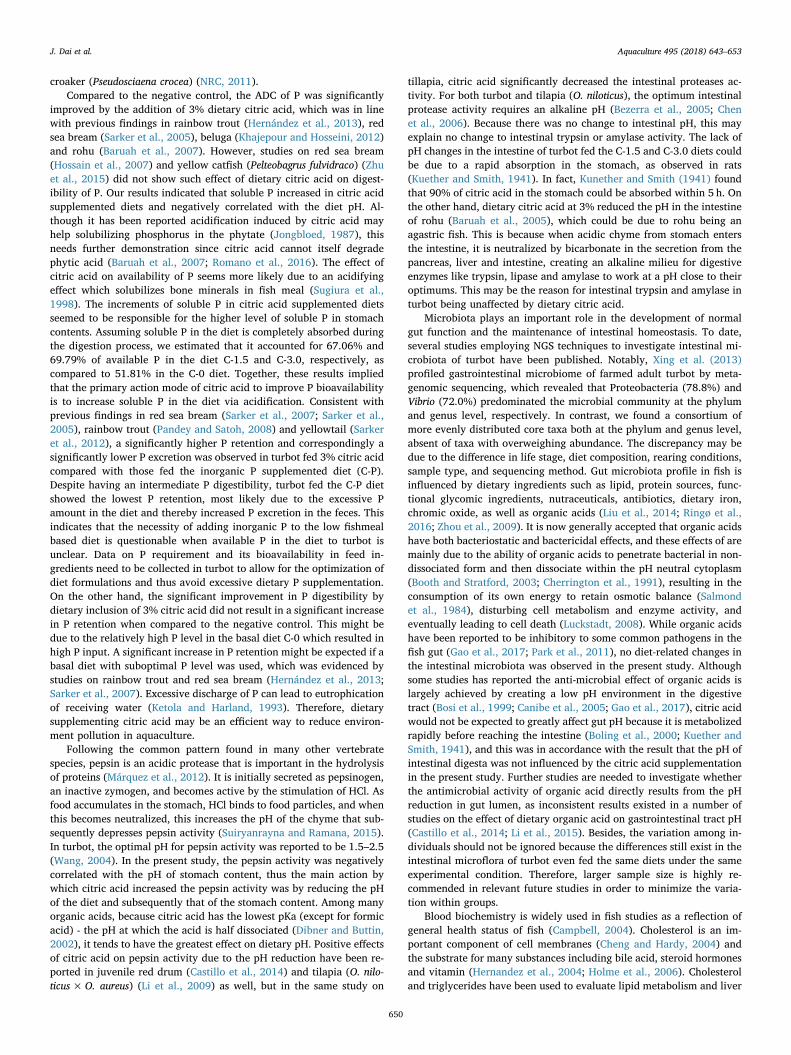
At phylum level, the bacterial composition of the positive controlgroup was dominated by Firmicutes (37.85%) and Proteobacteria(31.15%), followed by Bacteroidetes (13.21%) and Actinobacteria(11.31%) (Fig. 4A). At genus level, Lactobacillus and Bacillus accountedfor 16.82% of the total bacterial population, followed by Mesorhizobium(2.18%), Bacteroides (1.40%), Pseudomonas (1.16%), and Oscillospira
(1.08%) (Fig. 4B). No significant diet-related difference in alpha di-versity of intestinal microbiota was observed (Fig. S4). The PCoA plot(Fig. S5) showed no clear clustering of microbial samples under variousexperimental conditions, indicating that the overall microbial
Fig. 2. Effects of phosphorus and citric acid supplementations on apparent di-gestibility coefficient of nutrients of juvenile turbot. DM, dry matter; Ca, cal-cium; P, phosphorus; Pro, protein. Error bars of columns indicate standard errorof means (n= 3) and different letters within each variable denote significantdifferences as evaluated by Tukey's HSD test (P < 0.05).
Fig. 3. Effects of phosphorus and citric acid supplementations on P utilizationby juvenile turbot. (A) Stacked chart showing the total, soluble, available andfecal P of each diet. (B) 100% stacked chart showing the total, soluble, availableand fecal P of each diet, the total dietary P was specified as 1 (100%), the % inthe y-axis refers to the proportion of each component of P with respect to total Pin diet. (C) P retention and excretion. DM, dry matter. Total P= availableP+ fecal P; available P= soluble P+P liberated via digestion. Error bars in-dicate standard error of means (n=3) and different letters within a seriesdenote significant differences as evaluated by Tukey's HSD test (P < 0.05).
J. Dai et al. Aquaculture 495 (2018) 643–653
648

community structure may be similar among different treatments. Thiswas confirmed by the PERMANOVA results (Table S2). No differentiallyabundant taxa were identified at phylum or genus level between thenegative control group and citric acid supplemented groups.
4. Discussion
Phosphorus (P) is a major component of hard tissues and is an es-sential element of organic phosphates, which plays an essential role infish growth and development. Deficiency in P can result in malforma-tion of skeleton and reduced feed efficiency and fish growth (NRC,2011). Supplementing citric acid to a low phosphorus fish diet en-hanced the P utilization and allowed the growth performance similar tothat achieved with an inorganic P supplemented diet in rainbow trout
and red sea bream (Hernández et al., 2013; Hossain et al., 2007),suggesting that citric acid has the potential to liberate P from a low-phosphorus diet to boost fish growth. In the present study, however,dietary supplementation of citric acid did not improve the growth ofjuvenile turbot, despite citric acid increasing soluble dietary P. This waslikely due to high levels of already available dietary P that ranged from8.3–9.7 g kg−1 may have exceeded the minimum requirement of thefish for optimal growth. This is also based on the C-P and C-0 dietsleading to similar growth, indicating that P supplementations wereunnecessary, as well as a similar P content across all the treatmentgroups. The reported P requirements for optimal growth, feed utiliza-tion and bone mineralization has been reported to be 3.3–9.1 g kg−1 forchannel catfish (Ictalurus punctatus), black sea bream (Acanthopagrusschlegeli), salmon, haddock (Melanogrammus aeglefinus) and yellow
Fig. 4. Effects of phosphorus and citric acid supplementations on bacterial composition in the distal intestine of juvenile turbot. A, top 10 most abundant taxa atphylum level; B, top 20 most abundant taxa at genus level.
J. Dai et al. Aquaculture 495 (2018) 643–653
649
croaker (Pseudosciaena crocea) (NRC, 2011).Compared to the negative control, the ADC of P was significantly
improved by the addition of 3% dietary citric acid, which was in linewith previous findings in rainbow trout (Hernández et al., 2013), redsea bream (Sarker et al., 2005), beluga (Khajepour and Hosseini, 2012)and rohu (Baruah et al., 2007). However, studies on red sea bream(Hossain et al., 2007) and yellow catfish (Pelteobagrus fulvidraco) (Zhuet al., 2015) did not show such effect of dietary citric acid on digest-ibility of P. Our results indicated that soluble P increased in citric acidsupplemented diets and negatively correlated with the diet pH. Al-though it has been reported acidification induced by citric acid mayhelp solubilizing phosphorus in the phytate (Jongbloed, 1987), thisneeds further demonstration since citric acid cannot itself degradephytic acid (Baruah et al., 2007; Romano et al., 2016). The effect ofcitric acid on availability of P seems more likely due to an acidifyingeffect which solubilizes bone minerals in fish meal (Sugiura et al.,1998). The increments of soluble P in citric acid supplemented dietsseemed to be responsible for the higher level of soluble P in stomachcontents. Assuming soluble P in the diet is completely absorbed duringthe digestion process, we estimated that it accounted for 67.06% and69.79% of available P in the diet C-1.5 and C-3.0, respectively, ascompared to 51.81% in the C-0 diet. Together, these results impliedthat the primary action mode of citric acid to improve P bioavailabilityis to increase soluble P in the diet via acidification. Consistent withprevious findings in red sea bream (Sarker et al., 2007; Sarker et al.,2005), rainbow trout (Pandey and Satoh, 2008) and yellowtail (Sarkeret al., 2012), a significantly higher P retention and correspondingly asignificantly lower P excretion was observed in turbot fed 3% citric acidcompared with those fed the inorganic P supplemented diet (C-P).Despite having an intermediate P digestibility, turbot fed the C-P dietshowed the lowest P retention, most likely due to the excessive Pamount in the diet and thereby increased P excretion in the feces. Thisindicates that the necessity of adding inorganic P to the low fishmealbased diet is questionable when available P in the diet to turbot isunclear. Data on P requirement and its bioavailability in feed in-gredients need to be collected in turbot to allow for the optimization ofdiet formulations and thus avoid excessive dietary P supplementation.On the other hand, the significant improvement in P digestibility bydietary inclusion of 3% citric acid did not result in a significant increasein P retention when compared to the negative control. This might bedue to the relatively high P level in the basal diet C-0 which resulted inhigh P input. A significant increase in P retention might be expected if abasal diet with suboptimal P level was used, which was evidenced bystudies on rainbow trout and red sea bream (Hernández et al., 2013;Sarker et al., 2007). Excessive discharge of P can lead to eutrophicationof receiving water (Ketola and Harland, 1993). Therefore, dietarysupplementing citric acid may be an efficient way to reduce environ-ment pollution in aquaculture.
Following the common pattern found in many other vertebratespecies, pepsin is an acidic protease that is important in the hydrolysisof proteins (Márquez et al., 2012). It is initially secreted as pepsinogen,an inactive zymogen, and becomes active by the stimulation of HCl. Asfood accumulates in the stomach, HCl binds to food particles, and whenthis becomes neutralized, this increases the pH of the chyme that sub-sequently depresses pepsin activity (Suiryanrayna and Ramana, 2015).In turbot, the optimal pH for pepsin activity was reported to be 1.5–2.5(Wang, 2004). In the present study, the pepsin activity was negativelycorrelated with the pH of stomach content, thus the main action bywhich citric acid increased the pepsin activity was by reducing the pHof the diet and subsequently that of the stomach content. Among manyorganic acids, because citric acid has the lowest pKa (except for formicacid) - the pH at which the acid is half dissociated (Dibner and Buttin,2002), it tends to have the greatest effect on dietary pH. Positive effectsof citric acid on pepsin activity due to the pH reduction have been re-ported in juvenile red drum (Castillo et al., 2014) and tilapia (O. nilo-ticus×O. aureus) (Li et al., 2009) as well, but in the same study on
tillapia, citric acid significantly decreased the intestinal proteases ac-tivity. For both turbot and tilapia (O. niloticus), the optimum intestinalprotease activity requires an alkaline pH (Bezerra et al., 2005; Chenet al., 2006). Because there was no change to intestinal pH, this mayexplain no change to intestinal trypsin or amylase activity. The lack ofpH changes in the intestine of turbot fed the C-1.5 and C-3.0 diets couldbe due to a rapid absorption in the stomach, as observed in rats(Kuether and Smith, 1941). In fact, Kunether and Smith (1941) foundthat 90% of citric acid in the stomach could be absorbed within 5 h. Onthe other hand, dietary citric acid at 3% reduced the pH in the intestineof rohu (Baruah et al., 2005), which could be due to rohu being anagastric fish. This is because when acidic chyme from stomach entersthe intestine, it is neutralized by bicarbonate in the secretion from thepancreas, liver and intestine, creating an alkaline milieu for digestiveenzymes like trypsin, lipase and amylase to work at a pH close to theiroptimums. This may be the reason for intestinal trypsin and amylase inturbot being unaffected by dietary citric acid.
Microbiota plays an important role in the development of normalgut function and the maintenance of intestinal homeostasis. To date,several studies employing NGS techniques to investigate intestinal mi-crobiota of turbot have been published. Notably, Xing et al. (2013)profiled gastrointestinal microbiome of farmed adult turbot by meta-genomic sequencing, which revealed that Proteobacteria (78.8%) andVibrio (72.0%) predominated the microbial community at the phylumand genus level, respectively. In contrast, we found a consortium ofmore evenly distributed core taxa both at the phylum and genus level,absent of taxa with overweighing abundance. The discrepancy may bedue to the difference in life stage, diet composition, rearing conditions,sample type, and sequencing method. Gut microbiota profile in fish isinfluenced by dietary ingredients such as lipid, protein sources, func-tional glycomic ingredients, nutraceuticals, antibiotics, dietary iron,chromic oxide, as well as organic acids (Liu et al., 2014; Ringø et al.,2016; Zhou et al., 2009). It is now generally accepted that organic acidshave both bacteriostatic and bactericidal effects, and these effects of aremainly due to the ability of organic acids to penetrate bacterial in non-dissociated form and then dissociate within the pH neutral cytoplasm(Booth and Stratford, 2003; Cherrington et al., 1991), resulting in theconsumption of its own energy to retain osmotic balance (Salmondet al., 1984), disturbing cell metabolism and enzyme activity, andeventually leading to cell death (Luckstadt, 2008). While organic acidshave been reported to be inhibitory to some common pathogens in thefish gut (Gao et al., 2017; Park et al., 2011), no diet-related changes inthe intestinal microbiota was observed in the present study. Althoughsome studies has reported the anti-microbial effect of organic acids islargely achieved by creating a low pH environment in the digestivetract (Bosi et al., 1999; Canibe et al., 2005; Gao et al., 2017), citric acidwould not be expected to greatly affect gut pH because it is metabolizedrapidly before reaching the intestine (Boling et al., 2000; Kuether andSmith, 1941), and this was in accordance with the result that the pH ofintestinal digesta was not influenced by the citric acid supplementationin the present study. Further studies are needed to investigate whetherthe antimicrobial activity of organic acid directly results from the pHreduction in gut lumen, as inconsistent results existed in a number ofstudies on the effect of dietary organic acid on gastrointestinal tract pH(Castillo et al., 2014; Li et al., 2015). Besides, the variation among in-dividuals should not be ignored because the differences still exist in theintestinal microflora of turbot even fed the same diets under the sameexperimental condition. Therefore, larger sample size is highly re-commended in relevant future studies in order to minimize the varia-tion within groups.
Blood biochemistry is widely used in fish studies as a reflection ofgeneral health status of fish (Campbell, 2004). Cholesterol is an im-portant component of cell membranes (Cheng and Hardy, 2004) andthe substrate for many substances including bile acid, steroid hormonesand vitamin (Hernandez et al., 2004; Holme et al., 2006). Cholesteroland triglycerides have been used to evaluate lipid metabolism and liver
J. Dai et al. Aquaculture 495 (2018) 643–653
650

status in fish (Agrahari et al., 2007; Benedito-Palos et al., 2016; Sabziet al., 2017) and are influenced by the nutritional and physiologicalstates (Babin and Vernier, 1989). No significant difference in choles-terol and triglycerides in the present results indicated that citric acidcaused no change to lipid metabolism and liver function of turbot.Serum AST and ALT are sometimes used as an overall health statusindicator for the liver in nutritional studies on fish (Molina et al., 2005;Zhang et al., 2008). These enzymes are present at low concentrations inplasma, and increases of their activities in plasma indicate the devel-opment of tissue lesions, particularly hepatic lesion (Ebrahimi et al.,2017; Malbrouck et al., 2003). There was no significant difference inserum AST and ALT activity among dietary groups, indicating citricacid has no adverse effect on normal status of turbot liver. In contrast,dietary sodium citrate supplementation at the levels of 1%, 2% and 4%,which were similar to those used in the presents study, elevated theactivity of plasma ALT and induced liver damage in tilapia (Oreochromissp.), and this may be due to the concentration of sodium citrate hasbeen excessive to tilapia (Romano et al., 2016). Creatinine is a proteinproduced by muscle through the breakdown of creatinine phosphate forenergy and released into the blood. Elevated creatinine level signifiesimpaired kidney function (Pakhira et al., 2015). Urea is a by-product ofprotein metabolism that is formed in the liver and its main function is toremove nitrogen waste from the immune system and to avoid toxicity.The levels of uric acid and creatinine in the serum are useful markers,which indicate the overall health of kidney (Campbell, 2004; Tietz,1986). The present study shows absence of difference in urea andcreatinine among all experimental groups, indicating citric acid had noadverse effects on kidney of turbot. No significant difference was ob-served in any of the parameters examined, indicating that turbot fed thecitric acid supplemented diets were healthy as those fed the positivecontrol diet. This was supported by observing no adverse histo-pathology of the distal intestine, which detected no noticeable patho-logical changes in any of the fish examined. Interestingly, citric acid atthe lower inclusion level (1.5%) increased the absorptive surface area,but this did not lead to improved digestibility efficiency of the testednutrients. More comprehensive evaluation about the effects of citricacid on intestine function has to be done in future studies. Together,these results showed that dietary inclusion of citric acid up to 3% inturbot diet induced no detrimental effects on fish health.
5. Conclusions
Results indicate that when available P in low fishmeal-based diets isunclear, the necessity of inorganic dietary P supplementations isquestionable to turbot. This is because such a practice would unlikelyimprove turbot growth and only lead to excessive P excretion. Whilecitric acid supplementations did improve P digestibility, likely due toincreased soluble P, it is unclear whether this was released from fish-meal or plant proteins in the diets. There were also no indications ofdietary citric acid negatively affecting the overall health of turbot andactually the citric acid supplementation improved the pepsin activity.Thus, citric acid appears to be a promising feed additive to developmore eco-friendly turbot feeds.
Acknowledgement
This research was financially supported by the National NaturalScience Foundation of China (No.: 41576137, 31202006), the NationalBasic Research Program (973 program, No. 2014CB138601) and ChinaAgriculture Researches System (No.: CARS-47-G10).
Appendix A. Supplementary data
Supplementary data to this article can be found online at https://doi.org/10.1016/j.aquaculture.2018.04.004.
References
Agrahari, S., Pandey, K.C., Gopal, K., 2007. Biochemical alteration induced by mono-crotophos in the blood plasma of fish, Channa punctatus (Bloch). Pestic. Biochem.Physiol. 88, 268–272.
Anderson, M.J., 2001. A new method for non-parametric multivariate analysis of var-iance. Aust. Ecol. 26, 32–46.
Babin, P.J., Vernier, J.M., 1989. Plasma lipoproteins in fish. J. Lipid Res. 30, 467–489.Baldo, L., Riera, J.L., Tooming-Klunderud, A., Albà, M.M., Salzburger, W., 2015. Gut
microbiota dynamics during dietary shift in eastern African cichlid fishes. PLoS One10, e0127462.
Baruah, K., Pal, A.K., Sahu, N.P., Jain, K.K., Mukherjee, S.C., Debnath, D., 2005. Dietaryprotein level, microbial phytase, citric acid and their interactions on bone miner-alization of Labeo rohita (Hamilton) juveniles. Aquac. Res. 36, 803–812.
Baruah, K., Sahu, N.P., Pal, A.K., Jain, K.K., Debnath, D., Mukherjee, S.C., 2007. Dietarymicrobial phytase and citric acid synergistically enhances nutrient digestibility andgrowth performance of Labeo rohita (Hamilton) juveniles at sub-optimal protein level.Aquac. Res. 38, 109–120.
Benedito-Palos, L., Ballester-Lozano, G.F., Simó, P., Karalazos, V., Ortiz, Á., Calduch-Giner, J., Pérez-Sánchez, J., 2016. Lasting effects of butyrate and low FM/FO diets ongrowth performance, blood haematology/biochemistry and molecular growth-relatedmarkers in gilthead sea bream (Sparus aurata). Aquaculture 454, 8–18.
Bernfeld, Peter, 1951. Enzymes of starch degradation and synthesis. In: Advances inEnzymology & Related Subjects of Biochemistry. 12. pp. 379.
Bezerra, R.S., Paiva, P.M.G., Chaves, M.E.C., Coelho Jr., L.C.B.B., 2005. Alkaline protei-nase from intestine of Nile tilapia (Oreochromis niloticus). Process Biochem. 40,1829–1834.
Biswas, A.K., Hou, K., Ji, S.C., Seoka, M., Takii, K., 2007. Use of soybean meal and phytasefor partial replacement of fish meal in the diet of red sea bream, Pagrus major.Aquaculture 267, 284–291.
Bokulich, N.A., Subramanian, S., Faith, J.J., Gevers, D., Gordon, J.I., Knight, R., Mills,D.A., Caporaso, J.G., 2013. Quality-filtering vastly improves diversity estimates fromIllumina amplicon sequencing. Nat. Methods 10, 57–59.
Boling, S.D., Webel, D.M., Mavromichalis, I., Parsons, C.M., Baker, D.H., 2000. The effectof citric acid on phytate-phosphorous utilization in young chicks and pigs. J. Anim.Sci. 78, 682–689.
Booth, I.R., Stratford, M., 2003. Acidulants and low pH. In: Russell, N.J., Gould, G.W.(Eds.), Food Preservatives. Kluwer Academic/Plenum Publishers, New York, pp.25–47.
Bosi, P., Jung, H.J., Han, I.K., Perini, S., Cacciavillani, J.A., Casini, L., Creston, D.,Gremokolini, C., Mattuzzi, S., 1999. Effects of dietary buffering characteristics andprotected or unprotected acids on piglet growth, digestibility and characteristics ofgut content. Asian Australas. J. Anim. Sci. 12, 1104–1110.
Bucking, C., Wood, C.M., 2009. The effect of postprandial changes in pH along the gas-trointestinal tract on the distribution of ions between the solid and fluid phases ofchyme in rainbow trout. Aquac. Nutr. 15, 282–296.
Callahan, B.J., McMurdie, P.J., Rosen, M.J., Han, A.W., Johnson, A.J.A., Holmes, S.P.,2016. DADA2: high-resolution sample inference from Illumina amplicon data. Nat.Methods 13, 581–583.
Campbell, T.W., 2004. Clinical chemistry of fish and amphibians. In: Thrall, M.A., Barker,D.C., Campbell, T.W., DeNicola, D., Fettman, M.J., Lassen, E.D., Rebar, A., Weiser, G.(Eds.), Veterinary Hematology and Clinical Chemistry: Text and Clinical CasePresentations. Lippincott Williams and Wilkins, Philadelphia, pp. 499–517.
Canibe, N., Højberg, O., Højsgaard, S., Jensen, B.B., 2005. Feed physical form and formicacid addition to the feed affect the gastrointestinal ecology and growth performanceof growing pigs. J. Anim. Sci. 83, 1287–1302.
Cao, L., Wang, W., Yang, C., Yang, Y., Diana, J., Yakupitiyage, A., Luo, Z., Li, D., 2007.Application of microbial phytase in fish feed. Enzym. Microb. Technol. 40, 497–507.
Caporaso, J.G., Kuczynski, J., Stombaugh, J., Bittinger, K., Bushman, F.D., Costello, E.K.,Fierer, N., Pena, A.G., Goodrich, J.K., Gordon, J.I., Huttley, G.A., Kelley, S.T.,Knights, D., Koenig, J.E., Ley, R.E., Lozupone, C.A., McDonald, D., Muegge, B.D.,Pirrung, M., Reeder, J., Sevinsky, J.R., Tumbaugh, P.J., Walters, W.A., Widmann, J.,Yatsunenko, T., Zaneveld, J., Knight, R., 2010. QIIME allows analysis of high-throughput community sequencing data. Nat. Methods 7, 335–336.
Castillo, S., Rosales, M., Pohlenz, C., Iii, D.M.G., 2014. Effects of organic acids on growthperformance and digestive enzyme activities of juvenile red drum Sciaenops ocellatus.Aquaculture 433, 6–12.
Chen, M., Zhang, X., Gao, T., Chen, C., 2006. Effects of temperature, pH and NaCl onprotease activity in digestive tract of young turbot, Scophthalmus maximus. Chin. J.Oceanol. Limnol. 24, 300–306.
Cheng, Z.J., Hardy, R.W., 2004. Protein and lipid sources affect cholesterol concentra-tions of juvenile Pacific white shrimp, Litopenaeus vannamei (Boone) The onlineversion of this article, along with updated information and services, is located on theWorld Wide Web at: protein. J. Anim. Sci. 82, 1136–1145.
Cherrington, C.A., Hinton, M., Chopra, I., 1990. Effect of short-chain organic acids onmacromolecular synthesis in Escherichia coli. J. Appl. Bacteriol. 68, 69–74.
Cherrington, C.A., Hinton, M., Mead, G.C., Chopra, I., 1991. Organic acids: chemistry,antibacterial activity and practical applications. Adv. Microb. Physiol. 32, 87–108.
Coloso, R.M., King, K., Fletcher, J.W., Hendrix, M.A., Subramanyam, M., Weis, P.,Ferraris, R.P., 2003. Phosphorus utilization in rainbow trout (Oncochyncus mykiss) fedpractical diets and its consequences on effluent phosphorus levels. Aquaculture 220,801–820.
Cupp-Enyard, C., 2008. Sigma's non-specific protease activity assay - casein as a substrate.J. Visualized Experiments Jove 19, 899.
Dhariwal, A., Chong, J., Habib, S., King, I.L., Agellon, L.B., Xia, J., 2017. Microbiome
J. Dai et al. Aquaculture 495 (2018) 643–653
651

analyst: a web-based tool for comprehensive statistical, visual and meta-analysis ofmicrobiome data. Nucleic Acids Res. 45, W180–W188.
Dibner, J.J., Buttin, P., 2002. Use of organic acids as a model to study the impact of gutmicroflora on nutrition and metabolism. J. Appl. Poult. Res. 11, 453–463.
Dimitroglou, A., Merrifield, D., Moate, R., Davies, S., Spring, P., Sweetman, J., Bradley,G., 2009. Dietary mannan oligosaccharide supplementation modulates intestinalmicrobial ecology and improves gut morphology of rainbow trout Oncorhynchusmykiss (Walbaum). J. Anim. Sci. 87, 3226–3234.
Ebrahimi, M., Daeman, N.H., Chong, C.M., Karami, A., Kumar, V., Hoseinifar, S.H.,Romano, N., 2017. Comparing the effects of different dietary organic acids on thegrowth, intestinal short-chain fatty acids, and liver histopathology of red hybrid ti-lapia (Oreochromis sp.) and potential use of these as preservatives. Fish Physiol.Biochem. 43, 1–13.
Erdman, J.W., 1979. Oilseed phytates: nutritional implications. J. Am. Oil Chem. Soc. 56,736–741.
Erlanger, B.F., Kokowsky, N., Cohen, W., 1961. The preparation and properties of twonew chromogenic substrates of trypsin. Arch. Biochem. Biophys. 95, 271–278.
Gao, Y., He, J., He, Z., Li, Z., Zhao, B., Mu, Y., Lee, J.-Y., Chu, Z., 2017. Effects of fulvicacid on growth performance and intestinal health of juvenile loach Paramisgurnusdabryanus (Sauvage). Fish Shellfish Immunol. 62, 47–56.
He, W., Rahimnejad, S., Wang, L., Song, K., Lu, K., Zhang, C., 2017. Effects of organicacids and essential oils blend on growth, gut microbiota, immune response and dis-ease resistance of Pacific white shrimp (Litopenaeus vannamei) against Vibrio para-haemolyticus. Fish & Shellfish Immunology. 70, 164.
Hernandez, P.V., Olveranovoa, M.A., Rouse, D.B., 2004. Effect of dietary cholesterol ongrowth and survival of juvenile redclaw crayfish Cherax quadricarinatus under la-boratory conditions. Aquaculture 236, 405–411.
Hernández, A.J., Satoh, S., Kiron, V., 2013. The effect of citric acid supplementation ongrowth performance, phosphorus absorption and retention in rainbow trout(Oncorhynchus mykiss) fed a low-fishmeal diet. Cienc. Inv. Agr. 40, 397–406.
Hidalgo, M.C., Urea, E., Sanz, A., 1999. Comparative study of digestive enzymes in fishwith different nutritional habits. Proteolytic and amylase activities. Aquaculture 170,267–283.
Holme, M.H., Zeng, C., Southgate, P.C., 2006. The effects of supplemental dietary cho-lesterol on growth, development and survival of mud crab, Scylla serrata, megalopafed semi-purified diets. Aquaculture 261, 1328–1334.
Hossain, M.A., Pandey, A., Satoh, S., 2007. Effects of organic acids on growth andphosphorus utilization in red sea bream Pagrus major. Fish. Sci. 73, 1309–1317.
Hung, L.T., Thanh, N.T., Pham, M.A., Browdy, C.L., 2015. A comparison of the effect ofdietary fungal phytase and dicalcium phosphate supplementation on growth per-formances, feed and phosphorus utilization of tra catfish juveniles (Pangasianodonhypophthalmus Sauvage, 1878). Aquac. Nutr. 21, 197–202.
Jongbloed, A.W., 1987. Phosphorus in the Feeding of Pigs. Effect of Diet on theAdsorption and Retention of Phosphorus by Growing Pigs. Agriculture University ofWageningen, Wageningen, Netherlands, PhD dissertation.
Katoh, K., Standley, D.M., 2013. MAFFT multiple sequence alignment software version 7:improvements in performance and usability. Mol. Biol. Evol. 30, 772–780.
Kemme, P.A., Jongbloed, A.W., Mroz, Z., Kogut, J., Beynen, A.C., 1999. Digestibility ofnutrients in growing-finishing pigs is affected by Aspergillus niger phytase, phytate andlactic acid levels. 2. Apparent total tract digestibility of phosphorus, calcium andmagnesium and ileal degradation of phytic acid. Livest. Prod. Sci. 58, 119–127.
Ketola, H.G., Harland, B.F., 1993. Influence of phosphorus in rainbow trout diets onphosphorus discharges in effluent water. Trans. Am. Fish. Soc. 122, 1120–1126.
Khajepour, F., Hosseini, S.A., 2012. Citric acid improves growth performance and phos-phorus digestibility in Beluga (Huso huso) fed diets where soybean meal partly re-placed fish meal. Anim. Feed Sci. Technol. 171, 68–73.
Kirchgessner, M., Roth, F.X., 1982. Fumaric acid as a feed additive in pig nutrition. PigNews Info. 3, 259–264.
Krogdahl, Å., Sundby, A., Holm, H., 2015a. Characteristics of digestive processes inAtlantic salmon (Salmo salar). Enzyme pH optima, chyme pH, and enzyme activities.Aquaculture 449, 27–36.
Krogdahl, Å., Bakke-Mckellep, A.M., Baeverfjord, G., 2015b. Effects of graded levels ofstandard soybean meal on intestinal structure, mucosal enzyme activities, and pan-creatic response in Atlantic salmon (Salmo salar L.). Aquac. Nutr. 9, 361–371.
Kuether, C.A., Smith, A.H., 1941. The absorption and fate of free citric acid in the rat. J.Biol. Chem. 137, 647–658.
Li, J.S., Li, J.L., Wu, T.T., 2009. Effects of non-starch polysaccharides enzyme, phytaseand citric acid on activities of endogenous digestive enzymes of tilapia (Oreochromisniloticus× Oreochromis aureus). Aquac. Nutr. 15, 415–420.
Li, X.Q., Cui, W.O., Leng, X.J., 2015. Citric acid substituted the inclusion of inorganicphosphorus in diet of rainbow trout (Oncorhynchus mykiss). Aquac. Res. 48,1089–1098.
Li, Y., Hu, H., Liu, J., Yang, P., Zhang, Y., Ai, Q., Xu, W., Zhang, W., Mai, K., 2016. Dietarysoya allergen β-conglycinin induces intestinal inflammatory reactions, serum-specificantibody response and growth reduction in a carnivorous fish species, turbotScophthalmus maximus L. Aquac. Res. 48, 4022–4037.
Li, Y., Yang, P., Zhang, Y., Ai, Q., Xu, W., Zhang, W., Zhang, Y., Hu, H., Liu, J., Mai, K.,2017. Effects of dietary glycinin on the growth performance, digestion, intestinalmorphology and bacterial community of juvenile turbot, Scophthalmus maximus L.Aquaculture 479, 125–133.
Liebert, F., Portz, L., 2005. Nutrient utilization of Nile tilapia Oreochromis niloticus fedplant based low phosphorus diets supplemented with graded levels of differentsources of microbial phytase. Aquaculture 248, 111–119.
Ling, C., Wang, W., Yi, Y., Yang, C., Yuan, Z., Xiong, S., Diana, J., 2007. Environmentalimpact of aquaculture and countermeasures to aquaculture pollution in China.Environ. Sci. Pollut. Res. 14, 452–462.
Liu, W., Yang, Y., Zhang, J., Gatlin, D.M., Ringø, E., Zhou, Z., 2014. Effects of dietarymicroencapsulated sodium butyrate on growth, intestinal mucosal morphology, im-mune response and adhesive bacteria in juvenile common carp (Cyprinus carpio) pre-fed with or without oxidised oil. Br. J. Nutr. 112, 15–29.
Lozupone, C., Knight, R., 2005. UniFrac: a new phylogenetic method for comparing mi-crobial communities. Appl. Environ. Microbiol. 71, 8228–8235.
Lu, C., Sun, Y., Gao, Q., Dong, S., Wen, B., 2014. Effects of different water exchangefrequencies on the enviroments of the sediments in sea cucumber culture ponds.Transactions of Oceanology and Limnology. 4, 008.
Luckstadt, C., 2008. The use of acidifiers in fish nutrition. CAB Rev. 3, 1–8.Mai, K., Zhang, C., Ai, Q., Duan, Q., Xu, W., Zhang, L., Liufu, Z., Tan, B., 2006. Dietary
phosphorus requirement of large yellow croaker, Pseudosciaena crocea R. Aquaculture251, 346–353.
Malbrouck, C., Trausch, G., Devos, P., Kestemont, P., 2003. Hepatic accumulation andeffects of microcystin-LR on juvenile goldfish Carassius auratus L. Comp. Biochem.Physiol. C Toxicol. Pharmacol. 135, 39–48.
Mallekh, R., Boujard, T., Lagardère, J.P., 1999. Evaluation of retention and environ-mental discharge of nitrogen and phosphorus by farmed turbot (Scophthalmus max-imus). N. Am. J. Aquac. 61, 141–145.
Mandal, S., Van Treuren, W., White, R.A., Eggesbø, M., Knight, R., Peddada, S.D., 2015.Analysis of composition of microbiomes: a novel method for studying microbialcomposition. Microb. Ecol. Health Dis. 26.
Márquez, L., Robles, R., Morales, G.A., Moyano, F.J., 2012. Gut pH as a limiting factor fordigestive proteolysis in cultured juveniles of the gilthead sea bream (Sparus aurata).Fish Physiol. Biochem. 38, 859–869.
Molina, R., Moreno, I., Pichardo, S., Jos, A., Moyano, R., Monterde, J.G., Cameán, A.,2005. Acid and alkaline phosphatase activities and pathological changes induced intilapia fish (Oreochromis sp.) exposed subchronically to microcystins from toxic cy-anobacterial blooms under laboratory conditions. Toxicon Official Journal of theInternational Society on Toxinology. 46, 725–735.
National Research Council (NRC), 2011. Nutrient Requirements of Fish and Shrimp.National Academies Press, Washington, D.C.
Nelson, T.S., 1967. The utilization of phytate phosphorus by poultry—a review. Poult.Sci. 46, 862–871.
Ng, W.K., Koh, C.B., 2016. The utilization and mode of action of organic acids in the feedsof cultured aquatic animals. Rev. Aquac. 9, 342–368.
Ng, W.K., Koh, C.B., Sudesh, K., Siti-Zahrah, A., 2010. Effects of dietary organic acids ongrowth, nutrient digestibility and gut flora of red hybrid tilapia, Oreochromis sp., andsubsequent survival during a challenge test with Streptococcus agalactiae. Aquac. Res.40, 1490–1500.
Ogino, C., 1979. Availability of dietary phosphorus in carp and rainbow trout. Bull. Jpn.Soc. Sci. Fish. 45, 1527–1532.
Pakhira, C., Nagesh, T.S., Abraham, T.J., Dash, G., Behera, S., 2015. Stress responses inrohu, Labeo rohita transported at different densities. Aquac. Rep. 2, 39–45.
Pandey, A., Satoh, S., 2008. Effects of organic acids on growth and phosphorus utilizationin rainbow trout Oncorhynchus mykiss. Fish. Sci. 74, 867–874.
Park, G., Lee, J.H., Yun, H.H., Browdy, C.L., Bharadwaj, A.S., Bai, S.C., 2011. Effects oftwo different organic acid blands in olive flounder. In: South korea organic farmingassociation. 19. pp. 39–42.
Partanen, K.H., Mroz, Z., 1999. Organic acids for performance enhancement in pig diets.Nutr. Res. Rev. 12, 117.
Price, M.N., Dehal, P.S., Arkin, A.P., 2010. FastTree 2–approximately maximum-like-lihood trees for large alignments. PLoS One 5, e9490.
Ravindran, V., Ravindran, G., Sivalogan, S., 1994. Total and phytate phosphorus contentsof various foods and feedstuffs of plant origin. Food Chem. 50, 133–136.
Reddy, N.R., Sathe, S.K., Salunkhe, D.K., 1982. Phytates in legumes and cereals. Adv.Food Res. 28, 1.
Ricke, S.C., 2003. Perspectives on the use of organic acids and short chain fatty acids asantimicrobials. Poult. Sci. 82, 632–639.
Ringø, E., Zhou, Z., Vecino, J.L.G., Wadsworth, S., Romero, J., Krogdahl, Å., Olsen, R.E.,Dimitroglou, A., Foey, A., Davies, S., 2016. Effect of dietary components on the gutmicrobiota of aquatic animals. A never-ending story? Aquac. Nutr. 22, 219–282.
Romano, N., Simon, W., Ebrahimi, M., Fadel, A.H.I., Chong, C.M., Kamarudin, M.S., 2016.Dietary sodium citrate improved oxidative stability in red hybrid tilapia (Oreochromissp.) but reduced growth, health status, intestinal short chain fatty acids and inducedliver damage. Aquaculture 458, 170–176.
Sabzi, E., Mohammadiazarm, H., Salati, A.P., 2017. Effect of dietary l -carnitine and lipidlevels on growth performance, blood biochemical parameters and antioxidant statusin juvenile common carp (Cyprinus carpio). Aquaculture 480, 89–93.
Salmond, C.V., Kroll, R.G., Booth, I.R., 1984. The effect of food preservatives on pHhomeostasis in Escherichia coli. J. Gen. Microbiol. 130, 2845–2850.
Sarker, S.A., Satoh, S., Kiron, V., 2005. Supplementation of citric acid and amino acid-chelated trace element to develop environment-friendly feed for red sea bream,Pagrus major. Aquaculture 248, 3–11.
Sarker, M.S.A., Satoh, S., Kiron, V., 2007. Inclusion of citric acid and/or amino acid-chelated trace elements in alternate plant protein source diets affects growth andexcretion of nitrogen and phosphorus in red sea bream Pagrus major. Aquaculture262, 436–443.
Sarker, M., Alam, S., Satoh, S., Kamata, K., Haga, Y., Yamamoto, Y., 2012.Supplementation effect (s) of organic acids and/or lipid to plant protein-based dietson juvenile yellowtail, Seriola quinqueradiata Temminck et Schlegel 1845, growthand, nitrogen and phosphorus excretion. Aquac. Res. 43, 538–545.
Sugiura, S.H., Dong, F.M., Hardy, R.W., 1998. Effects of dietary supplements on theavailability of minerals in fish meal; preliminary observations. Aquaculture 160,283–303.
Suiryanrayna, M.V.A.N., Ramana, J.V., 2015. A review of the effects of dietary organic
J. Dai et al. Aquaculture 495 (2018) 643–653
652

acids fed to swine. Journal of animal science and biotechnology. 6, 45.Thaela, M.J., Jensen, M.S., Pierzynowski, S.G., Jakob, S., Jensen, B.B., 1998. Effect of
lactic acid supplementation on pancreatic secretion in pigs after weaning. J. Anim.Feed Sci. 7, 181–183.
Tietz, N., 1986. Textbook of Clinical Chemistry. W. B, Saunders, Philadelphia,Pennsylvania.
Vazquez-Baeza, Y., Pirrung, M., Gonzalez, A., Knight, R., 2013. EMPeror: a tool for vi-sualizing high-throughput microbial community data. GigaScience. 2, 16.
Wang, H., 2004. Digestive Enzyme in Turbot Scophthalmus maximus L. Ocean Universityof China, China, pp. 120.
Wang, A.R., Ran, C., Ringø, E., Zhou, Z.G., 2017. Progress in fish gastrointestinal mi-crobiota research. Rev. Aquac. http://dx.doi.org/10.1111/raq.12191.
Warth, A.D., 1991. Mechanism of action of benzoic acid on Zygosaccharomyces bailii: ef-fects on glycolytic metabolite levels, energy production, and intracellular pH. Appl.Environ. Microbiol. 57, 3410–3414.
Watanabe, T., Takeuchi, T., Murakami, A., Ogino, C., 1980. The availability to tilapianilotica of phosphorus in white fish meal. Nsugaf 46, 897–899.
Weiss, S., Xu, Z.Z., Peddada, S., Amir, A., Bittinger, K., Gonzalez, A., Lozupone, C.,Zaneveld, J.R., Vázquez-Baeza, Y., Birmingham, A., 2017. Normalization and mi-crobial differential abundance strategies depend upon data characteristics.
Microbiome 5, 27.Xing, M., Hou, Z., Yuan, J., Liu, Y., Qu, Y., Liu, B., 2013. Taxonomic and functional
metagenomic profiling of gastrointestinal tract microbiome of the farmed adultturbot (Scophthalmus maximus). FEMS Microbiol. Ecol. 86, 432–443.
Yao, Z., Wang, A., Li, Y., Cai, Z., Lemaitre, B., Zhang, H., 2016. The dual oxidase geneBdDuox regulates the intestinal bacterial community homeostasis of Bactrocera dor-salis. ISME J. 10, 1037.
Yone, Y., Toshima, N., 1979. The utilization of phosphorus in fish meal by carp and blacksea bream. Bull. Jpn. Soc. Sci. Fish. 45, 753–756.
Zhang, X., Xie, P., Wang, W., Li, D., Shi, Z., 2008. Plasma biochemical responses of theomnivorous crucian carp (Carassius auratus) to crude cyanobacterial extracts. FishPhysiol. Biochem. 34, 323–329.
Zhou, Z., Liu, Y., He, S., Shi, P., Gao, X., Yao, B., Ringø, E., 2009. Effects of dietarypotassium diformate (KDF) on growth performance, feed conversion and intestinalbacterial community of hybrid tilapia (Oreochromis niloticus♀× O. aureus).Aquaculture 291, 89–94.
Zhu, Y., Ding, Q., Chan, J., Chen, P., Wang, C., 2015. The effects of concurrent supple-mentation of dietary phytase, citric acid and vitamin D 3 on growth and mineralutilization in juvenile yellow catfish Pelteobagrus fulvidraco. Aquaculture 436,143–150.
J. Dai et al. Aquaculture 495 (2018) 643–653
653