city of albany, oregon · 2017-09-12 · city of albany, oregon adopted budget 2017-2018 budget...
TRANSCRIPT


CITY OF ALBANY, OREGON ADOPTED BUDGET 2017-2018 BUDGET COMMITTEE
City Council Lay Members
Sharon Konopa, Mayor Susan Folden, Chair Bill Coburn, Councilor Colleen Keller Bessie Johnson, Councilor Mitch Langjahr Rich Kellum, Councilor Scott Pierson Ray Kopczynski, Councilor Will Summers Dick Olsen, Councilor Michael Thomson Mike Sykes, Councilor Terry Virnig
Administrative Staff
City Manager .................................................... Wes Hare ................................................................ Peter Troedsson Urban Renewal ............................................... Ed Hodney Finance Director ....................................... Stewart Taylor Fire Chief ..................................................... John Bradner Human Resources Director ........................... David Shaw Assistant City Manager/CIO/Economic Development ..... ..................................................................... Jorge Salinas Library Director ........................................... Ed Gallagher Parks & Recreation Director ........................... Ed Hodney Police Chief ............................................ Mario Lattanzio PW Director (Operations) ............................. Chris Bailey PW Director (Engineering/CD) ....................... Jeff Blaine Accounting Supervisor .................................. Anne Baker Accounting Supervisor .............................. Jeanna Yeager City Clerk ...................................................... Mary Dibble


TABLE OF
CONTENTS


2017-2018 Budget TABLE OF CONTENTS City of Albany
EXECUTIVE SUMMARY Budget Message ........................................................................................................................................... 1 Executive Summary ..................................................................................................................................... 4 Strategic Plan: Introduction .............................................................................................................................................. 7 Mission & Vision Statement ................................................................................................................... 10 Property Taxes, Debt Management, Basis of Budgeting ........................................................................... 33 Fund Type Summary as Proposed by the City Manager ........................................................................... 35 Adjustments to the Proposed Budget Approved by the Budget Committee .............................................. 36 Adjustments to the Approved Budget Adopted by the City Council ......................................................... 37 Citywide Organizational Chart .................................................................................................................. 38 City of Albany Ward Map ......................................................................................................................... 39 City of Albany City Council ...................................................................................................................... 40 Personnel Change Report ........................................................................................................................... 41 Personnel and Monthly Salary Schedule ................................................................................................... 44
USER’S GUIDE A Brief Tour of Albany .............................................................................................................................. 50 Fund Structure ............................................................................................................................................ 52 Budget Document Structure ....................................................................................................................... 54 City of Albany Budget Process .................................................................................................................. 55 Budget Calendar ......................................................................................................................................... 59 Budget Assumptions .................................................................................................................................. 60
POLICIES Financial Policy ......................................................................................................................................... 61 Investment Policy ....................................................................................................................................... 65 Risk Management Policy ........................................................................................................................... 75 FINANCIAL SUMMARIES
Summary of Resources and Requirements by Fund Type and Category (Table 1) ................................... 79 Summary of Major Resources by Fund Type (Table 2) ............................................................................ 80 Adopted Budget by Fund Type and Requirement Type (Table 3) ............................................................ 82 Budget by Fund and Requirement Type (Table 4) .................................................................................... 84 Budget by Fund/Program and Requirement Type (Table 5) ...................................................................... 86 Schedule of Restricted (R) and Unrestricted (U) Reserves (Table 6) ........................................................ 90 Historical Financial Information by Fund and Fund Type (Table 7) ......................................................... 92 Projected Fund Balances (Table 8) ............................................................................................................ 93 Property Tax Rates – All Overlapping Districts (Table 9) ........................................................................ 94 Property Tax Information – 2016-17 Adopted Budget (Table 10) ............................................................ 95 Property Tax Receipts (Current and Delinquent Taxes) Last Ten Fiscal Years (Table 11) ...................... 97 Percent of Total Current & Delinquent Taxes Received by Fund Last Ten Fiscal Years (Table 11) ........ 97 Net Assessed Value Used to Compute Property Tax Last Ten Fiscal Years (Table 12) ........................... 97 Property Taxes Levied, Collected, & Collection Percentage-Ten Fiscal Years from 2004-2013 (Table 13) ............. 98 Annual Property Tax Collection Percentage – Ten Fiscal Years (Table 13) ............................................. 99 Total Property Taxes Levied per Capita, Assessed Value per Capita-Ten Fiscal Years from 2005-2014 (Table 14) ................................................................................................................................................. 100 Debt Management .................................................................................................................................... 101 Computation of Legal Debt Margin (Table 15) ....................................................................................... 102 Schedule of Future Debt Service Requirements Outstanding Principal and Interest – All Funds (Table 16) ........... 103 Summary of Debt Service by Type & Fund (Table 17) ........................................................................... 105 Long-Term Debt & Schedule of Future Debt Service Requirements (Table 18) .................................... 106 Revenue Bond Coverage: Enterprise Funds (Table 19) ........................................................................... 109

2017-2018 Budget TABLE OF CONTENTS City of Albany
GENERAL FUND (100) Program Functions, Revenue Trends, and Assumptions .......................................................................... 110 General Fund Resources and Requirements ............................................................................................. 112 Property Tax Collections .......................................................................................................................... 113 State Shared Resources ............................................................................................................................. 113 Municipal Court Fines .............................................................................................................................. 114 Rural Fire District Revenues ..................................................................................................................... 114 Beginning Fund Balance ........................................................................................................................... 114 Other Statistics .......................................................................................................................................... 115 2016-17 General Fund Resources including Public Safety Levy ............................................................. 115 Expenditures/Requirements by Year ........................................................................................................ 116 Percent of Total Annual General Fund Requirements for Ten Fiscal Years............................................. 116 Franchise Fee/Privilege Tax Collections .................................................................................................. 117 Annual Percentage Change for Each Fee & Tax ...................................................................................... 117 General Fund Resource Detail .................................................................................................................. 118 General Fund Resource Summary ............................................................................................................ 119 Requirement/Staffing Summaries ............................................................................................................. 120 10-1003 Non-departmental ....................................................................................................................... 121 10-1029 Municipal Court .......................................................................................................................... 123 25-1202 Public Safety Levy – Fire ........................................................................................................... 125 25-1203 Fire & Life Safety ....................................................................................................................... 127 25-1208 Fire Emergency Services ............................................................................................................ 129 30-1301 Police .......................................................................................................................................... 132 30-1302 Public Safety Levy - Police ........................................................................................................ 134 40-1601 Planning ...................................................................................................................................... 136 45-1701 Library ........................................................................................................................................ 138 SPECIAL REVENUE FUNDS Program Functions, Revenue Trends, and Assumptions .......................................................................... 140 Special Revenue Sources by Type ............................................................................................................ 142 Special Revenue Requirements by Category ............................................................................................ 142 PARKS & RECREATION FUND - 202
Resource Detail ......................................................................................................................................... 143 Requirement Summaries ........................................................................................................................... 145 Staffing Summary and Requirements by Type ......................................................................................... 146 Resources by Type, Ten Fiscal Years ....................................................................................................... 147 Property Taxes, Parks SDC Fees, & Charges for Services, Ten Fiscal Years .......................................... 147 Total Property Taxes Collected per Capita & Charges for Services per Capita ....................................... 148 Programs Supported by Property Taxes, User Fees, and Other Resources ............................................... 149 Self-Supported Special Programs ............................................................................................................. 151 35-1402 Sports Services ........................................................................................................................... 152 35-1403 Children/Youth/Family Recreation Services .............................................................................. 154 35-1404 Resource Development & Marketing Services ........................................................................... 156 35-1407 Park Maintenance Services ......................................................................................................... 158 35-1408 Parks & Recreation Administration ............................................................................................ 160 35-1410 Aquatic Services ......................................................................................................................... 162 35-1413 Adult Recreation Services .......................................................................................................... 164 35-1414 Performance and Cultural Arts ................................................................................................... 166 35-1500 Parks SDC Projects ..................................................................................................................... 168 35-1506 Senior Center Foundation ........................................................................................................... 170 35-1507 Parks Capital Improvement Projects........................................................................................... 172

2017-2018 Budget TABLE OF CONTENTS City of Albany
GRANTS FUND - 203
Grant Descriptions ................................................................................................................................... 174 Resource Detail ........................................................................................................................................ 176 Requirement/Staffing Summaries ............................................................................................................ 177 25-5099 State HMEP Grant ..................................................................................................................... 178 25-5117 Community Paramedic Program ................................................................................................ 179 25-5008 Department of Justice Bulletproof Vest Grant .......................................................................... 180 30-5096 Department of Justice Equitable Sharing Grant ........................................................................ 181 30-5110 Community Policing Donations ................................................................................................ 182 30-5119 Linn/Benton District Attorney’s Asset Forfeiture ..................................................................... 183 40-5100 CDBG Grant .............................................................................................................................. 184 40-5102 CDBG Activities ........................................................................................................................ 185 40-5118 14-15 State Historic Preservation Grant .................................................................................... 186 45-5032 Library Foundation Grant .......................................................................................................... 187 45-5033 Oregon Community Foundation ................................................................................................ 188 45-5034 Oregon State Library Grant ....................................................................................................... 189 50-5003 FAA Annual Capital Grant ........................................................................................................ 190 50-5014 Title XIX Grant ......................................................................................................................... 191 BUILDING INSPECTION FUND - 204
Resource Detail ........................................................................................................................................ 192 Requirement/Staffing Summaries ............................................................................................................ 193 Building Permit Revenues/Resources by Source ..................................................................................... 194 Residential, Commercial, and Electrical Permit Revenues/Resources by Source ................................... 194 Average Revenue per Permit ................................................................................................................... 194 40-1602 Building Inspection.................................................................................................................... 195 40-1603 Electrical Permit Program .......................................................................................................... 197 RISK MANAGEMENT FUND - 208
Resource Detail ........................................................................................................................................ 199 Requirement Summaries .......................................................................................................................... 199 10-1005 Risk Management ...................................................................................................................... 200 10-1037 Pepsi Settlement Proceeds ......................................................................................................... 202 ECONOMIC DEVELOPMENT FUND - 211
Resource Detail ........................................................................................................................................ 204 Requirement/Staffing Summaries ............................................................................................................ 205 Transient Room Tax Collections ............................................................................................................. 206 Use of Transient Room Tax Revenues .................................................................................................... 207 Percentage of Total Room Tax Revenues by Usage ................................................................................ 207 11-1101 Economic Development Activities ............................................................................................ 208 50-1103 Albany Municipal Airport ......................................................................................................... 210 50-1115 Municipal Airport Capital Projects ............................................................................................ 212

2017-2018 Budget TABLE OF CONTENTS City of Albany
PUBLIC TRANSIT FUND - 213
Resource Detail ........................................................................................................................................ 214 Resources by Type – Ten Fiscal Years .................................................................................................... 215 Requirement/Staffing Summaries ............................................................................................................ 216 50-1106 Albany Transit System .............................................................................................................. 217 50-1107 Linn-Benton Loop ..................................................................................................................... 219 50-1108 Paratransit System ..................................................................................................................... 221 PUBLIC SAFETY LEVY FUND - 215
Resource Detail ........................................................................................................................................ 223 Requirement Summary ............................................................................................................................ 223 Transfers Out & Total Taxes Detail by Fiscal Year ................................................................................ 223 Public Safety Levy Property Taxes Levied Last Ten Fiscal Years .......................................................... 224 Total Public Safety Levy Taxes Received Last Ten Fiscal Years ........................................................... 224 10-1008 Public Safety Levy .................................................................................................................... 225 CAPITAL REPLACEMENT FUND - 217
Resource Detail ........................................................................................................................................ 227 Requirement Summaries .......................................................................................................................... 227 10-1010 Equipment Replacement ............................................................................................................ 228 10-1034 City Facilities Replacement ....................................................................................................... 230 10-2002 General Fund Facilities Maintenance Projects .......................................................................... 232 13-1031 IT Equipment Replacement ....................................................................................................... 234 50-2018 Public Works Facilities Replacement ........................................................................................ 236 STREET FUND - 250
Resource Detail ........................................................................................................................................ 238 Requirement/Staffing Summaries ............................................................................................................ 239 Operation and Maintenance Combined Budget ....................................................................................... 240 Capital Projects Combined Budget .......................................................................................................... 241 Summary of Capital Expenditures – Fiscal Year 2016-2017 ................................................................... 242 Street Fund Resources – Ten Fiscal Years ............................................................................................... 243 State Gas Taxes, Licenses & Fees, and Franchise Fees – Ten Fiscal Years ............................................ 243 Per Capita State Gas Tax, Franchise Fees, and Current Resources – Ten Fiscal Years .......................... 244 50-2602 Street Maintenance .................................................................................................................... 245 50-2604 Street Administration ................................................................................................................. 247 50-2700 Street Capital & Restoration ...................................................................................................... 249 50-2701 North Albany Frontage Fee Projects ......................................................................................... 251 50-2703 Transportation SDC Improvement Fee Projects ........................................................................ 253 50-2704 Transportation SDC Reimbursement Fee Projects .................................................................... 255 50-2705 ADA Capital Projects ................................................................................................................ 256

2017-2018 Budget TABLE OF CONTENTS City of Albany
DEBT SERVICE FUNDS Program Functions, Revenue Trends, and Assumptions ......................................................................... 259 DEBT SERVICE FUND - 301
Resource Detail ........................................................................................................................................ 260 Requirement Summaries .......................................................................................................................... 261 10-1021 2002 Limited Tax Pension Bonds ............................................................................................. 262 10-1022 2004 Revenue Obligations ......................................................................................................... 264 GO DEBT SERVICE FUND - 303
Resource Detail ........................................................................................................................................ 266 Requirement Summaries .......................................................................................................................... 267 10-1051 2015 Public Safety Facilities Bonds .......................................................................................... 268 CAPITAL PROJECTS FUNDS Program Functions, Revenue Trends, and Assumptions ......................................................................... 270 CAPITAL PROJECTS FUND - 402
Resource Detail ........................................................................................................................................ 271 Requirement/Staffing Summaries ............................................................................................................ 272 10-1012 LID Construction Projects ......................................................................................................... 273 10-1052 Public Safety Facilities .............................................................................................................. 275
PERMANENT FUNDS Program Functions, Revenue Trends, and Assumptions ......................................................................... 277 SENIOR CENTER ENDOWMENT FUND - 501
Resource Detail ........................................................................................................................................ 278 Donations & Interest Earnings for Ten Fiscal Years ............................................................................... 278 Requirement Summaries .......................................................................................................................... 278 35-1418 Senior Center Endowment ........................................................................................................ 279 LIBRARY TRUST FUND - 502
Resource Detail ........................................................................................................................................ 281 Requirement Summaries .......................................................................................................................... 281 Interest Earnings for Ten Fiscal Years ..................................................................................................... 281 45-1703 V.O. Torney Trust ..................................................................................................................... 282 45-1704 Manela Trust .............................................................................................................................. 284 ENTERPRISE FUNDS Program Functions, Revenue Trends, and Assumptions ......................................................................... 286 SEWER FUND - 601
Resource Detail ........................................................................................................................................ 287 Requirement/Staffing Summaries ............................................................................................................ 288 Total Sewer Fund Resources by Source .................................................................................................. 289 Total Sewer Fund Requirements by Type ................................................................................................ 289 Use of Current Sewer Service Charges .................................................................................................... 289 Resources Ten Fiscal Years ..................................................................................................................... 290 Sewer Service Charges Revenues, Annual Percentage Change ............................................................... 290

2017-2018 Budget TABLE OF CONTENTS City of Albany
SEWER FUND – 601 (continued) Requirements Ten Fiscal Years ............................................................................................................... 291 Debt Service Combined Budget ............................................................................................................... 292 Operation and Maintenance Combined Budget ....................................................................................... 293 Capital & Economic Development Combined Budget ............................................................................ 294 Summary of Capital Expenditures for Fiscal Year 2015-2016 ................................................................ 295 50-2404 Wastewater Treatment Plant ...................................................................................................... 297 50-2405 Wastewater Collection ............................................................................................................... 299 50-2407 Wastewater Administration ....................................................................................................... 301 50-2410 Water Re-Use and Biosolids ...................................................................................................... 303 50-2411 TWG Wetlands .......................................................................................................................... 305 50-2413 Industrial Pretreatment............................................................................................................... 307 50-2500 Sewer System Capital Projects .................................................................................................. 309 50-2501 Sewer Equipment Replacement ................................................................................................. 311 50-2502 Sewer SDC Improvement Fee Projects ..................................................................................... 313 50-2503 Sewer SDC Reimbursement Fee Projects .................................................................................. 315 50-2504 Sewer Debt Service ................................................................................................................... 317 50-2506 Sewer Economic Development .................................................................................................. 319 WATER FUND - 615
Resource Detail ........................................................................................................................................ 321 Requirement/Staffing Summaries ............................................................................................................ 322 Total Water Fund Resources by Source ................................................................................................... 323 Total Water Fund Requirements by Type ................................................................................................ 323 Use of Current Water Service Charges .................................................................................................... 323 Resources Ten Fiscal Years ..................................................................................................................... 324 Water Service Charges Revenues, Annual Percentage Change ............................................................... 324 Requirements Ten Fiscal Years ............................................................................................................... 325 Operation and Maintenance Combined Budget ....................................................................................... 326 Debt Service Combined Budget ............................................................................................................... 327 Capital & Economic Development Combined Budget ............................................................................ 328 Summary of Capital Expenditures for Fiscal Year 2014-2015 ................................................................ 329 50-2202 Water Administration ................................................................................................................ 331 50-2204 Canal Maintenance .................................................................................................................... 333 50-2205 Vine Street Water Treatment Plant ............................................................................................ 335 50-2206 Water Distribution ..................................................................................................................... 337 50-2207 Albany-Millersburg Water Treatment Plant .............................................................................. 339 50-2300 Water SDC Improvement Fee Projects ...................................................................................... 341 50-2301 Water SDC Reimbursement Fee Projects .................................................................................. 343 50-2305 Water Debt Service .................................................................................................................... 345 50-2308 Water System Capital Projects .................................................................................................. 347 50-2309 Water Economic Development .................................................................................................. 349 50-2310 North Albany Water Capital Projects ........................................................................................ 351 50-2311 Water Equipment Replacement ................................................................................................. 353 STORMWATER FUND - 625
Resource Detail ........................................................................................................................................ 355 Requirement/Staffing Summaries ............................................................................................................ 356 50-3003 Stormwater Operations .............................................................................................................. 357 50-3004 Stormwater Administration ....................................................................................................... 359 50-3100 Vine Street Water Treatment Plant ............................................................................................ 361 50-3101 Stormwater Equipment Replacement ........................................................................................ 363

2017-2018 Budget TABLE OF CONTENTS City of Albany
INTERNAL SERVICE FUNDS Program Functions, Revenue Trends, and Assumptions ......................................................................... 365 CENTRAL SERVICES FUND - 701
Cost Allocation Methodology for Central Service Fund Programs ......................................................... 366 Resource Detail ........................................................................................................................................ 367 Requirement/Staffing Summaries ............................................................................................................ 368 10-1035 Finance Department ................................................................................................................... 369 11-1027 Council & Nondepartmental ...................................................................................................... 371 11-1028 City Manager’s Office ............................................................................................................... 373 13-1030 Information Technology Services.............................................................................................. 375 13-2010 Geographic Information Services .............................................................................................. 377 13-2011 Permit Tracking Services ........................................................................................................... 379 14-1032 Human Resources ...................................................................................................................... 381 35-1033 Facilities Maintenance ............................................................................................................... 383 PUBLIC WORKS SERVICES FUND - 705 Resource Detail ........................................................................................................................................ 385 Requirement/Staffing Summaries ............................................................................................................ 386 50-2802 Public Works Administration .................................................................................................... 387 50-2803 Public Works Engineering Services .......................................................................................... 389 50-2805 Operations Administration Services .......................................................................................... 392 50-2806 Water Quality Control Services ................................................................................................. 394 50-2807 Public Works Customer Services .............................................................................................. 396 50-2809 Facilities & Maintenance Engineering ...................................................................................... 398 CAPITAL BUDGET City Manager’s Message .......................................................................................................................... 400 Introduction .............................................................................................................................................. 401 Ongoing Projects ...................................................................................................................................... 403 Paying for Capital Projects ...................................................................................................................... 407 Major Needs That Remain Unfunded ...................................................................................................... 411 Schedule of Capital Equipment Fiscal Year 2014-2015 .......................................................................... 414 Summary of Capital Requirements and Capital Reserves ....................................................................... 415 2016-2017 CIP Project Information ......................................................................................................... 419
APPENDIX
Budget Adoption and Appropriation Resolution ..................................................................................... 472 Affidavit of Publication ........................................................................................................................... 477 Glossary ................................................................................................................................................... 480 Glossary – Acronyms ............................................................................................................................... 488

EXECUTIVE
SUMMARY


BUDGET MESSAGE Fiscal Year 2017-2018 When I wrote my first budget message in 1988, I did not have a cell phone bill, a cable television bill, an internet bill, an internet security bill, an Amazon Prime bill, a life insurance deduction from my bank account, an annual Costco fee, a subscription to Ancestry.com, and a home security alarm bill. Despite having four children at home, I lived in a house about one-third the size of my current home, and I spent a lot less money. I didn’t complain about my taxes then and I don’t complain about them now because I still appreciate the value I receive for what I spend.
Just as my personal budget has changed over the years, so have the budgets I’ve prepared for the places where I’ve worked. New swimming pools, new libraries, new wastewater and water treatment plants, new fire stations and countless smaller projects have been funded in response to citizen concerns or the orders of regulatory agencies. Budgets have also increased as the cost of qualified workers has grown and as new technology has made services possible that we never imagined in 1988. Forgotten amidst the changes that have taken place in local government finances over the years is the shift from federally funded projects to local government financing. The first wastewater treatment plant construction project I worked on as a young city manager received 75 percent funding from the federal government, while the last two in La Grande and Albany received no federal support. Cities also lost the Federal Revenue Sharing program in the 1980’s, again shifting more of the burden of paying for services to the local level. Tax cuts at the federal level have often led to increased costs for local government. The City of Albany adopted budget for Fiscal Year 2018 is something like my personal budget and the many budgets I’ve prepared over the years in the different cities where I’ve worked. Revenues and expenses have increased as needs and expectations have risen. This budget is intended to meet the goals and objectives of Albany’s Strategic Plan by funding services and projects at levels that have been established over time. I am not aware of any expensive new priorities called for in this budget; however, the cost of maintaining what we have is growing. Most of the adopted increases in expenditures will be for a few new employees to replace some of those lost during the Great Recession. New fire fighters and police officers are needed to keep pace with a growing demand for services and to ensure that current crime and traffic safety standards are met. We will continue to see savings from health insurance changes made in FY 2017, but whether we can expand those savings to help meet increasing retirement costs awaits the outcome of current labor negotiations. The City Council is aware there are many needs that will not be met in a single year’s budget. Streets, storm water management, public safety equipment replacement and sewer system improvements are just a few of the very expensive projects that will not be adequately addressed in this budget. While there should be cause for concern about our deficiencies, we should also recognize that we have been planning and working toward solutions. The new storm water utility formed in the current budget year; a proposal to direct asset sale proceeds to equipment replacement; plus a series of discussions about street maintenance and funding are all important steps toward meeting future needs. We will never have sufficient resources to meet all the expectations of every interest group or citizen, but I believe this budget will maintain current services without jeopardizing future priorities. I am also recommending to the City Council that they consider adopting a biennial budget next year in an effort to take a longer term look at financial needs while devoting less resources to simply preparing the budget. A biennial budget will, at the very least, delay the need for more administrative staff as both the community and organization continue to grow.
1

2

EXECUTIVE SUMMARY ____________________________________________________________________________________________ Overview The budget for Fiscal Year 2017-2018 reflects moderate growth. General property taxes are expected to increase by 3.61 percent and franchise fees and privilege taxes are expected to be flat. Water and sewer revenues reflect scheduled rate increases but are tempered by conservation. The ambulance, fire, and police operating levy was increased by voters in 2012 but is expected to continue to be impacted by property tax compression. Expenditures are growing by cost-of-living adjustments and increasing benefits costs. The result is a budget that maintains minimum reserves and allocates available resources to maintain targeted levels of service. This year’s approach to developing the budget continues the practice of identifying available revenues and then giving departments a target number within which to build their operating budgets. Two very favorable dynamics continue to characterize this approach. First, operating budgets are funded within current revenues. Second, department directors have greater flexibility to evaluate needs and allocate scarce resources to priority programs and activities. The challenge in future budgets will continue to be increases in expenditures growing faster than increases in revenues. Economic Conditions The slow growth out of the global economic downturn is continuing in Albany. A couple of key indicators are described below.
Unemployment. In January 2017, Linn County’s unemployment rate was 5.0 percent, matching its revised December rate. Linn County’s seasonally adjusted unemployment rate declined 1.0 percentage point over the past 12 months. Benton County’s unemployment rate was 3.2 percent in January, down from its revised rate of 3.7 percent in December. Oregon’s statewide unemployment rate in January was 4.3 percent, down from its revised rate of 4.5 percent in December.
Development. Albany’s Building Inspection Division reports that permits for new residential construction and total permits were down from 2016 as indicated in the following table:
February Fiscal YTD 2013 2014 2015 2016 2017 New Residential Permits 74 114 92 98 94 New Commercial Permits 6 4 5 12 6 Total Number of all Permits 1,407 1,558 1,492 1,723 1,630
The increased activity over the past two years contributes to growth in revenues for the Building Inspection Division and may suggest gradual growth in other revenues such as property taxes and franchise fees.
Population Growth Many of the services provided by the City are more closely tied to population growth than to economic conditions. A slowdown in the economy does not reduce the need for police, fire, library, utility and many other municipal services. An increase in population, however, often means a corresponding increase in demands for services.
Budgeted FTEs per 1,000 Population. The number of budgeted full-time equivalent (FTE) City employees per thousand of population has decreased by over 10 percent during the past ten years. For the past three years, a distinction was made between authorized positions and budgeted positions. Authorized positions were those that had previously been approved by the City Council but may or may not have been funded in the budget. Budgeted positions were authorized positions that were actually funded. The expectation was that authorized positions that were not funded in the budget could be filled as revenues became available or other expenditures were reduced. Continued budget constraints have eliminated the anticipated benefit of the two designations. Therefore, the distinction between authorized and budgeted has been dropped.
3

EXECUTIVE SUMMARY ________________________________________________________________________________________________ The following table presents the population for the City of Albany as stated by Portland State University, the number of budgeted FTEs, and the budgeted FTEs per 1,000 of population in the corresponding budget year.
Budgeted FTEs per 1,000 Population FY ending June 30
2009
2010
2011
2012
2013
2014*
2015
2016
2017
2018
10-Year
% Change Population
48,770
49,165
49,530
50,325
50,520
50,710
50,720
51,270
51,670
52,540
7.73%
Budgeted FTEs
428.825
427.425
424.925
424.925
388.825
389.775
385.875
399.508
406.558
424.118
-1.10%
Budgeted FTEs per 1,000 pop
8.793
8.694
8.579
8.444
7.696
7.686
7.608
7.792
7.868
8.072
-8.19%
*Includes six firefighter positions funded through the SAFER Grant
Population has increased over the last ten years by 7.73 percent while the number of budgeted FTEs has declined by 1.10 percent. The number of FTEs per thousand declined by 8.19 percent over the same period of time. The lower number of FTEs per thousand over the past several years reflects deliberate reductions in staffing to stay within available resources.
Cost-Saving Strategies Department budgets for 2017-2018 were compiled in the context of current economic conditions, increasing costs, and sustainability of programs and services in future years. A lot of effort and analysis has been done to keep expenditures within estimated available resources. The following outline presents several of the cost-saving strategies that have been used to contain costs.
Voluntary Separation Incentive Program. Three different Voluntary Separation Incentive Programs were offered to employees over the past several years to create vacancies and reduce staffing. The primary objective of the programs was to reduce staffing in a way that avoids the dislocation of employees and families typically associated with layoffs. Fifty employees participated in the incentive programs, resulting in several vacancies and significant budget savings.
4

EXECUTIVE SUMMARY ________________________________________________________________________________________________
Hiring Chill. A hiring chill was imposed for all departments. No vacancies are filled without careful review of the timing and the need to fill the position by the relevant department director and the City Manager. Savings associated with the hiring chill depend on the vacancies that occur. Cost of Living Adjustments (COLAs). Non-represented employees and all bargaining units were asked to forgo COLAs in previous budgets.
Leave Buy-back. Non-represented employees no longer have the option to buy back up to forty hours of administrative leave time. Reserves and Replacement Funds. Reserve accounts are being drawn down and contributions to vehicle and equipment replacement funds are still below desired funding levels. Materials and Services. Expenditures for contracted services, minor equipment, office supplies and other materials and services continue to be reviewed very closely.
Closing Statement The budget includes strategies to modestly increase staffing levels and maintain levels of service in an improving economic environment. The budget also attempts to be sustainable in Fiscal Year 2018-2019, but does not solve the problem of revenues continuing to be outpaced by the growth of expenditures. A combination of increased growth and reductions in expenditures may be needed to maintain existing levels of service in future years.
5

Strategic Plan and Program Budgets Albany’s strategic plan was first implemented in the 2005-2006 Adopted Budget. In that document, the plan was characterized as a way of taking traditional goal-setting to the next level. The plan continues to evolve but has in a very meaningful way fulfilled that expectation by becoming the standard against which goals, objectives, strategies and activities are measured. Each succeeding budget has to a greater degree incorporated references to the themes and objectives of the strategic plan.
The City Council has maintained the policy direction and leadership role in the strategic planning process by reviewing the plan on a regular basis. The most recent revisions were adopted on January 25, 2017. The direction provided in the strategic plan is followed by the City Manager and Department Directors in developing the proposed budget that is presented to the Budget Committee. Through this process, the adopted budget effectively becomes the implementing document for the strategic plan. Presented below are examples of objectives and actions in the strategic plan for various operating programs. Community Development Department
Strategic Plan Theme – Great Neighborhoods Objective GN-1a: Maintain the value and attraction of Albany’s historic assets and seek
federal funds and other sources. Actions: Apply for State Historic Preservation Office grants. Make rehabilitation loans
and track completions.
Strategic Plan Theme – Great Neighborhoods Objective GN-3: Ensure public buildings, sidewalks, and public transportation is
accessible to all. Actions: Develop a plan and prioritization system for making accessibility improvements
when funding is identified and available. Library Department
Strategic Plan Theme – Great Neighborhoods Objective GN-10: By the end of 2019, increase library visits by 10 percent. Actions: Add five new programs across all service areas. Increase the percentage of
operating dollars spent on collections to Oregon state median (10 percent). Police and Fire Departments
Strategic Plan Theme – A Safe City Objective SC-1: Complete construction of the Albany Police Department building and
Fire Station 11. Actions: Complete building projects by September 2017.
Strategic Plan Theme – A Safe City Objective SC-5: Maintain the combined number of fatal and injury collisions at 2.5 per
thousand residents or less annually. Actions: Achieve this objective through controlled traffic enforcement with an emphasis
at high-collision areas.
6

Strategic Plan Theme – A Safe City
Objective SC-9: Collaborate with neighboring fire departments and communities to improve emergency response reliability and provide a consistent level of emergency and life safety services.
Actions: Collaboratively staff and maintain a single-role medic unit with other emergency response agencies; expand community risk reduction services by increasing community paramedic program capabilities; explore opportunities to provide equivalent emergency services irrespective of geographic boundary.
Strategic Plan Theme – A Safe City Objective SC-15: Formalize work group with a focus on identifying current issues with
transitional housing. Actions: Identify staff that could help characterize and address transitional housing-
related issues. Public Works Department
Strategic Plan Theme – A Safe City Objective SC-16: Optimize the use and management of the Vine Street and Albany-
Millersburg Water Treatment Plants to meet regulatory and demand needs for the City’s drinking water supply.
Actions: Develop a written water production management plan that will maximize the efficient use of the two water treatment plants to meet supply and regulatory requirements.
Strategic Plan Theme – A Safe City Objective SC-18: Effectively manage biosolids waste at the Albany-Millersburg Water
Reclamation Facility. Actions: Maximize efficiencies and cost effective management and disposal of solids at
the Albany-Millersburg Water Reclamation Facility. Identify a preferred alternative for a solids improvement project along with funding options.
Parks and Recreation
Strategic Plan Theme – An Effective Government Objective EG-1: Reduce the percentage of total annual Parks & Recreation Fund
expenditures subsidized with property tax revenues to 55 percent by 2020. Actions: Achieve this objective through a combination of nontax revenue increases and
expenditure reductions. Finance Department
Strategic Plan Theme – An Effective Government Objective EG-13: Continue recognition from the Government Finance Officers
Association for excellence in budgeting and financial reporting. Maintain audit results establishing conformance to requirements and generally accepted accounting principles.
Actions: Receive the GFOA “Excellence in Financial Reporting” and “Distinguished Budget Presentation” awards. Achieve annual audit with no reportable findings of noncompliance.
7

OUR MISSION “Providing quality public services for a better Albany
community.”
OUR VISION “A vital and diverse community that promotes a high
quality of life, great neighborhoods, balanced economic growth, and quality public services.”
8

OUR VALUES
The City of Albany’s Strategic Plan is guided by three fundamental elements: our mission, our vision, and our core values. Our Mission Statement is based on the principles of high quality and continuous improvement. Our Vision Statement presents a compelling future toward which our Strategic Plan is directed. Both our mission and our vision are founded on the following basic values that guide all of our actions and that reflect what we expect from our employees and our elected officials:
Transparent, Open, and Honest Government. This value reflects our first and most important responsibility. Our competence is measured and, in fact, reinforced through active engagement of those we serve. We maintain an organizational reputation for openness, honesty, and integrity.
Dedication to Service. Our primary duty is to the people we serve. We are accessible, responsive, consistent, and understanding. We provide assistance beyond our customers’ expectations, and we find effective solutions to problems that they bring to our attention.
Fiscal Responsibility. Proper use of public resources is a trust which we continually guard. In our management of this trust, we must avoid even the appearance of impropriety. In our management of public funds, we constantly strive for the greatest possible efficiency and effectiveness to sustain affordable services.
Personal Honesty and Integrity. Each of us demonstrates the highest standards of personal integrity and honesty in our public activities to inspire confidence and trust in our government.
Excellence. We continually pursue excellence by being creative, professional, taking risks, showing initiative, and being committed to our community and team. In this pursuit, we support continuing education and training for all team members.
Teamwork. We are a team that emphasizes high levels of trust and cooperation and a commitment to excellent communications within the organization. We encourage employees to exercise independent judgment in meeting customer needs through professional behavior that is consistent with our values.
A Humane and Diverse Organization. We are a humane organization that honors diversity and protects individual rights. Open communication, respect for others, compassion, and a sense of humor contribute to our positive work environment. We make it possible for every employee to achieve his or her full potential. We value the cultural and social diversity that is reflected in our community, and we welcome the changes and new perspectives that this diversity brings to us. We protect those individuals whose basic rights are placed in jeopardy.
9

Why Do Strategic Planning?
If our Mission and Vision Statements are to have any meaning, they must be accompanied by deliberate planning efforts to move the organization and the community toward a desired future. This requires clearly defined goals, proactive objectives, committed leadership, and effective management. Above all, it requires managing the forces of change. Those forces include community demographics, state and federal mandates, fiscal constraints, economic conditions, emerging technologies, and many other influences on our service delivery efforts. High performing organizations are those that learn to anticipate and adapt to change by creating value for those we serve, and motivation and meaning for those who serve them. The best tool for accomplishing these objectives is strategic planning.
STRATEGIC PLAN THEMES
Our Strategic Plan has four primary themes that reflect our Mission and Vision Statements: Great Neighborhoods, a Safe City, a Healthy Economy, and an Effective Government. Specific goals, objectives, and actions move the organization toward our vision of the future.
Each theme is followed by the City’s primary goals in that subject area for the foreseeable future. The goals should remain constant over time and should only be revised to reflect significant community changes or unanticipated events. A list of measurable objectives with benchmarks helps us track progress toward the goals. Objectives are generally identified to cover the five-year planning period from the date they are adopted or revised. Actions are the steps needed to meet the objective. Many more strategies and actions will be developed at the department and division level to align the entire organization with the goals and objectives.
This plan is intended as a work in progress. While the mission, vision, values, and goals should remain constant, the objectives and actions will need periodic review and refinement. We will track progress through regular reporting on the measures, and they will be incorporated into department, organization, and community publications. The annual Budget and Capital Improvement Program will serve as reporting and implementing policy documents, identifying relationships with the Strategic Plan. The Comprehensive Plan, Transportation System Plan, Water Master Plan, Sewer Master Plan, Parks Master Plan, Hazard Mitigation Plan, Urban Forestry Management Plan, and related planning documents also support this Strategic Plan.
10

I. GREAT NEIGHBORHOODS
Goals: • Goal 1: Create and sustain a city of diverse neighborhoods where residents feel good about where they live.
• Goal 2: Provide an efficient transportation system with safe streets and alternative modes of transportation.
• Goal 3: Provide effective stewardship of Albany’s significant natural, cultural, and historic resources.
• Goal 4: Provide diverse recreational, educational, and cultural opportunities that enrich the lives of our
citizens.
Great Neighborhoods Objectives:
Goal 1: Create and sustain a city of diverse neighborhoods where residents feel good about where they live. Objective GN-1: Enforce City ordinances when properties are neglected or abandoned to prevent erosion of property values and quality of life. [City Manager’s Office and Albany Police Department] Actions: Reduce unresolved cases. Objective GN-1a: Maintain the value and attraction of Albany’s historic assets and seek federal funds and other sources. [Community Development] Actions: Apply for State Historic Preservation Office grants. Make rehabilitation loans and track completions. Objective GN-2: Create a Community Development/Land Use Issues list identifying code issues that are identified as not optimum. This list will be evaluated annually to identify priority issues that might be addressed with code revisions. [Community Development] Actions: Provide reviews and updates to the Albany Development Code (ADC).
OBJECTIVE MEASURE TARGET COMPLETED FY2015
COMPLETED FY2016
FY2017 FY2018 FY2019 FY2020 FY2021
GN-1 Maintain a close to open ratio of 75% or higher on submitted cases per fiscal year.
≥75% 55%
71% 75% 75% 75% 75% 75%
GN-1a Continue to seek grant funding from State Historic Preservation Office.
1 1 0 1 1 1
GN-2 Develop CD/Land Use Issues list. Complete annually
Annually Annually Annually Annually Annually Annually Annually
11

I. GREAT NEIGHBORHOODS (CONTINUED)
Goal 2: Provide an efficient transportation system with safe streets and alternative modes of transportation. Objective GN-3: Ensure public buildings, sidewalks, and public transportation are accessible to all. [Community Development, Public Works]
Actions: Develop a plan and prioritization system for making accessibility improvements when funding is identified and available (ADA Transition Plan). Objective GN-4: Utilize available street funding to maintain collector and arterial streets (85 total lane miles) in satisfactory or better condition
Curb installation for the Oak Street construction project.
and address local street needs as funding allows. Additionally, seek other sources of funding for the street system. [Public Works] Actions: Measure and monitor street condition in order to identify and prioritize street condition improvement projects. Implement repair and preventative street maintenance projects to preserve and restore City streets with the annual Street Maintenance budget. Plan for street rehabilitation and reconstruction capital projects with the annual five-year Capital Improvement Program and implement capital projects with the annual Street Capital budget. Objective GN-5: Work as a cooperative partner of the Albany Area Metropolitan Planning Organization (AAMPO) for the funding of street and transit improvements. [Public Works] Actions: Work within the AAMPO structure to plan for use of available Surface Transportation Program (STP) funding for the preservation and improvement of City streets. Work with the AAMPO to stabilize funding and maximize the effective use of transit funding for the City and the region. Objective GN-6: By the end of 2017, increase the number of transit system riders by ten percent over the FY2012-2013 ridership. [Public Works] Actions: Measure and monitor the number of rides provided. Identify opportunities to modify and maximize routes, increase operating revenue, and improve transit level of service. Identify and implement route improvements to serve more citizens, as funding allows.
OBJECTIVE MEASURE TARGET COMPLETED FY2015
COMPLETED FY2016
FY2017 FY2018 FY2019 FY2020 FY2021
GN-3 Accessibility Transition Plan completed. Complete by FY 2017
Dec 2017
GN-4 Percentage of collector and arterial streets in satisfactory or better condition:
≥80% 89% 94% 93% 92% 91% 90% 89%
GN-5 Complete Regional Transportation Plan (RTP).
Complete by FY 2017
Nov 2017
GN-6 Increase transit system ridership to: Albany Transit System Linn-Benton Loop Paratransit
≥96,000 ≥145,000 ≥21,000
86,200 124,800 18,400
79,369
111,595 18,346
87,000 121,000 21,000
87,500 121,500 22,300
88,000 122,000 22,500
88,500 122,500 23,000
89,000
123,000 23,500
12

I. GREAT NEIGHBORHOODS (CONTINUED)
Goal 3: Provide effective stewardship of Albany’s significant natural, cultural, and historic resources. Objective GN-7: Continue to partner and coordinate with community groups, such as the Calapooia Watershed Council, on watershed improvement programs and projects to meet statewide planning goals (Goal 5). [Community Development, Parks & Recreation, Public Works] Actions: Identify City-owned open spaces, riparian corridors, and natural resources and coordinate and help fund restoration and education/outreach projects.
OBJECTIVE MEASURE TARGET COMPLETED FY2015
COMPLETED FY2016
FY2017 FY2018 FY2019 FY2020 FY2021
GN-7 Coordinate and partner on restoration and education/outreach projects.
Complete annually
Annually Annually Annually Annually Annually Annually Annually
13

I. GREAT NEIGHBORHOODS (CONTINUED)
Goal 4: Provide diverse recreational, educational, and cultural opportunities that enrich the lives of our citizens.
Objective GN-8: Maintain total City-managed park land inventory at an annual average of 17.0 acres or greater per 1,000 residents. [Parks & Recreation] Actions: Acquire by purchase, lease, or other means enough park land to achieve and keep pace with Albany’s growth and to meet the City’s adopted total park acreage standards.
*Objective GN-9: Sustain total developed parks and recreation lands at 11.0 acres or greater per 1,000 residents. [Parks & Recreation] Actions: Maintain enough developed park land to keep pace with Albany’s growth and to meet the City’s adopted developed park acreage standards.
Objective GN-10: By the end of 2019, increase library visits by ten percent. [Library] Actions: Add five new programs across all service areas. Increase the percentage of operating dollars spent on collections to Oregon state median (ten percent).
*Includes gift of 94 acres to City in Oak Creek Greenbelt.
OBJECTIVE MEASURE TARGET COMPLETED FY2015
COMPLETED FY2016
FY2017 FY2018 FY2019 FY2020 FY2021
GN-8 Average total acres of park land per 1,000 residents.
≥17.0 17.3 17.3 17.1 17.1 16.8 16.6 16.6
GN-9 Average acres of developed parks and recreation land per 1,000 residents.
≥11.0 10.9 10.9 10.8 10.8 10.6 10.4 10.4
GN-10 Annual number of library visits. ≥371,000 346,695 331,000 340,000 345,000 345,000 348,000 350,000 GN-10 Number of discrete Library programs across
all service areas. ≥19 20 21 22 23 23 25 25
GN-10 Percentage of Library operating expenditures spent on collections.
10% 6.9% 7.4% 8% 9% 10% 10% 12%
Reading Girl at Main Library.
14

II. A SAFE CITY
Goals:
• Goal 1: Ensure a safe community by protecting people and property.
• Goal 2: Provide safe, sufficient, and reliable drinking water, sewage disposal, and drainage systems.
Safe City Objectives:
Goal 1: Ensure a safe community by protecting people and property.
Objective SC-1: Complete construction of Albany Police Department building and Fire Station 11. [Fire, Police] Actions: Complete building projects by September 2017.
Objective SC-2: Participate in the FEMA National Flood Insurance Program and maintain the City’s Community Rating System (CRS) rating. [Community Development] Actions: Form and maintain a cross-department team to continuously improve the City’s floodplain management. Participate in FEMA’s CRS Program.
Objective SC-3: Use Community Development Block Grant (CDBG) funds to provide funding to community programs that assist the vulnerable children and families in our City. [Community Development]
II. A SAFE C IT
OBJECTIVE MEASURE TARGET COMPLETED FY2015
COMPLETED FY2016
FY2017 FY2018 FY2019 FY2020 FY2021
SC-1 Move into new Fire Station 11. Complete by June
2017
Sept 2017
SC-1 Move into new Police Department building. Complete by June
2017
Sept 2017
SC-2 Maintain CRS rating. ≤ 6 6 6 6 6 6 6 6 SC-3 Distribute CDBG funding to assist Albany’s
vulnerable populations and neighborhoods. $300,000/
year $128,000 $202,000 $300,000 $300,000 $300,000 $300,000 $300,000
15

II. A SAFE CITY (CONTINUED)
Objective SC-4: Maintain police patrol response times to Priority One calls for service from dispatch to arrival time to four minutes fifteen seconds, or less, annually. [Police] Actions: Achieve this objective through maintaining no less than current staffing levels and incremental staffing increases related to population/demand for service increases.
Objective SC-5: Maintain the combined number of fatal and injury collisions at 2.5 per thousand residents or less annually. [Police] Actions: Achieve this objective through continued traffic enforcement with an emphasis at high-collision areas.
Objective SC-6: Achieve at least a 60 percent clearance rate for violent crimes and a 20 percent clearance rate for property crimes annually. [Police] Actions: Achieve this objective through maintaining current staffing levels in patrol and detectives with an emphasis on solving crimes.
Objective SC-7: Reduce Part One crimes by five percent annually with the ultimate goal of reducing the crime rate to the Oregon average per thousand. [Police] Actions: Continued emphasis on crime reduction through the Computer Statistics (COMPSTAT) process.
Objective SC-8: Facilitate continued development of property surrounding Fire Station 12 as an emergency responder training center. [Fire, Police, Public Works, Other Jurisdictions] Actions: Relocate City bus storage to expand current training facilities and build a training tower. Objective SC-9: Collaborate with neighboring fire departments and communities to improve emergency response reliability and provide a consistent level of emergency and life safety services. [Fire] Actions: Collaboratively staff and maintain a single-role
medic unit with other emergency response agencies; expand community risk reduction services by increasing community paramedic program capabilities; explore opportunities to provide equivalent emergency services irrespective of geographic boundary.
Objective SC-10: Fund Fire Department equipment replacement and facilities maintenance to adequately address emergency equipment and vehicle needs and long-term upkeep of department facilities. [Fire] Actions: Commit ambulance revenue received over budgeted amount to equipment replacement; pursue grants and other funding alternatives; consider a bond to fund department equipment replacement needs; consider other potential funding sources to provide both short- and long-term solutions to replace vehicles and equipment and provide for facilities maintenance; and consider sale proceeds of the Armory to fund police and fire equipment replacement. 16

II. A SAFE CITY (CONTINUED)
Objective SC-11: Reduce property code violations, substandard housing conditions, and inadequate infrastructure. [City Manager’s Office, CARA, Community Development, Police] Actions: Community Development, Police, and the City Manager’s Office will work together to set priorities for addressing property code violations and responding to citizen complaints. A partnership with CARA will focus significant code compliance and safety efforts within the CARA boundaries. Objective SC-12: CARA will continue to fund projects that eliminate blight and increase public safety. [Central Albany Revitalization Area, Police, Community Development] Actions: Use CARA funding on projects that eliminate blight, increase public safety, and reduce police calls.
Objective SC-13: Maintain and continue to minimize the impact of fires on our community. [Fire] Actions: Continue to incorporate Fire Department requirements in the development review and approval process. Conduct Fire Code compliance inspections on existing buildings. Provide fire/life safety education. Maintain residential fire/life safety equipment programs. Promote fire sprinkler systems in CARA-funded projects and other projects of new construction and remodeling.
OBJECTIVE MEASURE TARGET COMPLETED FY2015
COMPLETED FY2016
FY2017 FY2018 FY2019 FY2020 FY2021
SC-4 Patrol Unit: Maintain response time to priority one calls annually.
≤4:15 annually
3:12 annually
4:15 annually
4:15 annually
4:15 annually
4:15 annually
4:15 annually
4:15 annually
SC-5 Maintain the combined number of fatal and injury collisions at 2.5 per thousand residents or less annually.
≤2.5 per thousand annually
≤2.5 per thousand annually
≤2.5 per thousand annually
≤2.5 per thousand annually
≤2.5 per thousand annually
≤2.5 per thousand annually
SC-6 Achieve clearance rate for violent crimes annually.
60% annually
69% annually
60% annually
60% annually
60% annually
60% annually
60% annually
60% annually
SC-6 Achieve clearance rate for property crimes annually.
20% 28.3% annually
20% annually
20% annually
20% annually
20% annually
20% annually
20% annually
SC-7 Achieve reduction in Part I crimes annually. ≥5% annually
2.6% increase
5% annually
5% annually
5% annually
5% annually
5% annually
5% annually
SC-8 Relocate City bus storage. Complete by FY 2019
June 2019
SC-8 Provide improvements to training site by building training tower and training props.
Complete by FY 2018
June 2018
SC-9 Collaborate by staffing a single-role medic unit.
≥72 hours/ week
Hired and trained
personnel
72 hours/ week
91 hours/ week
112 hours/ week
112 hours/ week
168 hours/ week
SC-9 Increase Community Paramedic availability.
7-day coverage
5-day coverage
6-day coverage
7-day coverage
7-day coverage
7-day coverage
7-day coverage
SC-10 Provide funding to replace emergency vehicles and equipment and maintain facilities.
$2.6 million $583K $541K $714K $645K $550K $150K
17

II. A SAFE CITY (CONTINUED)
Objective SC-14: Fund to adequately staff for increasing emergency responses, response times, and community growth. [Fire] Actions: Continue to evaluate all funding options for public safety; hire additional personnel to address increases in responses and times; implement response time tracking system. Objective SC-15: Formalize work group with a focus on identifying current issues with transitional housing. [Police, Community Development, City Attorney, Fire] Actions: Identify staff who could help characterize and address transitional housing-related issues.
Goal 2: Provide safe, sufficient, and reliable drinking water, sewage disposal, and drainage systems. Objective SC-16: Optimize the use and management of the Vine Street and Albany-Millersburg Water Treatment Plants to meet regulatory and demand needs for the City’s drinking water supply. [Public Works] Actions: Develop a written water production management plan that will maximize the efficient use of the two water treatment plants to meet supply and regulatory requirements. Objective SC-17: Maintain existing compliance with all water quality, pretreatment, and biosolids regulatory requirements. [Public Works] Actions: Prepare for the requirements of a pending new wastewater discharge permit, which will likely include more restrictive water quality-based limitations. Remain engaged in agency groups such as ACWA and PNCWA in order to remain informed and offer input into regulatory direction. Prepare for the requirements of a stormwater discharge permit.
OBJECTIVE MEASURE TARGET COMPLETED FY2015
COMPLETED FY2016
FY2017 FY2018 FY2019 FY2020 FY2021
SC-11 Amount of CARA funding targeting code compliance/public safety.
$50,000 $0 $50,000 $50,000 $50,000 $50,000 $50,000 $50,000
SC-12 Number of blighted structures remediated within the CARA boundary.
≥3 0 3 3 3 3 3 3
SC-13 Structure fires per 1,000 residents. ≤0.9 0.86 0.81 0.80 0.80 0.75 0.75 0.75
SC-13 Percentage of population receiving fire & life safety public education presentations.
≥15% 13.2% 9% 15% 15% 15% 15% 15%
SC-13 Number of fire compliance inspections. ≥1,500 912 637 1,200 1,250 1,300 1,350 1,400 SC-13 Percentage of fire code violations
corrected. ≥75% 82.4% 72.5% 80% 85% 85% 90% 90%
SC-14 Hire additional personnel to address emergency call volume, increasing response times, and community needs.
As needed 0 3 (1 DFM & 2 EMTs)
3 (3 FF/ EMTs)
3 (1 Admin
& 2 EMTs)
4 (3 FF/EMTs & 1 EMT)
1 (1 Admin)
3 (3 FF/ EMTs)
SC-15 Develop and prioritize issues list and assign owners.
Complete by Feb 2017
Feb 2017
SC-15 Provide recommendations that address high-priority items.
Ongoing until
addressed
Ongoing Ongoing Ongoing Ongoing Ongoing Ongoing
Replacement of water filtration membrane modules at the Albany-Millersburg Water Treatment Plant.
18

II. A SAFE CITY (CONTINUED) Objective SC-18: Effectively manage biosolids wastes at the Albany-Millersburg Water Reclamation Facility. [Public Works] Actions: Maximize efficiencies and cost effective management and disposal of solids at the Albany-Millersburg Water Reclamation Facility. Identify a preferred alternative for a solids improvement project along with funding options.
OBJECTIVE MEASURE TARGET COMPLETED FY2015
COMPLETED FY2016
FY2017 FY2018 FY2019 FY2020 FY2021
SC-16 Develop written water production management plan.
Complete by FY 2019
June 2019
SC-17 Obtain a new discharge permit for the WRF. (DEQ DEPENDENT)
Complete by FY 2019
June 2019
SC-17 Obtain a stormwater discharge permit. (DEQ DEPENDENT)
Complete by FY 2017
June 2017
SC-18 Develop alternatives and funding options for new solid process at WRF.
Complete by FY 2017
June 2017
19

III. A HEALTHY ECONOMY
Goals:
• Goal 1: Business — Enhance the value and diversity of Albany’s economy by attracting, retaining, diversifying, and expanding local businesses.
• Goal 2: Partnerships — Strengthen the area’s role as a leading regional economic center through local and
regional coordination and collaboration on economic development planning and projects.
• Goal 3: Prosperity — Maintain and grow the income levels with a focus on living-wage jobs, training, and education opportunities of Albany residents consistent with Oregon and national trends. Work to increase the community’s assessed value while working to achieve a healthy balance of housing and jobs.
• Goal 4: Central Albany — Create a readily identifiable downtown core that is unique and vibrant with a
mixture of entertainment, housing, specialty shops, offices, and other commercial uses.
Healthy Economy Objectives: Goal 1: Business: Enhance the value and diversity of Albany’s economy by attracting, retaining, diversifying, and expanding local businesses.
Objective HE-1 - Support Local Business: Provide a supportive environment for the development and expansion of desired businesses, especially those that are locally owned or provide living-wage jobs. [Economic Development/Urban Renewal] Actions: Conduct regular visits to local businesses and industries as a business ambassador. Address the needs and opportunities for growth and work to eliminate barriers for future development. Connect growing businesses with available resources including the Chamber of Commerce, AMEDC, SBA, COG, and the Small Business Development Center (SBDC) at LBCC. Objective HE-2 - Land: Provide the supply of commercial and industrial land identified in the Economic Opportunities Analysis. Facilitate development consistent with community goals. [Economic Development/Urban Renewal, Community Development, Public Works] Actions: Complete research and documentation of available land, work to remove barriers for developable land.
OBJECTIVE MEASURE TARGET COMPLETED FY2015
COMPLETED FY2016
FY2017 FY2018 FY2019 FY2020 FY2021
HE-1 Conduct regular visits to local businesses and industries.
≥12 21 12
12 12 12 12 12
HE-1 Projects assisted: financial assistance or removal of development barriers.
≥5 19 15 8 8 8 8 8
HE-2 Complete research and documentation of significant available sites.
≥4 41 43 5 5 5 5 5
20

III. A HEALTHY ECONOMY (CONTINUED)
Goal 2: Partnerships: Strengthen the area’s role as a leading regional economic center through local and regional coordination and collaboration on economic development planning and projects. Objective HE-3 - Partnerships: Collaborate with organizations focused on business retention, expansion, startup development, and entrepreneurship to establish new firms and strengthen existing businesses locally. [Economic Development, All Departments] Actions: Maintain key department contacts for immediate response to information requests. Strong intra-city collaboration among departments to further economic development priorities, eliminate barriers, and provide accurate and timely assistance within the requested time frames. Continue to foster relationships and cultivate partnerships with the Chamber of Commerce, AMEDC, SBA, COG, and SBDC. Continue work of LBCC/Industry/City partnership on $2.9 million investment in equipment for workforce development and training.
Goal 3: Prosperity: Maintain and grow the income levels with a focus on living-wage jobs, training, and education opportunities of Albany residents consistent with Oregon and national trends. Work to increase the community’s assessed value while working to achieve a healthy balance of housing and jobs. Objective HE-4 - Living-wage Jobs: Focus on the creation and retention of living-wage jobs through policy, staff support, and funding of projects that support a healthy local economy and community. Continue to refine CARA and CDBG programs to support job-creation projects. Support the area’s educational resources as vital to the social and economic well-being of the community. Encourage opportunities for increasing skill levels of local workers and microenterprise development. [Economic Development/Urban Renewal, Community Development] Actions: Complete draft, review, and implementation of CARA economic development programs. Track results and job creation of the program. Work to improve the community’s assessed value. Facilitate connections between residents/businesses and workforce training or education. Track unemployment rate and per capita income for the city of Albany.
OBJECTIVE MEASURE TARGET COMPLETED FY2015
COMPLETED FY2016
FY2017 FY2018 FY2019 FY2020 FY2021
HE-3 Respond to information inquiries within the requested timelines.
100% 100% 100% 100% 100% 100% 100% 100%
A public-private partnership between CARA and Viper Northwest helped
them expand yielding 43 family-wage jobs and a significant increase in
assessed value.
21

III. A HEALTHY ECONOMY (CONTINUED)
Goal 4: Central Albany: Create a readily identifiable downtown core that is unique and vibrant with a mixture of entertainment, housing, specialty shops, offices, and other commercial uses. Objective HE-5: Leverage urban renewal dollars to maximize the total investment and development effort in Central Albany. Create an increase in assessed value with the majority of public-private partnerships or spur private investment through strategic public investment. [Central Albany Revitalization Area] Actions: Continue to focus CARA funding on public infrastructure projects that will drive or complement private investment and private projects that create a return on investment through an increase in assessed value. Objective HE-6: Recognize and support Albany’s unique historic character as a major cultural and tourist-oriented economic resource. Increase residential opportunities in the Central Albany area. [Central Albany Revitalization Area] Actions: Continue funding of rehabilitation and restoration of historic buildings, creation of new residential units, and various projects in the Main Street area and throughout the Central Albany Revitalization Area (CARA).
OBJECTIVE MEASURE TARGET COMPLETED FY2015
COMPLETED FY2016
FY2017 FY2018 FY2019 FY2020 FY2021
HE-4 CARA/City-funded economic development projects.
≥3 0 4 4 4 4 4 4
HE-4 Jobs (FTE) created through CARA/City-funded economic development projects.
≥5 0 10 13 17 17 17 17
HE-4 Jobs (FTE) created through CDBG-funded programs.
≥5 8 9 5 5 5 5 5
HE-4 Technical assistance provided to microenterprises.
≥10 24 25 10 10 10 10 10
OBJECTIVE MEASURE TARGET COMPLETED FY2015
COMPLETED FY2016
FY2017 FY2018 FY2019 FY2020 FY2021
HE-5 Total annual value of CARA investments in public-private partnerships.
≥$500K $379,500 $500K $500K $500K $500K $500K $500K
HE-5 Total annual value of private investment in CARA projects.
≥$2.5M $636,500 $2.5M $1.77M $2.5M $2.5M $2.5M $2.5M
HE-5 Total cumulative value of CARA investments. ≥$13.8M $11.8M $14.8M $23.3M $23.8M $24.2M $24.7M $25.2M HE-5 Ratio of overall CARA contributions versus
private money. $1:$7 $1:$8.38 $1:$7 $1:$7 $1:$7 $1:$7 $1:$7 $1:$7
HE-6 Cumulative number of CARA-funded new residential units.
≥303 287 292 298 312 326 340 354
Woodwind Apartments workforce housing project on
Second Avenue SE.
22

IV. AN EFFECTIVE GOVERNMENT
Goals: • Goal 1: Effectively and efficiently deliver the services that Albany’s citizens need, want, and are willing to
support.
Effective Government Objectives: Goal 1: Effectively and efficiently deliver the services that Albany’s citizens need, want, and are willing to support.
Objective EG-1: Reduce the percentage of total annual Parks & Recreation Fund expenditures subsidized with property tax revenues to 55 percent or lower by 2020. [Parks & Recreation] Actions: Achieve this objective through a combination of nontax revenue increases and expenditure reductions.
Objective EG-2: Sustain revenues received from gifts, grants, and endowments to equal or greater than $10 per capita. [Parks & Recreation] Actions: Complete and implement a Revenue Enhancement Plan by 2018, including strategies and private sector solicitations. Improve marketing and promotion efforts to communicate parks and recreation program needs to a wider audience.
Objective EG-3: Maintain Parks & Recreation Department staffing levels at or below 0.60 FTE per 1,000 residents. [Parks & Recreation] Actions: Annually adjust staffing plans and service delivery strategies to achieve the objective.
Objective EG-4: Provide responsive, efficient, customer-oriented service and meet mandated deadlines for project reviews. [Community Development] Actions: Meet or exceed state requirements for timely issuance of reviews, permits, and inspections. Complete building inspections as requested. Objective EG-5: Reduce water loss to 10 percent or less by 2019. [Public Works] Actions: Continue leak detection efforts to identify system leaks. Replace and upgrade older water meters to reduce under-reading water usage. Investigate and eliminate unmetered water use and enforce against water theft. Evaluate water system replacement needs to best target limited capital funds to provide best return.
OBJECTIVE MEASURE TARGET COMPLETED FY2015
COMPLETED FY2016
FY2017 FY2018 FY2019 FY2020 FY2021
EG-1 Property tax as a percent of Parks Fund revenue. ≤55% 51.2% 53.6% 55% 54% 54% 52% 52% EG-2 Parks per-capita revenue through grants, gifts,
and endowments. ≥$10.26 $7.86 $6.35 $9.50 $9.50 $10.00 $10.00 $10.00
EG-3 Parks & Recreation full-time equivalents per 1,000 residents.
≤0.60 0.50 0.52 0.53 0.54 0.53 0.52 0.52
23

IV. AN EFFECTIVE GOVERNMENT (CONTINUED)
Water line construction on Hill Street.
Objective EG-6: Provide the City Council with annual reports regarding the running five-year sewer, water, and stormwater revenue, expenditure, and rate funding requirements. [Public Works] Actions: Annual updates to the current five-year rate projection at the time the City Council considers utility rate adjustments. Objective EG-7: Maintain accreditation with the American Public Works Association (APWA). [Public Works] Actions: Maintain standards and policies to allow the department to obtain reaccreditation from APWA on a four-year cycle. Objective EG-8: Develop a full stormwater management program and identify stable funding strategy for stormwater utility functions. [Public Works] Actions: Complete the Stormwater Master Plan. Implement code changes to bring the City in line with regulatory requirements. Identify the annual operations and maintenance and capital costs required to maintain the City’s stormwater system in order to meet service level expectations and regulatory requirements. Develop SDC funding mechanism and funding levels. Objective EG-9: Complete update of the Sewer SDC methodology. [Public Works] Actions: Develop updated facility plan in phases. Upon completion of the collection system and treatment system updates, complete a new SDC methodology and have the City Council adopt it. Objective EG-10: Continue participation in national performance benchmarking for comparison with other jurisdictions. Implement process improvement projects to reduce processing time and costs or increase revenues. [City Manager’s Office] Actions: Prepare annual report to detail participation and compliance to appropriate national benchmarks. Institute tracking systems to gather management data where lacking. Perform process improvement studies. Objective EG-11: By the end of FY2020, reduce the cost/item circulated by 15 percent. [Library] Actions: Explore outsourcing processing. Objective EG-12: Seek $200,000 of outside funding for new library program support by 2020. [Library] Actions: Create an annual fund-raising campaign by working with library support groups and the Albany Library Scharpf Endowment Fund.
24

IV. AN EFFECTIVE GOVERNMENT (CONTINUED) Objective EG-13: Continue recognition from the Government Finance Officers Association (GFOA) for excellence in budgeting and financial reporting. Maintain annual audit results establishing conformance to requirements and generally accepted accounting principles. [Finance] Actions: Receive the GFOA award for “Excellence in Financial Reporting.” Receive the GFOA “Distinguished Budget Presentation” award. Achieve annual audit with no reportable findings of noncompliance. Objective EG-14: Ensure compliance with all federal and state regulations relating to municipal services. [All Departments] Actions: Monitor federal and state regulations on a routine basis. Target resources to maintain compliance. Objective EG-15: Maintain or improve City’s investment ratings. [Finance] Actions: Maintain sufficient reserves. Follow best practices for financial management. Objective EG-16: Maintain appropriate levels of Information Technology (IT) systems availability and services rating. [Information Technology] Actions: Ensure sufficient IT resources are available to maintain City functions. Objective EG-17: Establish personnel succession planning for executive and other key leadership positions throughout the organization. [All Departments] Actions: Ensure the City maintains adequate succession planning for executives and other key leadership positions. Objective EG-18: Conduct feasibility analysis on “portable” systems development charges. [Public Works] Actions: Retain consultant to evaluate feasibility of “portable” system development charges and identify steps necessary for implementation. Identify risks/rewards, data system support needs, and any additional staffing requirements to support such a program. Objective EG-19: Consider opportunities to secure additional funding for transportation system improvements with emphasis placed on maintaining and repairing the City’s 306 lane miles of local streets of which approximately 34 percent are not in satisfactory condition. [Public Works] Actions: Participate in regional discussions regarding a potential gas tax. Objective EG-20: Cooperate and partner with neighboring jurisdictions as appropriate to provide assistance, accomplish common goals/objectives, and maximize efficiencies. [All Departments] Actions: Maintain regular communication with community partners. Discuss areas of shared interest and consider ways to accomplish common goals through partnerships.
25

IV. AN EFFECTIVE GOVERNMENT (CONTINUED)
OBJECTIVE MEASURE TARGET COMPLETED FY2015
COMPLETED FY2016
FY2017 FY2018 FY2019 FY2020 FY2021
EG-4 Residential plan reviews completed within 10 days.
100% 100% 100% 100% 100% 100% 100% 100%
EG-4 Land use decisions issued within 120 days.
100% 100% 100% 100% 100% 100% 100% 100%
EG-4 Complete inspections within same day of request (when called in by 7:00 a.m.)
≥95% 95% 95% 95% 95% 95% 95% 95%
EG-5 Reduce water loss to 10% or less by 2019. ≤10% 13.6% 9.7% <10% <10% <10% <10% <10%
EG-6 Annual rate reports to Council. 2 2 2 2 3 3 3 3 EG-7 APWA accreditation. Accreditati
on mid-term report by FY2017
Reaccre -ditation
mid-term report
Reaccre -ditation
mid-term report
EG-8 Complete Stormwater Master Plan. Complete Master Plan by FY2018
June 2018
EG-8 Implement Stormwater funding plan. Complete by FY2017
In progress In progress Complete Dec 2017
EG-9 Complete Sewer SDC methodology update.
Complete Plan by FY2017
In progress In progress Complete Dec 2017
EG-10 Annual report of performance benchmarking progress.
Nov 2017 Nov 2014 Nov 2017 Nov 2018 Nov 2019 Nov 2020 Nov 2021
EG-11 Cost per library item circulated. ≤$3.73 $4.09
$4.00 $3.80 $3.60 $3.40 $3.20 $3.15
EG-12 Non-General Fund program support for the Library.
$40,000 $61,365 $40,000 $40,000 $40,000 $40,000 $40,000 $50,000
EG-13 Receive “Excellence in Financial Reporting” award.
Yes Yes Yes Yes Yes Yes Yes Yes
EG-13 Receive “Distinguished Budget Presentation” award.
Yes Yes Yes Yes Yes Yes Yes Yes
EG-13 Reportable audit findings of noncompliance.
None None None None None None None None
EG-14 Compliance with federal and state regulations.
Yes Yes Yes Yes Yes Yes Yes Yes
EG-15 Maintain investment ratings. Yes Yes Yes Yes Yes Yes Yes Yes EG-16 Maintain an overall quality of service
rating at 4 or 5, with 5 being excellent. 90% 88% 91.4% 90% 90% 90% 90% 90%
EG-16 Maintain an overall timeliness of service rating at 4 or 5, with 5 being excellent.
90% 92% 93.6% 90% 90% 90% 90% 90%
EG-17 Recruit and hire new City Manager. July 2017 July 2017 EG-17 Recruit and hire new Human Resources
Director and Finance Director. Oct 2017 Oct 2017
EG-17 Identify and develop personnel with the potential to fill executive and other key leadership roles.
Ongoing Ongoing Ongoing Ongoing Ongoing Ongoing Ongoing
EG-18 Complete feasibility analysis on “portable” systems development charges.
Complete by FY 2017
June 2018
EG-19 Consider opportunities to secure additional funding for transportation system improvements.
Ongoing until
addressed
Ongoing Ongoing Ongoing Ongoing Ongoing Ongoing
EG-20 Regular meetings. Annually Annually Annually Annually Annually Annually Annually
26

STRATEGIC PLAN ACCOMPLISHMENTS Under Strategic Plan FY2016 THROUGH FY2020
City Manager’s Office
• Received ICMA Award of Excellence for Performance Management.
CARA and Economic Development
CARA
• Retooled CARA programs with a new focus on increasing assessed value, eliminating blight, and resorting Albany’s historic resources and a heavy emphasis on job creation.
• Began work on next round of public infrastructure investment, including a public open house to understand
priorities.
Economic Development
• Economic Development Director worked with 18 existing businesses to help remove barriers to job creation.
• Responded to information inquiries within requested time frames 100 percent of the time.
Community Development
• Successfully completed an update to the floodplain development code, including reference to the new Flood Insurance Rate Maps for North Albany as required by the National Flood Insurance Program.
• Managed Community Development Block Grant (CDBG) programs that serve Albany low- and moderate-
income or at-risk residents in accordance with federal requirements. Services included infant abuse prevention services, court-appointed special advocates for children removed from their homes, shelter and case management for at-risk youth and for women and children, emergency housing assistance, housing rehabilitation, and small business development. Additionally, the City, with CDBG funds, finalized engineering for Sunrise Park storm drainage in preparation for a park remodel.
• Over the last four months, the Community Development Department has processed to a final decision approximately 30 land use applications and has held 40 land use pre-application meetings with potential applicants.
27

STRATEGIC PLAN ACCOMPLISHMENTS Under Strategic Plan FY2016 THROUGH FY2020
Finance
• Received the Excellence in Financial Reporting Award.
• Received the Distinguished Budget Presentation Award.
Fire
• Objective SC-1: Completed purchase on a portion of property needed for a new downtown fire station. Took numerous steps toward replacing existing Fire Station 11; project reviewed by the Public Safety Facilities Review Committee; selected a design team that has completed the initial building design; voters approved General Obligation Bond for safety facilities.
• Objective SC-9: Continued conversations regarding relocating the City bus storage. This will continue
moving forward. • Objective SC-9: Continued discussion regarding opportunities for regional training. • Objective SC-12: Completed identification of funds needed to sustain equipment replacement for the next
six years.
Information Technology
• Received Digital Cities Survey 2015 Award.
• Received the Government Technology’s Top 25 Doers, Dreamers, Drivers Award.
Library
• The Library partnered with United Way and other partners to provide books to over 1,000 Albany youth under age 5.
• The Library partnered with five other Linn County libraries to provide a courier system that delivered materials amongst those libraries.
• The Library received over $60,000 in grants and donations.
• The Library partnered with Greater Albany Public Schools (GAPS) to facilitate student IDs to function as Albany Public Library cards.
28

STRATEGIC PLAN ACCOMPLISHMENTS Under Strategic Plan FY2016 THROUGH FY2020
Parks & Recreation
• Secured use of gyms for P&R programs at Timber Ridge School and at the Boys & Girls Club of Albany.
• Secured addition by donation of 94 acres to Oak Creek Greenbelt.
• While reducing the number of FTEs in the department by 17 percent since 2009:
» increased donations of cash for department activities from $7 to nearly $10 per capita. » reduced maintenance costs per developed park acre from $3,000 to $2,700. » maintained the property tax subsidy for all P&R activities at 60 percent or lower. » maintained consistent levels of total park acres and developed acres per 1,000 residents,
despite population growth. » shifted 0.6 FTE from local property tax support to grant-funded program. » renovated and/or replaced playground equipment at seven parks.
Police
• Worked with the Linn County Sheriff’s Office on a Request for Proposal (RFP) for a new shared Computer-
Aided Dispatch/Records Management System. The current shared system is 25+ years old. The new Computer-Aided Dispatch/Records Management System is scheduled to go live in April 2017.
• A public facilities bond was approved by voters in May 2015 for the construction of a police station and
main fire station. A contractor was selected through a bid process and construction on the new police station began in August 2016. The new police station is slated to be completed in September 2017.
29

STRATEGIC PLAN ACCOMPLISHMENTS Under Strategic Plan FY2016 THROUGH FY2020
Public Works
• Continued to implement an Energy Management System at the Water Reclamation Facility resulting in a predicted annual savings in energy consumption of almost one million kwh.
• Received the First Place Paving Award for an Urban Street from the Asphalt Pavement Association of Oregon for North Albany Road.
• Conducted a significant amount of public education and outreach efforts to further the creation of a stormwater utility.
• Negotiated new water sales and maintenance agreements with the City of Millersburg.
• Claim of Beneficial Use testing completed to perfect City water rights.
• Completed purchase and installation of 960 new membrane modules at the Albany-Millersburg Water Treatment Plant.
• Upgraded the Umatilla Lift Station by adding a force main and capacity to reduce unpermitted sewer overflows.
• Implemented emergency preparedness improvements, such as additional Uninterrupted Power Supplies, improved communications equipment, and installation of a repeater for the department UHF radio network.
30


EXECUTIVE SUMMARY ________________________________________________________________________
PROPERTY TAXES The total property taxes to be levied for operations and debt service are estimated to be $28,840,327. Assumptions: (1) The assessed valuation of the City is
estimated to be $3,850,553,389, an increase of 3.61 percent.
(2) The City’s permanent tax rate is $6.3984
per $1,000 of assessed value. (3) The Budget Committee will recommend
and the City Council will adopt the full taxing authority.
(4) The levy for the General Obligation Debt
will be $1.038,300, a tax rate of $0.27 per $1,000 of assessed value.
(5) The Public Safety Local Option Levy is
estimated to be $4,583,057, an effective tax rate of $1.15 per $1,000 of assessed value
(6) The Public Safety Local Option levy will
have an estimated $934,973 reduction in tax revenues due to compression.
(7) The Fiscal Year 2017-2018 tax collection
rate is estimated to be 93.47 percent. CAPITAL EQUIPMENT The City prepares a separate five-year Capital Improvement Program (CIP). On June 14, 2017, the City Council adopted the 2018-2022 CIP as a planning document, following a public hearing. For Fiscal Year 2017-2018 the CIP identified capital projects totaling $16,175,000. A complete list of Capital Projects is included in the Capital Budget section of this budget document.
DEBT MANAGEMENT The City has a General Obligation Bond rating of “Aa3” from Moody’s Investors Service, and a rating of “AA-” from Standard and Poor’s. The ratings reflect the City’s growing tax base, stable financial position, and moderate debt burden. Full true cash value of property assessed in the City, per capita, is a respectable $80,788. The City’s direct debt burden is 0.41 percent of the true cash value, and the overall debt burden is 1.66 percent of the true cash value.
Debt Principal Outstanding as of July 1, 2017
General Obligation Bonds: 2015 Public Safety Facility $17,235,000 Other Bonds: Water Revenue $24,595,000 Revenue Obligations 500,000 Limited Tax Pension 4,992,001 Total Other Bonds $30,087,001 Other Debt: Clean Water SRF Loan 1,464,596 2012 SRF ARRA Loan 1,450,000 SRF Loans, Sewer 48,717,571 Total Other Debt $51,632,167 GO bonds were approved by voters on May 19, 2015. The series 2015 bonds were sold in August 2015. SRF = State Revolving Funds Oregon Revised Statutes, Chapter 287, provides a debt limit for General Obligation Bonds of three percent of the true cash value (TCV) of all taxable property within the City’s boundaries. As of June 30, 2017, that limit was $127.0 million on $4.235 billion TCV. The City’s legal debt margin for General Obligation Debt is $109.8 million. It is anticipated that the margin will remain the same for Fiscal Year 2017-2018.
31

EXECUTIVE SUMMARY ________________________________________________________________________
BASIS OF BUDGETING The budgets of all fund types (General, Special Revenue, Debt Service, Capital Projects, Permanent, Enterprise, and Internal Service) are prepared on a modified accrual basis. Briefly, this means that obligations of the City are budgeted as expenditures but revenues are recognized only when they are measurable and available. The Comprehensive Annual Financial Report (CAFR) shows the status of the City’s finances on the basis of “generally accepted accounting principles” (GAAP). In most cases this conforms to the way the City prepares its budget. Exceptions are as follows: 1) Compensated absences liabilities that are
expected to be liquidated with expendable available financial resources are accrued as earned by employees (GAAP), as opposed to being expended when paid (Budget).
2) Principal payments on long-term debt within the Enterprise Funds are applied to outstanding liability on a GAAP basis, as opposed to being expended on a Budget basis.
3) Capital outlay within the Enterprise and Internal Service Funds is recorded as assets on a GAAP basis and expended on a Budget basis.
4) Depreciation expense is recorded in the Enterprise and Internal Service Funds on a GAAP basis only.
5) Revenues are accrued on a GAAP basis in the Enterprise and Internal Service Funds as opposed to the modified accrual method for the Budget.
6) Principal receipts on City-financed assessments are applied to outstanding assets on a GAAP basis as opposed to being recorded as revenue on a Budget basis.
32

EXECUTIVE SUMMARY_______________________________________________________________________________________________________________
FUND TYPE SUMMARY AS PROPOSED BY THE CITY MANAGERfor the 2017-18 Fiscal Year
Over(under)
……2016-17…… ……...…2017-18………... 2016-17 PercentAdopted Revised Proposed Approved Adopted Revised of Total
Fund Type Budget Budget Budget Budget Budget Budget Budget_______________________________________________________________________________________________________________General Fund 36,627,700$ 36,747,900$ 38,909,100 -$ -$ 5.88% 20.58% Special Revenue 56,107,400 56,107,400 49,215,700 - - -12.28% 26.02% Debt Service 2,025,100 2,025,100 2,225,300 - - 9.89% 1.18% Capital Project 25,644,400 25,644,400 14,772,000 - - -42.40% 7.81% Permanent 136,000 136,000 136,700 - - 0.51% 0.07% Enterprise 67,015,100 67,015,100 68,564,800 - - 2.31% 36.25% Internal Service 14,945,900 14,945,900 15,321,300 - - 2.51% 8.10% _______________________________________________________________________________________________________________Totals, All Fund Types 202,501,600$ 202,621,800$ 189,144,900$ -$ -$ -6.65% 100.00% ______________________________________________________________________________________________________________________________________________________________________________________________________________________________
Percentage Change in the 2017-18 Proposed Budget from the 2016-17 Revised Budget
General Fund
Special Revenue -12.28%
5.88%
Special Revenue
Debt Service
Capital Project
Permanent
Enterprise
Internal Service 2.51%
2.31%
0.51%
-42.40%
9.89%
-100% -50% 0% 50% 100%
33

EXECUTIVE SUMMARY__________________________________________________________________________________________________________________________
APPROVED BUDGETfor the 2017-18 Fiscal Year
ADJUSTMENTS AS APPROVED BY THE BUDGET COMMITTEE
RESOURCES:
REQUIREMENTS:
____________________________________________________________________________________________________________________________________________________________________________________________________________________________________________________
COMPARISON OF 2016-17 REVISED BUDGET TO 2017-18 APPROVED BUDGETAND PERCENT OF TOTAL BUDGET BY FUND
Over(under)
The City Manager and the Budget Officer have the responsibility for preparing and presenting a proposed document to the City's Budget Committee that isbalanced and consistent with the Council's policies. The Budget Committee met, reviewed the proposed budget along with more current information, andconsidered public input.
No adjustments from the Proposed Budget were made by the Committee.
No adjustments from the Proposed Budget were made by the Committee.
……2016-17…… ……...…2017-18………... 2016-17 PercentAdopted Revised Proposed Approved Adopted Revised of Total
Fund Type Budget Budget Budget Budget Budget Budget Budget__________________________________________________________________________________________________________________________
General Fund 36,627,700$ 36,747,900$ 38,909,100$ 38,909,100$ -$ 5.88% 20.57%
Special Revenue 56,107,400 56,107,400 49,215,700 49,215,700 - -12.28% 26.02%
Debt Service 2,025,100 2,025,100 2,225,300 2,225,300 - 9.89% 1.18%
Capital Project 25,644,400 25,644,400 14,772,000 14,772,000 - -42.40% 7.81%
Permanent 136,000 136,000 136,700 136,700 - 0.51% 0.07%
Enterprise 67,015,100 67,015,100 68,564,800 68,564,800 - 2.31% 36.25%
Internal Service 14,945,900 14,945,900 15,321,300 15,321,300 - 2.51% 8.10% __________________________________________________________________________________________________________________________
Totals 202,501,600$ 202,621,800$ 189,144,900$ 189,144,900$ -$ -6.65% 100.00% ____________________________________________________________________________________________________________________________________________________________________________________________________________________________________________________
PERCENTAGE CHANGE IN THE 2017-18 APPROVED BUDGETFROM THE 2016-17 REVISED BUDGET
General Fund
Special Revenue
Debt Service
Capital Project
Permanent
Enterprise
Internal Service2.51%
2.31%
0.51%
-42.40%
9.89%
-12.28%
5.88%
-100% -80% -60% -40% -20% 0% 20% 40% 60% 80% 100%
34

EXECUTIVE SUMMARY_______________________________________________________________________________________________________________
ADOPTED BUDGETfor the 2017-18 Fiscal Year
ADJUSTMENTS AS ADOPTED BY THE CITY COUNCIL
______________________________________________________________________________________________________________________________________________________________________________________________________________________________
COMPARISON OF 2016-17 REVISED BUDGET TO 2017-18 ADOPTED BUDGETAND PERCENT OF TOTAL BUDGET BY FUND
Over(under)
……2016-17…… ……...…2017-18………... 2016-17 PercentAdopted Revised Proposed Approved Adopted Revised of Total
Fund Type Budget Budget Budget Budget Budget Budget Budget_______________________________________________________________________________________________________________General Fund 36,627,700$ 36,747,900$ 38,909,100$ 38,909,100$ 38,909,100$ 5.88% 20.57% Special Revenue 56,107,400 56,107,400 49,215,700 49,215,700 49,215,700 -12.28% 26.02% Debt Service 2,025,100 2,025,100 2,225,300 2,225,300 2,225,300 9.89% 1.18% Capital Project 25,644,400 25,644,400 14,772,000 14,772,000 14,772,000 -42.40% 7.81% Permanent 136,000 136,000 136,700 136,700 136,700 0.51% 0.07% Enterprise 67,015,100 67,015,100 68,564,800 68,564,800 68,564,800 2.31% 36.25% Internal Service 14,945,900 14,945,900 15,321,300 15,321,300 15,321,300 2.51% 8.10% _______________________________________________________________________________________________________________Totals, All Fund Types 202,501,600$ 202,621,800$ 189,144,900$ 189,144,900$ 189,144,900$ -6.65% 100.00%
REQUIREMENTS:No changes from Approved.
RESOURCES:No changes from Approved.
, yp , ,$ , ,$ , ,$ , ,$ , ,$______________________________________________________________________________________________________________________________________________________________________________________________________________________________
Percentage Change in the 2017-18 Adopted Budget from the 2016-17 Revised Budget
General Fund
Special Revenue
Debt Service
Capital Project
Permanent
Enterprise
Internal Service 2.51%
2.31%
0.51%
-42.40%
9.89%
-12.28%
5.88%
-100% -50% 0% 50% 100%
General Fund 20.57%
Special Revenue 26.02%
Debt Service 1.18% Capital Project 7.81% Permanent 0.07%
Enterprise 36.25%
Internal Service 8.1%
Adopted Budget by Fund Type, Percentage of Total Budget
35

EXECUTIVE SUMMARY
CITIZENS OF THE CITY OF ALBANY
Mayor and City Council Sharon Konopa, Mayor
Ward 1: Dick Olsen & Mike Sykes Ward 2: Ray Kopczynski & Bill Coburn Ward 3: Rich Kellum & Bessie Johnson
Municipal Judge (Contractual)
Bob Scott
Citizen Boards
and Commissions
City Manager
Peter Troedsson
City Attorney – Sean Kidd
Appointed by Council
Appointed by City Manager
Elected
Recommended by City Manager, ratified by Council
Urban Renewal
Ed Hodney
Police
Mario Lattanzio
Finance
Stewart Taylor
City Clerk Finance
Municipal Court
Fire
John Bradner
Ambulance Life Safety
Fire Suppression
Human Resources
David Shaw
Assistant City Manager/ Chief Information Officer
Jorge Salinas
Building Inspection Planning
Parks and Recreation
Ed Hodney
Aquatics Building Maintenance
Park Maintenance Recreation
Senior Center Urban Forestry
Library
Ed Gallagher
Public Works (Eng/CD)
Jeff Blaine
Engineering PW Operations Airport Transit
Engineering Services PW Customer Services
Facilities Sewer Streets Water
Wastewater
Public Works (Operations)
Chris Bailey
Economic Development
Jorge Salinas
36

Ward 1
Ward 2
Ward 3
37

City Council
Back Row, left to right
Mike Sykes – Councilor, Ward 1 Rich Kellum – Councilor, Ward 3 Dick Olsen – Councilor, Ward 1
Ray Kopczynski – Councilor, Ward 2
Front Row, left to right Bill Coburn – Councilor, Ward 2
Sharon Konopa – Mayor Bessie Johnson – Councilor, Ward 3
38

PERSONNEL CHANGE REPORT Addendum: The adopted budget for Fiscal Year 2015-2016 authorized 390.20 full-time equivalent (FTE) positions. Due to a typographical error, 1.00 FTE position was not included in the 390.20. The corrected authorized FTE was 391.20 as of July 1, 2015. Additionally, the following personnel adjustments were approved during Fiscal Year 2015-2016 but were inadvertently left out: Added two 0.0769 FTE Medic 71-Paramedic
positions [0.1538 total FTE] (100-25-1208) Added two 0.0769 FTE Medic 71-EMT
positions [0.1538 total FTE] (100-25-1208) With the above adjustments and those previously listed in the Fiscal Year 2016-2017 Adopted Budget, the corrected revised authorized FTE for Fiscal Year 2015-2016 changed from 398.20 to 399.5076 FTE positions as of April 1, 2016. The adopted budget for Fiscal Year 2016-2017 authorized 404.325 full-time equivalent (FTE) positions. In accounting for the Medic 71 positions and some Excel math errors, the corrected revised FTE was 405.8326 as of July 1, 2016. During Fiscal Year 2016-2017, the following personnel position adjustments were approved:
1. Changed job title for Safety Division Chief position to Safety Division Chief-Fire Marshal (100-25-1203)
2. Changed job title for EMS/Operations Division Chief position to Special Operations Division Chief (100-25-1208 – 80%; 203-25-5117 – 20%)
3. Changed job title for City Emergency Manager position to City Emergency Manager/Safety Officer (100-25-1203)
4. Transferred one 1.00 FTE Administrative Assistant I position from Police bargaining unit to the Non-bargaining group as an Administrative Assistant I (confidential) position in the Police Department.
5. Reclassified 1.00 FTE Recreation Program Coordinator position to Event and Program Coordinator (202-35-1403 – 25 %; 202-35-1404 – 50%; 202-35-1413 – 25%)
6. Reclassified 1.00 FTE Administrative Services Supervisor position to Senior Administrative Supervisor in the Police Department (100-30-1301)
7. Reclassified 1.00 FTE Senior Court Clerk position to Court Supervisor in the Finance Department [Municipal Court] (100-10-1029)
8. Added a 0.725 FTE Maple Lawn Preschool Instruction position (202-35-1403)
9. Reclassified 1.00 FTE Planner II position to Planner III (100-40-1601)
10. Reclassified 1.00 FTE Police Officer position to Police Lieutenant (100-30-1301)
11. Transferred 1.00 FTE Community Paramedic position from Community Paramedic Program grant (203-25-5117) to Fire Department Emergency Services (100-25-1208)
12. Transferred 0.20 FTE Special Operations Division Chief position from Community Paramedic Program grant (203-25-5117) to Fire Department Emergency Services (100-25-1208)
13. Transferred 0.10 FTE Senior Administrative Supervisor position from Community Paramedic Program grant (203-25-5117) to Fire Department Emergency Services (100-25-1208)
14. Transferred 0.10 FTE Clerk III position from Community Paramedic Program grant (203-25-5117) to Fire Department Emergency Services (100-25-1208)
15. Reclassified one vacant 1.00 FTE Fire Lieutenant position to a Firefighter/EMT position (100-25-1208)
16. Transferred one vacant 1.00 FTE Civil Engineer II position from Engineering Services (705-50-2803) to Planning (100-40-1601) and reclassified it to a Planner II position
17. Transferred 1.00 FTE Infrastructure Analyst position from Planning (100-40-1601) to Engineering Services (705-50-2803)
18. Reclassified 1.00 FTE Recreation Program Coordinator position to Event and Program Coordinator (202-35-1402)
19. Adjusted the salary range from A144 to A149 for the Natural Treatment Systems Specialist classification (601-50-2411)
20. Reclassified one 1.0 FTE Accounting Specialist position to Senior Court Clerk in the Finance Department [Municipal Court] (100-10-1029)
With the above adjustments, the revised authorized FTE increased to 406.5576 FTE positions as of April 1, 2017.
39

The adopted budget for Fiscal Year 2017-2018 authorizes 424.1176 budgeted FTE positions, an increase of 17.56 FTE. The proposed FTE changes are: City Manager’s Office +1.0000 FTE Finance Department +1.0000 FTE Fire Department +6.0000 FTE Human Resources Department +1.0000 FTE Library +0.2750 FTE Parks & Recreation Department +2.1875 FTE Police Department +6.0000 FTE Public Works & Community Develop. -0.9025 FTE Public Works Operations Department +1.0000 FTE Total +17.560 FTE CITY MANAGER’S OFFICE Add 1.00 FTE Administrative Services Supervisor position FINANCE DEPARTMENT Add 1.00 FTE Deputy City Clerk position FIRE DEPARTMENT Fire Department Emergency Services Add 1.00 FTE Training Division Chief position Add 3.00 FTE Firefighter/EMT positions Add 1.00 FTE Medic 71-Paramedic position Add 1.00 FTE Medic 71-EMT position HUMAN RESOURCES Add 1.00 FTE HR Programs Coordinator position LIBRARY Increase FTE for one Library Aide position from 0.875 to 1.00 Increase FTE for one Library Aide position from 0.7375 to 0.80 Increase FTE for one Library Aide position from 0.7125 to 0.80
PARKS & RECREATION DEPARTMENT Sports Services Add 1.00 FTE Recreation Aide position Children, Youth, & Family Recreation Services Add 0.4375 FTE Maple Lawn Preschool Teaching Assistant I position Transfer 0.50 FTE Recreation Programs Supervisor position to Adult Recreation Services Add 1.00 FTE Recreation Program Specialist position as a transfer from Adult Recreation Services Resource Development/Marketing Services Transfer 0.25 FTE Event and Program Coordinator position to Adult Recreation Services Park Maintenance Services Reclassify 0.50 FTE Parks Operations Supervisor position to Parks & Facilities Maintenance Manager Transfer 1.00 FTE Parks Operations Supervisor position to Park Facilities Repair & Construction Transfer 2.00 FTE Park Maintenance III positions to Park Facilities Repair & Construction Transfer 1.00 FTE Park Maintenance II position to Park Facilities Repair & Construction Parks and Recreation Administration Increase FTE for one vacant Clerk II position from 0.50 to 0.75 Aquatic Services Add 0.50 Clerk II position Adult Recreation Services Add 0.50 FTE Recreation Programs Supervisor position as a transfer from Children, Youth, & Family Recreation Services Add 0.25 FTE Event and Program Coordinator position as a transfer from Resource Development/ Marketing Services Transfer 1.00 FTE Recreation Programs Specialist to Children, Youth, & Family Recreation Services Park Facilities Repair & Construction Add 1.00 FTE Parks Operations Supervisor position as a transfer from Park Maintenance Services Add 2.00 FTE Park Maintenance III positions as a transfer from Park Maintenance Services Add 1.00 FTE Park Maintenance II position as a transfer from Park Maintenance Services Facilities Maintenance Reclassify 0.50 FTE Parks Operations Supervisor position to Parks & Facilities Maintenance Manager Reclassify 1.00 FTE Building Maintenance Lead Worker to Building Maintenance Supervisor
40

POLICE DEPARTMENT Salary grade adjustment for Police Lieutenant classification from N229 to N230 Salary grade adjustment for Police Records & Systems Supervisor classification from N221 to N223 Salary grade adjustment for Police Communications Supervisor classification from N222 to N223 Add 1.00 FTE Police Accreditation Manager position Add 3.00 FTE Police Officer positions Add 1.00 FTE Police Communications Specialist position Add 1.00 FTE Police Clerk position PUBLIC WORKS & COMMUNITY DEVELOPMENT DEPARTMENT Planning/CDBG Administration Increase FTE for a Planner III position from 0.60 to 0.6975 [100-40-1601 – 11.25%; 203-40-5100 – 58.5%] Public Works Administration Delete 1.00 FTE Administrative Project Coordinator position PUBLIC WORKS OPERATIONS DEPARTMENT Wastewater Administration Reclassify 1.00 FTE Utility Superintendent position to Wastewater Superintendent Industrial Pretreatment Delete 1.00 FTE Environmental Programs Supervisor position Reclassify vacant 1.00 FTE Environmental Services Technician II position to Lead Environmental Services Technician Vine Street Water Treatment Plant Add 0.50 FTE Treatment Facilities Operator position Albany-Millersburg Water Treatment Plant Add 0.50 FTE Treatment Facilities Operator position Water Quality Control Services Add 1.00 FTE Environmental Services Manager position
41

2015-2016 2016-2017 2017-2018Adjusted Adjusted AdoptedPositions Positions Positions Minimum Maximum
City Manager's OfficeCouncil & Nondepartmental – 701-11-1027
Mayor 1.0 1.0 1.0 $185 N/ACouncilor 6.0 6.0 6.0 $130 N/A
TOTAL 7.0 7.0 7.0
City Manager's Office – 701-11-1028
City Manager 1.0 1.0 1.0 $12,788 N/AManagement Assistant/Public Information Officer 1.0 1.0 1.0 $5,513 $6,782Administrative Services Supervisor 0.0 0.0 1.0 $4,618 $5,679Administrative Assistant I (confidential) 1.0 1.0 1.0 $3,983 $4,896Administrative Assistant (confidential) 0.7 0.7 0.7 $3,540 $4,354
TOTAL 3.7 3.7 4.7
Economic Development Activities – 211-11-1101
Economic Development & Urban Renewal Director 1.0 1.0 1.0 $8,274 $10,344Urban Renewal Officer 0.0 1.0 1.0 $4,618 $5,679
TOTAL 1.0 2.0 2.0
Finance DepartmentMunicipal Court – 100-10-1029
Municipal Court Judge 0.250 0.250 0.250 N/A $6,763Court Supervisor 0.000 1.000 1.000 $4,755 $5,848Senior Court Clerk 1.000 1.000 1.000 $3,193 $4,069Accounting Specialist 1.000 0.000 0.000 N/A N/ACourt Clerk 2.125 2.125 2.125 $2,757 $3,509
TOTAL 4.375 4.375 4.375
Finance Office – 701-10-1035
Finance Director 1.00 1.00 1.00 $9,190 $11,487Accounting Supervisor 0.00 2.00 2.00 $6,584 $8,100Senior Accountant 2.00 0.00 0.00 N/A N/ACity Clerk 1.00 1.00 1.00 $4,755 $5,848Deputy City Clerk 0.00 0.00 1.00 $4,103 $5,045Payroll Supervisor 1.00 1.00 1.00 $4,755 $5,848Purchasing Coordinator 1.00 1.00 1.00 $4,437 $5,734Accounting Specialist 4.00 4.00 4.00 $3,193 $4,069
TOTAL 10.00 10.00 11.00
Fire DepartmentPublic Safety Levy - Fire – 100-25-1202
Firefighter/EMT 7.0 7.0 7.0 $4,927 $6,228Senior Deputy Fire Marshal - Compliance 0.0 1.0 1.0 $5,859 $7,432Deputy Fire Marshal - Compliance 1.0 0.0 0.0 N/A N/A
TOTAL 8.0 8.0 8.0
Fire & Life Safety – 100-25-1203
Safety Division Chief - Fire Marshal 0.0 1.0 1.0 $7,196 $8,850Fire Marshal 1.0 0.0 0.0 N/A N/ACity Emergency Manager/Safety Officer 0.0 1.0 1.0 $6,207 $7,634Deputy Fire Marshal - Compliance 2.0 2.0 2.0 $5,628 $7,134Deputy Fire Marshal - Risk Reduction Specialist/Public Information Officer 1.0 1.0 1.0 $5,237 $6,579
TOTAL 4.0 5.0 5.0
Fire Department Emergency Services – 100-25-1208
Fire Chief 1.0000 1.0000 1.0000 $9,190 $11,487Assistant Fire Chief 1.0000 1.0000 1.0000 $7,864 $9,672Special Operations Division Chief 0.0000 1.0000 1.0000 $7,196 $8,850EMS/Operations Division Chief 0.8000 0.0000 0.0000 N/A N/ATraining Division Chief 0.0000 0.0000 1.0000 $7,196 $8,850Training Lieutenant 1.0000 1.0000 1.0000 $5,859 $7,432Battalion Chief 3.0000 3.0000 3.0000 $6,782 $8,342Lieutenant 13.0000 13.0000 13.0000 $5,859 $7,432Apparatus Operator 12.0000 12.0000 12.0000 $5,285 $6,664Firefighter/EMT 28.0000 28.0000 31.0000 $4,927 $6,228Medic 71 - Paramedic 1.1538 1.1538 2.1538 $18.82/hr N/AMedic 71 - EMT 1.1538 1.1538 2.1538 $13.59/hr N/ACommunity Paramedic 0.0000 1.0000 1.0000 $5,234 $6,623Senior Administrative Supervisor 0.9000 1.0000 1.0000 $4,896 $6,024Administrative Assistant I 2.0000 1.0000 1.0000 $3,539 $4,516Ambulance Billing Coordinator 1.0000 1.0000 1.0000 $3,492 $4,331Ambulance Billing Specialist 0.6000 0.6000 0.6000 $2,757 $3,509Clerk III 0.9000 1.0000 1.0000 $2,757 $3,509
TOTAL 67.5076 67.9076 73.9076
Authorized Positions and Monthly Salary Schedule(Regular, Full-Time FTE and Regular, Part-Time FTE)
Position2017-2018
Salary Schedule
42

2015-2016 2016-2017 2017-2018Adjusted Adjusted AdoptedPositions Positions Positions Minimum Maximum
Authorized Positions and Monthly Salary Schedule(Regular, Full-Time FTE and Regular, Part-Time FTE)
Position2017-2018
Salary Schedule
Community Paramedic Program - 203-25-5117
EMS/Operations Division Chief 0.2 0.0 0.0 N/A N/ACommunity Paramedic 1.0 0.0 0.0 N/A N/ASenior Administrative Supervisor 0.1 0.0 0.0 N/A N/AClerk III 0.1 0.0 0.0 N/A N/A
TOTAL 1.4 0.0 0.0
Human Resources DepartmentHuman Resources – 701-14-1032
Human Resources Director 1.0 1.0 1.0 $8,274 $10,344Senior Human Resources Programs Coordinator 1.0 1.0 1.0 $5,679 $6,985Human Resources Programs Coordinator 1.0 1.0 2.0 $4,755 $5,848Human Resources Information System (HRIS) Coordinator 1.0 1.0 1.0 $4,482 $5,513
TOTAL 4.0 4.0 5.0
Information Technology DepartmentInformation Technology Services – 701-13-1030
Assistant City Manager/Chief Information Officer 1.0 1.0 1.0 $9,190 $11,487Information Technology Project Manager 1.0 1.0 1.0 $6,392 $7,864Security & Network Solutions Engineer 1.0 1.0 1.0 $5,417 $6,910Enterprise Technology Manager 1.0 1.0 1.0 $6,392 $7,864
IT Infrastructure Administrator 0.0 1.0 1.0 $4,921 $6,265System Administrator 3.0 2.0 2.0 $4,709 $6,015Media & Applications Developer 0.0 1.0 1.0 $4,709 $6,015Graphics and Web Specialist 1.0 0.0 0.0 N/A N/ASenior Information Systems Technician 1.0 1.0 1.0 $3,978 $5,079Information Systems Technician 1.0 1.0 1.0 $3,697 $4,727Application Support Specialist 0.5 0.5 0.5 $3,614 $4,601
TOTAL 10.5 10.5 10.5
Geographic Information Services – 701-13-2010
Data Systems Manager 1.0 1.0 1.0 $6,392 $7,864Geographic Information System Analyst 1.0 1.0 1.0 $4,709 $6,015
TOTAL 2.0 2.0 2.0
Permit Tracking Services – 701-13-2011
Application Support Specialist 0.5 0.5 0.5 $3,614 $4,601TOTAL 0.5 0.5 0.5
Library DepartmentLibrary – 100-45-1701
Library Director 1.0000 1.0000 1.0000 $8,274 $10,344Supervising Librarian 1.0000 1.0000 1.0000 $5,513 $6,782Library Resources Coordinator 0.7500 0.7500 0.7500 $4,437 $5,734Librarian II 3.0000 4.0000 4.0000 $4,023 $5,125Librarian I 3.5000 2.5000 2.5000 $3,575 $4,546Senior Library Assistant 1.0000 1.0000 1.0000 $3,460 $4,408Library Assistant 2.7125 2.7125 2.7125 $3,119 $3,980System Administrator 1.0000 1.0000 1.0000 $4,709 $6,015Administrative Assistant I 1.0000 1.0000 1.0000 $3,539 $4,516Library Aide 5.9625 5.9625 6.2375 $2,541 $3,230
TOTAL 20.9250 20.9250 21.2000
Parks & Recreation DepartmentSports Services – 202-35-1402
Event & Program Coordinator 0.0 1.0 1.0 $4,437 $5,734
Recreation Aide 0.0 0.0 1.0 $1,978 $2,515
Recreation Coordinator 1.0 0.0 0.0 N/A N/ATOTAL 1.0 1.0 2.0
Children, Youth, & Family Recreation Services – 202-35-1403
Recreation Programs Manager 0.200 0.200 0.2000 $6,024 $7,411Recreation Programs Supervisor 1.000 1.000 0.5000 $4,618 $5,679Event and Program Coordinator 0.000 0.250 0.2500 $4,437 $5,734Recreation Programs Specialist 0.000 0.000 1.0000 $3,713 $4,741Recreation Coordinator 0.250 0.000 0.0000 N/A N/AMaple Lawn Preschool Instructor 0.000 1.750 1.7500 $2,757 $3,509Maple Lawn Preschool Teaching Assistant II 0.650 0.000 0.0000 N/A N/AMaple Lawn Preschool Teaching Assistant I 0.875 0.875 1.3125 $1,978 $2,515
TOTAL 2.975 4.075 5.0125
43

2015-2016 2016-2017 2017-2018Adjusted Adjusted AdoptedPositions Positions Positions Minimum Maximum
Authorized Positions and Monthly Salary Schedule(Regular, Full-Time FTE and Regular, Part-Time FTE)
Position2017-2018
Salary Schedule
Resource Development/Marketing Services – 202-35-1404
Recreation Programs Manager 0.20 0.20 0.20 $6,024 $7,411Resource Development Coordinator 1.00 1.00 1.00 $4,437 $5,734Event and Program Coordinator 1.00 1.50 1.25 $4,437 $5,734Recreation Coordinator 0.50 0.00 0.00 N/A N/A
TOTAL 2.70 2.70 2.45Park Maintenance Services – 202-35-1407
Parks & Facilities Maintenance Manager 0.0 0.0 0.5 $6,024 $7,411Parks Operations Supervisor 1.5 1.5 0.0 N/A N/ANatural Resources Specialist 1.0 1.0 1.0 $4,081 $5,212Park Maintenance III 2.0 2.0 0.0 N/A N/APark Maintenance II 1.0 4.0 3.0 $3,575 $4,546Park Maintenance I 3.0 1.0 1.0 $3,294 $4,186
TOTAL 8.5 9.5 5.5
Parks & Recreation Administration – 202-35-1408
Parks & Recreation Director 1.00 1.00 1.0 $8,274 $10,344Recreation Programs Manager 0.20 0.20 0.2 $6,024 $7,411Administrative Services Coordinator 1.00 1.00 1.0 $3,881 $4,930Clerk III 1.00 1.00 1.0 $2,757 $3,509Clerk II 1.25 1.25 1.5 $2,541 $3,230
TOTAL 4.45 4.45 4.7
Aquatic Services – 202-35-1410
Recreation Programs Manager 1.0 1.0 1.0 $6,024 $7,411Building Maintenance II 0.5 0.5 0.5 $3,575 $4,546Aquatics Program Coordinator 0.0 2.0 2.0 $3,492 $4,439Aquatics Program Leader 2.0 0.0 0.0 N/A N/AClerk II 0.0 0.0 0.5 $2,541 $3,230
TOTAL 3.5 3.5 4.0
Adult Recreation Services – 202-35-1413
Recreation Programs Manager 0.40 0.40 0.4 $6,024 $7,411Recreation Programs Supervisor 0.00 0.00 0.5 $4,618 $5,679Event and Program Coordinator 0.00 0.25 0.5 $4,437 $5,734Recreation Coordinator 0.25 0.00 0.0 N/A N/ARecreation Programs Specialist 2.00 2.00 1.0 $3,713 $4,741Clerk III 1.00 1.00 1.0 $2,757 $3,509
TOTAL 3.65 3.65 3.4
Park Facilities Repair & Construction – 202-35-1420
Parks Operations Supervisor 0.00 0.00 1.00 $4,618 $5,679Park Maintenance III 0.00 0.00 2.00 $3,881 $4,930Park Maintenance II 0.00 0.00 1.00 $3,575 $4,546
TOTAL 0.00 0.00 4.00
Facilities Maintenance – 701-35-1033
Parks & Facilities Maintenance Manager 0.0 0.0 0.5 $6,024 $7,411Parks Operations Supervisor 0.5 0.5 0.0 N/A N/ABuilding Maintenance Supervisor 0.0 0.0 1.0 $4,618 $5,679Building Maintenance Lead Worker 1.0 1.0 0.0 N/A N/ABuilding Maintenance II 2.0 2.0 2.0 $3,575 $4,546
TOTAL 3.5 3.5 3.5
Police DepartmentPolice – 100-30-1301
Police Chief 1.000 1.00 1.00 $9,190 $11,487Police Captain 2.000 2.00 2.00 $7,634 $9,390Police Lieutenant (changed from Sergeant to Lieutenant) 7.000 8.00 8.00 $6,392 $7,864Police Sergeant (changed from Corporal to Sergeant) 6.000 6.00 6.00 $5,327 $6,725Police Officer 41.000 41.00 44.00 $4,632 $5,833Police Records & Systems Supervisor 1.000 1.00 1.00 $5,195 $6,392Police Communications Supervisor 1.000 1.00 1.00 $5,195 $6,392Police Accreditation Manager 0.000 0.00 1.00 $4,814 $6,221Police Communications Specialist 9.000 9.00 10.00 $3,769 $4,787Code Compliance Officer 0.000 1.00 1.00 $4,437 $5,734Crime Prevention Specialist 1.000 1.00 1.00 $4,006 $5,132Community Service Officer 1.000 1.00 1.00 $3,889 $4,984Property and Evidence Specialist 1.625 2.00 2.00 $3,447 $4,314Senior Administrative Supervisor 0.000 1.00 1.00 $4,896 $6,024Administrative Services Supervisor 1.000 0.00 0.00 N/A N/AAdministrative Assistant I (confidential) 1.000 2.00 2.00 $3,983 $4,896Administrative Assistant I 1.000 0.00 0.00 N/A N/APolice Clerk 6.250 6.25 7.25 $2,976 $3,791
TOTAL 80.875 83.25 89.25
44

2015-2016 2016-2017 2017-2018Adjusted Adjusted AdoptedPositions Positions Positions Minimum Maximum
Authorized Positions and Monthly Salary Schedule(Regular, Full-Time FTE and Regular, Part-Time FTE)
Position2017-2018
Salary Schedule
Public Safety Levy - Police – 100-30-1302
Police Officer 4.0 4.0 4.0 $4,632 $5,833Crime Analyst 1.0 1.0 1.0 $4,509 $5,755Community Service Officer 3.0 3.0 3.0 $3,889 $4,984Police Communications Specialist 1.0 1.0 1.0 $3,769 $4,787
TOTAL 9.0 9.0 9.0
Public Works Engineering & Community Development DepartmentPlanning – 100-40-1601
Planning Manager 1.00 1.00 1.0000 $6,584 $8,100Planner III 1.00 2.00 2.1125 $5,417 $6,910Planner II 1.00 1.00 1.0000 $4,921 $6,265Planner I 1.00 1.00 1.0000 $4,081 $5,212Infrastructure Analyst 1.00 0.00 0.0000 N/A N/APermit Technician 0.50 0.50 0.5000 $3,539 $4,516Senior Code Compliance Inspector 0.32 0.32 0.3200 $4,437 $5,734
TOTAL 5.82 5.82 5.9325
CDBG Administration 203-40-5100
Planner III 0.00 0.60 0.585 $5,417 $6,910
TOTAL 0.00 0.60 0.585
CDBG Administration Odd Year – 203-40-5113
Planner III 0.60 0.00 0.00 N/A N/A
TOTAL 0.60 0.00 0.00
Building Inspection – 204-40-1602
Building Official Manager 1.00 1.00 1.00 $6,584 $8,100Building Inspector 3.25 3.25 3.25 $4,365 N/ASenior Code Compliance Inspector 0.68 0.68 0.68 $4,437 $5,734Permit Technician 1.50 1.50 1.50 $3,539 $4,516
TOTAL 6.43 6.43 6.43
Electrical Permit Program – 204-40-1603
Building Inspector 0.75 0.75 0.75 $4,365 N/ATOTAL 0.75 0.75 0.75
Public Works Administration – 705-50-2802
Public Works Engineering & Community Development Director 1.0 1.0 1.0 $9,190 $11,487Public Works/Community Development Business Manager 0.0 1.0 1.0 $6,584 $8,100Senior Accountant 1.0 0.0 0.0 N/A N/APublic Works Executive Assistant 1.0 0.0 0.0 N/A N/ASenior Administrative Supervisor 1.0 1.0 1.0 $4,896 $6,024Administrative Project Coordinator 1.0 1.0 0.0 N/A N/APublic Works Project Coordinator 1.0 1.0 1.0 $3,978 $5,079Administrative Assistant I 2.0 3.0 3.0 $3,539 $4,516Clerk III 2.0 2.0 2.0 $2,757 $3,509
TOTAL 10.0 10.0 9.0
Engineering Services – 705-50-2803
City Engineer 1.0 1.0 1.0 $7,196 $8,850Utilities Services Manager 1.0 0.0 0.0 N/A N/AEngineering Manager/Assistant City Engineer 1.0 1.0 1.0 $6,782 $8,342Development Services Manager 0.0 1.0 1.0 $7,196 $8,850Engineering Manager/Regulatory Affairs 1.0 0.0 0.0 N/A N/ATransportation Systems Analyst 1.0 1.0 1.0 $5,417 $6,910Civil Engineer III 4.0 5.0 5.0 $6,059 $7,732Civil Engineer II 2.0 2.0 2.0 $5,417 $6,910Lead Engineering Technician 1.0 1.0 1.0 $4,921 $6,265Infrastructure Analyst 0.0 1.0 1.0 $4,921 $6,265Engineering Associate I 1.0 0.0 0.0 N/A N/AEngineering Technician IV 2.0 2.0 2.0 $4,709 $6,015Engineering Technician III 2.0 1.0 1.0 $4,283 $5,456Engineering Technician II 2.0 2.0 2.0 $3,780 $4,813Public Works Project Accountant 1.0 1.0 1.0 $3,756 $4,780
TOTAL 20.0 19.0 19.0
Public Works Customer Services – 705-50-2807
Public Works Customer Services Supervisor 1.0 1.0 1.0 $5,513 $6,782Field Representative II 2.0 2.0 2.0 $3,271 $4,180Billing/Collection Specialist II 4.0 4.0 4.0 $2,892 $3,749Public Works Customer Service Representative 2.0 2.0 2.0 $2,757 $3,509
TOTAL 9.0 9.0 9.0
45

2015-2016 2016-2017 2017-2018Adjusted Adjusted AdoptedPositions Positions Positions Minimum Maximum
Authorized Positions and Monthly Salary Schedule(Regular, Full-Time FTE and Regular, Part-Time FTE)
Position2017-2018
Salary Schedule
Public Works Operations DepartmentAlbany Municipal Airport – 211-50-1103
Utility Superintendent - Transportation 0.1 0.1 0.1 $6,207 $7,634TOTAL 0.1 0.1 0.1
Albany Transit System – 213-50-1106
Utility Superintendent - Transportation 0.15 0.15 0.15 $6,207 $7,634Transit Programs Supervisor 0.50 0.50 0.50 $4,896 $6,024Operations Maintenance I 0.25 0.25 0.25 $3,294 $4,186Transit Operator 2.68 2.68 2.68 $3,193 $4,069Clerk III 0.33 0.33 0.33 $2,757 $3,509
TOTAL 3.91 3.91 3.91
Linn-Benton Transit Loop – 213-50-1107
Utility Superintendent - Transportation 0.150 0.150 0.150 $6,207 $7,634Transit Programs Supervisor 0.500 0.500 0.500 $4,896 $6,024Operations Maintenance I 0.250 0.250 0.250 $3,294 $4,186Transit Operator 2.745 3.245 3.245 $3,193 $4,069Clerk III 0.330 0.330 0.330 $2,757 $3,509
TOTAL 3.975 4.475 4.475
Paratransit System – 213-50-1108
Utility Superintendent - Transportation 0.150 0.15 0.15 $6,207 $7,634Paratransit Services Supervisor 1.000 1.00 1.00 $4,618 $5,679Transportation Assistant 1.925 3.00 3.00 $2,757 $3,509Clerk III 0.340 0.34 0.34 $2,757 $3,509
TOTAL 3.415 4.49 4.49
Street Maintenance – 250-50-2602
Street Maintenance Lead Worker 1.0 1.0 1.0 $4,180 $5,331Street Maintenance II 6.0 6.0 6.0 $3,575 $4,546
TOTAL 7.0 7.0 7.0
Street Administration - 250-50-2604
Utility Superintendent - Transportation 0.45 0.45 0.45 $6,207 $7,634TOTAL 0.45 0.45 0.45
Wastewater Treatment Plant – 601-50-2404 (A-M Water Reclamation Facility)
Treatment Plant Supervisor 1.0 1.0 1.0 $5,679 $6,985Treatment Facilities Operator 5.0 5.0 5.0 $3,649 $4,651Treatment Facilities Technician 0.0 1.0 1.0 $3,294 $4,186Treatment Facilities Maintenance Technician 1.0 0.0 0.0 N/A N/A
TOTAL 7.0 7.0 7.0
Wastewater Collection – 601-50-2405
Wastewater Collections Supervisor 1.0 1.0 1.0 $5,679 $6,985Lead Wastewater Operator 1.0 1.0 1.0 $4,180 $5,331Wastewater Maintenance II 8.0 8.0 8.0 $3,575 $4,546Water Maintenance II 0.5 0.5 0.5 $3,575 $4,546
TOTAL 10.5 10.5 10.5
Wastewater Administration – 601-50-2407
Wastewater Superintendent 0.0 0.0 1.0 $6,584 $8,100Utility Superintendent - Wastewater 1.0 1.0 0.0 N/A N/A
TOTAL 1.0 1.0 1.0
Wetlands – 601-50-2411
Natural Treatment Systems Specialist 1.0 1.0 1.0 $4,709 $6,015TOTAL 1.0 1.0 1.0
Industrial Pretreatment – 601-50-2413
Environmental Programs Supervisor 1.0 1.0 0.0 N/A N/ALead Environmental Services Technician 0.0 0.0 1.0 $4,437 $5,734Environmental Services Technician II 3.0 3.0 2.0 $4,223 $5,381
TOTAL 4.0 4.0 3.0
Water Administration – 615-50-2202
Utility Superintendent - Water 1.0 1.0 1.0 $6,207 $7,634TOTAL 1.0 1.0 1.0
Water Canal Maintenance – 615-50-2204
Water Operations Supervisor 0.5 0.5 0.5 $5,679 $6,985Lead Water Operator 1.0 1.0 1.0 $4,180 $5,331Water Maintenance II 2.0 2.0 2.0 $3,575 $4,546
TOTAL 3.5 3.5 3.5
46

2015-2016 2016-2017 2017-2018Adjusted Adjusted AdoptedPositions Positions Positions Minimum Maximum
Authorized Positions and Monthly Salary Schedule(Regular, Full-Time FTE and Regular, Part-Time FTE)
Position2017-2018
Salary Schedule
Vine Street Water Treatment Plant – 615-50-2205
Treatment Plant Supervisor 0.5 0.5 0.5 $5,679 $6,985
Treatment Facilities Operator 2.8 3.5 4.0 $3,649 $4,651TOTAL 3.3 4.0 4.5
Water Distribution – 615-50-2206
Water Operations Supervisor 0.5 0.5 0.5 $5,679 $6,985Lead Water Operator 1.0 1.0 1.0 $4,180 $5,331Water Maintenance III 0.0 1.0 1.0 $3,780 $4,813Water Maintenance II 7.5 6.5 6.5 $3,575 $4,546
TOTAL 9.0 9.0 9.0
Albany-Millersburg Water Treatment Plant – 615-50-2207
Treatment Plant Supervisor 0.50 0.50 0.5 $5,679 $6,985Treatment Facilities Operator 4.25 3.50 4.0 $3,649 $4,651
TOTAL 4.75 4.00 4.5
Operations Administration – 705-50-2805
Public Works Operations Director 1.0 1.0 1.0 $9,190 $11,487Inventory Specialist 1.0 0.0 0.0 N/A N/A
TOTAL 2.0 1.0 1.0
Water Quality Control Services – 705-50-2806
Environmental Services Manager 0.0 0.0 1.0 $5,848 $7,196Environmental Services Technician II 2.0 2.0 2.0 $4,223 $5,381WWTP Laboratory Technician 1.0 1.0 1.0 $4,180 $5,331
TOTAL 3.0 3.0 4.0Facilities & Maintenance Engineering – 705-50-2809
Public Works Technical Services Manager 0.0 1.0 1.0 $6,207 $7,634Facilities Maintenance & Control Manager 1.0 0.0 0.0 N/A N/APublic Works Technical Services Supervisor 0.0 1.0 1.0 $5,679 $6,985Lead Computerized Maintenance Management Systems Analyst 1.0 0.0 0.0 N/A N/A
Facilities Automation Analyst 3.0 3.0 3.0 $5,026 $6,411
System Administrator 0.0 1.0 1.0 $4,709 $6,015
Computerized Maintenance Management Systems Analyst 3.0 3.0 3.0 $4,081 $5,212Facilities Maintenance Electrician 1.0 1.0 1.0 $4,025 $5,129Facilities Automation Technician 1.0 1.0 1.0 $3,697 $4,727Facilities Mechanic I 3.0 3.0 3.0 $3,614 $4,601Inventory Specialist 0.0 1.0 1.0 $3,066 $3,903
TOTAL 13.0 15.0 15.0
ALL DEPARTMENTS TOTAL 399.5076 406.5576 424.1176
FTE = Full-Time Equivalency
47

USER’S GUIDE


USER’S GUIDE A BRIEF TOUR OF ALBANY Location The City of Albany is located in both Linn and Benton counties. It is the county seat of Linn County and has been called the “Hub of the Willamette Valley” due to its location at the junction of US Highways 99 and 20, and Interstate 5. Albany is 24 miles south of Salem, the Oregon state capital, and 69 miles south of Portland. Benton County is adjacent to and west of Linn County and is part of the Willamette Valley. The Willamette River forms the border between Linn and Benton counties. The city of Corvallis is the county seat of Benton County and is the largest city in the county. The second largest city in Benton County is the City of Albany.
Population
Albany has a population of 52,540. Nearly 86 percent of the City’s population resides in Linn County, with the remainder in Benton County. The City came close to matching the record growth in population of the 1960s and 1970s (over 40 percent) in the 1990s, at around 39 percent. In the 2000s, the total increase was approximately 17 percent. The increases for the last six years are:
As of Population % Change 2012 50,325 0.4% 2013 50,520 0.4% 2014 50,710 0.0%* 2015 50,720 1.1% 2016 51,270 0.9% 2017 51,670 1.6% Source: Center for Population Research and Census at Portland State University *Change of 0.02%
Demographics
City Boundary Land Area 2014 ................................................ 17.70 sq. mi. 2015 ................................................ 17.70 sq. mi. 2016 ................................................ 17.70 sq. mi.
Urban Growth Boundary Land Area 2014 ................................................ 21.72 sq. mi. 2015 ................................................ 21.72 sq. mi. 2016 ................................................ 21.72 sq. mi.
Assessed Value ($Millions) 2014-15 ....................................................... 3,416 2015-16 ....................................................... 3,552 2016-17 ....................................................... 3,663 Source: Linn and Benton County Assessor’s Offices
School Enrollment 2014 ............................................................ 9,108 2015 ............................................................ 9,600 2016 ............................................................ 9,600
Infrastructure (as of June 30, 2017) Police Stations ................................................... 1 Fire Stations ....................................................... 4 Libraries ............................................................. 2 Number of Parks ......................... 36/895.18 acres Lane Miles of Asphalt Roads ................... 372.74 Lane Miles of Concrete Roads ..................... 8.02 Lane Miles of Gravel/Oil Mat Roads ......... 20.04 Miles of Water Lines ..................................... 285 Miles of Sewer Lines ..................................... 225 Miles of Storm Drains ................................... 131
Interstate H
wy - 5
Albany
Lebanon
Corvallis
Brownsville
Tangent
Monmouth
Eugene
Salem MARION
LINN
POLK
LANE
BENTON
48

USER’S GUIDE Economics
Unemployment Rate, Linn County 2015 ............................................................. 6.4% 2016 ............................................................. 6.0% 2017 ............................................................. 5.0%
Unemployment Rate, Benton County 2015 ............................................................. 4.1% 2016 ............................................................. 3.8% 2017 ............................................................. 3.2% Source: State of Oregon Employment Division – July 2017.
Top Ten Taxpayers to the City of Albany in 2016 Taxpayer Tax Imposed Target Corporation $1,189,955 Oregon Freeze Dry Inc 594,661 Oregon Metallurgical Corp 479,247 Comcast Corporation 449,859 Pacific Cast Technologies Inc 422,810 PacifiCorp (P P & L) 359,428 Mennonite Home of Albany, Inc 340,989 Wal-Mart Real Estate Business Trust 334,012 Eugene Freezing & Storage Co 316,697 Northwest Natural Gas Co 314,860 Major Employers Education, including Oregon State University (OSU), located in Corvallis; Linn Benton Community College (LBCC), located in Albany and Corvallis; and Greater Albany Public School District 8J (GAPS), is the largest single source of employment in the Albany area. OSU is Oregon’s leading source of basic applied research in forestry, agriculture, fisheries, engineering, electronics, home economics, and the sciences for the development of human, land, atmospheric, and oceanic resources.
Rare metals provide the largest single source of employment within the city limits. The US Bureau of Mines, which opened a research facility in Albany in 1943, introduced rare metal technology. The primary private rare metal industrial plant in the area is Wah Chang, a subsidiary of Allegheny Technologies, along with their sister company Allvac Albany. Dayton Hudson Corporation, dba Target Distribution Center, is also a major employer in the City. As a regional distribution center, it serves Target stores all over California, Oregon, Washington, Idaho, and Montana. Government The City of Albany was founded in 1848, incorporated in 1864, and adopted a home rule charter in 1891. It operates under the provisions of its own Charter and applicable state law. It has a City Manager/Council form of government. The City Council consists of seven members who are elected by the citizens of Albany. Councilors are elected to serve overlapping four-year terms. There are three wards in the City. Two Councilors represent each ward. The Mayor is elected “at-large” by the entire City and serves a two-year term. The Mayor presides over all Council meetings and may vote only in the case of a tie. All Council members are part-time elected officials who exercise the legislative powers of the City and determine matters of policy. The City of Albany provides a full range of municipal services including fire and police protection; street construction, maintenance and lighting; parks and recreation; library services; planning and zoning; and general administrative services. It also operates water and wastewater treatment plants, and maintains water and sewer systems.
July-162014-16
July Avg
1982 Record High
1995 Record
Low
Benton 3.8% 4.4% 10.2% 1.8%
Linn 6.0% 7.0% 18.4% 3.2%
0%
5%
10%
15%
20%
Benton Linn
49

FUND STRUCTURE The City budgets use seven Fund types: General Fund, Special Revenue Funds, Debt Service Fund, Capital Projects Fund, Permanent Funds, Enterprise Funds, and Internal Services Funds. General Fund The General Fund accounts for resources that are generally not dedicated for a specific purpose. Most services provided are basic to the everyday operation of a municipality. Major Revenues
Property tax Franchise fees Privilege tax Intergovernmental (federal, state)
Primary Services Police protection Fire protection Emergency medical services Planning Municipal court Library services
Special Revenue Funds These funds account for revenues that are to be used for a specific purpose. Most of the time, the revenues are obtained through a legal agreement and must be restricted for such purposes. An example is a gas tax for street improvements. Major Revenues
Property tax State gas tax State and federal grants Building fees and permits Intergovernmental (federal, state) Charges for services
Primary Services Street maintenance Parks & recreation services Building inspections ADA code enforcement Economic development Public transit
Debt Service Funds These funds account for the payment of principal and interest on bond issues. The revenues used to retire debt can come from taxes or other revenue sources. Major Revenues
Property tax Department charges Special assessments
Primary Services Payment of principal and interest on
outstanding bonds. Capital Projects Fund This fund is created to record all revenues and expenditures used to finance the building or acquisition of capital facilities. Major Revenues
Transfers from other funds Special assessments Federal and state grants
Primary Services Acquisition, construction, and improvement
of City buildings, bridges, sewer and water, and road extensions.
Permanent Funds These funds are created to account for assets that have been given to the City, of which the City acts as trustee. The assets are legally restricted to the extent that only earnings, and not principal, may be used for the benefit of the government or its citizenry. Major Revenues
Endowments Gifts and donations
Primary Services To account for and spend monies in the
manner for which they were granted. 50

FUND STRUCTURE (cont.) Enterprise Funds These funds are created to finance and account for acquiring, operating, and maintaining facilities and services that are self-supporting. Major Revenues
Charges for service Intergovernmental revenues Licenses and fees Assessments Development fees
Primary Services Water treatment and distribution Wastewater collection and disposal Wastewater and water infrastructure
maintenance and improvements Internal Services Funds These funds account for services furnished by one City department to other departments on a cost reimbursement basis. Major Revenues
Charges to other City departments Primary Services
General administrative services (e.g., City manager, finance, and legal)
Human resources Information technology services Geographical information services Facilities maintenance Permit tracking services Public works administration
51

USER’S GUIDE
BUDGET DOCUMENT STRUCTURE
The City’s budget document is organized into sections by fund type. Each fund type section contains summaries by fund and program. Each program is explained by its functions and responsibilities, strategies/actions, performance measures and workload indicators, staffing summary and three-year financial history.
The highest level of budgeting is by Fund Type. The City budgets using seven Fund Types.
Within those seven Fund Types there are 19 funds.
Budgeted within each fund is at least one “program.” The number of programs is based on the level of management control needed to effectively control expenditures.
Budgeted within each program are seven “expenditure categories.” This is the lowest level of budget appropriation.
For management purposes only, the City budgets by “line item” within each expenditure category.
FUND TYPE
General Fund Special Revenue Funds Debt Service Funds Capital Projects Funds Permanent Funds Enterprise Funds Internal Services Funds
SPECIAL REVENUE TYPE FUNDS
Parks and Recreation Fund Grants Fund Building Inspection Fund Risk Management Fund (Various other funds)
SPECIAL REVENUE TYPE FUNDS:
BUILDING INSPECTION FUND ACTIVITIES
Building Inspection Electrical Permit Program ADA Code Enforcement Development Code Enforcement
SPECIAL REVENUE TYPE FUND: BUILDING INSPECTION:
ELECTRICAL PERMIT PROGRAM ACTIVITY:
EXPENDITURE CATEGORY
Personnel Materials and Services Capital Debt Service Contingency Unappropriated Transfers
MATERIALS AND SERVICES: Line Item
Telephone Postage (Various Line Items)
52

USER’S GUIDE
CITY OF ALBANY BUDGET PROCESS The objective throughout the budgeting process is to strive to achieve the City’s mission statement, which is “Providing quality public services for a better Albany.” With this in mind, the City Council and management staff expand upon its mission and lay the groundwork for a detailed budget process. The City of Albany’s budget process is driven primarily by four components: 1) revenue forecast, 2) Council’s Strategic Plan themes, 3) departmental strategies/actions, and 4) Oregon Local Budget Law. Revenue Forecast Toward the end of the calendar year, a five-year revenue forecast is prepared. This forecast takes into consideration such things as the current and future economic outlook, construction, population growth, and business growth in the City. These factors, as well as operational directives, will result in future demands for City services. Council’s Strategic Plan Themes Soon after the revenue forecast has been done, the City Council and Budget Committee meet during a work session in order to set policy and themes (goals) for the fiscal year beginning July 1. About this same time, the Council will be meeting with City staff to develop its five-year Capital Improvement Program, which will also aid in the development of department strategies. Department Strategies/Actions After Citywide policy and themes have been developed, management and staff will formulate their current and future departmental strategies or actions. While prioritizing these strategies, City staff has to consider many factors, such as current workload or service demands, its revenue forecast, project schedules, current workforce staffing needs, and fixed assets.
Oregon Local Budget Law Chapter 294 of the Oregon Revised Statutes (ORS) governs budgeting in Oregon. The objectives are as follows: To provide standard procedures for
preparing, presenting, and administering a district’s budget.
To encourage citizen participation in the
preparation of and exposure to the budget before its adoption.
ORS 294 requires all taxing districts to file their budgets with the county no later than July 15 of the new fiscal year. As an aid to taxing districts, the Oregon State Department of Revenue has broken down the budget process into nine steps. They are as follows: 1. Appoint Budget Officer - Every local
government is required to have a budget officer, either appointed by the governing body or designated in its charter. The Albany City Council has chosen to designate the City’s Finance Director as the Budget Officer.
2. Prepare Proposed Budget - With much of
the groundwork laid by the City Council and various work sessions, City management and staff meet and prepare an estimate of revenues and expenditures for the upcoming fiscal year. The City Manager and Budget Officer meet with various departments in order to “balance” the budget as required by the Oregon Revised Statutes.
3. Public Notice of Meeting - Upon completion
of the budget reviews, the proposed budget is prepared and a “Notice of Budget Committee Meeting” is advertised in the local newspaper. ORS 294 requires notice to be published at least twice, five to 30 days before the scheduled Budget Committee meeting date, separated by at least seven days.
53

USER’S GUIDE 4. Budget Committee Meets - At the first formal
Budget Committee meeting, the City Manager presents the budget message and the proposed budget document to the Committee for review. The Budget Committee may then meet as often as necessary with the public, until all citizen concerns are heard.
5. Budget Committee Approves Budget - When
the Budget Committee is satisfied that the budget will meet the needs of the citizens of Albany, it will approve the document and forward it to the City Council for adoption. The Budget Committee shall also approve a rate of total ad valorem property taxes to be certified for collection.
6. Notice of Hearing and Financial Summary -
After approval of the budget, a budget hearing must be held. The City Council must publish, by one or more of the methods described in ORS 294.311, a summary of the recommended budget and a notice of budget hearing five to 25 days before the scheduled hearing date. If the notice is posted instead of published in the newspaper, then a second posted notice is required eight to 14 days prior to the budget hearing.
Included in the notice shall be a summary of the budget comparing the most recent preceding year’s actual expenditures and budget resources, the current year budget summary with detail for each expenditure category (Personnel Services, Materials & Services, Capital Outlays, Debt Service, Transfers, and Operating Contingencies), the major resources for financing activities and significant changes from the current year, the estimated tax levy necessary to balance the budget and an analysis of tax levy and special levies for the ensuing years and current year, the time and place of the budget hearing, the basis of accounting used in the preceding and current years, and the place where the complete budget document can be inspected by the general public.
7. Budget Hearing Held - The budget hearing must be held on the date advertised in the newspaper and must allow for public testimony on any aspect of the approved budget.
8. Adopt Budget, Make Appropriations, Levy
Taxes - The City Council may make changes to the budget during the budget hearing; however, there are limitations to these changes:
a. Taxes may not be increased over the
amount approved by the Budget Committee.
b. Estimated expenditures in any fund
may not be increased by more than $5,000 or 10 percent, whichever is greater.
The City Council may do either of these only after publishing a revised financial summary and holding another budget hearing. After considering any public testimony, the City Council will then adopt a resolution that appropriates expenditures, levies the ad valorem tax rate, and categorizes the levy. The resolution must be adopted by June 30 before the next fiscal year.
54

USER’S GUIDE 9. Submit Budget to Assessor - The final step in the budget process is to file the budget and certify
any necessary property tax levy to the Linn and Benton County Assessors.
THE BUDGET PROCESS
Appoint Budget Officer
Prepare Proposed Budget
Publish Notice of Meeting
Budget Committee Meets
Approve Budget and Tax Levy
Publish Notice & Summary
Notice must be published twice, not more than 30 days and not less than five days prior to the meeting.
Hold Budget Hearing
Determine Tax Levy
Adopt Budget & Levy Taxes
by June 30
No Election Required Election Required
Notify Elections Officer (61 days before election)
Hold Election
Declare Election Results File Appropriation
Resolution and Levy Amount by July 15
55

USER’S GUIDE Supplemental Budget
During the fiscal year, circumstances may require expenses to be paid that were not budgeted or the City may receive unanticipated resources. A supplemental budget must be adopted and appropriated before any additional money can be spent. Supplemental budgets are good only through June 30 of the fiscal year in which they are adopted. Preparing a supplemental budget does not authorize the governing body to levy additional ad valorem taxes. When the estimated expenditures contained in a supplemental budget differ by less than 10 percent of any one of the individual funds contained in the regular budget for that fiscal year, then the process used to adopt the supplemental budget is as follows: 1. The supplemental budget may be adopted by
the Council at a regularly scheduled Council meeting. The Budget Committee is not required to convene.
2. Notice of the regular meeting at which the
supplemental budget will be adopted must be published not less than five days before the meeting. The notice must include the name of each fund being adjusted and the amount of change in each fund's revenues and expenditures.
3. At the Council meeting a resolution adopting
the supplemental budget and making appropriations may be approved.
When the supplemental budget will adjust any one of the individual funds in the current budget by 10 percent or more, then a different process must be used to adopt the supplemental budget. This process is described below: 1. A public hearing must be held to discuss and
adopt the supplemental budget. The City Council holds the hearing. The Budget Committee is not required.
2. A “Notice of Hearing” of the proposed
supplemental budget and a summary of the proposed supplemental budget must be published and posted not less than 5 days and not more than 30 days prior to the hearing.
3. The City Council may resolve to adopt and
appropriate the supplemental budget at the hearing.
56


FISCAL YEAR 2017-2018 BUDGET CALENDAR
\
Council/Budget Committee Work Session ..................................................... 6:30 p.m. Thursday, January 26
Central Services budget review with City Manager/Finance Director ................................................ January 25 Supervisors Meeting: Review of Budget Process ............................................................ 11:00 a.m., January 27 Departmental budget reviews with City Manager and Finance Director ......................................... March 01-03
Dept’s submit final Requested Budget, if changes occurred after Director’s review ........................... March 15
Council, Budget Committee, Planning Commission, and staff review of the Capital Improvement Program (CIP) and budget update .......................................................................................................................... April 04
Publish Notice of Budget Committee Meeting ....................................................................................... April 10
Budget Committee Meetings .................................................................. 6:30 p.m., April 27, May 04, 11, & 12
Publish CIP Public Hearing Notice, and Approved Budget and Public Hearing Notice ......................... May 31
CIP Public Hearing and adoption by City Council ............................................................................... June 14
Public Hearing on 2017-2018 Approved Budget .................................................................................. June 14
If necessary:
Public Hearing on 2017-2018 Supplemental Budget ........................................................................... June 28
Adoption of FY 2017-2018 Supplemental Budget ................................................................................. June 28
57

USER’S GUIDE
BUDGET ASSUMPTIONS During the initial phase of the budget process, the Finance Department compiles the Budget Planning Resource Guide. This manual provides the budget calendar, guidelines for budget worksheets, assumptions to include when formulating a program budget, and samples of budget forms. The rates provided below assist in the formulation of economic and personnel expenditures and revenues. Economic Interest: The average rate of return for City
investments will be 1.0 percent.
Assessed Value Growth: The assessed value of property within the City of Albany will increase by 3.49 percent.
Personnel Salaries: Salaries will be adjusted per union
contracts (e.g., Fire, Police, and AFSCME bargaining units).
PERS: The cost per employee for retirement benefits for the Public Employee Retirement System (PERS) will be calculated at 24 percent of the monthly salary.
PERS Pick-Up: The City of Albany will
continue the PERS pick-up of six percent.
Health Benefits: An increase in health insurance premiums will be calculated at eight percent.
REVENUE TRENDS AND ASSUMPTIONS General Fund The Local Option Public Safety Levy for
this budget will continue to be impacted by compression. The City’s permanent tax rate will be $6.3984/$1,000 valuation.
Special Revenue Funds New housing and commercial development
is growing slowly. The City will continue to receive state
revenue sharing funds at a slightly higher level than the prior year.
Capital Projects Funds The budget will reflect the total estimated
capital projects that will be initiated in the fiscal year.
Enterprise Funds The funds will operate without an increase
for the 2017-18 fiscal year
58

POLICIES


City of Albany
Finance Policy Policy #: F-07-08-006 Title: Financial Policies
I. POLICY STATEMENT It is the policy of the City of Albany to actively manage financial, operational, and budgetary affairs within established guidelines in order to maintain financial stability both now and in the future.
II. GENERAL GUIDELINES
1. The City Manager and department directors are charged with achieving the themes,
goals, and objectives adopted by the City Council in the City’s Strategic Plan. 2. The implementing document for the Strategic Plan is the annually adopted budget.
The adopted budget establishes types and levels of services through both operating and capital budgets. The relationships between the operating and capital budgets will be explicitly recognized and incorporated into the budget process. Resources will be identified to provide designated levels of service, and maintenance or enhancement of related capital and fixed assets.
3. The City will actively measure performance and pursue process improvements to enhance productivity and maximize resources.
4. Adequate reserves will be maintained for all known liabilities, including employee leave balances and explicit post employment benefits.
5. The City will actively seek partnerships with private interests and other government agencies to achieve common policy objectives, share the costs of providing local services, and support favorable legislation at the state and federal levels.
6. The City will seek out, apply for, and effectively administer federal, state, and foundation grants-in-aid that address the City’s priorities and objectives.
III. REVENUES
1. The City will actively identify and administer funding sources that create a reliable,
equitable and diversified revenue stream to shelter the City from short-term fluctuations in any single revenue source and to maintain desired levels of services.
2. Revenues will be conservatively estimated in the budget process. 3. Target fund balances for operating budgets will range between 5 and 15 percent of
operations. 4. The City will consider full cost recovery and comparable rates charged by other
municipalities of similar size in establishing rates, fees, and charges. 5. The City will follow an aggressive policy of collecting revenues. 6. Enterprise and internal service funds are intended to be self-supporting.
IV. EXPENDITURES
1. The City will identify priority services, establish appropriate service levels, and administer the expenditure of available resources to assure fiscal stability and the effective and efficient delivery of services.
59

2. The City will operate on a current funding basis. Expenditures will be monitored on an ongoing basis so as not to exceed current revenues and targeted fund balances.
3. The City Manager will take immediate corrective actions if at any time during a fiscal year revised revenue and expenditure estimates project a year-end deficit. Mitigating actions may include a hiring freeze, expenditure reductions, fee increases, or use of contingencies. Actions to be avoided include expenditure deferrals into the following fiscal year, short-term loans, and use of one-time revenues to support ongoing operations.
4. Target contingencies for operating budgets will range between 5 and 15 percent of operations.
5. Internal service charges and project accounting should be used when service recipients and parameters of a project can be easily identified. The charges should be based on methodologies that fairly allocate the full cost of services. The Finance Director shall review the methodologies on a periodic basis to verify that they are consistent with federal guidelines and Oregon Local Budget Law.
6. The City Manager will undertake ongoing staff and third-party reviews of City programs to measure efficiency and effectiveness. Privatization and contracting with other governmental agencies will be evaluated as alternatives to in-house service delivery. Programs that are determined to be inefficient and/or ineffective shall be reduced in scope or eliminated.
V. CAPITAL IMPROVEMENT PROGRAM (CIP)
1. The City will monitor and periodically assess the City’s capital equipment and
infrastructure, setting priorities for its renovation and replacement based on needs and available resources.
2. The City will develop a multi-year program for capital improvements that will be reviewed annually in the budget process.
3. Projects in the CIP will be flagged as either funded or unfunded depending on whether or not the forecasted operating budget can support or fund the project. All funded projects are included in the operating budget for the corresponding budget year.
4. The City will maintain its physical assets at a level adequate to protect the City’s capital investment and minimize future maintenance and replacement costs. The budget process will provide for review of maintenance and orderly replacement of capital assets from current revenues where possible.
VI. CAPITAL ASSETS
1. Capital assets are non-consumable assets with a purchase price of $5,000 or greater
and a useful life of more than one year. 2. The Finance Department will oversee a physical count/inspection of all capital assets
at least on a biennial basis. All additions, deletions, and depreciation of infrastructure will be reported consistent with the requirements of the Government Accounting Standards Board Statement Number 34.
3. Adequate insurance will be maintained on all capital assets. VII. DEBT
1. The City will generally limit long-term borrowing to capital improvements. 2. The City will follow a policy of full disclosure on every financial report, official
60

statement, and bond prospectus. 3. The City Manager will ensure that continuing disclosure policies and procedures are
in place and include the following: a. The City’s bond counsel will advise the City in developing appropriate
policies and procedures. b. The Finance Director is primarily responsible for meeting all post-issuance
and continuing disclosure requirements of all bonds issued by the City. c. The Finance Director will participate in timely and appropriate training to be
familiar with any changes in continuing disclosure requirements. d. Records will be maintained to substantiate compliance for three years after
securities have matured. e. The City will take timely steps to correct any instances of noncompliance.
4. The City will strive to maintain its high bond ratings, currently AA- from Standard & Poor’s and A1 from Moody’s, and will receive credit ratings on all its bond issues.
5. General obligation debt will not be used for self-supporting enterprise activities unless the activity provides a community-wide benefit.
6. The City shall ensure that its general obligation debt margins are within the 3% true cash value limitation as set forth in ORS Section 287.004.
7. Funding strategies that are necessary to support debt obligations should be implemented prior to debt payments becoming due so that debt obligations can be met from current revenues.
8. The City will use voter-approved general obligation debt to fund general-purpose public improvements that cannot be financed from current revenues. Special purpose debt including certificates of participation, revenue bonds, and loans will be linked to specific funding sources.
VIII. Grants
1. Community organizations that desire financial support from the City must submit a Community Grant application no later than March 1 in order to be considered for funding in the next budget year. Applications will be reviewed by the department director assigned by the City Manager. Primary consideration will be given to requests that further the goals and objectives in the Strategic Plan. Applications that are approved by the department director and City Manager shall be included in the Proposed Budget to be considered by the Budget Committee and City Council. Any recipient of a Community Grant shall submit an accounting of how the funds were expended and the benefits achieved as required by City Council Resolution No. 5089. Recipients of grants greater than $100,000 must also submit an independent review of financial policies and procedures related to the grant proceeds no later than six months following the end of the fiscal year in which the funds were granted. Notwithstanding the above, community organizations and events funded with transient lodging tax revenues will follow the guidelines set forth in Finance Policy F-12-11-001 as currently adopted or amended.
2. City departments are encouraged to seek grants and other financial support from private, nonprofit, and government agencies that would supplement City resources in meeting adopted goals and objectives. Grants that are available on an annual basis should be included in the proposed budget and do not require further City Council action once the budget is adopted, unless required by the granting agency. The City
61

Manager is responsible to oversee other grant applications. All awarded grants must be accepted and appropriated by resolution of the City Council as required by Oregon Local Government Budget Law (ORS 294.326(3)).
IX. ACCOUNTING, AUDITING, AND FINANCIAL REPORTING
1. The Finance Department is responsible to see that all accounting, auditing, and financial reporting comply with prevailing federal, state, and local statutes and regulations including generally accepted accounting principles as promulgated by the Governmental Accounting Standards Board (GASB), the American Institute of Certified Public Accountants (AICPA), and the Government Finance Officers Association (GFOA).
2. The Finance Department will conduct periodic internal audits of financial procedures such as cash handling, purchasing, and accounts payable to test internal controls and to detect instances of fraud or abuse. The Finance Director shall establish locations and limits for petty cash, purchase cards, and other cash and purchasing procedures consistent with operational needs, GFOA best practices, and Oregon Administrative Rules and Revised Statures.
3. The City will seek out and contract for the assistance of qualified financial advisors, consultants, and auditors in the management and administration of the City’s financial functions.
4. The City Council will be provided monthly financial reports of revenues and expenditures.
5. A complete independent audit will be performed annually. 6. The City will issue annual financial reports in accordance with generally accepted
accounting principles (GAAP) as outlined in the Governmental Accounting, Auditing, and Financial Reporting (GAAFR) publication.
7. The City will annually seek the GFOA Certificate of Achievement for Excellence in Financial Reporting and the GFOA Distinguished Budget Presentation Award.
Supersedes: Res. No. 6461
Created/Amended by/date: November 7, 2016
Effective Date: November 9, 2016
Reviewed by Council: November 7, 2016
62

City of AlbanyFinance PolicyPolicy #: F-06-08-008Title: Investment Policy
TABLE OF CONTENTS
I. INTRODUCTION .............................................................................................................................. 3
II. GOVERNING BODY ......................................................................................................................... 3
III. SCOPE .......................................................................................................................................... 3 IV. OBJECTIVES AND STRATEGY .............................................................................................................. 3
1. Safety of Principal
2. Liquidity
3. Yield‐Return
V. STANDARDS OF CARE ...................................................................................................................... 4 1. Delegation of Investment Authority
2. Prudence
3. Ethics and Conflict of Interest
VI. AUTHORIZED FINANCIAL INSTITUTIONS ............................................................................................... 5 1. Broker/Dealer Approval Process
2. Investment Adviser Process
3. Financial bank Institutions
4. Competitive Transactions
VII. SAFEKEEPING AND CUSTODY, CONTROLS ............................................................................................ 6 1. Safekeeping and Custody Securities
2. Safekeeping of Funds at Bank Depositories
3. Accounting Methods
4. Pooling of Funds
5. Internal Controls
VIII. AUTHORIZED AND SUITABLE INVESTMENTS ........................................................................................ 7
1. Authorized Investments
2. Suitable Investments
3. Collateralization
IX. INVESTMENT PARAMETERS ............................................................................................................... 9
1. Diversification
2. Investment Maturity
3. Prohibited Investments
X. POLICY COMPLIANCE AND PERFORMANCE EVALUATION ....................................................................... 10
63

1. Compliance Report
2. Compliance Measurement and Adherence
3. Performance Measurement
XI. REPORTING REQUIREMENTS ........................................................................................................... 11
XII. INVESTMENT POLICY ADOPTION BY GOVERNING BOARD ..................................................................... 11
I. INTRODUCTION
The City of Albany, (hereinafter referred to as "Albany" or "City") was founded in 1848. Albany is the eleventh largest city in the state of Oregon, and is the county seat of Linn County. Albany has a home rule charter and is a Council‐Manager form of government where the full time appointed City Manager administers the day‐to‐day operations and is the chief administrative officer of the City. The average monthly balance of funds invested in the City's general portfolio, excluding proceeds from bond issues, is approximately $60,000,000.00. The highest balances occur when taxes are collected. II. GOVERNING BODY
It is the policy of the City of Albany that the administration of its funds and the investment of those funds shall be handled with the highest public trust. Investments shall be made in a manner that will assure security of principal. Parameters will be set to limit maturities and increase diversification of the portfolio while meeting the daily cash flow needs of the City and conforming to all applicable state and City requirements governing the investment of public funds. The receipt of a market rate of return will be secondary to safety and liquidity requirements. It is the intent of the City to be in complete compliance with local, state, and federal law. The earnings from investments will be used in a manner that best serves the public trust and interests of the City.
III. SCOPE This policy applies to activities of the City of Albany with regard to investing the financial assets of all funds. Funds held by trustees or fiscal agents are excluded from these rules; however, all funds are subject to regulations established by the state of Oregon. The City commingles its daily cash into one pooled investment fund for investment purposes of efficiency and maximum investment opportunity. The following funds, and any new funds created by the City, unless specifically exempted by the City Council and this policy, are defined in the City's Comprehensive Annual Financial Report:
General Fund
Special Revenue Funds
Debt Service Funds
Capital Projects Funds
Enterprise Funds
Internal Service Funds
Permanent Funds
64

These funds will be invested in compliance with the provisions of all applicable Oregon Revised Statutes (ORS). Investments of any tax‐exempt borrowing proceeds and any related Debt Service funds will comply with the arbitrage restrictions in all applicable Internal Revenue Codes. IV. OBJECTIVES AND STRATEGY It is the policy of the City that all funds shall be managed and invested with three primary objectives, listed in the following order of priority:
1. Safety of Principal
Safety of principal is the foremost objective of the City. Investments of the City shall be undertaken in a manner that seeks to ensure the preservation of capital in the overall portfolio.
Diversification of the portfolio will include diversification by maturity and market sector and will include the use of multiple broker/dealers for diversification and market coverage.
2. Liquidity The City's investment portfolio will remain sufficiently liquid to enable it to meet all operating requirements that might be reasonably anticipated.
3. Yield‐Return The City's investment portfolio shall be designed with the objective of attaining a market rate of return throughout budgetary and economic cycles, taking into account the City's risk constraints and the cash flow of the portfolio. "Market rate of return" may be defined as the average yield of the current three‐month U.S. Treasury bill or any other index that most closely matches the average maturity of the portfolio.
Effective cash management is recognized as essential to good fiscal management. Cash management is defined as the process of managing monies in order to ensure maximum cash availability. The City shall maintain a comprehensive cash management program that includes collection of accounts receivable, prudent investment of its available cash, disbursement of payments in accordance with invoice terms, and the management of banking services.
V. STANDARDS OF CARE
1. Delegation of Investment Authority
a. Investment Officer. The Finance Director, acting on behalf of the City Council, is designated as the Investment Officer of the City and is responsible for investment management decisions and activities. The Council is responsible for considering the quality and capability of investment advisers and consultants involved in investment management and procedures. All participants in the investment process shall seek to act responsibly as custodians of the public trust.
The Investment Officer and those delegated investment authority under this policy, when acting in accordance with the written procedures and this policy, and in accord with the Prudent Person Rule, shall be relieved of personal responsibility and liability in the management of the portfolio.
65

b. Investment Adviser. The City may enter into contracts with external investment management firms on a non‐discretionary basis.
If an investment adviser is hired, the adviser will serve as a fiduciary for the City and comply with all requirements of this Investment Policy. Exceptions to the Investment Policy must be disclosed and agreed upon in writing by both parties. The Investment Officer remains the person ultimately responsible for the prudent management of the portfolio.
c. Staff Designation. The Investment Officer shall designate a staff person as a liaison/deputy
in the event circumstances require timely action and the Investment Officer is not available.
2. Prudence The standard of prudence to be used in the investment function shall be the "prudent person" standard and shall be applied in the context of managing the overall portfolio. This standard states: "Investments shall be made with judgment and care, under circumstances then prevailing, which persons of prudence, discretion, and intelligence exercise in the management of their own affairs, not for speculation, but for investment, considering the probable safety of their capital as well as the expected income to be derived.” 3. Ethics and Conflict of Interest Officers and employees involved in the investment process shall refrain from personal business activity that could conflict with the proper execution and management of the investment program, or that could impair their ability to make impartial decisions. Employees and investment officials shall disclose any material interests in financial institutions with which they conduct business. They shall further disclose any personal financial/investment positions that could be related to the performance of the investment portfolio. Employees, officers, and their families shall refrain from undertaking personal investment transactions with the same individual with whom business is conducted on behalf of the City. Officers and employees shall, at all times, comply with the state of Oregon Government Ethics as set forth in ORS 244.
VI. AUTHORIZED FINANCIAL INSTITUTIONS
1. Broker/Dealer Approval Process The Investment Officer shall maintain a list of all authorized brokers/dealers and financial institutions that are approved for investment purposes or investment dealings. Any firm is eligible to make an application to the City of Albany and upon due consideration and approval will be added to the list. Additions and deletions to the list will be made at the discretion of the Investment Officer. At the request of the City of Albany, the firms performing investment services shall provide their most recent financial statements or Consolidated Report of Condition for review. Further, there should be in place, proof as to all the necessary credentials and licenses held by employees of the brokers/dealers who will have contact with the City of Albany as specified by, but not necessarily limited to the Financial Industry Regulatory Authority (FINRA), Securities and Exchange Commission (SEC), etc. The Investment Officer shall conduct an annual evaluation of each firm's credit worthiness to determine if it should remain on the list.
66

All dealers with whom the City transacts business will be provided a copy of this Investment Policy to ensure that they are familiar with the goals and objectives of the investment program. If the City hires an investment adviser to provide investment management services, the adviser is authorized to transact with its direct dealer relationships on behalf of the City. A list of approved dealers must be submitted to the investment officer prior to transacting business. The investment officer can assign the responsibility of broker/dealer due diligence process to the Adviser, and all licensing information on the counterparties will be maintained by the Adviser and available upon request.
2. Investment Adviser An Investment Adviser may be selected through a competitive RFP process and must meet the following criteria:
a. The investment adviser firm must be registered with the Securities and Exchange Commission (SEC) or licensed by the state of Oregon if assets under management are less than $100 million.
b. All investment adviser firm representatives conducting investment transactions on behalf of the City must be registered representatives with FINRA.
c. All investment adviser firm representatives conducting investment transactions on behalf of the City must be licensed by the state of Oregon. Factors to be considered when hiring an investment advisory firm may include, but are not limited to:
i. The firm’s major business ii. Ownership and organization of the firm iii. The background and experience of key members of the firm, including the portfolio
manager expected to be responsible for the City’s account iv. The size of the firm’s asset base, and the portion of that base which would be made
up by the City’s portfolio if the firm were hired v. Management fees vi. Cost analysis of the adviser vii. Performance of the investment advisory firm, net of all fees, versus the Local
Government Investment Pool over a given period of time
3. Financial Bank Institutions All financial banks that provide bank deposits, certificates of deposits or any other deposit of the bank to the City must either be fully covered by the FDIC or the bank must be a participant of the Public Funds Collateralization Program (PFCP). ORS Chapter 295 governs the collateralization of Oregon public funds and provides the statutory requirements for the PFCP. Bank depositories are required to pledge collateral against any public fund deposits in excess of deposit insurance amounts. The PFCP provides additional protection for public funds in the event of a bank loss. 4. Competitive Transactions The Investment Officer will obtain telephone, faxed or emailed quotes before purchasing or selling an investment. The Investment Officer will select the quote which best satisfies the investment objectives of the investment portfolio within the parameters of this policy. The Investment Officer will maintain a written record of each bidding process including the name and prices offered by each participating financial institution.
67

The investment adviser must provide documentation of competitive pricing execution on each transaction. The adviser will retain documentation and provide upon request.
VII. Safekeeping and Custody, Controls
1. Safekeeping and Custody Securities
The laws of the state and prudent treasury management require that all purchased securities be bought on a delivery versus payment basis and be held in safekeeping by the City, an independent third‐party financial institution, or the City's designated depository. All safekeeping arrangements shall be designated by the Investment Officer and an agreement of the terms executed in writing. The approved broker/dealer or investment adviser shall provide the City with a confirmation ticket listing the specific instrument, issuer, coupon, maturity, CUSIP number, purchase or sale price, transaction date, and other pertinent information. The broker/dealer which executes the transaction on the City's behalf shall deliver all securities on a delivery versus payment method to the designated third party trustee at the direction of the Investment Officer.
2. Safekeeping of Funds at Bank Depositories The City may hold bank deposits or certificates of deposits at banks qualified under ORS 295.
3. Accounting Methods The City shall comply with all required legal provisions and Generally Accepted Accounting Principles (GAAP). The accounting principles are those contained in the pronouncements of authoritative bodies including but not necessarily limited to, the Governmental Accounting Standards Board (GASB); the American Institute of Certified Public Accountants (AICPA); and the Financial Accounting Standards Board (FASB).
4. Pooling of Funds Except for cash in certain restricted and special funds, the City will consolidate balances from all funds to maximize investment opportunities. Investment income will be allocated to the various funds based on their respective participation and in accordance with Generally Accepted Accounting Principles.
5. Internal Controls The City will maintain a structure of internal controls sufficient to assure the safekeeping and security of all investments. All out of compliance situations under this policy will be corrected and brought into compliance as soon as prudently possible. The Investment Officer shall develop and maintain written administrative procedures for the operation of the investment program that are consistent with this investment policy. Procedures will include reference to safekeeping, wire transfers, banking services contracts, and other investment‐related activities.
The Investment Officer shall be responsible for all transactions undertaken and shall establish a system of controls to regulate the activities of subordinate officials and staff. No officer or designee may engage in an investment transaction except as provided under the terms of this policy and the procedures established by the Investment Officer and approved by the Council.
68

VIII. AUTHORIZED AND SUITABLE INVESTMENTS
1. Authorized Investments
All investments of the City shall be made in accordance with Oregon Revised Statutes: ORS 294.035 (Investment of surplus funds of political subdivisions; approved investments), ORS 294.040 (Restriction on investments under ORS 294.035), ORS 294.052 (Definitions; investment by municipality of proceeds of bonds), ORS 294.135 (Investment maturity dates), ORS 294.145 (Prohibited conduct for custodial officer), ORS 294.805 to 294.895 (Local Government Investment Pool). Any revisions or extensions of these sections of the ORS shall be assumed to be part of this Investment Policy immediately upon being enacted.
2. Suitable Investments The City will diversify investments across maturities, security types and institutions to avoid incurring unreasonable risks. The City has further defined the eligible types of securities and transactions as follows:
TYPE DEFINITION
U.S. Treasury Obligation Direct obligations of the United States Treasury whose payment is guaranteed by the United States. [ORS Section 294.035(3)(a)]
GSE – Agency Obligations US Government Agencies, Government Sponsored Enterprises (GSEs), Corporations or Instrumentalities of the US Government ‐ Federal Instrumentality Securities include, but are not limited to Federal National Mortgage Association (FNMA), the Federal Home Loan Mortgage Corporation (FHLMC), Federal Home Loan Banks (FHLB), and the Federal Farm Credit Bureau (FFCB). [ORS 294.035(3)(a)]
Commercial Paper Commercial Paper* that is rated A1+/P1 and has long term bonds which have a minimum rating of AA‐ by Standard and Poor’s and Aa3 by Moody’s. In the case where both rating agencies provide ratings on the corporation, the lowest rating will be used.
Corporate Indebtedness Corporate indebtedness must be rated on the settlement date Aa3 or better by Moody’s Investors Service or AA‐ or better by S&P [ORS Section 294.035 (3) (B)]. In the case of a split rating, the lower rating will be used.
Local Government Investment Pool
State Treasurer’s local short‐term investment fund up to the statutory limit per ORS Section 294.810.
Oregon Intermediate Fund The Oregon Local Government Intermediate Fund (OLGIF) is a commingled investment pool for local governments offered by Oregon State Treasury due to Legislation HB2140 and pursuant to ORS Chapter 294. OLGIF provides qualified local government participants with a vehicle to invest assets over
69

an intermediate time horizon (three to five years).
Certificates of Deposit Certificates of deposit in insured institutions as defined in ORS Section 706.008, in credit unions as defined in ORS Section 723.006, or in federal credit unions, if the institution or credit union maintains a head office or a branch in this state [ORS Section 294.035(3)(d)].
Bank Time Deposit/Savings Account
Time deposit open accounts or savings accounts in insured institutions as defined in ORS Section 706.008, in credit unions as defined in ORS Section 723.006 or in federal credit unions, if the institution or credit union maintains a head office or a branch in this state [ORS Section 294.035(3)(d)].
Municipal Debt Lawfully insured debt obligations of the States of Oregon, California, Idaho, and Washington and political subdivisions of those states if the obligations have a long‐term rating on the settlement date of AA‐ or better by S&P or Aa3 or better by Moody’s. In the case of a split rating, the lower rating of these two rating agencies will be used.
Bankers’ Acceptance A short‐term credit investment created by a non‐financial firm and guaranteed by a qualified financial institution* whose long‐term letter of credit rating is at least AA‐ by Standard and Poor’s or Aa3 by Moody’s at the time of purchase. [ORS 294.035(3)(h)(A)] *For the purposes of this paragraph, “qualified financial institution” means: (i) A financial institution that is located and licensed to do banking business in the State of Oregon; or (ii) A financial institution that is wholly owned by a financial holding company or a bank holding company that owns a financial institution that is located and licensed to do banking business in the State of Oregon [ORS Section 294.035(3)(h)].
3. Collateralization
Time deposit open accounts, Certificates of Deposit and savings accounts shall be collateralized through the Public Funds Collateralization Program in accordance with ORS Section 295.018. All depositories must be on the State of Oregon's qualified list. Additional collateral requirements may be required if the Investment Officer deems increased collateral is beneficial to the protection of the monies under the City's management.
70

IX. INVESTMENT PARAMETERS 1. Diversification
The City will diversify the investment portfolio to avoid incurring unreasonable risks, both credit and interest rate risk, inherent in over investing in specific instruments, individual financial institutions or maturities.
DIVERSIFICATION CONSTRAINTS ON TOTAL HOLDINGS: LIQUIDITY AND CORE FUNDS*
Issuer Type
Maximum % Holdings
Maximum % Per Issuer
Ratings S&P
Ratings Moody’s
US Treasury Obligations 100% None N/A N/A
US Agency Primary Securities FHLB, FNMA, FHLMC, FFCB
100% 33% N/A N/A
US Agency Secondary Securities FICO, FARMER MAC etc.
10% 10% Must be rated
Must be rated
Oregon Short Term Fund ORS 294.810 Limit
None N/A N/A
Oregon Intermediate Fund 10% None N/A N/A
Bank Time Deposits/Savings Accounts
20% 10% OR Public Depository
OR Public Depository
Certificates of Deposit 10% 5% OR Public Depository
OR Public Depository
Corporate Bonds 20% 5% AA‐ Aa3
Municipal Bonds (OR, CA, ID, WA)
10% 5% AA‐ Aa3
Commercial Paper 10% 5% A1+ P1
Banker’s Acceptance 10% 5% A1+ AA‐ Long Term
P1 Aa3 Long Term
Local Government Investment Pool
ORS 294.810 Limit
2. Investment Maturity
The City will not directly invest in securities maturing more than five (5) years from the date of purchase. a. The maximum weighted maturity of the total portfolio shall not exceed 1.5 years. This
maximum is established to limit the portfolio to excessive price change exposure. b. Liquidity funds will be held in the State Pool or in money market instruments maturing six
months and shorter. The liquidity portfolio shall, at a minimum, represent three months budgeted outflows.
c. Core funds will be the defined as the funds in excess of liquidity requirements. The investments in this portion of the portfolio will have maturities between 1 day and 5 years and will be only invested in high quality and liquid securities.
71

Total Portfolio Maturity Constraints:
Maturity Constraints Minimum % of Total Portfolio
Under 30 days 10%
Under 1 year 25%
Under 5 years 100%
WAM ( Weighted Average Maturity) 2 years
Security Structure Constraint Maximum % of Total Portfolio
Callable Agency Securities 25%
Reserve or Capital Improvement Project monies may be invested in securities exceeding five (5) years if the maturities of such investments are made to coincide as nearly as practicable with the expected use of the funds
3. Prohibited Investments
The City shall not lend securities nor directly participate in a securities lending or reverse repurchase program. The purchase of derivatives and use of reverse repurchase agreements are specifically prohibited by this policy. The City shall not purchase mortgage‐backed securities.
X. POLICY COMPLIANCE AND PERFORMANCE EVALUATION 1. Compliance Report
A compliance report shall be maintained quarterly to document the portfolio versus the investment policy.
2. Compliance Measurement and Adherence a. Compliance Measurement: Guideline measurements will use [par/market] value of
investments. b. Compliance Procedures: If the portfolio falls outside of compliance with adopted
investment policy guidelines or is being managed inconsistently with this policy, the Investment Officer shall bring the portfolio back into compliance in a prudent manner and as soon as prudently feasible.
c. Violations of portfolio guidelines as a result of transactions; actions to bring the portfolio back into compliance and; reasoning for actions taken to bring the portfolio back into compliance shall be documented and reported to the City Council.
d. Due to fluctuations in the aggregate surplus funds balance, maximum percentages for a particular issuer or investment type may be exceeded at a point in time. Securities need not be liquidated to realign the portfolio; however, consideration should be given to this matter when future purchases are made to ensure that appropriate diversification is maintained.
e. As determined on any date that the security is held within the portfolio. If the credit rating of a security is subsequently downgraded below the minimum rating level for a new investment of that security, the Investment Officer shall evaluate the downgrade on a case‐by‐case basis in order to determine if the security should be held or sold. The Investment Officer will apply the general objectives of Safety, Liquidity, Yield, and Legality to make the decision. If the City has hired the services of an Investment Adviser, the Investment Officer will act on the recommendation of the Adviser.
72

3. Performance Measurement The performance of the City of Albany will be measured against the performance of the Local Government Investment Pool, using monthly net yield of both portfolios as the yardstick. Preservation of capital and maintenance of sufficient liquidity will be considered prior to attainment of market return performance. Given these considerations, the City's portfolio should provide a net yield that is equal or better to that attained by the Local Government Investment Pool over interest rate cycles. Additionally, a market benchmark will be determined that is appropriate for longer term investments based on the City's risk and return profile. The investment adviser will provide return comparisons of the portfolio to the benchmark on a monthly basis. When comparing the performance of the City's portfolio, all fees and expenses involved with managing the portfolio shall be included in the computation of the portfolio's rate of return. This would include any in‐house management of the funds, as well as outside management.
XI. REPORTING REQUIREMENTS
The Investment Officer shall submit quarterly and annual reports to the local governing board containing sufficient information to permit an informed outside reader to evaluate the performance of the investment program. More frequent reports may be provided when market conditions merit or if requested by the governing board. Minimum quarterly reporting requirements for total portfolio:
Earnings Yield
Holdings Report (including mark to market)
Transactions Report
Weighted Average Maturity or Duration
Compliance Report XII. INVESTMENT POLICY ADOPTION BY GOVERNING BOARD This investment policy will be formally adopted by the Albany City Council. The policy shall be reviewed on an annual basis by the Investment Officer and the Albany City Council. Material revisions to this policy will require a review by the Oregon Short Term Fund Board, pursuant to ORS.
Supersedes: Res No. 6459
Created/Amended by/date:November 7, 2016
Effective Date:November 9, 2016
Reviewed by Council:November 7, 2016
73


City of Albany
Finance Policy Policy #: F-08-08-005 Title: Risk Management
I. POLICY STATEMENT It is the policy of the City of Albany to proactively identify and manage the inherent risks of providing municipal services. Potential losses will be mitigated through employee safety committees, loss prevention programs, property and liability insurances, workers’ compensation, and employee health, life, and disability benefits.
II. GENERAL RESPONSIBILITIES
Each employee of the City is responsible to contribute to a safe environment for all employees and the public. Employees should help identify and correct unsafe conditions and should follow all established safety laws, policies, and practices. The City Manager and department directors are responsible to protect the City of Albany’s assets by identifying and managing risks. Primary objectives include containing costs, minimizing accidents and injuries to employees and the public, reducing the frequency and severity of property loss, and promoting a healthy employee workforce and working environment. Department directors are responsible for managing the risks of operations in their respective departments. They ensure that effective safety and loss prevention programs are implemented and oversee the investigation of claims and losses. Department directors coordinate their efforts with the Senior Accountant who acts as the City’s Risk Manager. The Risk Manager is responsible for facilitating claims processing and working closely with third party property and liability insurers. The City Manager may choose to retain professional advisors, consultants, insurers, brokers, and agents of record to assist the City in placing appropriate insurances and developing effective safety and loss prevention programs. III. SPECIFIC RESPONSIBILITIES
1. Human Resources Director. a. Coordinate and promote city-wide safety awareness and employee wellness
programs. b. Manage the City’s worker’s compensation and health insurance programs to
contain costs and promote safety and wellness for employees and their families.
2. Finance Director. a. Recommend appropriate levels of property and general liability insurance to the
City Manager and City Council. b. Coordinate periodic inventories of all property, buildings, equipment, vehicles,
and other capital assets and verify that appropriate insurance is in place. c. Maintain policies, bonds, and other legal documentation of insurance.
74

d. Provide an annual report to the City Council showing claims experience and the costs of insurance programs.
3. Fire Chief.
a. Conduct fire and life safety inspections of City facilities on a periodic basis according to the level of risk in each facility.
b. Verify that all facilities are in compliance with recognized fire code standards for fire and life safety.
4. City Attorney.
a. Develop templates of contracts and leases which include language to identify and mitigate liability and other potential losses.
b. Notify the City Manager of changes in state statutes and common law that affect municipal liability.
c. Assist insurers in the investigation and settlement of claims against the City. d. Review insurance and bond contracts.
IV. RETAINING AND TRANSFERING RISK
1. Reserve Account. A Risk Management Fund will be maintained with a working balance of up to $2,000,000 for unforeseen catastrophic events and major deductibles. Each department will be responsible for claims and deductibles up to $10,000 per incident resulting from losses in their respective operations.
2. Insurance Coverages. The following minimum policy limits and deductibles will be maintained:
Property/Boiler & Machinery Limit: Determined each year by the filed value of insured property.
Deductibles: Buildings/Contents $10,000 Boiler & Machinery $10,000 Mobile Equipment $10,000 Earthquake 3% of value
$100,000 min Limit $25,000,000
Flood $100,000 Limit $10,000,000
Tort Liability Limit: $5,000,000
Auto Liability Limit: $5,000,000
Auto Physical Damage Deductibles: Comprehensive $100
Collision $500
Senior Center Trips Limit: $5,250
3. Self Insurance. The City shall self-insure to the extent it is more cost effective than commercial insurance and does not present unacceptable financial or other risks to the City.
75

V. ALLOCATION OF INSURANCE COSTS
Departments and programs that have dedicated revenue sources or are independent legal entities will be charged insurance costs specific to the risk exposures of the operations of those departments and programs. Premiums and related costs for liability insurance, workers’ compensation, and property insurance will be allocated to each department based on claims experience and risk exposure. Property insurance costs are allocated according to the specific properties used and operated by each department or program. VI. CONFIDENTIALITY OF RECORDS
All personally identifiable and confidential information will be maintained in compliance with the Identity Theft Protection Policy, Finance Policy Number F-04-08. All employee medical records and long-term disability claims held by the City will be maintained in separate locked files and access will be controlled through the City Manager and Human Resources Departments.
All police reports will be kept confidential unless the Albany Police Department and/or the City Attorney approve release.
VII. REPORTING PROPERTY/CASUALTY ACCIDENTS AND LOSSES
1. Accidents and losses must be reported promptly and in accordance with prescribed
procedures. The benefits of timely reporting include enhanced citizen confidence, better protection of the City’s interests, reduced time lost for employees and equipment, and savings realized through prompt settlements. Reports of general liability claims and automobile accidents should be immediately reported to the Risk Manager. The following information should be included in every report: a. Date, time, and location of accident or event b. Description of vehicle, equipment, or property involved c. Name(s) of person(s) involved d. Name(s) of person(s) injured e. Description of any medical attention received f. Nature of damage/loss and estimated cost g. Description of circumstances; diagram of events if possible h. Insurance Policy Numbers, Agents, and/or Agencies i. Name(s) and addresses of witnesses j. Appropriate signatures k. Copy of DMV report, if filed l. Copy of police report, if filed In addition, procedures described in Human Resources Policy HR-SF-02-001 (Property Loss/Damage) must be followed.
2. The Risk Manager will process all accident/loss notices, except workers’ compensation, and will notify the appropriate insurance company.
3. The Human Resources Department will file workers’ compensation accident reports with the appropriate insurance company. Workers’ compensation incidents will be
76

processed in accordance with Human Resources Policy HR-SF-03-001 (Reporting On-the-Job Injuries).
4. Accidents of a serious nature and those occurring on weekends or holidays should be called in to the appropriate supervisor and followed up with the proper accident forms and information. The Risk Manager should be notified of the accident on the first day back to work.
5. As required by law, on-the-job injuries to employees that result in overnight hospitalization for treatment (not just observation), must be reported to OR-OSHA within twenty-four (24) hours of the injury. An on-the-job accident that results in the hospitalization of three or more employees, or in a fatality, must be reported to OR-OSHA within eight (8) hours of the accident. In either of these situations, the Human Resources Generalist or Human Resources Director should be notified immediately so they may make notification to OR-OSHA.
VIII. REPORTS TO BE FILED
1. All Property/Casualty claims reports will be filed with the Risk Manager.
2. Minutes of City Council meetings, safety meetings, and all other City committee meetings in which Risk Management policy or procedure decisions are made will be filed as appropriate.
3. Inspection reports when the building inspector or Fire Department inspects City premises will be filed with the Risk Manager or the Fire Department.
4. Long-term disability and life insurance claims and workers’ compensation claims and reports will be filed with the Human Resources Department.
IX. RISK MANAGER RECORDS The Risk Manager shall keep the following records:
1. An inventory of current locations, descriptions, and insurable values of all property/vehicles owned or leased by the City.
2. An insurance register, outlining all coverages in force and including premiums, policy numbers, servicing agents, terms of coverage, and expiration dates.
3. Premium payment and allocation records.
4. Claims filed and pending.
5. Loss records subdivided into property, liability, and other liability claims paid by the insurer under existing insurance policies.
6. Claim recoveries received from third parties who have damaged City property or who are reimbursing for City wages paid.
Supersedes: Res No. 6460
Created/Amended by/date: November 7, 2016
Effective Date: November 9, 2016
Reviewed by Council: November 7, 2016
77

FINANCIAL SUMMARIES


Table 1
SUMMARY OF RESOURCES AND REQUIREMENTS BY FUND TYPE AND CATEGORYAdopted for Fiscal Year 2017-18
Special Debt Capital InternalFund/Program General Revenue Service Projects Permanent Enterprise Service Totals______________________________________________________________________________________________________________________________RESOURCESProperty taxes 18,694,100$ 8,082,400 1,071,500$ -$ -$ -$ -$ 27,848,000$ Transient room taxes - 1,237,400 - - - - - 1,237,400 Franchise fees/privilege taxes 5,139,000 - - - - - - 5,139,000 Licenses & fees 318,100 2,378,400 - - - 1,301,800 - 3,998,300 Intergovernmental resources 3,497,500 7,669,000 - - - 796,900 - 11,963,400 Charges for service 3,309,200 2,972,000 675,000 - - 30,247,200 14,945,200 52,148,600 Fines & forfeitures 636,100 - - - - - - 636,100 Assessment payments - - - 85,000 - - - 85,000 Other resources 88,400 1,365,100 - - - 248,000 40,000 1,741,500 Investment earnings 18,000 137,500 3,100 10,000 700 178,200 6,900 354,400 ______________________________________________________________________________________________________________________________Total Current Resources 31,700,400 23,841,800 1,749,600 95,000 700 32,772,100 14,992,100 105,151,700 ______________________________________________________________________________________________________________________________Transfers in 3,625,200 3,316,100 180,400 1,002,000 - 1,906,000 17,100 10,046,800 Beginning balance 3,583,500 22,005,300 106,700 13,675,000 56,500 32,284,700 312,100 72,023,800 Reserved beginning balance - 52,500 188,600 - - 1,602,000 - 1,843,100 Beginning balance held in trust - - - - 79,500 - - 79,500 ______________________________________________________________________________________________________________________________TOTAL RESOURCES 38,909,100$ 49,215,700$ 2,225,300$ 14,772,000$ 136,700$ 68,564,800$ 15,321,300$ 189,144,900$ ____________________________________________________________________________________________________________________________________________________________________________________________________________________________________________________________
REQUIREMENTSPersonnel 28,964,300$ 6,533,900$ -$ -$ -$ 4,927,400$ 11,512,600$ 51,938,200$ Materials & Services 7,329,100 14,529,700 1,700 100,000 4,800 14,270,200 3,808,700 40,044,200 Capital 128,000 21,901,700 - 14,638,700 - 31,664,000 - 68,332,400 Transfers Out 882,900 5,671,300 - 33,300 52,400 3,146,900 - 9,786,800 Debt Service - - 2,223,600 - - 12,549,200 - 14,772,800 Contingency 1,604,800 579,100 - - - 2,007,100 - 4,191,000 Unappropriated - - - - 79,500 - - 79,500 ______________________________________________________________________________________________________________________________TOTAL REQUIREMENTS 38,909,100$ 49,215,700$ 2,225,300$ 14,772,000$ 136,700$ 68,564,800$ 15,321,300$ 189,144,900$ ____________________________________________________________________________________________________________________________________________________________________________________________________________________________________________________________
SELECTED FINANCIAL RATIOS
Special Debt Capital InternalFund/Ratio Description General Revenue Service Projects Permanent Enterprise Service Totals______________________________________________________________________________________________________________________________Property taxes as a percentage of the total fund type budget. 48.05% 16.42% 48.15% - - - - 14.72%______________________________________________________________________________________________________________________________Current resources as a percentage of Personnel and Materials & Services. 87.34% 113.19% - - 14.58% 170.71% 97.85% 114.32%______________________________________________________________________________________________________________________________Personnel as a percentage of the total fund type budget. 74.44% 13.28% - - - 7.19% 75.14% 27.46%______________________________________________________________________________________________________________________________Personnel and Materials & Services as a percentage of the totalfund type budget. 93.28% 42.80% 0.08% 0.68% 3.51% 28.00% 100.00% 48.63%______________________________________________________________________________________________________________________________Capital as a percentage of the total fund budget. 0.33% 44.50% - 99.10% - 46.18% - 36.13%______________________________________________________________________________________________________________________________
78

Table 2
SUMMARY OF MAJOR RESOURCES BY FUND TYPEAdopted Budget for Fiscal Year 2017-18
……2016-17…… Adopted % Change Percent of2014-15 2015-16 Adopted Revised 2017-18 from Fund Type
Fund type/Fund name Actual Actual Budget Budget Budget 2016-17 Budget____________________________________________________________________________________________________________________GENERAL FUNDProperty taxes 17,068,822$ 17,726,277$ 18,281,400$ 18,281,400$ 18,694,100$ 2.26% 48.04%Franchise fees/privilege taxes 4,138,028 4,882,455 5,000,900 5,000,900 5,139,000 2.76% 13.21%Licenses & fees 333,662 319,107 362,100 362,100 318,100 (12.15%) 0.82%Intergovernmental resources 2,949,436 3,210,629 3,240,400 3,240,400 3,497,500 7.93% 8.99%Charges for service 2,700,634 2,856,110 2,674,800 2,674,800 3,309,200 23.72% 8.50%Fines & forfeitures 713,592 718,892 671,500 671,500 636,100 (5.27%) 1.63%Other resources 95,750 106,705 105,500 105,500 88,400 (16.21%) 0.23%Investment earnings 21,345 16,807 25,500 25,500 18,000 (29.41%) 0.05%____________________________________________________________________________________________________________________Total Current Resources 28,021,269 29,836,982 30,362,100 30,362,100 31,700,400 4.41% 81.47%____________________________________________________________________________________________________________________Transfers in 2,970,400 2,805,200 3,395,500 3,395,500 3,625,200 6.76% 9.32%Beginning balance 2,065,529 2,681,904 2,870,100 2,990,300 3,583,500 19.84% 9.21%Reserved beginning balance - - - - - - - ____________________________________________________________________________________________________________________Total General Fund 33,057,198 35,324,086 36,627,700 36,747,900 38,909,100 5.88% 100.00%____________________________________________________________________________________________________________________
SPECIAL REVENUE FUNDSProperty taxes 6,712,275 7,182,178 7,698,600 7,698,600 8,082,400 4.99% 16.43%Transient room taxes 927,172 1,058,892 1,104,300 1,104,300 1,237,400 12.05% 2.51%Licenses & fees 3,081,098 3,030,720 2,291,600 2,291,600 2,378,400 3.79% 4.83%Intergovernmental resources 6,361,102 5,902,551 6,238,300 6,238,300 7,669,000 22.93% 15.58%Charges for service 2,093,851 2,120,041 2,065,600 2,065,600 2,972,000 43.88% 6.04%Other resources 567,734 2,622,873 406,100 406,100 1,365,100 236.15% 2.77%Investment earnings 148,495 215,041 132,000 132,000 137,500 4.17% 0.28%Investment earnings 148,495 215,041 132,000 132,000 137,500 4.17% 0.28%____________________________________________________________________________________________________________________Total Current Resources 19,891,727 22,132,296 19,936,500 19,936,500 23,841,800 19.59% 48.44%____________________________________________________________________________________________________________________Transfers in 3,528,044 2,993,554 3,133,900 3,133,900 3,316,100 5.81% 6.74%Beginning balance 28,139,552 25,267,450 20,051,600 20,051,600 22,005,300 9.74% 44.71%Reserved beginning balance 279,918 281,902 118,700 118,700 52,500 (55.77%) 0.11%____________________________________________________________________________________________________________________Total Special Revenue Funds 51,839,241 50,675,202 43,240,700 43,240,700 49,215,700 13.82% 100.00%____________________________________________________________________________________________________________________
DEBT SERVICE FUNDProperty taxes 1,237,003 1,021,280 1,008,100 1,008,100 1,071,500 6.29% 48.15%Charges for service 454,000 615,300 645,900 645,900 675,000 4.51% 30.33%Investment earnings 4,632 26,596 2,800 2,800 3,100 10.71% 0.14%____________________________________________________________________________________________________________________Total Current Resources 1,695,635 1,663,176 1,656,800 1,656,800 1,749,600 5.60% 78.62%____________________________________________________________________________________________________________________Transfers in 180,100 180,304 183,300 183,300 180,400 (1.58%) 8.11%Beginning balance 439,831 161,727 - - 106,700 - 4.79%Reserved beginning balance - - 185,000 185,000 188,600 1.95% 8.48%____________________________________________________________________________________________________________________Total Debt Service Fund 2,315,566 2,005,207 2,025,100 2,025,100 2,225,300 9.89% 100.00%____________________________________________________________________________________________________________________
CAPITAL PROJECT FUNDIntergovernmental resources 320 - - - - - - Assessment payments 848,354 527,492 50,800 50,800 85,000 67.32% 0.58%Other resources 55 18,636,761 - - - - - Investment earnings 5,176 154,732 32,500 32,500 10,000 (69.23%) 0.07%____________________________________________________________________________________________________________________Total Current Resources 853,905 19,318,985 83,300 83,300 95,000 14.05% 0.65%____________________________________________________________________________________________________________________Transfers in - 6,455,000 790,800 790,800 1,002,000 26.71% 6.78%Beginning balance 765,461 892,338 24,770,300 24,770,300 13,675,000 (44.79%) 92.57%____________________________________________________________________________________________________________________Total Capital Project Fund 1,619,366 26,666,323 25,644,400 25,644,400 14,772,000 (42.40%) 100.00%____________________________________________________________________________________________________________________
continued
79

Table 2
SUMMARY OF MAJOR RESOURCES BY FUND TYPE, continuedAdopted Budget for Fiscal Year 2017-18
……2016-17…… Adopted % Change Percent of2014-15 2015-16 Adopted Revised 2017-18 from Fund Type
Fund type/Fund name Actual Actual Budget Budget Budget 2016-17 Budget____________________________________________________________________________________________________________________PERMANENT FUNDSOther resources 103$ 25$ 100$ 100$ -$ (1)$ - Investment earnings 706 905 600 600 700 16.67% 0.51%____________________________________________________________________________________________________________________Total Current Resources 809 930 700 700 700 - 0.51%____________________________________________________________________________________________________________________Beginning balance 51,259 51,627 55,800 55,800 56,500 1.25% 41.33%Beginning balance held in trust 84,036 83,485 79,500 79,500 79,500 - 58.16%____________________________________________________________________________________________________________________Total Permanent Funds 136,104 136,042 136,000 136,000 136,700 0.51% 100.00%____________________________________________________________________________________________________________________
ENTERPRISE FUNDSProperty taxes 3,588 263 - - - - - Licenses & fees 1,769,422 1,486,176 1,014,500 1,014,500 1,301,800 28.32% 1.90%Intergovernmental resources 483,711 497,022 1,048,200 1,048,200 796,900 (23.97%) 1.16%Charges for service 27,538,349 29,565,492 29,717,100 29,717,100 30,247,200 1.78% 44.11%Assessment payments 19,141 - 5,100 5,100 - (100.00%) - Other resources 319,314 308,386 365,200 365,200 248,000 (32.09%) 0.36%Investment earnings 173,421 314,179 159,400 159,400 178,200 11.79% 0.26%____________________________________________________________________________________________________________________Total Current Resources 30,306,946 32,171,518 32,309,500 32,309,500 32,772,100 1.43% 47.79%____________________________________________________________________________________________________________________Transfers in 499,952 1,129,400 2,746,100 2,746,100 1,906,000 (30.59%) 2.78%Beginning balance 29,453,736 33,007,992 30,352,100 30,352,100 32,284,700 6.37% 47.09%Reserved beginning balance 1,621,904 1,632,354 1,607,400 1,607,400 1,602,000 (0.34%) 2.34%____________________________________________________________________________________________________________________Total Enterprise Funds 61,882,538 67,941,264 67,015,100 67,015,100 68,564,800 2.31% 100.00%____________________________________________________________________________________________________________________
INTERNAL SERVICE FUNDSCharges for service 12,333,465 12,988,402 14,754,100 14,754,100 14,945,200 1.30% 97.54%Other resources 50,071 66,835 40,000 40,000 40,000 - 0.26%Investment earnings 4,616 11,064 1,000 1,000 6,900 590.00% 0.05%____________________________________________________________________________________________________________________Total Current Resources 12,388,152 13,066,301 14,795,100 14,795,100 14,992,100 1.33% 97.85%____________________________________________________________________________________________________________________Transfers in - - - - 17,100 - 0.11%Beginning balance 922,187 670,553 150,800 150,800 312,100 106.96% 2.04%____________________________________________________________________________________________________________________Total Internal Service Funds 13,310,339 13,736,854 14,945,900 14,945,900 15,321,300 2.51% 100.00%________________________________________________________________________________________________________________________________________________________________________________________________________________________________________
ALL FUNDSProperty taxes 25,021,688 25,929,999 26,988,100 26,988,100 27,848,000 3.19% 14.73%Transient room taxes 927,172 1,058,892 1,104,300 1,104,300 1,237,400 12.05% 0.65%Franchise fees/privilege taxes 4,138,028 4,882,455 5,000,900 5,000,900 5,139,000 2.76% 2.72%Licenses & fees 5,184,182 4,836,003 3,668,200 3,668,200 3,998,300 9.00% 2.11%Intergovernmental resources 9,794,569 9,610,380 10,526,900 10,526,900 11,963,400 13.65% 6.32%Charges for service 45,120,299 48,145,345 49,857,500 49,857,500 52,148,600 4.60% 27.58%Fines & forfeitures 713,592 718,892 671,500 671,500 636,100 (5.27%) 0.34%Assessment payments 868,105 527,492 55,900 55,900 85,000 52.06% 0.04%Other resources 1,033,027 21,741,586 916,900 916,900 1,741,500 89.93% 0.92%Investment earnings 358,390 739,324 353,800 353,800 354,400 0.17% 0.19%____________________________________________________________________________________________________________________Total Current Resources 93,159,052 118,190,368 99,144,000 99,144,000 105,151,700 6.06% 55.60%____________________________________________________________________________________________________________________Transfers in 7,178,496 13,563,458 10,249,600 10,249,600 10,046,800 (1.98%) 5.31%Beginning balance 61,837,555 62,733,592 78,250,700 78,370,900 72,023,800 (8.10%) 38.08%Reserved beginning balance 1,901,822 1,914,256 1,911,100 1,911,100 1,843,100 (3.56%) 0.97%Beginning balance held in trust 84,036 83,485 79,500 79,500 79,500 - 0.04%____________________________________________________________________________________________________________________TOTALS, ALL FUNDS 164,160,961$ 196,485,159$ 189,634,900$ 189,755,100$ 189,144,900$ (0.32%) 100.00%________________________________________________________________________________________________________________________________________________________________________________________________________________________________________
80

Table 3
ADOPTED BUDGET BY FUND TYPE AND REQUIREMENT TYPEAdopted Budget for Fiscal Year 2017-18
2017-18 % Change % of Fund2014-15 2015-16 Adopted Revised Adopted from Type
Fund type/Requirement type Actual Actual Budget Budget Budget 2016-17 Budget_________________________________________________________________________________________________________________GENERAL FUNDPersonnel 23,632,707$ 25,235,381$ 27,438,300$ 27,438,300$ 28,964,300$ 5.56% 74.44%Materials & Services 5,949,917 5,919,804 6,872,400 6,872,400 7,329,100 6.65% 18.84%Capital 25,888 5,200 18,500 138,700 128,000 (7.71%) 0.33%Transfers Out 696,497 882,712 783,600 783,600 882,900 12.67% 2.27%Contingency - - 1,514,900 1,514,900 1,604,800 5.93% 4.12%_________________________________________________________________________________________________________________Total General Fund 30,305,009 32,043,097 36,627,700 36,747,900 38,909,100 5.88% 100.00%_________________________________________________________________________________________________________________
SPECIAL REVENUE FUNDSPersonnel 5,555,077 5,662,984 6,398,300 6,398,300 6,533,900 2.12% 13.28%Materials & Services 8,815,728 9,098,331 13,847,800 13,847,800 14,529,700 4.92% 29.52%Capital 7,773,569 6,348,983 17,276,300 17,276,300 21,901,700 26.77% 44.50%Transfers Out 4,106,062 8,573,664 5,369,600 5,369,600 5,671,300 5.62% 11.52%Debt Service 39,908 38,184 - - - - - Contingency - - 348,700 348,700 579,100 66.07% 1.18%_________________________________________________________________________________________________________________Total Special Revenue Funds 26,290,344 29,722,146 43,240,700 43,240,700 49,215,700 13.82% 100.00%_________________________________________________________________________________________________________________
DEBT SERVICE FUNDMaterials & Services 750 1,600 2,300 2,300 1,700 (26.09%) 0.08%Debt Service 2,153,090 1,727,420 2,022,800 2,022,800 2,223,600 9.93% 99.92%_________________________________________________________________________________________________________________Total Debt Service Fund 2,153,840 1,729,020 2,025,100 2,025,100 2,225,300 9.89% 100.00%_________________________________________________________________________________________________________________
CAPITAL PROJECT FUND
………2016-17………
CAPITAL PROJECT FUNDMaterials & Services 41,472 2,057,050 - - 100,000 - 0.68%Capital 40,523 92,063 25,611,100 25,611,100 14,638,700 (42.84%) 99.09%Transfers Out 645,032 196,877 33,300 33,300 33,300 - 0.23%_________________________________________________________________________________________________________________Total Capital Project Fund 727,027 2,345,990 25,644,400 25,644,400 14,772,000 (42.40%) 100.00%_________________________________________________________________________________________________________________
PERMANENT FUNDSMaterials & Services 992 1,366 4,700 4,700 4,800 2.13% 3.51%Transfers Out - - - - 52,400 - 38.33%Unappropriated - - 131,300 131,300 79,500 (39.45%) 58.16%_________________________________________________________________________________________________________________Total Permanent Funds 992 1,366 136,000 136,000 136,700 0.51% 100.00%_________________________________________________________________________________________________________________
ENTERPRISE FUNDSPersonnel 4,272,158 4,593,445 5,134,700 5,134,700 4,927,400 (4.04%) 7.19%Materials & Services 11,408,316 12,823,839 14,072,600 14,072,600 14,270,200 1.40% 20.81%Capital 2,555,291 7,126,979 29,467,400 29,467,400 31,664,000 7.45% 46.18%Transfers Out 1,583,405 2,325,505 3,803,200 3,803,200 3,146,900 (17.26%) 4.59%Debt Service 7,423,020 7,561,583 12,546,900 12,546,900 12,549,200 0.02% 18.30%Contingency - - 1,990,300 1,990,300 2,007,100 0.84% 2.93%_________________________________________________________________________________________________________________Total Enterprise Funds 27,242,190 34,431,351 67,015,100 67,015,100 68,564,800 2.31% 100.00%_________________________________________________________________________________________________________________
continued
81

Table 3
ADOPTED BUDGET BY FUND TYPE AND REQUIREMENT TYPE, continuedAdopted Budget for Fiscal Year 2017-18
2017-18 % Change % of Fund2014-15 2015-16 Adopted Revised Adopted from Type
Fund type/Requirement type Actual Actual Budget Budget Budget 2016-17 Budget_________________________________________________________________________________________________________________
INTERNAL SERVICE FUNDSPersonnel 9,495,535$ 9,940,931$ 11,171,500$ 11,171,500$ 11,512,600$ 3.05% 75.14%Materials & Services 3,143,628 3,430,638 3,774,400 3,774,400 3,808,700 0.91% 24.86%_________________________________________________________________________________________________________________Total Internal Service Funds 12,639,163 13,371,569 14,945,900 14,945,900 15,321,300 2.51% 100.00%_________________________________________________________________________________________________________________Total All Fund Types 99,358,565$ 113,644,539$ 189,634,900$ 189,755,100$ 189,144,900$ (0.32%)____________________________________________________________________________________________________________________________________________________________________________________________________________
ALL FUND TYPESPersonnel 42,955,477$ 45,432,741$ 50,142,800$ 50,142,800$ 51,938,200$ 3.58% 27.46%Materials & Services 29,360,805 33,332,628 38,574,200 38,574,200 40,044,200 3.81% 21.17%Capital 10,395,270 13,573,225 72,373,300 72,493,500 68,332,400 (5.74%) 36.13%Transfers Out 7,030,996 11,978,758 9,989,700 9,989,700 9,786,800 (2.03%) 5.17%Debt Service 9,616,017 9,327,187 14,569,700 14,569,700 14,772,800 1.39% 7.81%Contingency - - 3,853,900 3,853,900 4,191,000 8.75% 2.22%Unappropriated - - 131,300 131,300 79,500 (39.45%) 0.04%_________________________________________________________________________________________________________________Total All Fund Types 99,358,565$ 113,644,539$ 189,634,900$ 189,755,100$ 189,144,900$ (0.32%) 100.00%__________________________________________________________________________________________________________________________________________________________________________________________________________________________________
2017-18 Adopted Budget by Requirement Type
………2016-17………
Personnel, 27.46%
Materials & Services, 21.17% Capital, 36.13%
Transfers Out, 5.17%
Debt Service, 7.81%
Contingency, 2.22% Unappropriated, 0.04%
82

Table 4
BUDGET BY FUND AND REQUIREMENT TYPEAdopted Budget for Fiscal Year 2017-18
……….RESOURCES………Beginning Total
Fund Balance Resources ResourcesGENERAL FUND 3,583,500$ 35,325,600$ 38,909,100$
SPECIAL REVENUE FUNDSParks & Recreation 2,602,400 6,842,700 9,445,100Grants 183,400 1,511,600 1,695,000Building 1,415,900 1,474,900 2,890,800Risk Management 3,032,700 59,300 3,092,000Economic Development 678,300 1,631,200 2,309,500Public Transit 223,000 3,116,700 3,339,700Public Safety Levy 3,800 3,460,800 3,464,600Capital Replacement 6,142,600 2,295,100 8,437,700Streets 7,775,700 6,765,600 14,541,300Total Special Revenue Funds 22,057,800 27,157,900 49,215,700
DEBT SERVICE FUNDDebt Service 188,600 857,600 1,046,200General Obligation Debt Service 106,700 1,072,400 1,179,100Total Debt Service Fund 295,300 1,930,000 2,225,300
CAPITAL PROJECT FUNDCapital Projects 13,675,000 1,097,000 14,772,000Total Capital Project Fund 13,675,000 1,097,000 14,772,000
PERMANENT FUNDSSenior Center Endowment 52,400 - 52,400Library Trust 83,600 700 84,300Total Permanent Funds 136,000 700 136,700
ENTERPRISE FUNDSSewer 21,001,500 18,833,600 39,835,100Water 12,586,900 13,951,700 26,538,600Stormwater 298,300 1,892,800 2,191,100Total Enterprise Funds 33,886,700 34,678,100 68,564,800
INTERNAL SERVICE FUNDSCentral Services 248,500 6,423,800 6,672,300Public Works Central Services 63,600 8,585,400 8,649,000Total Internal Service Funds 312,100 15,009,200 15,321,300 ADOPTED BUDGET FOR 2017-18 73,946,400$ 115,198,500$ 189,144,900$ Percent change from 2016-17 -7.98% 5.31% -0.32%Percent of 2017-18 budget 39.10% 60.90% 100.00%REVISED BUDGET FOR 2016-17 80,361,500$ 109,393,600$ 189,755,100$ Percent of 2016-17 budget 42.35% 57.65% 100.00%
Table 4 summarizes resources and requirements by fund. The revised budget amounts for 2016-17 are presented forcomparison purposes. Also included are the percentage of total budget and percentage change from the previous fiscal year.
83

……………………………………………REQUIREMENTS……………………………………………Materials Capital Transfers Debt Contin- Unappro- Total
Personnel & Services Projects Out Service gency priated Requirements28,964,300$ 7,329,100$ 128,000$ 882,900$ -$ 1,604,800$ -$ 38,909,100$
3,124,600 3,957,500 1,872,600 290,400 - 200,000 - 9,445,100 173,500 788,100 733,400 - - - - 1,695,000 934,600 1,896,200 - 60,000 - - - 2,890,800
- 2,905,400 186,600 - - - - 3,092,000 202,600 936,300 520,700 649,900 - - - 2,309,500
1,265,800 1,102,600 971,300 - - - - 3,339,700 - - - 3,464,600 - - - 3,464,600 - 575,900 7,682,400 179,400 - - - 8,437,700
832,800 2,367,700 9,934,700 1,027,000 - 379,100 - 14,541,300 6,533,900 14,529,700 21,901,700 5,671,300 - 579,100 - 49,215,700
- 800 - - 1,045,400 - - 1,046,200 - 900 - - 1,178,200 - - 1,179,100 - 1,700 - - 2,223,600 - - 2,225,300
- 100,000 14,638,700 33,300 - - - 14,772,000 - 100,000 14,638,700 33,300 - - - 14,772,000
- - - 52,400 - - - 52,400 - 4,800 - - - - 79,500 84,300 - 4,800 - 52,400 - - 79,500 136,700
2,109,000 6,655,800 19,001,700 2,063,500 9,010,600 994,500 - 39,835,100 2,515,400 6,023,700 12,461,900 1,043,700 3,538,600 955,300 - 26,538,600
303,000 1,590,700 200,400 39,700 - 57,300 - 2,191,100 4,927,400 14,270,200 31,664,000 3,146,900 12,549,200 2,007,100 - 68,564,800
4,742,700 1,929,600 - - - - - 6,672,300 6,769,900 1,879,100 - - - - - 8,649,000
11,512,600 3,808,700 - - - - - 15,321,300 51,938,200$ 40,044,200$ 68,332,400$ 9,786,800$ 14,772,800$ 4,191,000$ 79,500$ 189,144,900$
3.58% 3.81% -5.74% -2.03% 1.39% 8.75% -39.45% -0.32%27.46% 21.17% 36.13% 5.17% 7.81% 2.22% 0.04% 100.00%
50,142,800$ 38,574,200$ 72,493,500$ 9,989,700$ 14,569,700$ 3,853,900$ 131,300$ 189,755,100$ 26.43% 20.33% 38.20% 5.26% 7.68% 2.03% 0.07% 100.00%
84

Table 5
BUDGET BY FUND/PROGRAM AND REQUIREMENT TYPEAdopted Budget for Fiscal Year 2017-18
Materials Transfers Debt Contin- Unappro-Fund/Program Personnel & Services Capital Out Service gency priated Totals_____________________________________________________________________________________________________________________________________GENERAL FUNDNondepartmental - 326,500 - 882,900 - 1,604,800 - 2,814,200$ Municipal Court 415,000 355,500 - - - - - 770,500 Code Enforcement - - - - - - - - Public Safety Levy: Fire 1,115,400 199,600 - - - - - 1,315,000 Fire & Life Safety 790,200 181,900 - - - - - 972,100 Fire Emergency Services 10,872,600 2,193,500 100,000 - - - - 13,166,100 Police 12,167,400 2,456,900 28,000 - - - - 14,652,300 Public Safety Levy: Police 1,072,800 283,200 - - - - - 1,356,000 Planning 710,800 346,400 - - - - - 1,057,200 Library 1,820,100 985,600 - - - - - 2,805,700 ______________________________________________________________________________________________________________________________________Total General Fund 28,964,300 7,329,100 128,000 882,900 - 1,604,800 - 38,909,100 ______________________________________________________________________________________________________________________________________
PARKS & RECREATION FUNDSports Services 161,500 146,500 - - - - - 308,000 Children/Youth/Family Rec Services 337,600 81,900 - - - - - 419,500 Resource Developement Marketing Services 288,100 70,900 - - - - - 359,000 Park Maintenance Services 496,400 1,159,200 - - - - - 1,655,600 Parks & Recreation Administration 478,500 836,300 - 240,400 - 200,000 - 1,755,200 Aquatic Services 574,200 275,600 29,000 - - - - 878,800 Adult Recreation Services 361,300 257,200 - - - - - 618,500 Performance and Cultural Arts 6,000 667,500 - - - - - 673,500 Park Facilities Repair & Construction 421,000 126,800 197,000 - - - - 744,800 Park SDC Projects - 265,300 1,536,600 50,000 - - - 1,851,900 Senior Center Foundation - 70,300 - - - - - 70,300 Parks Capital Improvement Program - - 110,000 - - - - 110,000 ______________________________________________________________________________________________________________________________________Total Parks & Recreation Fund 3,124,600 3,957,500 1,872,600 290,400 - 200,000 - 9,445,100 ______________________________________________________________________________________________________________________________________
GRANTS FUNDState HMEP Grant - 9,000 - - - - - 9,000 Community Paramedic Program - 30,000 - - - - - 30,000 Ground Emergency Transport 50,000 50,000 - - - - - 100,000 DOJ Bulletproof Vest - 8,000 - - - - - 8,000 pDOJ Equitable Sharing - 52,100 - - - - - 52,100 Community Policing Donations - 11,000 - - - - - 11,000 Asset Forfeiture - 35,100 - - - - - 35,100 LINE 36,500 23,500 - - - - - 60,000 CDBG 79,000 2,300 - - - - - 81,300 CDBG Activities - 386,500 364,300 - - - - 750,800 SHPO Historic Preservation - 12,000 - - - - - 12,000 Library Foundation - - 36,100 - - - - 36,100 Oregon Community Foundation 3,000 158,500 - - - - - 161,500 State Library Grant - 10,100 - - - - - 10,100 FAA Annual Capital Grant - - 333,000 - - - - 333,000 Title XIX Grant 5,000 - - - - - - 5,000 ______________________________________________________________________________________________________________________________________Total Grants Fund 173,500 788,100 733,400 - - - - 1,695,000 ______________________________________________________________________________________________________________________________________
BUILDING FUNDBuilding Inspection 827,900 1,751,200 - 60,000 - - - 2,639,100 Electrical Permit Program 106,700 145,000 - - - - - 251,700 ADA Code Enforcement - - - - - - - - ______________________________________________________________________________________________________________________________________Total Building Fund 934,600 1,896,200 - 60,000 - - - 2,890,800 ______________________________________________________________________________________________________________________________________
RISK MANAGEMENT FUNDRisk Management Reserve - 1,099,200 - - - - - 1,099,200 PepsiCo Settlement Projects - 1,806,200 186,600 - - - - 1,992,800 ______________________________________________________________________________________________________________________________________Total Risk Management Fund - 2,905,400 186,600 - - - - 3,092,000 ______________________________________________________________________________________________________________________________________
continued
85

Table 5
BUDGET BY FUND/PROGRAM AND REQUIREMENT TYPE, continuedAdopted Budget for Fiscal Year 2017-18
Materials Transfers Debt Contin- Unappro-Fund/Program Personnel & Services Capital Out Service gency priated Totals______________________________________________________________________________________________________________________________________ECONOMIC DEVELOPMENT FUNDTarget Utilities - - - - - - - - Economic Development Activities 186,600 855,900 - 647,200 - - - 1,689,700 Albany Municipal Airport 16,000 79,500 220,000 - - - - 315,500 Municipal Airport Capital Projects - 900 300,700 2,700 - - - 304,300 ______________________________________________________________________________________________________________________________________Total Economic Development Fund 202,600 936,300 520,700 649,900 - - - 2,309,500 ______________________________________________________________________________________________________________________________________
PUBLIC TRANSIT FUNDAlbany Transit System 396,600 657,300 451,300 - - - - 1,505,200 Linn-Benton Loop 429,100 271,700 420,000 - - - - 1,120,800 Paratransit System 440,100 173,600 100,000 - - - - 713,700 ______________________________________________________________________________________________________________________________________Total Public Transit Fund 1,265,800 1,102,600 971,300 - - - - 3,339,700 ______________________________________________________________________________________________________________________________________
PUBLIC SAFETY LEVY FUNDPublic Safety Levy - - - 3,464,600 - - - 3,464,600 ______________________________________________________________________________________________________________________________________Total Public Safety Levy Fund - - - 3,464,600 - - - 3,464,600 ______________________________________________________________________________________________________________________________________
CAPITAL REPLACEMENT FUNDEquipment Replacement - 325,000 5,574,800 179,400 - - - 6,079,200 City Facilities Replacement - 18,700 125,600 - - - - 144,300 GF Facilities Maintenance Projects - 32,200 43,100 - - - - 75,300 IT Equipment Replacement - 200,000 1,290,400 - - - - 1,490,400 Facilities Replacement - - 648,500 - - - - 648,500 ______________________________________________________________________________________________________________________________________Total Capital Replacement Fund - 575,900 7,682,400 179,400 - - - 8,437,700 ______________________________________________________________________________________________________________________________________
STREETS FUNDStreet Maintenance 760,900 1,191,500 - - - - - 1,952,400 Street Administration 71,900 887,900 - 80,000 - 379,100 - 1,418,900 Stormwater Operations - - - - - - - - Street Capital & Restoration - 280,000 5,743,100 210,600 - - - 6,233,700 N. Albany Frontage Fee Projects - - 104,600 29,000 - - - 133,600 Transportation SDC Imp Fee - 8,000 3,528,500 382,500 - - - 3,919,000
i S C i b 300 4 0 100 324 900 9 300Transportation SDC Reimb Fee - 300 470,100 324,900 - - - 795,300 ADA Capital projects - - 88,400 - - - - 88,400 ______________________________________________________________________________________________________________________________________Total Streets Fund 832,800 2,367,700 9,934,700 1,027,000 - 379,100 - 14,541,300 ______________________________________________________________________________________________________________________________________
DEBT SERVICE FUND2002 LTD Tax Pension Bonds - - - - 865,800 - - 865,800 2004 Revenue Obligations - 800 - - 179,600 - - 180,400 ______________________________________________________________________________________________________________________________________Total Debt Service Fund - 800 - - 1,045,400 - - 1,046,200 ______________________________________________________________________________________________________________________________________
GENERAL OBLIGATION DEBT SERVICE FUND2015 Public Safety Facilities Bonds - 900 - - 1,178,200 - - - ______________________________________________________________________________________________________________________________________Total General Obligation Debt Service Fund - 900 - - 1,178,200 - - 1,179,100 ______________________________________________________________________________________________________________________________________
CAPITAL PROJECTS FUNDLID Construction Projects - - 2,233,700 33,300 - - - 2,267,000 Public Safety Facilities - - 12,005,000 - - - - 12,005,000 ______________________________________________________________________________________________________________________________________Total Capital Projects Fund - 100,000 14,638,700 33,300 - - - 14,772,000 ______________________________________________________________________________________________________________________________________
SENIOR CENTER ENDOWMENT FUNDSenior Center Endowment - - - 52,400 - - - 52,400 ______________________________________________________________________________________________________________________________________Total Senior Center Endowment Fund - - - 52,400 - - - 52,400 ______________________________________________________________________________________________________________________________________
LIBRARY TRUST FUNDV. O. Torney Trust - 3,600 - - - - 10,000 13,600 Manela Trust - 1,200 - - - - 69,500 70,700 ______________________________________________________________________________________________________________________________________Total Library Trust Fund - 4,800 - - - - 79,500 84,300 ______________________________________________________________________________________________________________________________________
continued
86

Table 5
BUDGET BY FUND/PROGRAM AND REQUIREMENT TYPE, continuedAdopted Budget for Fiscal Year 2017-18
Materials Transfers Debt Contin- Unappro-Fund/Program Personnel & Services Capital Out Service gency priated Totals_____________________________________________________________________________________________________________________________________SEWER FUNDWastewater Treatment Plant 737,400 1,833,500 67,000 - - - - 2,637,900 Wastewater Collection 767,900 721,000 11,000 - - - - 1,499,900 Wastewater Administration 151,800 3,396,100 - 596,100 - 994,500 - 5,138,500 Water Reuse and Biosolids - 8,600 - - - - - 8,600 TWG Wetlands 110,300 149,600 7,000 - - - - 266,900 Stormwater Operations - - - - - - - - Industrial Pretreatment 341,600 142,000 - - - - - 483,600 Sewer System Capital Projects - 405,000 15,487,600 - - - - 15,892,600 Sewer Equipment Replacement - - 726,200 - - - - 726,200 Sewer SDC Improvement Fee Projects - - 1,627,100 1,467,400 - - - 3,094,500 Sewer SDC Reimbursement Fee Projects - - 536,600 - - - - 536,600 Sewer Debt Service - - - - 9,010,600 - - 9,010,600 Sewer Economic Development - - 539,200 - - - - 539,200 Wetlands Treatment Project - - - - - - - - Stormwater Capital - - - - - - - - ______________________________________________________________________________________________________________________________________Total Sewer Fund 2,109,000 6,655,800 19,001,700 2,063,500 9,010,600 994,500 - 39,835,100 ______________________________________________________________________________________________________________________________________
WATER FUNDWater Administration 156,100 3,047,600 - 530,100 - 955,300 - 4,689,100 Water Canal Maintenance 440,300 398,600 48,000 - - - - 886,900 Vine Street Water Treatment Plant 476,600 498,600 18,000 - - - - 993,200 Water Distribution 965,800 992,500 81,500 - - - - 2,039,800 Albany-Millersburg WTP 476,600 889,900 533,000 - - - - 1,899,500 Water SDC Improvement Fee Projects - - 143,600 214,300 - - - 357,900 Water SDC Reimbursement Fee Projects - - 847,200 224,300 - - - 1,071,500 Water Debt Service - - - - 3,538,600 - - 3,538,600 Water System Capital Projects - 196,500 8,768,100 75,000 - - - 9,039,600 Water Economic Development - - 591,300 - - - - 591,300 N. Albany Water Capital Projects - - 792,500 - - - - 792,500 Water Equipment Replacement - - 638,700 - - - - 638,700 ______________________________________________________________________________________________________________________________________Total Water Fund 2,515,400 6,023,700 12,461,900 1,043,700 3,538,600 955,300 - 26,538,600 ______________________________________________________________________________________________________________________________________
STORMWATER FUNDStormwater Operations 303,000 251,900 - - - - - 554,900 Stormwater Administration - 1,323,800 - - - 57,300 - 1,381,100 Stormwater Capital - 15,000 123,000 39,700 - - - 177,700 Stormwater Equipment Replacement - - 77,400 - - - - 77,400 ______________________________________________________________________________________________________________________________________Total Stormwater Fund 303,000 1,590,700 200,400 39,700 - 57,300 - 2,191,100 ______________________________________________________________________________________________________________________________________
CENTRAL SERVICES FUNDFinance Department 1,353,000 263,800 - - - - - 1,616,800 Council & Nondepartmental 17,800 187,600 - - - - - 205,400 City Manager's Office 632,000 340,300 - - - - - 972,300 Information Technology Services 1,312,500 359,200 - - - - - 1,671,700 GIS Services 310,400 147,000 - - - - - 457,400 Permit Tracking 50,700 70,100 - - - - - 120,800 Human Resources 691,300 147,600 - - - - - 838,900 Facilities Maintenance 375,000 414,000 - - - - - 789,000 ______________________________________________________________________________________________________________________________________Total Central Services Fund 4,742,700 1,929,600 - - - - - 6,672,300 ______________________________________________________________________________________________________________________________________
PUBLIC WORKS CENTRAL SERVICES FUNDPW Administration 996,900 187,200 - - - - - 1,184,100 Engineering Services 2,540,300 405,300 - - - - - 2,945,600 Operations Admin 223,100 343,000 - - - - - 566,100 Water Quality Control Service 461,900 61,800 - - - - - 523,700 PW Customer Services 787,800 603,300 - - - - - 1,391,100 Facilities & Maintenance Engineering 1,759,900 278,500 - - - - - 2,038,400 ______________________________________________________________________________________________________________________________________Total Engineering/Water Quality Fund 6,769,900 1,879,100 - - - - - 8,649,000 ______________________________________________________________________________________________________________________________________Grand Totals 51,938,200$ 40,044,200$ 68,332,400$ 9,786,800$ 14,772,800$ 4,191,000$ 79,500$ 189,144,900$ ____________________________________________________________________________________________________________________________________________________________________________________________________________________________________________________________________________
Table 5 summarizes the 2017-18 budget by fund, program, and requirement type.
continued
87

Table 5
BUDGET BY FUND/PROGRAM AND REQUIREMENT TYPE, continuedAdopted Budget for Fiscal Year 2017-18
2017-18 Budget by Requirement Type
Operating Budget and Total Budget for Fiscal YearsEnded/Ending June 30, 2009, through 2018
Personnel $51,938,200, 27.46%
Materials & Services $40,044,200, 21.17%
Capital $68,332,400, 36.13%
Transfers Out $9,786,800, 5.17%
Debt Service $14,772,800, 7.81%
Contingency $4,191,000, 2.22%
Unappropriated $79,500, 0.04%
$200,000,000
$250,000,000
Total Budget
OperatingBudget
Fiscal Total as % ofYear Materials Operating Total Total
June 30, Personnel & Supplies Budget Budget Budget____________________________________________________________________________
2009 40,624,700$ 35,604,900$ 76,229,600$ 192,372,900$ 39.63%
2010 41,588,200 35,839,800 77,428,000 193,109,200 40.10%
2011 42,325,800 32,220,300 74,546,100 185,224,500 40.25%
2012 43,782,600 33,176,500 76,959,100 164,966,200 46.65%
2013 42,547,700 31,666,800 74,214,500 155,830,600 47.63%
2014 44,754,400 32,270,000 77,024,400 158,291,600 48.66%
2015 46,014,900 33,859,600 79,874,500 160,228,600 49.85%
2016 47,265,300 37,828,100 85,093,400 188,088,000 45.24%
2017 50,142,800 38,574,200 88,717,000 189,634,900 46.78%
2018 51,938,200 40,044,200 91,982,400 189,144,900 48.63%
$-
$50,000,000
$100,000,000
$150,000,000
2009 2010 2011 2012 2013 2014 2015 2016 2017 2018
Operating Budget
88

Table 6
SCHEDULE OF RESTRICTED (R) AND UNRESTRICTED (U) RESERVESAdopted Budget for Fiscal Year 2017-18
ReservedFund/Account#/Description Amount Description/Percent of Fund Budget___________________________________________________________________________________________________________________________GENERAL FUND100-10-1003-99005 Contingencies 1,604,800$ U Designated for General Fund activities___________________________________________________________________________________________________________________________Total General Fund 1,604,800 4.12% of General Fund budget___________________________________________________________________________________________________________________________
PARKS & RECREATION FUND202-35-1407-69026 Reserve: Lumber to Legacy 4,000 U Designated for Parks activities202-35-1408-69027 Reserve: Public Art 1,000 U Designated for Parks activities202-35-1408-99005 Contingencies 200,000 U Designated for Parks activities202-35-1500-90012 Reserve: Capital Projects 1,536,600 R Restricted to Parks SDC projects202-35-1506-69028 Reserve: Senior Center Foundation 52,400 R Restricted to Parks SDC projects202-35-1507-90014 Reserve: Parks Capital Projects 50,000 U Designated for Parks capital projects___________________________________________________________________________________________________________________________Total Parks & Recreation Fund 1,844,000 19.52% of Parks & Recreation Fund budget___________________________________________________________________________________________________________________________
GRANTS FUND203-30-5096-69023 Reserve: DOJ Equitable Sharing 52,100 R Restricted to Police203-30-5119-69023 Reserve: DOJ Equitable Sharing 15,000 R Restricted to Police___________________________________________________________________________________________________________________________Total Grants Fund 67,100 3.96% of Grants Fund budget___________________________________________________________________________________________________________________________
BUILDING FUND204-40-1602-69015 Reserve: Operating 972,100 U Designated for Building Inspection activities204-40-1603-69015 Reserve: Operating 86,500 U Designated for Building Inspection activities___________________________________________________________________________________________________________________________Total Building Fund 1,058,600 37.4% of Building Fund budget___________________________________________________________________________________________________________________________
RISK MANAGEMENT FUND208-10-1005-69016 Reserve: Risk Management 1,099,200 U Designated for potential risk management liabilities208-10-1037-90015 Reserve: PepsiCo Settlement 186,600 U Designated for City Council-approved projects___________________________________________________________________________________________________________________________Total Risk Management Fund 1,285,800 41.58% of Risk Management Fund budget___________________________________________________________________________________________________________________________
ECONOMIC DEVELOPMENT FUND211-11-1101-69020 Reserve: Economic Development 100,000 U Designated for economic development activities211-50-1103-90017 Reserve: Facilities Maintenance 220,000 U Designated for airport facilities maintenance211-50-1115-90012 Reserve: Capital Projects 300,700 U Designated for airport capital projects___________________________________________________________________________________________________________________________Total Economic Development Fund 620,700 26.88% of Economic Development Fund budget___________________________________________________________________________________________________________________________
PUBLIC TRANSIT FUND213-50-1106-69015 Reserve: Operating 14,900 U Designated for Albany Transit operations213-50-1107-69015 Reserve: Operating 30,600 U Designated for Loop operations213-50-1108-69015 Reserve: Operating 17,900 U Designated for Paratransit operations___________________________________________________________________________________________________________________________Total Public Transit Fund 63,400 1.9% of Public Transit Fund budget___________________________________________________________________________________________________________________________
CAPITAL REPLACEMENT FUND217-10-1010-90004 Reserve: Replacement 4,848,800 U Designated for equipment replacement217-10-1034-90008 Reserve: Building Replacement 93,400 U Designated for building replacement217-10-1034-90035 Reserve: Energy Trust 32,200 U Designated for building replacement217-10-2002-90010 Reserve: Building Maintenance 31,400 U Designated for building maintenance projects217-10-2002-90020 Reserve: Monteith House 11,700 U Designated for Monteith House projects217-13-1031-90004 Reserve: Replacement 1,290,400 U Designated for Fire Property Management Expenses217-50-2018-90019 Reserve: Facilities Replacement 248,500 U Designated for Information Technology equipment217-50-2018-90038 Reserve: Bus Barn 350,000 U Designated for Public Works facilities replacement___________________________________________________________________________________________________________________________Total Capital Replacement Fund 6,906,400 81.85% of Capital Replacement Fund budget___________________________________________________________________________________________________________________________
STREETS FUND250-50-2604-99005 Contingencies 379,100 U Designated for street capital projects250-50-2700-90009 Reserve: Street Connection Fees 163,900 U Designated for street capital projects250-50-2700-90012 Reserve: Capital Projects 1,362,600 U Designated for street capital projects250-50-2700-90021 Reserve: Waverly RH Land Mod Dep - WM 203,300 U Designated for street capital projects250-50-2700-90032 Reserve: ODOT Safety Grant Match 30,000 U Designated for street capital projects250-50-2701-90012 Reserve: Capital Projects 104,600 U Designated for capital projects250-50-2703-90012 Reserve: Capital Projects 1,590,300 U Designated for capital projects250-50-2703-90033 Reserve: Lochner Road Imp 400,000 U Designated for capital projects250-50-2703-90034 Reserve: ODOT I-5 EA 200,000 U Designated for capital projects250-50-2704-90012 Reserve: Capital Projects 470,100 U Designated for capital projects250-50-2705-90012 Reserve: Capital Projects 1,200 U Designated for capital projects250-50-2705-90023 Reserve: Albany Transit 15,000 U Designated for capital projects250-50-2705-90025 Reserve: Street Capital 72,200 U Designated for capital projects___________________________________________________________________________________________________________________________Total Streets Fund 4,992,300 34.33% of Streets Fund budget___________________________________________________________________________________________________________________________
DEBT SERVICE FUND301-10-1021-95000 Reserve: Debt Service 190,500 R Restricted to debt service___________________________________________________________________________________________________________________________Total Debt Service Fund 190,500 18.21% of Debt Service Fund budget___________________________________________________________________________________________________________________________
continued
An 'unrestricted reserve' is an appropriation which may be used for any legal purpose within the general instructions of the type of fund in which it isbudgeted. For example, 'unrestricted reserve' in the Street Fund, a Special Revenue fund, can be used for any street-related purpose. A 'restrictedreserve' can only be used for the specific purpose for which the reserve was established. Resources in the North Albany street reserve can be used onlyto maintain and replace streets in the North Albany area of the City.
89

Table 6
SCHEDULE OF RESTRICTED (R) AND UNRESTRICTED (U) RESERVES, continuedAdopted Budget for Fiscal Year 2017-18
ReservedFund/Account#/Description Amount Description/Percent of Fund Budget___________________________________________________________________________________________________________________________GENERAL OBLIGATION DEBT SERVICE FUND303-10-1051-95000 Reserve: Debt Service 139,900 R Designated for capital projects___________________________________________________________________________________________________________________________Total General Obligation Debt Service Fund 139,900 0.95% of General Obligation Debt Service Fund budget
CAPITAL PROJECTS FUND402-10-1012-90012 Reserve: Capital Projects 773,700 U Designated for capital projects402-10-1052-90012 Reserve: Capital Projects 12,005,000 U Designated for capital projects___________________________________________________________________________________________________________________________Total Capital Projects Fund 12,778,700 86.51% of Capital Projects Fund budget___________________________________________________________________________________________________________________________
LIBRARY TRUST FUND502-45-1703-99505 Unappropriated Surplus 10,000 R Restricted endowment donations502-45-1704-99505 Unappropriated Surplus 69,500 R Restricted endowment donations___________________________________________________________________________________________________________________________Total Library Trust Fund 79,500 94.31% of Library Trust Fund budget___________________________________________________________________________________________________________________________
SEWER FUND601-50-2407-99005 Contingencies 994,500 U Designated for sewer operations601-50-2500-90003 Reserve: Connection Fees 462,700 U Designated for sewer system capital projects601-50-2500-90012 Reserve: Capital Projects 3,614,700 U Designated for sewer system capital projects601-50-2500-90022 Reserve: Siemens Settlement 3,753,000 U Designated for sewer system capital projects601-50-2501-90007 Reserve: Equipment Replacement 726,200 U Designated for sewer equipment replacement601-50-2502-90001 Reserve: Pipe Over-sizing 10,000 R Restricted SDC - capacity increasing projects601-50-2502-90012 Reserve: Capital Projects 1,076,400 R Restricted SDC - capacity increasing projects601-50-2503-90012 Reserve: Capital Projects 536,600 R Restricted SDC - general capital improvements601-50-2504-95002 Reserve: Rates 960,000 U Designated for debt service601-50-2504-95009 Reserve: SRF Requirements (WWTP) 2,403,000 U Designated for debt service601-50-2504-95010 Reserve :SRF Requirements (Wetlands) 50,000 U Designated for debt service601-50-2506-90012 Reserve: Capital Projects 539,200 U Designated for sewer capital projects___________________________________________________________________________________________________________________________Total Sewer Fund 15,126,300 37.97% of Sewer Fund budget___________________________________________________________________________________________________________________________
WATER FUND615-50-2202-99005 Contingencies 955,300 U Designated for water operations615-50-2300-90001 Reserve: Pipe Over-sizing 10,000 U Designated for water system pipe over-sizing615-50-2300-90012 Reserve: Capital Projects 20,000 R Restricted to SDC - improvement fee projects615-50-2301-90012 Reserve: Capital Projects 387,200 R Restricted to SDC - reimbursement fee projects615-50-2305-95002 Reserve: Rates 500,100 U Designated for debt service615-50-2305-95007 Bond Payment Stabilization Reserve 1,100,000 U Designated for water canal maintenance615-50-2308-90003 Reserve: Connection Fees 281,400 U Designated for water capital projects615-50-2308-90012 Reserve: Capital Projects 1,333,300 U Designated for water capital projects615-50-2309-90012 Reserve: Capital Projects 501,300 U Designated for water economic development projects615-50-2310-90012 Reserve: Capital Projects 792,500 R Restricted to North Albany water projects615-50-2311-90007 Reserve: Equipment Replacement 408,700 U Designated for water equipment replacement___________________________________________________________________________________________________________________________Total Water Fund 6,289,800 23.7% of Water Fund budget___________________________________________________________________________________________________________________________
STORMWATER FUNDContingencies 57,300 U Designated for stormwaterReserve: Stormwater Capital 200 U Designated for stormwaterReserve: Stormwater Deferred Planting 5,000 U Designated for stormwaterReserve: Stormwater In-Lieu-of Planting 5,000 U Designated for stormwaterReserve: Stormwater Drain Connection Fee 112,800 U Designated for stormwaterReserve: Equipment Replacement 77,400 U Designated for equipment purchase___________________________________________________________________________________________________________________________Total Stormwater Fund 257,700 0.97% of Stormwater Fund budget___________________________________________________________________________________________________________________________
PUBLIC WORKS CENTRAL SERVICES FUND705-50-2802-69015 Reserve: Operating 10,000 U Designated for Public Works Operations705-50-2803-69015 Reserve: Operating 14,600 U Designated for Public Works Operations705-50-2805-69015 Reserve: Operating 10,700 U Designated for Public Works Operations705-50-2806-69015 Reserve: Operating 5,500 U Designated for Public Works Operations705-50-2807-69015 Reserve: Operating 10,000 U Designated for Public Works Operations705-50-2809-69015 Reserve: Operating 23,200 U Designated for Public Works Operations___________________________________________________________________________________________________________________________Total Public Works Central Services Fund 74,000 0.86% of Public Works Central Services Fund budget___________________________________________________________________________________________________________________________
___________________________________________________________________________________________________________________________TOTAL RESTRICTED RESERVES 4,888,700 TOTAL DESIGNATED RESERVES 48,490,800 ___________________________________________________________________________________________________________________________TOTAL RESERVES 53,379,500$ ______________________________________________________________________________________________________________________________________________________________________________________________________________________________________________________
90

Table 7
HISTORICAL FINANCIAL INFORMATION BY FUND AND FUND TYPEAdopted Budget for Fiscal Year 2017-18
2017-18 % Change2014-15 2015-16 Adopted Revised Adopted from
Fund type/Fund name Actual Actual Budget Budget Budget 2016-17_________________________________________________________________________________________________________GENERAL FUND 30,305,009$ 32,043,099$ 36,627,700$ 36,747,900$ 38,909,100$ 5.88%_________________________________________________________________________________________________________
SPECIAL REVENUE FUNDSParks & Recreation 6,019,363 6,311,067 8,797,800 8,797,800 9,445,100 7.36%Grants 1,879,333 1,120,576 1,592,600 1,592,600 1,695,000 6.43%Building 1,232,979 1,530,147 2,835,400 2,835,400 2,890,800 1.95%Risk Management 1,972,865 5,084,340 3,910,500 3,910,500 3,092,000 (20.93%)Economic Development 1,205,916 1,493,192 2,128,000 2,128,000 2,309,500 8.53%Public Transit 2,302,966 1,653,226 2,878,600 2,878,600 3,339,700 16.02%Public Safety Levy 2,422,600 2,756,000 3,236,300 3,236,300 3,464,600 7.05%Capital Replacement 894,426 3,412,634 7,908,600 7,908,600 8,437,700 6.69%Streets 8,359,897 6,360,962 9,952,900 9,952,900 14,541,300 46.10%_________________________________________________________________________________________________________Total Special Revenue Funds 26,290,345 29,722,144 43,240,700 43,240,700 49,215,700 13.82%_________________________________________________________________________________________________________
DEBT SERVICE FUNDSDebt Service 2,153,840 1,729,020 1,016,100 1,016,100 1,046,200 2.96%General Obligation Debt Service - - 1,009,000 1,009,000 1,179,100 16.86%_________________________________________________________________________________________________________Total Debt Service Funds 2,153,840 1,729,020 2,025,100 2,025,100 2,225,300 9.89%_________________________________________________________________________________________________________
CAPITAL PROJECT FUNDCapital Projects 727,027 2,345,990 25,644,400 25,644,400 14,772,000 (42.40%)_________________________________________________________________________________________________________Total Capital Project Fund 727,027 2,345,990 25,644,400 25,644,400 14,772,000 (42.40%)_________________________________________________________________________________________________________
PERMANENT FUNDSSenior Center Endowment - - 52,000 52,000 52,400 0.77%Library Trust 992 1,366 84,000 84,000 84,300 0.36%_________________________________________________________________________________________________________Total Permanent Funds 992 1,366 136,000 136,000 136,700 0.51%_________________________________________________________________________________________________________
ENTERPRISE FUNDSSewer 15,685,695 18,540,600 39,902,900 39,902,900 39,835,100 (0.17%)Water 11,556,495 15,890,751 25,955,300 25,955,300 26,538,600 2.25%Stormwater - - 1,156,900 1,156,900 2,191,100 89.39%_________________________________________________________________________________________________________Total Enterprise Funds 27,242,190 34,431,351 67,015,100 67,015,100 68,564,800 2.31%_________________________________________________________________________________________________________
INTERNAL SERVICE FUNDSCentral Services 5,533,625 5,931,898 6,367,200 6,367,200 6,672,300 4.79%Public Works Central Services 7,105,538 7,439,671 8,578,700 8,578,700 8,649,000 0.82%_________________________________________________________________________________________________________Total Internal Service Funds 12,639,163 13,371,569 14,945,900 14,945,900 15,321,300 2.51%_________________________________________________________________________________________________________Totals for All Fund Types 99,358,566$ 113,644,539$ 189,634,900$ 189,755,100$ 189,144,900$ (0.32%)__________________________________________________________________________________________________________________________________________________________________________________________________________________
Table 7 summarizes the 2017-18 Budget by fund and fund type. Also included are the actual expenditures for the2014-15 and the 2015-16 fiscal years as well as the 2016-17 adopted and revised budgets.
………2016-17………
91

Table 8
PROJECTED FUND BALANCESAdopted Budget for Fiscal Year 2017-18
Operating:Personnel, Projected
July 1, 2017 …….Resources……. Materials & Transfers Debt June 30, 2018,Fund Type/Fund Name Fund Balance Current Transfers In Services (1) Capital (2) Out Service (3) Fund Balance____________________________________________________________________________________________________________________________________GENERAL FUND 3,583,500 31,700,400 3,625,200 36,293,400 128,000 882,900 - 1,604,800$ ____________________________________________________________________________________________________________________________________
SPECIAL REVENUE FUNDSParks & Recreation 2,602,400 6,189,100 653,600 7,024,700 286,000 290,400 - 1,844,000 Grants 183,400 1,508,900 2,700 894,500 733,400 - - 67,100 Building 1,415,900 1,474,900 - 1,772,200 - 60,000 - 1,058,600 Risk Management 3,032,700 26,000 33,300 1,806,200 - - - 1,285,800 Economic Development 678,300 1,347,300 283,900 1,038,900 - 649,900 - 620,700 Public Transit 223,000 2,241,600 875,100 2,305,000 971,300 - - 63,400 Public Safety Levy 3,800 3,460,800 - - - 3,464,600 - - Capital Replacement 6,142,600 2,016,300 278,800 575,900 275,000 179,400 - 7,407,400 Streets 7,775,700 5,576,900 1,188,700 3,200,500 5,321,500 1,027,000 - 4,992,300 ____________________________________________________________________________________________________________________________________Total Special Revenue Funds 22,057,800 23,841,800 3,316,100 18,617,900 7,587,200 5,671,300 - 17,339,300 ____________________________________________________________________________________________________________________________________
DEBT SERVICE FUNDSDebt Service 188,600 677,200 180,400 800 (190,500) - 1,045,400 190,500 General Obligation Debt Service 106,700 1,072,400 - 900 (139,900) - 1,178,200 139,900 ____________________________________________________________________________________________________________________________________Total Debt Service Funds 295,300 1,749,600 180,400 1,700 (330,400) - 2,223,600 330,400 ____________________________________________________________________________________________________________________________________
CAPITAL PROJECT FUNDCapital Projects 13,675,000 95,000 1,002,000 100,000 1,860,000 33,300 - 12,778,700 ____________________________________________________________________________________________________________________________________Total Capital Project Fund 13,675,000 95,000 1,002,000 100,000 1,860,000 33,300 - 12,778,700 ____________________________________________________________________________________________________________________________________
PERMANENT FUNDSSenior Center Endowment 52,400 0 - - - 52,400 - - Library Trust 83,600 700 - 4,800 - - - 79,500 ____________________________________________________________________________________________________________________________________Total Permanent Funds 136,000 700 - 4,800 - 52,400 - 79,500 ____________________________________________________________________________________________________________________________________Total Governmental Fund Types 39,747,600 57,387,500 8,123,700 55,017,800 9,244,800 6,639,900 2,223,600 32,132,700 ____________________________________________________________________________________________________________________________________
ENTERPRISE FUNDSSewer 21,001,500 17,366,200 1,467,400 8,764,800 4,869,900 2,063,500 9,010,600 15,126,300 Water 12,586,900 13,513,100 438,600 8,539,100 7,127,400 1,043,700 3,538,600 6,289,800 Stormwater 298,300 1,892,800 - 1,893,700 - 39,700 - 257,700 ____________________________________________________________________________________________________________________________________Total Enterprise Funds 33,886,700 32,772,100 1,906,000 19,197,600 11,997,300 3,146,900 12,549,200 21,673,800 ____________________________________________________________________________________________________________________________________
INTERNAL SERVICE FUNDSCentral Services 248,500 6,406,700 17,100 6,672,300 - - - - Public Works Central Services 63,600 8,585,400 - 8,575,000 - - - 74,000 ____________________________________________________________________________________________________________________________________Total Internal Service Funds 312,100 14,992,100 17,100 15,247,300 - - - 74,000 ____________________________________________________________________________________________________________________________________Total Proprietary Fund Types 34,198,800 47,764,200 1,923,100 34,444,900 11,997,300 3,146,900 12,549,200 21,747,800 ____________________________________________________________________________________________________________________________________Total All Fund Types 73,946,400$ 105,151,700$ 10,046,800$ 89,462,700$ 21,242,100$ 9,786,800$ 14,772,800$ 53,880,500$ ________________________________________________________________________________________________________________________________________________________________________________________________________________________________________________________________________
(1) Operating expenditures less operating reserves.(2) Capital projects less capital reserves.(3) Debt service less debt reserves.
The projected June 30, 2018, fund balance is determined by subtracting the total requirements from the sum of the total resources and the Beginning Balance for July 1, 2017. Amounts held in reserve for future operating requirements, debt service, and capital projects total $2,519,700,$47,090,300, and $5,343,500, respectively. The reserved amounts are included in the projected June 30, 2018, fund balance.
92


Table 9
PROPERTY TAX RATES - ALL OVERLAPPING DISTRICTSPer $1,000 of Assessed Value
BentonFiscal Linn/ Greater CountyYear Benton/ Albany Linn- Soil &
Ended/ Linn & Lincoln Public Benton Albany Water TotalEnding City of Benton Counties School Community 4H Urban District Effective
June 30, County Albany Counties ESD District College Extension Renewal (BCSWD) Rate 1______________________________________________________________________________________________________________________________________________________________________________________________________________________________2008 Linn 7.8618 3.5969 0.2984 6.0328 0.6589 - 0.4229 - 18.87
Benton 7.8618 2.4652 0.2984 6.0328 0.6589 - 0.2608 0.0500 17.63_______________________________________________________________________________________________________________2009 Linn 7.7737 3.5129 0.2964 6.0349 0.6577 - 0.5233 - 18.80
Benton 7.7994 3.1052 0.2977 6.0552 0.6606 - 0.5475 0.0500 18.52_______________________________________________________________________________________________________________2010 Linn 7.7811 3.4893 0.2962 6.0520 0.6628 0.0503 0.5619 - 18.89
Benton 7.7811 2.7952 0.2962 6.0520 0.6628 - 0.5475 0.0500 18.18_______________________________________________________________________________________________________________2011 Linn 7.8092 3.6136 0.3049 6.2160 0.6736 0.0520 0.6059 - 19.2752
Benton 8.0572 2.8452 0.3049 6.2160 0.6736 - 0.5475 0.0500 18.6944_______________________________________________________________________________________________________________2012 Linn 7.1465 4.0436 0.3049 6.1893 0.6814 0.0520 0.6059 - 19.0236
Benton 7.5155 2.8852 0.3049 6.1823 0.6814 - 0.5475 0.0500 18.1668_______________________________________________________________________________________________________________2013 Linn 7.4970 4.0436 0.3049 6.2006 0.6736 0.0520 0.7309 - 19.5026
Benton 7.5132 2.9665 0.3049 6.2006 0.6754 - 0.5475 0.0500 18.2581_______________________________________________________________________________________________________________2014 Linn 7.6592 3.8492 0.2930 6.0682 0.6644 0.0495 0.7967 - 19.3802
Benton 7.6592 3.1052 0.2930 6.0682 0.6644 - 0.5475 0.0500 18.3875_______________________________________________________________________________________________________________2015 Linn 7.5890 4.2189 0.2923 6.0551 0.6491 0.0494 0.7085 - 19.5623
Benton 7.5890 3.1052 0.2923 6.0551 0.6491 - 0.5475 0.0500 18.2882_______________________________________________________________________________________________________________2016 Linn 7.4880 4.2936 0.3049 6.2923 0.6794 0.0700 0.6059 - 19.7341
Benton 7.7875 3.1052 0.3049 6.2159 0.6794 - 0.5475 0.0500 18.6904_______________________________________________________________________________________________________________2017 Linn 7.5172 4.2052 0.2901 5.7858 0.6438 0.0658 0.7618 - 19.2697
Benton 7.5175 3.1052 0.2901 5.7858 0.6438 - 0.6689 0.0500 18.0613_______________________________________________________________________________________________________________
City of Albany (Linn County)2016-17 Property Taxes, $150,000 Assessed Valuep y , ,
Total Property Tax Imposed $2,892
City of Albany (Benton County)2016-17 Property Taxes, $150,000 Assessed Value
Total Property Tax Imposed $2,711
(1) Source-Summary of Assessment and Tax Roll, Linn and Benton Counties.
City of Albany 39.01%, $1,128
Linn County 21.82%, $631LBL ESD 1.52%, $44
GAPS 30.01%, $868
LBCC 3.35%, $974H Extension 0.35%, $10
Urban Renewal 3.94%, $114
City of Albany 41.6%, $1,128
Benton County 17.19%, $466
LBL ESD 1.62%, $44
GAPS 32.02%, $868
LBCC 3.58%, $97 Urban Renewal 3.69%, $100 BSCWD 0.3%, $8
93

Table 10
PROPERTY TAX INFORMATION - 2017-18 ADOPTED BUDGET
2017-18 Estimated General Fund and Parks & Recreation Fund Taxes to be Levied for Linn and Benton Counties
General Fund and Parks Fund Property Tax Data Linn Benton Total
2016-17 Actual tax to be collected (amount levied) 18,850,651$ 4,587,793$ 23,438,444$
Estimated increase in the amount to be levied in 2017-18 2.78% 6.41% 3.49%
Estimated 2017-18 tax levy 19,375,622$ 4,881,648$ 24,257,270$
Estimated collection rate 93.47% 93.47% 93.47%
Total Estimated Tax Collections (General & Parks Funds) 18,110,394$ 4,562,876$ 22,673,270$
Allocation of Estimated Tax to be collected
General Fund (80%) 18,138,616$
Parks Fund (20%) 4,534,654$
Estimated Rate per $1,000 of assessed value (AV) 6.08$
Estimated Public Safety Taxes to be Levied for Linn and Benton Counties
Public Safety Levy Property Tax Data Linn Benton Total
2016-17 Actual tax to be collected (levied before compression) 3,561,392$ 866,748$ 4,428,140$
Estimated % increase in the amount to be levied in 2017-18 2.82% 6.29% 3.50%
Estimated 2017-18 tax levy* 3,661,822$ 921,235$ 4,583,057$
Estimated 2017-18 compression loss (794,392) (140,581) (934,973)
Estimated 2017-18 tax levy after compression 2,867,430$ 780,654$ 3,648,084$
Estimated collection rate 93.47% 93.47% 93.47%
Total estimated tax collections for the Public Safety Levy 2,680,187$ 729,677$ 3,409,864$
Estimated Rate per $1,000 of assessed value (AV) 1.15$
* In May 2016, voters approved a new five-year $1.15 per $1,000 levy. This is the first year of that levy.
General Obligation Debt Service Property Tax Requirements for Fiscal Year 2017-18
General Obligation Debt Service Requirements Levy Amount* Budget
Debt Service Fund: 2015 GO Public Safety Facilities Bonds 1,110,838$ 1,038,300
Total General Obligation Debt Service Requirements 1,110,838$ 1,038,300$
* Levy Amount = Budget/collection rate (93.47%)
2015 GO Bonds 0.27844$
Total estimated rate per $1,000 of assessed value 0.27844$
General Fund 19,405,816$ Parks & Recreation Fund 4,851,454
Public Safety Levy 3,648,084
General Obligation Debt Service 1,110,838
Estimated total taxes to be levied 29,016,192$
Estimated collection rate 93.47%
Estmated Current Tax Collections 27,121,435$
Estimated Rate per $1,000 of Assessed Value for General Obligation Debt
Estimated Total Taxes to be Levied for Fiscal Year 2016-17
94

Table 10
PROPERTY TAX INFORMATION - 2017-18 ADOPTED BUDGET, continued
Estimated 2017-18 City Assessed Value for Linn and Benton Counties
Assessed Value Linn Benton Total
2016-17 actual assessed value 3,096,858,647$ 753,694,742$ 3,850,553,389$
Estimated increase in assessed value 2.82% 6.84% 3.61%
Estimated 2017-18 assessed value 3,184,190,061$ 805,247,462$ 3,989,437,523$
Percentage of the Total City Assessed Value (AV) in Linn and Benton Counties2016-17 Actual Assessed Value
Percent
County City AV of Total
Linn 3,096,858,647$ 80.43%
Benton 753,694,742 19.57%
Totals 3,850,553,389$ 100.00%
Total City Assessed Value (AV) versus Total County Assessed Value2016-17 Actual Assessed Value
City %
Total Total of Total
County City AV County AV County AV
Linn 3,096,858,647$ 6,127,581,961$ 50.54%
Benton 753,694,742 7,568,954,695 9.96%
Totals 3,850,553,389$ 13,696,536,656$ 28.11%
Budgeted Current and Delinquent Property Tax Collections for 2017-18
Fund Name (Percent of Total Collections) Current Delinquent Total
General Fund (69.82%) 18,138,600$ 555,500$ 18,694,100$
Parks & Recreation Fund (17.26%) 4,534,600 88,000 4,622,600
Public Safety Levy Fund (12.92%) 3,409,800 50,000 3,459,800
Total budgeted property tax collections 26,083,000$ 693,500$ 26,776,500$
Use of Property Tax Resources for 2017-18
Percent
Description Total Taxes of Total
General Fund, Parks & Recreation Fund 23,316,700 87.08%
Public Safety Local Option Levy 3,459,800 12.92%
Totals 26,776,500$ 100.00%
95

Table 11
Current and Delinquent Property Tax Collections
Last Ten Fiscal Years 1
TotalFiscal Property General GeneralYear Taxes General Parks & Public Obligation Obligation
June 30, Received 2 Fund Recreation Safety Levy Debt Service Debt-Water_______________________________________________________________________________________________2009 22,525,645$ 14,577,623$ 3,643,784$ 2,547,957$ 955,531$ 800,750$ 2010 23,609,154 15,223,744 3,806,006 2,628,400 1,294,417 656,587 2011 24,504,571 15,811,249 3,952,833 2,571,987 2,141,144 27,358 2012 23,936,714 16,204,832 4,051,531 2,321,263 1,333,190 25,898 2013 23,693,704 16,174,909 4,043,730 2,137,956 1,326,121 10,988 2014 24,273,951 16,376,958 4,150,416 2,429,127 1,315,152 2,298 2015 25,021,688 17,068,822 4,256,772 2,455,503 1,237,003 3,588 2016 25,929,999 17,726,277 4,431,550 2,750,629 1,021,280 263 2017 25,980,000 18,281,400 4,513,300 3,185,300 - - 2018 27,954,700 18,694,100 4,622,600 3,459,800 1,178,200 -
Percent of Total Current and Delinquent Taxes Received by FundLast Ten Fiscal Years
TotalFiscal Property General GeneralYear Taxes General Parks & Public Obligation Obligation
June 30 Received Fund Recreation Safety Levy Debt Service Debt-Water
(1) Actual tax receipts for fiscal years ended June 30, 2009, through 2016. Budgeted receipts for fiscal years endingJune 30, 2017 and 2018. (2) Current plus delinquent taxes.
June 30, Received Fund Recreation Safety Levy Debt Service Debt Water_______________________________________________________________________________________________2009 100.01% 64.73% 16.18% 11.31% 4.24% 3.55%2010 99.98% 64.47% 16.12% 11.13% 5.48% 2.78%2011 100.00% 64.52% 16.13% 10.50% 8.74% 0.11%2012 100.02% 67.71% 16.93% 9.70% 5.57% 0.11%2013 100.01% 68.27% 17.07% 9.02% 5.60% 0.05%2014 100.00% 67.46% 17.10% 10.01% 5.42% 0.01%2015 99.98% 68.21% 17.01% 9.81% 4.94% 0.01%2016 99.99% 68.35% 17.09% 10.61% 3.94% 0.00%2017 100.00% 70.37% 17.37% 12.26% 0.00% 0.00%2018 100.00% 66.87% 16.54% 12.38% 4.21% 0.00%
Percent of Estimated Total Current and Delinquent Taxesto be Received by Fund for Fiscal Year 2017-18
General Fund, 66.87%Parks & Recreation,
16.54%
Public Safety Levy, 12.38%GO Debt Service,
4.21%
96

Table 12
Net Assessed Value Used to Compute Property Tax
Last Ten Fiscal Years 1
Linn &Benton Benton Counties
……………Linn County…………… County Total CombinedFiscal Total Value Used Value Used Value Used AnnualYear Assessed to Compute to Compute to Compute Percentage
June 30, Value Adjustments the Tax the Tax the Tax Change______________________________________________________________________________________________________2009 2,512,935,769$ (83,900,206)$ 2,429,035,563$ 526,917,483$ 2,955,953,046$ na2010 2,619,857,693 (90,157,811) 2,529,699,882 550,561,377 3,080,261,259 4.21%2011 2,720,366,416 (101,564,871) 2,618,801,545 578,241,790 3,197,043,335 3.79%2012 2,760,000,798 (111,196,690) 2,648,804,108 603,925,284 3,252,729,392 1.74%2013 2,762,432,910 (123,803,553) 2,638,629,357 617,297,378 3,255,926,735 0.10%2014 2,826,866,390 (135,999,495) 2,690,866,895 636,151,862 3,327,018,757 2.18%2015 2,895,358,204 (147,927,166) 2,747,431,038 668,393,866 3,415,824,904 2.67%2016 3,010,149,432 (166,529,559) 2,843,619,873 708,740,905 3,552,360,778 4.00%2017 3,096,858,647 (187,363,932) 2,909,494,715 753,694,742 3,663,189,457 3.12%2018 3,184,190,061 (192,647,595) 2,991,542,466 805,247,462 3,796,789,928 3.65%
(1) Actual assessed values for Fiscal Years 2009 through 2017. Estimated value for Fiscal Year 2018.
7 4 8 57
28
$3,000,000,000
$4,000,000,000
Net Assessed Value Used to Compute Property TaxLinn and Benton Counties Combined Annual Percentage Change
$2,9
55,9
53,0
46
$3,0
80,2
61,2
59
$3,1
97,0
43,3
35
$3,2
52,7
29,3
92
$3,2
55,9
26,7
35
$3,3
27,0
18,7
57
$3,4
15,8
24,9
04
$3,5
52,3
60,7
7
$3,6
63,1
89,4
5
$3,7
96,7
89,9
$-
$1,000,000,000
$2,000,000,000
2009 2010 2011 2012 2013 2014 2015 2016 2017 2018
4.21%
3.79% 1.74%
0.10%2.18%
2.67%
4.00%
3.12%
3.65%
0%
2%
4%
6%
8%
10%
2010 2011 2012 2013 2014 2015 2016 2017 2018
97

Table 13
Property Taxes Levied, Collected, and Collection PercentageTen Fiscal Years from 2007-2016
Fiscal Property Taxes RunningYear Property Collected Annual Collection
Ended Taxes in the Year Collection PercentageJune 30, Levied Levied Percentage Average_______________________________________________________________________________
2007 $21,270,329 $19,954,676 93.81% 93.39%2008 22,492,032 21,166,331 94.11% 93.68%2009 23,516,147 21,961,902 93.39% 93.59%2010 24,350,079 22,743,124 93.40% 93.55%2011 25,400,423 24,511,822 96.50% 94.13%2012 24,567,501 23,941,988 97.45% 94.66%2013 24,283,889 23,220,370 95.62% 94.79%2014 25,235,167 23,174,341 91.83% 94.42%2015 25,632,561 25,018,102 97.60% 94.78%2016 27,866,584 24,908,456 89.38% 94.19%
Annual Property Tax Collection PercentageTen Fiscal Years from 2007-2016
93%94%95%96%97%98%99%
Running Collection Percentage Average
93.3
9%
93.6
8%
93.5
9%
93.5
5%
94.1
3%
94.6
6%
94.7
9%
94.4
2%
94.7
8%
94.1
9%
90%
91%
92%
93%
94%
95%
2007 2008 2009 2010 2011 2012 2013 2014 2015 2016
93.8
1%
94.1
1%
93.3
9%
93.4
0% 96.5
0%
97.4
5%
95.6
2%
91.8
3%
97.6
0%
89.3
8%
85%86%87%88%89%90%91%92%
2007 2008 2009 2010 2011 2012 2013 2014 2015 2016
98

Table 14
Total Property Taxes Levied per Capita and Assessed Value per CapitaTen Fiscal Years from 2009-2018 (1)
Fiscal POPULATION PROPERTY TAXES ASSESSED VALUEYear Annual Annual Value Used Annual
Ended Percentage Amount Percentage to Compute PercentageJune 30, Amount Change Levied per Capita Change the Tax per Capita Change_______________________________________________________________________________________________________
2009 48,770 23,516,147$ 482.18$ n/a 2,955,953,046$ 60,610.07$ n/a2010 49,165 0.81% 24,350,079 495.27 2.71% 3,080,261,259 62,651.51 3.37%2011 49,530 0.74% 25,400,423 512.83 3.55% 3,197,043,335 64,547.61 3.03%2012 50,325 1.61% 24,567,501 488.18 (4.81%) 3,252,729,392 64,634.46 0.13%2013 50,520 0.39% 24,283,889 480.68 (1.54%) 3,255,926,735 64,448.27 (0.29%)2014 50,710 0.38% 25,235,167 497.64 3.53% 3,327,018,757 65,608.73 1.80%2015 50,720 0.02% 25,632,561 505.37 1.55% 3,415,824,904 67,346.71 2.65%2016 51,270 1.08% 27,866,584 543.53 7.55% 3,552,360,778 69,287.32 2.88%2017 51,670 0.78% 28,840,327 558.16 2.69% 3,663,189,457 70,895.87 2.32%2018 52,540 1.68% 28,840,327 548.92 (1.66%) 3,796,789,928 72,264.75 1.93%
Annual Percentage ChangePopulation, Property Taxes per Capita, and Assessed Value per Capita
(1) Actual amounts for fiscal years ended June 30, 2009, through 2016. Budgeted amounts for fiscal years ending June 30,2017 and 2018.
-6%
-4%
-2%
0%
2%
4%
6%
8%
10%
2010 2011 2012 2013 2014 2015 2016 2017 2018
Annual Percentage Change-Property Taxes per Capita
Annual Percentage Change-Assessed Value per Capita
Annual Percentage Change-Population
99

DEBT MANAGEMENT
Debt Summary
Outstanding debt as of July 1, 2017:
Short-term None
Long-term:Gross bonded debt (all debt with a General Obligation pledge)
2015 General Obligation Public Facilities Bonds 17,235,000$ Pledged from the general revenues of the City
2002 Limited Tax Pension Obligations 4,992,001Payable from unobligated, non-property tax revenues of the City
2004 Revenue Obligations 500,0002010 Wetlands Loan 1,464,5962012 SRF ARRA Loan 1,450,000
___________Gross Debt (General obligation and general revenue and pledge) 25,641,597$ ______________________
Net direct debt (all debt paid in whole or in part by taxes) 17,235,000$ Net overlapping debt as of June 30, 2016 44,765,676___________Total net direct debt and overlapping debt 62,000,676$ ______________________
Debt RatiosPercent of True Cash
Per Capita Value_________ ________2018 Population 52,540True Cash Value as of June 30, 2017 $ 4,234,924,544 $ 80,603.82Gross Bonded Debt 17,235,000 328.04 0.41%Gross Debt including General Fund Obligations 25,641,597 488.04 0.61%Overlapping Debt 44,765,676 852.03 1.06%Net Direct (General Obligation) and Overlapping Debt 62,000,676 1,180.07 1.46%Gross Debt and Overlapping Debt 70,407,273 1,340.07 1.66%
The City is subject to City Charter and State Constitutional limitations for issuing debt. Oregon Revised Statutes,Chapter 287, provides a debt limit of three percent (3%) of the True Cash Value of all taxable properties within cityboundaries. Debt Service Schedule Tables 16-18 summarize the total principal and interest due on all debt of theCity. Debt Service Table 19 presents Enterprise Fund revenue bond coverage information for the last 10 fiscal years.
100

Debt Service Schedule - Table 15
COMPUTATION OF LEGAL DEBT MARGIN
True Cash Value for the City of Albany (1) 4,234,924,544$ 3% Limitation 3%
General Obligation Debt Limit - 3% of True Cash Value 127,047,736
Gross bonded debt principal:17,235,000$
Net debt subject to 3% limitation 17,235,000
Legal Debt Margin for General Obligation Debt 109,812,736$
$100,000,000
$120,000,000
$140,000,000
Historical Trend of Legal Debt Margin
____________________
(1) Source: Tax Rolls - Linn and Benton County Tax Assessors as of June 30, 2016.
Oregon Revised Statutes Chapter 287 provides a debt limit of three percent (3%) of the true cash value of all taxableproperties within City boundaries. Excluded from this limit are improvement bonds and sinking fund reserves. An increasingdebt margin is a favorable trend which suggests that the true cash value of the City is rising as compared to outstandinggeneral obligation debt.
$62,
290,
773
$70,
230,
743
$78,
006,
188
$95,
352,
995
$108
,854
,636
$116
,352
,040
$111
,581
,580
$102
,710
,498
$127
,047
,736
$109
,812
,736
$-
$20,000,000
$40,000,000
$60,000,000
$80,000,000
, ,
2008 2009 2010 2011 2012 2013 2014 2015 2016 2017
Fiscal Years Ended June 30
101

2015 Public SafetyGeneral 2002 Limited Tax 2004 General
Years of ……….Total Requirements……... Obligation Bonds Pension Obligations Revenue ObligationsMaturity Total Principal Interest Principal Interest Principal Interest Principal Interest _____________________________________________________________________________________________________________________2017-2018 9,383,184 5,508,460 3,874,724 415,000 614,975 111,140 564,098 160,000 19,5532018-2019 9,426,020 5,720,522 3,705,498 465,000 597,375 111,257 593,980 165,000 13,3942019-2020 9,479,426 5,994,548 3,484,878 520,000 577,675 159,604 580,634 175,000 7,0002020-2021 8,927,898 5,929,615 2,998,283 575,000 555,775 460,000 315,7852021-2022 8,886,510 6,126,596 2,759,914 625,000 531,775 530,000 284,2752022-2023 8,931,422 6,413,561 2,517,861 685,000 505,575 600,000 247,9702023-2024 8,982,955 6,723,943 2,259,012 745,000 473,250 685,000 206,8702024-2025 8,257,585 6,282,843 1,974,742 815,000 434,250 159,9472025-2026 9,140,223 7,420,371 1,719,852 890,000 391,625 865,000 159,9472026-2027 9,217,594 7,811,636 1,405,958 970,000 349,975 970,000 100,6952027-2028 8,702,940 7,611,754 1,091,186 1,050,000 314,825 500,000 34,2502028-2029 8,180,007 7,375,842 804,165 1,115,000 282,3502029-2030 5,864,632 5,314,477 550,155 1,190,000 247,7752030-2031 3,538,403 3,125,000 413,403 1,265,000 210,1592031-2032 3,527,359 3,210,000 317,359 1,345,000 169,3752032-2033 3,520,202 3,305,000 215,202 1,430,000 125,1252033-2034 3,572,578 3,465,000 107,578 1,520,000 77,1882034-2035 1,641,244 1,615,000 26,244 1,615,000 26,244_____________________________________________________________________________________________________________________
Totals 129,180,182$ 98,954,168$ 30,226,014$ 17,235,000$ 6,485,291$ 4,992,001$ 3,248,451$ 500,000$ 39,947$ _____________________________________________________________________________________________________________________
Debt Service Schedule - Table 16
SCHEDULE OF FUTURE DEBT SERVICE REQUIREMENTS
OUTSTANDING PRINCIPAL AND INTEREST - ALL FUNDSas of June 30, 2017
_____________________________________________________________________________________________________________________
continued
2,000,000
4,000,000
6,000,000
8,000,000
10,000,000
12,000,000
2018
2019
2020
2021
2022
2023
2024
2025
2026
2027
2028
2029
2030
2031
2032
2033
2034
2035
Fiscal Years Ending June 30
Annual Principal and Interest Requirements - All Funds
102

Years ofMaturity_________2017-20182018-20192019-20202020-20212021-20222022-20232023-20242024-20252025-20262026-20272027-20282028-20292029-20302030-20312031-20322032-20332033-20342034-2035_________
Totals_________
2013 Water 2007 State Revenue Revolving Fund 2010 Wetlands 2012 SRFBonds Loans - Sewer Loan ARRA Loan
Principal Interest Principal Interest Principal Interest Principal Fee__________________________________________________________________________________________________1,020,000 918,494 3,260,904 1,691,770 441,416 58,584 100,000 7,2501,060,000 876,894 3,360,192 1,576,178 459,073 40,927 100,000 6,7501,100,000 833,694 3,462,508 1,457,061 477,436 22,564 100,000 6,2501,140,000 783,194 3,567,944 1,334,312 86,671 3,467 100,000 5,7501,195,000 730,794 3,676,596 1,207,820 100,000 5,2501,240,000 682,094 3,788,561 1,077,472 100,000 4,7501,290,000 631,494 3,903,943 943,148 100,000 4,2501,345,000 572,068 4,022,843 804,727 100,000 3,7501,420,000 502,944 4,145,371 662,086 100,000 3,2501,500,000 437,444 4,271,636 515,094 100,000 2,7501,560,000 376,244 4,401,754 363,617 100,000 2,2501,625,000 312,544 4,535,842 207,521 100,000 1,7501,705,000 254,468 2,319,477 46,662 100,000 1,2501,760,000 202,494 100,000 7501,815,000 147,734 50,000 2501,875,000 90,0771,945,000 30,390
__________________________________________________________________________________________________
24,595,000$ 8,383,065$ 48,717,571$ 11,887,468$ 1,464,596$ 125,542$ 1,450,000$ 56,250$ __________________________________________________________________________________________________
Debt Service Schedule - Table 16, continued
SCHEDULE OF FUTURE DEBT SERVICE REQUIREMENTS
OUTSTANDING PRINCIPAL AND INTEREST - ALL FUNDSas of June 30, 2017
___________________________________________________________________________________________________________
103

Debt Service Schedule - Table 17
SUMMARY OF DEBT SERVICE BY TYPE AND FUND2017-2018 Fiscal Year Requirements
Total forFund/Source/Debt Description Principal Interest 2017-2018
DEBT SERVICE FUND:General Obligation Bonds
2015 Public Safety Facilities 415,000$ 614,975$ 1,029,975$ Revenue Obligation Bonds
2004 General Revenue Obligations 160,000 19,553 179,553 Limited Tax Pension Obligations
2002 Limited Tax Pension Obligations 111,140 564,098 675,238
Total Debt Service Fund 686,140 1,198,626 1,884,766
SEWER FUND:State Revolving Fund Loans
2007 State Revolving Fund Loans - Sewer Treatment Plant 3,260,904 1,691,770 4,952,6742010 Wetlands Loan 441,416 58,584 500,0002012 SRF ARRA Loan 100,000 7,250 107,250
Total Sewer Fund: 3,802,320 1,757,604 5,559,924
WATER FUND:WATER FUND:Water Revenue Bonds
2013 Full Faith and Credit Refunding Bonds 1,020,000 918,494 1,938,494
Total Water Fund: 1,020,000 918,494 1,938,494
Total Requirements for Fiscal Year 2017-2018 5,508,460$ 3,874,724$ 9,383,184$
Property Taxes $1,029,975, 10.98%
Revenue Obligations $179,553, 1.91%
Available General Funds $675,238, 7.20%
2010 Wetlands Loan $500,000, 5.33%
2011 State Revolving Funds - ARRA
$107,250, 1.14%
Sewer Revenues $4,952,674, 52.78% Water Revenues
$1,938,494, 20.66%
Debt Service Requirements, Summary by Funding Source
104

Debt Service Schedule - Table 18
LONG-TERM DEBT AND SCHEDULE OF FUTURE DEBT SERVICE REQUIREMENTS
General Obligation Bonds
Years EndingJune 30, Principal Interest Totals
2018 415,000 614,975 1,029,975 2019 465,000 597,375 1,062,375 2020 520,000 577,675 1,097,675 2021 575,000 555,775 1,130,775
2022-2026 3,760,000 2,336,475 5,860,775 2027-2031 5,590,000 1,405,084 6,707,525 2032-2036 5,910,000 397,932 7,686,194
Totals 17,235,000$ 6,485,291$ 23,720,291$
Limited Tax Pension Obligations
Years EndingJune 30, Principal Interest Totals
2018 111,140 564,098 675,238 2019 111,257 593,980 705,237 2020 159,604 580,634 740,238 2021 460,000 315,785 775,785
2022-2026 2,680,000 1,059,009 3,739,009 2027-2029 1,470,000 134,945 1,604,945
Totals 4,992,001$ 3,248,451$ 8,240,452$
General Revenue Obligations
Years EndingJune 30, Principal Interest Totals
2017 160,000 19,553 179,553 2018 165,000 13,394 178,394 2019 175,000 7,000 182,000
Totals 500,000$ 39,947$ 539,947$ ______________________________________________________________
General obligation bonds are direct obligations and pledge the full faith and credit of the City. The City issues general obligationbonds to provide funds for the acquisition and construction of major capital facilities.
In May 2015, the voters approved $18,000,000 of general obligation bonds to construct new police and fire facilities. The Series 2015bonds were sold in August 2015. The bonds are payable from property taxes levied specifically for repayment. The interest rateranges from 3 to 5 percent for the 20-year bonds. Final maturity is June 2035.
In March 2002, the City issued $6,851,826 of Limited Tax Pension Obligations. Net proceeds in the amount of $6,700,000 were usedto finance a portion of the City's estimated unfunded liability in the Oregon Public Employees Retirement System. Debt servicerequirements are payable from available general funds, including taxes and other funds. Interest rates range from 2 percent to 7.36percent for the 26-year bonds. Final maturity is June 2028.
In December 2004, the City issued $3,720,000 of general revenue obligations, secured and payable from any unobligated, non-property tax revenues legally available to the City, to finance the construction of a public swimming pool and repayment and/ordefeasance of the City's Certificates of Participation, Series 1994. Interest rates range from 2 percent to 5 percent for the 15-yearbonds. Final maturity is January 2020.
105

Debt Service Schedule - Table 18, continued
LONG-TERM DEBT AND SCHEDULE OF FUTURE DEBT SERVICE REQUIREMENTS
Water Revenue Bonds
Years EndingJune 30, Principal Interest Totals
2017 1,020,000 918,494 1,938,494 2018 1,060,000 876,894 1,936,894 2019 1,100,000 833,694 1,933,694 2020 1,140,000 783,194 1,923,194
2021-2025 6,490,000 3,119,394 9,609,394 2026-2030 8,150,000 1,583,194 9,733,194 2031-2035 5,635,000 268,201 5,903,201
Totals 24,595,000$ 8,383,065$ 32,978,065$
State Revolving Fund (SRF) Loans, Sewer Fund
Years EndingJune 30, Principal Interest Totals
2017 3,260,904 1,691,770 4,952,674 2018 3,360,192 1,576,178 4,936,370 2019 3,462,508 1,457,061 4,919,569 2020 3,567,944 1,334,312 4,902,256
2021-2025 19,537,314 4,695,253 24,232,567 2026-2030 15,528,709 1,132,894 16,661,603
Totals 48,717,571$ 11,887,468$ 60,605,039$
State Revolving Fund (SRF) ARRA Loans, Sewer Fund
Years EndingJune 30, Principal Interest Totals
2017 100,000 7,250 107,250 2018 100,000 6,750 106,750 2019 100,000 6,250 106,250 2020 100,000 5,750 105,750
2021-2025 500,000 21,250 521,250 2026-2030 500,000 8,750 508,750 2031-2032 50,000 250 50,250
Totals 1,450,000$ 56,250$ 1,506,250$
In 2010, the City received a $4,000,000 loan from the Special Public Works Revolving Fund (SPWRF), which was funded by theAmerican Recovery and Reinvestment Act (ARRA) to finance a portion of the costs of the Talking Water Garden Project. 50% of theloan is forgivable. Debt service requirements are payable solely from the net revenues of the City's sewer system. There is an annualfee of 5 percent on the outstanding loan balance, which is due at the time of debt service payments on the 20-year loan. In the tablebelow, the loan fee has been included in the interest requirements. Final maturity is 2032.
The City received two loans totaling $69,000,000 from the Clean Water State Revolving Fund to assist in the payment of costs of anew wastewater treatment plant. Loan repayment requirements are payable from the net revenues of the City's sewer system. Accruedinterest was paid on April 1, 2010. At that time the debt service payment schedule was prepared. Interest rates range from 2.9 percentto 3.14 percent for the 20-year loan. In addition, there is an annual 0.5% loan fee due at the time of debt service payments. In thetable below, the loan fee has been included in the interest requirements.
In March 2013, the City issued $28,405,000 Full Faith and Credit Refunding Bonds, Series 2013, to refinance certain outstandingWater Revenue and Refunding Bonds, Series 2003, that financed and re-financed capital projects for the City's Water System, and topay the costs of issuance of the bonds. The interest rate is 3.125 percent for the 20-year bonds. Final maturity is August 2033.
106

Debt Service Schedule - Table 18, continued
LONG-TERM DEBT AND SCHEDULE OF FUTURE DEBT SERVICE REQUIREMENTS
Wetlands Loan
Years EndingJune 30, Principal Interest Totals
2017 441,416 58,584 500,000 2018 459,073 40,927 500,000 2019 477,436 22,564 500,000 2020 86,671 3,467 90,138
Totals 1,464,596$ 125,542$ 1,590,138$
TOTAL OUTSTANDING BONDS, CERTIFICATES OF PARTICIPATION, AND SRF LOANS
Years EndingJune 30, Principal Interest Totals
2017 5,508,460 3,874,724 9,383,184 2018 5,720,522 3,705,498 9,426,020 2019 5,994,548 3,484,878 9,479,426 2020 5,929,615 2,998,283 8,927,898
2021-2025 32,967,314 11,231,381 44,198,695 2026-2030 31,238,709 4,264,867 35,503,576 2031-2035 11,595,000 666,383 12,261,383
Totals 98,954,168$ 30,226,014$ 129,180,182$
The City received a loan in the amount of $4,114,000 from the former property owner to assist in the payment of costs of TalkingWater Garden. Loan repayment requirements are payable from the net revenues of the City's sewer system. The interest rate is 4percent for the ten-year loan. Final maturity is December 2021.
107

Debt Service Schedule - Table 19
REVENUE BOND COVERAGE: ENTERPRISE FUNDSlast 10 fiscal years
Fiscal Year Net
Ended Operating Operating Operating Debt Requirements2 Total Debt
June 30, Revenue Expense1 Revenue Principal Interest Requirements Coverage______________________________________________________________________________________________________
2007 21,830,693 13,935,942 7,894,751 1,772,704 2,072,517 3,845,221 205.31%
2008 22,970,160 14,999,807 7,970,353 1,976,955 3,072,934 5,049,889 157.83%
2009 23,806,995 14,591,520 9,215,475 2,030,396 2,977,014 5,007,410 184.04%
2010 26,188,307 15,032,412 11,155,895 2,401,143 5,881,196 8,282,339 134.69%
2011 30,059,038 14,284,897 15,774,141 3,770,148 3,938,971 7,709,119 204.62%
2012 26,697,590 15,330,041 11,367,549 3,759,599 3,808,017 7,567,616 150.21%
2013 30,855,527 15,444,084 15,411,443 3,636,835 3,675,970 7,312,805 210.75%
2014 27,175,162 15,923,044 11,252,118 3,897,278 2,930,937 6,828,215 164.79%
2015 28,489,572 14,884,999 13,604,573 4,367,742 3,018,747 7,386,489 184.18%
2016 29,096,871 19,234,576 9,862,295 4,006,056 2,909,389 6,915,445 142.61%
2 Includes principal and interest amounts paid from water and sewer revenues only.
1 Operating expenses less depreciation.
205%158% 184%
135%205%
150%211%
165% 184%143%
0%
100%
200%
300%
2007 2008 2009 2010 2011 2012 2013 2014 2015 2016
Fiscal Years Ended June 30
Enterprise Funds Bond Coverage
108

GENERAL FUND


GENERAL FUNDPROGRAM FUNCTIONS, REVENUE TRENDS, AND ASSUMPTIONS
PROGRAM FUNCTIONS
The General Fund is used to account for all financial resources except those accounted for in another fund. The City hasone General Fund. General Fund programs include:
NondepartmentalExpenditures which cannot be attributed to other General Fund programs are accounted for in this program. City Hallbuilding maintenance charges are expected to be $213,200. Major interfund transfers include: $488,400 of State RevenueSharing proceeds to the Albany Transit System; $104,400 of State Revenue Sharing proceeds to the Paratransit System;and $187,200 to the Parks & Recreation Fund. $85,400 is for Urban Forestry Management and $101,800 to outsideagencies.
Municipal CourtMunicipal Court processes citations issued by the Albany Police Department, the City's Code Enforcement Division, andprivate citizens of the City. This program is responsible for scheduling and conducting pretrial conferences and courttrials including notification of attorneys, police officers, and witnesses.
Fire Emergency ServicesFire Emergency Services responds to emergencies including fires, rescues, hazardous materials incidents, vehicleaccidents, health difficulties, and natural or other disasters. This program is responsible for the production andmaintenance of the Emergency Operations Plan. It also provides emergency and non-emergency ambulancetransportation for Albany and portions of Linn, Benton, and Marion Counties. Included are ambulance billing, customerservice, collection for charges related to ambulance transports, and administrative support of the FireMed program.Theprimary source of revenue is ambulance service charges. Service charge revenue is expected to be $2,300,000. Fire Medrevenues are limited by federal reimbursement rates and have been budgeted at $170,000.
Public Safety Levy-FireThis program accounts for the Fire personnel and materials funded by the five-year Public Safety Levy passed by thevoters in May 2016. Fiscal Year 2017-18 is the second year of the levy.
Fire & Life SafetyPersonnel in this program conduct fire and life safety inspections of occupancies within the City that are covered bymunicipal and state fire codes. Also provided are fire and life safety information and education, review of constructionplans for compliance with the Uniform Fire Code and other appropriate laws and codes, fire investigation, andadministration of the Juvenile Firesetters Program.
PoliceThe Police Department provides detective and prosecutorial services, community service assistance, City regulatoryservices, traffic enforcement, and accident investigation. In addition, the Department provides animal control, communitypolicing, crime prevention programs, and maintains records in accordance with state statutes and departmental policies.
Public Safety Levy-PoliceThis program accounts for the Police personnel and materials funded by the five-year Public Safety Levy passed by thevoters in May 2016. Fiscal Year 2017-18 is the second year of the levy.
PlanningStaff in this program administer the Development Code, oversee the City's state-mandated "periodic review" process, andparticipate on the City's economic development team. Comprehensive planning activities include involvement in housingissues, historic preservation issues, and transportation planning.
LibraryThe Library program provides for educational, informational, cultural, and recreational needs of the residences andbusinesses of Albany.
109

GENERAL FUNDPROGRAM FUNCTIONS, REVENUE TRENDS, AND ASSUMPTIONS
REVENUE TRENDS AND ASSUMPTIONS
Property TaxesThe estimated 2017-18 collection of current property taxes for the General Fund will be $17,701,400. Provisions ofBallot Measure 50 and subsequent legislation have combined to set the permanent tax rate for the City of Albany at$6.3984 per $1,000 of assessed value. Ballot Measure 50 limits the annual increase in assessed value of each property tothree percent. The increase is not automatic and can only increase as much as the real market value up to the threepercent limit. The value of new construction is added to the assessed value, which may result in property tax revenuesincreasing more than three percent. For 2017-18, tax collections are estimated to rise by 4.15.0 percent. The collectionrate is estimated to be 93.47 percent of the taxes levied.
In May of 2016, Albany voters passed a new local option levy to support public safety. The levy is for five years at $1.15per $1,000 of assessed value starting in 2016-17. For 2017-18, the first year of the levy, current tax collections areestimated to be $3,117,300. The tax revenues will be received into the Public Safety Fund (215) and distributed to theGeneral Fund (100) throughout the year.
Franchise Fees and Privilege Taxes
Franchise fees and privilege taxes account for 13.65 percent of the General Fund budget. It is projected that the 2017-18level of actual receipts will be more than those of 2016-17.
Licenses and FeesPlanning fees are forecast to increase by 2 percent ($14,900).
Intergovernmental RevenuesIntergovernmental revenues are projected to increase by 6.26 percent for Fiscal Year 2017-18. Rural fire districtpayments will increase by $26,000 (1.71 percent). Liquor taxes, cigarette taxes, and state revenue sharing are forecast toincrease by $111,700 (7.99 percent).
Charges for ServicesThe major item in this section is City Hall rental charges for office space. The rental charges are used to pay for buildingmaintenance and utilities. With the retirement of Debt associated with the construction of City Hall, rental charges for2016-17 will decrease ($120,000).
Fines and Forfeitures
Court fines are estimated to increase by 5.87 percent from the 2016-17 estimate.
Other RevenuesThere are no major changes in this category, as the 2016-17 adopted budget reflects historical levels of activity.
Investment EarningsFor 2016-17, interest earnings are expected to be $25,500, increasing from the 2015-16 estimate.
110

GENERAL FUND
Adopted for the Fiscal Year 2017-18
RESOURCES REQUIREMENTS
Property Taxes 18,281,400$ Personnel 27,438,300$ Franchise Fees/Privilege Taxes 5,000,900 Materials & Services 6,872,400 Licenses & Fees 362,100 Capital 18,500 Intergovernmental Revenues 3,240,400 Transfers Out 783,600 Charges for Service 2,674,800 Contingencies 1,514,900 Fines & Forfeitures 671,500 Other Revenues 105,500 Investment Earnings 25,500 Transfers In 3,395,500 Beginning Balance 2,870,100
Total Resources 36,627,700$ Total Requirements 36,627,700$
Property Taxes, 49.91%
Intergovernmental Revenues, 8.85%
Transfers In, 9.27%
All Other Resources, 10.48%
Beginning Balance, 7.84%
General Fund Resources
Franchise Fees/Privilege Taxes, 13.650%
Personnel, 74.91%
Materials & Services, 18.76%
Capital, 0.05%
Contingency, 4.10%
General Fund Requirements
111

GENERAL FUND
(Amounts for 2009 through 2016 are actual. Budgeted amounts have been used for 2017 and 2018.)
Property Tax CollectionsYear Ended/ Property
Ending Tax PercentageJune 30, Collections Increase________________________________________
2009 17,139,504$ -2010 17,531,899 2.29% 2011 18,449,022 5.23% 2012 20,839,368 12.96% 2013 17,621,998 (15.44%) 2014 18,657,072 5.87% 2015 19,491,422 4.47% 2016 20,482,277 5.08% 2017 21,517,700 5.06% 2018 22,158,700 2.98%
Property taxes collected in the Public Safety Levy Fund and transferred to the General Fund:2009 2,561,881$ 2010 2,308,154 2011 2,637,773 2012 2,317,268 2013 1 833 900
Property tax collections include amounts collected in the Public Safety Levy Fund that were reported in the General Fund as transfers in.
$17,
139,
504
$17,
531,
899
$18,
449,
022
$20,
839,
368
$17,
621,
998
$18,
657,
072
$19,
491,
422
$20,
482,
277
$21,
517,
700
$22,
158,
700
$-
$4,000,000
$8,000,000
$12,000,000
$16,000,000
$20,000,000
$24,000,000
2009 2010 2011 2012 2013 2014 2015 2016 2017 2018
Property Tax Collections (Ten Years)
2013 1,833,900 2014 2,250,300 2015 2,422,600 2016 2,756,000 2017 3,236,300 2018 3,464,600
As of FY 2014-2015, the Ambulance Fund was combined with Fire Emergency Services in the General Fund. All property taxes collected in the Public Safety Levy Fund are transferred to the General Fund.
State Shared Resources: Cigarette Taxes, Liquor Taxes, and State Revenue Sharing
Year Ended/ State PercentageEnding Shared IncreaseJune 30, Revenues (Decrease) State Shared Revenues (Ten Years)________________________________________
2009 1,023,060$ -2010 1,018,924 (0.40%) 2011 1,045,135 2.57% 2012 1,128,461 7.97% 2013 1,213,099 7.50% 2014 1,251,981 3.21% 2015 1,300,909 3.91% 2016 1,317,405 1.27% 2017 1,510,000 14.62% 2018 1,659,600 9.91%
1
$1,023,060
$1,018,924
$1,045,135
$1,128,461
$1,213,099
$1,251,981
$1,300,909
$1,317,405
$1,510,000
$1,659,600
$-
$200,000
$400,000
$600,000
$800,000
$1,000,000
$1,200,000
$1,400,000
$1,600,000
$1,800,000
2009 2010 2011 2012 2013 2014 2015 2016 2017 2018
1
112

GENERAL FUND
Municipal Court FinesYear Ended/ Percentage
Ending IncreaseJune 30, Fines (Decrease) Municipal Court Fines (Ten Years)________________________________________
2009 897,179$ -2010 826,786 (7.85%) 2011 769,200 (6.97%) 2012 731,135 (4.95%) 2013 515,660 (29.47%) 2014 589,291 14.28% 2015 706,114 19.82% 2016 706,324 0.03% 2017 664,800 (5.88%) 2018 625,700 (5.88%)
Rural Fire District Revenues (Albany RFD, North Albany RFD, Palestine RFD)
Year Ended/ Rural PercentageEnding Fire IncreaseJune 30, Districts (Decrease) Rural Fire District Revenues (Ten Years)________________________________________
2009 1,625,827$ -2010 1,670,598 2.75%
$897,179
$826,786
$769,200
$731,135
$515,660
$589,291
$706,114
$706,324
$664,800
$625,700
$-
$200,000
$400,000
$600,000
$800,000
$1,000,000
$1,200,000
2009 2010 2011 2012 2013 2014 2015 2016 2017 2018
$2,000,000
2011 1,512,232 (9.48%) 2012 1,383,093 (8.54%) 2013 1,416,589 2.42% 2014 1,417,767 0.08% 2015 1,473,085 3.90% 2016 1,492,987 1.35% 2017 1,549,000 3.75% 2018 1,644,000 6.13%
Beginning Fund BalanceYear Ended/ Beginning Percentage
Ending Fund IncreaseJune 30, Balance (Decrease)________________________________________
2009 4,971,138$ -2010 4,023,051 (19.07%) 2011 2,654,786 (34.01%) 2012 2,715,154 2.27% 2013 2,821,976 3.93% 2014 2,170,549 (23.08%) 2015 2,065,529 (4.84%) 2016 2,681,904 29.84% 2017 2,990,300 11.50% 2018 3,583,500 19.84%
$4,971,138
4,023,051
2,654,786
2,715,154
2,821,976
2,170,549
2,065,529
2,681,904
2,990,300
3,583,500
$-
$1,000,000
$2,000,000
$3,000,000
$4,000,000
$5,000,000
2009 2010 2011 2012 2013 2014 2015 2016 2017 2018
Beginning Fund Balance (Ten Years)
$1,625,827
$1,670,598
$1,512,232
$1,383,093
$1,416,589
$1,417,767
$1,473,085
$1,492,987
$1,549,000
$1,644,000
$-
$400,000
$800,000
$1,200,000
$1,600,000
2009 2010 2011 2012 2013 2014 2015 2016 2017 2018
113
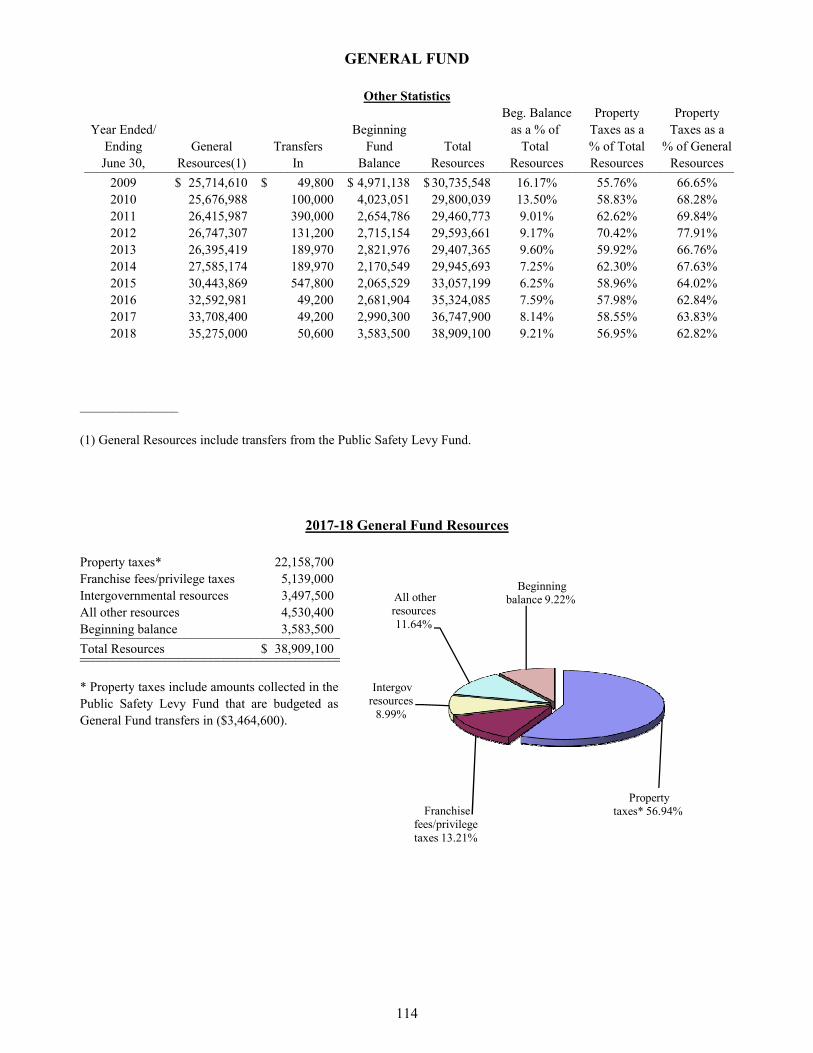
GENERAL FUND
Other StatisticsBeg. Balance Property Property
Year Ended/ Beginning as a % of Taxes as a Taxes as aEnding General Transfers Fund Total Total % of Total % of GeneralJune 30, Resources(1) In Balance Resources Resources Resources Resources____________________________________________________________________________________________________
2009 25,714,610$ 49,800$ 4,971,138$ 30,735,548$ 16.17% 55.76% 66.65%2010 25,676,988 100,000 4,023,051 29,800,039 13.50% 58.83% 68.28%2011 26,415,987 390,000 2,654,786 29,460,773 9.01% 62.62% 69.84%2012 26,747,307 131,200 2,715,154 29,593,661 9.17% 70.42% 77.91%2013 26,395,419 189,970 2,821,976 29,407,365 9.60% 59.92% 66.76%2014 27,585,174 189,970 2,170,549 29,945,693 7.25% 62.30% 67.63%2015 30,443,869 547,800 2,065,529 33,057,199 6.25% 58.96% 64.02%2016 32,592,981 49,200 2,681,904 35,324,085 7.59% 57.98% 62.84%2017 33,708,400 49,200 2,990,300 36,747,900 8.14% 58.55% 63.83%2018 35,275,000 50,600 3,583,500 38,909,100 9.21% 56.95% 62.82%
_______________
(1) General Resources include transfers from the Public Safety Levy Fund.
2017-18 General Fund Resources
Property taxes* 22,158,700Franchise fees/privilege taxes 5,139,000Intergovernmental resources 3,497,500All other resources 4,530,400Beginning balance 3,583,500________________________________________Total Resources 38,909,100$ ________________________________________________________________________________
* Property taxes include amounts collected in thePublic Safety Levy Fund that are budgeted asGeneral Fund transfers in ($3,464,600).
Property taxes* 56.94% Franchise
fees/privilege taxes 13.21%
Intergov resources
8.99%
All other resources 11.64%
Beginning balance 9.22%
114

GENERAL FUND
Expenditures/Requirements by Year
Public Community PercentYear Ended/ Safety: Development: Change
Ending Police, Fire, Planning, Nondepart- from PreviousJune 30, M. Court (1) Library Code Enf. mental (2) Total Year____________________________________________________________________________________________________
2009 21,655,993$ 2,354,223$ 1,183,428$ 1,518,853$ 26,712,497$ -2010 21,688,792 2,529,453 1,177,670 1,749,338 27,145,252 1.62% 2011 21,873,810 2,317,694 1,151,701 1,402,415 26,745,620 (1.47%) 2012 22,294,567 2,298,354 1,090,750 1,088,015 26,771,686 0.10% 2013 22,627,757 2,332,276 920,555 1,180,161 27,060,749 1.08% 2014 23,156,912 2,399,480 845,850 1,472,785 27,875,027 3.01% 2015 26,127,673 2,383,202 820,213 973,921 30,305,009 8.72% 2016 27,559,730 2,508,368 845,434 1,129,566 32,043,099 5.74% 2017 30,433,300 2,705,200 1,000,700 1,093,800 35,233,000 9.96% 2018 32,232,000 2,805,700 1,057,200 1,209,400 37,304,300 5.88%
2017-2018 General Fund Requirements Percentage of Total Budget
(2) For Nondepartmental, in Fiscal Years ending June 30, 2017 and 2018, the budgeted contingency amount has not beenincluded.
(1) In 2015 the Ambulance Fund was combined into the General Fund.
Community Development 2.83%
Nondepartmental 3.24%
Percent of Total Annual General Fund Requirementsfor Ten Fiscal Years
Year Ended/ Public Safety: Community Dev:Ending Police, Fire, Planning, Nondepart-June 30, M. Court Library Code Enf. mental Total________________________________________________________________________________________
2009 81.07% 8.81% 4.43% 5.69% 100.00%2010 79.90% 9.32% 4.34% 6.44% 100.00%2011 81.78% 8.67% 4.31% 5.24% 100.00%2012 83.28% 8.59% 4.07% 4.06% 100.00%2013 83.62% 8.62% 3.40% 4.36% 100.00%2014 83.08% 8.61% 3.03% 5.28% 100.00%2015 86.22% 7.86% 2.71% 3.21% 100.00%2016 86.00% 7.83% 2.64% 3.53% 100.00%2017 86.38% 7.68% 2.84% 3.10% 100.00%2018 86.41% 7.52% 2.83% 3.24% 100.00%
Public Safety 86.41%
Library 7.52%
115


GENERAL FUNDFranchise Fee/Privilege Tax Collections
for Fiscal Years 2009 thru 2018*
Fiscal ………..Franchise Fees……….. ….Privilege Taxes…. AnnualYear Garbage Cable/ROW Natural %
June 30, Telephone Collection Television Electricity Gas Total Change____________________________________________________________________________________________2009 237,929$ 398,630$ 463,754$ 1,838,115$ 921,177$ 3,859,605$ n/a2010 142,683 408,980 489,169 1,857,441 713,161 3,611,434 (6.43%)2011 148,548 397,377 553,248 2,000,119 680,758 3,780,050 4.67%2012 130,185 434,762 521,337 2,215,746 685,743 3,987,773 5.50%2013 114,812 452,810 535,596 2,215,530 545,888 3,864,636 (3.09%)2014 141,175 468,937 560,333 2,326,164 640,785 4,137,394 7.06%2015 98,749 420,509 634,053 2,329,364 655,354 4,138,028 0.02%2016 90,921 530,063 689,454 3,000,224 571,793 4,882,455 17.99%2017 91,100 525,500 652,300 3,120,000 612,000 5,000,900 2.43%2018 82,000 544,200 688,300 3,197,700 626,800 5,139,000 2.76%
* Actual receipts for years 2009 through 2016, amount budgeted for 2017 and 2018.
Annual Percentage Change for Each Fee and Tax
Fiscal ………..Franchise Fees……….. ….Privilege Taxes…. TotalYear Garbage Cable/ROW Natural Annual
June 30, Telephone Collection Television Electricity Gas % Change__________________________________________________________________________________2010 (40.03%) 2.60% 5.48% 1.05% (22.58%) (6.43%) 2011 4.11% (2.84%) 13.10% 7.68% (4.54%) 4.67% 2012 (12.36%) 9.41% (5.77%) 10.78% 0.73% 5.50% 2013 (11.81%) 4.15% 2.74% (0.01%) (20.39%) (3.09%) 2014 22.96% 3.56% 4.62% 4.99% 17.38% 7.06% 2015 (30.05%) (10.33%) 13.16% 0.14% 2.27% 0.02% 2016 (7.93%) 26.05% 8.74% 28.80% (12.75%) 17.99% 2017 0.20% (0.86%) (5.39%) 3.99% 7.03% 2.43% 2018 (9.99%) 3.56% 5.52% 2.49% 2.42% 2.76%
Average Annual Percentage Change for Each Fee and Tax from Fiscal Year 2009 to Fiscal Year 2018
Total………..Franchise Fees……….. ….Privilege Taxes…. Average
Garbage Cable/ROW Natural AnnualTelephone Collection Television Electricity Gas % Change________________________________________________________________________(6.55%) 3.65% 4.84% 7.40% (3.20%) 3.31%________________________________________________________________________________________________________________________________________________
116

GENERAL FUND
RESOURCE DETAIL
2017-18 % Change % of2014-15 2015-16 Adopted Revised Adopted from Fund
Resources Actual Actual Budget Budget Budget 2016-17 Budget_________________________________________________________________________________________________________________________Property Taxes - Current 16,406,772 17,197,145 17,701,400 17,701,400 18,138,600 2.47% 46.62%Property Taxes - Delinquent 662,051 529,133 580,000 580,000 555,500 (4.22%) 1.43%Privilege Tax: Electric 2,329,364 3,000,224 3,120,000 3,120,000 3,197,700 2.49% 8.22%Franchise Fees: R-O-W Carriers 43,982 57,170 33,600 33,600 50,100 49.11% 0.13%Franchise Fees: Telephone 98,749 90,921 91,100 91,100 82,000 (9.99%) 0.21%Franchise Fees: Garbage Collection 420,509 530,063 525,500 525,500 544,200 3.56% 1.40%Privilege Tax: Natural Gas 655,354 571,793 612,000 612,000 626,800 2.42% 1.61%Franchise Fees: Cable TV 590,070 632,284 618,700 618,700 638,200 3.15% 1.64%Permit Fees 75 1,500 1,300 1,300 1,500 15.38% - Number of Dogs Permit Fee 700 700 800 800 800 - - Fire Line Fees - 60,813 40,000 40,000 62,000 55.00% 0.16%Licenses 8,928 11,090 9,600 9,600 9,000 (6.25%) 0.02%Library Fees 75,242 72,504 71,800 71,800 73,100 1.81% 0.19%Planning Fees 233,985 156,310 222,800 222,800 155,600 (30.16%) 0.40%Alarm Fees 14,431 16,040 15,600 15,600 16,000 2.56% 0.04%Medical Marijuana Facility Permit 300 150 200 200 100 (50.00%) - DUII/Safety Belt Enf. Grants 10,288 10,213 9,400 9,400 10,200 8.51% 0.03%State Liquor Taxes 735,210 740,186 855,700 855,700 901,000 5.29% 2.31%State Cigarette Taxes 68,286 68,107 61,500 61,500 63,000 2.44% 0.16%State Revenue Sharing 497,413 509,112 592,800 592,800 695,600 17.34% 1.79%Conflagration Response Reimb. 60,486 264,518 80,000 80,000 50,000 (37.50%) 0.13%WComp Wage Subsidy Reimb 34,244 35,735 8,000 8,000 14,700 83.75% 0.04%OT Reimbursement - DEA 7,948 2,193 - - 1,500 - - Linn County 17,579 13,213 9,700 9,700 13,200 36.08% 0.03%Albany Rural Fire District 979,044 978,449 1,015,100 1,015,100 1,083,600 6.75% 2.78%North Albany Rural Fire District 332,060 347,830 360,900 360,900 384,000 6.40% 0.99%Palestine Rural Fire District 161,981 166,708 173,000 173,000 176,400 1.97% 0.45%GAPS Police Grant 40,000 40,000 40,000 40,000 70,000 75.00% 0.18%Linn County Victim Impact Panel Grant 3,000 - - - - - - State Department of Forestry 1,897 - - - - - - SunGuard Outside Agencies - 34,366 34,300 34,300 34,300 - 0.09%OSFM/USAR Teams Response Reimb. 14,181 20,091 19,100 19,100 20,100 5.24% 0.05%Ambulance Service Fees 2,200,718 2,357,429 2,300,000 2,300,000 2,918,200 26.88% 7.50%Fi M d F 188 435 172 990 170 000 170 000 173 000 1 76% 0 44%
………2016-17………
FireMed Fees 188,435 172,990 170,000 170,000 173,000 1.76% 0.44%Space Rental 297,300 305,600 185,700 185,700 197,900 6.57% 0.51%Municipal Court Fines 706,114 706,324 664,800 664,800 625,700 (5.88%) 1.61%Parking Violations 3,127 5,482 3,400 3,400 5,500 61.76% 0.01%Nuisance Vehicle Admin Fee 600 850 800 800 1,600 100.00% - Dog Control Assessment 3,751 3,314 2,500 2,500 3,300 32.00% 0.01%Damaged Material Fine - 2,921 - - - - - Gifts & Donations 6,335 5,044 8,400 8,400 2,900 (65.48%) 0.01%DARE Donations 925 - - - - - - Grass Abatement Fee Principal - - 300 300 800 166.67% - Miscellaneous Revenue 47,174 71,398 62,300 62,300 58,500 (6.10%) 0.15%Over & short (46) (42) - - - - - AEID Principal 35,587 29,484 31,800 31,800 25,200 (20.75%) 0.06%AEID Interest 5,775 546 700 700 500 (28.57%) - Club Sales - 275 2,000 2,000 500 (75.00%) - Interest 21,345 16,807 25,500 25,500 18,000 (29.41%) 0.05%_________________________________________________________________________________________________________________________Total Current Resources 28,021,269 29,836,981 30,362,100 30,362,100 31,700,400 4.41% 81.47%_________________________________________________________________________________________________________________________From Public Safety Levy Fund 193,500 460,000 668,100 668,100 793,600 18.78% 2.04%From General Fund - - - - - - - From Public Safety Levy-Police 995,500 1,025,400 1,303,800 1,303,800 1,356,000 4.00% 3.49%From Public Safety Levy-Fire 1,061,300 1,093,100 1,264,400 1,264,400 1,315,000 4.00% 3.38%From CARA Program - - 50,000 50,000 50,000 - 0.13%From Building Inspection - - 60,000 60,000 60,000 - 0.15%From Street Fund 500,000 - - - - - - Transfer In: Transient Room Tax 47,800 49,200 49,200 49,200 50,600 2.85% 0.13%From Public Safety Levy-Ambulance 172,300 177,500 - - - - - _________________________________________________________________________________________________________________________Total Transfers In 2,970,400 2,805,200 3,395,500 3,395,500 3,625,200 6.76% 9.32%_________________________________________________________________________________________________________________________Beginning Balance 2,065,529 2,681,904 2,870,100 2,990,300 3,583,500 19.84% 9.21%_________________________________________________________________________________________________________________________Total General Fund Resources 33,057,199$ 35,324,085$ 36,627,700$ 36,747,900$ 38,909,100$ 5.88% 100.00%__________________________________________________________________________________________________________________________________________________________________________________________________________________________________________________
117

GENERAL FUNDREVENUE/RESOURCE SUMMARY
2017-18 % Change % of2014-15 2015-16 Adopted Revised Adopted from Fund
Resource type Actual Actual Budget Budget Budget 2016-17 Budget_________________________________________________________________________________________________________________________Property taxes 17,068,822 17,726,277 18,281,400 18,281,400 18,694,100 2.26% 48.04%Franchise fees/privilege taxes 4,138,028 4,882,455 5,000,900 5,000,900 5,139,000 2.76% 13.21%Licenses & fees 333,662 319,107 362,100 362,100 318,100 (12.15%) 0.82%Intergovernmental resources 2,949,436 3,210,629 3,240,400 3,240,400 3,497,500 7.93% 8.99%Charges for service 2,700,634 2,856,110 2,674,800 2,674,800 3,309,200 23.72% 8.50%Fines & forfeitures 713,592 718,892 671,500 671,500 636,100 (5.27%) 1.63%Other resources 95,750 106,705 105,500 105,500 88,400 (16.21%) 0.23%Investment earnings 21,345 16,807 25,500 25,500 18,000 (29.41%) 0.05%_________________________________________________________________________________________________________________________Total Current Resources 28,021,270 29,836,981 30,362,100 30,362,100 31,700,400 4.41% 81.47%_________________________________________________________________________________________________________________________Transfers in 2,970,400 2,805,200 3,395,500 3,395,500 3,625,200 6.76% 9.32%Beginning balance 2,065,529 2,681,904 2,870,100 2,990,300 3,583,500 19.84% 9.21%_________________________________________________________________________________________________________________________TOTAL RESOURCES 33,057,199$ 35,324,085$ 36,627,700$ 36,747,900$ 38,909,100$ 5.88% 100.00%__________________________________________________________________________________________________________________________________________________________________________________________________________________________________________________
Category Totals and Percent of Budget
ADOPTED GENERAL FUND RESOURCES BY SOURCE
* All other: licenses & fees, charges forservice, fines & forfeitures, investment
i d h
………2016-17………
Property taxes $18,694,100 (48.04%)
Intergovernmental resources $3,497,500 (8.99%)
Transfers in $3,625,200 (9.32%)
Beginning balance $3,583,500 (9.21%)
All other* $4,369,800 (11.23%)
GENERAL FUND RESOURCES AND REQUIREMENTSTen Fiscal Years
earnings, and other resources.
Franchise fees/privilege taxes $5,139,000 (13.21%)
$0
$5,000,000
$10,000,000
$15,000,000
$20,000,000
$25,000,000
$30,000,000
$35,000,000
$40,000,000
$45,000,000
2008 2009 2010 2011 2012 2013 2014 2015 2016 2017
Requirements
Resources
118


GENERAL FUNDREQUIREMENT AND STAFFING SUMMARIES
2014-15 2015-16Program Requirements Actual Actual Adopted Revised Proposed Approved Adopted___________________________________________________________________________________________________________________Nondepartmental Materials & Services 277,424$ 246,854$ 310,200$ 310,200$ 326,500$ 326,500$ 326,500$ Transfers Out 696,497 882,712 783,600 783,600 882,900 882,900 882,900 Contingency - - 1,514,900 1,514,900 1,604,800 1,604,800 1,604,800 Municipal Court 704,107 717,316 762,700 882,900 770,500 770,500 770,500 Public Safety Levy: Fire 1,023,974 1,060,821 1,174,000 1,174,000 1,315,000 1,315,000 1,315,000 Fire & Life Safety 654,698 482,627 839,300 839,300 972,100 972,100 972,100 Fire Emergency Services 10,938,927 11,833,067 12,315,400 12,315,400 13,166,100 13,166,100 13,166,100 Police 11,868,955 12,418,339 14,007,900 14,007,900 14,652,300 14,652,300 14,652,300 Public Safety Levy: Police 937,011 1,047,560 1,213,800 1,213,800 1,356,000 1,356,000 1,356,000 Planning 820,213 845,434 1,000,700 1,000,700 1,057,200 1,057,200 1,057,200 Library 2,383,202 2,508,368 2,705,200 2,705,200 2,805,700 2,805,700 2,805,700 ___________________________________________________________________________________________________________________Total Requirements 30,305,009$ 32,043,099$ 36,627,700$ 36,747,900$ 38,909,100$ 38,909,100$ 38,909,100$ ______________________________________________________________________________________________________________________________________________________________________________________________________________________________________
Requirements by TypePersonnel 23,632,707$ 25,235,382$ 27,438,300$ 27,438,300$ 28,964,300$ 28,964,300 28,964,300Materials & Services 5,949,917 5,919,805 6,872,400 6,872,400 7,329,100 7,329,100 7,329,100Capital 25,888 5,200 18,500 138,700 128,000 128,000 128,000Transfers Out 696,497 882,712 783,600 783,600 882,900 882,900 882,900Contingency - - 1,514,900 1,514,900 1,604,800 1,604,800 1,604,800___________________________________________________________________________________________________________________Total Requirements 30,305,009$ 32,043,099$ 36,627,700$ 36,747,900$ 38,909,100$ 38,909,100$ 38,909,100$ ______________________________________________________________________________________________________________________________________________________________________________________________________________________________________
Adopted Requirements Materials Transfers Contin- Adopted % of Fundby Program and Type Personnel & Services Capital Out gency Budget Budget___________________________________________________________________________________________________________________Nondepartmental -$ 326,500$ -$ 882,900$ 1,604,800$ 2,814,200$ 7.22%Municipal Court 415,000 355,500 - - - 770,500 1.98%Public Safety Levy: Fire 1,115,400 199,600 - - - 1,315,000 3.38%Fire & Life Safety 790,200 181,900 - - - 972,100 2.50%Fire Emergency Services 10,872,600 2,193,500 100,000 - - 13,166,100 33.84%Police 12,167,400 2,456,900 28,000 - - 14,652,300 37.66%Public Safety Levy: Police 1,072,800 283,200 - - - 1,356,000 3.49%Planning 710,800 346,400 - - - 1,057,200 2.72%Library 1,820,100 985,600 - - - 2,805,700 7.21%___________________________________________________________________________________________________________________Total Requirements 28,964,300$ 7,329,100$ 128,000$ 882,900$ 1,604,800$ 38,909,100$ 100.00%______________________________________________________________________________________________________________________________________________________________________________________________________________________________________Percent of Fund Budget 74.44% 18.84% 0.33% 2.27% 4.12% 100.00%__________________________________________________________________________________________________________________________________________________________________________________________________________
2014-15 2015-16Staffing Summary (FTE) Actual Actual Adopted Revised Proposed Approved Adopted___________________________________________________________________________________________________________________Municipal Court 4.375 4.375 4.375 4.375 4.375 4.375 4.375 Public Safety Levy: Fire 8.000 8.000 8.000 8.000 8.000 8.000 8.000 Fire & Life Safety 3.000 4.000 5.000 5.000 5.000 5.000 5.000 Fire Emergency Services 61.400 67.508 67.908 67.908 73.908 73.908 73.908 Police 78.875 80.875 83.250 83.250 89.250 89.250 89.250 Public Safety Levy: Police 9.000 9.000 9.000 9.000 9.000 9.000 9.000 Planning 5.500 5.820 5.820 5.820 5.933 5.933 5.933 Library 20.925 20.925 20.925 20.925 21.200 21.200 21.200 ___________________________________________________________________________________________________________________Total FTE 191.075 200.503 204.278 204.278 216.665 216.665 216.665 ______________________________________________________________________________________________________________________________________________________________________________________________________________________________________
………2016-17……… ………2017-18………
………2016-17……… ………2017-18………
119

PROGRAM NARRATIVE
GENERAL FUND: NONDEPARTMENTAL (100-10-1003) Responsible Manager/Title: Stewart Taylor, Finance Director
FUNCTIONS AND RESPONSIBILITIES
A transfer to the Parks and Recreation Fund provides continued funding for the Boys and Girls Club, YMCA, and the Community After-School Program.
State Revenue Sharing proceeds, which are recorded as revenue in the General Fund, are transferred to the Public Transit Fund in support of the Albany Transit System and the Paratransit System.
Payments to the Albany Downtown Associa-tion from the Albany Economic Improvement District assessments are made from this program.
An outside agency grant to the Senior Meals Program is included in this budget.
Money previously appropriated for the spay/neuter program is redirected to Safe Haven for the same purpose.
Transfers from Planning and Fire to Economic Development settlement proceeds for the purchase of the E-plans system were made from this program.
120

100: General Fund
10: Finance
2014-2015 2015-2016 2016-2017 2016-2017 2017-2018 %Description Actual Actual Adopted Revised Adopted Change
EXPENDITURESMaterials & Services 277,424 246,854 310,200 310,200 326,500 5.25 % Transfers Out 696,497 882,712 783,600 783,600 882,900 12.67 % Contingencies - - 1,514,900 1,514,900 1,604,800 5.93 % TOTAL EXPENDITURES 973,921 1,129,566 2,608,700 2,608,700 2,814,200 7.88 %
CITY OF ALBANY, OREGONPROG 1003: Nondepartmental
121

PROGRAM NARRATIVE
GENERAL FUND: MUNICIPAL COURT (100-10-1029) Responsible Manager/Title: September Ridgeway, Court Supervisor
FUNCTIONS AND RESPONSIBILITIES
The Municipal Court processes citations issued by the Albany Police Department, the Code Enforcement Division, and private citizens. The court schedules and coordinates pretrial conferences and trials with attorneys, police officers, and witnesses.
Court procedures are administered by the
Municipal Court Judge, who is an attorney licensed to practice in Oregon and is appointed by the City Council under a one-year contract as a .25 FTE.
The City of Albany Municipal Court provides full-service court in addition to a traffic court.
STRATEGIES/ACTIONS
Strategic Plan Theme Target Date Status Strategies/Actions
Budget Year 2016-2017
Effective Government 10/16
Completed
Complete an RFP for new court computer system.
03/17 In Progress Develop and implement a sustainable work plan to maintain a high level of service following turnover in the Court Accounting Specialist position.
04/17 In Progress Assist the IT Department in finding and implementing a court software program compatible with the new CAD/RMS system
Budget Year 2017-2018
Effective Government 12/17 Work with the Albany Police Department and Linn County Justice to implement a more efficient and cost effective way of handling in-custody pre-trials.
Update procedures around the new court system to ensure efficiency.
PERFORMANCE MEASURES AND WORKLOAD INDICATORS 2013* 2014* 2015* 2016** Number of warrants issued 2,171 2,865 2,750 3,000 Case numbers issued 4,365 6,053 5,300 5,700 Crimes filed 1,542 1,760 1,500 1,700 Violations filed 2,626 4,101 3,400 3,800 Other filings 197 192 190 200 Municipal Court Fines*** 515,659 589,291 706,114 669,400 *Calendar Years **Estimated ***Fiscal Year Ending
STAFFING SUMMARY Budgeted FTEs 4.38 4.38 4.38 4.38
122

100: General Fund
10: Finance
2014-2015 2015-2016 2016-2017 2016-2017 2017-2018 %Description Actual Actual Adopted Revised Adopted Change
EXPENDITURESPersonnel Services 377,960 373,134 442,800 442,800 415,000 (6.28)% Materials & Services 326,147 344,182 319,900 319,900 355,500 11.13 % TOTAL EXPENDITURES 704,107 717,316 762,700 762,700 770,500 1.02 %
CITY OF ALBANY, OREGONPROG 1029: Municipal Court
123

PROGRAM NARRATIVE
GENERAL FUND: PUBLIC SAFETY LEVY (100-25-1202) Responsible Manager/Title: John R. Bradner, Fire Chief
FUNCTIONS AND RESPONSIBILITIES
Provide wages and benefits for seven Firefighter/EMT positions.
Provide wages and benefits for one Deputy Fire Marshal - Compliance position.
Provide a portion of the support costs associated with the program positions.
Provide equipment replacement funding.
STAFFING SUMMARY 2014-2015 2015-2016 2016-2017 2017-2018
Budgeted FTEs 8.00 8.00 8.00 8.00
124

100: General Fund
25: Fire
2014-2015 2015-2016 2016-2017 2016-2017 2017-2018 %Description Actual Actual Adopted Revised Adopted Change
EXPENDITURESPersonnel Services 971,823 1,010,533 1,082,600 1,082,600 1,115,400 3.03 % Materials & Services 52,151 50,288 91,400 91,400 199,600 118.38 % TOTAL EXPENDITURES 1,023,974 1,060,821 1,174,000 1,174,000 1,315,000 12.01 %
CITY OF ALBANY, OREGONPROG 1202: Public Safety Levy: Fire
125

PROGRAM NARRATIVE
GENERAL FUND: FIRE & LIFE SAFETY (100-25-1203) Responsible Manager/Title: John R. Bradner, Fire Chief
FUNCTIONS AND RESPONSIBILITIES
Investigate fires to determine point of origin and cause, and assist law enforcement with arson investigation and prosecution.
Review construction plans and conduct inspections for compliance with applicable codes.
Conduct fire and life safety inspections of priority occupancies and work with high-hazard occupancies to reduce risks to the community.
Provide records and statistics on Fire Code-regulated occupancies.
Provide public education and training for all-hazard risk reduction in the community.
Provide public information on Department operations and emergency incidents.
Provide services by contract to three rural fire districts.
Maintain and implement City of Albany Emergency Operations and Hazard Mitigation Plans.
STRATEGIES/ACTIONS
Strategic Plan Theme Target Date Status Strategies/Actions
Budget Year 2016-2017
Safe City/Effective Government 07/16 Completed Restructure and fill Fire Marshal position.
06/17 Completed Evaluate and provide for staff training needs based on reorganization of the Division.
06/17 Ongoing Evaluate current record management system.
06/17 Ongoing Adopt current Fire Code for local use.
Budget Year 2017-2018
Safe City/Effective Government 06/18 Evaluate current record management system.
06/18 Adopt current Fire Code for local use.
06/18 Support community efforts to provide cardio- pulmonary resuscitation (CPR) and automatic external defibrillator (AED) training in Albany schools.
PERFORMANCE MEASURES AND WORKLOAD INDICATORS
2014-2015 2015-2016 2016-2017 2017-2018 Number of inspections and re-inspections of Fire Code-regulated occupancies. 953 587 1,500 1,650
Fire Code violations noted vs. violations corrected. 470/233 566/456 2,499/1,239 2,000/1,500
Number of life safety education outreach activities. 287 N/A 200 400
Number of people involved in life safety education activities. 6,756 N/A 5,000 10,000
STAFFING SUMMARY
Budgeted FTEs 3.00 3.00 5.00 5.00
126

100: General Fund
25: Fire
2014-2015 2015-2016 2016-2017 2016-2017 2017-2018 %Description Actual Actual Adopted Revised Adopted Change
EXPENDITURESPersonnel Services 495,665 309,306 700,600 700,600 790,200 12.79 % Materials & Services 159,034 170,297 138,700 138,700 181,900 31.15 % TOTAL EXPENDITURES 654,699 479,603 839,300 839,300 972,100 15.82 %
CITY OF ALBANY, OREGONPROG 1203: Fire & Life Safety
127

PROGRAM NARRATIVE
GENERAL FUND: FIRE DEPARTMENT EMERGENCY SERVICES (100-25-1208) Responsible Manager/Title: John R. Bradner, Fire Chief
FUNCTIONS AND RESPONSIBILITIES
Prepare for, respond to, and mitigate medical, fire, hazardous materials, technical rescue, and water rescue emergencies; and natural or manmade disasters.
Provide fire services by contract to three rural fire districts.
Conduct fire and emergency medical service training, skills proficiency, and re-certification for certified personnel.
Provide emergency and non-emergency ambulance transport for City of Albany, Linn County, and Benton County Ambulance Service Areas.
Provide Community Paramedic Program services.
Support billing and collection services for the Ambulance and FireMed programs.
Maintain vehicles and equipment in a state of preparedness.
STRATEGIES/ACTIONS
Strategic Plan Theme Target Date Status Strategies/Actions
Budget Year 2016-2017
Safe City/Effective Government 12/16 In Progress Present annual report and successfully extend outside funding for Community Paramedic Program.
12/16 Ongoing Rollout and refinement of Single-Role EMS program (Medic 71).
06/17 Completed Complete re-chassis of one Lifeline ambulance.
06/17 In Progress Construction of the new downtown fire station (Station 11).
06/17 In Progress Implementation of new record management system and Computer Aided Dispatch software.
Budget Year 2017-2018
Safe City/Effective Government 09/17 Complete construction and move into new Station 11.
10/17 Increase the number of on-duty firefighters to address the increase in emergency calls.
10/17 Explore options for expanding Single-Role EMS program coverage.
06/18 Complete record management system and Computer Aided Dispatch software update.
06/18 Reduce number of on-the-job injuries through education and evaluation of current practices.
128

PERFORMANCE MEASURES AND WORKLOAD INDICATORS
2014-2015 2015-2016 2016-2017 2017-2018
Total emergency responses. 7,505 8,029 8,780 9,000
Civilian death/injuries. 3/1 0/4 0/0 0/0
Structure fires. 42 55 65 65
Special rescue responses (hazmat, technical, water). 52 39 39 33
Value of property responded to vs. value loss (millions of $).
$50.4/$9.4 $24.6/$2.2 $25/$2.0 $25/$2.0
Fire response time (alarm to arrival % < 6 min). 71% 71% 70% 70%
Fire response mutual aid provided vs. mutual aid received. 29/10 31/9 31/10 35/12
Field transports to out-of-community medical facilities. 635 805 780 800
Inter-facility transfers. 488 540 650 675
Billing percent received (includes Medicare write-offs). 44.9% 43.0% 43.0% 43.0%
EMS responses per 1,000 population served (Mean for cities under 100k = 77.77).
109.1 111 116 119
STAFFING SUMMARY
Budgeted FTEs *61.40 67.51 67.91 71.91 * Two Firefighter/EMT positions were funded through the SAFER grant (203-25-5098) through January 3, 2015, and then
transferred to Emergency Services (100-25-1208) for the remainder of the fiscal year.
129


100: General Fund
25: Fire
2014-2015 2015-2016 2016-2017 2016-2017 2017-2018 %Description Actual Actual Adopted Revised Adopted Change
EXPENDITURESPersonnel Services 9,021,356 9,919,047 10,146,300 10,146,300 10,872,600 7.16 % Materials & Services 1,891,684 1,911,843 2,150,600 2,150,600 2,193,500 1.99 % Capital 25,888 5,200 18,500 18,500 100,000 440.54 % TOTAL EXPENDITURES 10,938,928 11,836,090 12,315,400 12,315,400 13,166,100 6.91 %
CITY OF ALBANY, OREGONPROG 1208: Fire Emergency Services
130

PROGRAM NARRATIVE
GENERAL FUND: POLICE DEPARTMENT (100-30-1301) Responsible Manager/Title: Mario Lattanzio, Chief of Police
FUNCTIONS AND RESPONSIBILITIES
Provide community policing and crime prevention programs.
Provide effective emergency and prioritized non-emergency police response to calls for service.
Investigate all major crimes.
Conduct Citizen Academy.
Receive all emergency and non-emergency telephone calls and provide quality dispatch services to field operations.
Maintain and disseminate records in accordance with state statutes and department requirements.
Provide timely response and investigation of code violations, abandoned vehicle complaints, and animal-related issues.
STRATEGIES/ACTIONS
Strategic Plan Theme Target Date Status Strategies/Actions
Budget Year 2016-2017 Safe City 6/17 On going Maintain patrol response to priority-one calls of
4:15 minutes or less. 6/17 Reduce the number of fatal and injury accidents
by 5%. 6/17 Achieve 60% clearance rate for violent crimes. 6/17 Achieve 20% clearance rate for property crimes. 6/17 Achieve 5% reduction in Part I crimes annually. Budget Year 2017-2018 Safe City 6/18 Maintain Part I crimes at 32.0 per thousand
residents or less annually with the goal of being at or below the Oregon average.
6/18 Maintain patrol response to priority-one calls of 4:15 minutes or less.
6/18 Maintain the combined number of fatal and injury collisions at 2.5 per thousand residents or less, annually.
6/18 Achieve 60% clearance rate for violent crimes. 6/18 Achieve 20% clearance rate for property crimes.
PERFORMANCE MEASURES AND WORKLOAD INDICATORS
2015 2016 2017 2018 Number of calls for service. 59,409 57,553 61,000 60,000 Part 1 Crimes (UCR) (1). 1,821 1,560 1,730 1,650 Part 2 Crimes (UCR) (2). 5,076 5,545 5,300 5,300 Total number of arrests. 4,722 4,938 5,000 5,000 Number of uniform traffic citations and written warnings. 7,197 7,531 7,500 7,000 Animal and abandoned vehicle calls. 2,448 2,319 2,400 2,400 (1) Part 1 crimes include: homicide, rape, aggravated assault, burglary, larceny, motor vehicle theft, arson. (2) Part 2 crimes include: simple assault, forgery/fraud, weapons laws, drugs, liquor, sex, family, disorderly conduct. UCR = Uniform Crime Reporting.
STAFFING SUMMARY Budgeted FTEs 78.87 80.87 83.25 88.25
131

100: General Fund
30: Police
2014-2015 2015-2016 2016-2017 2016-2017 2017-2018 %Description Actual Actual Adopted Revised Adopted Change
EXPENDITURESPersonnel Services 9,713,763 10,261,344 11,498,400 11,498,400 12,167,400 5.82 % Materials & Services 2,155,193 2,156,994 2,509,500 2,509,500 2,456,900 (2.10)% TOTAL EXPENDITURES 11,868,956 12,418,338 14,007,900 14,007,900 14,652,300 4.60 %
CITY OF ALBANY, OREGONPROG 1301: Police
132

PROGRAM NARRATIVE
GENERAL FUND: POLICE – PUBLIC SAFETY LEVY (100-30-1302) Responsible Manager/Title: Mario Lattanzio, Chief of Police
FUNCTIONS AND RESPONSIBILITIES Provide community policing and crime prevention
programs.
Provide effective emergency and prioritized non-emergency police response to calls for service.
Receive all emergency and non-emergency telephone calls and provide quality dispatch services to field operations.
Provide analysis and research on crime patterns and trends that assist in directing police response to crime and identified programs.
STAFFING SUMMARY 2014-2015 2015-2016 2016-2017 2017-2018 Budgeted FTEs 9.00 9.00 9.00 10.00
133

100: General Fund
30: Police
2014-2015 2015-2016 2016-2017 2016-2017 2017-2018 %Description Actual Actual Adopted Revised Adopted Change
EXPENDITURESPersonnel Services 861,044 971,954 996,100 996,100 1,072,800 7.70 % Materials & Services 75,968 75,606 217,700 217,700 283,200 30.09 % TOTAL EXPENDITURES 937,012 1,047,560 1,213,800 1,213,800 1,356,000 11.72 %
CITY OF ALBANY, OREGONPROG 1302: Public Safety Levy: Police
134

PROGRAM NARRATIVE
GENERAL FUND: COMMUNITY DEVELOPMENT, PLANNING (100-40-1601) Responsible Manager/Title: Bob Richardson, Planning Manager
FUNCTIONS AND RESPONSIBILITIES Plan for the future of the City. The general plan for
the City is the Albany Comprehensive Plan and Map. Planning topics addressed in the Comprehensive Plan include transportation, housing, natural resources, economic development, social amenities, and urbanization. Planning staff keeps the Comprehensive Plan and Map up-to-date by making revisions when necessary to reflect changing conditions.
Process development proposals and annexation applications in accordance with the Albany Development Code (ADC). This includes providing accurate and consistent application and enforcement of the ADC.
Administer and revise the ADC. The ADC includes the regulations that describe how development in Albany should look and function. Planning staff keeps the ADC up-to-date by making revisions when necessary.
Provide information to citizens and developers about City regulations related to development.
Encourage preservation and rehabilitation of buildings in the City’s four National Register Historic Districts by administering the City’s Historic Preservation Program.
Provide staff support to City Council, Planning Commission, Landmarks Advisory Commission, Community Development Commission, City departments, and ad hoc committees.
Prepare long-range plans for the City. These plans typically propose new zoning designations or new public facility locations.
Administer the floodplain management program consistent with the Federal Emergency Management Agency’s (FEMA) National Floodplain Insurance Program (NFIP), and participate in FEMA’s Community Rating System (CRS).
STRATEGIES/ACTIONS
Strategic Plan Theme Target Date Status Strategies/Actions
Budget Year 2016-2017
Healthy Economy
Great Neighborhoods
06/17 In Progress Revise ADC sections affecting downtown zones and to comply with legal requirements.
Budget Year 2017-2018
Healthy Economy
Great Neighborhoods
06/18
Amend Sign Code.
06/18 Audit Comprehensive Code.
06/18 Amend ADC based on results of Code audit.
PERFORMANCE MEASURES AND WORKLOAD INDICATORS 2014-2015 2015-2016 2016-2017 2017-2018
Number of Planning applications. 104 114 80 85 Number of Pre-application meetings. 78 74 100 100 Percent of applications reviewed within state-mandated time limit.
100% 100% 100% 100%
Maintain or improve current FEMA CRS rating of 6. 6 6 6 6
STAFFING SUMMARY Budgeted FTEs 5.50 5.82 5.82 5.93
135

100: General Fund
40: Community Development
2014-2015 2015-2016 2016-2017 2016-2017 2017-2018 %Description Actual Actual Adopted Revised Adopted Change
EXPENDITURESPersonnel Services 551,863 642,379 746,400 746,400 710,800 (4.77)% Materials & Services 268,350 203,055 254,300 254,300 346,400 36.22 % TOTAL EXPENDITURES 820,213 845,434 1,000,700 1,000,700 1,057,200 5.65 %
CITY OF ALBANY, OREGONPROG 1601: Planning
136

PROGRAM NARRATIVE
GENERAL FUND: LIBRARY (100-45-1701) Responsible Manager/Title: Ed Gallagher, Library Director
FUNCTIONS AND RESPONSIBILITIES The Library provides resources to enrich the
education, cultural, and recreational opportunities of the community.
Educating Albany’s children is a significant Library priority, with a special emphasis on early childhood literacy.
The Library strives to build a diverse and dynamic collection of materials that encourages users to think and learn for themselves.
The Library provides timely, accurate, and relevant information in multiple formats for all community residents and businesses. Borrowing Library materials provides significant economic savings for the community.
The Main Library is open Monday through Wednesday, 10:00 a.m. to 8:00 p.m.; Thursday and Friday, 10:00 a.m. to 6:00 p.m.; Saturday and Sunday, 1:00 p.m. to 5:00 p.m. Operating hours for the Carnegie Library are Monday through Friday, 10:00 a.m. to 6:00 p.m.
STRATEGIES/ACTIONS
Strategic Plan Theme Target Date Status Strategies/Actions
Budget Year 2016-2017
Effective Government
06/17 Ongoing Partner with Linn County libraries to improve access to library services.
06/17 Completed Apply for Federal E-rate discounts.
Great Neighborhoods 06/17 Ongoing Collaborate with Greater Albany Public Schools (GAPS) to improve access to library services.
Budget Year 2017-2018
Great Neighborhoods
06/18 Collaborate with GAPS to improve access to library services.
Effective Government 06/18 Apply for Federal E-rate discounts.
06/18 Partner with Linn County libraries to improve access to library resources.
PERFORMANCE MEASURES AND WORKLOAD INDICATORS
2014-2015 2015-2016 2016-2017 2017-2018 . Library visitors. 363,696 342,695 350,000 360,000 Program attendance. 14,693 14,700 15,000 17,000 Circulation. 709,000 628,143 690,000 700,000
STAFFING SUMMARY Budgeted FTEs 21.40 20.90 20.93 21.20
137

100: General Fund
45: Library
2014-2015 2015-2016 2016-2017 2016-2017 2017-2018 %Description Actual Actual Adopted Revised Adopted Change
EXPENDITURESPersonnel Services 1,639,234 1,747,684 1,825,100 1,825,100 1,820,100 (0.27)% Materials & Services 743,968 760,684 880,100 880,100 985,600 11.99 % TOTAL EXPENDITURES 2,383,202 2,508,368 2,705,200 2,705,200 2,805,700 3.72 %
CITY OF ALBANY, OREGONPROG 1701: Library
138


SPECIAL
REVENUE FUNDS


SPECIAL REVENUE FUNDS
PROGRAM FUNCTIONS, REVENUE TRENDS, AND ASSUMPTIONS
Special Revenue funds are used to account for the proceeds of specific revenue sources that are legally restricted toexpenditures for specific purposes. The City has ten Special Revenue funds.
PARKS & RECREATION FUNDResponsibilities of the Parks & Recreation Fund include: coordination of sports and recreation programs; promotion andmarketing of the two annual summer concert series; maintenance of all City Parks, provision of social, cultural,educational, transportation, and health service needs of senior citizens; management of park facility capital projects; andmaintenance and enhancement of the City's urban forest. Property taxes are a major source of revenue. Under theexisting property tax limitation, the Parks & Recreation Fund no longer receives property taxes based upon voterapproved levies. Instead, the fund receives a percentage of the total property taxes received by the City, excluding localoption tax levies and property taxes levied to retire debt. For 2017-18, the Parks & Recreation Fund is forecast to receivecurrent property taxes totalling $4,513,300.
GRANTS FUNDThe Grants Fund receives monies from private citizens and agencies of local, state, and federal governments for variousprojects within the City. In Fiscal Year 2014-15, the Housing Program was moved to the Grants Fund. This programaccounts for CDBG loans and uses proceeds from those loan payments for new housing loans and grants.
BUILDING INSPECTION FUNDThe Building Inspection Fund issues building and electrical permits, conducts inspections, administers state buildingcodes and the City's Municipal Code, and assists the public with information relating to building and development codes.ADA Code Enforcement provides enforcement and investigation of complaints relating to the Americans with DisabilitiesAct and state disability access requirements. Development Code Enforcement provides enforcement and investigation ofcomplaints and code violations relating to the City's Development Code. Building officials are expecting building activityfor Budget Year 2017-18 to remain steady.
RISK MANAGEMENT FUNDFunds are accumulated in this program to mitigate risk factors and provide financial protection for deductible paymentsand liability exposure. Litigation settlement proceeds and associated projects are also accounted for in this fund.
ECONOMIC DEVELOPMENT FUNDIt is the responsibility of this fund to establish, retain, and expand businesses in Albany; to provide administrativeoversight for economic development activities; to market Albany to convention and event planners; and to support theeconomic viability and to provide oversight of the day-to-day operation of the Albany Municipal Airport.
AMBULANCE FUNDIn Fiscal Year 2013-14, the Ambulance Fund was closed and the operations of the fund were combined with the FireSuppression Program in the General Fund in the 2014-15 budget.
PUBLIC TRANSIT FUNDIncluded in the Public Transit Fund are the Albany Transit System, the Transit Loop System, and the Paratransit System.The Albany Transit System provides bus service within the City. The Transit Loop System provides transportationbetween the cities of Albany and Corvallis and Linn-Benton Community College. The Paratransit System providestransportation to essential services for the elderly or individuals who have disabilities that prevent them from using otherpublic transit. Proceeds from state revenue sharing, through transfers from the General Fund, provide 23.11 percent ofthe total fund resources. Grants from the Federal Transit Administration and local governmental agencies provide 53.04percent.
139

SPECIAL REVENUE FUNDS
PROGRAM FUNCTIONS, REVENUE TRENDS, AND ASSUMPTIONS
PUBLIC SAFETY LEVY FUNDThe Public Safety Levy Fund provides an independent accounting of property tax revenues collected from the PublicSafety Levy passed by the voters of the City in the May, 2016, Primary Election. The rate is $1.15 per $1,000 of assessedvalue for a period of five years beginning with the 2016-17 fiscal year. Fiscal Year 2016-17 is the second year of thelevy.
CAPITAL REPLACEMENT FUNDThe Capital Replacement Fund accounts for monies accumulated for the replacement of vehicles, computer equipment,and City facilities. Monies are also accumulated for major maintenance projects for General Fund fire, police, library,and administrative buildings.
STREET FUNDStreet Fund responsibilities include: street cleaning, pavement management, traffic control, storm drain maintenance,bridge maintenance, airport inspection, right-of-way maintenance, and capital improvements of the transportation system.The major source of revenue is the state gasoline tax. The State of Oregon Highway Trust Fund distributes 15.57 percentof all gas taxes to Oregon cities. The City has estimated that it will receive $2,900,000 in Fiscal Year 2017-18, increasing$100,000 from 2016-17.
The five-percent sewer and water in-lieu-of franchise fee will generate $596,100 and $530,100 from the Sewer and WaterFunds respectively. Revenues from the franchise fees are expected to rise three to five percent annually as water andsewer rates rise over the next ten years.
140

SPECIAL REVENUE FUNDS
Adopted for the Fiscal Year 2017-18
RESOURCES REQUIREMENTS
Property Taxes 8,082,400$ Personnel 6,533,900$ Transient Room Taxes 1,237,400 Materials & Services 14,529,700Licenses & Fees 2,378,400 Capital 21,901,700Intergovernmental Revenues 7,669,000 Transfers Out 5,671,300Charges for Service 2,972,000 Contingency 579,100Other Revenues 1,365,100Investment Earnings 137,500Transfers In 3,316,100Beginning Balance 22,005,300Reserved Beginning Balance 52,500
Total Resources 49,215,700$ Total Requirements 49,215,700$
Property Taxes, 16.42%
Intergovernmental Revenues, 15.58%
Beginning Balance, 46.37%
Reserved Beginning Balance, 0.11%
Special Revenue Sources by Type
Charges for Service, 6.04% Other Revenues,
2.77%
Investment Earnings, 14.36%
Personnel, 13.28%
Materials & Services, 29.52%
Capital, 44.5%
Transfers Out, 11.52%
Contingency, 1.18%
Special Revenue Requirements by Category
141

PARKS & RECREATION FUNDRESOURCE DETAIL
2017-18 % Change % of2014-15 2015-16 Adopted Revised Adopted from Fund
Resources Actual Actual Budget Budget Budget 2016-17 Budget____________________________________________________________________________________________________________________Property Taxes - Current 4,101,682$ 4,299,292$ 4,425,300$ 4,425,300$ 4,534,600$ 2.47% 47.98%Property Taxes - Delinquent 155,090 132,258 88,000 88,000 88,000 - 0.93%Parks SDC: Principal 982 1,187 3,000 3,000 2,000 (33.33%) 0.02%Parks SDC: Interest 883 162 500 500 200 (60.00%) - Parks Systems Development Charges 333,197 258,359 200,000 200,000 275,000 37.50% 2.91%Street Tree Development Fees 250 15,450 1,000 1,000 25,000 2,400.00% 0.26%State Marine Board 7,600 8,400 8,400 8,400 7,500 (10.71%) 0.08%Charges for Services 15,000 15,000 15,000 15,000 15,000 - 0.16%Agriculture Lease Payments 1,107 3,305 2,100 2,100 3,200 52.38% 0.03%CYF Recreation Fees 69,811 63,980 60,000 60,000 65,000 8.33% 0.68%CYF Sponsorships 6,000 6,532 8,000 8,000 8,000 - 0.08%Adult Recreation Fees 42,364 57,687 50,000 50,000 55,000 10.00% 0.58%Swimming Pool Receipts 96,082 74,967 81,000 81,000 81,000 - 0.86%Senior Center Rental Fees 16,907 20,803 17,000 17,000 15,000 (11.76%) 0.16%Maple Lawn Preschool Fees 78,743 90,566 88,000 88,000 96,800 10.00% 1.02%Sports Program Fees 119,498 127,000 141,000 141,000 132,000 (6.38%) 1.40%Waverly Boat Revenues 5,805 4,240 5,000 5,000 5,000 - 0.05%Park Permits 21,955 21,057 7,000 7,000 8,000 14.29% 0.08%Preschool Material/Service Fees 3,864 5,349 4,900 4,900 4,900 - 0.05%Senior Program Fees 4,865 8,543 10,000 10,000 8,000 (20.00%) 0.08%NWAAF Fees 9,840 15,045 9,500 9,500 11,200 17.89% 0.12%Hot Air Balloon Rides 11,200 10,350 7,200 7,200 7,200 - 0.08%Senior Newsletter 11,738 11,371 10,000 10,000 10,000 - 0.11%Gift Shop Revenue 10,712 10,443 9,000 9,000 10,000 11.11% 0.11%Trip Revenue 63,813 75,107 58,000 58,000 60,000 3.45% 0.64%
h di S l A i 2 9 2 8 2 000 2 000 2 400 20 00% 0 03%
……2016-17……
Merchandise Sales - Aquatics 2,759 2,785 2,000 2,000 2,400 20.00% 0.03%Cool! Facility Rental Fees 12,497 8,728 6,000 6,000 6,000 - 0.06%Concession Sales - Aquatic 16,860 13,820 11,000 11,000 11,000 - 0.12%Concession Sales - Sports 2,162 1,786 3,000 3,000 2,000 (33.33%) 0.02%Public Arts 1,549 1,119 1,500 1,500 1,000 (33.33%) 0.01%Swanson Room Rental Fees 3,200 - - - - - - Track Club Revenue 2,736 2,412 4,500 4,500 2,500 (44.44%) 0.03%Facility Enhancement Fee 6,440 8,205 6,500 6,500 6,800 4.62% 0.07%ACP Swimming Pool Receipts 159,997 156,037 150,000 150,000 140,000 (6.67%) 1.48%ACP Facility Rental Fees 24,285 24,207 20,000 20,000 20,000 - 0.21%Sport Camp Fees - - - - 500 - 0.01%Tournament Rental Fees 6,526 7,871 6,500 6,500 5,500 (15.38%) 0.06%Event Donations - - - - - - - Youth Program User Fees - 2,500 2,500 2,500 2,500 - 0.03%Community Garden Revenues 450 250 - - - - - Pool Room Revenue 792 809 800 800 700 (12.50%) 0.01%River Rhythms Food Faire 17,500 14,732 10,000 10,000 10,000 - 0.11%NWAAF Food Vendors 11,683 15,545 11,000 11,000 12,000 9.09% 0.13%Mondays at Monteith Food Vendors 1,324 - - - - - - River Rhythms Souvenir Sales 1,497 (778) 1,700 1,700 2,400 41.18% 0.03%NWAAF Souvenir Sales 9,997 4,342 4,300 4,300 1,500 (65.12%) 0.02%Summer Sounds - Food Vendors 400 2,781 2,500 2,500 2,500 - 0.03%Festival Latino - Food Vendors - - 200 200 200 - - Festival Latino Resource Fair - - - - 700 - 0.01%SDC Administrative Charges - - 32,000 32,000 32,000 - 0.34%Trolley Rental Charges 150 376 200 200 - (100.00%) - River Rhythms Donations 14,188 13,725 13,000 13,000 11,000 (15.38%) 0.11%
continued
142

PARKS & RECREATION FUNDRESOURCE DETAIL, continued
2017-18 % Change % of2014-15 2015-16 Adopted Revised Adopted from Fund
Resources, continued Actual Actual Budget Budget Budget 2016-17 Budget____________________________________________________________________________________________________________________NWAAF Donations 22,693 21,074 21,000 21,000 22,000 4.76% 0.23%Mondays at Monteith Donations 1,952 - - - - - - July 4th Sponsorships 21,000 - - - - - - Lumber to Legacy Program Revenues 25,245 224 2,000 2,000 2,000 - 0.02%Summer Sounds - Donations 120 3,534 3,000 3,000 4,000 33.33% 0.04%Summer Sounds - Sponsorships 9,793 15,802 20,000 20,000 20,000 - 0.21%Festival Latino Sponsorships - 1,000 2,000 2,000 2,500 25.00% 0.03%Gifts & Donations 8,184 9,781 7,700 7,700 12,700 64.94% 0.13%Mondays at Monteith Sponsorships (2,000) - - - - - - Senior Center Sponsorships 2,681 4,687 8,000 8,000 10,000 25.00% 0.11%CPAS Sponsorships 9,900 12,500 10,000 10,000 10,000 - 0.11%River Rhythms Sponsorships 71,502 73,858 80,000 80,000 85,000 6.25% 0.90%NWAAF Sponsorships 107,600 57,633 90,000 90,000 95,000 5.56% 0.99%Aquatic Sponsorship - 10,500 3,500 3,500 3,500 - 0.04%Sports Sponsorship 2,200 2,350 2,000 2,000 2,000 - 0.02%Aquatic Donations 61,028 73,700 64,500 64,500 67,000 3.88% 0.71%E Thornton Lake Donations 40 - - - - - - Foster Grandparent Sponsorships 1,753 - - - - - - Albany GEMS 9,818 14,741 11,000 11,000 11,000 - 0.12%Miscellaneous Revenue 14,554 15,691 9,000 9,000 9,000 - 0.10%Over & short 94 (82) - - - - - Brochure Advertising Revenue 3,030 2,880 2,500 2,500 2,500 - 0.03%General Fundraising - 168 100 100 - (100.00%) - Land Sales - 11,496 - - - - - Interest 13,659 33,100 27,100 27,100 30,100 11.07% 0.32%____________________________________________________________________________________________________________________
……2016-17……
Total Current Resources 5,870,823 5,982,338 5,961,500 5,961,500 6,189,100 3.82% 65.53%____________________________________________________________________________________________________________________From Parks Fund 8,900 23,303 63,500 63,500 60,000 (5.51%) 0.63%From General Fund 187,200 187,200 187,200 187,200 187,200 - 1.98%From Economic Development - - - - 47,000 - 0.50%From Street Fund 80,000 80,000 80,000 80,000 80,000 - 0.85%From Parks SDC Program - - 50,000 50,000 50,000 - 0.53%From Capital Projects Fund - 10,666 - - - - - Transfer In: Transient Room Tax 90,800 171,800 171,800 171,800 177,000 3.03% 1.87%From: Senior Center Endowment Fund - - - - 52,400 - 0.55%____________________________________________________________________________________________________________________Total Transfers In 366,900 472,969 552,500 552,500 653,600 18.30% 6.92%____________________________________________________________________________________________________________________Beginning Balance 2,080,828 2,299,033 2,283,800 2,283,800 2,602,400 13.95% 27.55%____________________________________________________________________________________________________________________Total Resources 8,318,551$ 8,754,340$ 8,797,800$ 8,797,800$ 9,445,100$ 7.36% 100.00%________________________________________________________________________________________________________________________________________________________________________________________________________________________________________
SUMMARY BY SOURCE
2017-18 % Change % of2014-15 2015-16 Adopted Revised Adopted from Fund
Resources Actual Actual Budget Budget Budget 2016-17 Budget____________________________________________________________________________________________________________________Property taxes 4,256,772$ 4,431,550$ 4,513,300$ 4,513,300$ 4,622,600$ 2.42% 48.94%Licenses and permits 335,312 275,158 204,500 204,500 302,200 47.78% 3.20%Intergovernmental resources 7,600 8,400 8,400 8,400 7,500 (10.71%) 0.08%Charges for services 872,104 888,870 858,900 858,900 857,500 (0.16%) 9.08%Other resources 385,375 345,261 349,300 349,300 369,200 5.70% 3.91%Investment earnings 13,659 33,100 27,100 27,100 30,100 11.07% 0.32%____________________________________________________________________________________________________________________Total Current Resources 5,870,823 5,982,338 5,961,500 5,961,500 6,189,100 3.82% 65.53%____________________________________________________________________________________________________________________Transfers in 366,900 472,969 552,500 552,500 653,600 18.30% 6.92%____________________________________________________________________________________________________________________Beginning balance 2,080,828 2,299,033 2,283,800 2,283,800 2,602,400 13.95% 27.55%____________________________________________________________________________________________________________________Total Resources 8,318,551$ 8,754,340$ 8,797,800$ 8,797,800$ 9,445,100$ 7.36% 100.00%________________________________________________________________________________________________________________________________________________________________________________________________________________________________________
……2016-17……
143

PARKS & RECREATION FUNDREQUIREMENT SUMMARIES
2014-15 2015-16Program Requirements Actual Actual Adopted Revised Proposed Approved Adopted_________________________________________________________________________________________________________________Sports Services 263,605$ 260,739$ 258,900$ 258,900$ 308,000$ 308,000$ 308,000$ Children/Youth/Family Recreation Services 271,148 306,638 359,600 359,600 419,500 419,500 419,500 Resource Development/ Marketing Services 343,569 361,919 393,100 393,100 359,000 359,000 359,000 Park Maintenance Services 1,905,206 1,941,848 2,101,000 2,101,000 1,655,600 1,655,600 1,655,600 Parks & Recreation Administration 1,367,342 1,463,534 1,744,800 1,744,800 1,755,200 1,755,200 1,755,200 Aquatic Services 791,311 768,964 831,100 831,100 878,800 878,800 878,800 Adult Recreation Services 436,527 484,813 596,800 596,800 618,500 618,500 618,500 Performance and Cultural Arts 537,022 615,799 655,600 655,600 673,500 673,500 673,500 Park Facilities Repair & Construction - - - - 744,800 744,800 744,800 Park SDC Projects 78,216 69,717 1,725,000 1,725,000 1,851,900 1,851,900 1,851,900 Senior Center Foundation 16,421 11,822 18,400 18,400 70,300 70,300 70,300 Parks Capital Improvement Program 8,995 25,273 113,500 113,500 110,000 110,000 110,000 _________________________________________________________________________________________________________________Total Requirements 6,019,363$ 6,311,067$ 8,797,800$ 8,797,800$ 9,445,100$ 9,445,100$ 9,445,100$ __________________________________________________________________________________________________________________________________________________________________________________________________________________________________
Requirements by TypePersonnel 2,469,210$ 2,627,540$ 2,980,000$ 2,980,000$ 3,124,600$ 3,124,600$ 3,124,600$ Materials & Services 3,256,266 3,433,213 3,729,600 3,729,600 3,957,500 3,957,500 3,957,500 Capital 104,887 46,707 1,591,400 1,591,400 1,872,600 1,872,600 1,872,600 Transfers Out 189,000 203,607 296,800 296,800 290,400 290,400 290,400 Contingency - - 200,000 200,000 200,000 200,000 200,000 _________________________________________________________________________________________________________________Total Requirements 6,019,363$ 6,311,067$ 8,797,800$ 8,797,800$ 9,445,100$ 9,445,100$ 9,445,100$ __________________________________________________________________________________________________________________________________________________________________________________________________________________________________
Adopted Requirements Materials Transfers Contin- Adopted % of Fundby Program and Type Personnel & Services Capital Out gency Budget Budget
……2016-17…… ……2017-18……
y g yp p g y g g_________________________________________________________________________________________________________________Sports Services 161,500 146,500 - - - 308,000$ 3.26%Children/Youth/Family Recreation Services 337,600 81,900 - - -
419,500 4.44%
Resource Development/ Marketing Services 288,100 70,900 - - -
359,000 3.80%
Park Maintenance Services 496,400 1,159,200 - - - 1,655,600 17.53%Parks & Recreation Administration 478,500 836,300 - 240,400 200,000 1,755,200 18.58%Aquatic Services 574,200 275,600 29,000 - - 878,800 9.30%Adult Recreation Services 361,300 257,200 - - - 618,500 6.55%Performance and Cultural Arts 6,000 667,500 - - - 673,500 7.13%Park Facilities Repair & Construction 421,000 126,800 197,000 - - 744,800 7.89%Park SDC Projects - 265,300 1,536,600 50,000 - 1,851,900 19.61%Senior Center Foundation - 70,300 - - - 70,300 0.75%Parks Capital Improvement Program - - 110,000 - - 110,000 1.16%_________________________________________________________________________________________________________________Total Requirements 3,124,600$ 3,957,500$ 1,872,600$ 290,400$ 200,000$ 9,445,100$ 100.00%__________________________________________________________________________________________________________________________________________________________________________________________________________________________________Percent of Fund Budget 33.08% 41.90% 19.83% 3.07% 2.12% 100.00%____________________________________________________________________________________________________________________________________________________________________________________________________________
144

PARKS & RECREATION FUNDSTAFFING SUMMARY AND REQUIREMENTS BY TYPE
2014-15 2015-16Staffing Summary (FTE) Actual Actual Adopted Revised Proposed Approved Adopted_________________________________________________________________________________________________________________Sports Services 1.000 1.000 1.000 1.000 2.000 2.000 2.000 Children/Youth/Family Recreation Services 2.975 2.975 4.075 4.075 5.013 5.013 5.013 Resource Development/ Marketing Services 2.450 2.700 2.700 2.700 2.450 2.450 2.450 Park Maintenance Services 9.500 8.500 9.500 9.500 5.500 5.500 5.500 Parks & Recreation Administration 4.245 4.450 4.450 4.450 4.700 4.700 4.700 Aquatic Services 3.500 3.500 3.500 3.500 4.000 4.000 4.000 Adult Recreation Services 2.400 3.650 3.650 3.650 3.400 3.400 3.400 Park Facilities Repair & Construction - - - - 4.000 4.000 4.000 _________________________________________________________________________________________________________________Total FTE 26.070 26.775 28.875 28.875 31.063 31.063 31.063 __________________________________________________________________________________________________________________________________________________________________________________________________________________________________
……2016-17…… ……2017-18……
Personnel $3,124,600 (33.08%)
Capital $1,872,600 (19.83%)
Transfers Out $290,400 (3.07%)
Contingency $200,000 (2.12%)
REQUIREMENTS BY TYPECategory Total and Percent of Budget
Materials & Services
$3,957,500 (41.9%)
145

PARKS & RECREATION FUND
RESOURCES BY TYPE, TEN FISCAL YEARS
Actual Revenues for 2009 through 2016, Budgeted Resources for 2017 and 2018
Intergovern- ChargesFiscal Property Parks mental for Other Transfers Beginning TotalYears Taxes SDC Resources Services Resources In Balance Resources______________________________________________________________________________________________________2009 3,643,784$ 174,297$ 9,000$ 755,639$ 376,886$ 1,631,923$ 3,719,450$ 10,310,979$ 2010 3,806,006 252,341 9,416 870,682 347,348 586,629 2,260,922 8,133,344 2011 3,952,833 178,991 11,310 809,323 261,372 1,387,117 2,498,537 9,099,483 2012 4,051,531 129,673 11,896 767,106 347,278 796,317 2,636,562 8,740,363 2013 4,043,730 220,553 7,600 756,200 323,400 521,300 1,204,500 7,077,284 2014 4,150,416 448,232 10,316 809,465 385,148 486,300 1,683,245 7,973,123 2015 4,256,772 335,312 7,600 872,104 399,034 366,900 2,080,828 8,318,551 2016 4,431,550 275,158 8,400 888,870 378,361 472,969 2,299,033 8,754,340 2017 4,513,300 204,500 8,400 858,900 376,400 552,500 2,283,800 8,797,800 2018 4,622,600 302,200 7,500 857,500 399,300 653,600 2,602,400 9,445,100
SDC - System Development Charges
PROPERTY TAXES, PARKS SDC FEES, AND CHARGES FOR SERVICESTen Fiscal Years
$5,000,000
$-
$1,000,000
$2,000,000
$3,000,000
$4,000,000
$5,000,000
2009 2010 2011 2012 2013 2014 2015 2016 2017 2018
Property Taxes Parks SDC Fees Charges for Services
146

PARKS & RECREATION FUNDTotal Property Taxes Collected per Capita and Charges for Services per Capita
Ten Fiscal Years from 2009-2018 (1)
OPERATINGFiscal EXPENDITURES/ PROPERTY CHARGESYear REQUIREMENTS TAXES (2) FOR SERVICES
Ended Amount Amount AmountJune 30, Expended per Capita Collected per Capita Received per Capita_____________________________________________________________________________________________________
2009 4,874,550$ 99.95$ 2,643,784$ 54.21$ 755,639$ 15.49$ 2010 4,973,685 101.16 3,806,006 77.41 870,682 17.71 2011 4,733,468 95.57 3,952,833 79.81 809,323 16.34 2012 5,061,393 100.57 4,051,531 80.51 767,106 15.24 2013 5,074,793 100.45 4,043,730 80.04 821,024 16.25 2014 5,380,946 106.11 4,150,416 81.85 809,465 15.96 2015 5,725,476 112.88 4,256,772 83.93 872,104 17.19 2016 6,060,753 118.21 4,431,550 86.44 888,870 17.34 2017 6,709,600 129.85 4,513,300 87.35 858,900 16.62 2018 7,082,100 134.79 4,622,600 87.98 857,500 16.32
(1) Actual figures used for 2009 through 2016. Budgeted amounts used for 2017 and 2018. (2) General property taxes are allocated 80% to the General Fund and 20% to Parks & Recreation.
Per Capita InformationOperating Expenditures/Requirements, Property Tax Receipts, and Charges for Services
$0
$20
$40
$60
$80
$100
$120
$140
$160
2009 2010 2011 2012 2013 2014 2015 2016 2017 2018
Property Taxes Charges for Services
Operating Expenditures/Requirements P.Taxes + Charges for Services
147

PARKS & RECREATION FUNDPROGRAMS SUPPORTED BY PROPERTY TAXES, USER FEES, AND OTHER RESOURCES
2017-18 % Change % of2014-15 2015-16 Adopted Revised Adopted from Fund
Resources Actual Actual Budget Budget Budget 2016-17 Budget________________________________________________________________________________________________________________Property Taxes - Current 4,101,682 4,299,292 4,425,300 4,425,300 4,534,600 2.47% 61.17%Property Taxes - Delinquent 155,090 132,258 88,000 88,000 88,000 - 1.19%Street Tree Development Fees 250 15,450 1,000 1,000 25,000 2,400.00% 0.34%State Marine Board 7,600 8,400 8,400 8,400 7,500 (10.71%) 0.10%Charges for Services 15,000 15,000 15,000 15,000 15,000 - 0.20%Agriculture Lease Payments 1,107 3,305 2,100 2,100 3,200 52.38% 0.04%CYF Recreation Fees 69,811 63,980 60,000 60,000 65,000 8.33% 0.87%CYF Sponsorships 6,000 6,532 8,000 8,000 8,000 - 0.11%Adult Recreation Fees 42,364 57,687 50,000 50,000 55,000 10.00% 0.74%Swimming Pool Receipts 96,082 74,967 81,000 81,000 81,000 - 1.09%Senior Center Rental Fees 16,907 20,803 17,000 17,000 15,000 (11.76%) 0.20%Maple Lawn Preschool Fees 78,743 90,566 88,000 88,000 96,800 10.00% 1.30%Sports Program Fees 119,498 127,000 141,000 141,000 132,000 (6.38%) 1.78%Waverly Boat Revenues 5,805 4,240 5,000 5,000 5,000 - 0.06%Park Permits 21,955 21,057 7,000 7,000 8,000 14.29% 0.11%Preschool Material/Service Fees 3,864 5,349 4,900 4,900 4,900 - 0.06%Senior Program Fees 4,865 8,543 10,000 10,000 8,000 (20.00%) 0.11%NWAAF Fees 9,840 15,045 9,500 9,500 11,200 17.89% 0.15%Hot Air Balloon Rides 11,200 10,350 7,200 7,200 7,200 - 0.10%Senior Newsletter 11,738 11,371 10,000 10,000 10,000 - 0.12%Trip Revenue 63,813 75,107 58,000 58,000 60,000 3.45% 0.81%Merchandise Sales - Aquatics 2,759 2,785 2,000 2,000 2,400 20.00% 0.03%Cool! Facility Rental Fees 12,497 8,728 6,000 6,000 6,000 - 0.08%Concession Sales - Aquatic 16,860 13,820 11,000 11,000 11,000 - 0.15%Concession Sales - Sports 2,162 1,786 3,000 3,000 2,000 (33.33%) 0.02%Public Arts 1,549 1,119 1,500 1,500 1,000 (33.33%) 0.01%Swanson Room Rental Fees 3,200 - - - - - - Track Club Revenue 2,736 2,412 4,500 4,500 2,500 (44.44%) 0.03%Facility Enhancement Fee 6,440 8,205 6,500 6,500 6,800 4.62% 0.09%ACP Swimming Pool Receipts 159,997 156,037 150,000 150,000 140,000 (6.67%) 1.89%ACP Facility Rental Fees 24,285 24,207 20,000 20,000 20,000 - 0.27%Sport Camp Fees - - - - 500 - 0.01%Tournament Rental Fees 6,526 7,871 6,500 6,500 5,500 (15.38%) 0.06%Youth Program User Fees - 2,500 2,500 2,500 2,500 - 0.03%Community Garden Revenues 450 250 - - - - - River Rhythms Food Faire 17,500 14,732 10,000 10,000 10,000 - 0.13%NWAAF Food Vendors 11,683 15,545 11,000 11,000 12,000 9.09% 0.16%Mondays at Monteith Food Vendors 1,324 - - - - - - River Rhythms Souvenir Sales 1,497 (778) 1,700 1,700 2,400 41.18% 0.03%
continued
Detailed below are the property taxes and other user fees supporting the following Parks & Recreation programs: SportsServices, Children/Youth/Family Recreation Services, Resource Developement Marketing Services, Park MaintenanceServices, Parks & Recreation Administration, Aquatic Services, Adult Recreation Services, Performance and Cultural Arts.These programs represent 78 percent of the Parks & Recreation budget. The resource items listed below are included in theParks & Recreation Fund - Resource Detail presented on previous pages.
……2016-17……
148

PARKS & RECREATION FUNDPROGRAMS SUPPORTED BY PROPERTY TAXES, USER FEES, AND OTHER RESOURCES, continued
2017-18 % Change % of2014-15 2015-16 Adopted Revised Adopted from Fund
Resources, continued Actual Actual Budget Budget Budget 2016-17 Budget_________________________________________________________________________________________________________________NWAAF Souvenir Sales 9,997 4,342 4,300 4,300 1,500 (65.12%) 0.02%Summer Sounds - Food Vendors 400 2,781 2,500 2,500 2,500 - 0.03%Festival Latino - Food Vendors - - 200 200 200 - - Festival Latino Resource Fair - - - - 700 - 0.01%SDC Administrative Charges - - 32,000 32,000 32,000 - 0.43%Trolley Rental Charges 150 376 200 200 - (100.00%) - River Rhythms Donations 14,188 13,725 13,000 13,000 11,000 (15.38%) 0.15%NWAAF Donations 22,693 21,074 21,000 21,000 22,000 4.76% 0.30%Mondays at Monteith Donations 1,952 - - - - - - July 4th Sponsorships 21,000 - - - - - - Lumber to Legacy Program Revenues 25,245 224 2,000 2,000 2,000 - 0.03%Summer Sounds - Donations 120 3,534 3,000 3,000 4,000 33.33% 0.05%Summer Sounds - Sponsorships 9,793 15,802 20,000 20,000 20,000 - 0.27%Festival Latino Sponsorships - 1,000 2,000 2,000 2,500 25.00% 0.03%Gifts & Donations 7,784 9,740 7,500 7,500 12,000 60.00% 0.16%Mondays at Monteith Sponsorships (2,000) - - - - - - Senior Center Sponsorships 2,681 4,687 8,000 8,000 10,000 25.00% 0.13%CPAS Sponsorships 9,900 12,500 10,000 10,000 10,000 - 0.13%River Rhythms Sponsorships 71,502 73,858 80,000 80,000 85,000 6.25% 1.15%NWAAF Sponsorships 107,600 57,633 90,000 90,000 95,000 5.56% 1.28%Aquatic Sponsorship - 10,500 3,500 3,500 3,500 - 0.05%Sports Sponsorship 2,200 2,350 2,000 2,000 2,000 - 0.03%Aquatic Donations 61,028 73,700 64,500 64,500 67,000 3.88% 0.90%E Thornton Lake Donations 40 - - - - - - Foster Grandparent Sponsorships 1,753 - - - - - - Albany GEMS 9,818 14,741 11,000 11,000 11,000 - 0.15%Miscellaneous Revenue 14,554 15,691 9,000 9,000 9,000 - 0.12%Over & short 94 (82) - - - - - Brochure Advertising Revenue 3,030 2,880 2,500 2,500 2,500 - 0.03%Land Sales - 11,496 - - - - - Interest 5,514 22,133 15,000 15,000 15,000 - 0.20%_________________________________________________________________________________________________________________Total Current Resources 5,515,715 5,700,206 5,735,800 5,735,800 5,885,400 2.61% 79.29%_________________________________________________________________________________________________________________From General Fund 187,200 187,200 187,200 187,200 187,200 - 2.53%From Economic Development - - - - 47,000 - 0.63%From Street Fund 80,000 80,000 80,000 80,000 80,000 - 1.08%Transfer In: Transient Room Tax 90,800 171,800 171,800 171,800 177,000 3.03% 2.39%_________________________________________________________________________________________________________________Total Transfers In 358,000 439,000 439,000 439,000 491,200 11.89% 6.63%_________________________________________________________________________________________________________________Beginning Balance 1,159,587 1,117,413 766,100 766,100 1,036,300 35.27% 13.98%_________________________________________________________________________________________________________________Total Resources 7,033,302$ 7,256,619$ 6,940,900$ 6,940,900$ 7,412,900$ 6.80% 100.00%__________________________________________________________________________________________________________________________________________________________________________________________________________________________________
Adopted Requirements Materials Transfers Contin- Adopted % of Fundby Program and Type Personnel & Services Capital Out gency Budget Budget_________________________________________________________________________________________________________________Sports Services 161,500$ 146,500$ -$ -$ -$ 308,000$ 4.15%Children/Youth/Family Rec Services 337,600 81,900 - - - 419,500 5.66%Resource Development Marketing 288,100 70,900 - - - 359,000 4.84%Park Maintenance Services 496,400 1,159,200 - - - 1,655,600 22.33%Parks & Recreation Administration 478,500 836,300 - 240,400 200,000 1,755,200 23.70%Aquatic Services 574,200 275,600 29,000 - - 878,800 11.86%Adult Recreation Services 361,300 257,200 - - - 618,500 8.34%Performance and Cultural Arts 6,000 667,500 - - - 673,500 9.09%Park Facilities Repair & Construction 421,000 126,800 197,000 - - 744,800 10.05%_________________________________________________________________________________________________________________Total Requirements 3,124,600$ 3,621,900$ 226,000$ 240,400$ 200,000$ 7,412,900$ 100.00%__________________________________________________________________________________________________________________________________________________________________________________________________________________________________Percent of Budget 42.14% 48.86% 3.05% 3.24% 2.70% 100.00%______________________________________________________________________________________________________________________________________________________________________________________________________________
……2016-17……
149


PARKS & RECREATION FUNDSELF-SUPPORTED SPECIAL PROGRAMS
2017-18 % Change % of2014-15 2015-16 Adopted Revised Adopted from Fund
Resources Actual Actual Budget Budget Budget 2016-17 Budget_______________________________________________________________________________________________________________Parks SDC: Principal 982$ 1,187$ 3,000$ 3,000$ 2,000$ (33.33%) 0.10%Parks SDC: Interest 883 162 500 500 200 (60.00%) 0.01%Parks Systems Development Charges 333,197 258,359 200,000 200,000 275,000 37.50% 13.53%Gift Shop Revenue 10,712 10,443 9,000 9,000 10,000 11.11% 0.49%Pool Room Revenue 792 809 800 800 700 (12.50%) 0.03%Gifts & Donations 400 41 200 200 700 250.00% 0.03%General Fundraising - 168 100 100 - (100.00%) - Interest 8,146 10,967 12,100 12,100 15,100 24.79% 0.74%_______________________________________________________________________________________________________________Total Current Resources 355,111 282,136 225,700 225,700 303,700 34.56% 14.93%_______________________________________________________________________________________________________________From Parks Fund 8,900 23,303 63,500 63,500 60,000 (5.51%) 2.97%From Parks SDC Program - - 50,000 50,000 50,000 - 2.46%From Capital Projects Fund - 10,666 - - - - - From Senior Center Endowment Fund - - - - 52,400 - 2.58%_______________________________________________________________________________________________________________Total Transfers In 8,900 33,969 113,500 113,500 162,400 43.08% 8.01%_______________________________________________________________________________________________________________Beginning Balance 921,240 1,181,619 1,517,700 1,517,700 1,566,100 3.19% 77.06%_______________________________________________________________________________________________________________Total Resources 1,285,252$ 1,497,724$ 1,856,900$ 1,856,900$ 2,032,200$ 9.44% 100.00%______________________________________________________________________________________________________________________________________________________________________________________________________________________________
Detailed below are the user fees and other resources used to support the following Parks & Recreation Fund programs: ParkSDC Projects, Senior Center Foundation, and Parks Capital Improvement Program. These programs represent 22 percent ofthe total Parks & Recreation Fund budget. The resource items listed below are included in the Parks & Recreation Fund -Resource Detail presented on previous pages.
……2016-17……
Adopted Requirements Materials Transfers Adopted % of Fundby Program and Type & Services Capital Out Budget Budget_______________________________________________________________________________________________________________Park SDC Projects 265,300 1,536,600 50,000 1,851,900$ 91.13%Senior Center Foundation 70,300 - - 70,300 3.46%Parks Capital Improvement Program - 110,000 - 110,000 5.41%_______________________________________________________________________________________________________________Total Requirements 335,600$ 1,646,600$ 50,000$ 2,032,200$ 100.00%______________________________________________________________________________________________________________________________________________________________________________________________________________________________Percent of Budget 16.51% 81.03% 2.46% 100.00%__________________________________________________________________________________________________________________________________________________________________________________________________________
REQUIREMENTS BY TYPECategory Totals and Percent of Budget
Materials & Services $335,600
(16.51%)Capital $1,646,600
(81.03%)
Transfers Out $50,000 (2.46%)
150

PROGRAM NARRATIVE
Parks and Recreation Fund: Parks & Recreation Department, Sports Services (202-35-1402)
Responsible Manager/Title: Ed Hodney, Parks & Recreation Director
FUNCTIONS AND RESPONSIBILITIES
Provide opportunities for positive participation in recreational athletics programs to Albany residents.
Accurately plan, prepare, monitor, and control the Sports Services budget.
Provide long-term vision and direction to ensure the program’s viability while keeping abreast of new opportunities for involving residents in an active lifestyle.
STRATEGIES/ACTIONS
Strategic Plan Theme
Target Date Status Strategies/Actions
Budget Year 2016-2017
Great Neighborhoods/Effective Government
10/16 In Progress Install recycle centers at both softball complexes in an effort to create a greener program for the City.
Effective Government 01/17 Completed Complete a comprehensive Sports Master Plan to coincide with Parks Master Plan.
06/16 In Progress Sustain a minimum cost recovery program of 60% recovery of expenditures with non-tax revenues.
06/16 Completed Build quality infields for softball program.
Budget Year 2017-2018
Great Neighborhoods/Effective Government
12/17 Develop and implement a new Sporting Events Plan to increase program revenues by 15% by Fiscal Year 2019.
Effective Government 06/18 Develop programming and financial strategies to achieve a cost recovery rate of at least 50% by Fiscal Year 2019.
Great Neighborhoods/Effective Government
05/18 Complete the installation of recycling centers at both softball complexes in an effort to create a greener program for the City.
PERFORMANCE MEASURES AND WORKLOAD INDICATORS 2014-2015 2015-2016 2016-2017 2017-2018 Number of participants in a City sports program during the year.
6,950 7,100 7,150 7,000
Number of participant hours in a City sports program activity during the year.
118,150 120,700 121,500 119,000
Percentage of total sports expenditures recovered with non-tax revenues.
50% 61% 59% 47%
STAFFING SUMMARY Budgeted FTEs 1.00 1.00 1.00 2.00
151

202: Parks & Recreation
35: Parks
2014-2015 2015-2016 2016-2017 2016-2017 2017-2018 %Description Actual Actual Adopted Revised Adopted Change
EXPENDITURESPersonnel Services 131,353 115,756 116,900 116,900 161,500 38.15 % Materials & Services 132,252 144,983 142,000 142,000 146,500 3.17 % TOTAL EXPENDITURES 263,605 260,739 258,900 258,900 308,000 18.96 %
CITY OF ALBANY, OREGONPROG 1402: Sports Services
152

PROGRAM NARRATIVE
Parks and Recreation Fund: Parks & Recreation Department, Children/Youth/Family Recreation Services (202-35-1403)
Responsible Manager/Title: Katie Nooshazar, Recreation Program Manager
FUNCTIONS AND RESPONSIBILITIES
Offer diverse opportunities for quality recreation and cultural programs for children, youth, and families (CYF) in order to build skills and provide a positive lifestyle and leisure options.
Develop and maintain partnerships with community agencies, businesses, and service organizations to achieve objectives, promote cooperation, avoid
duplications of service, and provide activities designed to meet community needs.
Coordinate recreation and summer learning programs for children in a community setting that develops problem-solving skills, builds self-esteem, enhances learning skills, and encourages personal responsibility.
STRATEGIES/ACTIONS
Strategic Plan Theme
Target Date Status Strategies/Actions
Budget Year 2016-2017
Great Neighborhoods 06/17 Completed Enhance Festival Latino offerings to improve attendee experience and impact on community.
Effective Government 06/17 Completed Implement on-line registration for classes, camps, and activities.
06/17 Completed Develop and implement revised staffing structure to better meet programming needs.
Budget Year 2017-2018
Great Neighborhoods 06/18 Evaluate Children’s Performing Art Series and implement changes as needed.
06/18 Enhance nature, science, and Science, Technology, Engineering, Art, and Math (STEAM) recreation opportunities for youth.
Effective Government/Great Neighborhoods
06/18 Create a service plan and revenue enhancement plan that will increase revenue by 15% in Fiscal Year 2019 and expand reach to underserved populations and target markets.
PERFORMANCE MEASURES AND WORKLOAD INDICATORS 2014-2015 2015-2016 2016-2017 2017-2018 Percentage of class and program participants who are satisfied with services.
90% 90% 98% 95%
Percentage of total program cost recovered with non-tax revenues.
51% 49% 49% 45%
STAFFING SUMMARY Budgeted FTEs 2.98 2.98 3.35 4.58
153

202: Parks & Recreation
35: Parks
2014-2015 2015-2016 2016-2017 2016-2017 2017-2018 %Description Actual Actual Adopted Revised Adopted Change
EXPENDITURESPersonnel Services 203,211 218,838 271,300 271,300 337,600 24.44 % Materials & Services 67,937 87,800 88,300 88,300 81,900 (7.25)% TOTAL EXPENDITURES 271,148 306,638 359,600 359,600 419,500 16.66 %
CITY OF ALBANY, OREGONPROG 1403: Children/Youth/Family Rec Services
154

PROGRAM NARRATIVE
Parks & Recreation Fund: Parks & Recreation Department, Resource Development & Marketing Services (202-35-1404)
Responsible Manager/Title: Katie Nooshazar, Recreation Program Manager
FUNCTIONS AND RESPONSIBILITIES
Develop revenue sources that will support the recreation experiences, services, and facilities the community wants and needs.
Coordinate sponsorships and partnership programs, including proposals, recognition, and identification of appropriate sponsorship opportunities.
Manage comprehensive marketing efforts for Parks & Recreation Department in order to solidify community niche and position Department in appropriate community roles.
Coordinate all branding and publicity efforts for Parks & Recreation Department.
STRATEGIES/ACTIONS
Strategic Plan Theme
Target Date Status Strategies/Actions
Budget Year 2016-2017
Effective Government 06/17 Completed Implement social media strategy to engage community and identify needs.
06/17 Completed Rebrand major events as appropriate.
06/17 In Progress Secure presenting sponsor for Northwest Art & Air Festival.
Budget Year 2017-2018
Effective Government 06/18 Secure presenting sponsor for Northwest Art & Air Festival.
06/18 Develop strategy to incorporate Albany Parks & Recreation Foundation into Department’s revenue opportunities, including grants, gifts, and donations.
06/18 Develop a services plan that will expand marketing reach to engage underserved populations.
PERFORMANCE MEASURES AND WORKLOAD INDICATORS
2014-2015 2015-2016 2016-2017 2017-2018 Per capita revenue from endowments, grants, foundations, solicitations, and donations
$7.86 $6.35 $7.76 $9.50
STAFFING SUMMARY Budgeted FTEs 2.45 2.70 2.70 2.45
155

202: Parks & Recreation
35: Parks
2014-2015 2015-2016 2016-2017 2016-2017 2017-2018 %Description Actual Actual Adopted Revised Adopted Change
EXPENDITURESPersonnel Services 282,464 297,706 316,700 316,700 288,100 (9.03)% Materials & Services 61,105 64,213 76,400 76,400 70,900 (7.20)% TOTAL EXPENDITURES 343,569 361,919 393,100 393,100 359,000 (8.67)%
CITY OF ALBANY, OREGONPROG 1404: Resource Dev. Marketing Services
156

PROGRAM NARRATIVE
Parks & Recreation Fund: Parks & Recreation Department, Park Maintenance Service (202-35-1407)
Responsible Manager/Title: Rick Barnett, Park Operations Supervisor
FUNCTIONS AND RESPONSIBILITIES
Maintains and operates all City parks and facilities in a safe, clean, attractive, and affordable manner by using responsive and efficient procedures.
Responsible for the Urban Forestry Program including street tree maintenance.
Coordinates volunteer program for work in parks, trails, and natural areas.
Supports Recreation Division programs through coordination and implementation of event logistics.
STRATEGIES/ACTIONS
Strategic Plan Theme Target Date Status Strategies/Actions
Budget Year 2016-2017
Great Neighborhoods 06/17 Completed Partner with American Youth Soccer Organization (AYSO) for rebuilding of Timber Linn Park Soccer fields – Phase I.
Effective Government 06/17 In Progress Develop management protocols for invasive aquatic vegetation.
12/16 Completed Implement new urban forestry contract.
Budget Year 2017-2018
Effective Government 06/18 Support Engineering, Streets, and other City departments with natural resources-related projects.
08/17 Establish a more efficient, consistent park custodial program.
01/18 Implement a more efficient work order system.
PERFORMANCE MEASURES AND WORKLOAD INDICATORS 2014-2015 2015-2016 2016-2017 2017-2018 Developed acres of parkland per 1,000 population (Based on 895 total park acres. Number changes as population grows).
10.87 10.75 10.75 10.75
Avg. cost of maintenance per developed acre. $2,780 $2,780 $2,850 $1,840 Percentage of time lost to work-related injuries. 0% 0% 0% 0% FTE per 1,000 residents. .19 .19 .19 .11 Est. number of trees responsible for maintaining.
13,000 13,000 13,000 13,000
Est. number of trees receiving maintenance. 3,200 3,200 3,200 3,200 Total tree maintenance expenditures. $65,000 $65,000 $70,000 $81,000
STAFFING SUMMARY
Budgeted FTEs 8.50 8.50 9.50 5.50*
*New Program Division Established (202-35-1420) 157

202: Parks & Recreation
35: Parks
2014-2015 2015-2016 2016-2017 2016-2017 2017-2018 %Description Actual Actual Adopted Revised Adopted Change
EXPENDITURESPersonnel Services 751,601 797,705 890,400 890,400 496,400 (44.25)% Materials & Services 1,064,870 1,144,143 1,113,600 1,113,600 1,159,200 4.09 % Capital 88,734 - 97,000 97,000 - (100.00)% TOTAL EXPENDITURES 1,905,205 1,941,848 2,101,000 2,101,000 1,655,600 (21.20)%
CITY OF ALBANY, OREGONPROG 1407: Park Maintenance Services
158

PROGRAM NARRATIVE
Parks and Recreation Fund: Parks & Recreation Department,
Park Administration (202-35-1408) Responsible Manager/Title: Ed Hodney, Parks and Recreation Director
FUNCTIONS AND RESPONSIBILITIES Organize and administer department personnel, resources,
facilities, programs, and activities to achieve City and department goals.
Provide customer service to citizens who visit or contact the Parks & Recreation Department and other City Hall offices.
Working with the Albany Arts Commission, promote and provide oversight for the installation or display of public art at City facilities and other public spaces.
Plan and implement scheduled Parks capital improvement projects.
Provide administrative support to the Parks & Recreation Commission, City Tree Commission, Albany Arts Commission, and Senior Center Endowment Committee.
STRATEGIES/ACTIONS
Strategic Plan Theme
Target Date Status Strategies/Actions
Budget Year 2016-2017
Great Neighborhoods 06/17 In Progress Complete Parks Plan update through the University of Oregon (UO) Sustainable Cities Program.
06/17 Deferred to FY17-18
Draft a Public Arts Strategic Plan for City Council review through UO Sustainable Cities Program.
Effective Government 06/17 Completed Establish and launch new 501c3 Albany Parks & Recreation Foundation.
Budget Year 2017-2018
Effective Government 06/18 Complete Parks Plan update through UO Sustainable Cities Program.
06/18 Draft a Public Arts Strategic Plan for City Council review through UO Sustainable Cities Program.
06/18 Complete a plan for the first phase of East Thornton Lake Natural Area (ETLNA) development.
PERFORMANCE MEASURES AND WORKLOAD INDICATORS 2014-2015 2015-2016 2016-2017 2017-2018 Percentage of total Fund 202 operating expenditures subsidized with property tax revenues.*
51% 56% 55% 54%
Per capita revenue from endowments, grants, foundations, solicitations, and donations.
$10.42 $7.86 8.00 $9.50
STAFFING SUMMARY Budgeted FTEs 4.15 4.45 4.45 4.70 *Fund 202 operating expenditures only includes programs 1402, 1403, 1404, 1407, 1408, 1410, 1413, and 1414.
159

202: Parks & Recreation
35: Parks
2014-2015 2015-2016 2016-2017 2016-2017 2017-2018 %Description Actual Actual Adopted Revised Adopted Change
EXPENDITURESPersonnel Services 389,658 431,413 456,000 456,000 478,500 4.93 % Materials & Services 788,683 828,514 842,000 842,000 836,300 (0.68)% Transfers Out 189,000 203,607 246,800 246,800 240,400 (2.59)% Contingencies - - 200,000 200,000 200,000 - %TOTAL EXPENDITURES 1,367,341 1,463,534 1,744,800 1,744,800 1,755,200 0.60 %
CITY OF ALBANY, OREGONPROG 1408: Parks & Recreation Admin
160

PROGRAM NARRATIVE
Parks & Recreation Fund: Parks & Recreation Department, Aquatic Services (202-35-1410)
Responsible Manager/Title: Rob Romancier, Recreation Program Manager
FUNCTIONS AND RESPONSIBILITIES Meet the needs of our community by offering a wide
variety of aquatic programs and activities that encourage participation at all levels and result in increased health, wellness, and recreation for participants.
Promote water safety and prevent accidental drowning through water awareness with a focus on youth.
Provide a safe and positive environment and activities for all ages.
Provide indoor year-round facility for educational community use and team sports. Provide outdoor recreation and fitness facility in the summer. Operate wading pool.
OBJECTIVES AND STRATEGIES/ACTIONS
Strategic Plan Theme
Target Date Status Strategies/Actions
Budget Year 2016-2017
Great Neighborhoods 12/16 Completed Work with community partners to expand program offerings to diverse populations.
Safe City 09/16 In Progress Increase the number of staff trainings for emergency situations.
Effective Government 07/16 Completed Recruit, train, and retain certified staff.
Budget Year 2017-2018
Effective Government 08/17 Create new programs/strategies to increase usage.
06/18 Advertise our programs using TV, Facebook, and Twitter.
Safe City 12/17 Improve pool equipment room safety and staff competency through additional training.
PERFORMANCE MEASURES AND WORKLOAD INDICATORS 2014-2015 2015-2016 2016-2017 2017-2018 Percentage of users who are satisfied or very satisfied with their aquatic experience.
95% 96% 96% 90%
Percentage of program costs recovered with non-tax revenues.
44% 44% 41% 38%
STAFFING SUMMARY Budgeted FTEs 3.50 3.50 3.50 4.00
161

202: Parks & Recreation
35: Parks
2014-2015 2015-2016 2016-2017 2016-2017 2017-2018 %Description Actual Actual Adopted Revised Adopted Change
EXPENDITURESPersonnel Services 494,833 499,717 550,800 550,800 574,200 4.25 % Materials & Services 289,322 247,812 267,300 267,300 275,600 3.11 % Capital 7,157 21,434 13,000 13,000 29,000 123.08 % TOTAL EXPENDITURES 791,312 768,963 831,100 831,100 878,800 5.74 %
CITY OF ALBANY, OREGONPROG 1410: Aquatic Services
162

PROGRAM NARRATIVE
Parks and Recreation Fund: Parks & Recreation Department, Adult Recreation Services (202-35-1413)
Responsible Manager/Title: Katie Nooshazar, Recreation Program Manager
FUNCTIONS AND RESPONSIBILITIES
Offer diverse, quality recreational services for adults and seniors in order to promote wellness, provide positive leisure choices, build skills, and contribute to a strong healthy community.
Provide facilities and infrastructure needed to meet community’s recreational needs.
Develop partnerships with community agencies and businesses to provide recreation experiences for adults and seniors.
Recruit, train, and recognize qualified volunteers, providing opportunities for them to make meaningful contributions to the community.
STRATEGIES/ACTIONS
Strategic Plan Theme
Target Date Status Strategies/Actions
Budget Year 2016-2017
Effective Government 06/17 In Progress Finalize and implement programming goals and strategies.
06/17 In Progress Develop and implement process for updating and rebranding Senior Center.
06/17 Completed Implement on-line registration for classes, tours, and activities.
Budget Year 2017-2018
Effective Government 06/18 Finalize and implement programming goals and strategies to reach underserved older adults, including baby boomers.
06/18 Develop and implement process for updating and rebranding Senior Center.
06/18 Develop revenue enhancement strategies that will increase program revenues by 15% in Fiscal Year 2019.
PERFORMANCE MEASURES AND WORKLOAD INDICATORS 2014-2015 2015-2016 2016-2017 2017-2018 Percentage of participants who are satisfied with level of service received.
95% 98% 98% 98%
Percentage of facility renters who are satisfied with services rendered.
95% 98% 95% 95%
Percentage of total program costs recovered with non-tax revenues.
37% 31% 27% 27%
STAFFING SUMMARY Budgeted FTEs 2.40 3.65 3.65 3.40
163

202: Parks & Recreation
35: Parks
2014-2015 2015-2016 2016-2017 2016-2017 2017-2018 %Description Actual Actual Adopted Revised Adopted Change
EXPENDITURESPersonnel Services 207,841 254,763 368,500 368,500 361,300 (1.95)% Materials & Services 228,686 230,051 228,300 228,300 257,200 12.66 % TOTAL EXPENDITURES 436,527 484,814 596,800 596,800 618,500 3.64 %
CITY OF ALBANY, OREGONPROG 1413: Adult Recreation Services
164

PROGRAM NARRATIVE
Parks and Recreation Fund: Parks & Recreation Department, Performance and Cultural Arts (202-35-1414)
Responsible Manager/Title: Katie Nooshazar, Recreation Program Manager
FUNCTIONS AND RESPONSIBILITIES
Provide events that enhance Albany’s livability for residents and draw visitors from throughout the Northwest, helping to support the local economy.
Utilize community sponsorships to provide funding for diverse events.
Promote free music and art activities providing opportunities for cultural enrichment and development of great neighborhoods.
Utilize events to showcase business and industry in order to create a positive economic impact on the community.
OBJECTIVES AND STRATEGIES/ACTIONS
Strategic Plan Theme Target Date Status Objectives and Strategies/Actions
Budget Year 2016-2017
Great Neighborhoods 09/16 Completed Add additional event feature to Northwest Art & Air Festival (NWAAF) to draw attendees and improve attendee experience.
Effective Government 09/16 Completed Rebrand NWAA to reflect new sponsorship focus.
Great Neighborhoods 06/17 In progress Secure presenting sponsor for NWAAF.
Budget Year 2017-2018
Great Neighborhoods 06/18 Secure presenting sponsor for NWAAF Festival, and Summer Sounds.
09/17 Add feature of Oregon Pilots Association conference to NWAAF.
Effective Government 06/18 Evaluate and restructure Children’s Performing Art Series.
PERFORMANCE MEASURES AND WORKLOAD INDICATORS 2014-2015 2015-2016 2016-2017 2017-2018 Number of individuals attending Performance Series.*
8,800 10,600 140,000 145,000
Percent of participants who are satisfied or very satisfied with the quality of the event.
95% 98% 98% 98%
Number of individuals attending NWAAF. 50,000 61,000 60,100 63,000
Percent of sponsors satisfied or very satisfied with events.
95% 97% 98% 98%
Percent of program costs recovered with non-tax revenues.
63% 67% 65% 67%
Expenditures avoided through donations of in-kind services and materials.
$177,000 $180,000 $201,700 $209,500
*Revised Performance Measure in FY 2016-2017
STAFFING SUMMARY
Budgeted FTEs 0.00 0.00 0.00 0.00
165

202: Parks & Recreation
35: Parks
2014-2015 2015-2016 2016-2017 2016-2017 2017-2018 %Description Actual Actual Adopted Revised Adopted Change
EXPENDITURESPersonnel Services 8,249 11,641 9,400 9,400 6,000 (36.17)% Materials & Services 528,773 604,158 646,200 646,200 667,500 3.30 % TOTAL EXPENDITURES 537,022 615,799 655,600 655,600 673,500 2.73 %
CITY OF ALBANY, OREGONPROG 1414: Performance and Cultural Arts
166

PROGRAM NARRATIVE
Parks & Recreation Fund: Parks & Recreation Department, Park Facilities Repair and Construction (202-35-1420)
Responsible Manager/Title: Gary Carlson, Park Operations Supervisor
FUNCTIONS AND RESPONSIBILITIES
Responsible for maintenance projects and repair operations on all City park properties. This is a new program in Fiscal Year 2017-2018.
Secures and coordinates grants and other funding sources which finance projects.
Maintains and ensures that all City parks, playgrounds, and facilities are kept in safe, clean, attractive and affordable manner by using responsible and efficient procedures.
STRATEGIES/ACTIONS
Strategic Plan Theme Target Date Status Strategies/Actions
Budget Year 2017-2018
Great Neighborhoods 06/18 Manage the renovation of Sunrise Park.
06/18 Install new floating docks at Waverly Park.
Effective Government 06/18 Work with Oregon State Marine Board to replace dock at Takena Landing.
06/18 Develop short- and long-term plans for repair and maintenance of aging City parks, and implement appropriate software tracking system.
PERFORMANCE MEASURES AND WORKLOAD INDICATORS 2014-2015 2015-2016 2016-2017 2017-2018* Repair or replace 300 linear feet of walkway and sidewalk.
n/a n/a n/a 300ft
Number of hours related to repair/replacement projects.
n/a n/a n/a 4,000
Percentage of time lost to work-related injuries. n/a n/a n/a 0% FTE per 1,000 residents. n/a n/a n/a .08 *New Program Division Established STAFFING SUMMARY
Budgeted FTEs n/a n/a n/a 4.00
167

202: Parks & Recreation
35: Parks
2014-2015 2015-2016 2016-2017 2016-2017 2017-2018 %Description Actual Actual Adopted Revised Adopted Change
EXPENDITURESPersonnel Services - - - - 421,000 - %Materials & Services - - - - 126,800 - %Capital - - - - 197,000 - %TOTAL EXPENDITURES - - - - 744,800 - %
CITY OF ALBANY, OREGONPROG 1420: Park Facilities Repair & Construction
168

PROGRAM NARRATIVE
Parks & Recreation Fund: Parks & Recreation Department, Parks SDC Projects (202-35-1500)
Responsible Manager/Title: Ed Hodney, Parks and Recreation Director
FUNCTIONS AND RESPONSIBILITIES
Implement growth-related projects included in the 2006 Parks & Recreation Master Plan through planning, acquisition, design, and construction of new parks and facilities.
STRATEGIES/ACTIONS
Strategic Plan Theme
Target Date Status Strategies/Actions
Budget Year 2016-2017
Effective Government 06/17 In progress Complete SDC-funded projects as programmed.
Budget Year 2017-2018 06/18
Effective Government Complete SDC-funded projects as programmed.
PERFORMANCE MEASURES AND WORKLOAD INDICATORS 2014-2015 2015-2016 2016-2017 2017-2018 Number of acres of park land. 895 895 895 895
Number of acres of park land per 1,000 pop. (*changes as population grows).
17.3* 17.3* 17.1 17.1
169

202: Parks & Recreation
35: Parks
2014-2015 2015-2016 2016-2017 2016-2017 2017-2018 %Description Actual Actual Adopted Revised Adopted Change
REVENUESLicenses and Fees 335,062 259,708 203,500 203,500 277,200 36.22%Miscellaneous Revenue - - - - - 0.00%Investment Income 9,689 12,732 12,000 12,000 15,000 25.00%Investment Income - 10,666 - 0 - 0.00%Beginning Balance 1,138,032 1,404,567 1,509,500 1,509,500 1,559,700 3.33%TOTAL REVENUES 1,482,783 1,687,673 1,725,000 1,725,000 1,851,900 7.36 %
EXPENDITURESPersonnel Services - - - - - - %Materials & Services 78,216 69,717 307,100 307,100 265,300 (13.61)% Capital - - 1,367,900 1,367,900 1,536,600 12.33 % Transfers Out - - 50,000 50,000 50,000 - %TOTAL EXPENDITURES 78,216 69,717 1,725,000 1,725,000 1,851,900 7.36 %
Prog 1500: Park SDC Projects Revenues less Expenditures 1,404,567 1,617,956 - - -
CITY OF ALBANY, OREGONPROG 1500: Park SDC Projects
170

PROGRAM NARRATIVE
Parks and Recreation Fund: Parks & Recreation Department, Senior Center Foundation (202-35-1506)
Responsible Manager/Title: Katie Nooshazar, Recreation Programs Manager
FUNCTIONS AND RESPONSIBILITIES
Assist with coordination of activities and services offered by the senior groups using the Albany Senior Center.
Provide support and assistance to Recreation staff in order to meet the needs of older adults in Albany.
Provide funding that supports Senior Center programming.
Assist with planning and implementation of programs and special events.
STRATEGIES/ACTIONS
Strategic Plan Theme
Target Date Status Strategies/Actions
Budget Year 2016-2017
Great Neighborhoods 06/17 Completed Assist with strategies to revise volunteer celebration and recognition program.
06/17 In Progress Assist with evaluation of rebranding and remodeling needs of the Senior Center.
Budget Year 2017-2018
Great Neighborhoods 06/18 Assist with evaluation of rebranding and remodeling needs of the Senior Center.
171

202: Parks & Recreation
35: Parks
2014-2015 2015-2016 2016-2017 2016-2017 2017-2018 %Description Actual Actual Adopted Revised Adopted Change
REVENUESLicenses and Fees 11,504 11,252 9,800 9,800 10,700 9.18 % Miscellaneous Revenue 400 209 300 300 700 133.33 % Investment Income 130 163 100 100 100 - %Transfers In - - - - 52,400 - %Beginning Balance 17,891 13,504 8,200 8,200 6,400 (21.95)% TOTAL REVENUES 29,925 25,128 18,400 18,400 70,300 282.07 %
EXPENDITURESMaterials & Services 16,421 11,822 18,400 18,400 70,300 282.07 % TOTAL EXPENDITURES 16,421 11,822 18,400 18,400 70,300 282.07 %
Prog 1506: Senior Center Foundation Revenues less Expenditures 13,504 13,306 - - -
CITY OF ALBANY, OREGONPROG 1506: Senior Center Foundation
172

PROGRAM NARRATIVE
Parks and Recreation Fund: Parks & Recreation Department, Parks Capital Improvement Projects (202-35-1507)
Responsible Manager/Title: Ed Hodney, Parks and Recreation Director
FUNCTIONS AND RESPONSIBILITIES
Implement Capital Improvement Projects (CIP) that are funded with revenue other than grants.
STRATEGIES/ACTIONS
Strategic Plan Theme
Target Date Status Strategies/Actions
Budget Year 2016-2017
Effective Government
Great Neighborhoods
06/17 In Progress Complete projects as scheduled in the FY 2016-2017 CIP.
Budget Year 2017-2018
Effective Government
Great Neighborhoods
06/18 Complete projects as scheduled in the FY 2017-2018 CIP.
173

202: Parks & Recreation
35: Parks
2014-2015 2015-2016 2016-2017 2016-2017 2017-2018 %Description Actual Actual Adopted Revised Adopted Change
REVENUESInvestment Income (1,673) (1,928) - - - - %Transfers In 8,900 23,303 113,500 113,500 110,000 (3.08)% Beginning Balance (234,683) (236,451) - - - - %TOTAL REVENUES (227,456) (215,076) 113,500 113,500 110,000 (3.08)%
EXPENDITURESCapital 8,995 25,273 113,500 113,500 110,000 (3.08)% TOTAL EXPENDITURES 8,995 25,273 113,500 113,500 110,000 (3.08)%
Prog 1506: Senior Center Foundation Revenues less Expenditures (236,451) (240,349) - - -
CITY OF ALBANY, OREGONPROG 1507: Parks Capital Improvement Program
174

Grants Fund
Grant Descriptions The Grants Fund receives monies from private citizens and agencies of local, state, and federal governments for various projects within the City. The following grants have been budgeted for the 2017-2018 Budget Year: State Hazardous Materials Emergency Preparedness (HMEP) Grant (203-25-5089): $17,300 on behalf of the Mid-Valley Local Emergency Planning Committee to provide hazardous materials education, training, and evacuation planning. Community Paramedic Program Grant (203-25-5117): $145,200 provides a transformational model of healthcare that connects at-risk populations to appropriate resources in the community and reduces the use of traditional emergency services. Ground Emergency Medical Transport Grant (203-25-5121): $100,000 Federally-backed Medicaid entitlement program that allows public EMS providers the ability to collect a percentage of their uncompensated costs for providing care to Medicaid patients. Department of Justice Bulletproof Vest Grant (203-30-5008): $8,000 Grant proceeds provide 50 percent matching funds to law enforcement agencies to purchase replacement bulletproof vests. Department of Justice Equitable Sharing (203-30-5096): $52,100 Grant proceeds are from asset forfeitures. Equitable Sharing may only be used for law enforcement purposes such as investigations, training, facilities, equipment, transportation, memorials, drug/gang education, matching, pro-rata funding, community-based programs, and language assistance. Funds are not to be used to replace or supplant appropriated resources of the recipient. Community Policing Donations – Albany Police and Kids (APAK) and Bringing Up Learning and Behavior (BULB) (203-30-5110): $11,000 Funded by community sponsors to inspire kids to be positive, see their potential, and work towards their goals. Donations are received intermittently and are intended to span multiple fiscal years. The Albany Police Department will partner with local businesses and community members to connect honored children with a community sponsor, while also ensuring that the child continues their positive academic work. Linn/Benton County District Attorney’s Office Asset Forfeiture (203-30-5119): $35,100 Grant proceeds from asset forfeiture may be used for law enforcement purposes only, such as investigations, training, facilities, equipment, awards and memorials, drug/gang education, matching and pro-rata funding, asset accounting and tracking, language assistance, transfers to other law enforcement agencies, and support for community-based programs. Linn County Interagency Narcotics Enforcement (LINE) Task Force (203-30-5122): $60,000 The mission of LINE is to reduce illegal drug trafficking in the Linn County area by identifying, disrupting, or dismantling drug trafficking and money laundering organizations through cooperative efforts, enforcement, and intelligence sharing by local, state, and federal law enforcement agencies. Entitlement Community Development Block Grant (CDBG): The City became a Housing and Urban Development (HUD) CDBG Entitlement City in 2012 after Albany’s population passed 50,000. The City received its first entitlement grant in the 2013-2014 fiscal year. The funds will be used for activities and programs that will primarily benefit Albany’s low- and moderate-income residents, homeless residents, seniors, and special needs populations. The funds will also be used for eligible community development activities that may include removing architectural barriers to handicap accessibility in Albany’s public buildings and curb ramps in low-income Census tracts. Staff will support the Community Development Commission’s work to provide the City Council with recommendations for use of the funding. Staff will
175

Grants Fund
Grant Descriptions provide the required annual Action Plan and Consolidated Annual Performance Evaluation Report (CAPER) to HUD. The grant will fund 0.6 FTE staff support for the program.
CDBG (203-40-5100/5102): This program accounts for $832,100 for activities in 2017-18. State Historic Preservation (SHPO) Grant (203-40-5118): $12,000. The City has applied for a residential rehabilitation grant for National Register properties, public education, and outreach through newsletters, workshops, and preservation activities associated with the City’s preservation program, staff and Landmarks Commission training and conferences. The local match is $12,000 and will consist of staff time and other resources dedicated to the City’s Historic Preservation Program. Library Foundation Grant (203-45-5032): $36,100 Foundation grants are used to provide ongoing support to the Albany Public Library, with special focus on maintaining services at the Carnegie Library building. Remaining projects include basement flooring and renovation of both storage and meeting rooms. For the past few years the foundation has been providing funds for the purchase of children’s books for the library system. Oregon Community Foundation (OCF) (203-45-5033): $161,500 This is a $2,000,000 donor-advised fund established in 2004 by Mrs. Doris Scharpf. Investment earnings from this fund may be annually disbursed to enhance the objectives and services of Albany Public Library. Disbursement is subject to OCF/donor policies. Oregon State Library Grant (203-45-5034): $10,100 Otherwise known as the Ready to Read Grant, this grant is used solely for the support of early childhood literacy endeavors within the Children’s Department. The amount is determined by Census data regarding the number of children in the Library’s service area. FAA Annual Capital Grant (203-50-5003): $333,000. A Federal FAA grant was received for the design of taxiway connectors in 2015-16. Title XIX Grant (203-50-5014): $5,000 Title XIX is a federal Medicaid grant program which pays for nonmedical rides for eligible clients. This grant has been ongoing for Paratransit since 1997. The City could bill up to $75,000 per year; however, only $5,000 in eligible rides is estimated to be provided in Fiscal Year 2017-18. This grant does require a City match (40 percent), and by Medicaid rules that match amount cannot appear in the Title XIX grant budget. The City match is paid for from the Paratransit budget (213-50-1108-62210).
176

GRANTS FUNDRESOURCE DETAIL
2016-17 2017-18 % Change % of
2014-15 2015-16 Adopted Revised Adopted from FundResources Actual Actual Budget Budget Budget 2016-17 Budget____________________________________________________________________________________________________________________FAA Entitlement Proceeds 903$ 38,221$ 256,500$ 256,500$ 306,000$ 19.30% 18.05%Non-Medical Medicaid Grant 19,230 6,131 13,000 13,000 5,000 (61.54%) 0.29%Bureau of Justice 8,216 2,609 6,500 6,500 6,500 - 0.38%Oregon Emergency Management 442,623 22,439 17,300 17,300 9,000 (47.98%) 0.53%Department of Aviation - - - - 24,300 - 1.43%Foster Grandparent Grant 109,978 3,551 - - - - - FEMA Disaster Reimbursement 377,604 19,212 - - - - - CDBG Grant 478,710 169,270 847,100 847,100 832,100 (1.77%) 49.10%Centers for Medicare & Medicaid - - - - 100,000 - 5.90%State of Oregon 243,751 142,168 20,000 20,000 20,000 - 1.18%DOJ Equitable Sharing 15,732 10,940 20,000 20,000 20,000 - 1.18%Brownsfield Redevelopment Grant 12,345 9,492 - - - - - LINE Task Force - - - - 80,000 - 4.72%Oregon Community Foundation 82,286 83,830 87,000 87,000 90,000 3.45% 5.31%InterCommunity Health - 121,000 145,200 145,200 - (100.00%) - Albany Library Foundation 30,000 - 20,000 20,000 - (100.00%) - Home Depot 1,000 - - - - - - APAK (Albany Police & Kids) 1,360 - 10,000 10,000 2,000 (80.00%) 0.12%BULB (Bringing Up Learning & Behavior) 3,565 1,085 500 500 2,000 300.00% 0.12%Miscellaneous Revenue 7,883 26,207 10,000 10,000 10,000 - 0.59%Interest 5,182 7,008 2,900 2,900 2,000 (31.03%) 0.12%____________________________________________________________________________________________________________________Total Current Resources 1,840,368 663,163 1,456,000 1,456,000 1,508,900 3.63% 89.02%____________________________________________________________________________________________________________________From Albany Municipal Airport 16,534 - 28,500 28,500 2,700 (90.53%) 0.16%____________________________________________________________________________________________________________________Total Transfers In 16,534 - 28,500 28,500 2,700 (90.53%) 0.16%____________________________________________________________________________________________________________________Beginning Balance 272,193 252,485 108,100 108,100 183,400 69.66% 10.82%Designated Beg. Balance-Housing 279,918 281,902 - - - - - ____________________________________________________________________________________________________________________Total Beginning Balance 552,111 534,387 108,100 108,100 183,400 69.66% 10.82%____________________________________________________________________________________________________________________Total Resources 2,409,013$ 1,197,550$ 1,592,600$ 1,592,600$ 1,695,000$ 6.43% 100.00%________________________________________________________________________________________________________________________________________________________________________________________________________________________________________
GRANTS FUND RESOURCES BY SOURCECategory Totals and Percent of Budget
Intergovernmental resources $1,492,900 (88.08%)
Other resources $40,500 (2.54%) Investment earnings
$2,000 (0.12%)
Transfers in $28,500 (1.79%)
Beginning balance $183,400 (10.82%)
177

GRANTS FUNDREQUIREMENTS AND STAFFING SUMMARIES
2014-15 2015-16Program Requirements Actual Actual Adopted Revised Proposed Approved Adopted_____________________________________________________________________________________________________________________________________
State HMEP Grant 13,780$ 15,773$ 17,300$ 17,300$ 9,000$ 9,000$ 9,000$
Community Paramedic Program - 125,746 145,200 145,200 30,000 30,000 30,000
Ground Emergency Transport - - - - 100,000 100,000 100,000
DOJ Bulletproof Vest 5,396 3,300 6,500 6,500 8,000 8,000 8,000
DOJ Equitable Sharing 22,841 4,409 32,200 32,200 52,100 52,100 52,100
Community Policing Donations 1,407 1,551 14,200 14,200 11,000 11,000 11,000
Asset Forfeiture - - 10,000 10,000 35,100 35,100 35,100
LINE - - - - 60,000 60,000 60,000
CDBG 18,821 569 93,300 93,300 81,300 81,300 81,300
CDBG Activities 270,084 36,515 753,800 753,800 750,800 750,800 750,800
SHPO Historic Preservation - - 12,000 12,000 12,000 12,000 12,000
Library Foundation - - 35,700 35,700 36,100 36,100 36,100
Oregon Community Foundation 137,470 119,557 159,500 159,500 161,500 161,500 161,500
State Library Grant 9,635 8,292 10,100 10,100 10,100 10,100 10,100
FAA Annual Capital Grant 23,109 4,133 289,800 289,800 333,000 333,000 333,000
Title XIX Grant 20,531 6,266 13,000 13,000 5,000 5,000 5,000
Closed Grants 1,356,258 794,465 - - - - - _____________________________________________________________________________________________________________________________________
Total Requirements 1,879,332$ 1,120,576$ 1,592,600$ 1,592,600$ 1,695,000$ 1,695,000$ 1,695,000$ __________________________________________________________________________________________________________________________________________________________________________________________________________________________________________________________________________
Requirements by Type_____________________________________________________________________________________________________________________________________
Personnel 410,792$ 210,919$ 193,600$ 193,600$ 173,500$ 173,500$ 173,500$
Materials & Services 867,150 778,341 580,200 580,200 788,100 788,100 788,100
Capital 601,391 126,659 818,800 818,800 733,400 733,400 733,400 _____________________________________________________________________________________________________________________________________
Total Requirements 1,879,333$ 1,115,919$ 1,592,600$ 1,592,600$ 1,695,000$ 1,695,000$ 1,695,000$ __________________________________________________________________________________________________________________________________________________________________________________________________________________________________________________________________________
Adopted Requirements Materials Adopted % of Fund
by Program and Type Personnel & Services Capital Budget Budget_____________________________________________________________________________________________________________________________________
State HMEP Grant -$ 9,000$ -$ 9,000$ 0.53%
Community Paramedic Program - 30,000 - 30,000 1.77%
Ground Emergency Transport 50,000 50,000 - 100,000 5.90%
DOJ Bulletproof Vest - 8,000 - 8,000 0.47%
DOJ Equitable Sharing - 52,100 - 52,100 3.07%
Community Policing Donations - 11,000 - 11,000 0.65%
Asset Forfeiture - 35,100 - 35,100 2.07%
LINE 36,500 23,500 - 60,000 3.54%
CDBG 79,000 2,300 - 81,300 4.80%
CDBG Activities - 386,500 364,300 750,800 44.29%
SHPO Historic Preservation - 12,000 - 12,000 0.71%
Library Foundation - - 36,100 36,100 2.13%
Oregon Community Foundation 3,000 158,500 - 161,500 9.53%
State Library Grant - 10,100 - 10,100 0.60%
FAA Annual Capital Grant - - 333,000 333,000 19.65%
Title XIX Grant 5,000 - - 5,000 0.29%_____________________________________________________________________________________________________________________________________
Total Requirements 173,500$ 788,100$ 733,400$ 1,695,000$ 100.00%__________________________________________________________________________________________________________________________________________________________________________________________________________________________________________________________________________
Percent of Fund Budget 10.23% 46.50% 43.27% 100.00%______________________________________________________________________________________________________________________________________________________________________________________________________________________________________________
2014-15 2015-16Staffing Summary (FTE) Actual Actual Adopted Revised Proposed Approved Adopted_____________________________________________________________________________________________________________________________________
Community Paramedic Program - 1.400 - - - - -
Foster Grandparents (94.011) 0.580 - - - - - -
CDBG 0.600 0.600 0.600 0.600 0.585 0.585 0.585 _____________________________________________________________________________________________________________________________________
Total FTE 1.180 2.000 0.600 0.600 0.585 0.585 0.585 __________________________________________________________________________________________________________________________________________________________________________________________________________________________________________________________________________
……2016-17…… ……2017-18……
……2016-17…… ……2017-18……
178
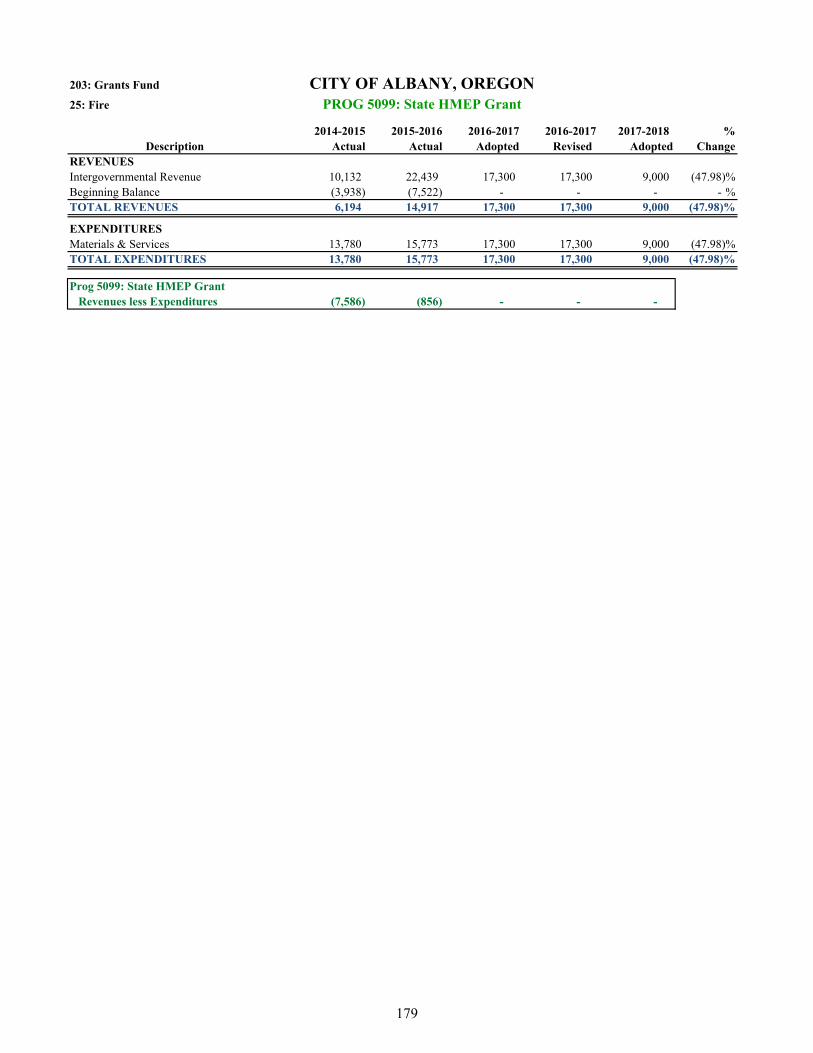
203: Grants Fund
25: Fire
2014-2015 2015-2016 2016-2017 2016-2017 2017-2018 %Description Actual Actual Adopted Revised Adopted Change
REVENUESIntergovernmental Revenue 10,132 22,439 17,300 17,300 9,000 (47.98)% Beginning Balance (3,938) (7,522) - - - - %TOTAL REVENUES 6,194 14,917 17,300 17,300 9,000 (47.98)%
EXPENDITURESMaterials & Services 13,780 15,773 17,300 17,300 9,000 (47.98)% TOTAL EXPENDITURES 13,780 15,773 17,300 17,300 9,000 (47.98)%
Prog 5099: State HMEP Grant Revenues less Expenditures (7,586) (856) - - -
CITY OF ALBANY, OREGONPROG 5099: State HMEP Grant
179

203: Grants Fund
25: Fire
2014-2015 2015-2016 2016-2017 2016-2017 2017-2018 %Description Actual Actual Adopted Revised Adopted Change
REVENUESIntergovernmental Revenue - 121,000 145,200 145,200 - - %Investment Earnings - 1 - - - - %Beginning Balance - - - - 30,000 - %TOTAL REVENUES - 121,001 145,200 145,200 30,000 (79.34)%
EXPENDITURESPersonnel Services - 117,675 103,600 103,600 - (100.00)% Materials & Services - 8,071 41,600 41,600 30,000 (27.88)% TOTAL EXPENDITURES - 125,746 145,200 145,200 30,000 (79.34)%
Prog 5117: Community Paramedic Program Revenues less Expenditures - (4,745) - - -
CITY OF ALBANY, OREGONPROG 5117: Community Paramedic Program
180

203: Grants Fund
25: Fire
2014-2015 2015-2016 2016-2017 2016-2017 2017-2018 %Description Actual Actual Adopted Revised Adopted Change
REVENUESIntergovernmental Revenue - - - - 100,000 - %TOTAL REVENUES - - - - 100,000 - %
EXPENDITURESPersonnel Services - - - - 50,000 - %Materials & Services - - - - 50,000 - %TOTAL EXPENDITURES - - - - 100,000 - %
Prog 5117: Community Paramedic Program Revenues less Expenditures - - - - -
CITY OF ALBANY, OREGONPROG 5121: Ground Emergency Transport
181

203: Grants Fund
30: Police
2014-2015 2015-2016 2016-2017 2016-2017 2017-2018 %Description Actual Actual Adopted Revised Adopted Change
REVENUESIntergovernmental Revenue 8,216 2,609 6,500 6,500 6,500 - %Investment Earnings - - - - - - %Beginning Balance (3,779) (959) - - 1,500 #DIV/0!TOTAL REVENUES 4,437 1,650 6,500 6,500 8,000 23.08 %
EXPENDITURESMaterials & Services 5,396 3,300 6,500 6,500 8,000 23.08 % TOTAL EXPENDITURES 5,396 3,300 6,500 6,500 8,000 23.08 %
Prog 5008: DOJ Bulletproof Vest Revenues less Expenditures (959) (1,650) - - -
CITY OF ALBANY, OREGONPROG 5008: DOJ Bulletproof Vest
182

203: Grants Fund
30: Police
2014-2015 2015-2016 2016-2017 2016-2017 2017-2018 %Description Actual Actual Adopted Revised Adopted Change
REVENUESIntergovernmental Revenue 15,732 5,046 10,000 10,000 20,000 100.00 % Investment Income 238 185 100 100 100 - %Beginning Balance 29,700 22,856 22,100 22,100 32,000 44.80 % TOTAL REVENUES 45,670 28,087 32,200 32,200 52,100 61.80 %
EXPENDITURESMaterials & Services 22,841 4,409 32,200 32,200 52,100 61.80 % TOTAL EXPENDITURES 22,841 4,409 32,200 32,200 52,100 61.80 %
Prog 5096: DOJ Equitable Sharing Revenues less Expenditures 22,829 23,678 - - -
CITY OF ALBANY, OREGONPROG 5096: DOJ Equitable Sharing
183

203: Grants Fund
30: Police
2014-2015 2015-2016 2016-2017 2016-2017 2017-2018 %Description Actual Actual Adopted Revised Adopted Change
REVENUESMiscellaneous Revenue 4,926 1,085 10,500 10,500 4,000 (61.90)% Beginning Balance - 3,534 3,700 3,700 7,000 89.19 % TOTAL REVENUES 4,942 4,650 14,200 14,200 11,000 (22.54)%
EXPENDITURESMaterials & Services 1,407 1,245 14,200 14,200 11,000 (22.54)% TOTAL EXPENDITURES 1,407 1,245 14,200 14,200 11,000 (22.54)%
Prog 5110: Community Policing Donations Revenues less Expenditures 3,535 3,405 - - -
CITY OF ALBANY, OREGONPROG 5110: Community Policing Donations
184

203: Grants Fund
30: Police
2014-2015 2015-2016 2016-2017 2016-2017 2017-2018 %Description Actual Actual Adopted Revised Adopted Change
REVENUESIntergovernmental Revenue - 5,894 10,000 10,000 20,000 100.00 % Investment Income - 11 - - - - %Beginning Balance - - - - 15,100 - %TOTAL REVENUES - 5,905 10,000 10,000 35,100 251.00 %
EXPENDITURESMaterials & Services - - 10,000 10,000 35,100 251.00 % TOTAL EXPENDITURES - - 10,000 10,000 35,100 251.00 %
Prog 5119: Linn/Benton District Attorney's Asset Forfeiture Revenues less Expenditures - 5,905 - - -
CITY OF ALBANY, OREGONPROG 5119: Linn/Benton District Attorney's Asset Forfeiture
185

203: Grants Fund
30: Police
2014-2015 2015-2016 2016-2017 2016-2017 2017-2018 %Description Actual Actual Adopted Revised Adopted Change
REVENUESIntergovernmental Revenue - - - - 60,000 - %TOTAL REVENUES - - - - 60,000 - %
EXPENDITURESPersonnel Services - - - - 36,500 - %Materials & Services - - - - 23,500 - %TOTAL EXPENDITURES - - - - 60,000 - %
Prog 5122: LINE Task Force Revenues less Expenditures - - - - -
CITY OF ALBANY, OREGONPROG 5122: LINE Task Force
186

203: Grants Fund
40: Community Development
2014-2015 2015-2016 2016-2017 2016-2017 2017-2018 %Description Actual Actual Adopted Revised Adopted Change
REVENUESIntergovernmental Revenue 75,947 70,212 93,300 93,300 81,300 (12.86)% Investment Income 12 (163) - - - - %TOTAL REVENUES 75,994 70,007 93,300 93,300 81,300 (12.86)%
EXPENDITURESPersonnel Services 73,281 79,450 77,000 77,000 79,000 2.60 % Materials & Services 2,757 807 16,300 16,300 2,300 (85.89)% TOTAL EXPENDITURES 76,038 80,257 93,300 93,300 81,300 (12.86)%
Prog 5100: CDBG Revenues less Expenditures (44) (10,250) - - -
CITY OF ALBANY, OREGONPROG 5100: CDBG
187

203: Grants Fund
40: Community Development
2014-2015 2015-2016 2016-2017 2016-2017 2017-2018 %Description Actual Actual Adopted Revised Adopted Change
REVENUESIntergovernmental Revenue 402,762 99,058 753,800 753,800 750,800 (0.40)% Investment Income - 168 - - - - %TOTAL REVENUES 402,781 99,244 753,800 753,800 750,800 (0.40)%
EXPENDITURESMaterials & Services 302,449 121,794 260,500 260,500 386,500 48.37 % Capital 61,313 - 493,300 493,300 364,300 (26.15)% TOTAL EXPENDITURES 363,762 121,794 753,800 753,800 750,800 (0.40)%
Prog 5102: CDBG Activities Revenues less Expenditures 39,019 (22,550) - - -
CITY OF ALBANY, OREGONPROG 5102: CDBG Activities
188

203: Grants Fund
40: Community Development
2014-2015 2015-2016 2016-2017 2016-2017 2017-2018 %Description Actual Actual Adopted Revised Adopted Change
REVENUESIntergovernmental Revenue - 12,000 12,000 12,000 12,000 - %TOTAL REVENUES - 12,011 12,000 12,000 12,000 - %
EXPENDITURESMaterials & Services 1,419 5,447 12,000 12,000 12,000 - %TOTAL EXPENDITURES 1,419 10,812 12,000 12,000 12,000 - %
Prog 5118: 2014-15 State Historic Preservation Grant Revenues less Expenditures (1,419) 1,199 - - -
CITY OF ALBANY, OREGONPROG 5118: 2014-15 State Historic Preservation Grant
189

203: Grants Fund
45: Library
2014-2015 2015-2016 2016-2017 2016-2017 2017-2018 %Description Actual Actual Adopted Revised Adopted Change
REVENUESInvestment Income 284 287 200 200 300 50.00 % Beginning Balance 34,952 35,236 35,500 35,500 35,800 0.85 % TOTAL REVENUES 35,236 35,523 35,700 35,700 36,100 1.12 %
EXPENDITURESMaterials & Services - - - - - - %Capital - - 35,700 35,700 36,100 1.12 % TOTAL EXPENDITURES - - 35,700 35,700 36,100 1.12 %
Prog 5032: Library Foundation Revenues less Expenditures 35,236 35,523 - - -
CITY OF ALBANY, OREGONPROG 5032: Library Foundation
190

203: Grants Fund
45: Library
2014-2015 2015-2016 2016-2017 2016-2017 2017-2018 %Description Actual Actual Adopted Revised Adopted Change
REVENUESIntergovernmental Revenue 82,286 83,830 87,000 87,000 90,000 3.45 % Miscellaneous Revenue 37,749 26,207 30,000 30,000 10,000 (66.67)% Investment Income 344 1,733 2,500 2,500 1,500 (40.00)% Beginning Balance 24,607 7,516 40,000 40,000 60,000 50.00 % TOTAL REVENUES 144,986 119,286 159,500 159,500 161,500 1.25 %
EXPENDITURESPersonnel Services - - - - 3,000 - %Materials & Services 137,470 119,557 159,500 159,500 158,500 (0.63)% TOTAL EXPENDITURES 137,470 119,557 159,500 159,500 161,500 1.25 %
Prog 5033: Oregon Community Foundation Revenues less Expenditures 7,516 (271) - - -
CITY OF ALBANY, OREGONPROG 5033: Oregon Community Foundation
191

203: Grants Fund
45: Library
2014-2015 2015-2016 2016-2017 2016-2017 2017-2018 %Description Actual Actual Adopted Revised Adopted Change
REVENUESIntergovernmental Revenue 8,005 7,714 8,000 8,000 8,000 - %Investment Income 51 79 100 100 100 - %Beginning Balance 5,720 4,152 2,000 2,000 2,000 - %TOTAL REVENUES 13,788 11,945 10,100 10,100 10,100 - %
EXPENDITURESMaterials & Services 9,635 8,292 10,100 10,100 10,100 - %TOTAL EXPENDITURES 9,635 8,292 10,100 10,100 10,100 - %
Prog 5034: State Library Grant Revenues less Expenditures 4,153 3,653 - - -
CITY OF ALBANY, OREGONPROG 5034: State Library Grant
192

203: Grants Fund
50: Public Works
2014-2015 2015-2016 2016-2017 2016-2017 2017-2018 %Description Actual Actual Adopted Revised Adopted Change
REVENUESIntergovernmental Revenue 903 38,221 256,500 256,500 330,300 28.77 % Investment Income - - - - - - %Transfers In 16,534 - 28,500 28,500 2,700 (90.53)% Beginning Balance (26,488) (32,159) 4,800 4,800 - (100.00)% TOTAL REVENUES (9,051) 6,062 289,800 289,800 333,000 14.91 %
EXPENDITURESMaterials & Services 15,765 4,133 - - - - %Capital 7,344 - 289,800 289,800 333,000 14.91 % TOTAL EXPENDITURES 23,109 4,133 289,800 289,800 333,000 14.91 %
Prog 5003: FAA Annual Capital Grant Revenues less Expenditures (32,160) 1,929 - - -
CITY OF ALBANY, OREGONPROG 5003: FAA Annual Capital Grant
193

203: Grants Fund
50: Public Works
2014-2015 2015-2016 2016-2017 2016-2017 2017-2018 %Description Actual Actual Adopted Revised Adopted Change
REVENUESIntergovernmental Revenue 19,230 6,131 13,000 13,000 5,000 (61.54)% Investment Income - 7 - - - - %Beginning Balance 1,286 (16) - - - - %TOTAL REVENUES 20,516 6,122 13,000 13,000 5,000 (61.54)%
EXPENDITURESPersonnel Services 20,531 6,266 13,000 13,000 5,000 (61.54)% TOTAL EXPENDITURES 20,531 6,266 13,000 13,000 5,000 (61.54)%
Prog 5014: Title XIX Grant Revenues less Expenditures (15) (144) - - -
CITY OF ALBANY, OREGONPROG 5014: Title XIX Grant
194

BUILDING FUNDRESOURCE DETAIL
2017-18 % Change % of
2014-15 2015-16 Adopted Revised Adopted from FundResources Actual Actual Budget Budget Budget 2016-17 Budget_______________________________________________________________________________________________________________Building Permit Surcharge 110,986 - - - - - - Master Electrical Permit 769 2,981 2,000 2,000 2,000 - 0.07%Electrical Minor Labels 6,525 5,250 6,600 6,600 6,600 - 0.23%Residential Permits 431,842 437,212 376,900 376,900 440,000 16.74% 15.22%Commercial Permits 629,751 768,526 572,500 572,500 493,000 (13.89%) 17.06%Land Use Plan Review Fee 5,819 3,815 4,000 4,000 4,000 - 0.14%Manufactured Home Set-up Fees 3,610 2,200 2,000 2,000 2,500 25.00% 0.09%Fire Sprinkler Permits 23,989 25,965 18,000 18,000 19,400 7.78% 0.67%Parking Lot Permits 13,747 8,266 9,000 9,000 9,000 - 0.31%Electrical Permits 144,570 134,339 131,800 131,800 130,800 (0.76%) 4.52%Fire Alarm Permits 7,697 6,298 6,000 6,000 6,000 - 0.21%Sign Permits 5,330 3,886 6,000 6,000 6,500 8.33% 0.22%Document Imaging Fees 28,638 24,654 25,000 25,000 25,200 0.80% 0.87%Electrical Document Imaging 1,011 1,135 1,000 1,000 1,500 50.00% 0.05%GAPS Construction Excise Tax - 290,305 320,000 320,000 320,000 - 11.07%Charges for Services 124,415 15,644 - - - - - Miscellaneous Revenue 85 - - - - - - School Construction Excise Tax Admin Fee - 2,932 - - - - - Interest 5,344 12,002 8,400 8,400 8,400 - 0.29%_______________________________________________________________________________________________________________Total Current Resources 1,544,127 1,745,412 1,489,200 1,489,200 1,474,900 (0.96%) 51.02%_______________________________________________________________________________________________________________From General Fund 38,997 2,612 - - - - - _______________________________________________________________________________________________________________Total Transfers In 38,997 2,612 - - - - - _______________________________________________________________________________________________________________Beginning Balance 810,668 1,160,813 1,346,200 1,346,200 1,415,900 5.18% 48.98%_______________________________________________________________________________________________________________Total Resources 2 393 792$ 2 908 837$ 2 835 400$ 2 835 400$ 2 890 800$ 1 95% 100 00%
……2016-17……
Total Resources 2,393,792$ 2,908,837$ 2,835,400$ 2,835,400$ 2,890,800$ 1.95% 100.00%______________________________________________________________________________________________________________________________________________________________________________________________________________________________
BUILDING INSPECTION FUND RESOURCES BY SOURCECategory Totals and Percent of Budget
Licenses & fees $1,466,500 (50.73%)
Investment earnings $8,400 (0.29%)
Beginning balance $1,415,900 (48.98%)
195

BUILDING FUNDREQUIREMENTS AND STAFFING SUMMARIES
2014-15 2015-16Program Requirements Actual Actual Adopted Revised Proposed Approved Adopted__________________________________________________________________________________________________________Building Inspection 1,087,961$ 1,375,708$ 2,595,200$ 2,595,200$ 2,639,100$ 2,639,100$ 2,639,100$ Electrical Permit Program 141,022 151,931 240,200 240,200 251,700 251,700 251,700 ADA Code Enforcement 3,997 2,508 - - - - - __________________________________________________________________________________________________________Total Requirements 1,232,980$ 1,530,147$ 2,835,400$ 2,835,400$ 2,890,800$ 2,890,800$ 2,890,800$ ____________________________________________________________________________________________________________________________________________________________________________________________________________________
Requirements by Type__________________________________________________________________________________________________________Personnel 738,418$ 687,844$ 904,300$ 904,300$ 934,600$ 934,600$ 934,600$ Materials & Services 435,235 842,302 1,871,100 1,871,100 1,896,200 1,896,200 1,896,200 Transfers Out 59,327 - 60,000 60,000 60,000 60,000 60,000 __________________________________________________________________________________________________________Total Requirements 1,232,980$ 1,530,147$ 2,835,400$ 2,835,400$ 2,890,800$ 2,890,800$ 2,890,800$ ____________________________________________________________________________________________________________________________________________________________________________________________________________________
Adopted Requirements Materials Transfers Adopted % of Fundby Program and Type Personnel & Services Out Budget Budget__________________________________________________________________________________________________________Building Inspection 827,900$ 1,751,200$ 60,000$ 2,639,100$ 91.29%Electrical Permit Program 106,700 145,000 - 251,700 8.71%__________________________________________________________________________________________________________Total Requirements 934,600$ 1,896,200$ 60,000$ 2,890,800$ 100.00%____________________________________________________________________________________________________________________________________________________________________________________________________________________Percent of Fund Budget 32.33% 65.59% 2.08% 100.00%______________________________________________________________________________________________________________________________________________________________________________________________
2014-15 2015-16Staffing Summary (FTE) Actual Actual Adopted Revised Proposed Approved Adopted__________________________________________________________________________________________________________Building Inspection 5.750 6.430 6.430 6.430 6.430 6.430 6.430 Electrical Permit Program 0.750 0.750 0.750 0.750 0.750 0.750 0.750 __________________________________________________________________________________________________________Total FTE 6.500 7.180 7.180 7.180 7.180 7.180 7.180 ____________________________________________________________________________________________________________________________________________________________________________________________________________________
……2016-17…… ……2017-18……
……2016-17…… ……2017-18……
196

PROGRAM NARRATIVE
BUILDING INSPECTION: BUILDING INSPECTION PROGRAM (204-40-1602) Responsible Manager/Title: Gary Stutzman, Building Official
FUNCTIONS AND RESPONSIBILITIES
Protect public health and safety through enforcement of Albany Municipal Code Title 18 and the state building code, which enhances the community’s quality of life.
Implement new building code requirements resulting from new legislative action. Provide information to the public regarding code cycle updates in construction codes and standards.
Assist the public with information relevant to building codes.
Respond to complaints regarding safety and habitability concerns for both commercial and residential buildings.
Participate in the development review process, conduct plans review, issue building permits, and perform inspections for all new construction, checking compliance with applicable codes and adopted standards.
Administer the Building Inspection Program per the state-approved Operational Plan.
STRATEGIES/ACTIONS
Strategic Plan Theme Target Date Status Strategies/Actions Budget Year 2016-2017
Effective Government 06/17 In Progress Fully implement Accela Mobile Office and Citizen Access to more efficiently process inspection requests.
06/17 Ongoing Provide educational outreach to homeowners, landlords, property managers, and tenants so they understand their rights and responsibilities as they pertain to maintenance and safety of their structures.
Budget Year 2017-2018
Effective Government 06/18 Partner with Police Department team members to respond and assist in resolving non-building inspection related complaint issues.
06/18 Provide code-change education for inspectors.
PERFORMANCE MEASURES AND WORKLOAD INDICATORS 2014-2015 2015-2016 2016-2017 2017-2018
Total permits issued. 2,359 2,549 2,300 2,300
Commercial construction permits issued. 136 127 113 90
New single-family residence permits issued. 129 125 120 125
Construction value (in millions of dollars). Includes new and alterations.
$88 $84 $80 $75
Percent of inspections performed according to policy framework.
100% 100% 100% 100%
Number of inspections performed. 8,324 9,668 8,400 8,400
STAFFING SUMMARY Budgeted FTEs 5.75 6.43 6.43 6.43
197

204: Building
40: Community Development
2014-2015 2015-2016 2016-2017 2016-2017 2017-2018 %Description Actual Actual Adopted Revised Adopted Change
REVENUESLicenses and Fees 1,244,277 1,570,966 1,339,400 1,339,400 1,325,400 (1.05)% Charges for Services 124,415 15,644 - - - - %Miscellaneous Revenue 81 (35) - - - - %Investment Income 4,764 8,025 7,800 7,800 7,800 - %Transfers In 35,000 - - - - - %Beginning Balance 731,475 1,052,051 1,248,000 1,248,000 1,305,900 4.64 % TOTAL REVENUES 2,140,012 2,646,651 2,595,200 2,595,200 2,639,100 1.69 %
EXPENDITURESPersonnel Services 641,831 574,543 798,200 798,200 827,900 3.72 % Materials & Services 386,803 801,130 1,737,000 1,737,000 1,751,200 0.82 % Transfers Out 59,327 - 60,000 60,000 60,000 - %TOTAL EXPENDITURES 1,087,961 1,375,673 2,595,200 2,595,200 2,639,100 1.69 %
Prog 1602: Building Inspection Revenues less Expenditures 1,052,051 1,270,978 - - -
CITY OF ALBANY, OREGONPROG 1602: Building Inspection
198

PROGRAM NARRATIVE
BUILDING INSPECTION: ELECTRICAL PERMIT PROGRAM (204-40-1603) Responsible Manager/Title: Gary Stutzman, Building Official
FUNCTIONS AND RESPONSIBILITIES
Protect public health and safety through enforcement of the state building codes, which enhance the community’s quality of life.
Administer Albany’s Electrical Inspection Program using the operational plan approved by the State of Oregon as the standard.
Assist the public with information relevant to the Oregon Electrical Specialty Code requirements.
Administer Albany’s Electrical Master Permit Program for large commercial businesses.
Perform inspections for the State of Oregon’s Minor Label Electrical Inspection Program.
Perform electrical plan review as required by Oregon Administrative Rule.
Conduct electrical inspections upon request, checking compliance with applicable municipal codes and state building codes.
Ensure that homeowners install safe and code-compliant electrical systems.
STRATEGIES/ACTIONS
Strategic Plan Theme Target Date Status Strategies/Actions Budget Year 2016-2017
Effective Government 06/17 In Progress Fully implement Accela Mobile Office and Citizen Access to more efficiently process inspection requests.
Budget Year 2017-2018
Effective Government 06/18 Provide training to allow and qualify an additional A-level electrical inspector.
PERFORMANCE MEASURES AND WORKLOAD INDICATORS 2014-2015 2015-2016 2016-2017 2017-2018 Number of electrical permits issued (new, additional, and alterations).
910 1,011 1,175 1,180
Percent of inspections performed according to policy framework.
100% 100% 100% 100%
STAFFING SUMMARY Budgeted FTEs 0.75 0.75 0.75 0.75
199

204: Building
40: Community Development
2014-2015 2015-2016 2016-2017 2016-2017 2017-2018 %Description Actual Actual Adopted Revised Adopted Change
REVENUESLicenses and Fees 170,008 143,867 141,400 141,400 141,100 (0.21)% Investment Income 580 3,982 600 600 600 - %Beginning Balance 79,191 108,761 98,200 98,200 110,000 12.02 % TOTAL REVENUES 249,783 256,610 240,200 240,200 251,700 4.79 %
EXPENDITURESPersonnel Services 96,587 113,302 106,100 106,100 106,700 0.57 % Materials & Services 44,435 38,629 134,100 134,100 145,000 8.13 % TOTAL EXPENDITURES 141,022 151,931 240,200 240,200 251,700 4.79 %
Prog 1603: Electrical Permit Program Revenues less Expenditures 108,761 104,679 - - -
CITY OF ALBANY, OREGONPROG 1603: Electrical Permit Program
200


RISK MANAGEMENT FUND
RESOURCE DETAIL
2017-18 % Change % of2014-15 2015-16 Adopted Revised Adopted from Fund
Resources Actual Actual Budget Budget Budget 2016-17 Budget____________________________________________________________________________________________________________________Miscellaneous Revenue 25,526$ 39,098$ -$ -$ -$ - - Loan Repayment-Principal - 8,999 - - 9,100 - 0.29%Loan Repayment-Interest - 553 - - 400 - 0.01%Interest 48,898 57,306 32,600 32,600 16,500 (49.39%) 0.53%____________________________________________________________________________________________________________________Total Current Resources 74,424 105,956 32,600 32,600 26,000 (20.25%) 0.83%____________________________________________________________________________________________________________________From Capital Projects Fund 632,000 139,700 33,300 33,300 33,300 - 1.08%From EPlans Building 59,327 - - - - - - From EPlans Planning 2,700 1,900 2,700 2,700 - (100.00%) - From EPlans Water 2,700 15,588 - - - - - From EPlans Sewer 2,700 15,588 - - - - - From EPlans Fire 900 900 900 900 - (100.00%) - ____________________________________________________________________________________________________________________Total Transfers In 700,327 173,676 36,900 36,900 33,300 (200.00%) 1.08%____________________________________________________________________________________________________________________Beginning Balance 10,211,785 9,013,671 3,841,000 3,841,000 3,032,700 (21.04%) 98.09%____________________________________________________________________________________________________________________Total Resources 10,986,536$ 9,293,303$ 3,910,500$ 3,910,500$ 3,092,000$ (20.93%) 100.00%________________________________________________________________________________________________________________________________________________________________________________________________________________________________________
REQUIREMENT SUMMARIES
2014-15 2015-16Program Requirements Actual Actual Adopted Revised Proposed Approved Adopted____________________________________________________________________________________________________________________Risk Management Reserve 77,972$ 84,340$ 1,201,200$ 1,201,200$ 1,099,200$ 1,099,200$ 1,099,200$ PepsiCo Settlement Projects 1,894,893 5,000,000 2,709,300 2,709,300 1,992,800 1,992,800 1,992,800 ____________________________________________________________________________________________________________________Total Requirements 1,972,865$ 5,084,340$ 3,910,500$ 3,910,500$ 3,092,000$ 3,092,000$ 3,092,000$ ________________________________________________________________________________________________________________________________________________________________________________________________________________________________________
2014-15 2015-16Percent of Fund Total Actual Actual Adopted Revised Proposed Approved Adopted____________________________________________________________________________________________________________________Risk Management Reserve 3.95% 1.66% 30.72% 30.72% 35.55% 35.55% 35.55%PepsiCo Settlement Projects 96.05% 98.34% 69.28% 69.28% 64.45% 64.45% 64.45%____________________________________________________________________________________________________________________Totals 100.00% 100.00% 100.00% 100.00% 100.00% 100.00% 100.00%________________________________________________________________________________________________________________________________________________________________________________________________________________________________________
……2016-17……
……2016-17…… ……2017-18……
……2016-17…… ……2017-18……
201

PROGRAM NARRATIVE
RISK MANAGEMENT FUND: RISK MANAGEMENT (208-10-1005) Responsible Manager/Title: Stewart Taylor, Finance Director
FUNCTIONS AND RESPONSIBILITIES
The City’s Risk Management policy states that a fund will be maintained with a working balance of up to $2,000,000 for unforeseen catastrophic events and major deductibles.
Each department is responsible for claims and deductibles up to $10,000 per incident resulting from losses in their respective operations.
202

208: Risk Management
10: Finance
2014-2015 2015-2016 2016-2017 2016-2017 2017-2018 %Description Actual Actual Adopted Revised Adopted Change
REVENUESMiscellaneous Revenue (7,764) 39,098 - - - - %Investment Income 6,691 8,028 7,600 7,600 8,500 11.84 % Beginning Balance 1,305,802 1,226,757 1,193,600 1,193,600 1,090,700 (8.62)% TOTAL REVENUES 1,304,729 1,273,883 1,201,200 1,201,200 1,099,200 (8.49)%
EXPENDITURESMaterials & Services 77,972 69,421 1,201,200 1,201,200 1,099,200 (8.49)% TOTAL EXPENDITURES 77,972 69,421 1,201,200 1,201,200 1,099,200 (8.49)%
Prog 1005: Risk Management Reserve Revenues less Expenditures 1,226,757 1,204,462 - - -
CITY OF ALBANY, OREGONPROG 1005: Risk Management Reserve
203

PROGRAM NARRATIVE
RISK MANAGEMENT FUND: PEPSICO SETTLEMENT PROJECTS (208-10-1037) Responsible Manager/Title: Stewart Taylor, Finance Director
FUNCTIONS AND RESPONSIBILITIES
This program accounts for the funds received in March 2010 from the SVC Manufacturing Inc. (PepsiCo) settlement agreement.
Proceeds that have not yet been expended are appropriated for economic development and public safety facilities.
$1,280,988 was loaned for the construction of
the Oak Street LID. Most of the principal and interest assessment payments have been transferred back in repayment of the loan.
$5,000,000 was transferred to the Capital
Projects fund for the construction of the Public Safety Facilities.
$3,348,794 was loaned for the construction of the Timber Ridge LIDs. Repayment will be made through transfers from the LID Capital Projects Program upon sale of the property.
$174,100 was loaned for the purchase of the Project.dox E-plan software. Most of the payments have been transferred back in repayment of the loan.
A capital loan of $300,000 was made to the
Capital Replacement Fund to assist in the purchase of needed equipment.
204

208: Risk Management
10: Finance
2014-2015 2015-2016 2016-2017 2016-2017 2017-2018 %Description Actual Actual Adopted Revised Adopted Change
REVENUESMiscellaneous Revenue 33,290 9,552 - - 9,500 - %Investment Income 42,207 40,287 25,000 25,000 8,000 (68.00)% Transfers In 700,327 173,677 36,900 36,900 33,300 (9.76)% Beginning Balance 8,905,984 7,786,914 2,647,400 2,647,400 1,942,000 (26.65)% TOTAL REVENUES 9,681,808 8,010,430 2,709,300 2,709,300 1,992,800 (26.45)%
EXPENDITURESMaterials & Services 216,733 - 1,831,300 1,831,300 1,806,200 (1.37)% Capital 1,178,160 - 878,000 878,000 186,600 (78.75)% Transfers Out 500,000 5,000,000 - - - - %TOTAL EXPENDITURES 1,894,893 5,000,000 2,709,300 2,709,300 1,992,800 (26.45)%
Prog 1037: PepsiCo Settlement Projects Revenues less Expenditures 7,786,915 3,010,430 - - -
CITY OF ALBANY, OREGONPROG 1037: PepsiCo Settlement Projects
205

ECONOMIC DEVELOPMENT FUNDRESOURCE DETAIL
2017-18 % Change % of
2014-15 2015-16 Adopted Revised Adopted from FundResources Actual Actual Budget Budget Budget 2016-17 Budget___________________________________________________________________________________________________________Transient Room Tax 927,172$ 965,060$ 1,028,800$ 1,028,800$ 1,122,000$ 9.06% 48.58%TLT - Online Travel Companies - 93,832 75,500 75,500 115,400 52.85% 5.00%Airport: Fuel 125,841 982 2,300 2,300 2,400 4.35% 0.10%Airport: Tie Down Fees 525 325 600 600 600 - 0.03%Airport: Lease 46,766 43,194 44,900 44,900 47,900 6.68% 2.07%Fixed Base Operator Revenues 15,355 19,200 18,000 18,000 18,000 - 0.78%Space Rental 28,200 28,600 28,600 28,600 28,600 - 1.24%Dayton Hudson Corp (Target) 35,282 33,758 - - - - - Miscellaneous Revenue 168 296 - - 6,100 - 0.26%Interest 2,809 6,206 4,600 4,600 6,300 36.96% 0.27%___________________________________________________________________________________________________________Total Current Resources 1,182,118 1,191,453 1,203,300 1,203,300 1,347,300 11.97% 58.33%___________________________________________________________________________________________________________From CARA Program 147,500 129,700 209,900 209,900 210,000 0.05% 9.09%Transfer In: Transient Room Tax 67,600 69,600 71,700 71,700 73,900 3.07% 3.20%From Economic Development 4,800 5,000 - - - - - ___________________________________________________________________________________________________________Total Transfers In 219,900 204,300 281,600 281,600 283,900 0.82% 12.29%___________________________________________________________________________________________________________Beginning Balance 549,237 745,339 643,100 643,100 678,300 5.47% 29.38%___________________________________________________________________________________________________________Total Resources 1,951,255$ 2,141,091$ 2,128,000$ 2,128,000$ 2,309,500$ 8.53% 100.00%______________________________________________________________________________________________________________________________________________________________________________________________________________________
CARA-Central Albany Revitalization Area
ECONOMIC DEVELOPMENT FUND RESOURCES BY SOURCECategory Totals and Percent of Budget
……2016-17……
Transient room taxes $1,237,400 (53.58%)
Airport resources $97,500 (4.22%)
Investment earnings $6,300 (0.27%)
Transfers in $283,900 (12.29%)
Beginning balance $678,300 (29.38%)
206

ECONOMIC DEVELOPMENT FUNDREQUIREMENT AND STAFFING SUMMARIES
2014-15 2015-16Program Requirements Actual Actual Adopted Revised Proposed Approved Adopted_________________________________________________________________________________________________________________Target Utilities 39,908$ 38,184$ -$ -$ -$ -$ -$ Economic Development Activities 936,159 1,331,309 1,553,400 1,553,400 1,689,700 1,689,700 1,689,700 Albany Municipal Airport 181,075 90,652 310,600 310,600 315,500 315,500 315,500 Municipal Airport Capital Projects 48,774 33,047 264,000 264,000 304,300 304,300 304,300 _________________________________________________________________________________________________________________Total Requirements 1,205,916$ 1,493,192$ 2,128,000$ 2,128,000$ 2,309,500$ 2,309,500$ 2,309,500$ __________________________________________________________________________________________________________________________________________________________________________________________________________________________________
Requirements by Type_________________________________________________________________________________________________________________Personnel 164,139$ 218,898$ 267,900$ 267,900$ 202,600$ 202,600$ 202,600$ Materials & Services 759,734 726,929 838,700 838,700 936,300 936,300 936,300 Capital - 4,781 426,800 426,800 520,700 520,700 520,700 Transfers Out 242,134 504,400 594,600 594,600 649,900 649,900 649,900 Debt Service 39,908 38,184 - - - - - _________________________________________________________________________________________________________________Total Requirements 1,205,916$ 1,493,192$ 2,128,000$ 2,128,000$ 2,309,500$ 2,309,500$ 2,309,500$ __________________________________________________________________________________________________________________________________________________________________________________________________________________________________
Adopted Requirements Materials Transfers Adopted % of Fundby Program and Type Personnel & Services Capital Out Budget Budget_________________________________________________________________________________________________________________Economic Development Activities 186,600 855,900 - 647,200 1,689,700 73.16%Albany Municipal Airport 16,000 79,500 220,000 - 315,500 13.66%Municipal Airport Capital Projects - 900 300,700 2,700 304,300 13.18%_________________________________________________________________________________________________________________Total Requirements 202,600$ 936,300$ 520,700$ 649,900$ 2,309,500$ 100.00%__________________________________________________________________________________________________________________________________________________________________________________________________________________________________Percent of Fund Budget 8.77% 40.54% 22.55% 28.14% 100.00%____________________________________________________________________________________________________________________________________________________________________________________________________________
2014-15 2015-16Staffing Summary (FTE) Actual Actual Adopted Revised Proposed Approved Adopted_________________________________________________________________________________________________________________Economic Development Activities 2.000 1.000 2.000 2.000 2.000 2.000 2.000 Albany Municipal Airport 0.100 0.100 0.100 0.100 0.100 0.100 0.100 _________________________________________________________________________________________________________________Total FTE 2.100 1.100 2.100 2.100 2.100 2.100 2.100 __________________________________________________________________________________________________________________________________________________________________________________________________________________________________
……2016-17…… ……2017-18……
……2016-17…… ……2017-18……
207

ECONOMIC DEVELOPMENT FUND
TRANSIENT LODGING TAX COLLECTIONS*
Ten Fiscal YearsAnnual
Fiscal Debt Economic IncreaseYear Service** Development Totals (Decrease)_________________________________________________________2009 196,593$ 478,150$ 674,743$ na2010 213,175 382,054 595,229 (11.78%) 2011 - 655,879 655,879 10.19% 2012 - 715,865 715,865 9.15% 2013 - 754,585 754,585 5.41% 2014 - 803,805 803,805 6.52% 2015 - 927,172 927,172 15.35% 2016 - 965,060 965,060 4.09% 2017 - 1,028,800 1,028,800 6.60% 2018 - 1,122,000 1,122,000 9.06%
* Actual collections for years 2009 through 2016. Budgeted collections for 2017 and 2018. ** Final payment of Fairgrounds bonds paid in 2010 with reserves.
ANNUAL PERCENTAGE INCREASE (DECREASE)
Nine Fiscal Years
(11.78%)
10.19%
9.15%
5.41% 6.52%
15.35%
4.09% 6.60%
9.06%
(15.00%)
(10.00%)
(5.00%)
-
5.00%
10.00%
15.00%
20.00%
25.00%
2010 2011 2012 2013 2014 2015 2016 2017 2018
208

ECONOMIC DEVELOPMENT FUNDUSE OF TRANSIENT LODGING TAX REVENUES
Ten Fiscal Years
……….Non-Profit Agencies………. Amount Total TotalAlbany Albany Available Economic Transient
Fiscal Visitors Downtown for Other Development Debt Lodging TaxYear Association AMEDC1 Association Activities Fund Service2 Revenues___________________________________________________________________________________________________2009 347,000$ 45,000$ 30,000$ 56,150$ 478,150$ 196,593$ 674,743$ 2010 337,300 45,000 35,589 (35,835) 382,054 213,175 595,229 2011 320,300 42,700 33,623 259,256 655,879 - 655,879 2012 329,000 44,000 39,600 303,265 715,865 - 715,865 2013 338,900 45,400 40,800 329,485 754,585 - 754,585 2014 349,100 46,900 42,000 365,805 803,805 - 803,805 2015 359,600 48,300 43,300 475,972 927,172 - 927,172 2016 370,400 49,700 44,600 500,360 965,060 - 965,060 2017 381,500 51,200 45,900 550,200 1,028,800 - 1,028,800 2018 392,900 52,700 47,300 629,100 1,122,000 - 1,122,000
1 Albany-Millersburg Economic Development Corporation2 After Fiscal Year 2010, no tax revenues are required for debt service.
PERCENTAGE OF TOTAL LODGING TAX REVENUES BY USAGETen Fiscal Years
……….Non-Profit Agencies………. Amount Total TotalAlbany Albany Available Economic Transient
Fiscal Visitors Downtown for Other Development Debt Lodging TaxYear Association AMEDC Association Activities Fund Service Revenues___________________________________________________________________________________________________2009 51 43% 6 67% 4 45% 8 32% 70 86% 29 14% 100 00%2009 51.43% 6.67% 4.45% 8.32% 70.86% 29.14% 100.00% 2010 56.67% 7.56% 5.98% (6.02%) 64.19% 35.81% 100.00% 2011 48.84% 6.51% 5.13% 39.53% 100.00% - 100.00% 2012 45.96% 6.15% 5.53% 42.36% 100.00% - 100.00% 2013 44.91% 6.02% 5.41% 43.66% 100.00% - 100.00% 2014 43.43% 5.83% 5.23% 45.51% 100.00% - 100.00% 2015 38.78% 5.21% 4.67% 51.34% 100.00% - 100.00% 2016 38.38% 5.15% 4.62% 51.85% 100.00% - 100.00% 2017 37.08% 4.98% 4.46% 53.48% 100.00% - 100.00% 2018 35.02% 4.70% 4.22% 56.07% 100.00% - 100.00%
PERCENTAGE OF TOTAL LODGING TAX REVENUES BY USAGETen Fiscal Years
-20%
0%
20%
40%
60%
80%
2009 2010 2011 2012 2013 2014 2015 2016 2017 2018
Non-Profit Agencies Economic Development Activities Debt service
209

PROGRAM NARRATIVE
ECONOMIC DEVELOPMENT: ECONOMIC DEVELOPMENT ACTIVITIES (211-11-1101) Responsible Manager/Title: Jorge Salinas, Interim Economic Development Director
FUNCTIONS AND RESPONSIBILITIES
Provide management oversight for economic development and urban renewal activities and the Strategic Plan initiatives.
Provide management oversight and support to the CARA district and its activities.
Manage outside agency grants to market Albany to convention, event, and tournament planners via the Transient Lodging Tax (TLT) policy adopted by City Council for use of Transient Room Tax (TRT). (A review of this policy began in FY 2015-16 and continues in FY 2017-18.)
Meet regularly with local businesses and industries to determine needs, eliminate barriers, and connect businesses to available resources.
Contract (through outside agency grant), support, and coordinate with the Albany-Millersburg Economic Development Corporation (AMEDC) to establish, retain, and expand business in Albany.
Continue active collaboration and participation with partner organizations including AMEDC, Chamber, and Main Street Committees, as well as neighboring communities and jurisdictions. Maintain membership on statewide boards to strengthen Albany’s presence and opportunities. Complete draft, review, and implement economic development metrics for Albany.
Administer the TRT according to ORS Sections 320.345-320.350; Albany Municipal Code Chapter 3.14; and the TLT policy adopted by the City Council. The room tax rate has been nine percent since July 1, 1999. Operators retain five percent of the gross tax as compensation for record-keeping services.
The Reserve in this fund is used for tourism promotion activities.
STRATEGIES/ACTIONS
Strategic Plan Theme Target Date Status Strategies/Actions
Budget Year 2016-2017
Effective Government 07/16 Completed Reestablish the Urban Renewal Officer position.
Healthy Economy 06/17 Completed Coordinate partnership with Linn Benton Community College (LBCC) and local industries related to City’s $2.9 million investment in equipment.
Budget Year 2017-2018
Healthy Economy 06/18 Continue partnership with LBCC and local industries related to City’s $2.9 million investment in equipment until all required invoices are paid.
06/18 Partner with AMEDC to renew the Santiam Enterprise Zone for an additional ten-year period.
PERFORMANCE MEASURES AND WORKLOAD INDICATORS
2014-2015 2015-2016 2016-2017* 2017-2018 Conduct regular visits to local businesses and industries. 21 12 12 18 Assist projects with financial assistance or removal 19 15 8 6 of development barriers. * Numbers are through January 31, 2017
STAFFING SUMMARY Budgeted FTEs 1.00 1.00 2.00 2.00
210

211: Economic Development
11: City Manager's Office
2014-2015 2015-2016 2016-2017 2016-2017 2017-2018 %Description Actual Actual Adopted Revised Adopted Change
REVENUESTransient Lodging Tax 927,172 1,058,892 1,104,300 1,104,300 1,237,400 12.05 % Miscellaneous Revenue 17 76 - - 100 - %Investment Income 1,210 3,544 2,400 2,400 3,800 58.33 % Transfers In 147,500 129,700 209,900 209,900 210,000 0.05 % Beginning Balance 224,495 364,235 236,800 236,800 238,400 0.68 % TOTAL REVENUES 1,300,394 1,556,447 1,553,400 1,553,400 1,689,700 8.77 %
EXPENDITURESPersonnel Services 149,472 203,928 252,300 252,300 186,600 (26.04)% Materials & Services 561,087 622,982 735,000 735,000 855,900 16.45 % Transfers Out 225,600 504,400 566,100 566,100 647,200 14.33 % TOTAL EXPENDITURES 936,159 1,331,310 1,553,400 1,553,400 1,689,700 8.77 %
Prog 1101: Economic Development Activities Revenues less Expenditures 364,235 225,137 - - -
CITY OF ALBANY, OREGONPROG 1101: Economic Development Activities
211

PROGRAM NARRATIVE
ECONOMIC DEVELOPMENT: ALBANY MUNICIPAL AIRPORT (211-50-1103) Responsible Manager/Title: Jon Goldman, Utility Superintendent - Transportation
FUNCTIONS AND RESPONSIBILITIES
Support the economic viability of the Albany Municipal Airport through an active partnership with economic development, local business and industry, and the aviation community.
Provide management of the Albany Municipal Airport including hangar leases, property management, and compliance with FAA regulations.
STRATEGIES/ACTIONS
Strategic Plan Theme Target Date Status Strategies/Actions
Budget Year 2016-2017
Effective Government 06/17 In Progress Install static display aircraft.
Budget Year 2017-2018
Effective Government 06/18 Install new hangar taxilane.
PERFORMANCE MEASURES AND WORKLOAD INDICATORS
2014-2015 2015-2016 2016-2017 2017-2018 Percent of City hangar occupancy. 100% 100% 100% 100% Number of aircraft based on the field. 88 90 90 90 Average aircraft operations per day. 70 62 62 62 Number of Airport Advisory Commission mtgs. 11 11 11 12
STAFFING SUMMARY Budgeted FTEs 0.10 0.10 0.10 0.10
212

211: Economic Development
50: Public Works
2014-2015 2015-2016 2016-2017 2016-2017 2017-2018 %Description Actual Actual Adopted Revised Adopted Change
REVENUESCharges for Services 216,687 92,301 94,400 94,400 97,500 3.28 % Investment Income 665 1,240 1,200 1,200 1,000 (16.67)% Beginning Balance 174,099 210,527 215,000 215,000 217,000 0.93 % TOTAL REVENUES 391,602 304,288 310,600 310,600 315,500 1.58 %
EXPENDITURESPersonnel Services 14,667 14,971 15,600 15,600 16,000 2.56 % Materials & Services 166,408 70,900 67,200 67,200 79,500 18.30 % Capital - 4,781 227,800 227,800 220,000 (3.42)% TOTAL EXPENDITURES 181,075 90,652 310,600 310,600 315,500 1.58 %
Prog 1103: Albany Municipal Airport Revenues less Expenditures 210,527 213,636 - - -
CITY OF ALBANY, OREGONPROG 1103: Albany Municipal Airport
213

PROGRAM NARRATIVE
ECONOMIC DEVELOPMENT FUND: MUNICIPAL AIRPORT CAPITAL PROJECTS (211-50-1115) Responsible Manager/Title: Jon Goldman, Utility Superintendent - Transportation
FUNCTIONS AND RESPONSIBILITIES
This program receives revenues from the Transient Lodging Tax distributions, which is a vital piece of economic development.
Funds capital projects for the Albany Municipal Airport.
Builds reserves for future Airport capital projects.
STRATEGIES/ACTIONS
Strategic Plan Theme Target Date Status Strategies/Actions
Budget Year 2016-2017
Effective Government 06/17 In Progress Provide matching funds for the parallel taxiway design project.
Budget Year 2017-2018
Effective Government 06/18 Provide matching funds for the apron rehabilitation.
214

211: Economic Development
50: Public Works
2014-2015 2015-2016 2016-2017 2016-2017 2017-2018 %Description Actual Actual Adopted Revised Adopted Change
REVENUESMiscellaneous Revenue - - - - 6,000 - %Investment Income 934 1,422 1,000 1,000 1,500 50.00 % Transfers In 67,600 69,600 71,700 71,700 73,900 3.07 % Beginning Balance 151,295 171,055 191,300 191,300 222,900 16.52 % TOTAL REVENUES 219,829 242,077 264,000 264,000 304,300 15.27 %
EXPENDITURESMaterials & Services 32,239 33,047 36,500 36,500 900 (97.53)% Capital - - 199,000 199,000 300,700 51.11 % Transfers Out 16,534 - 28,500 28,500 2,700 (90.53)% TOTAL EXPENDITURES 48,773 33,047 264,000 264,000 304,300 15.27 %
Prog 1115: Municipal Airport Capital Projects Revenues less Expenditures 171,056 209,030 - - -
CITY OF ALBANY, OREGONPROG 1115: Municipal Airport Capital Projects
215

PUBLIC TRANSIT FUNDRESOURCE DETAIL
2017-18 % Change % of
2014-15 2015-16 Adopted Revised Adopted from FundResources Actual Actual Budget Budget Budget 2016-17 Budget____________________________________________________________________________________________________________State Operating Match Grant - - - - - - - FTA Section 5310 Grant 247,754 160,173 121,300 121,300 95,800 (21.02%) 2.87%FTA Section 5309 Grant 311,250 - 348,600 348,600 348,600 - 10.44%FTA Section 5307 817,916 613,059 1,125,000 1,125,000 1,398,700 24.33% 41.86%WComp Wage Subsidy Reimb 1,159 5,373 - - - - - City of Millersburg 788 2,106 1,900 1,900 1,200 (36.84%) 0.04%Local Funds: Operational 12,000 9,750 - - - - - Special Transit Fund: Linn Co - 54,720 49,600 49,600 42,000 (15.32%) 1.26%Special Transit Fund: Benton Co 8,000 27,000 27,000 27,000 27,000 - 0.81%LBCC Partnership 105,500 108,500 111,700 111,700 113,900 1.97% 3.41%OSU Partnership 105,500 108,500 111,700 111,700 113,900 1.97% 3.41%OSU Pass Program 1,100 1,100 3,000 3,000 3,000 - 0.09%Other Pass Programs 2,200 - - - - - - LBCC Pass Program 18,900 18,900 15,000 15,000 15,000 - 0.45%Advertising Revenue 7,004 5,781 5,000 5,000 - (100.00%) - Bus Fares 56,140 51,620 47,000 47,000 47,000 - 1.41%LBCC Fare Match Program - - - - - - - Call-A-Ride Revenue 30,000 34,805 32,000 32,000 34,000 6.25% 1.02%Gifts & Donations 90 610 300 300 300 - 0.01%Miscellaneous Revenue 321 1,442 - - - - - Over & short 38 (4) - - - - - Interest 299 1,254 300 300 1,200 300.00% 0.04%____________________________________________________________________________________________________________Total Current Resources 1,725,959 1,204,689 1,999,400 1,999,400 2,241,600 12.11% 67.12%____________________________________________________________________________________________________________From General Fund 466,700 571,900 592,800 592,800 695,700 17.36% 20.83%From Capital Equipment Fund 88,000 - 159,400 159,400 179,400 12.55% 5.37%____________________________________________________________________________________________________________Total Transfers In 554 700 571 900 752 200 752 200 875 100 16 34% 26 20%
……2016-17……
Total Transfers In 554,700 571,900 752,200 752,200 875,100 16.34% 26.20%____________________________________________________________________________________________________________Beginning Balance 266,459 244,153 127,000 127,000 223,000 75.59% 6.68%____________________________________________________________________________________________________________Total Resources 2,547,118$ 2,020,742$ 2,878,600$ 2,878,600$ 3,339,700$ 16.02% 100.00%________________________________________________________________________________________________________________________________________________________________________________________________________________________
LBCC-Linn Benton Community College
FTA-Federal Transit Administration
PUBLIC TRANSIT RESOURCES BY SOURCECategory Totals and Percent of Budget
Intergovernmental resources $2,159,100
(64.64%)
Charges for service $81,000 (2.43%)
Other resources $300 (0.01%)
Investment earnings $1,200 (0.04%)
Transfers in $875,100 (26.2%)
Beginning balance $223,000 (6.68%)
216

PUBLIC TRANSIT FUND
RESOURCES BY TYPE - TEN FISCAL YEARS
Intergovern- ChargesFiscal mental for Other Interest Transfers Beginning TotalYear Resources Services Resources Earnings In Balance Resources_______________________________________________________________________________________________________2009 512,225$ 123,937$ 2,623$ 418$ 320,000$ 75,749$ 1,034,952$ 2010 747,408 147,438 725 (177) 459,900 15,671 1,370,965 2011 542,730 161,798 5,468 226 426,500 149,353 1,286,075 2012 1,080,017 161,026 1,334 1,211 370,800 58,180 1,672,568 2013 788,548 148,779 368 1,070 436,100 282,919 1,657,784 2014 1,125,755 94,443 1,167 (755) 516,000 90,944 1,827,554 2015 1,632,067 93,144 449 299 554,700 266,459 2,547,118 2016 1,109,181 92,207 2,048 1,254 571,900 244,153 2,020,743 2017 1,914,800 84,000 300 300 752,200 127,000 2,878,600 2018 2,159,100 81,000 300 1,200 875,100 223,000 3,339,700
RESOURCES BY TYPE - PERCENTAGE OF TOTAL RESOURCES - TEN FISCAL YEARS
2009 49.49% 11.98% 0.25% 0.04% 30.92% 7.32% 100.00% 2010 54.52% 10.75% 0.05% (0.01%) 33.55% 1.14% 100.00% 2011 42.20% 12.58% 0.43% 0.02% 33.16% 11.61% 100.00% 2012 64.57% 9.63% 0.08% 0.07% 22.17% 3.48% 100.00% 2013 47.57% 8.97% 0.02% 0.06% 26.31% 17.07% 100.00% 2014 61.60% 5.17% 0.06% (0.04%) 28.23% 4.98% 100.00% 2015 64.08% 3.66% 0.02% 0.01% 21.78% 10.45% 100.00% 2016 54.89% 4.56% 0.10% 0.06% 28.30% 12.09% 100.00% 2017 66.52% 2.92% 0.01% 0.01% 26.13% 4.41% 100.00% 2018 64.65% 2.43% 0.01% 0.04% 26.20% 6.67% 100.00%
MAJOR RESOURCES BY TYPE - TEN FISCAL YEARS
$-
$200,000
$400,000
$600,000
$800,000
$1,000,000
$1,200,000
$1,400,000
$1,600,000
$1,800,000
$2,000,000
$2,200,000
$2,400,000
2009 2010 2011 2012 2013 2014 2015 2016 2017 2018
Intergov. Resources Charges for Services Transfers In Beginning Balance
217


PUBLIC TRANSIT FUNDREQUIREMENT AND STAFFING SUMMARIES
2014-15 2015-16Program Requirements Actual Actual Adopted Revised Proposed Approved Adopted______________________________________________________________________________________________________Albany Transit System 968,381$ 628,331$ 1,192,700$ 1,192,700$ 1,505,200$ 1,505,200$ 1,505,200$ Linn-Benton Loop 899,224 533,552 1,103,900 1,103,900 1,120,800 1,120,800 1,120,800Paratransit System 435,361 491,343 582,000 582,000 713,700 713,700 713,700______________________________________________________________________________________________________Total Requirements 2,302,966$ 1,653,226$ 2,878,600$ 2,878,600$ 3,339,700$ 3,339,700$ 3,339,700$ ____________________________________________________________________________________________________________________________________________________________________________________________________________
Requirements by Type______________________________________________________________________________________________________Personnel 988,184$ 1,082,088$ 1,254,900$ 1,254,900$ 1,265,800$ 1,265,800$ 1,265,800$ Materials & Services 557,696 566,138 752,400 752,400 1,102,600 1,102,600 1,102,600 Capital 752,086 - 871,300 871,300 971,300 971,300 971,300 Transfers Out 5,000 5,000 - - - - - ______________________________________________________________________________________________________Total Requirements 2,302,966$ 1,653,226$ 2,878,600$ 2,878,600$ 3,339,700$ 3,339,700$ 3,339,700$ ____________________________________________________________________________________________________________________________________________________________________________________________________________
Adopted Requirements Materials Adopted % of Fundby Program and Type Personnel & Services Capital Budget Budget______________________________________________________________________________________________________Albany Transit System 396,600 657,300 451,300 1,505,200$ 45.07%Linn-Benton Loop 429,100 271,700 420,000 1,120,800 33.56%Paratransit System 440,100 173,600 100,000 713,700 21.37%______________________________________________________________________________________________________Total Requirements 1,265,800$ 1,102,600$ 971,300$ 3,339,700$ 100.00%____________________________________________________________________________________________________________________________________________________________________________________________________________Percent of Fund Budget 37.91% 33.01% 29.08% 100.00%______________________________________________________________________________________________________________________________________________________________________________________
2014-15 2015-16Staffing Summary (FTE) Actual Actual Adopted Revised Proposed Approved Adopted______________________________________________________________________________________________________Albany Transit System 3.910 3.910 3.910 3.910 3.910 3.910 3.910 Linn-Benton Loop 3.975 3.975 4.475 4.475 4.475 4.475 4.475 Paratransit System 3.415 3.415 4.490 4.490 4.490 4.490 4.490 ______________________________________________________________________________________________________Total FTE 11.300 11.300 12.875 12.875 12.875 12.875 12.875 ____________________________________________________________________________________________________________________________________________________________________________________________________________
……2016-17…… ……2017-18……
……2016-17…… ……2017-18……
218

PROGRAM NARRATIVE
PUBLIC TRANSIT: ALBANY TRANSIT SYSTEM (213-50-1106) Responsible Manager/Title: Jon Goldman, Utility Superintendent - Transportation
Developed by: Barry Hoffman, Transit Programs Supervisor
FUNCTIONS AND RESPONSIBILITIES
Provide a safe and reliable public transit system along fixed routes to link residential areas with retail, employment, medical, and educational centers.
Maintain records of ridership, maintenance, and operation of the system and apply for state and federal grants in order to obtain system funding.
Administer the Ride-Home-Free Program with local merchants.
Identify and pursue additional grant and revenue resources.
Provide management and supervision of the transit system in compliance with federal and state regulations.
Conduct a ridership satisfaction survey every two years.
Provide rides to Linn Benton Community College and Oregon State (OS) students through the combined Pass Programs.
STRATEGIES/ACTIONS
Strategic Plan Theme
Target Date
Status Strategies/Actions
Budget Year 2016-2017
Effective Government Safe City
07/16 Postponed Conduct triennial review with Federal Transit Administration (FTA) to improve processes.
10/16 In Progress Work to find grant funding for replacement bus barn.
03/17 In Progress Participate in regional transportation planning effort and Transit Development Plan.
06/17 In Progress Begin to implement changes recommended in regional plan.
Budget Year 2017-2018
Effective Government 07/17 Research and fund real-time bus location software.
11/17 Finalize Transit Development plan with Albany Area Metropolitan Planning Organization (AAMPO).
12/17 Complete purchase of replacement bus.
03/18 Dispose of bus 455-05.
PERFORMANCE MEASURES AND WORKLOAD INDICATORS 2014-2015 2015-2016 2016-2017 2017-2018 Total number of rides. 86,149 73,369 80,000 81,000 Number of senior/disabled passengers. 20,675 17,608 19,200 19,440 Annual mileage. 92,515 94,085 92,000 92,000 Operating cost per ride. $5.95 $7.06 $7.60 $10.20
STAFFING SUMMARY Budgeted FTEs 3.91 3.91 3.91 3.91
219

213: Public Transit
50: Public Works
2014-2015 2015-2016 2016-2017 2016-2017 2017-2018 %Description Actual Actual Adopted Revised Adopted Change
REVENUESIntergovernmental Revenue 557,712 300,739 627,100 627,100 735,900 17.35 % Charges for Services 34,072 32,513 27,000 27,000 25,000 (7.41)% Miscellaneous Revenue 165 1,438 - - - - %Investment Income (1,394) 495 - - 600 - %Transfers In 417,200 389,100 487,100 487,100 593,700 21.88 % Beginning Balance 101,782 141,156 51,500 51,500 150,000 191.26 % TOTAL REVENUES 1,109,537 865,441 1,192,700 1,192,700 1,505,200 26.20 %
EXPENDITURESPersonnel Services 375,786 405,868 410,300 410,300 396,600 (3.34)% Materials & Services 213,087 217,463 331,100 331,100 657,300 98.52 % Capital 374,509 - 451,300 451,300 451,300 - %Transfers Out 5,000 5,000 - - - - %TOTAL EXPENDITURES 968,382 628,331 1,192,700 1,192,700 1,505,200 26.20 %
Prog 1106: Albany Transit System Revenues less Expenditures 141,155 237,110 - - -
CITY OF ALBANY, OREGONPROG 1106: Albany Transit System
220

PROGRAM NARRATIVE
PUBLIC TRANSIT: LINN-BENTON LOOP (213-50-1107) Responsible Manager/Title: Jon Goldman, Utility Superintendent - Transportation
Developed by: Barry Hoffman, Transit Programs Supervisor
FUNCTIONS AND RESPONSIBILITIES
Manage the Linn-Benton Loop to provide a safe and reliable public transit system along fixed routes between the cities of Albany and Corvallis in accordance with federal and state regulations.
Maintain records of ridership, maintenance, and operation of the system and apply for state and federal grants in order to obtain system funding.
Provide rides to LBCC and OSU students through the combined Pass Program.
Provide management and supervision for the system, including personnel, operating, and maintenance of equipment.
Manage local operating funds from partners: Benton County Special Transportation Fund (STF); Linn County; LBCC; Corvallis; Albany; and OSU.
Participate in the Albany Area Metropolitan Planning Organization (AAMPO) technical and policy meetings, and in developing a funding and governance plan for the Loop.
STRATEGIES/ACTIONS
Strategic Plan Theme Target Date Status Strategies/Actions
Budget Year 2016-2017
Effective Government 07/16 In Progress Conduct onboard ridership count to determine senior and disabled use of the Loop.
08/16 In Progress Apply for funding for Loop expansion study and plan.
01/17 In Progress Work with AAMPO to organize a new Loop Advisory Committee.
06/17 In Progress Begin implementation of recommendations from Loop study plan.
Budget Year 2017-2018
Effective Government Safe City
07/17 Research and fund real-time bus location software.
11/17 Work with new Loop Governing board and TAC to establish procedures.
12/17 Work with AAMPO to stabilize funding sources.
03/18 Complete purchase of replacement bus.
PERFORMANCE MEASURES AND WORKLOAD INDICATORS
2014-2015 2015-2016 2016-2017 2017-2018 Total number of rides. 128,716 111,595 102,000 108,000 Number of senior/disabled passengers. 18,020 13,391 14,280 15,120 Annual mileage. 105,005 108,875 105,000 105,000 Operating cost per ride. $3.35 $4.04 $4.60 $5.80
STAFFING SUMMARY
Budgeted FTEs 3.98 3.98 4.48 4.48
221

213: Public Transit
50: Public Works
2014-2015 2015-2016 2016-2017 2016-2017 2017-2018 %Description Actual Actual Adopted Revised Adopted Change
REVENUESIntergovernmental Revenue 799,456 503,426 939,500 939,500 959,100 2.09 % Charges for Services 29,072 24,889 25,000 25,000 22,000 (12.00)% Miscellaneous Revenue 172 - - - - - %Investment Income 626 614 - - 300 - %Transfers In - - 71,400 71,400 71,400 - %Beginning Balance 154,472 84,573 68,000 68,000 68,000 - %TOTAL REVENUES 983,798 613,502 1,103,900 1,103,900 1,120,800 1.53 %
EXPENDITURESPersonnel Services 297,823 323,289 430,300 430,300 429,100 (0.28)% Materials & Services 223,824 210,263 253,600 253,600 271,700 7.14 % Capital 377,578 - 420,000 420,000 420,000 - %TOTAL EXPENDITURES 899,225 533,552 1,103,900 1,103,900 1,120,800 1.53 %
Prog 1107: Linn-Benton Loop Revenues less Expenditures 84,573 79,950 - - -
CITY OF ALBANY, OREGONPROG 1107: Linn-Benton Loop
222

PROGRAM NARRATIVE
PUBLIC TRANSIT: PARATRANSIT SYSTEM (213-50-1108) Responsible Manager/Title: Jon Goldman, Utility Superintendent - Transportation
Developed by: Ted Frazier, Paratransit Services Supervisor
FUNCTIONS AND RESPONSIBILITIES Provide transportation to essential services
through the Call-A-Ride program for the elderly and individuals who have disabilities that prevent them from using the fixed-route transit system.
Manage and operate the Paratransit service as required by the Americans with Disabilities Act (ADA) and federal and state public transit regulations.
Identify and pursue additional grant and revenue resources.
Certify eligibility of ADA participants and provide Paratransit service in compliance with federal law.
Provide Medicaid nonmedical transportation for eligible senior citizens and individuals with disabilities (Title XIX rides).
Maintain ridership and operation records for state-funding purposes.
Ensure that all transit services are in Federal Transit Administration (FTA) compliance.
STRATEGIES/ACTIONS
Strategic Plan Theme Target Date Status Strategies/Actions
Budget Year 2016-2017
Effective Government 06/17 In Progress
Work with Metropolitan Planning Organization (MPO) partners to finalize short- and long-term Paratransit goals.
01/17 Completed Evaluate program for ADA compliance. 03/17 Completed Develop and complete rider survey. 06/17 Completed Develop volunteer recruitment plan.
Budget Year 2017-2018
Effective Government 01/18
Update volunteer driving evaluation forms and set up new monthly schedule to evaluate the volunteers’ driving skills.
07/17
Meet with outlying cities within the Urbanized Area (UZA) to discuss transportation needs/options.
12/17
Work with Samaritan Health Services and Heart to Heart partners to discuss volunteer recruitment possibilities and available grants.
08/17
Send out Request for Quotes (RFQ) to vendors to purchase two replacement wheelchair-accessible vans.
PERFORMANCE MEASURES AND WORKLOAD INDICATORS
2014-2015 2015-2016 2016-2017 2017-2018 Percent of those using the Paratransit/Call-A-Ride program
satisfied or very satisfied with the service received. 95% 95% 96% 96%
Number of rides provided per month. 1,629 1,720 1,780 1,830 Number of miles driven per month. 8,800 8,800 9,100 9,100 Number of volunteer hours. 5,000 5,000 5,000 4,100 Cost per revenue service mile. $3.60 $3.97 $4.82 $4.54
STAFFING SUMMARY
Budgeted FTEs 3.42 3.42 4.49 4.49
223

213: Public Transit
50: Public Works
2014-2015 2015-2016 2016-2017 2016-2017 2017-2018 %Description Actual Actual Adopted Revised Adopted Change
REVENUESIntergovernmental Revenue 274,900 305,017 348,200 348,200 464,100 33.29 % Charges for Services 30,000 34,805 32,000 32,000 34,000 6.25 % Miscellaneous Revenue 112 610 300 300 300 - %Investment Income 1,067 145 300 300 300 - %Transfers In 137,500 182,800 193,700 193,700 210,000 8.42 % Beginning Balance 10,206 18,425 7,500 7,500 5,000 (33.33)% TOTAL REVENUES 453,785 541,802 582,000 582,000 713,700 22.63 %
EXPENDITURESPersonnel Services 314,575 352,930 414,300 414,300 440,100 6.23 % Materials & Services 120,785 138,222 167,700 167,700 173,600 3.52 % Capital - - - - 100,000 - %TOTAL EXPENDITURES 435,360 491,152 582,000 582,000 713,700 22.63 %
Prog 1108: Paratransit System Revenues less Expenditures 18,425 50,650 - - -
CITY OF ALBANY, OREGONPROG 1108: Paratransit System
224
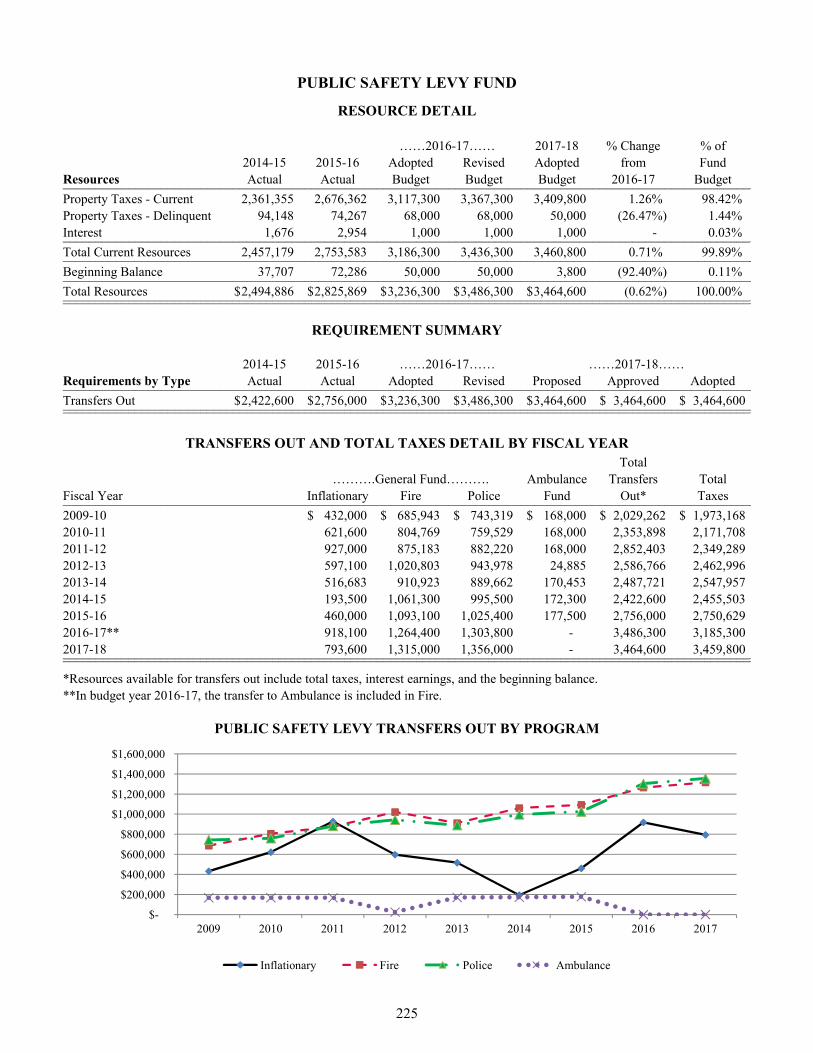
PUBLIC SAFETY LEVY FUND
RESOURCE DETAIL
2017-18 % Change % of2014-15 2015-16 Adopted Revised Adopted from Fund
Resources Actual Actual Budget Budget Budget 2016-17 Budget__________________________________________________________________________________________________________Property Taxes - Current 2,361,355 2,676,362 3,117,300 3,367,300 3,409,800 1.26% 98.42%Property Taxes - Delinquent 94,148 74,267 68,000 68,000 50,000 (26.47%) 1.44%Interest 1,676 2,954 1,000 1,000 1,000 - 0.03%__________________________________________________________________________________________________________Total Current Resources 2,457,179 2,753,583 3,186,300 3,436,300 3,460,800 0.71% 99.89%__________________________________________________________________________________________________________Beginning Balance 37,707 72,286 50,000 50,000 3,800 (92.40%) 0.11%__________________________________________________________________________________________________________Total Resources 2,494,886$ 2,825,869$ 3,236,300$ 3,486,300$ 3,464,600$ (0.62%) 100.00%____________________________________________________________________________________________________________________________________________________________________________________________________________________
REQUIREMENT SUMMARY
2014-15 2015-16Requirements by Type Actual Actual Adopted Revised Proposed Approved Adopted__________________________________________________________________________________________________________Transfers Out 2,422,600$ 2,756,000$ 3,236,300$ 3,486,300$ 3,464,600$ 3,464,600$ 3,464,600$ ____________________________________________________________________________________________________________________________________________________________________________________________________________________
TRANSFERS OUT AND TOTAL TAXES DETAIL BY FISCAL YEARTotal
……….General Fund………. Ambulance Transfers TotalFiscal Year Inflationary Fire Police Fund Out* Taxes__________________________________________________________________________________________________________2009-10 432,000$ 685,943$ 743,319$ 168,000$ 2,029,262$ 1,973,168$ 2010-11 621,600 804,769 759,529 168,000 2,353,898 2,171,708 2011-12 927,000 875,183 882,220 168,000 2,852,403 2,349,289 2012 13 597 100 1 020 803 943 978 24 885 2 586 766 2 462 996
……2016-17……
……2016-17…… ……2017-18……
2012-13 597,100 1,020,803 943,978 24,885 2,586,766 2,462,996 2013-14 516,683 910,923 889,662 170,453 2,487,721 2,547,957 2014-15 193,500 1,061,300 995,500 172,300 2,422,600 2,455,5032015-16 460,000 1,093,100 1,025,400 177,500 2,756,000 2,750,6292016-17** 918,100 1,264,400 1,303,800 - 3,486,300 3,185,3002017-18 793,600 1,315,000 1,356,000 - 3,464,600 3,459,800____________________________________________________________________________________________________________________________________________________________________________________________________________________
*Resources available for transfers out include total taxes, interest earnings, and the beginning balance.**In budget year 2016-17, the transfer to Ambulance is included in Fire.
PUBLIC SAFETY LEVY TRANSFERS OUT BY PROGRAM
$-
$200,000
$400,000
$600,000
$800,000
$1,000,000
$1,200,000
$1,400,000
$1,600,000
2009 2010 2011 2012 2013 2014 2015 2016 2017
Inflationary Fire Police Ambulance
225

Public Safety Levy Property Taxes Levied
Last Ten Fiscal Years 1
……..LINN COUNTY…….. ……..BENTON COUNTY……..Taxes Taxes Linn Co. & Annual
Fiscal Imposed Com- Imposed Com- Benton Co. Per-Year before pression Total before pression Total Total centage
June 30, Compression Amount Received Compression Amount Received Received Change____________________________________________________________________________________________2009 2,221,177$ 137,010$ 2,084,167$ 452,811$ 445$ 452,366$ 2,536,533$ n/a2010 2,333,529 153,763 2,179,766 488,611 6,002 482,609 2,662,375 4.96%2011 2,417,606 197,327 2,220,279 509,107 4,550 504,557 2,724,836 2.35%2012 2,504,913 368,500 2,136,413 532,445 9,036 523,409 2,662,375 -2.29%2013 2,535,336 686,075 1,849,261 554,766 36,689 518,077 2,367,338 -11.08%2014 2,528,454 825,673 1,702,781 565,012 75,216 489,796 2,192,577 -7.38%2015 3,123,405 1,121,228 2,002,177 702,884 167,378 535,506 2,537,683 15.74%2016 3,191,554 1,235,309 1,956,245 736,771 177,372 559,399 2,515,644 -0.87%2017 3,306,950 1,079,205 2,227,745 778,623 181,140 597,483 2,825,228 12.31%2018 n/avail. n/avail. 2,867,430 n/avail. n/avail. 780,654 3,648,084 29.13%
Total Public Safety Levy Taxes to be Received
Last Ten Fiscal Years 1
1 Actual 'Total Received' for 2009-2017. Estimated 'Total Received' for 2018. In May 2016, voters passed a five-year $1.15 per $1,000 levy beginning in Fiscal Year 2016-17.
$4,000,000
Public Safety Levy - Total to be ReceivedAnnual Percentage Change
7.42%
-2.29%
-11.08%
-7.38%
15.74%
-0.87%
12.31%
29.13%
-16%-12%-8%-4%0%4%8%
12%16%20%24%28%32%
2011 2012 2013 2014 2015 2016 2017 2018
$0
$1,000,000
$2,000,000
$3,000,000
2009 2010 2011 2012 2013 2014 2015 2016 2017 2018
$2,5
36,5
33
$2,6
62,3
75
$2,7
24,8
36
$2,6
62,3
75
$2,3
67,3
38
$2,1
92,5
77
$2,5
37,6
83
$2,5
15,6
44
$2,8
25,2
28
$3,6
48,0
84
226

PROGRAM NARRATIVE
PUBLIC SAFETY LEVY FUND: PUBLIC SAFETY LEVY (215-10-1008) Responsible Manager/Title: Stewart Taylor, Finance Director
FUNCTIONS AND RESPONSIBILITIES
This program provides an independent accounting of property tax revenues collected from the Public Safety Levy passed by the voters of the City of Albany in the May 2016 special election. Proceeds from the tax levy are transferred to the General Fund in direct support of police, fire, and ambulance services.
The levy is $1.15 per $1,000 of assessed value for a period of five years.
Fiscal Year 2017-2018 is the second year of the 4th five-year Public Safety Local Option Levy.
227

215: Public Safety Levy
10: Finance
2014-2015 2015-2016 2016-2017 2016-2017 2017-2018 %Description Actual Actual Adopted Revised Adopted Change
REVENUESProperty Taxes 2,455,503 2,750,629 3,185,300 3,185,300 3,459,800 8.62 % Investment Income 1,676 2,954 1,000 1,000 1,000 - %Beginning Balance 37,707 72,286 50,000 50,000 3,800 (92.40)% TOTAL REVENUES 2,494,886 2,825,869 3,236,300 3,236,300 3,464,600 7.05 %
EXPENDITURESTransfers Out 2,422,600 2,756,000 3,236,300 3,236,300 3,464,600 7.05 % TOTAL EXPENDITURES 2,422,600 2,756,000 3,236,300 3,236,300 3,464,600 7.05 %
Prog 1008: Public Safety Levy Revenues less Expenditures 72,286 69,869 - - -
CITY OF ALBANY, OREGONPROG 1008: Public Safety Levy
228


CAPITAL REPLACEMENT FUNDRESOURCE DETAIL
2017-18 % Change % of
2014-15 2015-16 Adopted Revised Adopted from FundResources Actual Actual Budget Budget Budget 2016-17 Budget_________________________________________________________________________________________________________________Energy Trust of Oregon 22,886$ 8,029$ -$ -$ 27,000$ - 0.32%Oregon Community Foundation 2,497 2,547 2,500 2,500 2,500 - 0.03%Departmental Charges 150,000 150,000 150,000 150,000 450,000 200.00% 5.33%Equipment Replacement Charges 562,500 806,020 803,300 803,300 1,411,000 75.65% 16.72%Phone System Charges 75,000 75,000 75,000 75,000 75,000 - 0.89%Albany Library Foundation - 118 - - - - - Property Management 22,000 9,500 - - - - - Miscellaneous Revenue 52,856 96,189 15,000 15,000 15,000 - 0.18%Proceeds From Sale of Capital Assets - 1,745,013 - - - - - Other Financing Sources: Cap. Leases - 242,881 - - - - - Interest 27,928 54,153 26,800 26,800 35,800 33.58% 0.42%_________________________________________________________________________________________________________________Total Current Resources 915,667 3,189,450 1,072,600 1,072,600 2,016,300 87.98% 23.89%_________________________________________________________________________________________________________________From Litigation Proceeds 500,000 - - - - - - From General Fund - 118,200 - - - - - Transfer In: Transient Room Tax 12,000 206,100 270,700 270,700 278,800 2.99% 3.30%_________________________________________________________________________________________________________________Total Transfers In 512,000 324,300 270,700 270,700 278,800 2.99% 3.30%_________________________________________________________________________________________________________________Beginning Balance 5,156,986 5,690,226 6,446,600 6,446,600 6,090,100 (5.53%) 72.19%Beginning Balance: Energy Trust - - 102,400 102,400 23,900 (76.66%) 0.28%Beginning Balance Property Mgmt - - - - 2,200 - 0.03%Beginning Balance Monteith House - - 16,300 16,300 26,400 61.96% 0.31%_________________________________________________________________________________________________________________Total Resources 6,584,653$ 9,203,976$ 7,908,600$ 7,908,600$ 8,437,700$ 6.69% 100.00%__________________________________________________________________________________________________________________________________________________________________________________________________________________________________
REQUIREMENT SUMMARIES
2014-15 2015-16Program Requirements Actual Actual Adopted Revised Proposed Approved Adopted_________________________________________________________________________________________________________________Equipment Replacement 437,208$ 1,606,036$ 5,520,100$ 5,520,100$ 6,079,200$ 6,079,200$ 6,079,200$ City Facilities Replacement 25,396 12,904 121,600 121,600 144,300 144,300 144,300 GF Facilities Maintenance Projects 96,967 67,827 109,500 109,500 75,300 75,300 75,300 IT Equipment Replacement 226,095 694,792 1,810,000 1,810,000 1,490,400 1,490,400 1,490,400 Facilities Replacement 108,760 1,031,075 347,400 347,400 648,500 648,500 648,500 _________________________________________________________________________________________________________________Total Requirements 894,426$ 3,412,634$ 7,908,600$ 7,908,600$ 8,437,700$ 8,437,700$ 8,437,700$ __________________________________________________________________________________________________________________________________________________________________________________________________________________________________
Requirements by Type_________________________________________________________________________________________________________________Materials & Services 484,778$ 456,832$ 573,700$ 573,700$ 575,900$ 575,900$ 575,900$ Capital 321,648 2,955,802 7,175,500 7,175,500 7,682,400 7,682,400 7,682,400Transfers Out 88,000 0 159,400 159,400 179,400 179,400 179,400_________________________________________________________________________________________________________________Total Requirements 894,426$ 3,412,634$ 7,908,600$ 7,908,600$ 8,437,700$ 8,437,700$ 8,437,700$ __________________________________________________________________________________________________________________________________________________________________________________________________________________________________
Adopted Requirements Materials Transfers Adopted % of Fundby Program and Type & Services Capital Out Budget Budget_________________________________________________________________________________________________________________Equipment Replacement 325,000$ 5,574,800$ 179,400$ 6,079,200$ 72.05%City Facilities Replacement 18,700 125,600 - 144,300 1.71%GF Facilities Maintenance Projects 32,200 43,100 - 75,300 0.89%IT Equipment Replacement 200,000 1,290,400 - 1,490,400 17.66%Facilities Replacement - 648,500 - 648,500 7.69%_________________________________________________________________________________________________________________Total Requirements 575,900$ 7,682,400$ 179,400$ 8,437,700$ 100.00%__________________________________________________________________________________________________________________________________________________________________________________________________________________________________Percent of Fund Budget 6.83% 91.04% 2.13% 100.00%____________________________________________________________________________________________________________________________________________________________________________________________________________
GF- General FundIT - Information Technology
……2016-17……
……2016-17…… ……2017-18……
229

PROGRAM NARRATIVE
CAPITAL REPLACEMENT FUND: EQUIPMENT REPLACEMENT (217-10-1010) Responsible Manager/Title: Anne Baker, Accounting Supervisor
FUNCTIONS AND RESPONSIBILITIES
The Equipment Replacement program provides a reserve to replace equipment, excluding Water and Sewer Fund equipment, when the end of its useful life has been reached.
Equipment is replaced when it is determined by
its age, condition, operation and maintenance costs, obsolescence, and depreciation that it is no longer economical to keep. This is referred to as the life expectancy or economic life of the equipment.
In Fiscal Year 2012-13, Equipment
Replacement transferred $300,000 to the General Fund. This was repaid by a loan from Litigation Proceeds.
Ideally, monies are transferred annually from the various departments to the Equipment Replacement program based on the economic life, replacement cost, and estimated rate of return on invested cash for each asset in the replacement program. Estimates of remaining useful life and replacement cost are updated each year by the contributing departments.
230

217: Capital Replacement
10: Finance
2014-2015 2015-2016 2016-2017 2016-2017 2017-2018 %Description Actual Actual Adopted Revised Adopted Change
REVENUESCharges for Services 449,600 398,300 578,300 578,300 1,101,900 90.54 % Miscellaneous Revenue 37,479 336,130 15,000 15,000 15,000 - %Investment Income 14,949 34,092 15,000 15,000 18,000 20.00 % Transfers In 500,000 311,900 258,300 258,300 266,000 2.98 % Beginning Balance 2,654,886 3,219,705 4,653,500 4,653,500 4,678,300 0.53 % TOTAL REVENUES 3,656,914 6,045,140 5,520,100 5,520,100 6,079,200 10.13 %
EXPENDITURESMaterials & Services 191,167 254,657 325,000 325,000 325,000 - %Capital 158,041 1,351,379 5,035,700 5,035,700 5,574,800 10.71 % Transfers Out 88,000 - 159,400 159,400 179,400 12.55 % TOTAL EXPENDITURES 437,208 1,606,036 5,520,100 5,520,100 6,079,200 10.13 %
Prog 1010: Equipment Replacement Revenues less Expenditures 3,219,706 4,439,104 - - -
CITY OF ALBANY, OREGONPROG 1010: Equipment Replacement
231

PROGRAM NARRATIVE
CAPITAL REPLACEMENT FUND: CITY FACILITIES REPLACEMENT (217-10-1034) Responsible Manager/Title: Anne Baker, Accounting Supervisor
FUNCTIONS AND RESPONSIBILITIES
The City Facilities Replacement program reserves funds for major City facilities replacement projects.
Currently there is not a funding source available to replenish what is being expended to maintain City facilities.
232

217: Capital Replacement
10: Finance
2014-2015 2015-2016 2016-2017 2016-2017 2017-2018 %Description Actual Actual Adopted Revised Adopted Change
REVENUESIntergovernmental Revenue 22,886 8,029 - - 27,000 - %Investment Income 680 808 500 500 800 60.00 % Dedicated Beginning Balance - - 102,400 102,400 23,900 (76.66)% Beginning Balance 122,410 120,580 18,700 18,700 92,600 395.19 % TOTAL REVENUES 145,976 129,417 121,600 121,600 144,300 18.67 %
EXPENDITURESMaterials & Services 12,396 2,923 18,700 18,700 18,700 - %Capital 13,000 9,982 102,900 102,900 125,600 22.06 % TOTAL EXPENDITURES 25,396 12,905 121,600 121,600 144,300 18.67 %
Prog 1034: City Facilities Replacement Revenues less Expenditures 120,580 116,512 - - -
CITY OF ALBANY, OREGONPROG 1034: City Facilities Replacement
233

PROGRAM NARRATIVE
CAPITAL REPLACEMENT FUND: GENERAL FUND FACILITIES MAINTENANCE PROJECTS (217-10-2002)
Responsible Manager/Title: Anne Baker, Accounting Supervisor
FUNCTIONS AND RESPONSIBILITIES
Funds are reserved in this program for building maintenance expenditures on City-owned General Fund buildings.
Revenue from the rental units on the fire station property are accounted for here to
offset the expense of maintaining the units.
Transient Lodging Tax is transferred in for restoration and repairs of the Monteith House.
234

217: Capital Replacement
10: Finance
2014-2015 2015-2016 2016-2017 2016-2017 2017-2018 %Description Actual Actual Adopted Revised Adopted Change
REVENUESIntergovernmental Revenue 2,497 2,547 2,500 2,500 2,500 - %Miscellaneous Revenue 22,056 9,500 - - - - %Investment Income 591 862 1,000 1,000 1,000 - %Transfers In 12,000 12,400 12,400 12,400 12,800 3.23 % Dedicated Beginning Balance - - 16,300 16,300 28,600 75.46 % Beginning Balance 156,701 96,877 77,300 77,300 30,400 (60.67)% TOTAL REVENUES 193,845 122,186 109,500 109,500 75,300 (31.23)%
EXPENDITURESMaterials & Services 96,967 67,827 30,000 30,000 32,200 7.33 % Capital - - 79,500 79,500 43,100 (45.79)% TOTAL EXPENDITURES 96,967 67,827 109,500 109,500 75,300 (31.23)%
Prog 2002: GF Facilities Maintenance Projects Revenues less Expenditures 96,878 54,359 - - -
CITY OF ALBANY, OREGONPROG 2002: GF Facilities Maintenance Projects
235
PROGRAM NARRATIVE
CAPITAL REPLACEMENT FUND: IT EQUIPMENT REPLACEMENT (217-13-1031) Responsible Manager/Title: Jorge Salinas, Assistant City Manager/CIO
FUNCTIONS AND RESPONSIBILITIES The Information Technology Equipment
Replacement activity provides a means to replace computer equipment at the end of its useful life.
Annually monies are transferred from the various departments to the Information Technology Equipment Replacement activity based on the economic life, replacement cost, and estimated return on invested cash for each asset in the replacement program. Estimates of remaining useful life and replacement cost are updated each year by the contributing departments.
236

217: Capital Replacement
13: Information Technology
2014-2015 2015-2016 2016-2017 2016-2017 2017-2018 %Description Actual Actual Adopted Revised Adopted Change
REVENUESCharges for Services 187,900 482,720 300,000 300,000 384,100 28.03 % Miscellaneous Revenue 15,321 3,058 - - - - %Investment Income 6,385 12,546 10,000 10,000 15,000 50.00 % Beginning Balance 1,227,467 1,210,977 1,500,000 1,500,000 1,091,300 (27.25)% TOTAL REVENUES 1,437,073 1,709,301 1,810,000 1,810,000 1,490,400 (17.66)%
EXPENDITURESMaterials & Services 184,248 131,426 200,000 200,000 200,000 - %Capital 41,847 563,367 1,610,000 1,610,000 1,290,400 (19.85)% TOTAL EXPENDITURES 226,095 694,793 1,810,000 1,810,000 1,490,400 (17.66)%
Prog 1031: IT Equipment Replacement Revenues less Expenditures 1,210,978 1,014,508 - - -
CITY OF ALBANY, OREGONPROG 1031: IT Equipment Replacement
237

PROGRAM NARRATIVE
CAPITAL REPLACEMENT FUND: PUBLIC WORKS FACILITIES REPLACEMENT (217-50-2018) Responsible Manager/Title: Chris Bailey, Public Works Operations Director
FUNCTIONS AND RESPONSIBILITIES
This program funds future facilities replacement of Public Works.
Receive revenues from other Public Works fund budgets to fund future facilities replacement.
STRATEGIES/ACTIONS
Strategic Plan Theme Target Date Status Strategies/Actions
Budget Year 2016-2017
Effective Government 08/16 Completed Complete construction of Operations building addition.
06/17 Completed Receive revenues from water, sewer, and street fund budgets to fund future department facility replacement or new construction.
Budget Year 2017-2018
Effective Government 04/18 Replace roofs on Buildings C and D.
06/18 Receive revenues from water, sewer, stormwater, street, and transit fund budgets to fund future department facility replacement or new construction.
238

217: Capital Replacement
50: Public Works
2014-2015 2015-2016 2016-2017 2016-2017 2017-2018 %Description Actual Actual Adopted Revised Adopted Change
REVENUESCharges for Services 150,000 150,000 150,000 150,000 450,000 200.00 % Investment Income 5,323 5,844 300 300 1,000 233.33 % Beginning Balance 995,522 1,042,086 197,100 197,100 197,500 0.20 % TOTAL REVENUES 1,150,845 1,197,930 347,400 347,400 648,500 86.67 %
EXPENDITURESCapital 108,760 1,031,075 347,400 347,400 648,500 86.67 % TOTAL EXPENDITURES 108,760 1,031,075 347,400 347,400 648,500 86.67 %
Prog 2018: Facilities Replacement Revenues less Expenditures 1,042,085 166,855 - - -
CITY OF ALBANY, OREGONPROG 2018: Facilities Replacement
239

STREETS FUNDRESOURCE DETAIL
2017-18 % Change % of
2014-15 2015-16 Adopted Revised Adopted from FundResources Actual Actual Budget Budget Budget 2016-17 Budget___________________________________________________________________________________________________________________Transportation SDC: Principal 100,039$ 9,102$ 6,300$ 6,300$ 3,300$ (47.62%) 0.02%Transportation SDC: Interest 3,185 1,825 900 900 2,200 144.44% 0.02%Street IAF: Principal 1,682 898 1,600 1,600 100 (93.75%) - Street IAF: Interest 195 41 100 100 100 - - Street Connection Fees 53,992 12,030 15,000 15,000 7,500 (50.00%) 0.05%Transportation SDC: Revenues 1,105,306 891,653 567,400 567,400 581,500 2.49% 4.00%Public Facility Construction Permit 23,887 68,742 15,000 15,000 15,000 - 0.10%EPSC Permit Fees 43,215 56,440 - - - - - State Gasoline Tax 2,899,968 3,046,727 2,900,000 2,900,000 3,000,000 3.45% 20.63%Surface Transportation Program - 1,098,803 - - 980,000 - 6.74%Bonded Asmnts: Principal 113 - - - - - - Bonded Asmnts: Interest 498 - - - - - - Miscellaneous Revenue 2,186 68,935 1,000 1,000 951,000 95,000.00% 6.54%Interest 42,701 50,049 28,300 28,300 36,200 27.92% 0.25%___________________________________________________________________________________________________________________Total Current Resources 4,276,967 5,305,245 3,535,600 3,535,600 5,576,900 57.74% 38.35%___________________________________________________________________________________________________________________From Water Capital - - - - - - - From Capital Projects Fund 13,032 46,511 - - - - - From Grants Fund - 4,657 - - - - - From Debt Service Fund - - - - - - - Transfer In: Transient Room Tax 2,600 2,700 2,700 2,700 2,800 3.70% 0.02%From Sewer - ILFF Transfer 560,083 622,854 639,700 639,700 596,100 (6.82%) 4.10%From Water - ILFF Transfer 517,970 542,074 549,100 549,100 530,100 (3.46%) 3.65%From: Albany Transit 5,000 5,000 - - - - - From: Street Capital 20,000 20,000 20,000 20,000 20,000 - 0.14%From: Stormwater Capital - - - - 39,700 - 0.27%___________________________________________________________________________________________________________________Total Transfers In 1 118 685 1 243 796 1 211 500 1 211 500 1 188 700 (1 88%) 8 18%
……2016-17……
Total Transfers In 1,118,685 1,243,796 1,211,500 1,211,500 1,188,700 (1.88%) 8.18%___________________________________________________________________________________________________________________Beginning Balance 8,753,689 5,789,444 5,205,800 5,205,800 7,775,700 49.37% 53.47%___________________________________________________________________________________________________________________Total Resources 14,149,341$ 12,338,485$ 9,952,900$ 9,952,900$ 14,541,300$ 46.10% 100.00%______________________________________________________________________________________________________________________________________________________________________________________________________________________________________
STREET FUND RESOURCES BY SOURCECategory Totals and Percent of Budget
Budget Notes___________________________________________________________________________________________________________________
The following is a list of several acronyms used with respect to the Street Fund:EPSC - Erosion Prevention Sediment Control SDC - Systems Development ChargeIAF - Improvement Assurance FeeILFF - In-Lieu-of Franchise Fees
Licenses & fees $609,700 (4.19%)
Intergovernmental resources $3,980,000
(27.37%)
Other resources $951,000 (6.54%)
Investment earnings $36,200 (0.25%)
Transfers in $1,188,700 (8.18%)
Beginning balance $7,775,700 (53.47%)
240

STREETS FUNDREQUIREMENT/STAFFING SUMMARIES
2014-15 2015-16Program Requirements Actual Actual Adopted Revised Proposed Approved Adopted___________________________________________________________________________________________________________________Street Maintenance 1,688,567$ 1,753,211$ 1,932,700$ 1,932,700$ 1,952,400$ 1,952,400$ 1,952,400$ Street Administration 1,125,673 1,120,692 1,481,600 1,481,600 1,418,900 1,418,900 1,418,900 Street Capital & Restoration 2,951,349 1,890,259 3,019,300 3,019,300 6,233,700 6,233,700 6,233,700 N. Albany Frontage Fee Projects 408,190 (58,847) 146,400 146,400 133,600 133,600 133,600 Transportation SDC Imp Fee 1,878,131 1,489,046 2,728,900 2,728,900 3,919,000 3,919,000 3,919,000 Transportation SDC Reimb Fee 102,048 (15,984) 561,200 561,200 795,300 795,300 795,300 ADA Capital projects - - 82,800 82,800 88,400 88,400 88,400 ___________________________________________________________________________________________________________________Total Requirements 8,359,898$ 6,360,962$ 9,952,900$ 9,952,900$ 14,541,300$ 14,541,300$ 14,541,300$ ______________________________________________________________________________________________________________________________________________________________________________________________________________________________________
Requirements by Type___________________________________________________________________________________________________________________Personnel 784,335$ 835,695$ 797,600$ 797,600$ 832,800$ 832,800$ 832,800$ Materials & Services 2,160,165 2,210,235 2,469,600 2,469,600 2,367,700 2,367,700 2,367,700Capital 4,815,397 3,215,033 5,514,500 5,514,500 9,934,700 9,934,700 9,934,700Transfers Out 600,000 100,000 1,022,500 1,022,500 1,027,000 1,027,000 1,027,000Contingency - - 148,700 148,700 379,100 379,100 379,100___________________________________________________________________________________________________________________Total Requirements 8,359,897$ 6,360,963$ 9,952,900$ 9,952,900$ 14,541,300$ 14,541,300$ 14,541,300$ ______________________________________________________________________________________________________________________________________________________________________________________________________________________________________
Adopted Requirements Materials Transfers Adopted % of Fundby Program and Type Personnel & Services Capital Out Contingency Budget Budget___________________________________________________________________________________________________________________Street Maintenance 760,900$ 1,191,500$ -$ -$ -$ 1,952,400$ 13.43%Street Administration 71,900 887,900 - 80,000 379,100 1,418,900 9.76%Street Capital & Restoration - 280,000 5,743,100 210,600 - 6,233,700 42.86%N. Albany Frontage Fee Projects - - 104,600 29,000 - 133,600 0.92%Transportation SDC Imp Fee - 8,000 3,528,500 382,500 - 3,919,000 26.95%Transportation SDC Reimb Fee - 300 470,100 324,900 - 795,300 5.47%ADA Capital projects - - 88,400 - - 88,400 0.61%___________________________________________________________________________________________________________________Total Requirements 832,800$ 2,367,700$ 9,934,700$ 1,027,000$ 379,100$ 14,541,300$ 100.00%______________________________________________________________________________________________________________________________________________________________________________________________________________________________________Percent of Fund Budget 5.73% 16.28% 68.32% 7.06% 2.61% 100.00%______________________________________________________________________________________________________________________________________________________________________________________________________________
2014-15 2015-16Staffing Summary (FTE) Actual Actual Adopted Revised Proposed Approved Adopted___________________________________________________________________________________________________________________Street Maintenance 7.000 7.000 7.000 7.000 7.000 - - Street Administration 0.450 0.450 0.450 0.450 0.450 0.450 0.450 ___________________________________________________________________________________________________________________Total FTE 7.450 7.450 7.450 7.450 7.450 0.450 0.450 ______________________________________________________________________________________________________________________________________________________________________________________________________________________________________
……2016-17…… ……2017-18……
……2016-17…… ……2017-18……
241


STREETS FUNDOPERATION AND MAINTENANCE COMBINED BUDGET
……2016-17…… 2017-18 % Change % of
2014-15 2015-16 Adopted Revised Adopted from FundResources Actual Actual Budget Budget Budget 2016-17 Budget______________________________________________________________________________________________________________Public Facility Construction Permit 23,887$ 68,742$ 15,000$ 15,000$ 15,000$ - 0.44%EPSC Permit Fees 43,215 56,440 - - - - - State Gasoline Tax 2,570,968 3,046,727 2,900,000 2,900,000 3,000,000 3.45% 88.99%Miscellaneous Revenue 1,086 3,305 1,000 1,000 1,000 - 0.03%Interest 1,356 19,721 5,000 5,000 5,000 - 0.15%______________________________________________________________________________________________________________Total Current Resources 2,640,512 3,194,935 2,921,000 2,921,000 3,021,000 3.42% 89.61%______________________________________________________________________________________________________________Transfer In: Transient Room Tax 2,600 2,700 2,700 2,700 2,800 3.70% 0.08%From Sewer - ILFF Transfer 287,739 - 68,100 68,100 - (100.00%) - From Water - ILFF Transfer 247,762 - 68,100 68,100 - (100.00%) - ______________________________________________________________________________________________________________Total Transfers In 538,101 2,700 138,900 138,900 2,800 (97.98%) 0.08%______________________________________________________________________________________________________________Beginning Balance 246,159 405,203 354,400 354,400 347,500 (1.95%) 10.31%______________________________________________________________________________________________________________Total Resources 3,424,772$ 3,602,838$ 3,414,300$ 3,414,300$ 3,371,300$ (1.26%) 100.00%____________________________________________________________________________________________________________________________________________________________________________________________________________________________
Adopted Requirements Materials Transfers Adopted % of Fundby Program and Type Personnel & Services Out Contingency Budget Budget
Street Maintenance 760,900 1,191,500 - - 1,952,400$ 57.91%Street Administration 71,900 887,900 80,000 379,100 1,418,900 42.09%
T t l R i t 832 800$ 2 079 400$ 80 000$ 379 100$ 3 371 300$ 100 00%
Detailed below are the gasoline taxes, transfers in, and other resources used to support the following Street Fund operationand maintenance programs: Street Maintenance and Street Administration. The resource items listed below are included inthe Street Fund - Resource Detail presented on a previous page.
Total Requirements 832,800$ 2,079,400$ 80,000$ 379,100$ 3,371,300$ 100.00%
Percent of Budget 24.71% 61.68% 2.37% 11.24% 100.00%______________________________________________________________________________________________________________________________________________________________________________
RESOURCES USED FOR STREET FUND OPERATION AND MAINTENANCE PROGRAMSCategory Totals and Percent of Budget
Fees and permits $15,000 (0.44%)
State gasoline tax $3,000,000 (88.99%)
Other resources $6,000 (0.18%)
Transfers in $2,800 (0.07%)
Beginning balance $347,500 (10.31%)
242

STREETS FUNDCAPITAL PROJECTS COMBINED BUDGET
……2016-17…… 2017-18 % Change % of
2014-15 2015-16 Adopted Revised Adopted from FundResources Actual Actual Budget Budget Budget 2016-17 Budget________________________________________________________________________________________________________________Transportation SDC: Principal 100,039$ 9,102$ 6,300$ 6,300$ 3,300$ (47.62%) 0.03%Transportation SDC: Interest 3,185 1,825 900 900 2,200 144.44% 0.02%Street IAF: Principal 1,682 898 1,600 1,600 100 (93.75%) - Street IAF: Interest 195 41 100 100 100 - - Street Connection Fees 53,992 12,030 15,000 15,000 7,500 (50.00%) 0.07%Transportation SDC: Revenues 1,105,306 891,653 567,400 567,400 581,500 2.49% 5.22%State Gasoline Tax 329,000 - - - - - - Surface Transportation Program - 1,098,803 - - 980,000 - 8.80%Miscellaneous Revenue 1,100 65,630 - - 950,000 - 8.54%Interest 41,344 30,328 23,300 23,300 31,200 33.91% 0.28%From Sewer - ILFF Transfer 272,344 622,854 571,600 571,600 596,100 4.29% 5.36%From Water - ILFF Transfer 270,208 542,074 481,000 481,000 530,100 10.21% 4.76%________________________________________________________________________________________________________________Total Current Resources 2,178,395 3,275,238 1,667,200 1,667,200 3,682,100 120.86% 33.08%________________________________________________________________________________________________________________From: Albany Transit 5,000 5,000 - - - - - From: Street Capital 20,000 20,000 20,000 20,000 20,000 - 0.18%________________________________________________________________________________________________________________Total Transfers In 25,000 25,000 20,000 20,000 20,000 - 0.18%________________________________________________________________________________________________________________Beginning Balance 8,507,530 5,384,241 4,851,400 4,851,400 7,428,200 53.11% 66.74%________________________________________________________________________________________________________________Total Resources 10,710,925$ 8,684,479$ 6,538,600$ 6,538,600$ 11,130,300$ 70.22% 100.00%________________________________________________________________________________________________________________________________________________________________________________________________________________________________
Adopted Requirements Materials Transfers Adopted % of Fundb P d T & S i C it l O t B d t B d t
Detailed below are the in-lieu-of franchise fees, development fees, state support, and other resources used to fund thefollowing Street Fund capital programs: Street Capital & Restoration, North Albany Frontage Fee Projects, and TransportationSDC Projects.
by Program and Type & Services Capital Out Budget Budget________________________________________________________________________________________________________________Street Capital & Restoration 280,000$ 5,743,100$ 210,600$ 6,233,700$ 55.81%N. Albany Frontage Fee Projects - 104,600 29,000 133,600 1.20%Transportation SDC Imp Fee 8,000 3,528,500 382,500 3,919,000 35.08%Transportation SDC Reimb Fee 300 470,100 324,900 795,300 7.12%ADA Capital projects - 88,400 - 88,400 0.79%________________________________________________________________________________________________________________Total Requirements 288,300$ 9,934,700$ 947,000$ 11,170,000$ 100.00%________________________________________________________________________________________________________________________________________________________________________________________________________________________________Percent of Budget 2.58% 88.94% 8.48% 100.00%____________________________________________________________________________________________________________________________________________________________________________________________________________
STREET CAPITAL PROJECT RESOURCESFees and permits 594,700$ 5.34%Other resources 2,107,400 18.93%Transfers in 20,000 0.18%Beginning balance 7,428,200 66.74%______________________________________________________Total Resources 11,130,300$ 100.00%____________________________________________________________________________________________________________
Fees and permits
$594,700 (5.34%)
Other resources
$2,107,400 (18.93%)
Transfers in $20,000 (0.18%)
Beginning balance
$7,428,200 (66.740%)
243

STREET FUND
NorthAlbany Trans- Trans- Trans-
Street Frontage portation portation ADACapital & Fee SDC SDC Capital
Project Description Totals Restoration Projects Imp Fee Reimb Fee Projects_____________________________________________________________________________________________________________Sidewalk Infill Program 15,000 15,000 - - - - ST-13-05 Corvallis Albany Path 304,500 - - 304,500 - - ST-16-01 Transit Stop Ped Imp (Ph 2) 200,000 68,000 - 132,000 - - ST-17-01 Oak Street Rehab 34th-38th 612,000 612,000 - - - - ST-17-02 Grand Prairie Park CW/Waverly 40,000 40,000 - - - - ST-18-01 Hill St, Queen to 24th 2,700,000 2,298,300 - 401,700 - - ST-18-02 Santa Maria Street Imp 1,450,000 950,000 - 500,000 - - _____________________________________________________________________________________________________________Project Totals 5,321,500 3,983,300 - 1,338,200 - - _____________________________________________________________________________________________________________
Reserve: Street Connection Fees 163,900 163,900 - - - - Reserve: Capital Projects 3,528,800 1,362,600 104,600 1,590,300 470,100 1,200 Reserve: Waverly RH Land Mod Dep - WM 203,300 203,300 - - - - Reserve: Albany Transit 15,000 - - - - 15,000 Reserve: Street Capital 72,200 - - - - 72,200 Reserve: ODOT Safety Grant Match 30,000 30,000 - - - - Reserve: Lochner Road Imp 400,000 - - 400,000 - - Reserve: ODOT I-5 EA 200,000 - - 200,000 - - _____________________________________________________________________________________________________________Total Reserves 4,613,200 1,759,800 104,600 2,190,300 470,100 88,400 _____________________________________________________________________________________________________________Grand Totals 9,934,700$ 5,743,100$ 104,600$ 3,528,500$ 470,100$ 88,400$ __________________________________________________________________________________________________________________________________________________________________________________________________________________________
SUMMARY OF CAPITAL REQUIREMENTS AND CAPITAL RESERVES - FISCAL YEAR 2017-18
244

STREET FUNDSTREET FUND RESOURCES - TEN FISCAL YEARS*
Inter- StateFranchise Licenses governmental Gasoline Other Transfers Beginning Total
June 30, Fees & Fees Resources Taxes Resources In Balance Resources_______________________________________________________________________________________________________2009 942,711$ 405,953$ 878,258$ 1,857,308$ 270,478$ 519,474$ 9,052,861$ 13,927,043$ 2010 1,016,466 403,227 4,836 2,024,426 155,678 381,300 8,363,513 12,349,446 2011 848,969 1,086,992 - 2,365,624 75,157 1,753,285 8,327,379 14,457,406 2012 891,255 415,283 70,693 2,745,670 272,210 892,855 9,969,701 15,257,667 2013 932,792 565,435 885,440 2,764,402 59,239 934,992 6,874,827 13,017,127 2014 1,000,687 646,524 2,135,531 2,913,483 61,838 619,640 6,860,709 14,238,412 2015 1,078,053 1,331,502 - 2,899,968 45,497 40,632 8,753,689 14,149,341 2016 1,164,928 1,040,730 1,098,803 3,046,727 118,984 78,868 5,789,444 12,338,484 2017 1,188,800 606,300 - 2,900,000 29,300 22,700 5,205,800 9,952,900 2018 1,126,200 609,700 980,000 3,000,000 987,200 62,500 7,775,700 14,541,300
* Actual revenues for Fiscal Years 2009 through 2016. Budgeted resources for Fiscal Years 2017 and 2018.
STREET FUND RESOURCES - PERCENT OF TOTAL RESOURCES
Inter- StateFranchise Licenses governmental Gasoline Other Transfers Beginning Total
June 30, Fees & Fees Resources Taxes Resources In Balance Resources_______________________________________________________________________________________________________2009 6.77% 2.91% 6.31% 13.34% 1.94% 3.73% 65.00% 100.00%2010 8.23% 3.27% 0.04% 16.39% 1.26% 3.09% 67.72% 100.00%2011 5.87% 7.52% - 16.36% 0.52% 12.13% 57.60% 100.00%2012 5.85% 2.72% 0.46% 18.00% 1.78% 5.85% 65.34% 100.00%2013 7.17% 4.34% 6.80% 21.24% 0.46% 7.18% 52.81% 100.00%2014 7 04% 4 54% 15 00% 20 46% 0 43% 4 35% 48 18% 100 00%2014 7.04% 4.54% 15.00% 20.46% 0.43% 4.35% 48.18% 100.00%2015 7.61% 9.41% - 20.50% 0.32% 0.29% 61.87% 100.00%2016 9.45% 8.43% 8.91% 24.69% 0.96% 0.64% 46.92% 100.00%2017 11.95% 6.09% - 29.14% 0.29% 0.23% 52.30% 100.00%2018 7.75% 4.19% 6.74% 20.63% 6.79% 0.43% 53.47% 100.00%
STATE GAS TAXES, LICENSES & FEES, AND FRANCHISE FEESTEN FISCAL YEARS
$-
$500,000
$1,000,000
$1,500,000
$2,000,000
$2,500,000
$3,000,000
$3,500,000
2009 2010 2011 2012 2013 2014 2015 2016 2017 2018
Franchise Fees Licenses & Fees State Gasoline Taxes
245

STREET FUNDSTREET FUND RESOURCES PER CAPITA - TEN FISCAL YEARS 1
State Gasoline Tax Franchise Fees Current Resources2
Annual Per Annual Per Annual PerJune 30, Population Amount Capita Amount Capita Amount Capita_____________________________________________________________________________________________________
2009 48,770 1,857,308$ 38.08$ 942,711$ 19.33$ 4,874,182$ 99.94$ 2010 49,165 2,024,426 41.18 1,016,466 20.67 3,985,934 81.07 2011 49,530 2,365,624 47.76 848,969 17.14 6,130,027 123.76 2012 50,325 2,745,670 54.56 891,255 17.71 5,287,965 105.08 2013 50,520 2,764,402 54.72 932,792 18.46 6,142,300 121.58 2014 50,710 2,913,483 57.45 1,000,687 19.73 7,377,703 145.49 2015 50,720 2,764,402 54.50 1,078,053 21.25 5,395,652 106.38 2016 51,270 2,913,483 56.83 1,164,928 22.72 6,549,040 127.74 2017 51,670 2,800,000 54.19 1,188,800 23.01 4,747,100 91.87 2018 52,540 3,000,000 57.10 1,126,200 21.44 6,765,600 128.77
(1) Actual revenues for Fiscal Years 2009 through 2016. Budgeted resources for Fiscal Years 2017 and 2018. (2) Current Resources equals Total Resources less Beginning Balance.
PER CAPITA STATE GASOLINE TAX, FRANCHISE FEES,AND CURRENT RESOURCES
TEN FISCAL YEARS
$140
$160
$-
$20
$40
$60
$80
$100
$120
$140
2009 2010 2011 2012 2013 2014 2015 2016 2017 2018
State Gasoline Taxes Franchise Fees Total Resources
246

PROGRAM NARRATIVE
STREET FUND: STREET MAINTENANCE (250-50-2602) Responsible Manager/Title: Jon Goldman, Utility Superintendent - Transportation
FUNCTIONS AND RESPONSIBILITIES
The primary function of this activity is to maintain the transportation system facilities.
Pavement management and street restoration responsibilities include sweeping, sanding, base repair, crack sealing, pothole patching, chip-sealing streets, overlay projects, and bridge maintenance.
Repair tree-damaged sidewalks and gutters on an as-needed basis.
Right-of-way maintenance responsibilities include barricades, property clean-up, and vegetation maintenance.
Transportation management responsibilities include pavement markings, traffic sign maintenance, quarterly streetlight inspections, and quarterly traffic signal inspections and maintenance.
Perform yearly street condition rating for one-quarter of the City streets and annually update traffic sign inventory program.
STRATEGIES/ACTIONS
Strategic Plan Theme Target Date Status Strategies/Actions
Budget Year 2016-2017
Effective Government 06/17 Ongoing Meet federally mandated retro-reflectivity standards for traffic signs.
Budget Year 2017-2018
Effective Government 06/18 Assume utility patch work for Water Distribution.
PERFORMANCE MEASURES AND WORKLOAD INDICATORS
2014-2015 2015-2016 2016-2017 2017-2018 Number of miles of improved streets. 194.5 196.1 196.1 196.1 Number of customer service work orders. 386 391 450 450 Number of City traffic signals. 19 19 21 22 Percentage of traffic signals inspected quarterly. 100% 100% 100% 100% Miles of painted pavement marking. 61 61 61 61 Percentage of pavement marking annually painted.
100% 100% 100% 100%
Number of traffic signs repaired annually. 329 467 300 300
STAFFING SUMMARY
Budgeted FTEs 7.00 7.00 7.00 6.65
247

250: Streets
50: Public Works
2014-2015 2015-2016 2016-2017 2016-2017 2017-2018 %Description Actual Actual Adopted Revised Adopted Change
EXPENDITURESPersonnel Services 659,557 698,126 727,700 727,700 760,900 4.56 % Materials & Services 1,010,372 1,055,085 1,205,000 1,205,000 1,191,500 (1.12)% Capital 18,637 - - - - - %TOTAL EXPENDITURES 1,688,566 1,753,211 1,932,700 1,932,700 1,952,400 1.02 %
CITY OF ALBANY, OREGONPROG 2602: Street Maintenance
248

PROGRAM NARRATIVE
STREET FUND: STREET ADMINISTRATION (250-50-2604) Responsible Manager/Title: Chris Bailey, Public Works Operations Director
Jeff Blaine, P.E., Public Works Engineering and Community Development Director
FUNCTIONS AND RESPONSIBILITIES This program provides funding for a portion
of the Transportation Superintendent position, PW Internal Services Fund, which includes charges for Public Works Administration, Operations Administration, and PW Engineering Services.
Transfers funds to other City programs such as Urban Forestry.
Maintains the contingency for the Street Fund.
STRATEGIES/ACTIONS
Strategic Plan Theme Target Date Status Strategies/Actions
Budget Year 2016-2017
Effective Government 06/17 Ongoing Participate in the multi-year regional transportation and transit planning efforts required by the Albany Area Metropolitan Planning Organization (AAMPO.)
Budget Year 2017-2018
Effective Government
Great Neighborhoods
12/17 Complete Council discussions on local street maintenance funding options.
PERFORMANCE MEASURES AND WORKLOAD INDICATORS
2014-2015 2015-2016 2016-2017 2017-2018 Percentage of collector and arterial streets in satisfactory or better condition.
87% 88% 84% 84%
STAFFING SUMMARY
Budgeted FTEs 0.45 0.45 0.45 0.45
249

250: Streets
50: Public Works
2014-2015 2015-2016 2016-2017 2016-2017 2017-2018 %Description Actual Actual Adopted Revised Adopted Change
EXPENDITURESPersonnel Services 63,824 65,626 69,900 69,900 71,900 2.86 % Materials & Services 981,849 975,066 976,300 976,300 887,900 (9.05)% Transfers Out 80,000 80,000 286,700 286,700 80,000 (72.10)% Contingencies - - 148,700 148,700 379,100 154.94 % TOTAL EXPENDITURES 1,125,673 1,120,692 1,481,600 1,481,600 1,418,900 (4.23)%
CITY OF ALBANY, OREGONPROG 2604: Street Administration
250

PROGRAM NARRATIVE
STREET FUND: STREET CAPITAL & RESTORATION (250-50-2700) Responsible Manager/Title: Staci Belcastro, P.E., City Engineer
FUNCTIONS AND RESPONSIBILITIES This activity receives funds from franchise fees,
Surface Transportation Program (STP) funds, grants, and interest income.
Provides local funding match for bicycle and pedestrian improvement grants that become available.
This program provides funding for transportation-related capital construction projects including pavement restoration, bridge repair, bicycle and pedestrian improvements, and grant match.
STRATEGIES/ACTIONS
Strategic Plan Theme Target Date Status Strategies/Actions
Budget Year 2016-2017
Great Neighborhoods 09/16 Completed Construct ST-14-03, Pedestrian Crossing Improvements.
09/16 In Progress Construct ST-16-01, Transit Stop Pedestrian Improvements (Phase 2).
06/17 In Progress Construct ST-17-01, Oak Street Rehabilitation: 34th to 38th Avenue.
Budget Year 2017-2018
Great Neighborhoods 09/17 Construct ST-16-01, Transit Stop Pedestrian Improvements (Phase 2).
09/17 Construct ST-17-01, Oak Street Rehabilitation: 34th to 38th Avenue.
09/18 Construct ST-18-01, Hill Street: Queen Avenue to 24th Avenue.
09/18 Construct ST-18-02, Santa Maria Street Improvements.
251

250: Streets
50: Public Works
2014-2015 2015-2016 2016-2017 2016-2017 2017-2018 %Description Actual Actual Adopted Revised Adopted Change
REVENUESLicenses and Fees 53,992 12,030 15,000 15,000 7,500 (50.00)% Intergovernmental Revenue 329,000 1,098,803 - - 980,000 - %Miscellaneous Revenue 1,100 65,630 - - 950,000 - %Investment Income 16,638 3,830 9,200 9,200 9,700 5.43 % Transfers In 555,584 1,216,096 1,052,600 1,052,600 1,165,900 10.76 % Beginning Balance 3,734,628 1,739,592 1,942,500 1,942,500 3,120,600 60.65 % TOTAL REVENUES 4,690,942 4,135,981 3,019,300 3,019,300 6,233,700 106.46 %
EXPENDITURESMaterials & Services 18,107 62,497 280,000 280,000 280,000 - %Capital 2,413,242 1,807,762 2,634,300 2,634,300 5,743,100 118.01 % Transfers Out 520,000 20,000 105,000 105,000 210,600 100.57 % TOTAL EXPENDITURES 2,951,349 1,890,259 3,019,300 3,019,300 6,233,700 106.46 %
Prog 2700: Street Capital & Restoration Revenues less Expenditures 1,739,593 2,245,722 - - -
CITY OF ALBANY, OREGONPROG 2700: Street Capital & Restoration
252
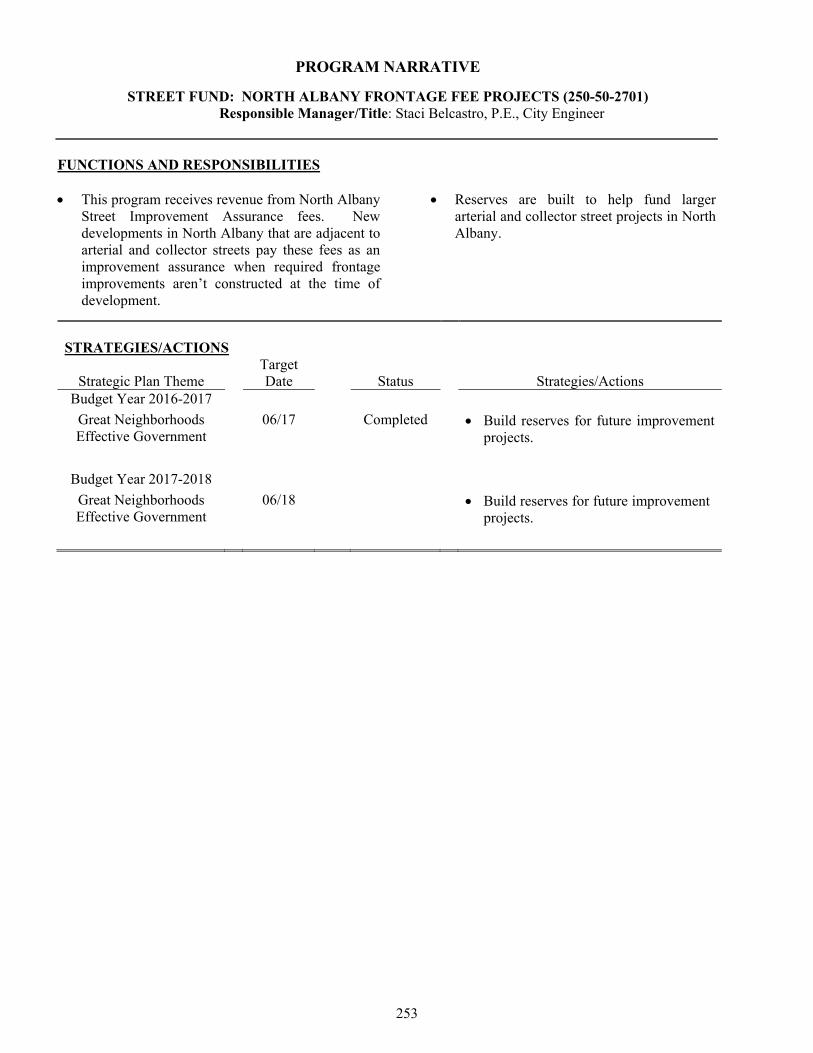
PROGRAM NARRATIVE
STREET FUND: NORTH ALBANY FRONTAGE FEE PROJECTS (250-50-2701) Responsible Manager/Title: Staci Belcastro, P.E., City Engineer
FUNCTIONS AND RESPONSIBILITIES This program receives revenue from North Albany
Street Improvement Assurance fees. New developments in North Albany that are adjacent to arterial and collector streets pay these fees as an improvement assurance when required frontage improvements aren’t constructed at the time of development.
Reserves are built to help fund larger arterial and collector street projects in North Albany.
STRATEGIES/ACTIONS
Strategic Plan Theme Target Date Status Strategies/Actions
Budget Year 2016-2017
Great Neighborhoods Effective Government
06/17 Completed Build reserves for future improvement projects.
Budget Year 2017-2018
Great Neighborhoods Effective Government
06/18 Build reserves for future improvement projects.
253

250: Streets
50: Public Works
2014-2015 2015-2016 2016-2017 2016-2017 2017-2018 %Description Actual Actual Adopted Revised Adopted Change
REVENUESLicenses and Fees 1,877 939 1,700 1,700 200 (88.24)% Investment Income 2,186 816 400 400 600 50.00 % Beginning Balance 487,687 83,560 144,300 144,300 132,800 (7.97)% TOTAL REVENUES 491,750 85,315 146,400 146,400 133,600 (8.74)%
EXPENDITURESCapital 408,190 (58,847) 117,400 117,400 104,600 (10.90)% Transfers Out - - 29,000 29,000 29,000 - %TOTAL EXPENDITURES 408,190 (58,847) 146,400 146,400 133,600 (8.74)%
Prog 2701: N. Albany Frontage Fee Projects Revenues less Expenditures 83,560 144,162 - - -
CITY OF ALBANY, OREGONPROG 2701: N. Albany Frontage Fee Projects
254

PROGRAM NARRATIVE
STREET FUND: TRANSPORTATION SDC IMPROVEMENT FEE PROJECTS (250-50-2703) Responsible Manager/Title: Staci Belcastro, P.E., City Engineer
FUNCTIONS AND RESPONSIBILITIES This program is dedicated to funding
eligible, capacity-increasing projects that are a direct result of new growth and development. Revenues are received from Transportation Systems Development Charges (SDC).
The current Transportation Systems Development Charge (effective July 2016) is $3,634 for a single-family residence. This program receives $3,101 of the residential fee.
In 1989 legislation was adopted in Oregon requiring justification and separate accounting of revenues and expenditures for all SDCs effective July 1, 1991. This budget was created in order to comply with that legislation.
STRATEGIES/ACTIONS
Strategic Plan Theme Target Date Status Strategies/Actions
Budget Year 2016-2017
Great Neighborhoods 09/16 In Progress Construct ST-16-01, Transit Stop Pedestrian Improvements (Phase 2).
Budget Year 2017-2018
Great Neighborhoods 09/17 Construct ST-16-01, Transit Stop Pedestrian Improvements (Phase 2).
09/18 Construct ST-18-01, Hill Street: Queen Avenue to 24th Avenue.
09/18 Construct ST-18-02, Santa Maria Street Improvements.
255

250: Streets
50: Public Works
2014-2015 2015-2016 2016-2017 2016-2017 2017-2018 %Description Actual Actual Adopted Revised Adopted Change
REVENUESLicenses and Fees 988,558 758,237 490,900 490,900 501,200 2.10 % Investment Income 20,617 21,849 11,100 11,100 17,000 53.15 % Beginning Balance 4,032,565 3,163,609 2,226,900 2,226,900 3,400,800 52.71 % TOTAL REVENUES 5,041,740 3,943,695 2,728,900 2,728,900 3,919,000 43.61 %
EXPENDITURESMaterials & Services 4,851 6,944 8,000 8,000 8,000 - %Capital 1,873,280 1,482,102 2,338,400 2,338,400 3,528,500 50.89 % Transfers Out - - 382,500 382,500 382,500 - %TOTAL EXPENDITURES 1,878,131 1,489,046 2,728,900 2,728,900 3,919,000 43.61 %
Prog 2703: Transportation SDC Imp Fee Revenues less Expenditures 3,163,609 2,454,649 - - -
CITY OF ALBANY, OREGONPROG 2703: Transportation SDC Imp Fee
256

PROGRAM NARRATIVE
STREET FUND: TRANSPORTATION SDC REIMBURSEMENT FEE PROJECTS (250-50-2704) Responsible Manager/Title: Staci Belcastro, P.E., City Engineer
FUNCTIONS AND RESPONSIBILITIES Revenues are received from System
Development Charges (SDCs). These revenues reimburse the City for past investments in capacity-increasing projects identified in the City’s adopted transportation SDC methodology.
Funding provided through this program is used to complete capital projects within the transportation system.
The current Transportation Systems Development Charge (effective July 2016) is $3,634 for a single-family residence. This program receives $533 of the fee.
In 1989 legislation was adopted in Oregon requiring justification and separate accounting of revenues and expenditures for all SDCs effective July 1, 1991. This budget was created in order to comply with that legislation.
STRATEGIES/ACTIONS
Strategic Plan Theme Target Date Status Strategies/Actions
Budget Year 2016-2017
Effective Government 06/17 Completed Build reserves for future projects.
Budget Year 2017-2018
Effective Government 06/18 Build reserves for future projects.
257

250: Streets
50: Public Works
2014-2015 2015-2016 2016-2017 2016-2017 2017-2018 %Description Actual Actual Adopted Revised Adopted Change
REVENUESLicenses and Fees 219,973 144,343 83,700 83,700 85,800 2.51 % Investment Income 1,772 3,445 2,300 2,300 3,500 52.17 % Beginning Balance 240,444 360,141 475,200 475,200 706,000 48.57 % TOTAL REVENUES 462,189 507,929 561,200 561,200 795,300 41.71 %
EXPENDITURESMaterials & Services - - 300 300 300 - %Capital 102,048 (15,984) 341,600 341,600 470,100 37.62 % Transfers Out - - 219,300 219,300 324,900 48.15 % TOTAL EXPENDITURES 102,048 (15,984) 561,200 561,200 795,300 41.71 %
Prog 2704: Transportation SDC Reimb Fee Revenues less Expenditures 360,141 523,913 - - -
CITY OF ALBANY, OREGONPROG 2704: Transportation SDC Reimb Fee
258

PROGRAM NARRATIVE
STREET FUND: ADA CAPITAL PROJECTS (250-50-2705) Responsible Manager/Title: Staci Belcastro, P.E., City Engineer
FUNCTIONS AND RESPONSIBILITIES This program receives revenues from a variety of
sources including the Albany Transit System and Street Capital programs.
Build and maintain adequate reserves to fund future Americans with Disabilities Act (ADA) required capital projects.
STRATEGIES/ACTIONS
Strategic Plan Theme Target Date Status Strategies/Actions
Budget Year 2016-2017 Safe City 06/17 Completed Build reserves to fund future ADA capital
projects. Budget Year 2017-2018
Safe City 06/18 Build reserves to fund future ADA capital projects.
259

250: Streets
50: Public Works
2014-2015 2015-2016 2016-2017 2016-2017 2017-2018 %Description Actual Actual Adopted Revised Adopted Change
REVENUESInvestment Income 132 387 300 300 400 33.33 % Transfers In 25,000 25,000 20,000 20,000 20,000 - %Beginning Balance 12,208 37,339 62,500 62,500 68,000 8.80 % TOTAL REVENUES 37,340 62,726 82,800 82,800 88,400 6.76 %
EXPENDITURESCapital - - 82,800 82,800 88,400 6.76 % TOTAL EXPENDITURES - - 82,800 82,800 88,400 6.76 %
Prog 2705: ADA Capital projects Revenues less Expenditures 37,340 62,726 - - -
CITY OF ALBANY, OREGONPROG 2705: ADA Capital projects
260


DEBT SERVICE FUNDS


DEBT SERVICE FUNDS
PROGRAM FUNCTIONS, REVENUE TRENDS, AND ASSUMPTIONS
DEBT SERVICE FUND
2015 Public Safety Facilities GO Bonds
RESOURCES REQUIREMENTS
Property Taxes 1,071,500$ Materials & Services 1,700$ Charges for Service 675,000 Debt Service 2,223,600Investment Earnings 3,100Transfers In 180,400Beginning Balance 106,700Reserved beginning balance 188,600
Total Resources 2,225,300$ Total Requirements 2,225,300$
In May of 2015, voters approved an $18 million General Obligation Bond issue to finance the building of new police and firestations. The bonds were sold on August 5th, 2015. The debt service requirement for 2017-18 is $1,383,300.
Debt Service funds accumulate resources and account for the payment of general long-term debt principal and interest. BecauseOregon Local Budget Law requires that general obligation debt be accounted for in a separate fund from revenue obligation debt,the City has two Debt Service funds.
These limited tax bonds were used to finance a portion of the estimated unfunded actuarial liability with the Oregon PublicEmployees Retirement System (PERS). Each City program with personnel costs is assessed a fee proportionate to its PERS-eligible payroll to pay for the annual debt service requirements. The bonds will be retired in 2027-28. The debt servicerequirement for 2017-18 is $675,300.
Issued in December 2004, these bonds provide funding for the Aquatic Center project and the defeasance of the 1994 City HallCertificates of Participation. The General Fund share of the debt retired in Fiscal Year 2013-14. The Parks & Recreationrequirement for 2017-18 is $179,600 with the final payment in Fiscal Year 2019-20.
Separate programs are maintained in these funds to account for each of the City's general long-term debt issuances.
2002 Limited Tax Pension Bonds
2004 Revenue Obligations
261

DEBT SERVICE FUNDRESOURCE DETAIL
2017-18 % Change % of
2014-15 2015-16 Adopted Revised Adopted from FundRESOURCES Actual Actual Budget Budget Budget 2016-17 Budget__________________________________________________________________________________________________________Property Taxes - Current 1,183,124$ 976,000$ -$ -$ -$ - - Property Taxes - Delinquent 53,880 45,280 - - - - - Departmental Charges 454,000 615,300 645,900 645,900 675,000 4.51% 64.52%Interest 4,632 26,596 1,900 1,900 2,200 15.79% 0.21%__________________________________________________________________________________________________________Total Current Resources 1,695,636 1,663,176 647,800 647,800 677,200 4.54% 64.73%__________________________________________________________________________________________________________From Parks Fund 180,100 180,304 183,300 183,300 180,400 (1.58%) 17.24%__________________________________________________________________________________________________________Total Transfers In 180,100 180,304 183,300 183,300 180,400 (1.58%) 17.24%__________________________________________________________________________________________________________Beginning Balance 439,831 161,727 - - - - - Reserved Beginning Balance - - 185,000 185,000 188,600 1.95% 18.03%__________________________________________________________________________________________________________Total Resources 2,315,567$ 2,005,207$ 1,016,100$ 1,016,100$ 1,046,200$ 2.96% 100.00%____________________________________________________________________________________________________________________________________________________________________________________________________________________
DEBT SERVICE FUND RESOURCES BY SOURCECategory Totals and Percent of Budget
……2016-17……
Departmental charges $675,000 (64.52%) Investment earnings
$2,200 (0.21%) , ( )
Transfers in $180,400 (17.24%)
Reserved beginning balance $188,600
(18.03%)
262

DEBT SERVICE FUNDREQUIREMENT SUMMARIES
2014-15 2015-16Program Requirements Actual Actual Adopted Revised Proposed Approved Adopted_______________________________________________________________________________________________________________2002 LTD Tax Pension Bonds 585,236 615,236 832,800 832,800 865,800 865,800 865,800 2004 Revenue Obligations 180,204 180,304 183,300 183,300 180,400 180,400 180,400 2007 GO Refunding Bonds 1,388,400 - - - - - - 2015 Public Safety Facilities Bonds - 933,481 - - - - - _______________________________________________________________________________________________________________Total Requirements 2,153,840$ 1,729,021$ 1,016,100$ 1,016,100$ 1,046,200$ 1,046,200$ 1,046,200$ ______________________________________________________________________________________________________________________________________________________________________________________________________________________________
2014-15 2015-16Requirements by Type Actual Actual Adopted Revised Proposed Approved Adopted_______________________________________________________________________________________________________________Materials & Services 750$ 1,600$ 1,400$ 1,400$ 800$ 800$ 800$ Debt Service 2,153,090 1,727,420 1,014,700 1,014,700 1,045,400 1,045,400 1,045,400 _______________________________________________________________________________________________________________Total Requirements 2,153,840$ 1,729,020$ 1,016,100$ 1,016,100$ 1,046,200$ 1,046,200$ 1,046,200$ ______________________________________________________________________________________________________________________________________________________________________________________________________________________________
Adopted Requirements Materials Debt Adopted % of Fundby Program and Type & Services Service Budget Budget_______________________________________________________________________________________________________________2002 LTD Tax Pension Bonds -$ 865,800$ 865,800$ 82.76%2004 Revenue Obligations 800 179,600 180,400 17.24%_______________________________________________________________________________________________________________Total Requirements 800$ 1,045,400$ 1,046,200$ 100.00%______________________________________________________________________________________________________________________________________________________________________________________________________________________________Percent of Fund Budget 0.08% 99.92% 100.00%________________________________________________________________________________________________________________________________________________________________________________________________________
Adopted Budget Final Debt AdoptedDetail of Debt Service Maturity Principal Interest Reserve Budget_______________________________________________________________________________________________________________2002 LTD Tax Pension Bonds 06/01/2028 111,200$ 564,100$ 190,500$ 865,800 2004 Revenue Obligations 01/01/2020 160,000 19,600 - 179,600 _______________________________________________________________________________________________________________Total Requirements 271,200$ 583,700$ 190,500$ 1,045,400$ ______________________________________________________________________________________________________________________________________________________________________________________________________________________________
……2016-17…… ……2017-18……
……2016-17…… ……2017-18……
263

PROGRAM NARRATIVE
DEBT SERVICE FUND: 2002 LIMITED TAX PENSION BONDS (301-10-1021) Responsible Manager/Title: Jeanna Yeager, Accounting Supervisor
FUNCTIONS AND RESPONSIBILITIES
This program provides for payment of the $6,851,826 Limited Tax Pension Obligations, Series 2002.
The bonds are secured by the full faith and credit of the City.
The bonds, dated March 15, 2002, were issued
as the Limited Tax Pension Deferred Interest Obligations, Series 2002A, and the Limited Tax Pension Obligations, Series 2002B. Interest rates range from 2.00% to 7.41% with a true interest cost (TIC) of 7.061361%. Interest paid is subject to federal income tax.
Interest on the 2002A Obligations will be paid
only at maturity, and will be compounded semiannually as of June 1 and December 1. Interest on the 2002B Obligations, issued as current interest obligations, is payable on June 1, 2002, and semiannually thereafter until June 1, 2028.
The 2002A Obligations are not subject to prepayment prior to their stated maturities. The 2002B Obligations maturing on June 1, 2025, are subject to prepayment prior to their stated maturities.
The bonds are insured by American
Municipal Bonds Assurance Corporation (AMBAC) and are rated “Aaa” by Moody’s Investors Service.
The Bond Registrar and Paying Agent is
Wells Fargo Bank Northwest, National Association, Portland, Oregon. The Bond Counsel is Preston Gates & Ellis LLP, Portland, Oregon. The Financial Advisor is Piper Jaffray, Portland, Oregon.
On December 1, 2010, a prepayment of
callable bonds in the amount of $770,000 was made from litigation settlement proceeds.
MATURITY SCHEDULE
Fiscal Year Principal Interest Total Interest Rate
2017-2018 $ 111,140 $ 564,098 $ 675,238 7.31%2018-2019 111,257 593,980 705,237 7.36%2019-2020 159,604 580,634 740,238 7.41%
2020-2021 460,000 315,785 775,785 6.85%
2021-2022 530,000 284,275 814,275 6.85%
2022-2023 600,000 247,970 847,970 6.85%
2023-2024 685,000 206,870 891,870 6.85%
2024-2028 2,335,000 454,840 2,789,840 6.85%
Totals $ 4,992,001 $ 3,248,452 $ 8,240,453
264

301: Debt Service
10: Finance
2014-2015 2015-2016 2016-2017 2016-2017 2017-2018 %Description Actual Actual Adopted Revised Adopted Change
REVENUESCharges for Services 454,000 615,300 645,900 645,900 675,000 4.51 % Investment Income 2,492 2,175 1,900 1,900 2,200 15.79 % Dedicated Beginning Balance - - 185,000 185,000 188,600 1.95 % TOTAL REVENUES 768,889 801,128 832,800 832,800 865,800 3.96 %
EXPENDITURESMaterials & Services - - 600 600 - (100.00)% Debt Service 585,236 615,236 832,200 832,200 865,800 4.04 % TOTAL EXPENDITURES 585,236 615,236 832,800 832,800 865,800 3.96 %
Prog 1021: 2002 LTD Tax Pension Bonds Revenues less Expenditures 183,653 185,892 - - -
CITY OF ALBANY, OREGONPROG 1021: 2002 LTD Tax Pension Bonds
265

PROGRAM NARRATIVE
DEBT SERVICE FUND: 2004 REVENUE OBLIGATIONS (301-10-1022) Responsible Manager/Title: Jeanna Yeager, Accounting Supervisor
FUNCTIONS AND RESPONSIBILITIES
This activity provides for payment of the principal and interest on the 2004 Revenue Obligations used for the Aquatic Center project and the defeasance of the City’s Certificates of Participation, Series 1994.
The bonds were dated December 30, 2004,
and accrue interest from that date until maturity or earlier redemption, payable semiannually on July 1 and January 1 of each fiscal year.
The bond payments are secured by and
payable from any unobligated, non-property tax revenues legally available to the City. The payments are currently made only from the Parks and Recreation fund, as the General Fund obligation matured in January 2014.
The original amount of the bond issue was $3,720,000.
The bonds are rated by Moody’s Investors Service as “Aaa.”
The Bond Registrar and Paying Agent is
Bank of New York Trust Co., N.A; Los Angeles, California. The Bond Counsel is Orrick, Herrington & Sutcliffe, LLP, Portland, Oregon. The Underwriter is Piper Jaffray.
MATURITY SCHEDULE
Fiscal Year Principal Interest Total
2017-2018 $160,000 $19,553 $179,553
2018-2019 165,000 13,394 178,394
2019-2020 175,000 7,000 182,000
Totals $500,000 $39,947 $539,947
266

301: Debt Service
10: Finance
2014-2015 2015-2016 2016-2017 2016-2017 2017-2018 %Description Actual Actual Adopted Revised Adopted Change
REVENUESInvestment Income (114) 46 - - - - %Transfers In 180,100 180,304 183,300 183,300 180,400 (1.58)% Beginning Balance 172 (46) - - - - %TOTAL REVENUES 180,158 180,304 183,300 183,300 180,400 (1.58)%
EXPENDITURESMaterials & Services 750 750 800 800 800 - %Debt Service 179,454 179,554 182,500 182,500 179,600 (1.59)% TOTAL EXPENDITURES 180,204 180,304 183,300 183,300 180,400 (1.58)%
Prog 1022: 2004 Revenue Obligations Revenues less Expenditures (46) - - - -
CITY OF ALBANY, OREGONPROG 1022: 2004 Revenue Obligations
267

GENERAL OBLIGATION DEBT SERVICE FUNDRESOURCE DETAIL
2017-18 % Change % of
2014-15 2015-16 Adopted Revised Adopted from FundRESOURCES Actual Actual Budget Budget Budget 2016-17 Budget__________________________________________________________________________________________________________Property Taxes - Current -$ -$ 1,008,100$ 1,008,100$ 1,038,300$ 3.00% 90.61%Interest - - 900 900 900 - 0.08%Total Current Resources - - 1,009,000 1,009,000 1,039,200 2.99% 90.69%__________________________________________________________________________________________________________Total Resources -$ -$ 1,009,000$ 1,009,000$ 1,145,900$ 13.57% 100.00%
……2016-17……
268

GENERAL OBLIGATION DEBT SERVICE FUNDREQUIREMENT SUMMARIES
2014-15 2015-16Program Requirements Actual Actual Adopted Revised Proposed Approved Adopted_______________________________________________________________________________________________________________2015 Public Safety Facilities Bonds -$ -$ 1,009,000$ 1,009,000$ 1,179,100$ 1,179,100$ 1,179,100$ _______________________________________________________________________________________________________________Total Requirements -$ -$ 1,009,000$ 1,009,000$ 1,179,100$ 1,179,100$ 1,179,100$ ______________________________________________________________________________________________________________________________________________________________________________________________________________________________
2014-15 2015-16Requirements by Type Actual Actual Adopted Revised Proposed Approved Adopted_______________________________________________________________________________________________________________Materials & Services -$ -$ 900$ 900$ 900$ 900$ 900$ Debt Service - - 1,008,100 1,008,100 1,178,200 1,178,200 1,178,200 _______________________________________________________________________________________________________________Total Requirements -$ -$ 1,009,000$ 1,009,000$ 1,179,100$ 1,179,100$ 1,179,100$ ______________________________________________________________________________________________________________________________________________________________________________________________________________________________
Adopted Requirements Materials Debt Adopted % of Fundby Program and Type & Services Service Budget Budget_______________________________________________________________________________________________________________2015 Public Safety Facilities Bonds 900$ 1,178,200$ 1,179,100$ 100.00%_______________________________________________________________________________________________________________Total Requirements 900$ 1,178,200$ 1,179,100$ 100.00%______________________________________________________________________________________________________________________________________________________________________________________________________________________________Percent of Fund Budget 0.08% 99.92% 100.00%________________________________________________________________________________________________________________________________________________________________________________________________________
Adopted Budget Final Debt AdoptedDetail of Debt Service Maturity Principal Interest Reserve Budget_______________________________________________________________________________________________________________2015 Public Safety Facilities Bonds 06/15/2035 415,000$ 623,300$ 139,900$ 1,178,200$ _______________________________________________________________________________________________________________Total Requirements 415,000$ 623,300$ 139,900$ 1,178,200$ ______________________________________________________________________________________________________________________________________________________________________________________________________________________________
……2016-17…… ……2017-18……
……2016-17…… ……2017-18……
269

PROGRAM NARRATIVE
DEBT SERVICE FUND: 2015 Public Safety Facilities Bonds (303-10-1051) Responsible Manager/Title: Jeanna Yeager, Accounting Supervisor
FUNCTIONS AND RESPONSIBILITIES
This activity provides for payment of the principal and interest on the GO series 2015 Public Safety Facilities Bonds used for the construction of new police and fire stations. The bonds were approved by voters in the May 2015 election.
The bonds were dated August 19, 2015, and
accrue interest from that date until maturity or earlier redemption, payable semiannually on December 15 and June 15 of each fiscal year.
The original amount of the bond issue was $18,000,000.
The bonds are rated AA- by Standard and Poor’s.
The Bond Paying Agent is US Bank
National Association, Portland, Oregon. The Bond Counsel is Hawkins, Delafield & Wood LLP, Portland, Oregon. The Financial Advisor is Piper Jaffray.
MATURITY SCHEDULE
Fiscal Year Principal Interest Total
2017-2018 $415,000 $623,275 $1,038,275
2018-2019 465,000 606,675 1,071,675
2019-2020 520,000 588,075 1,108,075
2020-2021 575,000 567,275 1,142,275
2021-2026 3,760,000 2,423,925 6,183,925
2026-2031 5,590,000 1,494,576 7,084,576
2031-2035 5,910,000 493,132 6,403,132
Totals $17,235,000 $6,796,933 $24,031,933
270

303: GO Debt Service
10: Finance
2014-2015 2015-2016 2016-2017 2016-2017 2017-2018 %Description Actual Actual Adopted Revised Adopted Change
REVENUESProperty Taxes - 1,021,280 1,008,100 1,008,100 1,071,500 6.29 % Investment Income - 2,493 900 900 900 - %Beginning Balance - - - - 106,700 - %TOTAL REVENUES - 1,023,773 1,009,000 1,009,000 1,179,100 16.86 %
EXPENDITURESMaterials & Services - 850 900 900 900 - %Debt Service - 932,631 1,008,100 1,008,100 1,178,200 16.87 % TOTAL EXPENDITURES - 933,481 1,009,000 1,009,000 1,179,100 16.86 %
Prog 1051: 2015 Public Safety Facilities Bonds Revenues less Expenditures - 90,292 - - -
CITY OF ALBANY, OREGONPROG 1051: 2015 Public Safety Facilities Bonds
271


CAPITAL PROJECT FUNDS


CAPITAL PROJECTS FUND
PROGRAM FUNCTIONS, REVENUE TRENDS, AND ASSUMPTIONS
CAPITAL PROJECTS FUND
RESOURCES REQUIREMENTS
Assessment Revenues 85,000$ Materials & Services 100,000$ Investment Earnings 10,000 Capital 14,638,700Transfers In 1,002,000 Transfers Out 33,300Beginning Balance 13,675,000
Total Resources 14,772,000$ Total Requirements 14,772,000$
Public Safety Facilities: This project will account for the construction of the new police and fire facilities. The primary sourcesof revenue for this program are property Taxes ($18 million), settlement proceeds ($5 million), and the Albany RevitalizationAgency ($1.55 Million).
Local Improvement District Construction Projects: This program will be used to account for the construction and financingof local improvement district (LID) projects benefiting properties within the City. The primary sources of revenue for thisprogram are assessment payoffs and Bancroft bond proceeds.
Capital Project funds are created to account for the financial resources used for the acquisition or construction of major capitalfacilities. The City has one Capital Project fund.
Albany Data Integration: This program will be used to account for the implementation of a new Enterprise Resource Planning(ERP) system for the City.
272

CAPITAL PROJECTS FUNDRESOURCE DETAIL
2017-18 % Change % of
2014-15 2015-16 Adopted Revised Adopted from FundResources Actual Actual Budget Budget Budget 2016-17 Budget____________________________________________________________________________________________________________________Federal TEA Grant 320$ -$ -$ -$ -$ - - Financed Asmnts: Principal 66,423 19,100 15,000 15,000 30,000 100.00% 0.20%Financed Asmnts: Interest 31,119 883 2,500 2,500 15,000 500.00% 0.10%Unbonded Asmnts: Principal 750,812 507,510 33,300 33,300 40,000 20.12% 0.27%2015 Public Safety Facilities Bond Proceeds - 18,636,260 - - - - - Interest 5,176 154,732 32,500 32,500 10,000 (69.23%) 0.07%____________________________________________________________________________________________________________________Total Current Resources 853,850 19,318,485 83,300 83,300 95,000 14.05% 0.64%____________________________________________________________________________________________________________________From Water Capital - - 75,000 75,000 75,000 - 0.51%From CARA Program - 1,455,000 - - - - - From Street Fund - - 715,800 715,800 927,000 29.51% 6.28%From Litigation Proceeds - 5,000,000 - - - - - ____________________________________________________________________________________________________________________Total Transfers In - 6,455,000 790,800 790,800 1,002,000 26.71% 6.79%____________________________________________________________________________________________________________________Beginning Balance 765,461 892,338 24,770,300 24,770,300 13,675,000 (44.79%) 92.57%____________________________________________________________________________________________________________________Total Resources 1,619,311$ 26,665,823$ 25,644,400$ 25,644,400$ 14,772,000$ (42.40%) 100.00%________________________________________________________________________________________________________________________________________________________________________________________________________________________________________
TEA - Transportation Equity Act
CAPITAL PROJECTS FUND RESOURCES BY SOURCECategory Totals and Percent of Budget
……2016-17……
Assessment payments $85,000 (0.580%)
Investment earnings $10,000 (0.07%)
Transfers in $1,002,000 (6.78%)
Beginning balance $13,675,000 (92.57%)
273

CAPITAL PROJECTS FUNDREQUIREMENT/STAFFING SUMMARIES
2014-15 2015-16Program Requirements Actual Actual Adopted Revised Proposed Approved Adopted_____________________________________________________________________________________________________________________Albany Data Integration Project -$ -$ -$ -$ 500,000$ 500,000$ 500,000$ LID Construction Projects 647,690 184,498 1,559,400 1,559,400 2,267,000 2,267,000 2,267,000 Public Safety Facilities 41,472 2,068,517 24,085,000 24,085,000 12,005,000 12,005,000 12,005,000 Albany Station Pathway 20,122 92,975 - - - - - North Albany Park & Ride 17,742 - - - - - - _____________________________________________________________________________________________________________________Total Requirements 727,026$ 2,345,990$ 25,644,400$ 25,644,400$ 14,772,000$ 14,772,000$ 14,772,000$ __________________________________________________________________________________________________________________________________________________________________________________________________________________________________________
2014-15 2015-16Requirements by Type Actual Actual Adopted Revised Proposed Approved Adopted_____________________________________________________________________________________________________________________Materials & Services 41,472$ 2,057,050$ -$ -$ 100,000$ 100,000$ 100,000$ Capital 40,523 92,063 25,611,100 25,611,100 14,638,700 14,638,700 14,638,700 Transfers Out 645,032 196,877 33,300 33,300 33,300 33,300 33,300 _____________________________________________________________________________________________________________________Total Requirements 727,027$ 2,345,990$ 25,644,400$ 25,644,400$ 14,772,000$ 14,772,000$ 14,772,000$ __________________________________________________________________________________________________________________________________________________________________________________________________________________________________________
Adopted Requirements Materials Transfers Adopted % of Fundby Program and Type & Services Capital Out Budget Budget_____________________________________________________________________________________________________________________Albany Data Integration Project 100,000$ 400,000$ -$ 500,000$ 3.38%LID Construction Projects - 2,233,700 33,300 2,267,000 15.35%Public Safety Facilities - 12,005,000 - 12,005,000 81.27%_____________________________________________________________________________________________________________________Total Requirements 100,000$ 14,638,700$ 33,300$ 14,772,000$ 100.00%__________________________________________________________________________________________________________________________________________________________________________________________________________________________________________Percent of Fund Budget 0.67% 99.10% 0.23% 100.00%__________________________________________________________________________________________________________________________________________________________________________________________________________________
……2016-17…… ……2017-18……
……2016-17…… ……2017-18……
274

PROGRAM NARRATIVE
CAPITAL PROJECTS FUND: Albany Data Integration (402-10-1011) Responsible Manager/Title: Anne Baker, Accounting Supervisor
FUNCTIONS AND RESPONSIBILITIES
This program accounts for the conversion from Tyler’s Eden Enterprise Resource Planning (ERP) system to a new ERP system.
Tyler is phasing Eden out and is no longer providing enhancements to the system. The City has been using Eden for over ten years.
The new system will be purchased using funds made available through an accounting change required during the Fiscal Year 2015-16 audit.
STRATEGIES/ACTIONS
Strategic Plan Theme Target Date Status Strategies/Actions
Budget Year 2017-2018
Effective Government Ongoing Select and begin implementation of a new ERP.
275

402: Capital Projects
10: Finance
2014-2015 2015-2016 2016-2017 2016-2017 2017-2018 %Description Actual Actual Adopted Revised Adopted Change
REVENUESInvestment Income 105 92 - - - - %Beginning Balance 16,719 16,824 - - 500,000 - %TOTAL REVENUES 16,824 16,916 - - 500,000 - %
EXPENDITURESMaterials & Services - - - - 100,000 - %Capital - - - - 400,000 - %TOTAL EXPENDITURES - - - - 500,000 - %
Prog 1011: Albany Data Integration Project Revenues less Expenditures 16,824 16,916 - - -
CITY OF ALBANY, OREGONPROG 1011: Albany Data Integration Project
276

PROGRAM NARRATIVE
CAPITAL PROJECTS FUND: LID CONSTRUCTION PROJECTS (402-10-1012) Responsible Manager/Title: Anne Baker, Accounting Supervisor
FUNCTIONS AND RESPONSIBILITIES
This program accounts for the construction and financing of special assessment Local Improvement District (LID) projects and the payment of assessments from benefited property owners.
Assessment payments for the Timber Ridge and Oak Street LID assessments will be transferred to settlement proceeds to repay the loans for those projects.
STRATEGIES/ACTIONS
Strategic Plan Theme Target Date Status Strategies/Actions
Budget Year 2016-2017
Effective Government Ongoing Collect and disburse assessments due from completed LID projects.
Budget Year 2017-2018
Effective Government Collect and disburse assessments due from completed LID projects.
277

402: Capital Projects
10: Finance
2014-2015 2015-2016 2016-2017 2016-2017 2017-2018 %Description Actual Actual Adopted Revised Adopted Change
REVENUESCharges for Services 848,354 527,492 50,800 50,800 85,000 67.32 % Investment Income 4,301 4,497 2,500 2,500 5,000 100.00 % Transfers In - - 790,800 790,800 1,002,000 26.71 % Beginning Balance 617,427 822,391 715,300 715,300 1,175,000 64.27 % TOTAL REVENUES 1,470,082 1,354,380 1,559,400 1,559,400 2,267,000 45.38 %
EXPENDITURESCapital 15,690 44,298 1,526,100 1,526,100 2,233,700 46.37 % Transfers Out 632,000 139,700 33,300 33,300 33,300 - %TOTAL EXPENDITURES 647,690 184,498 1,559,400 1,559,400 2,267,000 45.38 %
Prog 1012: LID Construction Projects Revenues less Expenditures 822,392 1,169,882 - - -
CITY OF ALBANY, OREGONPROG 1012: LID Construction Projects
278

PROGRAM NARRATIVE
PUBLIC SAFETY FACILITIES (402-10-1052) Responsible Manager/Title: Anne Baker, Accounting Supervisor
FUNCTIONS AND RESPONSIBILITIES
This program accounts for the construction of the new police and fire facilities.
STRATEGIES/ACTIONS
Strategic Plan Theme Target Date Status Strategies/Actions
Budget Year 2016-2017
Effective Government 07/16 Completed Begin construction of new facilities for the Police Department and Fire Department.
Budget Year 2017-2018
Effective Government 06/18 Complete construction of new facilities for the Police Department and Fire Department.
279

402: Capital Projects
10: Finance
2014-2015 2015-2016 2016-2017 2016-2017 2017-2018 %Description Actual Actual Adopted Revised Adopted Change
REVENUESMiscellaneous Revenue - 18,636,761 - - - - %Investment Income - 149,770 30,000 30,000 5,000 (83.33)% Transfers In - 6,455,000 - - - - %Beginning Balance - (41,472) 24,055,000 24,055,000 12,000,000 (50.11)% TOTAL REVENUES - 25,200,059 24,085,000 24,085,000 12,005,000 (50.16)%
EXPENDITURESMaterials & Services 41,472 2,056,550 - - - - %Capital - 11,967 24,085,000 24,085,000 12,005,000 (50.16)% TOTAL EXPENDITURES 41,472 2,068,517 24,085,000 24,085,000 12,005,000 (50.16)%
Prog 1052: Public Safety Facilities Revenues less Expenditures (41,472) 23,131,542 - - -
CITY OF ALBANY, OREGONPROG 1052: Public Safety Facilities
280


PERMANENT FUNDS


PERMANENT FUNDS
PROGRAM FUNCTIONS, REVENUE TRENDS, AND ASSUMPTIONS
SENIOR CENTER ENDOWMENT FUND
LIBRARY TRUST FUND
RESOURCES REQUIREMENTS
Investment Earnings 700$ Materials & Services 4,800$ Beginning Balance 56,500 Transfers out 52,400Beginning Balance Held in Trust 79,500 Unappropriated 79,500
Total Resources 136,700$ Total Requirements 136,700$
Manela Trust: Interest earnings on the $69,500 trust balance are used to purchase scientific, educational, and technical books.
Permanent funds are used to report resources that are legally restricted to the extent that only earnings, and not principal, may beused for the benefit of the government or its citizenry. The City has two Permanent funds.
This fund receives private gifts and donations dedicated to Senior Center operations. Donations have ranged from $3,500 to$5,000 annually. Because the nature of the fund has changed and expenditures may be made from all donations, in 2017-18 thefunds are being transferred to the Parks Fund for management.
Veda O. Torney Trust: Interest earnings on the $10,000 trust balance are used for the purchase of children's picture books.
281


SENIOR CENTER ENDOWMENT FUND
RESOURCE DETAIL
2017-18 % Change % of2014-15 2015-16 Adopted Revised Adopted from Fund
Resources Actual Actual Budget Budget Budget 2016-17 Budget_______________________________________________________________________________________________Donations 100$ 25$ 100$ 100$ -$ (100.00%) - Interest 268 340 100 100 - (100.00%) - _______________________________________________________________________________________________Total Current Resources 368 365 200 200 - (100.00%) - _______________________________________________________________________________________________Beginning Balance 51,259 51,627 51,800 51,800 52,400 1.16% 100.00%_______________________________________________________________________________________________Total Resources 51,627$ 51,992$ 52,000$ 52,000$ 52,400$ 0.77% 100.00%______________________________________________________________________________________________________________________________________________________________________________________________
DONATIONS AND INTEREST EARNINGS FOR TEN FISCAL YEARS
Year Donations Interest2009 3,041 860 2010 2,414 1,773 2011 922 2,379 2012 296 2,324 2013 133 1,472 2014 - 412 2015 100 268 2016 25 340 2017 100 100 2018 - -
REQUIREMENT SUMMARIES
……2016-17……
$0
$1,000
$2,000
$3,000
$4,000
2009 2010 2011 2012 2013 2014 2015 2016 2017 2018
Donations
Interest
REQUIREMENT SUMMARIES
Program Expenditures/ 2014-15 2015-16Requirements Actual Actual Adopted Revised Proposed Approved Adopted_______________________________________________________________________________________________Materials & Services -$ -$ 200$ 200$ -$ -$ -$ Unappropriated - - 51,800 51,800 - - - _______________________________________________________________________________________________Total Requirements -$ -$ 52,000$ 52,000$ -$ -$ -$ ______________________________________________________________________________________________________________________________________________________________________________________________
2014-15 2015-16Percent of Fund Total Actual Actual Adopted Revised Proposed Approved Adopted_______________________________________________________________________________________________Materials & Services - - 0.38% 0.38% - - - Unappropriated - - 99.62% 99.62% - - - _______________________________________________________________________________________________Totals - - 100.00% 100.00% - - - ______________________________________________________________________________________________________________________________________________________________________________________________
……2016-17…… ……2017-18……
……2016-17…… ……2017-18……
282

PROGRAM NARRATIVE
Senior Center Endowment Fund: Senior Center Endowment (501-35-1418) Responsible Manager/Title: Katie Nooshazar, Recreation Programs Manager
FUNCTIONS AND RESPONSIBILITIES
Promote collection of endowment funds to be used for operation of the Albany Senior Center.
Oversee fund expenditures and ensure monies are used solely for operation of the Albany Senior Center.
Receive funds, recognize donors, and ensure capital is reinvested.
STRATEGIES/ACTIONS
Strategic Plan Theme
Target Date Status Strategies/Actions
Budget Year 2016-2017
Effective Government 06/17 Completed Identify how fund might best assist with rebranding and remodeling efforts.
Budget Year 2017-2018
Effective Government 06/18 Dissolve Endowment Fund, and transfer assets to 501c3 Senior Center Foundation.
283

501: Senior Center Endowment
35: Parks
2014-2015 2015-2016 2016-2017 2016-2017 2017-2018 %Description Actual Actual Adopted Revised Adopted Change
REVENUESInvestment Income 268 340 100 100 - (100.00)% Beginning Balance 51,259 51,627 51,800 51,800 52,400 1.16 % TOTAL REVENUES 51,627 51,992 52,000 52,000 52,400 0.77 %
EXPENDITURESMaterials & Services - - 200 200 - (100.00)% Transfers Out - - - - 52,400 - %Unappropriated - - 51,800 51,800 - (100.00)% TOTAL EXPENDITURES - - 52,000 52,000 52,400 0.77 %
Prog 1418: Senior Center Endowment Revenues less Expenditures 51,627 51,992 - - -
CITY OF ALBANY, OREGONPROG 1418: Senior Center Endowment
284


LIBRARY TRUST FUNDRESOURCE DETAIL
2017-18 % Change % of
2014-15 2015-16 Adopted Revised Adopted from FundResources Actual Actual Budget Budget Budget 2016-17 Budget___________________________________________________________________________________________________Interest 438$ 565$ 500$ 500$ 700$ 40.00% 0.83%___________________________________________________________________________________________________Total Current Resources 438 565 500 500 700 40.00% 0.83%___________________________________________________________________________________________________Beginning Balance - - 4,000 4,000 4,100 2.50% 4.86%Beginning Balance Held in Trust 84,036 83,485 79,500 79,500 79,500 - 94.31%___________________________________________________________________________________________________Total Resources 84,474$ 84,050$ 84,000$ 84,000$ 84,300$ 0.36% 100.00%______________________________________________________________________________________________________________________________________________________________________________________________________
REQUIREMENT SUMMARIES
2014-15 2015-16Program Requirements Actual Actual Adopted Revised Proposed Approved Adopted___________________________________________________________________________________________________V. O. Torney Trust -$ -$ 13,500$ 13,500$ 13,600$ 13,600$ 13,600$ Manela Trust 992 1,366 70,500 70,500 70,700 70,700 70,700 ___________________________________________________________________________________________________Total Requirements 992$ 1,366$ 84,000$ 84,000$ 84,300$ 84,300$ 84,300$ ______________________________________________________________________________________________________________________________________________________________________________________________________
2014-15 2015-16Requirements by Type Actual Actual Adopted Revised Proposed Approved Adopted___________________________________________________________________________________________________Materials & Services 992$ 1,366$ 4,500$ 4,500$ 4,800$ 4,800$ 4,800$ Unappropriated - - 79,500 79,500 79,500 79,500 79,500 ___________________________________________________________________________________________________T t l R i t 992$ 1 366$ 84 000$ 84 000$ 84 300$ 84 300$ 84 300$
……2016-17……
……2016-17…… ……2017-18……
……2016-17…… ……2017-18……
Total Requirements 992$ 1,366$ 84,000$ 84,000$ 84,300$ 84,300$ 84,300$ ______________________________________________________________________________________________________________________________________________________________________________________________________
Adopted Requirements Materials Unappro- Adopted % of Fundby Program and Type & Services priated Budget Budget___________________________________________________________________________________________________V. O. Torney Trust 3,600$ 10,000$ 13,600$ 16.13%Manela Trust 1,200 69,500 70,700 83.87%___________________________________________________________________________________________________Total Requirements 4,800$ 79,500$ 84,300$ 100.00%______________________________________________________________________________________________________________________________________________________________________________________________________Percent of Fund Budget 5.69% 94.31% 100.00%__________________________________________________________________________________________________________________________________________________________________________________
INTEREST EARNINGS LAST TEN FISCAL YEARSYear Interest Expends
2009 1,094 1,246 2010 1,733 - 2011 3,362 - 2012 4,199 3,334 2013 2,656 2,880 2014 703 3,172 2015 438 9922016 565 1,3662017 500 4,5002018 700 4,800
$1,094
$1,733
$3,362
$4,199
$2,656
$703 $438 $565 $500 $700
$0
$1,000
$2,000
$3,000
$4,000
$5,000
2009 2010 2011 2012 2013 2014 2015 2016 2017 2018
285

PROGRAM NARRATIVE
LIBRARY TRUST FUND: V.O. TORNEY TRUST (502-45-1703) Responsible Manager/Title: Ed Gallagher, Library Director
FUNCTIONS AND RESPONSIBILITIES
Upon her death, Veda Torney left $10,000 to the Library solely for the purchase of children’s picture books. The principal is invested and only the interest is used each year for the intended purpose.
Established March 31, 1977.
STRATEGIES/ACTIONS
Strategic Plan Theme Target Date Status Strategies/Actions
Budget Year 2016-2017
Great Neighborhoods 06/17 Completed Purchase 125 picture books.
Budget Year 2017-2018
Great Neighborhoods 06/18 Purchase 135 children’s picture books.
286

502: Library Trust
45: Library
2014-2015 2015-2016 2016-2017 2016-2017 2017-2018 %Description Actual Actual Adopted Revised Adopted Change
REVENUESInvestment Income 69 105 100 100 100 - %Dedicated Beginning Balance 13,206 13,275 10,000 10,000 10,000 - %Beginning Balance - - 3,400 3,400 3,500 2.94 % TOTAL REVENUES 13,275 13,380 13,500 13,500 13,600 0.74 %
EXPENDITURESMaterials & Services - - 3,500 3,500 3,600 2.86 % Unappropriated - - 10,000 10,000 10,000 - %TOTAL EXPENDITURES - - 13,500 13,500 13,600 0.74 %
Prog 1703: V. O. Torney Trust Revenues less Expenditures 13,275 13,380 - - -
CITY OF ALBANY, OREGONPROG 1703: V. O. Torney Trust
287

PROGRAM NARRATIVE
LIBRARY TRUST FUND: MANELA TRUST (502-45-1704) Responsible Manager/Title: Ed Gallagher, Library Director
FUNCTIONS AND RESPONSIBILITIES
Upon the death of Olive Manela, a trust fund was established in the amount of $69,500 for the Albany Public Library, with the principal to be invested and only the interest to be spent on religious, educational, scientific, or technical books.
Established June 11, 1975.
STRATEGIES/ACTIONS
Strategic Plan Theme Target Date Status Strategies/Actions
Budget Year 2016-2017
Great Neighborhoods 06/17 Completed Purchase 75 books in the designated subject areas.
Budget Year 2017-2018
Great Neighborhoods 06/18 Purchase 50 books in the designated subject areas.
288

502: Library Trust
45: Library
2014-2015 2015-2016 2016-2017 2016-2017 2017-2018 %Description Actual Actual Adopted Revised Adopted Change
REVENUESInvestment Income 369 460 400 400 600 50.00 % Dedicated Beginning Balance 70,830 70,210 69,500 69,500 69,500 - %Beginning Balance - - 600 600 600 - %TOTAL REVENUES 71,202 70,670 70,500 70,500 70,700 0.28 %
EXPENDITURESMaterials & Services 992 1,366 1,000 1,000 1,200 20.00 % Unappropriated - - 69,500 69,500 69,500 - %TOTAL EXPENDITURES 992 1,366 70,500 70,500 70,700 0.28 %
Prog 1704: Manela Trust Revenues less Expenditures 70,210 69,304 - - -
CITY OF ALBANY, OREGONPROG 1704: Manela Trust
289


ENTERPRISE
FUNDS


SEWER FUND
WATER FUND
STORMWATER FUND
RESOURCES REQUIREMENTS
Licenses & fees 1,301,800$ Personnel 4,927,400$ Intergovernmental resources 796,900 Materials & Services 14,270,200Charges for service 30,247,200 Capital 31,664,000Assessment payments 248,000 Transfers Out 3,146,900Other resources 178,200 Debt Service 12,549,200Investment earnings 1,906,000 Contingency 2,007,100Transfers in 32,284,700Beginning balance 1,602,000
Total Resources 68,564,800$ Total Requirements 68,564,800$
The Stormwater Fund accounts for all programs associated with the collection of stormwater in the City. Activities includecollection, equipment replacement, and system improvements to the stormwater system.
The primary source of revenue for the Stormwater Fund is post-construction stormwater quality permit fees and other post-construction stormwater quality program activities. Permit Fees are estimated at $1,740,000 for 2017-18.
ENTERPRISE FUNDS
PROGRAM FUNCTIONS, REVENUE TRENDS, AND ASSUMPTIONS
Enterprise funds are established for operations that are financed and managed in a manner similar to private enterprises. Theintent of enterprise funds is that the cost of providing utility services to the general public on a continuing basis will be financedor recovered primarily through user charges. The City has three enterprise funds.
The Sewer Fund accounts for all programs associated with the collection and treatment of wastewater in the City. Activitiesinclude collection, treatment, billing, equipment replacement, plant expansion, system improvements, economic development,and the repayment of debt incurred to make improvements to the sewer system.
The primary source of revenue for the Sewer Fund is sewer service charges. The City Council authorizes increases to sewerservice charges on an annual basis to cover debt service for major construction projects and the cost of inflation.
Development fees, including systems development charges (SDC), vary with the level of residential and commercialdevelopment. SDC revenues are projected to increase by $23,300 in 2017-18.
In Fiscal Year 2004-05, the City began a major renovation and improvement of its wastewater treatment plant and facilities.Funding has been provided through a State Revolving Fund loan, the city of Millersburg, and resources of the Sewer Fund.
Development fees, including systems development charges (SDC), vary with the level of residential and commercialdevelopment. SDC revenues are projected to increase by $223,000 in 2017-18.
The Water Fund accounts for all activities associated with the provision of water to the citizenry of Albany. Activities includetreatment, distribution, source (canal) maintenance, billing, plant expansion, system improvements, equipment replacement,economic development, and repayment of debt incurred to purchase and improve the water system.
The primary source of revenue for the Water Fund is water service charges. The City Council authorizes increases to the waterrates on an annual basis to cover debt service for major capital projects and the costs of inflation.
In 2003, the City sold $40.485 million of water revenue bonds to finance several large capital projects, including a new watertreatment plant in a joint venture with the city of Millersburg, and to make fish screen, diversion dam, and hydroelectricimprovements to the existing water system. The new treatment plant was put online in the fall of 2005.
290

SEWER FUNDRESOURCE DETAIL
2017-18 % Change % of
2014-15 2015-16 Adopted Revised Adopted from FundResources Actual Actual Budget Budget Budget 2016-17 Budget____________________________________________________________________________________________________________________Storm Drain Plan Review/ Inspection Fees
6,729$ 25,609$ -$ -$ -$ - -
Stormwater Quality Permits - 8,013 - - - - - Sewer SDC: Principal 177,611 4,688 3,000 3,000 2,500 (16.67%) 0.01%Sewer SDC: Interest 4,215 717 600 600 500 (16.67%) - Connection Fees: Principal 6,999 7,097 4,000 4,000 6,000 50.00% 0.02%Connection Fees: Interest 4,980 4,586 3,100 3,100 3,100 - 0.01%General Sewer Connection Fees 22,329 7,363 15,000 15,000 10,000 (33.33%) 0.03%Storm Drain Connection Fees 25,692 6,539 - - - - - Connection Fees 33,594 3,876 - - - - - Public Facility Construction Permit 16,051 44,518 5,000 5,000 5,000 - 0.01%Sewer Systems Development Charges 881,359 752,617 470,000 470,000 715,000 52.13% 1.79%Stormwater In-Lieu-of Planting - 20,565 - - - - - WComp Wage Subsidy Reimb 1,061 979 - - - - - Millersburg Debt Service Payment 405,650 - - - - - - Millersburg Debt - Principal - 256,653 264,500 264,500 272,500 3.02% 0.68%Millersburg Debt - Interest - 159,855 150,700 150,700 141,400 (6.17%) 0.35%Albany Sewer Service Charges 14,898,828 16,231,487 16,506,000 16,506,000 15,604,000 (5.46%) 39.17%Certified Sewer Charges 38,460 46,471 50,000 50,000 50,000 - 0.13%Millersburg O&M Charges 153,480 199,454 150,000 150,000 175,000 16.67% 0.44%Wah Chang O&M Charges 124,664 219,971 125,000 125,000 140,000 12.00% 0.35%Collection Agency Payments 19,812 13,289 5,000 5,000 5,000 - 0.01%Equipment Replacement Charges 93,200 118,000 118,600 118,600 99,500 (16.10%) 0.25%Financed Asmnts: Principal 19,036 - 5,000 5,000 - (100.00%) - Financed Asmnts: Interest 105 - 100 100 - (100.00%) - Miscellaneous Revenue 27,189 34,594 25,000 25,000 25,000 - 0.06%Interest 105,755 193,214 104,300 104,300 111,700 7.09% 0.28%____________________________________________________________________________________________________________________Total Current Resources 17,066,799 18,360,155 18,004,900 18,004,900 17,366,200 (3.55%) 43.59%____________________________________________________________________________________________________________________
From 2502: SDC-I for WWTP SRF debt - 727,300 1,424,100 1,424,100 1,467,400 3.04% 3.68%____________________________________________________________________________________________________________________Total Transfers In - 727,300 1,424,100 1,424,100 1,467,400 3.04% 3.68%____________________________________________________________________________________________________________________Beginning Balance 19,092,178 20,588,336 20,473,900 20,473,900 21,001,500 2.58% 52.73%____________________________________________________________________________________________________________________Total Resources 36,158,977$ 39,675,791$ 39,902,900$ 39,902,900$ 39,835,100$ (0.17%) 100.00%________________________________________________________________________________________________________________________________________________________________________________________________________________________________________
SDC - Systems Development Charges SDC-I - Systems Development Charges - Improvement feeSRF - State Revolving Fund
……2016-17……
291

SEWER FUNDREQUIREMENT/STAFFING SUMMARIES
2014-15 2015-16Program Requirements Actual Actual Adopted Revised Proposed Approved Adopted___________________________________________________________________________________________________________________Wastewater Treatment Plant 2,571,092$ 3,030,244$ 2,459,700$ 2,459,700$ 2,637,900$ 2,637,900$ 2,637,900$ Wastewater Collection 1,943,319 2,055,658 1,601,800 1,601,800 1,499,900 1,499,900 1,499,900 Wastewater Administration 2,829,112 3,188,477 6,090,000 6,090,000 5,138,500 5,138,500 5,138,500 Water Reuse and Biosolids 5,446 21,376 9,000 9,000 8,600 8,600 8,600 TWG Wetlands 235,009 306,994 265,800 265,800 266,900 266,900 266,900 Stormwater Operations 328,453 435,697 - - - - - Industrial Pretreatment 538,317 550,447 621,100 621,100 483,600 483,600 483,600 Sewer System Capital Projects 1,439,279 1,752,408 14,284,100 14,284,100 15,892,600 15,892,600 15,892,600 Sewer Equipment Replacement 115,207 564,321 776,400 776,400 726,200 726,200 726,200 Sewer SDC Imp. Fee Projects 9 727,300 3,648,500 3,648,500 3,094,500 3,094,500 3,094,500 Sewer SDC Reimb. Fee Projects - - 483,700 483,700 536,600 536,600 536,600 Sewer Debt Service 5,494,826 5,629,989 9,013,500 9,013,500 9,010,600 9,010,600 9,010,600 Sewer Economic Development 30,333 7,535 649,300 649,300 539,200 539,200 539,200 Wetlands Treatment Project 155,294 270,154 - - - - - ___________________________________________________________________________________________________________________Total Requirements 15,685,696$ 18,540,600$ 39,902,900$ 39,902,900$ 39,835,100$ 39,835,100$ 39,835,100$ ______________________________________________________________________________________________________________________________________________________________________________________________________________________________________
2014-15 2015-16Requirements by Type Actual Actual Adopted Revised Proposed Approved Adopted___________________________________________________________________________________________________________________Personnel 2,174,895$ 2,347,565$ 2,324,900$ 2,324,900$ 2,109,000$ 2,109,000$ 2,109,000$ Materials & Services 6,126,600 6,737,114 6,921,800 6,921,800 6,655,800 6,655,800 6,655,800 Capital 1,211,539 2,460,189 17,907,900 17,907,900 19,001,700 19,001,700 19,001,700 Transfers Out 677,835 1,365,743 2,759,800 2,759,800 2,063,500 2,063,500 2,063,500 Debt Service 5,494,826 5,629,989 9,013,500 9,013,500 9,010,600 9,010,600 9,010,600 Contingency - - 975,000 975,000 994,500 994,500 994,500 ___________________________________________________________________________________________________________________Total Requirements 15,685,695$ 18,540,600$ 39,902,900$ 39,902,900$ 39,835,100$ 39,835,100$ 39,835,100$ ______________________________________________________________________________________________________________________________________________________________________________________________________________________________________
Adopted Requirements Materials Transfers Debt Contin- Adopted % of Fundby Program and Type Personnel & Services Capital Out Service gency Budget Budget_____________________________________________________________________________________________________________________________Wastewater Treatment Plant 737,400$ 1,833,500$ 67,000$ -$ -$ -$ 2,637,900 6.62%Wastewater Collection 767,900 721,000 11,000 - - - 1,499,900 3.77%Wastewater Administration 151,800 3,396,100 - 596,100 - 994,500 5,138,500 12.90%Water Reuse and Biosolids - 8,600 - - - - 8,600 0.02%TWG Wetlands 110,300 149,600 7,000 - - - 266,900 0.67%Industrial Pretreatment 341,600 142,000 - - - - 483,600 1.21%Sewer System Capital Projects - 405,000 15,487,600 - - - 15,892,600 39.90%Sewer Equipment Replacement - - 726,200 - - - 726,200 1.82%Sewer SDC Imp. Fee Projects - - 1,627,100 1,467,400 - - 3,094,500 7.77%Sewer SDC Reimb. Fee Projects - - 536,600 - - - 536,600 1.35%Sewer Debt Service - - - - 9,010,600 - 9,010,600 22.62%Sewer Economic Development - - 539,200 - - - 539,200 1.35%_____________________________________________________________________________________________________________________________Total Requirements 2,109,000$ 6,655,800$ 19,001,700$ 2,063,500$ 9,010,600$ 994,500$ 39,835,100$ 100.00%__________________________________________________________________________________________________________________________________________________________________________________________________________________________________________________________Percent of Fund Budget 5.29% 16.71% 47.70% 5.18% 22.62% 2.50% 100.00%______________________________________________________________________________________________________________________________________________________________________________________________________________________________________
2014-15 2015-16Staffing Summary (FTE) Actual Actual Adopted Revised Proposed Approved Adopted___________________________________________________________________________________________________________________Wastewater Treatment Plant 7.000 7.000 7.000 7.000 7.000 7.000 7.000 Wastewater Collection 10.500 10.500 10.500 10.500 10.500 10.500 10.500 Wastewater Administration 1.000 1.000 1.000 1.000 1.000 1.000 1.000 Water Reuse and Biosolids - 1.000 1.000 1.000 1.000 1.000 1.000 Industrial Pretreatment 4.000 4.000 4.000 4.000 3.000 3.000 3.000 ___________________________________________________________________________________________________________________Total FTE 22.500 23.500 23.500 23.500 22.500 22.500 22.500 ______________________________________________________________________________________________________________________________________________________________________________________________________________________________________
……2016-17…… ……2017-18……
……2016-17…… ……2017-18……
……2016-17…… ……2017-18……
292

SEWER FUNDRESOURCES AND REQUIREMENTS
TOTAL SEWER FUND RESOURCES BY SOURCE
TOTAL SEWER FUND REQUIREMENTS BY TYPE
Licenses and permits $742,100 (1.86%)
Intergovernmental resources $413,900
(1.04%)
Charges for services $15,974,000 (40.1%)
Other resources $124,500 (0.32%)
Investment earnings $111,700 (0.28%)
Transfers in $1,467,400 (3.68%)
Beginning balance $21,001,500 (52.72%)
Capital $19,001,700
Transfers Out $2,063,500 (5.18%)
Debt Service $9,010,600 (22.62%)
Contingency
USE OF SEWER SERVICE CHARGES FOR FISCAL YEAR 2017-18
O & M 8,672,100$ 55.40%Capital 3,170,600 20.25%Debt Service 3,711,300 23.71%Economic Development 100,000 0.64%___________________________________________________Total Sewer Service Charges 15,654,000$ 100.00%______________________________________________________________________________________________________
O & M - Operation & Maintenance
Personnel $2,109,000 (5.29%)
Materials & Services $6,655,800 (16.71%)
Capital $19,001,700 (47.7%)
Contingency $994,500 (2.5%)
O & M $8,672,100
(55.4%)
Capital $3,170,600 (20.25%)
Debt Service
$3,711,300 (23.71%)
Economic Devel.
$100,000 (0.64%)
293

SEWER FUNDRESOURCES
ChargesFiscal for Licenses & Other Debt BeginningYear Services Permits Revenues Transfers In Proceeds Balance Totals________________________________________________________________________________________________________2009 10,883,554$ 458,541$ 495,910$ -$ 7,637,289$ 12,719,639$ 32,194,933$ 2010 11,483,847 497,701 3,843,436 - 14,083,964 8,930,945 38,839,893 2011 12,091,105 529,652 10,366,748 - 426,336 13,051,865 36,465,706 2012 12,044,223 446,073 427,557 - 417,316 18,427,707 31,762,876 2013 12,955,303 892,883 5,229,976 - 420,135 17,488,625 36,986,921 2014 14,097,974 739,173 263,859 - 406,254 22,493,841 38,001,101 2015 15,235,245 1,179,560 246,346 115,052 405,650 19,092,178 36,274,031 2016 16,710,672 886,187 763,295 727,300 - 20,588,336 39,675,790 2017 16,836,000 500,700 668,200 696,800 - 20,473,900 39,175,600 2018 15,974,000 742,100 650,100 - - 21,001,500 38,367,700
NOTES: Actual revenues for Fiscal Years 2009 through 2016. Budgeted resources for 2017 and 2018.
SEWER SERVICE CHARGE REVENUES
through Fiscal Year 2010.
Settlement Proceeds.
Ten Fiscal Years
Other Revenues: In Fiscal Year 2008, the Sewer Fund received $1,000,000 from the City of Millersburg and $710,000 from
Transfers In: Intrafund transfers have been eliminated from all years in the table above. Debt Proceeds: The City received SRF loan proceeds for the new Wastewater Treatment Plant from Fiscal Year 2007
In Fiscal Year 2010, the City received resources of $2,000,000 from the City of Millersburg.
Annual Percentage Change
Fiscal Annual %Year Change_________________________2010 5.52% 2011 5.29% 2012 (0.39%) 2013 7.56% 2014 8.82% 2015 8.07% 2016 9.68% 2017 0.75% 2018 (5.12%)
5.52%
5.29%
(0.39%)
7.56%
8.82%
8.07% 9.68%
0.75%
(5.12%) -8%
-4%
0%
4%
8%
12%
16%
20%
2010 2011 2012 2013 2014 2015 2016 2017 2018
294

SEWER FUNDREQUIREMENTS
Fiscal Operating Transfers DebtYear Expenditures Capital Out Service Totals______________________________________________________________________________2009 7,151,115$ 15,315,647$ 1,991,874$ 695,351$ 25,153,987$ 2010 7,851,432 10,287,148 12,412,515 5,300,646 35,851,741 2011 7,997,179 6,576,349 - 5,054,086 19,627,614 2012 8,260,807 837,402 743,211 5,608,369 15,449,789 2013 9,434,600 9,301,600 523,420 9,516,000 28,775,620 2014 8,401,275 4,449,039 556,214 5,502,395 18,908,923 2015 8,301,495 1,211,539 677,835 5,494,826 15,685,695 2016 9,084,679 2,460,189 818,943 5,629,989 17,993,800 2017 9,246,700 11,125,000 2,032,500 9,013,500 31,417,700 2018 8,764,800 7,678,800 596,100 9,010,600 26,050,300
NOTES: Actual revenues for Fiscal Years 2009 through 2016. Budgeted resources for 2017 and 2018.Operating Expenditures equal Personnel plus Materials and Services.
REQUIREMENTS, TEN FISCAL YEARS
Debt Service includes Debt Reserves. In April 2010, a $4.3 million payment was made on the SRF loan to finance the newsewage treatment plant.
Ten Fiscal Years
$30,000,000
$34,000,000
$(2,000,000)
$2,000,000
$6,000,000
$10,000,000
$14,000,000
$18,000,000
$22,000,000
$26,000,000
$30,000,000
2009 2010 2011 2012 2013 2014 2015 2016 2017 2018
Operating Exp Capital Transfers Out Debt Service
295

SEWER FUNDDEBT SERVICE COMBINED BUDGET
2017-18 % Change % of2014-15 2015-16 Adopted Revised Adopted from Fund
Resources Actual Actual Budget Budget Budget 2016-17 Budget____________________________________________________________________________________________________________________Millersburg Debt Service Payment 405,650$ -$ -$ -$ -$ - - Millersburg Debt - Principal - 256,653 264,500 264,500 272,500 3.02% 3.02%Millersburg Debt - Interest - 159,855 150,700 150,700 141,400 (6.17%) 1.57%Albany Sewer Service Charges 3,735,300 3,821,600 3,742,500 3,742,500 3,711,300 (0.83%) 41.19%Interest 27,081 18,251 15,000 15,000 15,000 - 0.17%____________________________________________________________________________________________________________________Total Current Resources 4,168,031 4,256,359 4,172,700 4,172,700 4,140,200 (0.78%) 45.95%____________________________________________________________________________________________________________________From 2502: SDC-I for WWTP SRF debt - 727,300 1,424,100 1,424,100 1,467,400 3.04% 16.29%____________________________________________________________________________________________________________________Total Transfers In - 727,300 1,424,100 1,424,100 1,467,400 3.04% 16.29%____________________________________________________________________________________________________________________Beginning Balance 5,393,196 4,066,401 3,416,700 3,416,700 3,403,000 (0.40%) 37.76%____________________________________________________________________________________________________________________Total Resources 9,561,227$ 9,050,060$ 9,013,500$ 9,013,500$ 9,010,600$ (0.03%) 100.00%________________________________________________________________________________________________________________________________________________________________________________________________________________________________________
Adopted Requirements Debt Adopted % of Fundby Program and Type Service Budget Budget____________________________________________________________________________________________________________________Sewer Debt Service 9,010,600$ 9,010,600$ 100.00%____________________________________________________________________________________________________________________Total Requirements 9,010,600$ 9,010,600$ 100.00%____________________________________________________________________________________________________________________Percent of Budget 100.00% 100.00%__________________________________________________________________________________________________________________________________________________________________________________________________________________________
Adopted Budget Final Debt AdoptedDetail of Debt Service Maturity Principal Interest Reserve Budget_________________________________________________________________________________________________________________________WWTP SRF Loan 10/01/2029 3,839,900$ 1,757,700$ 3,413,000$ 9,010,600$ _________________________________________________________________________________________________________________________Totals 3,839,900$ 1,757,700$ 3,413,000$ 9,010,600$ __________________________________________________________________________________________________________________________________________________________________________________________________________________________________________________
WWTP - Wastewater Treatment Plant SDC - Systems Development ChargeSRF - State Revolving Fund
Detailed below are the resources dedicated to fund sewer system debt service. The Sewer Fund currently has one debt service program:Sewer Debt Service. The resource items listed below are included in the Sewer Fund - Resource Detail presented earlier. In Fiscal Year 2016-2017, the Millersburg debt payment was split to reflect the principal and interest payments.
……2016-17……
296

SEWER FUNDOPERATION AND MAINTENANCE COMBINED BUDGET
2017-18 % Change % of2014-15 2015-16 Adopted Revised Adopted from Fund
Resources Actual Actual Budget Budget Budget 2016-17 Budget____________________________________________________________________________________________________________________Storm Drain Plan Review/ Inspection Fees
6,729$ -$ -$ -$ -$ - -
Public Facility Construction Permit 16,051 44,518 5,000 5,000 5,000 - 0.05%Albany Sewer Service Charges 7,691,628 9,174,382 9,671,300 9,671,300 8,622,100 (10.85%) 85.92%Certified Sewer Charges 38,460 46,471 50,000 50,000 50,000 - 0.50%Millersburg O&M Charges 153,480 199,454 150,000 150,000 175,000 16.67% 1.74%Wah Chang O&M Charges 124,664 219,971 125,000 125,000 140,000 12.00% 1.40%Collection Agency Payments 19,812 13,289 5,000 5,000 5,000 - 0.05%Miscellaneous Revenue 20,076 25,113 25,000 25,000 25,000 - 0.25%Interest 9,028 26,002 15,000 15,000 15,000 - 0.15%____________________________________________________________________________________________________________________Total Current Resources 8,079,928 9,749,200 10,046,300 10,046,300 9,037,100 (10.05%) 90.06%________________________________________________________________________________________________________________________________________________________________________________________________________________________________________Beginning Balance 1,386,989 1,017,230 1,001,100 1,001,100 998,300 (0.28%) 9.94%____________________________________________________________________________________________________________________Total Resources 9,466,917$ 10,766,430$ 11,047,400$ 11,047,400$ 10,035,400$ (9.16%) 100.00%________________________________________________________________________________________________________________________________________________________________________________________________________________________________________
Adopted Requirements Materials Transfers Contin- Adopted % of Fundby Program and Type Personnel & Services Capital Out gency Budget Budget____________________________________________________________________________________________________________________Wastewater Treatment Plant 737,400$ 1,833,500$ 67,000$ -$ -$ 2,637,900 26.28%Wastewater Collection 767,900 721,000 11,000 - - 1,499,900 14.95%Wastewater Administration 151,800 3,396,100 - 596,100 994,500 5,138,500 51.20%W t R d Bi lid 8 600 8 600 0 09%
Detailed below are the resources which provide funding for operation and maintenance of the sewer system. Programs funded areSewer Environmental Services, Wastewater Treatment Plant, Wastewater Collection, and Wastewater Administration. The resourceitems listed below are included in the Sewer Fund - Resource Detail presented earlier.
……2016-17……
Water Reuse and Biosolids - 8,600 - - - 8,600 0.09%TWG Wetlands 110,300 149,600 7,000 - - 266,900 2.66%Industrial Pretreatment 341,600 142,000 - - - 483,600 4.82%____________________________________________________________________________________________________________________Total Requirements 2,109,000$ 6,250,800$ 85,000$ 596,100$ 994,500$ 10,035,400$ 100.00%________________________________________________________________________________________________________________________________________________________________________________________________________________________________________Percent of Budget 21.01% 62.29% 0.85% 5.94% 9.91% 100.00%______________________________________________________________________________________________________________________________________________________________________________________________________________________
SEWER OPERATION & MAINTENANCE RESOURCES BY TYPECategory Totals and Percent of Budget
Fees and permits $5,000 (0.05%)
Sewer service charges $8,992,100 (89.61%)
Other resources $40,000 (0.4%)
Beginning balance $998,300 (9.94%)
297

SEWER FUNDCAPITAL AND ECONOMIC DEVELOPMENT COMBINED BUDGET
2017-18 % Change % of2014-15 2015-16 Adopted Revised Adopted from Fund
Resources Actual Actual Budget Budget Budget 2016-17 Budget__________________________________________________________________________________________________________________Storm Dr Plan Review/Insp Fees -$ 25,609$ -$ -$ -$ - - Stormwater Quality Permits - 8,013 - - - - - Sewer SDC: Principal 177,611 4,688 3,000 3,000 2,500 (16.67%) 0.01%Sewer SDC: Interest 4,215 717 600 600 500 (16.67%) - Connection Fees: Principal 6,999 7,097 4,000 4,000 6,000 50.00% 0.03%Connection Fees: Interest 4,980 4,586 3,100 3,100 3,100 - 0.01%General SCF 22,329 7,363 15,000 15,000 10,000 (33.33%) 0.05%Storm Drain Connection Fees 25,692 6,539 - - - - - Connection Fees 33,594 3,876 - - - - - Sewer Systems Development Charges 881,359 752,617 470,000 470,000 715,000 52.13% 3.44%Stormwater In-Lieu of Planting - 20,565 - - - - - Albany Sewer Service Charges 3,471,900 3,235,505 3,092,200 3,092,200 3,270,600 5.77% 15.73%Equipment Replacement Charges 93,200 118,000 118,600 118,600 99,500 (16.10%) 0.48%Financed Asmnts: Principal 19,036 - 5,000 5,000 - (100.00%) - Financed Asmnts: Interest 105 - 100 100 - (100.00%) - Miscellaneous Revenue 7,114 9,481 - - - - - Interest 69,646 148,962 74,300 74,300 81,700 9.96% 0.39%__________________________________________________________________________________________________________________Total Current Resources 4,817,780 4,353,618 3,785,900 3,785,900 4,188,900 10.64% 20.14%__________________________________________________________________________________________________________________Beginning Balance 12,311,993 15,504,705 16,056,100 16,056,100 16,600,200 3.39% 79.86%__________________________________________________________________________________________________________________Total Resources 17,129,773$ 19,858,323$ 19,842,000$ 19,842,000$ 20,789,100$ 14.03% 100.00%____________________________________________________________________________________________________________________________________________________________________________________________________________________________________
SDC System Development Charge SCF Sewer Connection FeeSRF State Revolving Fund
Adopted Requirements Materials Transfers Adopted % of Fundby Program and Type & Services Capital Out Budget Budget__________________________________________________________________________________________________________________Sewer System Capital Projects 405,000$ 15,487,600$ -$ 15,892,600$ 76.45%Sewer Equipment Replacement - 726,200 - 726,200 3.49%Sewer SDC Improvement Fee Projects - 1,627,100 1,467,400 3,094,500 14.89%Sewer SDC Reimbursement Fee Projects - 536,600 - 536,600 2.58%Sewer Economic Development - 539,200 - 539,200 2.59%__________________________________________________________________________________________________________________Total Requirements 405,000$ 18,916,700$ 1,467,400$ 20,789,100$ 100.00%____________________________________________________________________________________________________________________________________________________________________________________________________________________________________Percent of Budget 1.95% 90.99% 7.06% 100.00%________________________________________________________________________________________________________________________________________________________________________________________________________________
Detailed below are the resources used to fund sewer system capital projects and economic development. Programs funded areSewer System Capital Projects, Sewer Equipment Replacement, Sewer SDC Improvement Fee Projects, Sewer SDCReimbursement Fee Projects, Sewer Economic Development, Wastewater Facilities Improvement, and Wetlands TreatmentProject. The resource items listed below are included in the Sewer Fund - Resource Detail presented earlier.
……2016-17……
298

WaterWastewater Wastewater Reuse and TWG
Project Description Totals Collection Administration Biosolids Wetlands_________________________________________________________________________________________________________________Capital Equipment 85,000$ 67,000$ 11,000$ -$ 7,000$ SS-17-01 Cox Creek Interceptor P7 1,430,000 - - - - SS-17-02 Cox Creek Interceptor P8 1,184,900 - - - - SS-17-03 2017 Collection System Rehab 765,000 - - - - SS-17-04 Marion Lift Station 70,000 - - - - SS-17-05 Cox Creek Interceptor P10A 1,285,000 - - - - SS-17-09 Lyon & Ellsworth Sewer Imp 245,000 - - - - SS-18-01 2018 Collection System Rehab 1,250,000 - - - - SS-18-02 Hill St Sewer Imp 665,000 - - - - SS-18-03 Santa Maria Sewer Imp 803,000 - - - - WWTP-13-01 WRF Solids Handling Imp Proj 500,000 - - - - _________________________________________________________________________________________________________________Project Totals 8,282,900 67,000 11,000 - 7,000 _________________________________________________________________________________________________________________
Reserve: Pipe Over-sizing 10,000 - - - - Reserve: Connection Fees 462,700 - - - - Reserve: Equipment Replacement 726,200 - - - - Reserve: Capital Projects 5,766,900 - - - - Reserve: Siemens Settlement 3,753,000 - - - - _________________________________________________________________________________________________________________Total Reserves 10,718,800 - - - - _________________________________________________________________________________________________________________Grand Totals 19,001,700$ 67,000$ 11,000$ -$ 7,000$ __________________________________________________________________________________________________________________________________________________________________________________________________________________________________
SUMMARY OF CAPITAL REQUIREMENTS AND CAPITAL RESERVES - FISCAL YEAR 2017-18SEWER FUND
299

Sewer Sewer SDC SDC SewerSystem Equipment Improve- Reimburse- EconomicCapital Replace- ment Fee ment Fee Develop-Projects ment Projects Projects ment Project Description__________________________________________________________________________________________________________________
-$ -$ -$ -$ -$ Capital Equipment1,430,000 - - - - SS-17-01 Cox Creek Interceptor P7
800,000 - 384,900 - - SS-17-02 Cox Creek Interceptor P8765,000 - - - - SS-17-03 2017 Collection System Rehab
70,000 - - - - SS-17-04 Marion Lift Station1,285,000 - - - - SS-17-05 Cox Creek Interceptor P10A
245,000 - - - - SS-17-09 Lyon & Ellsworth Sewer Imp1,250,000 - - - - SS-18-01 2018 Collection System Rehab
665,000 - - - - SS-18-02 Hill St Sewer Imp647,200 - 155,800 - - SS-18-03 Santa Maria Sewer Imp500,000 - - - - WWTP-13-01 WRF Solids Handling Imp Proj__________________________________________________________________________________________________________________
7,657,200 - 540,700 - - Project Totals__________________________________________________________________________________________________________________
- - 10,000 - - Reserve: Pipe Over-sizing462,700 - - - - Reserve: Connection Fees
- 726,200 - - - Reserve: Equipment Replacement3,614,700 - 1,076,400 536,600 539,200 Reserve: Capital Projects3,753,000 - - - - Reserve: Siemens Settlement__________________________________________________________________________________________________________________7,830,400 726,200 1,086,400 536,600 539,200 Total Reserves__________________________________________________________________________________________________________________
15,487,600$ 726,200$ 1,627,100$ 536,600$ 539,200$ Grand Totals____________________________________________________________________________________________________________________________________________________________________________________________________________________________________
300

PROGRAM NARRATIVE
SEWER FUND: WASTEWATER TREATMENT PLANT (601-50-2404) Responsible Manager/Title: Kristin Preston – Utility Superintendent - Wastewater
Developed By: Scott LaRoque, Wastewater Treatment Plant Supervisor
FUNCTIONS AND RESPONSIBILITIES
This activity funds the operation of the Albany- Millersburg Water Reclamation Facility (A-M WRF).
The A-M WRF processes domestic and industrial wastewater from the City of Albany and domestic wastewater from the City of Millersburg.
Is compliant by maintaining effluent quality within limits established in the City’s National Pollutant Discharge Elimination System Permit.
Maintains the Peak Performance Award from the National Association of Clean Water Agencies for treatment performance.
Maintains management and operational practices commensurate with the City’s Biosolids Management Program.
STRATEGIES/ACTIONS
Strategic Plan Theme
Target Date Status Strategies/Actions
Budget Year 2016-2017
Great Neighborhoods 06/17 Completed Maintain an effective short-term sludge management system which will minimize operator involvement, control odors, and reduce costs for hauling and disposal.
Healthy Economy 06/17 Completed Reduce energy usage by 3% per year for three years.
Effective Government 06/17 In Progress Reinitiate a sustainable biosolids reuse program through the design, construction, start-up, and successful operation of a solids stabilization and biosolids land application program.
Budget Year 2017-2018
Great Neighborhoods 06/18 Reduce odor notifications by means of increased communication to neighboring homes regarding plant activities and maintenance.
Healthy Economy 06/18 Participate in energy management activities to further reduce energy consumption annually by 2% and maintain energy saving processes and policies.
Effective Government 06/18 Participate in the planning, design, and construction of processes in order to re-establish the City’s biosolids re-use program.
PERFORMANCE MEASURES AND WORKLOAD INDICATORS
2014-2015 2015-2016 2016-2017 2017-2018 Wastewater treated annually (million gallons). 2,940 3,240 3,440 3,200 Percentage of days facility is in regulatory compliance. 99.5% 100% 100% 100% Cost/wet ton sludge hauling. $49.42 $53.46 $56.50 $58.20 Award for operational excellence from the National Association of Clean Water Agencies.
Silver Gold Gold Gold
Odor notifications. 13 9 4 0
STAFFING SUMMARY
Budgeted FTEs 7.00 7.00 7.00 7.00
301

601: Sewer
50: Public Works
2014-2015 2015-2016 2016-2017 2016-2017 2017-2018 %Description Actual Actual Adopted Revised Adopted Change
EXPENDITURESPersonnel Services 628,638 684,503 744,300 744,300 737,400 (0.93)% Materials & Services 1,942,455 2,255,270 1,675,400 1,675,400 1,833,500 9.44 % Capital - 90,471 40,000 40,000 67,000 67.50 % TOTAL EXPENDITURES 2,571,093 3,030,244 2,459,700 2,459,700 2,637,900 7.24 %
CITY OF ALBANY, OREGONPROG 2404: Wastewater Treatment Plant
302

PROGRAM NARRATIVE
SEWER FUND: WASTEWATER COLLECTION (601-50-2405) Responsible Manager/Title: Kristin Preston, Utility Superintendent – Wastewater
Developed By: Jeff Gill, Wastewater Collections Supervisor
FUNCTIONS AND RESONSIBILITIES To ensure compliance with City of Albany
Standard Construction Specifications, this work group inspects all service replacement connections, including warranty video inspection of all mainline construction projects.
The televising program is on a five-year cycle and provides updated information on needed sanitary mainline repairs and replacements.
The wastewater pipelines are on a four-year cleaning cycle to prevent blockages that could cause overflows. Large diameter mains are cleaned and assessed on a five-year cycle. Root cutting is a two-year process.
Responsible for flow monitoring within the wastewater collection and stormwater systems to monitor flows during routine operations and storm events.
STRATEGIES/ACTIONS
Strategic Plan Theme Target Date Status Strategies/Actions
Budget Year 2016-2017
Safe City 06/17 Completed Complete initial assessment of sewer manholes in system.
Effective Government 06/17 Completed Develop an internal grouting program for manhole repairs.
Safe City 06/17 In Progress Clean and inspect the large effluent pipelines to the river.
Budget Year 2017-2018
Safe City 10/17 Clean and inspect the large effluent pipelines to the river.
Effective Government 06/18 Complete repair projects to gain access to lines that are inaccessible for inspection.
06/18 Install a new flow meter at the College Green Lift Station.
PERFORMANCE MEASURES AND WORKLOAD INDICATORS 2014-2015 2015-2016 2016-2017 2017-2018 Number of sanitary sewer overflows. 6 3 10 0 Volume of sanitary sewer overflows (millions of gallons). 0.45 1.68 3.77 0 Miles of sanitary sewer mainline maintained. 200 201 201 201 Percentage of the sewer system cleaned annually. 45% 47% 30% 30% Percentage of sewer system televised annually. 37% 39% 20% 20%
STAFFING SUMMARY
Budgeted FTEs 10.50 10.50 10.50 7.85
303

601: Sewer
50: Public Works
2014-2015 2015-2016 2016-2017 2016-2017 2017-2018 %Description Actual Actual Adopted Revised Adopted Change
EXPENDITURESPersonnel Services 838,112 853,907 869,000 869,000 767,900 (11.63)% Materials & Services 1,105,207 1,201,750 732,800 732,800 721,000 (1.61)% Capital - - - - 11,000 - %TOTAL EXPENDITURES 1,943,319 2,055,657 1,601,800 1,601,800 1,499,900 (6.36)%
CITY OF ALBANY, OREGONPROG 2405: Wastewater Collection
304

PROGRAM NARRATIVE
SEWER FUND: WASTEWATER ADMINISTRATION (601-50-2407) Responsible Manager/Title: Chris Bailey, Public Works Operations Director
Jeff Blaine, P.E., Public Works Engineering and Community Development Director
FUNCTIONS AND RESPONSIBILITIES
This activity provides funding for the Wastewater Superintendent and the PW Internal Services fund, which includes administration charges and charges for Operations Administration, PW Engineering Services, Water Quality Control Services, and Facilities Engineering.
Maintains the contingency for the Sewer fund.
Maintains a sustainable funding plan for the utility.
Manages permit development, such as the City’s National Pollution Discharge Elimination System (NPDES) permit for the Albany-Millersburg Water Reclamation Facility (A-M WRF), monitors regulatory activities that affect utility operations, and participates in the development of state and federal rules and regulations.
Pays in-lieu-of franchise fees for the sewer utility.
STRATEGIES/ACTIONS
Strategic Plan Theme Target Date Status Strategies/Actions
Budget Year 2016-2017
Safe City 06/17 Completed Update the wastewater treatment facility plan.
Effective Government 06/17 In Progress Adopt updated wastewater System Development Charge methodology incorporating the collection and treatment facility plan updates.
Budget Year 2017-2018
Effective Government 06/18 Adopt updated wastewater System Development Charge methodology.
06/18 Secure new NPDES discharge permit for A-M WRF, if DEQ initiates permit renewal for Albany.
STAFFING SUMMARY 2014-2015 2015-2016 2016-2017 2017-2018
Budgeted FTEs 1.00 1.00 1.00 1.00
305

601: Sewer
50: Public Works
2014-2015 2015-2016 2016-2017 2016-2017 2017-2018 %Description Actual Actual Adopted Revised Adopted Change
EXPENDITURESPersonnel Services 133,320 133,468 144,800 144,800 151,800 4.83 % Materials & Services 2,133,009 2,416,566 3,634,500 3,634,500 3,396,100 (6.56)% Transfers Out 562,783 638,443 1,335,700 1,335,700 596,100 (55.37)% Contingencies - - 975,000 975,000 994,500 2.00 % TOTAL EXPENDITURES 2,829,112 3,188,477 6,090,000 6,090,000 5,138,500 (15.62)%
CITY OF ALBANY, OREGONPROG 2407: Wastewater Administration
306

PROGRAM NARRATIVE
SEWER FUND: WATER REUSE & BIOSOLIDS (601-50-2410) Responsible Manager/Title: Kristin Preston, Utility Superintendent - Wastewater
Developed By: Scott LaRoque, Wastewater Treatment Plant Supervisor
FUNCTIONS AND RESPONSIBILITIES
Ensure that biosolids generated at the Albany-Millersburg Water Reclamation Facility (A-M WRF) are beneficially reused in conformance with state and federal regulations.
This program is responsible for biosolids storage and agriculture application.
This program is currently in a transitional phase pending resolution of the solids stabilization system limitations resulting from the failed Cannibal solids reduction system.
STRATEGIES/ACTIONS
Strategic Plan Theme Target Date Status Strategies/Actions
Budget Year 2016-2017
Safe City Effective Government
06/17 In Progress Continue to coordinate with A-M WRF, consultants, and other City personnel to determine a viable Class A or B biosolids option and equipment needs.
Budget Year 2017-2018
Safe City Effective Government
06/18 Continue to coordinate with A-M WRF, consultants, and other City personnel to determine a viable Class A or B biosolids option and equipment needs.
PERFORMANCE MEASURES AND WORKLOAD INDICATORS 2014-2015 2015-2016 2016-2017 2017-2018Dry tons of biosolids applied per year/percentage of biosolids applied for beneficial agriculture use. 0/0% 0/0% 0/0% 0/0%
307

601: Sewer
50: Public Works
2014-2015 2015-2016 2016-2017 2016-2017 2017-2018 %Description Actual Actual Adopted Revised Adopted Change
EXPENDITURESMaterials & Services 5,446 21,376 9,000 9,000 8,600 (4.44)% TOTAL EXPENDITURES 5,446 21,376 9,000 9,000 8,600 (4.44)%
CITY OF ALBANY, OREGONPROG 2410: Water Reuse and Biosolids
308

PROGRAM NARRATIVE
SEWER FUND: TWG WETLANDS (601-50-2411) Responsible Manager/Title: Kristin Preston, Utility Superintendent – Wastewater
Prepared By: Scott LaRoque, Wastewater Treatment Plant Supervisor
FUNCTIONS AND RESPONSIBILITIES
This activity funds the operation and maintenance of Talking Water Gardens (TWG) in coordination with the City of Millersburg and ATI Wah Chang.
Monitor vegetation and add native plants as necessary to increase diversity. Use wetland as nursery for other plantings. Control invasive species.
Ensure that TWG is operated and managed to provide maximum protection to the Willamette River, and to provide compliance with temperature allocations under the Willamette Total Maximum Daily Load (TMDL).
Encourage public involvement at Talking Water Gardens by providing community group and educational tours and outreach programs.
STRATEGIES/ACTIONS
Strategic Plan Theme Target Date Status Strategies/Actions
Budget Year 2016-2017
Safe City Great Neighborhoods
06/17 In Progress Complete the installation of visitor information kiosk and bike rack.
Safe City
06/17
Completed Implement Integrated Pest Management (IPM) strategies to minimize potential harm to people, property, and the environment.
Safe City Effective Government
06/17
Completed Update and improve wetland monitoring capability to aid understanding of wetland performance.
Budget Year 2017-2018
Great Neighborhoods 12/17 Complete the installation of a visitor bike rack.
Safe City
04/18
Complete installation of security camera to monitor and protect facilities from vandalism.
PERFORMANCE MEASURES AND WORKLOAD INDICATORS
2014-2015 2015-2016 2016-2017 2017-2018
Shade plant coverage of the wetland ponds. 45% 65% 73% 80%
Number of TWG tours or events/participants. 24/721 33/1,012 30/1,000 30/1,000
STAFFING SUMMARY Budgeted FTEs 1.00 1.00 1.00 1.00
309

601: Sewer
50: Public Works
2014-2015 2015-2016 2016-2017 2016-2017 2017-2018 %Description Actual Actual Adopted Revised Adopted Change
EXPENDITURESPersonnel Services 77,507 91,505 101,500 101,500 110,300 8.67 % Materials & Services 156,231 158,332 164,300 164,300 149,600 (8.95)% Capital 1,271 57,157 - - 7,000 - %TOTAL EXPENDITURES 235,009 306,994 265,800 265,800 266,900 0.41 %
CITY OF ALBANY, OREGONPROG 2411: TWG Wetlands
310

PROGRAM NARRATIVE
SEWER FUND: INDUSTRIAL PRETREATMENT (601-50-2413) Responsible Manager/Title: Kristin Preston, Utility Superintendent – Wastewater
Developed by: Mark Humphrey, Industrial Pretreatment Supervisor
FUNCTIONS AND RESPONSIBILITIES
This activity funds the Industrial Pretreatment Program, a regulatory program required by the National Pollutant Discharge Elimination System (NPDES) wastewater permit.
Permits, inspects, and monitors industrial sewer users under federal and state regulations. Commercial and minor industrial sewer users in Albany and Millersburg are inspected regularly under the industrial survey.
Performs plan reviews and code enforcement as related to environmental programs concerns.
This program also samples and reports on wet-weather sewer overflows as required by the Oregon Department of Environmental Quality (ODEQ) and responds to spills to the wastewater collection or stormwater systems.
Staff evaluates and revises major program documents as needed, including Albany Municipal Code Chapter 10.06 (Wastewater Collection and Treatment System-Regulation of Industrial Wastes).
Responds to problem discharges including expansion of the fats, oil, and grease (FOG) program.
STRATEGIES/ACTIONS
Strategic Plan Theme Target Date Status Strategies/Actions
Budget Year 2016-2017
Safe City
06/17 Completed
Identify new pretreatment activities required to comply with impending DEQ wastewater treatment plant permit renewal.
Effective Government 06/17 Completed
Assess and develop a strategy for sampling protocols to meet pending new permit requirements.
Safe City 06/17 In Progress Complete Local Limits evaluation.
Effective Government 06/17 In Progress Create inventory of grease-retention devices.
Budget Year 2017-2018
Safe City 06/18 Complete Local Limits evaluation.
Effective Government 06/18 Create an inventory of grease-retention devices.
06/18 Update all Standard Operating Procedures
(SOPs). Safe City 06/18
Develop new SOPs for hazardous waste, universal waste, Fire Marshal reports, and pesticide reporting. Provide Operations-wide training for waste disposal protocols.
PERFORMANCE MEASURES AND WORKLOAD INDICATORS 2014-2015 2015-2016 2016-2017 2017-2018 Number of responses to sewer and stormwater complaints or spills.
73 41 54 54
Number of Significant Industrial User (SIU) permits. 14 15 15 15 Number of Non-Discharging Categorical Industrial User (NDCIU) permits.
5 5 5 5
Number of non-SIU (general) permits. 6 7 7 7 Number of non-permitted businesses in the Pretreatment Program.
436 435 440 440
Number of inspections by Pretreatment staff. 34 54 32 32
STAFFING SUMMARY Budgeted FTEs 4.00 4.00 4.00 3.00
311

601: Sewer
50: Public Works
2014-2015 2015-2016 2016-2017 2016-2017 2017-2018 %Description Actual Actual Adopted Revised Adopted Change
EXPENDITURESPersonnel Services 407,268 422,950 465,300 465,300 341,600 (26.58)% Materials & Services 131,049 127,496 155,800 155,800 142,000 (8.86)% TOTAL EXPENDITURES 538,317 550,446 621,100 621,100 483,600 (22.14)%
CITY OF ALBANY, OREGONPROG 2413: Industrial Pretreatment
312

PROGRAM NARRATIVE
SEWER FUND: SEWER SYSTEM CAPITAL PROJECTS (601-50-2500) Responsible Manager/Title: Staci Belcastro, P.E., City Engineer
FUNCTIONS AND RESPONSIBILITIES
This activity provides very limited funding to repair,
replace, or upgrade treatment facilities, pumping stations, and collection systems.
Funding provided through this budget is used to repair or replace sewer system facilities, equipment, and structures that are not accumulating a depreciation reserve from a specific replacement schedule.
Identify and complete capacity-increasing improvements necessary to support economic development and future growth.
Eliminate basement flooding by replacing inadequate piping in the collection system and managing the Sewer Lateral Replacement Program.
Prevent sanitary sewer overflows by completing projects to reduce infiltration and inflow into the sanitary sewer system.
Continue perpetual life replacement program of failing (cracked, collapsing) sewer pipes as funds become available.
STRATEGIES/ACTIONS
Strategic Plan Theme Target Date Status Strategies/Actions
Budget Year 2016-2017 Safe City 10/16 Completed Construct SS-16-01, 2016 Pipe
Replacement Projects.
10/16 Completed Construct SS-16-02, Umatilla LS & FM Improvements.
10/16 Completed Construct SS-16-04, Collection System Access Improvements.
06/17 In Progress Construct SS-17-01, Cox Creek Interceptor P7.
06/17 In Progress Construct SS-17-02, Cox Creek Interceptor P8.
06/17 In Progress Construct SS-17-03, 2017 Collection System Rehabilitation Improvements.
06/17 In Progress Construct SS-17-04, Marion Lift Station.
06/17 In Progress Construct SS-17-05, Cox Creek Interceptor P10a.
Budget Year 2017-2018 Safe City 06/18 Construct SS-17-01, Cox Creek Interceptor
P7.
06/18 Construct SS-17-02, Cox Creek Interceptor P8.
06/18 Construct SS-17-03, 2017 Collection System Rehabilitation Improvements.
06/18 Construct SS-17-04, Marion Lift Station.
06/18 Construct SS-17-05, Cox Creek Interceptor P10a.
06/18 Construct SS-18-01, 2018 Collection System Rehabilitation.
06/18 Construct SS-18-03, Santa Maria Sewer Extension.
313

601: Sewer
50: Public Works
2014-2015 2015-2016 2016-2017 2016-2017 2017-2018 %Description Actual Actual Adopted Revised Adopted Change
REVENUESLicenses and Fees 59,216 18,603 21,000 21,000 18,000 (14.29)% Charges for Services 3,271,900 2,994,900 2,992,200 2,992,200 3,270,600 9.30 % Miscellaneous Revenue 2,439 7,830 - - - - %Investment Income 43,562 114,557 51,500 51,500 61,200 18.83 % Beginning Balance 8,091,850 10,029,688 11,219,400 11,219,400 12,542,800 11.80 % TOTAL REVENUES 11,468,967 13,165,578 14,284,100 14,284,100 15,892,600 11.26 %
EXPENDITURESMaterials & Services 384,468 277,069 540,000 540,000 405,000 (25.00)% Capital 939,758 1,475,338 13,744,100 13,744,100 15,487,600 12.69 % Transfers Out 115,052 - - - - - %TOTAL EXPENDITURES 1,439,278 1,752,407 14,284,100 14,284,100 15,892,600 11.26 %
Prog 2500: Sewer System Capital Projects Revenues less Expenditures 10,029,689 11,413,171 - - -
CITY OF ALBANY, OREGONPROG 2500: Sewer System Capital Projects
314

PROGRAM NARRATIVE
SEWER FUND: SEWER EQUIPMENT REPLACEMENT (601-50-2501) Responsible Manager/Title: Jeff Babbitt, Public Works Business Manager
FUNCTIONS AND RESPONSIBILITIES This program funds replacement of sewer system
equipment in accordance with an established depreciation and replacement schedule.
Receive revenues from other sewer fund budgets to fund future equipment replacement.
STRATEGIES/ACTIONS
Strategic Plan Theme
Target Date Status Strategies/Actions
Budget Year 2016-2017
Effective Government
06/17 Completed Receive revenues from other sewer fund budgets to fund future equipment replacement.
Budget Year 2017-2018
Effective Government
06/18 Receive revenues from other sewer fund budgets to fund future equipment replacement.
315

601: Sewer
50: Public Works
2014-2015 2015-2016 2016-2017 2016-2017 2017-2018 %Description Actual Actual Adopted Revised Adopted Change
REVENUESCharges for Services 93,200 118,000 118,600 118,600 99,500 (16.10)% Miscellaneous Revenue 4,675 1,651 - - - - %Investment Income 4,785 5,548 2,000 2,000 3,500 75.00 % Beginning Balance 951,403 938,857 655,800 655,800 623,200 (4.97)% TOTAL REVENUES 1,054,063 1,064,056 776,400 776,400 726,200 (6.47)%
EXPENDITURESCapital 115,207 564,321 776,400 776,400 726,200 (6.47)% TOTAL EXPENDITURES 115,207 564,321 776,400 776,400 726,200 (6.47)%
Prog 2501: Sewer Equipment Replacement Revenues less Expenditures 938,856 499,735 - - -
CITY OF ALBANY, OREGONPROG 2501: Sewer Equipment Replacement
316

PROGRAM NARRATIVE
SEWER FUND: SEWER SDC IMPROVEMENT FEE PROJECTS (601-50-2502) Responsible Manager/Title: Staci Belcastro, P.E., City Engineer
FUNCTIONS AND RESPONSIBILITIES This program is dedicated to funding eligible,
capacity-increasing projects that are a direct result of new growth and development. Revenues are received from System Development Charges (SDC).
In 1989, legislation was adopted in Oregon requiring justification and separate accounting of revenues and expenditures for all SDCs effective July 1, 1991. This budget was created in order to comply with that legislation.
Maintain a reserve for future participation in funding of eligible over-sizing of capital projects. Maximum reserve of $50,000.
Provide funding for pipe over-sizing as needed.
In January 2000, the City Council accepted the Mayor’s Wastewater Task Force-recommended sewer SDC fees designed to recognize wastewater strength and to fund growth-related improvements identified in the Wastewater Facility Plan through the SDC improvement fee. The current wastewater SDC fee for a single-family residence is $3,031 (effective July 2016). This program receives $2,902 of the fee.
This budget receives in-lieu-of assessment receipts from the former North Albany Sewer Health Project area to repay this program for a Fiscal Year 1995-1996 transfer used to retire the North Albany construction bonds.
Identify and complete capacity-increasing improvements necessary to support economic development and future growth.
STRATEGIES/ACTIONS
Strategic Plan Theme Target Date Status Strategies/Actions
Budget Year 2016-2017
Effective Government 06/17 Completed Build reserves for future planned projects and for debt service payments due for the Water Reclamation Facility and Talking Water Gardens State Revolving Fund loan.
06/17 In Progress Construct SS-17-02, Cox Creek Interceptor P8.
Budget Year 2017-2018
Effective Government 06/18 Build reserves for future planned projects and for debt service payments due for the Water Reclamation Facility and Talking Water Gardens State Revolving Fund loan.
06/18 Construct SS-17-02, Cox Creek Interceptor P8.
06/18 Construct SS-18-03, Santa Maria Sewer Extension.
317

601: Sewer
50: Public Works
2014-2015 2015-2016 2016-2017 2016-2017 2017-2018 %Description Actual Actual Adopted Revised Adopted Change
REVENUESLicenses and Fees 987,776 730,345 453,000 453,000 676,000 49.23 % Assessment Revenue 19,141 - 5,100 5,100 - (100.00)% Investment Income 16,056 22,083 15,800 15,800 12,000 (24.05)% Beginning Balance 2,366,553 3,389,516 3,174,600 3,174,600 2,406,500 (24.20)% TOTAL REVENUES 3,389,526 4,141,944 3,648,500 3,648,500 3,094,500 (15.18)%
EXPENDITURESCapital 9 - 2,224,400 2,224,400 1,627,100 (26.85)% Transfers Out - 727,300 1,424,100 1,424,100 1,467,400 3.04 % TOTAL EXPENDITURES 9 727,300 3,648,500 3,648,500 3,094,500 (15.18)%
Prog 2502: Sewer SDC Improvement Fee Projects Revenues less Expenditures 3,389,517 3,414,644 - - -
CITY OF ALBANY, OREGONPROG 2502: Sewer SDC Improvement Fee Projects
318

PROGRAM NARRATIVE
SEWER FUND: SEWER SDC REIMBURSEMENT FEE PROJECTS (601-50-2503) Responsible Manager/Title: Staci Belcastro, P.E., City Engineer
FUNCTIONS AND RESPONSIBILITIES Revenues are received from System Development
Charges (SDCs). These revenues reimburse the City for past investments in capacity-increasing projects identified in the City’s adopted sewer SDC methodology.
Funding provided through this program is used to complete capital projects within the sewer system.
In 1989 legislation was adopted in Oregon requiring justification and separate accounting of revenues and expenditures for all SDCs. This program complies with that legislation.
In January 2000, the City Council accepted the Mayor’s Wastewater Task Force-recommended sewer SDC fees designed to recover the value of available system capacity through the SDC reimbursement fee. The current wastewater SDC fee for a single-family residence is $3,031 (effective July 2016). This program receives $129 of the fee.
STRATEGIES/ACTIONS
Strategic Plan Theme Target Date Status Strategies/Actions
Budget Year 2016-2017
Effective Government 06/17 Completed Build reserves for future projects.
Budget Year 2017-2018
Effective Government 06/18 Build reserves for future projects.
319

601: Sewer
50: Public Works
2014-2015 2015-2016 2016-2017 2016-2017 2017-2018 %Description Actual Actual Adopted Revised Adopted Change
REVENUESLicenses and Fees 109,788 31,996 21,700 21,700 43,100 98.62 % Investment Income 2,094 2,962 2,300 2,300 2,400 4.35 % Beginning Balance 323,380 435,263 459,700 459,700 491,100 6.83 % TOTAL REVENUES 435,262 470,221 483,700 483,700 536,600 10.94 %
EXPENDITURESCapital - - 483,700 483,700 536,600 10.94 % TOTAL EXPENDITURES - - 483,700 483,700 536,600 10.94 %
Prog 2503: Sewer SDC Reimbursement Fee Projects Revenues less Expenditures 435,262 470,221 - - -
CITY OF ALBANY, OREGONPROG 2503: Sewer SDC Reimbursement Fee Projects
320

PROGRAM NARRATIVE
SEWER FUND: SEWER DEBT SERVICE (601-50-2504) Responsible Manager/Title: Jeff Babbitt, Public Works Business Manager
FUNCTIONS AND RESPONSIBILITIES This program provides for the principal,
interest, and .5% annual fee payments on the State Revolving Fund (SRF) loan associated with the 2009 Wastewater Treatment Plant.
A reserve is required in the amount of $2,402,925.
This program provides for the principal and interest payments on the Wetlands land acquisition loan.
This program provides for the principal and .5% annual fee payments on the SRF loan associated with the Wetlands Treatment Project.
A reserve is required in the amount of $50,000.
MATURITY SCHEDULE
Fiscal Year Principal Interest Annual Fee Total
2017-2018 3,260,904 1,448,182 243,588 4,952,674
2018-2028 38,601,348 8,489,512 1,452,003 48,542,863
2028-2030 6,855,319 208,309 45,874 7,109,502Totals (SRF - A-M
WRF) $ 48,717,571 $ 10,146,003 $ 1,741,465 $ 60,605,039
SRF - Wetlands Treatment Project
2017-2018 100,000 0 7,250 107,250
2018-2028 1,000,000 0 45,000 1,045,000
2028-2032 350,000 0 4,000 354,000
Totals (SRF - Wetlands) $ 1,450,000 -$ $ 56,250 $ 1,506,250 Wetlands Land Acquisition
2017-2018 441,416 58,584 0 500,000
2018-2021 1,023,180 66,958 0 1,090,138Totals (Wetlands Land
Acquisition) $ 1,464,596 $ 125,542 -$ $ 1,590,138 DEBT SUMMARY
Issue Original Amount Principal Balance Required Reserve
SRF Loan (A-M WRF) 69,000,000 48,717,571 2,402,925
SRF Loan (Wetlands) 4,000,000 1,450,000 50,000
Wetlands Land Acquisition 4,114,000 1,464,596 -
Totals $ 77,114,000 $ 51,632,167 $ 2,452,925
321

601: Sewer
50: Public Works
2014-2015 2015-2016 2016-2017 2016-2017 2017-2018 %Description Actual Actual Adopted Revised Adopted Change
REVENUESIntergovernmental Revenue 405,650 416,508 415,200 415,200 413,900 (0.31)% Charges for Services 3,735,300 3,821,600 3,742,500 3,742,500 3,711,300 (0.83)% Investment Income 27,081 18,251 15,000 15,000 15,000 - %Transfers In - 727,300 1,424,100 1,424,100 1,467,400 3.04 % Beginning Balance 5,393,196 4,066,401 3,416,700 3,416,700 3,403,000 (0.40)% TOTAL REVENUES 9,561,227 9,050,060 9,013,500 9,013,500 9,010,600 (0.03)%
EXPENDITURESDebt Service 5,494,826 5,629,989 9,013,500 9,013,500 9,010,600 (0.03)% TOTAL EXPENDITURES 5,494,826 5,629,989 9,013,500 9,013,500 9,010,600 (0.03)%
Prog 2504: Sewer Debt Service Revenues less Expenditures 4,066,401 3,420,071 - - -
CITY OF ALBANY, OREGONPROG 2504: Sewer Debt Service
322

PROGRAM NARRATIVE
SEWER FUND: SEWER ECONOMIC DEVELOPMENT (601-50-2506) Responsible Manager/Title: Staci Belcastro, P.E., City Engineer
FUNCTIONS AND RESPONSIBILITIES This program annually receives up to $100,000
from service charges to help fund economic development-related capital projects as approved by the City Council.
Fund balance for this program will be capped at $500,000.
Council authorization to annually fund this program began in Fiscal Year 2003-2004.
STRATEGIES/ACTIONS
Strategic Plan Theme Target Date Status Strategies/Actions
Budget Year 2016-2017
Effective Government 10/16 Completed Construct SS-16-07, Lochner Road Sewer.
06/17 Completed Complete Elevation Certificates for North Albany property owners facing potential negative financial impacts as a result of the Federal Emergency Management Agency’s (FEMA) new floodplain maps.
Budget Year 2017-2018
Effective Government 06/18 Build reserves for future projects.
323
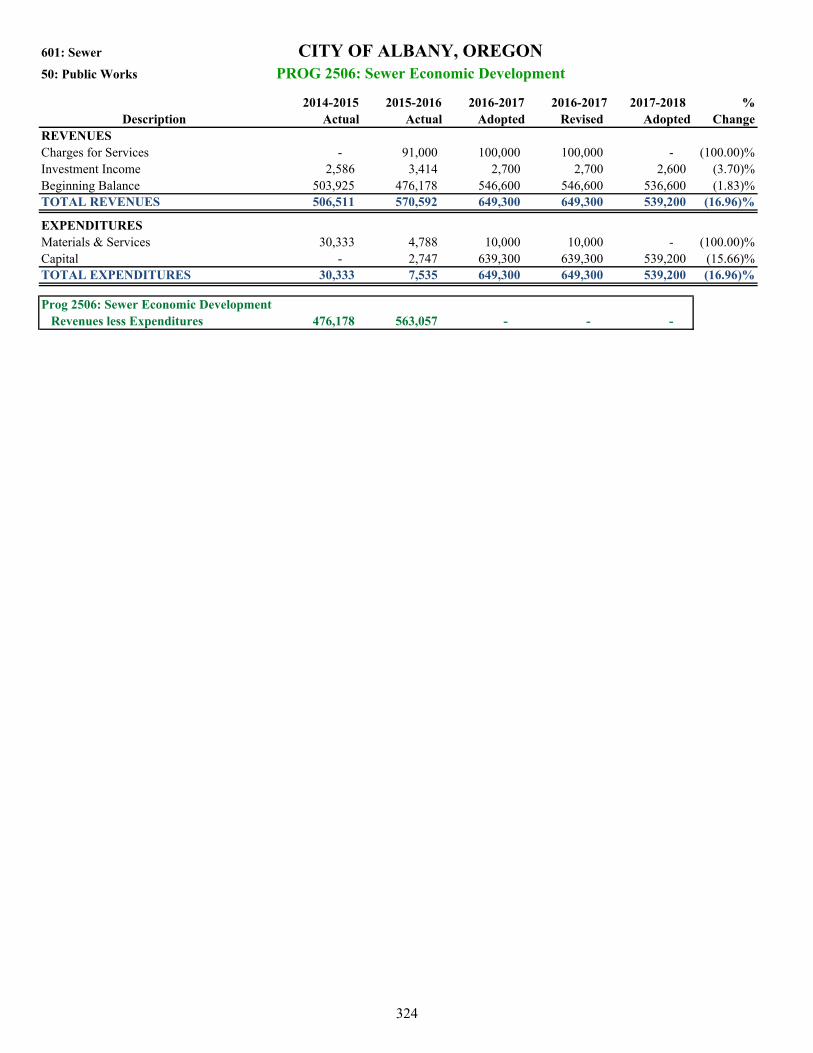
601: Sewer
50: Public Works
2014-2015 2015-2016 2016-2017 2016-2017 2017-2018 %Description Actual Actual Adopted Revised Adopted Change
REVENUESCharges for Services - 91,000 100,000 100,000 - (100.00)% Investment Income 2,586 3,414 2,700 2,700 2,600 (3.70)% Beginning Balance 503,925 476,178 546,600 546,600 536,600 (1.83)% TOTAL REVENUES 506,511 570,592 649,300 649,300 539,200 (16.96)%
EXPENDITURESMaterials & Services 30,333 4,788 10,000 10,000 - (100.00)% Capital - 2,747 639,300 639,300 539,200 (15.66)% TOTAL EXPENDITURES 30,333 7,535 649,300 649,300 539,200 (16.96)%
Prog 2506: Sewer Economic Development Revenues less Expenditures 476,178 563,057 - - -
CITY OF ALBANY, OREGONPROG 2506: Sewer Economic Development
324

WATER FUNDRESOURCE DETAIL
2017-18 % Change % of
2014-15 2015-16 Adopted Revised Adopted from FundResources Actual Actual Budget Budget Budget 2016-17 Budget_________________________________________________________________________________________________________________Property Taxes - Delinquent 3,588$ 263$ -$ -$ -$ - - Water SDC: Principal 23,544 2,013 3,500 3,500 1,500 (57.14%) 0.01%Water SDC: Interest 599 176 300 300 200 (33.33%) - Water Connection Fees 22,202 25,135 15,000 15,000 20,000 33.33% 0.08%Water SDC 382,329 385,485 350,000 350,000 383,000 9.43% 1.44%Public Facility Construction Permit 54,640 77,377 10,000 10,000 10,000
- 0.04%
Water Service Installation Charge 106,547 109,804 60,000 60,000 60,000
- 0.23%
WComp Wage Subsidy Reimb - 2,535 - - - - - City of Lebanon 77,000 77,000 633,000 633,000 383,000 (39.49%) 1.44%Hydropower Revenue 68,295 77,273 70,000 70,000 70,000 - 0.26%Millersburg Service Charges 249,269 360,622 240,000 240,000 240,000 - 0.90%Dumbeck Water District 65,728 64,041 57,000 57,000 55,000 (3.51%) 0.21%Albany Water Service Charges 11,795,552 12,229,733 12,371,900 12,371,900 11,985,200 (3.13%) 45.16%Capital Charges 109,300 111,400 113,100 113,100 109,800 (2.92%) 0.41%Collection Agency Payments 14,960 11,751 7,500 7,500 7,500 - 0.03%Equipment Replacement Charges 174,000 146,400 215,600 215,600 117,500 (45.50%) 0.44%Miscellaneous Revenue 25,274 9,420 6,000 6,000 6,000 - 0.02%Over & short (349) (130) - - - - - Interest 67,665 120,964 54,300 54,300 64,400 18.60% 0.24%_________________________________________________________________________________________________________________Total Current Resources 13,240,143 13,811,262 14,207,200 14,207,200 13,513,100 (4.89%) 50.91%_________________________________________________________________________________________________________________From Water SDC-I 384,900 402,100 419,300 419,300 214,300 (48.89%) 0.81%From: Water SDC-R - - - - 224,300 - 0.85%_________________________________________________________________________________________________________________Total Transfers In 384,900 402,100 419,300 419,300 438,600 4.60% 1.66%_________________________________________________________________________________________________________________Beginning Balance 10,361,557 12,419,656 9,721,400 9,721,400 10,984,900 13.00% 41.39%Reserved Beginning Balance 1,621,904 1,632,354 1,607,400 1,607,400 1,602,000 (0.34%) 6.04%_________________________________________________________________________________________________________________Total Resources 25,608,504$ 28,265,372$ 25,955,300$ 25,955,300$ 26,538,600$ 2.25% 100.00%__________________________________________________________________________________________________________________________________________________________________________________________________________________________________
SDC - System Development ChargesSDC-I - System Development Charge Improvement Fee
……2016-17……
325

WATER FUNDREQUIREMENT/STAFFING SUMMARIES
2014-15 2015-16Program Requirements Actual Actual Adopted Revised Proposed Approved Adopted______________________________________________________________________________________________________________________Water Administration 2,859,999$ 3,040,066$ 5,298,400$ 5,298,400$ 4,689,100$ 4,689,100$ 4,689,100$ Water Canal Maintenance 749,285 781,718 855,100 855,100 886,900 886,900 886,900 Vine Street WTP 873,962 1,065,494 939,400 939,400 993,200 993,200 993,200 Water Distribution 1,850,785 2,025,713 2,061,600 2,061,600 2,039,800 2,039,800 2,039,800 Albany-Millersburg WTP 1,469,186 1,600,473 1,416,600 1,416,600 1,899,500 1,899,500 1,899,500 SDC Improvement Fee Projects 389,061 402,100 442,800 442,800 357,900 357,900 357,900 SDC Reimbursement Fee Projects - - 1,056,900 1,056,900 1,071,500 1,071,500 1,071,500 Water Debt Service 1,928,194 1,931,594 3,533,400 3,533,400 3,538,600 3,538,600 3,538,600 Water System Capital Projects 1,185,920 4,681,584 7,785,200 7,785,200 9,039,600 9,039,600 9,039,600 Water Economic Development - 2,684 625,000 625,000 591,300 591,300 591,300 N. Albany Water Capital Projects 199,249 - 678,200 678,200 792,500 792,500 792,500 Water Equipment Replacement 50,854 359,324 1,262,700 1,262,700 638,700 638,700 638,700 ______________________________________________________________________________________________________________________Total Requirements 11,556,495$ 15,890,750$ 25,955,300$ 25,955,300$ 26,538,600$ 26,538,600$ 26,538,600$ ____________________________________________________________________________________________________________________________________________________________________________________________________________________________________________
Requirements by Type______________________________________________________________________________________________________________________Personnel 2,097,263$ 2,245,880$ 2,471,800$ 2,471,800$ 2,515,400$ 2,515,400$ 2,515,400$ Materials & Services 5,281,717 6,086,725 6,580,400 6,580,400 6,023,700 6,023,700 6,023,700 Capital 1,343,752 4,666,790 11,365,300 11,365,300 12,461,900 12,461,900 12,461,900 Transfers Out 905,570 959,762 1,043,400 1,043,400 1,043,700 1,043,700 1,043,700 Debt Service 1,928,194 1,931,594 3,533,400 3,533,400 3,538,600 3,538,600 3,538,600 Contingency - - 961,000 961,000 955,300 955,300 955,300 ______________________________________________________________________________________________________________________Total Requirements 11,556,496$ 15,890,751$ 25,955,300$ 25,955,300$ 26,538,600$ 26,538,600$ 26,538,600$ ____________________________________________________________________________________________________________________________________________________________________________________________________________________________________________
Adopted Requirements Materials Transfers Debt Contin- Adopted % of Fundby Program and Type Personnel & Services Capital Out Service gency Budget Budget________________________________________________________________________________________________________________________________Water Administration 156,100$ 3,047,600$ -$ 530,100$ -$ 955,300$ 4,689,100$ 17.67%Water Canal Maintenance 440,300 398,600 48,000 - - - 886,900 3.34%Vine Street WTP 476,600 498,600 18,000 - - - 993,200 3.74%Water Distribution 965,800 992,500 81,500 - - - 2,039,800 7.69%Albany-Millersburg WTP 476,600 889,900 533,000 - - - 1,899,500 7.16%SDC Improvement Fee Projects - - 143,600 214,300 - - 357,900 1.35%SDC Reimbursement Fee Projects - - 847,200 224,300 - - 1,071,500 4.04%Water Debt Service - - - - 3,538,600 - 3,538,600 13.33%Water System Capital Projects - 196,500 8,768,100 75,000 - - 9,039,600 34.06%Water Economic Development - - 591,300 - - - 591,300 2.23%N. Albany Water Capital Projects - - 792,500 - - - 792,500 2.99%Water Equipment Replacement - - 638,700 - - - 638,700 2.40%________________________________________________________________________________________________________________________________Total Requirements 2,515,400$ 6,023,700$ 12,461,900$ 1,043,700$ 3,538,600$ 955,300$ 26,538,600$ 100.00%________________________________________________________________________________________________________________________________________________________________________________________________________________________________________________________________Percent of Fund Budget 9.48% 22.70% 46.96% 3.93% 13.33% 3.60% 100.00%____________________________________________________________________________________________________________________________________________________________________________________________________________________________________________
2014-15 2015-16Staffing Summary (FTE) Actual Actual Adopted Revised Proposed Approved Adopted______________________________________________________________________________________________________________________Water Administration 1.000 1.000 1.000 1.000 1.000 1.000 1.000 Water Canal Maintenance 3.500 3.500 3.500 3.500 3.500 3.500 3.500 Vine Street WTP 3.250 3.250 4.000 4.000 4.500 4.500 4.500 Water Distribution 9.000 9.000 9.000 9.000 9.000 9.000 9.000 Albany-Millersburg WTP 4.750 4.750 4.000 4.000 4.500 4.500 4.500 ______________________________________________________________________________________________________________________Total FTE 21.500 21.500 21.500 21.500 22.500 22.500 22.500 ____________________________________________________________________________________________________________________________________________________________________________________________________________________________________________
……2016-17…… ……2017-18……
……2016-17…… ……2017-18……
326

WATER FUNDRESOURCES AND REQUIREMENTS
TOTAL WATER FUND RESOURCES BY SOURCE
TOTAL WATER FUND REQUIREMENTS BY TYPE
Intergovernmental resources $383,000
(1.44%)
Charges for services $12,467,500 (46.98%)
Other resources $1,101,200 (4.15%)
Beginning balance $10,984,900 (41.39%)
Reserved beginning balance
$1,602,000 (6.04%)
Transfers Out $1,043,700 (3.93%)
Debt Service $3,538,600 (13.33%)
Contingency $955,300 (3.6%)
USE OF WATER SERVICE CHARGES FOR FISCAL YEAR 2017-18
O & M 8,687,800$ 71.83%Capital 1,914,200 15.83%Debt Service 1,493,000 12.34%_________________________________________________Total Water Service Charges 12,095,000$ 100.00%__________________________________________________________________________________________________
O & M - Operation & Maintenance
Personnel $2,515,400 (9.48%)
Materials & Services $6,023,700 (22.7%)
Capital $12,461,900 (46.96%)
O & M $8,687,800 (71.83%)
Capital $1,914,200 (15.83%)
Debt Service $1,493,000 (12.34%)
327

WATER FUNDRESOURCESTen Fiscal Years
ChargesFiscal for Property Licenses Other Transfers Debt BeginningYear Services Taxes & Permits Revenues In Proceeds Balance Totals________________________________________________________________________________________________________2009 11,439,042$ 800,750$ 463,332$ 1,243,106$ -$ -$ 17,588,904$ 31,535,134$ 2010 11,533,472 656,587 446,300 1,195,995 - - 16,628,741 30,461,095 2011 10,894,536 27,358 354,748 433,165 - - 13,824,152 25,533,959 2012 11,083,208 25,898 346,576 712,705 - - 14,838,378 27,006,765 2013 11,487,341 10,988 439,437 31,454,823 - - 14,413,702 57,806,291 2014 11,884,427 2,298 618,497 470,375 - - 12,644,224 25,619,821 2015 12,303,104 3,588 589,862 343,590 - - 11,983,461 25,223,605 2016 12,854,820 263 599,989 356,191 - - 14,052,010 27,863,273 2017 12,859,500 - 438,800 908,900 - - 11,328,800 25,536,000 2018 12,467,500 - 474,700 570,900 - - 12,586,900 26,100,000
NOTES: Actual revenues for Fiscal Years 2009 through 2016. Budgeted resources for 2017 and 2018.
WATER SERVICE CHARGE REVENUES, ANNUAL PERCENTAGE CHANGENine Fiscal Years
Fiscal Annual %Year Change_____________________
Debt Service: In FY 2012-13, the City issued bonds in the amount of $27,400,000 to refund the 2003 Water Revenue Bonds.Transfers In: Intrafund transfers have been eliminated from all years in the table above.
30%
2010 0.83% 2011 (5.54%) 2012 1.73% 2013 3.65% 2014 3.46% 2015 3.52% 2016 4.48% 2017 0.04% 2018 (3.05%)
0.83%
(5.54%)
1.73% 3.65%
3.46%
3.52% 4.48%
0.04%
(3.05%)
-10%
-5%
0%
5%
10%
15%
20%
25%
2010 2011 2012 2013 2014 2015 2016 2017 2018
328

WATER FUNDREQUIREMENTS
Ten Fiscal Years
Fiscal Operating Transfers DebtYear Expenditures Capital Out Service Totals______________________________________________________________________________2009 7,390,298$ 3,564,537$ 428,874$ 3,849,683$ 15,233,392$ 2010 7,499,726 3,171,286 1,025,228 3,835,479 15,531,719 2011 7,120,915 2,310,797 460,477 2,655,032 12,547,221 2012 6,886,842 2,427,261 752,213 2,526,748 12,593,064 2013 7,842,307 3,804,694 958,384 33,001,945 45,607,330 2014 7,364,431 3,097,379 1,639,685 1,967,064 14,068,559 2015 7,378,980 1,343,752 905,570 1,928,194 11,556,496 2016 8,332,605 4,666,790 959,762 1,931,594 15,890,751 2017 9,052,200 11,365,300 1,043,400 3,533,400 24,994,300 2018 8,539,100 12,461,900 1,043,700 3,538,600 25,583,300
NOTES: Actual revenues for Fiscal Years 2009 through 2016. Budgeted resources for 2017 and 2018.Operating Expenditures equal Personnel plus Materials & Services.
EXPENDITURES/REQUIREMENTSTen Fiscal Years
Debt Service: In FY 2012-13, the City issued bonds in the amount of $27,400,000 to refund the 2003 WaterRevenue Bonds.Transfers Out: Intrafund transfers have been eliminated from all years in the table above.
$36 000 000
$-
$4,000,000
$8,000,000
$12,000,000
$16,000,000
$20,000,000
$24,000,000
$28,000,000
$32,000,000
$36,000,000
2009 2010 2011 2012 2013 2014 2015 2016 2017 2018
Operating Exp Capital Transfers Out Debt Service
329
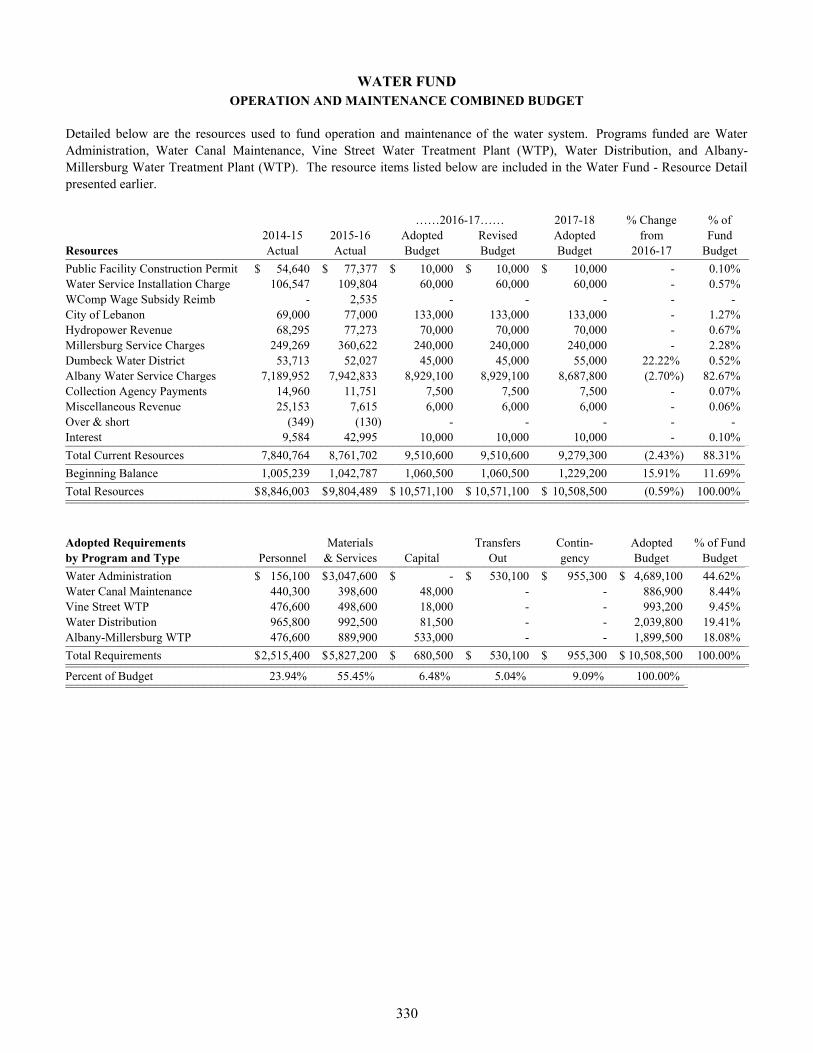
WATER FUNDOPERATION AND MAINTENANCE COMBINED BUDGET
2017-18 % Change % of
2014-15 2015-16 Adopted Revised Adopted from FundResources Actual Actual Budget Budget Budget 2016-17 Budget_________________________________________________________________________________________________________________Public Facility Construction Permit 54,640$ 77,377$ 10,000$ 10,000$ 10,000$ - 0.10%Water Service Installation Charge 106,547 109,804 60,000 60,000 60,000 - 0.57%WComp Wage Subsidy Reimb - 2,535 - - - - - City of Lebanon 69,000 77,000 133,000 133,000 133,000 - 1.27%Hydropower Revenue 68,295 77,273 70,000 70,000 70,000 - 0.67%Millersburg Service Charges 249,269 360,622 240,000 240,000 240,000 - 2.28%Dumbeck Water District 53,713 52,027 45,000 45,000 55,000 22.22% 0.52%Albany Water Service Charges 7,189,952 7,942,833 8,929,100 8,929,100 8,687,800 (2.70%) 82.67%Collection Agency Payments 14,960 11,751 7,500 7,500 7,500 - 0.07%Miscellaneous Revenue 25,153 7,615 6,000 6,000 6,000 - 0.06%Over & short (349) (130) - - - - - Interest 9,584 42,995 10,000 10,000 10,000 - 0.10%_________________________________________________________________________________________________________________Total Current Resources 7,840,764 8,761,702 9,510,600 9,510,600 9,279,300 (2.43%) 88.31%_________________________________________________________________________________________________________________Beginning Balance 1,005,239 1,042,787 1,060,500 1,060,500 1,229,200 15.91% 11.69%_________________________________________________________________________________________________________________Total Resources 8,846,003$ 9,804,489$ 10,571,100$ 10,571,100$ 10,508,500$ (0.59%) 100.00%__________________________________________________________________________________________________________________________________________________________________________________________________________________________________
Adopted Requirements Materials Transfers Contin- Adopted % of Fundby Program and Type Personnel & Services Capital Out gency Budget Budget_________________________________________________________________________________________________________________Water Administration 156,100$ 3,047,600$ -$ 530,100$ 955,300$ 4,689,100$ 44.62%Water Canal Maintenance 440,300 398,600 48,000 - - 886,900 8.44%Vine Street WTP 476,600 498,600 18,000 - - 993,200 9.45%Water Distribution 965,800 992,500 81,500 - - 2,039,800 19.41%Albany-Millersburg WTP 476,600 889,900 533,000 - - 1,899,500 18.08%_________________________________________________________________________________________________________________Total Requirements 2,515,400$ 5,827,200$ 680,500$ 530,100$ 955,300$ 10,508,500$ 100.00%__________________________________________________________________________________________________________________________________________________________________________________________________________________________________Percent of Budget 23.94% 55.45% 6.48% 5.04% 9.09% 100.00%______________________________________________________________________________________________________________________________________________________________________________________________________________
Detailed below are the resources used to fund operation and maintenance of the water system. Programs funded are WaterAdministration, Water Canal Maintenance, Vine Street Water Treatment Plant (WTP), Water Distribution, and Albany-Millersburg Water Treatment Plant (WTP). The resource items listed below are included in the Water Fund - Resource Detailpresented earlier.
……2016-17……
330

WATER FUNDDEBT SERVICE COMBINED BUDGET
2017-18 % Change % of
2014-15 2015-16 Adopted Revised Adopted from FundResources Actual Actual Budget Budget Budget 2016-17 Budget_________________________________________________________________________________________________________________Property Taxes - Delinquent 3,588$ 263$ -$ -$ -$ - - Albany Water Service Charges 1,545,900 1,500,300 1,503,700 1,503,700 1,493,000 (0.71%) 42.19%Interest 4,256 7,505 3,000 3,000 5,000 66.67% 0.14%_________________________________________________________________________________________________________________Total Current Resources 1,553,744 1,508,068 1,506,700 1,506,700 1,498,000 (0.58%) 42.33%_________________________________________________________________________________________________________________From Water SDC-I 384,900 402,100 419,300 419,300 214,300 (48.89%) 6.06%From: Water SDC-R - - - - 224,300 - 6.34%_________________________________________________________________________________________________________________Total Transfers In 384,900 402,100 419,300 419,300 438,600 4.60% 12.40%_________________________________________________________________________________________________________________Reserved Beginning Balance 1,621,904 1,632,354 1,607,400 1,607,400 1,602,000 (0.34%) 45.27%_________________________________________________________________________________________________________________Total Resources 3,560,548$ 3,542,522$ 3,533,400$ 3,533,400$ 3,538,600$ 0.15% 100.00%__________________________________________________________________________________________________________________________________________________________________________________________________________________________________
Adopted Requirements Debt Adopted % of Fundby Program and Type Service Budget Budget_________________________________________________________________________________________________________________Water Debt Service 3,538,600$ 3,538,600$ 100.00%_________________________________________________________________________________________________________________Total Requirements 3,538,600$ 3,538,600$ 100.00%_________________________________________________________________________________________________________________Percent of Budget 100.00% 100.00%____________________________________________________________________________________________________________________________________________________________________________________________________________
Adopted Budget Final Debt AdoptedDetail of Debt Service Maturity Principal Interest Reserve Budget_________________________________________________________________________________________________________________2004 Water Revenue Bonds 08/01/2033 1,020,000 918,500 1,600,100 3,538,600 _________________________________________________________________________________________________________________Totals 1,020,000$ 918,500$ 1,600,100$ 3,538,600$ __________________________________________________________________________________________________________________________________________________________________________________________________________________________________
Detailed below are the resources used to fund water system debt service. The Water Fund currently has one debt serviceprogram: Water Debt Service. The resource items listed below are included in the Water Fund - Resource Detail presentedearlier.
……2016-17……
331

WATER FUNDCAPITAL AND ECONOMIC DEVELOPMENT COMBINED BUDGET
2017-18 % Change % of
2014-15 2015-16 Adopted Revised Adopted from FundResources Actual Actual Budget Budget Budget 2016-17 Budget_______________________________________________________________________________________________________________Water SDC: Principal 23,544$ 2,013$ 3,500$ 3,500$ 1,500$ (57.14%) 0.01%Water SDC: Interest 599 176 300 300 200 (33.33%) - Water Connection Fees 22,202 25,135 15,000 15,000 20,000 33.33% 0.16%Water SDC 382,329 385,485 350,000 350,000 383,000 9.43% 3.07%City of Lebanon 8,000 - 500,000 500,000 250,000 (50.00%) 2.00%Dumbeck Water District 12,014 12,014 12,000 12,000 - (100.00%) - Albany Water Service Charges 3,059,700 2,786,600 1,939,100 1,939,100 1,804,400 (6.95%) 14.45%Capital Charges 109,300 111,400 113,100 113,100 109,800 (2.92%) 0.88%Equipment Replacement Charges 174,000 146,400 215,600 215,600 117,500 (45.50%) 0.94%Miscellaneous Revenue 121 1,805 - - - - - Interest 53,825 70,465 41,300 41,300 49,400 19.61% 0.40%_______________________________________________________________________________________________________________Total Current Resources 3,845,634 3,541,493 3,189,900 3,189,900 2,735,800 (14.24%) 21.90%_______________________________________________________________________________________________________________From Water Capital: Canal - - - - - - - _______________________________________________________________________________________________________________Total Transfers In - - - - - - - _______________________________________________________________________________________________________________Beginning Balance 9,356,318 11,376,870 8,660,900 8,660,900 9,755,700 12.64% 78.10%_______________________________________________________________________________________________________________Total Resources 13,201,952$ 14,918,363$ 11,850,800$ 11,850,800$ 12,491,500$ 5.41% 100.00%______________________________________________________________________________________________________________________________________________________________________________________________________________________________
Adopted Requirements Materials Transfers Adopted % of Fundby Program and Type & Services Capital Out Budget Budget_______________________________________________________________________________________________________________Water SDC Improvement Fee Projects -$ 143,600$ 214,300$ 357,900$ 2.87%Water SDC Reimbursement Fee Projects - 847,200 224,300 1,071,500 8.58%Water System Capital Projects 196,500 8,768,100 75,000 9,039,600 72.37%Water Economic Development - 591,300 - 591,300 4.73%N. Albany Water Capital Projects - 792,500 - 792,500 6.34%Water Equipment Replacement - 638,700 - 638,700 5.11%_______________________________________________________________________________________________________________Total Requirements 196,500$ 11,781,400$ 513,600$ 12,491,500$ 100.00%_______________________________________________________________________________________________________________Percent of Budget 1.57% 94.32% 4.11% 100.00%____________________________________________________________________________________________________________________________________________________________________________________________________________
Detailed below are the resources used to fund water system capital projects and economic development. Programs funded areWater SDC Improvement Fee Projects, Water SDC Reimbursement Fee Projects, 2003 Water Bond Projects, Water Capital:Canal, Water System Capital Projects, Water Economic Development, North Albany Water Capital Projects, and WaterEquipment Replacement. The resource items listed below are included in the Water Fund - Resource Detail presented earlier.
……2016-17……
332

Water SDCWater Vine Street ImprovCanal Treatment Water Fee
Project Description Totals Maint Plant Distribution Projects____________________________________________________________________________________________________Capital Equipment 910,500$ 48,000$ 18,000 81,500$ -$ WC-13-01 Canal Diversion Structures 250,000 - - - - WL-16-01 Crocker LID Waterline 400,000 - - - - WC-16-01 CZ Gates Improvements 600,000 - - - - WL-16-03 Fire Line Backflow Install 90,000 - - - - WC-16-03 Canal Bank Repair Goltra 120,000 - - - - WL-17-01 CARA Water Line Imp 345,600 - - - - WL-17-02 Industrial Way Water Line 320,000 - - - - WL-17-03 Oak Street WL 34th-38th 253,700 - - - - WC-17-03 Canal Bank Repair 4th-5th 460,000 - - - - WL-17-04 Seismic Valves 130,000 - - - - WC-17-01 Raised Canal Embankment 150,000 - - - - WL-17-05 Lyon/Ellsworth Water Line Imp 485,000 - - - - WL-18-01 Lafayette et al WL 1,300,000 - - - - WL-18-02 Pine Meadows WL Repl 940,000 - - - - WL-18-03 Santa Maria WL 329,700 - - - 113,600 WTP-15-02 AM WTP Chemical Tank Rehab 60,000 - - - - WTP-17-01 Ponds Imp 308,000 - - - - WTP-17-02 Vine WTP Imp 290,000 - - - - WTP-18-01 Vine St WTP Accelator Imp 542,000 - - - - W-12-02 AM WTP Sand Removal 443,000 - - - - ____________________________________________________________________________________________________Project Totals 8,727,500 48,000 18,000 81,500 113,600 ____________________________________________________________________________________________________
Reserve: Pipe Over-sizing 10,000 - - - 10,000 Reserve: Connection Fees 281,400 - - - - Reserve: Equipment Replacement 408,700 - - - - Reserve: Capital Projects 3,034,300 - - - 20,000 ____________________________________________________________________________________________________Total Reserves 3,734,400 - - - 30,000 ____________________________________________________________________________________________________Grand Totals 12,461,900$ 48,000$ 18,000$ 81,500$ 143,600$ ________________________________________________________________________________________________________________________________________________________________________________________________________
SUMMARY OF CAPITAL REQUIREMENTS AND CAPITAL RESERVES - FISCAL YEAR 2017-18WATER FUND
333

Water SDC Water N AlbanyReimburse System Water Water Water
Fee Capital Economic Capital EquipmentProjects Projects Development Projects Replacement Project Description______________________________________________________________________________________________________
-$ -$ -$ -$ 230,000$ Capital Equipment- 250,000 - - - WC-13-01 Canal Diversion Structures- 400,000 - - - WL-16-01 Crocker LID Waterline- 600,000 - - - WC-16-01 CZ Gates Improvements- - 90,000 - - WL-16-03 Fire Line Backflow Install- 120,000 - - - WC-16-03 Canal Bank Repair Goltra- 345,600 - - - WL-17-01 CARA Water Line Imp- 320,000 - - - WL-17-02 Industrial Way Water Line- 253,700 - - - WL-17-03 Oak Street WL 34th-38th
460,000 - - - - WC-17-03 Canal Bank Repair 4th-5th- 130,000 - - - WL-17-04 Seismic Valves- 150,000 - - - WC-17-01 Raised Canal Embankment- 485,000 - - - WL-17-05 Lyon/Ellsworth Water Line Imp- 1,300,000 - - - WL-18-01 Lafayette et al WL- 940,000 - - - WL-18-02 Pine Meadows WL Repl- 216,100 - - - WL-18-03 Santa Maria WL- 60,000 - - - WTP-15-02 AM WTP Chemical Tank Rehab- 308,000 - - - WTP-17-01 Ponds Imp- 290,000 - - - WTP-17-02 Vine WTP Imp- 542,000 - - - WTP-18-01 Vine St WTP Accelator Imp- 443,000 - - - W-12-02 AM WTP Sand Removal______________________________________________________________________________________________________
460,000 7,153,400 90,000 - 230,000 Project Totals______________________________________________________________________________________________________
- - - - - Reserve: Pipe Over-sizing- 281,400 - - - Reserve: Connection Fees- - - - 408,700 Reserve: Equipment Replacement
387,200 1,333,300 501,300 792,500 - Reserve: Capital Projects______________________________________________________________________________________________________387,200 1,614,700 501,300 792,500 408,700 Total Reserves______________________________________________________________________________________________________847,200$ 8,768,100$ 591,300$ 792,500$ 638,700$ Grand Totals____________________________________________________________________________________________________________________________________________________________________________________________________________
334

PROGRAM NARRATIVE
WATER FUND: WATER ADMINISTRATION (615-50-2202) Responsible Manager/Title: Chris Bailey, Public Works Operations Director
Jeff Blaine, P.E., Public Works Engineering and Community Development Director
FUNCTIONS AND RESPONSIBILITIES This program provides funding for the Water
Superintendent and the Public Works (PW) Internal Services fund, which includes charges for PW Administration, Operations Administration, PW Engineering Services, Water Quality Control Services, and Facilities Engineering.
Maintains a sustainable funding plan for the utility.
Pays in-lieu-of-franchise fees for the water utility.
Maintains the contingency for the Water Fund.
STRATEGIES/ACTIONS
Strategic Plan Theme Target Date Status Strategies/Actions
Budget Year 2016-2017
Effective Government 06/17 In Progress Complete perfection of additional water rights.
Budget Year 2017-2018
Effective Government 06/18 Complete a preliminary work plan to build resilience in the water system.
Safe City 06/18 Maintain or improve compliance with disinfection byproducts standards in drinking water.
STAFFING SUMMARY 2014-2015 2015-2016 2016-2017 2017-2018
Budgeted FTEs 1.00 1.00 1.00 1.00
335

615: Water
50: Public Works
2014-2015 2015-2016 2016-2017 2016-2017 2017-2018 %Description Actual Actual Adopted Revised Adopted Change
EXPENDITURESPersonnel Services 120,154 146,953 156,000 156,000 156,100 0.06 % Materials & Services 2,219,175 2,335,451 3,632,300 3,632,300 3,047,600 (16.10)% Transfers Out 520,670 557,662 549,100 549,100 530,100 (3.46)% Contingencies - - 961,000 961,000 955,300 (0.59)% TOTAL EXPENDITURES 2,859,999 3,040,066 5,298,400 5,298,400 4,689,100 (11.50)%
CITY OF ALBANY, OREGONPROG 2202: Water Administration
336

PROGRAM NARRATIVE
WATER FUND: CANAL MAINTENANCE (615-50-2204) Responsible Manager/Title: Karen Kelley, Utility Superintendent - Water
Developed By: Jeff Kinney, Water Operations Supervisor
FUNCTIONS AND RESPONSIBILITIES
Performs routine operation and maintenance of the Albany-Santiam Canal. Water is diverted from the South Santiam River into the Canal southeast of Lebanon. The Canal runs approximately 18 miles from the diversion dam to the Vine Street Water Treatment Plant (WTP) and into the Calapooia River.
Removes debris, performs vegetation and pest management, and routinely inspects and repairs bank condition to preserve bank stability.
Complete comprehensive bank inspection of entire length of the canal within a five-year cycle.
Operates hydro-electric generator to maximize revenue and comply with all relevant articles in the Federal Energy Regulatory Commission license.
Controls and monitors flow and water levels to ensure adequate raw water supplies for Albany and Lebanon water treatment plants, hydro-electric facility, flow augmentation, and to control against flooding.
Performs semi-annual raw water sampling to monitor for potential contaminants in the Canal.
Monitors and collects data from Canal gauging stations.
Performs quarterly inspections for penstock, tainter gate, level sensors, crest gates, and Supervisory Control and Data Acquisition (SCADA) alarms.
STRATEGIES/ACTIONS
Strategic Plan Theme Target Date Status Strategies/Actions
Budget Year 2016-2017
Effective Government 12/16 Completed Develop and implement a training program for crew and contractors that work in and around the canal.
Safe City 06/17 In Progress Develop standard operating procedures for headgate operation and flow control structures to relieve excess flows in high-flow events.
Budget Year 2017-2018
Safe City 12/17 Design and install a safety catwalk above the fish screens.
Effective Government Safe City
06/18 Develop scope of work and consultant contract for Part 12D Safety Inspection Report Update.
PERFORMANCE MEASURES AND WORKLOAD INDICATORS
2014-2015 2015-2016 2016-2017 2017-2018 Fully utilize the water right for hydropower (Y/N). N N Y Y
Fully utilize the water right for flow augmentation (Y/N). N Y Y Y Percent of time water levels/flow are managed to ensure an adequate supply of water to the Vine Street WTP.
100% 100% 100% 100%
Number of excursions to the Article 404 flow compliance plan for the year. Goal = 0.
0 0 0 0
Number of excursions to the Article 416 slough flow compliance plan. Goal = 0.
2 0 0 0
Number of miles of brush cleared to stabilize banks and provide sight distance.
2 2 12 12
During hydropower production, average monthly kWh produced. Goal = 100,000.
111,560 128,121 148,836 100,000
Days per year the hydro-electric generator is in operation. Goal = 250.
102 167 220 250
STAFFING SUMMARY
Budgeted FTEs 3.50 3.50 3.50 3.50 337

615: Water
50: Public Works
2014-2015 2015-2016 2016-2017 2016-2017 2017-2018 %Description Actual Actual Adopted Revised Adopted Change
EXPENDITURESPersonnel Services 398,827 413,454 445,500 445,500 440,300 (1.17)% Materials & Services 350,458 368,265 399,600 399,600 398,600 (0.25)% Capital - - 10,000 10,000 48,000 380.00 % TOTAL EXPENDITURES 749,285 781,719 855,100 855,100 886,900 3.72 %
CITY OF ALBANY, OREGONPROG 2204: Water Canal Maintenance
338

PROGRAM NARRATIVE
WATER FUND: VINE STREET WATER TREATMENT PLANT (615-50-2205) Responsible Manager/Title: Karen Kelley, Utility Superintendent - Water
Developed by: John Adams, Treatment Plant Supervisor
FUNCTIONS AND RESPONSIBILITIES This program funds the operation and maintenance of the
Vine Street Water Treatment Plant (Vine WTP).
The Vine Street Water Treatment Plant provides water to residential, commercial, and industrial customers in Albany and Millersburg in conjunction with the Albany-Millersburg Water Treatment Plant (A-M WTP).
The plant has a current operating capacity of 14.5 million gallons per day, and is operated approximately 8 hours per day, 365 days per year to meet peak demand requirements including pressure, flow, and storage, as well as maintain filter readiness.
Plant operators are responsible for acquiring and interpreting operational and water quality data and using that information to develop operating strategies that will meet water quality objectives set forth by the Safe Drinking Water Act and Oregon Drinking Water Quality Act while managing efficient use of facility infrastructure and resources.
Plant operators are responsible for responding to emergency situations in ways that protect public health and safety as well as facility infrastructure.
STRATEGIES/ACTIONS
Strategic Plan Theme Target
Date
Status
Strategies/Actions Budget Year 2016-2017
Safe City 12/16 In Progress Develop a chemical and water storage tank management plan.
Safe City Effective Government
12/16 In Progress Complete entry of plant equipment into Computerized Maintenance Management System (CMMS) and process work orders through CMMS.
Effective Government 06/17 Completed Implement the Energy Consumption Reduction Plan.
Budget Year 2017-2018
Effective Government Safe City
12/17 Prepare for Water System Survey performed by Oregon Health Authority.
12/17 Complete coagulant change and chemical delivery, storage, and injection efficiency improvements.
PERFORMANCE MEASURES AND WORKLOAD INDICATORS
2014-2015 2015-2016 2016-2017 2017-2018 Water treated annually (millions of gallons). 383 521 605 605 Peak demand in million gallons per day. 3.6 4.6 5.0 5.0 Percent of time plant met regulatory requirements for safe drinking water.
100% 100% 100% 100%
Percent of time plant met peak daily flow. 100% 100% 100% 100% Percent energy consumption reduced after plan implementation.
n/a n/a 5% 5%
Percent of preventative maintenance tasks tracked through CMMS after plan implementation.
n/a 100% 100% 100%
STAFFING SUMMARY
Budgeted FTEs 3.25 3.25 4.00* 4.50* *FTE split between Vine WTP and A-M WTP
339

615: Water
50: Public Works
2014-2015 2015-2016 2016-2017 2016-2017 2017-2018 %Description Actual Actual Adopted Revised Adopted Change
EXPENDITURESPersonnel Services 307,733 345,129 444,300 444,300 476,600 7.27 % Materials & Services 566,229 720,365 481,800 481,800 498,600 3.49 % Capital - - 13,300 13,300 18,000 35.34 % TOTAL EXPENDITURES 873,962 1,065,494 939,400 939,400 993,200 5.73 %
CITY OF ALBANY, OREGONPROG 2205: Vine Street Water Treatment Plant
340

PROGRAM NARRATIVE
WATER FUND: WATER DISTRIBUTION (615-50-2206) Responsible Manager/Title: Karen Kelley, Utility Superintendent - Water
Developed By: Jeff Kinney, Water Operations Supervisor
FUNCTIONS AND RESPONSIBILITIES
Operate and maintain the water distribution systems for the cities of Albany and Millersburg and the Dumbeck Lane Water District to assure adequate water pressure, flow, and quality. This includes a network of 288 miles of water mains, 7,845 valves, 2,016 fire hydrants, 18,344 meters, 88 large meters (3-inch or greater), 9 reservoirs, 6 pump stations, and 54 water quality sample stations.
Perform perpetual meter maintenance of all small meters; changing out all meters more than 20 years old.
Ensure compliance with all Federal Safe Drinking Water Act and Oregon Drinking Water Quality Act Rules and Regulations.
Maintain water system flushing, fire hydrant maintenance, valve survey and exercising, water service installation, repair, replacement, and cross-connection programs.
STRATEGIES/ACTIONS
Strategic Plan Theme Target Date Status Strategies/Actions
Budget Year 2016-2017
Effective Government 06/17 Completed Implement the Energy Consumption Reduction Plan.
Safe City 06/17 In Progress Develop and implement an Asbestos Cement (AC) pipe replacement program.
Budget Year 2017-2018
Effective Government Safe City
12/17 Complete and implement citywide flushing plan.
12/17 Prepare for Water System Survey performed by Oregon Health Authority.
06/18 Develop and implement a copper service line protection program.
PERFORMANCE MEASURES AND WORKLOAD INDICATORS 2014-2015 2015-2016 2016-2017 2017-2018 Number of miles of pipe maintained. 278 283 288 290 Number of leaks reported. 159 70 105 90 Percent of leaks repaired within 1 week of reporting. 95% 100% 100% 100% Percent of out-of-service fire hydrants returned to service within 36 hours.
98% 100% 100% 100%
Percent of new meters installed within 48 hours of receipt of permit.
100% 100% 92% 100%
Percent energy consumption reduced after plan implementation.
n/a n/a 5% 5%
STAFFING SUMMARY
Budgeted FTEs 9.00 9.00 9.00 9.00
341

615: Water
50: Public Works
2014-2015 2015-2016 2016-2017 2016-2017 2017-2018 %Description Actual Actual Adopted Revised Adopted Change
EXPENDITURESPersonnel Services 851,011 870,738 967,700 967,700 965,800 (0.20)% Materials & Services 999,774 1,119,083 1,001,900 1,001,900 992,500 (0.94)% Capital - 35,892 92,000 92,000 81,500 (11.41)% TOTAL EXPENDITURES 1,850,785 2,025,713 2,061,600 2,061,600 2,039,800 (1.06)%
CITY OF ALBANY, OREGONPROG 2206: Water Distribution
342

PROGRAM NARRATIVE
WATER FUND: ALBANY-MILLERSBURG WATER TREATMENT PLANT (615-50-2207) Responsible Manager/Title: Karen Kelley, Utility Superintendent - Water
Developed by: John Adams, Treatment Plant Supervisor
FUNCTIONS AND RESPONSIBILITIES
This program funds the operation and maintenance of the Albany-Millersburg Water Treatment Plant.
The Albany-Millersburg Water Treatment Plant provides water to residential, commercial, and industrial customers in Albany and Millersburg in conjunction with the Vine Street Water Treatment Plant.
The plant has a current operating capacity of 12 million gallons per day, and is operated 24 hours per day, 365 days per year to meet peak demand requirements including pressure, flow, and storage.
Plant operators are responsible for acquiring and interpreting operational and water quality data and using that information to develop operating strategies that will meet water quality objectives set forth by the Safe Drinking Water Act and Oregon Drinking Water Quality Act while managing efficient use of facility infrastructure and resources.
Plant operators are responsible for responding to emergency situations in ways that protect public health and safety as well as facility infrastructure.
STRATEGIES/ACTIONS
Strategic Plan Theme Target Date Status Strategies/Actions
Budget Year 2016-2017
Effective Government Safe City
12/16 In Progress Develop a chemical and water storage tank management plan.
Effective Government 06/17 Completed Implement the Energy Consumption Reduction Plan.
Budget Year 2017-2018
Effective Government Safe City
12/17 Implement the membrane replacement program.
12/17 Prepare for Water System Survey performed by Oregon Health Authority.
PERFORMANCE MEASURES AND WORKLOAD INDICATORS
2014-2015 2015-2016 2016-2017 2017-2018 Water treated annually (millions of gallons). 2,470 2,282 2,080 2,080 Peak demand in million gallons per day. 11.1 9.7 10.9 10.9 Percent of time the plant met regulatory requirements for safe drinking water.
100% 100% 100% 100%
Percent of time the plant met peak daily flow. 100% 100% 100% 100% Percent energy consumption reduced after plan implementation.
n/a n/a 36.29%
5%
Percent of preventative maintenance tasks tracked through CarteGraph Maintenance Management Software (CMMS) after plan implementation.
n/a 100% 100% 100%
STAFFING SUMMARY
Budgeted FTEs 4.75 4.75 4.00* 4.50* *FTE split between A-M WTP and Vine WTP
343

615: Water
50: Public Works
2014-2015 2015-2016 2016-2017 2016-2017 2017-2018 %Description Actual Actual Adopted Revised Adopted Change
EXPENDITURESPersonnel Services 419,538 469,606 458,300 458,300 476,600 3.99 % Materials & Services 1,049,648 1,109,717 958,300 958,300 889,900 (7.14)% Capital - 21,150 - - 533,000 - %TOTAL EXPENDITURES 1,469,186 1,600,473 1,416,600 1,416,600 1,899,500 34.09 %
CITY OF ALBANY, OREGONPROG 2207: Albany-Millersburg WTP
344

PROGRAM NARRATIVE
WATER FUND: WATER SDC IMPROVEMENT FEE PROJECTS (615-50-2300) Responsible Manager/Title: Staci Belcastro, P.E., City Engineer
FUNCTIONS AND RESPONSIBILITIES
This program is dedicated to funding eligible, capacity-increasing projects that are a direct result of new growth and development. Revenues are received from Water System Development Charges (SDCs).
Provide over-sizing component funding for City projects constructed by development projects.
Identify and complete capacity-increasing improvements necessary to support economic development and future growth.
The current SDC for the water system is $2,481 for a single-family residence with a 3/4-inch meter (effective July 2016). This program receives $2,125 of the fee.
In 1989 legislation was adopted in Oregon
requiring justification and separate accounting of revenues and expenditures for all SDCs. This budget complies with that legislation.
STRATEGIES/ACTIONS
Strategic Plan Theme Target Date Status Strategies/Actions
Budget Year 2016-2017
Effective Government 06/17 Completed Build reserves for future capital projects.
Budget Year 2017-2018
Effective Government 06/18 Build reserves for future capital projects.
06/18 Construct WL-18-03, Santa Maria Water Line Improvements.
345

615: Water
50: Public Works
2014-2015 2015-2016 2016-2017 2016-2017 2017-2018 %Description Actual Actual Adopted Revised Adopted Change
REVENUESLicenses and Fees 316,848 330,655 300,600 300,600 323,900 7.75 % Investment Income 1,857 1,500 700 700 700 - %Beginning Balance 341,920 271,563 141,500 141,500 33,300 (76.47)% TOTAL REVENUES 660,625 603,718 442,800 442,800 357,900 (19.17)%
EXPENDITURESCapital 4,161 - 23,500 23,500 143,600 511.06 % Transfers Out 384,900 402,100 419,300 419,300 214,300 (48.89)% TOTAL EXPENDITURES 389,061 402,100 442,800 442,800 357,900 (19.17)%
Prog 2300: Water SDC Improvement Fee Projects Revenues less Expenditures 271,564 201,618 - - -
CITY OF ALBANY, OREGONPROG 2300: Water SDC Improvement Fee Projects
346

PROGRAM NARRATIVE
WATER FUND: WATER SDC REIMBURSEMENT FEE PROJECTS (615-50-2301) Responsible Manager/Title: Staci Belcastro, P.E., City Engineer
FUNCTIONS AND RESPONSIBILITIES
Revenues are received from System Development Charges (SDCs). These revenues reimburse the City for past investments in capacity-increasing projects identified in the City’s adopted water SDC methodology.
The current SDC for the water system is $2,481 for a single-family residence with a 3/4-inch meter (effective July 2016). This program receives $356 of the fee.
Funding provided through this program is used to complete capital projects within the water system.
In 1989 legislation was adopted in Oregon requiring justification and separate accounting of revenues and expenditures for all SDCs effective July 1, 1991. This budget was created to comply with that legislation.
STRATEGIES/ACTIONS
Strategic Plan Theme Target Date Status Strategies/Actions
Budget Year 2016-2017
Effective Government 06/17 In Progress Construct WC-17-03, Santiam-Albany Canal Bank Repair: 4th to 5th Avenues.
Budget Year 2017-2018
Effective Government 06/18 Construct WC-17-03, Santiam-Albany Canal Bank Repair: 4th to 5th Avenues.
347

615: Water
50: Public Works
2014-2015 2015-2016 2016-2017 2016-2017 2017-2018 %Description Actual Actual Adopted Revised Adopted Change
REVENUESLicenses and Fees 89,624 57,019 53,200 53,200 60,800 14.29 % Charges for Services 12,014 12,014 12,000 12,000 - (100.00)% Investment Income 4,787 6,436 4,900 4,900 5,000 2.04 % Beginning Balance 816,074 922,499 986,800 986,800 1,005,700 1.92 % TOTAL REVENUES 922,499 997,968 1,056,900 1,056,900 1,071,500 1.38 %
EXPENDITURESCapital - - 1,056,900 1,056,900 847,200 (19.84)% Transfers Out - - - - 224,300 - %TOTAL EXPENDITURES - - 1,056,900 1,056,900 1,071,500 1.38 %
Prog 2301: Water SDC Reimbursement Fee Projects Revenues less Expenditures 922,499 997,968 - - -
CITY OF ALBANY, OREGONPROG 2301: Water SDC Reimbursement Fee Projects
348

PROGRAM NARRATIVE
WATER FUND: WATER DEBT SERVICE (615-50-2305) Responsible Manager/Title: Jeff Babbitt, Public Works Business Manager
FUNCTIONS AND RESPONSIBILITIES
This program provides for the principal and interest payments on City of Albany Water Revenue Bonds.
MATURITY SCHEDULE Fiscal Year Principal Interest Total
2017-2018 1,020,000 918,494 1,938,4942018-2019 1,060,000 876,894 1,936,8942019-2020 1,100,000 833,694 1,933,6942020-2021 1,140,000 783,194 1,923,1942021-2022 1,195,000 730,794 1,925,7942022-2023 1,240,000 682,094 1,922,0942023-2024 1,290,000 631,494 1,921,4942024-2025 1,345,000 572,069 1,917,0692025-2026 1,420,000 502,944 1,922,9442026-2027 1,500,000 437,444 1,937,4442027-2028 1,560,000 376,244 1,936,2442028-2029 1,625,000 312,544 1,937,5442029-2030 1,705,000 254,469 1,959,4692030-2031 1,760,000 202,494 1,962,4942031-2032 1,815,000 147,734 1,962,7342032-2033 1,875,000 90,078 1,965,0782033-2034 1,945,000 30,391 1,975,391
Totals $ 24,595,000 $ 8,383,066 $ 32,978,066
DEBT SUMMARY
Issue Original Amount Principal Balance Required Reserve
2013 $ 28,405,000 $ 24,595,000 $ 1,100,000
Totals $ 28,405,000 $ 24,595,000 $ 1,100,000
349

615: Water
50: Public Works
2014-2015 2015-2016 2016-2017 2016-2017 2017-2018 %Description Actual Actual Adopted Revised Adopted Change
REVENUESProperty Taxes 3,588 263 - - - - %Charges for Services 1,545,900 1,500,300 1,503,700 1,503,700 1,493,000 (0.71)% Investment Income 4,256 7,505 3,000 3,000 5,000 66.67 % Transfers In 384,900 402,100 419,300 419,300 438,600 4.60 % Dedicated Beginning Balance 1,621,904 1,632,354 1,607,400 1,607,400 1,602,000 (0.34)% TOTAL REVENUES 3,560,548 3,542,522 3,533,400 3,533,400 3,538,600 0.15 %
EXPENDITURESDebt Service 1,928,194 1,931,594 3,533,400 3,533,400 3,538,600 0.15 % TOTAL EXPENDITURES 1,928,194 1,931,594 3,533,400 3,533,400 3,538,600 0.15 %
Prog 2305: Water Debt Service Revenues less Expenditures 1,632,354 1,610,928 - - -
CITY OF ALBANY, OREGONPROG 2305: Water Debt Service
350

PROGRAM NARRATIVE WATER FUND: WATER SYSTEM CAPITAL PROJECTS (615-50-2308) Responsible Manager/Title: Staci Belcastro, P.E., City Engineer
FUNCTIONS AND RESPONSIBILITIES
This program provides only limited funding to repair, replace, or upgrade facilities, equipment, and accessories to maintain the design capacity of the existing Water Treatment Plants (WTP), reservoirs, and distribution system.
Identify and complete capacity increasing
improvements necessary to support economic development and future growth.
Funding provided through this program is used to repair or replace water system facilities, equipment, and structures that are not accumulating a depreciation reserve from a specific replacement schedule.
Maintain adequate reserve for funding
emergency repairs or replacement of equipment or systems.
STRATEGIES/ACTIONS
Strategic Plan Theme Target Date Status Strategies/Actions
Budget Year 2016-2017
Safe City 06/17 In Progress Construct WC-16-01, CZ Gates Improvements.
06/17 In Progress Construct WL-17-01, CARA Water Line Improvements.
06/17 In Progress Construct WL-17-02, Industrial Way Water Line.
06/17 In Progress Construct WL-17-03, Oak Street Water Line – 34th to 38th.
06/17 In Progress Construct WTP-17-01, Backwash Ponds Improvements.
06/17 In Progress Construct WTP-17-02, Vine WTP Improvements.
Budget Year 2017-2018
Safe City 09/17 Construct WC-16-01, CZ Gates Improvements.
09/17 Construct WL-17-01, CARA Water Line Improvements.
09/17 Construct WL-17-02, Industrial Way Water Line.
09/17 Construct WL-17-03, Oak Street Water Line – 34th to 38th.
09/17 Construct WTP-17-01, Backwash Ponds Improvements.
09/17 Construct WTP-17-02, Vine WTP Improvements.
06/18 Construct WL-18-01, Lafayette, Cloverdale, Peach Tree, Cherry and Fairway Area Water Line.
06/18 Construct WL-18-02, Pine Meadows Water Line Replacement.
06/18 Construct WL-18-03, Santa Maria Water Line.
06/18 Construct WTP-18-01, Vine WTP Accelator Improvements.
351

615: Water
50: Public Works
2014-2015 2015-2016 2016-2017 2016-2017 2017-2018 %Description Actual Actual Adopted Revised Adopted Change
REVENUESLicenses and Fees 22,202 25,135 15,000 15,000 20,000 33.33 % Intergovernmental Revenue 8,000 - 500,000 500,000 250,000 (50.00)% Charges for Services 3,059,700 2,786,600 1,867,100 1,867,100 1,804,400 (3.36)% Miscellaneous Revenue 121 250 - - - - %Investment Income 35,522 48,154 26,900 26,900 35,000 30.11 % Beginning Balance 6,098,014 8,037,639 5,376,200 5,376,200 6,930,200 28.91 % TOTAL REVENUES 9,223,559 10,897,778 7,785,200 7,785,200 9,039,600 16.11 %
EXPENDITURESMaterials & Services 96,432 74,520 106,500 106,500 196,500 84.51 % Capital 1,089,488 4,607,064 7,603,700 7,603,700 8,768,100 15.31 % Transfers Out - - 75,000 75,000 75,000 - %TOTAL EXPENDITURES 1,185,920 4,681,584 7,785,200 7,785,200 9,039,600 16.11 %
Prog 2308: Water System Capital Projects Revenues less Expenditures 8,037,639 6,216,194 - - -
CITY OF ALBANY, OREGONPROG 2308: Water System Capital Projects
352

PROGRAM NARRATIVE
WATER FUND: WATER ECONOMIC DEVELOPMENT (615-50-2309) Responsible Manager/Title: Staci Belcastro, P.E., City Engineer
FUNCTIONS AND RESPONSIBILITIES
This program annually receives up to $100,000 from service charges to help fund economic development-related capital projects as approved by the City Council.
Fund balance for this program will be capped at $500,000.
Council authorization to annually fund this program began in Fiscal Year 2003-2004.
STRATEGIES/ACTIONS
Strategic Plan Theme Target Date Status Strategies/Actions
Budget Year 2016-2017
Effective Government 06/17 Completed Build reserves for future projects.
Budget Year 2017-2018
Effective Government 06/18 Build reserves for future projects.
06/18 Construct WL-16-03, Fire Line Backflow Installation.
353

615: Water
50: Public Works
2014-2015 2015-2016 2016-2017 2016-2017 2017-2018 %Description Actual Actual Adopted Revised Adopted Change
REVENUESCharges for Services - - 72,000 72,000 - (100.00)% Investment Income 3,119 3,839 2,100 2,100 2,900 38.10 % Beginning Balance 570,019 573,137 550,900 550,900 588,400 6.81 % TOTAL REVENUES 573,138 576,976 625,000 625,000 591,300 (5.39)%
EXPENDITURESCapital - 2,684 625,000 625,000 591,300 (5.39)% TOTAL EXPENDITURES - 2,684 625,000 625,000 591,300 (5.39)%
Prog 2309: Water Economic Development Revenues less Expenditures 573,138 574,292 - - -
CITY OF ALBANY, OREGONPROG 2309: Water Economic Development
354

PROGRAM NARRATIVE
WATER FUND: NORTH ALBANY WATER CAPITAL PROJECTS (615-50-2310) Responsible Manager/Title: Staci Belcastro, P.E., City Engineer
FUNCTIONS AND RESPONSIBILITIES
This program receives revenue ($23.10 per month per customer) from water customers outside the city limits in North Albany. Currently there are 396 meters in this program.
Revenues received in this program are dedicated to funding capital projects and fixed assets that benefit the North Albany water system outside the city limits.
STRATEGIES/ACTIONS
Strategic Plan Theme Target Date Status Strategies/Actions
Budget Year 2016-2017
Safe City 06/17 Completed Build reserves for future capital projects.
Budget Year 2017-2018
Safe City 06/18 Build reserves for future capital projects.
355

615: Water
50: Public Works
2014-2015 2015-2016 2016-2017 2016-2017 2017-2018 %Description Actual Actual Adopted Revised Adopted Change
REVENUESCharges for Services 109,300 111,400 113,100 113,100 109,800 (2.92)% Investment Income 2,714 3,391 2,700 2,700 3,300 22.22 % Beginning Balance 536,030 448,795 562,400 562,400 679,400 20.80 % TOTAL REVENUES 648,044 563,586 678,200 678,200 792,500 16.85 %
EXPENDITURESCapital 199,249 - 678,200 678,200 792,500 16.85 % TOTAL EXPENDITURES 199,249 - 678,200 678,200 792,500 16.85 %
Prog 2310: N. Albany Water Capital Projects Revenues less Expenditures 448,795 563,586 - - -
CITY OF ALBANY, OREGONPROG 2310: N. Albany Water Capital Projects
356

PROGRAM NARRATIVE
WATER FUND: WATER EQUIPMENT REPLACEMENT (615-50-2311) Responsible Manager/Title: Jeff Babbitt, Public Works Business Manager
FUNCTIONS AND RESPONSIBILITIES
This program funds replacement of water system vehicles and major equipment in accordance with an established depreciation and replacement schedule.
Receive revenues from other water fund budgets to fund future equipment replacement.
STRATEGIES/ACTIONS
Strategic Plan Theme Target Date Status Strategies/Actions
Budget Year 2016-2017
Effective Government 06/17 Completed Receives revenues from other water fund budgets to fund future equipment replacement.
06/17 Completed Purchase replacement filter membranes for the Albany-Millersburg Water Treatment Plant.
06/17 Completed Replace Vehicle 947-03.
06/17 Completed Replace Vehicle 950-01.
Budget Year 2017-2018
Effective Government
06/18 Receives revenues from other water fund budgets to fund future equipment replacement.
06/18 Purchase replacement filter membranes for the Albany-Millersburg Water Treatment Plant.
06/18 Replace Vehicle 900-02.
06/18 Replace Vehicle 914-01.
357

615: Water
50: Public Works
2014-2015 2015-2016 2016-2017 2016-2017 2017-2018 %Description Actual Actual Adopted Revised Adopted Change
REVENUESCharges for Services 174,000 146,400 215,600 215,600 117,500 (45.50)% Miscellaneous Revenue - 1,555 - - - - %Investment Income 5,827 7,145 4,000 4,000 2,500 (37.50)% Beginning Balance 994,262 1,123,236 1,043,100 1,043,100 518,700 (50.27)% TOTAL REVENUES 1,174,089 1,278,336 1,262,700 1,262,700 638,700 (49.42)%
EXPENDITURESMaterials & Services - 359,324 - - - - %Capital 50,854 - 1,262,700 1,262,700 638,700 (49.42)% TOTAL EXPENDITURES 50,854 359,324 1,262,700 1,262,700 638,700 (49.42)%
Prog 2311: Water Equipment Replacement Revenues less Expenditures 1,123,235 919,012 - - -
CITY OF ALBANY, OREGONPROG 2311: Water Equipment Replacement
358

STORMWATER FUNDRESOURCE DETAIL
2017-18 % Change % of
2014-15 2015-16 Adopted Revised Adopted from FundResources Actual Actual Budget Budget Budget 2016-17 Budget
Storm Dr Plan Review/Insp Fees 6,729$ -$ 5,000$ 5,000$ 10,000$ 100.00% 0.46%Stormwater Quality Permits - - 5,000 5,000 10,000 100.00% 0.46%Storm Drain Connection Fees - - 5,000 5,000 5,000 - 0.23%EPSC Permit Fees 43,215 56,440 50,000 50,000 50,000 - 2.28%Stormwater Service Charges - - - - 1,750,000 - 79.87%Stormwater Deferred Planting - - 5,000 5,000 5,000 - 0.23%Stormwater In-Lieu-of Planting - - 5,000 5,000 5,000 - 0.23%Equipment Replacement Charges - - 21,600 21,600 55,700 157.87% 2.54%Interest - - 800 800 2,100 162.50% 0.10%
Total Current Resources 49,944 56,440 97,400 97,400 1,892,800 1,843.33% 86.40%
From Street Fund - - 206,700 206,700 - (100.00%) - From Sewer Fund - - 696,000 696,000 - (100.00%) -
Total Transfers In - - 902,700 902,700 - (100.00%) -
Beginning Balance - - 156,800 156,800 298,300 90.24% 13.60%
Total Resources 49,944$ 56,440$ 1,156,900$ 1,156,900$ 2,191,100$ 89.39% 100.00%
……2016-17……
359

STORMWATER FUNDREQUIREMENT/STAFFING SUMMARIES
2014-15 2015-16Program Requirements Actual Actual Adopted Revised Proposed Approved Adopted_______________________________________________________________________________________________________________________Stormwater Operations -$ -$ 511,200$ 511,200$ 554,900$ 554,900$ 554,900$ Stormwater Administration - - 451,500 451,500 1,381,100 1,381,100 1,381,100 Vine Street WTP - - 172,500 172,500 177,700 177,700 177,700 Stormwater Equipment Replacement - - 21,700 21,700 77,400 77,400 77,400 _______________________________________________________________________________________________________________________Total Requirements -$ -$ 1,156,900$ 1,156,900$ 2,191,100$ 2,191,100$ 2,191,100$ ______________________________________________________________________________________________________________________________________________________________________________________________________________________________________________
Requirements by Type_______________________________________________________________________________________________________________________Personnel -$ -$ 338,000$ 338,000$ 303,000$ 303,000$ 303,000$ Materials & Services - - 570,400 570,400 1,590,700 1,590,700 1,590,700 Capital - - 194,200 194,200 200,400 200,400 200,400 Contingency - - 54,300 54,300 57,300 57,300 57,300 _______________________________________________________________________________________________________________________Total Requirements -$ -$ 1,156,900$ 1,156,900$ 2,191,100$ 2,191,100$ 2,191,100$ ______________________________________________________________________________________________________________________________________________________________________________________________________________________________________________
Adopted Requirements Materials Contin- Adopted % of Fundby Program and Type Personnel & Services Capital gency Budget Budget___________________________________________________________________________________________________________________________________Stormwater Operations 303,000$ 251,900$ -$ -$ 554,900$ 25.79%Stormwater Administration - 1,323,800 - 57,300 1,381,100 64.19%Stormwater Capital - 15,000 123,000 - 138,000 6.40%Stormwater Equipment Replacement - - 77,400 - 77,400 3.60%___________________________________________________________________________________________________________________________________Total Requirements 303,000$ 1,590,700$ 200,400$ 57,300$ 2,151,400$ 100.00%______________________________________________________________________________________________________________________________________________________________________________________________________________________________________________________________________Percent of Fund Budget 14.09% 73.94% 9.31% 2.66% 100.00%______________________________________________________________________________________________________________________________________________________________________________________________________________________________________________
……2016-17…… ……2017-18……
360


StormwaterStormwater Equipment
Project Description Totals Capital Replacement_____________________________________________________________________________________________________Reserve: Equipment Replacement 77,400$ -$ 77,400$ Reserve: Stormwater Capital 200 200 - Reserve: Stormwater Deferred Planting 5,000 5,000 - Reserve: Stormwater In-Lieu-of Planting 5,000 5,000 - Reserve: Stormwater Drain Connection 112,800 112,800 -
Total Reserves 200,400 123,000 77,400
Grand Totals 200,400$ 123,000$ 77,400$
STORMWATER FUNDSUMMARY OF CAPITAL REQUIREMENTS AND CAPITAL RESERVES - FISCAL YEAR 2017-18
361

PROGRAM NARRATIVE FORM
STORMWATER FUND: STORMWATER OPERATIONS (625-50-3003) Responsible Manager/Title: Chris Bailey, Public Works Operations Director
FUNCTIONS AND RESPONSIBILITIES
Manage stormwater runoff to minimize impacts to private property and public infrastructure.
Inspect, maintain, and repair stormwater infrastructure.
Respond to storm events to control street flooding, place high water signs, and close streets as necessary.
Inspect, maintain, and repair post-construction stormwater quality facilities.
No personnel are assigned to this program. All work is performed by Wastewater Collections, Street Maintenance, and Water Quality Control staff.
Respond to spills which may impact the stormwater system, including those affecting area streams and rivers.
Ensure that National Pollutant Discharge Elimination System (NPDES) 1200-Z stormwater permit and Willamette Total Maximum Daily Load (TMDL) actions are implemented as required.
STRATEGIES/ACTIONS
Strategic Plan Theme
Target Date Status Strategies/Actions
Budget Year 2016-2017
Safe City Effective Government
06/17 Completed Deliver a series of presentations to City Council about the development and implementation of a stormwater utility fee.
06/17 Completed Update City website content regarding stormwater quality information and best management practices.
Budget Year 2017-2018
Safe City
Effective Government
06/18 Begin repairing or replacing failing stormwater catch basins.
06/18 Expand the amount of storm infrastructure cleaned and inspected throughout the year.
PERFORMANCE MEASURES AND WORKLOAD INDICATORS
2014-2015 2015-2016 2016-2017 2017-2018
Miles of streets swept annually. 4,792 4,816 4,840 4,860
Pounds of debris removed by street sweeping (millions). 1.20 1.38 1.40 1.40
Miles of storm drain mainlines. 130 130 130 130
Percentage of storm drain mainlines cleaned. 9% 10% 18% 20%
Percentage of storm catch basins inspected/cleaned. 34% 43% 50% 50%
Number of after-hours stormwater callouts. 14 10 15 0
362

625: Stormwater
50: Public Works
2014-2015 2015-2016 2016-2017 2016-2017 2017-2018 %Description Actual Actual Adopted Revised Adopted Change
EXPENDITURESPersonnel Services 151,005 233,175 338,000 338,000 303,000 (10.36)% Materials & Services 383,388 385,107 173,200 173,200 251,900 45.44 % TOTAL EXPENDITURES 534,393 618,282 511,200 511,200 554,900 8.55 %
CITY OF ALBANY, OREGONPROG 3003: Stormwater Operations
363

PROGRAM NARRATIVE FORM
STORMWATER FUND: STORMWATER ADMINISTRATION (625-50-3004) Responsible Manager/Title: Chris Bailey, Public Works Operations Director
Jeff Blaine, P.E., Public Works Engineering and Community Development Director
FUNCTIONS AND RESPONSIBILITIES This program provides funding for administration
of the Stormwater fund and programs and the Public Works Internal Services fund, which includes Administration charges and charges for Operations administration, PW Engineering Services, Water Quality Control Services, and Facilities Engineering.
Maintains the contingency for the Stormwater fund.
Maintains a sustainable funding plan for the utility.
STRATEGIES/ACTIONS
Strategic Plan Theme Target Date Status Strategies/Actions
Budget Year 2016-2017
Safe City Effective Government
06/17 Completed Deliver a series of presentations to City Council about the development and implementation of a stormwater utility fee.
06/17 In Progress Apply for National Pollutant Discharge Elimination System (NPDES) Municipal Separate Storm Water Sewer System (MS4) permit in accordance with Department of Environmental Quality (DEQ) requirements.
Budget Year 2017-2018
Effective Government 06/18 Begin implementation of new NPDES MS4 permit upon issuance.
364

625: Stormwater
50: Public Works
2014-2015 2015-2016 2016-2017 2016-2017 2017-2018 %Description Actual Actual Adopted Revised Adopted Change
EXPENDITURESMaterials & Services - - 397,200 397,200 1,323,800 233.28 % Contingencies - - 54,300 54,300 57,300 5.52 % TOTAL EXPENDITURES - - 451,500 451,500 1,381,100 205.89 %
CITY OF ALBANY, OREGONPROG 3004: Stormwater Administration
365

PROGRAM NARRATIVE
STORMWATER FUND: STORMWATER CAPITAL (625-50-3100) Responsible Manager/Title: Staci Belcastro, P.E., City Engineer
FUNCTIONS AND RESPONSIBILITIES Revenues are received from post-
construction stormwater quality permit fees and other post-construction stormwater quality program activities.
Funding provided through this program is used for design review and construction inspection of developer-initiated post-construction stormwater quality facilities.
Complete landscaping requirements on facilities where the developer has funded City installation of plant materials.
Construct post-construction stormwater quality retrofit projects.
STRATEGIES/ACTIONS
Strategic Plan Theme Target Date Status Strategies/Actions
Budget Year 2016-2017
Effective Government 06/17 Completed Build reserves for future projects.
Budget Year 2017-2018
Effective Government 06/18 Build reserves for future projects.
366
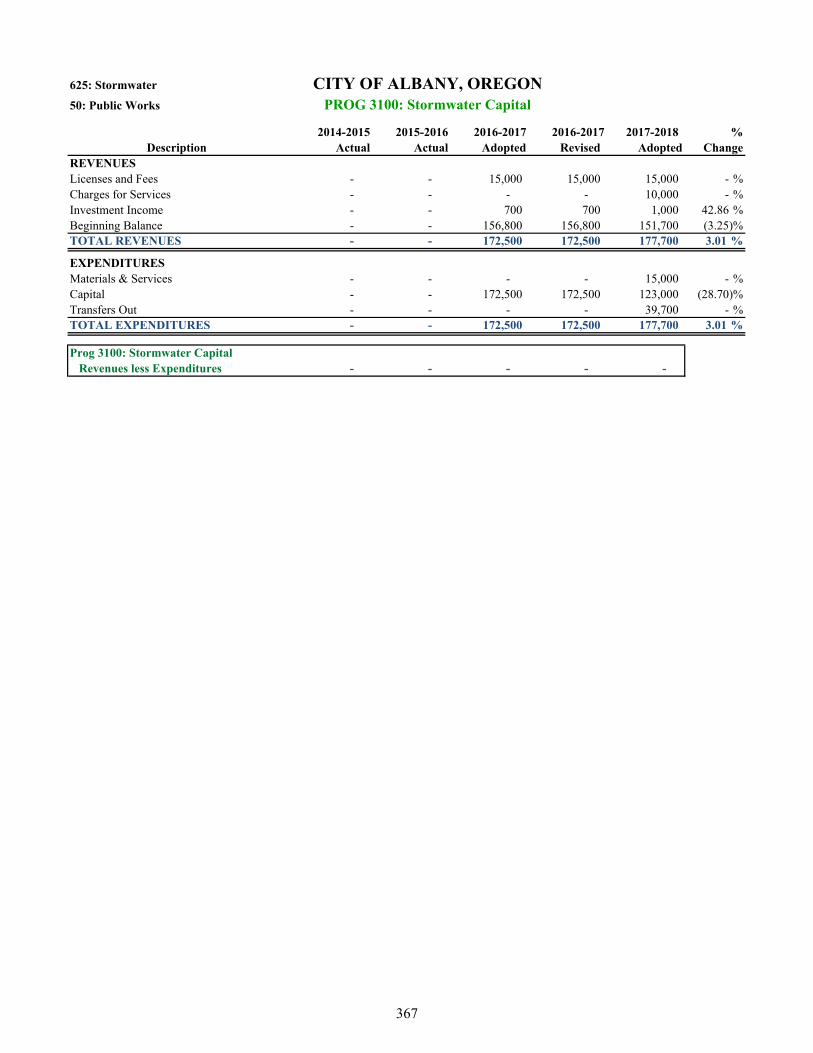
625: Stormwater
50: Public Works
2014-2015 2015-2016 2016-2017 2016-2017 2017-2018 %Description Actual Actual Adopted Revised Adopted Change
REVENUESLicenses and Fees - - 15,000 15,000 15,000 - %Charges for Services - - - - 10,000 - %Investment Income - - 700 700 1,000 42.86 % Beginning Balance - - 156,800 156,800 151,700 (3.25)% TOTAL REVENUES - - 172,500 172,500 177,700 3.01 %
EXPENDITURESMaterials & Services - - - - 15,000 - %Capital - - 172,500 172,500 123,000 (28.70)% Transfers Out - - - - 39,700 - %TOTAL EXPENDITURES - - 172,500 172,500 177,700 3.01 %
Prog 3100: Stormwater Capital Revenues less Expenditures - - - - -
CITY OF ALBANY, OREGONPROG 3100: Stormwater Capital
367

PROGRAM NARRATIVE
STORMWATER FUND: STORMWATER EQUIPMENT REPLACEMENT (625-50-3101) Responsible Manager/Title: Jeff Babbitt, Public Works Business Manager
FUNCTIONS AND RESPONSIBILITIES This program funds replacement of stormwater
system equipment in accordance with an established depreciation and replacement schedule.
Receive revenues from other stormwater fund budgets to fund future equipment replacement.
STRATEGIES/ACTIONS
Strategic Plan Theme Target Date Status Strategies/Actions
Budget Year 2016-2017
Effective Government 06/17 Completed Receive revenues from other stormwater fund budgets to fund future equipment replacement.
Budget Year 2017-2018
Effective Government 06/18 Receive revenues from other stormwater fund budgets to fund future equipment replacement.
368

625: Stormwater
50: Public Works
2014-2015 2015-2016 2016-2017 2016-2017 2017-2018 %Description Actual Actual Adopted Revised Adopted Change
REVENUESCharges for Services - - 21,600 21,600 55,700 157.87 % Investment Income - - 100 100 100 - %Beginning Balance - - - - 21,600 - %TOTAL REVENUES - - 21,700 21,700 77,400 256.68 %
EXPENDITURESReserves - - 21,700 21,700 77,400 256.68 % TOTAL EXPENDITURES - - 21,700 21,700 77,400 256.68 %
Prog 3101: Stormwater Equipment Replacement Revenues less Expenditures - - - - -
CITY OF ALBANY, OREGONPROG 3101: Stormwater Equipment Replacement
369


INTERNAL SERVICE FUNDS


CENTRAL SERVICES FUND
PUBLIC WORKS SERVICES FUND
RESOURCES REQUIREMENTS
Charges for Services 14,945,200 Personnel 11,512,600Other Revenues 40,000 Materials & Services 3,808,700Investment Earnings 6,900Transfers in 17,100Beginning Balance 312,100
Total Resources 15,321,300$ Total Requirements 15,321,300$
On a Citywide basis, each operating program is charged fees for the services provided by the Central Services Fund. The feesare based on a range of factors including number of personnel, current operating budget, pieces of information technologyequipment, usage of the GIS and Permit Tracking systems, square footage, and age of City buildings.
The Public Works Services Fund is divided into six programs: Administration, Engineering Services, Operations Administration,Water Quality Control Services, Public Works Customer Services, and Facilities and Maintenance Engineering, which primarilyprovide services to the Water, Sewer, and Street Funds. Responsibilities include management of public improvements, trafficengineering and design, fee and rate development guidance, laboratory testing of water and wastewater samples, water andsanitary sewer flow monitoring, oversight of the bridge maintenance program, and oversight and development of the automatedprocess control and monitoring system for water and sewer treatment.
INTERNAL SERVICE FUNDS
PROGRAM FUNCTIONS, REVENUE TRENDS, AND ASSUMPTIONS
Internal Service funds are used to account for the financing of goods and/or services provided to various City departments on acost-reimbursement basis. The City has two Internal Service funds.
The Central Services Fund provides services to all City departments. Those services are provided by the following programs:City Council & Nondepartmental, City Manager's Office, Finance, Human Resources, Information Technology Services,Geographic Information Systems Services, Permit Tracking Services, and Building Maintenance.
370


COST ALLOCATION METHODOLOGY FOR CENTRAL SERVICES FUND PROGRAMS
ADMINISTRATIVE SERVICES
INFORMATION TECHNOLOGY (IT)
GEOGRAPHIC INFORMATION SYSTEMS (GIS)
PERMIT TRACKING
BUILDING MAINTENANCE
FISCAL YEAR SURPLUS/DEFICITAt fiscal year end, any surplus, total revenues less total expenditures, will be refunded Citywide using the same allocationproportion as when initially charged. An allowance for the estimated beginning balance of the new fiscal year will be consideredwhen determining the amount of the refund. In a deficit situation, significant additional charges would be approved and programexpenditures appropriated by City Council action.
Permit Tracking is responsible for the day-to-day operation of the City's permit tracking software, including development,maintenance, and implementation of source code and documents required for generating permits and collecting fees. The PermitTracking budget is reduced by estimated interest earnings and beginning balance to determine the net amount to allocate. Thenet budget is charged to using programs based on their estimated use of services. For Fiscal Year 2017-18, the Permit Trackingcharges to using programs will be $112,800.
Building Maintenance is responsible for providing in-house and contractual services for building maintenance, repair, andrenovation of sixteen City facilities including City Hall, both libraries, four fire stations, the Police Station, and Parks, Airport,and Transit facilities. The estimated Building Maintenance budget is allocated based on a formula which considers a number offactors including square footage and age of the facility. For Fiscal Year 2017-18, the Building Maintenance charges to usingprograms will be $789,000.
Administrative Services includes four programs: City Council and Nondepartmental, City Manager's Office, Finance, andHuman Resources. To calculate the amount of administrative charges to be allocated Citywide, the estimated budgets of the fourprograms are added together to determine the gross budget. Interest, miscellaneous revenues, and estimated beginning balanceare subtracted from the gross budget to determine the net budget to allocate.
The net budgets for the four programs are divided into three cost centers: personnel, special assessments, and everything else.The total budget of the 'personnel' cost center is allocated Citywide based on employee full-time equivalents (FTE). The totalbudget of the 'special assessment' cost center is allocated to the funds which generate property assessments: Water, Sewer, Street,and Parks Funds. The 'everything else' cost center is allocated Citywide based on a fund's current year operating budget. TheCity does not allocate Central Services charges to the Grants, Risk Management, Public Safety Levy, Capital Replacement, DebtService, Capital Projects, and Permanent Funds.
For Fiscal Year 2017-18, the net budget to allocate is $3,370,800, and the operating budget allocation basis is $79,313,400,making the administrative central service charge average $0.0425 per $1 of operating budget.
Information Technology Services is responsible for maintenance and support of the City's network infrastructure, businessapplications, telephone system, server room operations, database systems, systems security, backup and restore services, andhardware maintenance and replacement.
The first step in calculating IT Service charges is to prepare the estimated budget for the IT Services program and to prepare alist of all of the IT equipment, personal computers, laptop computers, and mobile data terminals it is responsible for servicing.The IT Services estimated budget is allocated as a Citywide service charge based on the number of pieces of equipment on thelist. For Fiscal Year 2017-18, the net budget to allocate is $1,518,000 and the total number of pieces of equipment in theallocation basis is 417, making the information technology charge $3,640 per piece of equipment.
GIS Services coordinates the planning, implementation, and maintenance of the Citywide Geographic Information System. TheGIS Services program provides mapping services, analysis, application development, GIS software, and GIS training toparticipating departments. The GIS Services estimated budget is reduced by GIS sales, interest earnings, and beginning balanceto determine the amount to allocate. The net budget is distributed to using programs based on their estimated use of services.For Fiscal Year 2017-18, the GIS charges to using programs will be $457,400.
371

CENTRAL SERVICES FUNDRESOURCE DETAIL
2017-18 % Change % of
2014-15 2015-16 Adopted Revised Adopted from FundResources Actual Actual Budget Budget Budget 2016-17 Budget_________________________________________________________________________________________________________WComp Wage Subsidy Reimb -$ 179$ -$ -$ -$ - - GIS Information Sales Revenue 145 90 - - - - - Building Maintenance Charges 709,000 552,984 761,300 761,300 789,000 3.64% 11.83%Administrative Services Charges 3,082,900 3,106,496 3,487,300 3,487,300 3,485,500 (0.05%) 52.23%Information Technology Charges 1,366,200 1,438,900 1,450,700 1,450,700 1,518,000 4.64% 22.75%GIS Services Charge 395,700 298,180 425,900 425,900 457,400 7.40% 6.86%Permit Tracking Services Charge 116,900 106,073 118,700 118,700 112,800 (4.97%) 1.69%Miscellaneous Revenue 47,510 57,769 40,000 40,000 40,000 - 0.60%Interest 2,407 6,709 1,000 1,000 4,000 300.00% 0.06%_________________________________________________________________________________________________________Total Current Resources 5,720,762 5,567,344 6,284,900 6,284,900 6,406,700 1.94% 96.02%_________________________________________________________________________________________________________From Economic Development - - - - 17,100 - 0.26%_________________________________________________________________________________________________________Total Transfers In - - - - 17,100 - 0.26%_________________________________________________________________________________________________________Beginning Balance 304,275 490,789 82,300 82,300 248,500 201.94% 3.72%_________________________________________________________________________________________________________Total Resources 6,025,037$ 6,058,133$ 6,367,200$ 6,367,200$ 6,672,300$ 4.79% 100.00%__________________________________________________________________________________________________________________________________________________________________________________________________________________
GIS - Geographic Information Systems
CENTRAL SERVICES FUND RESOURCESCategory Totals and Percent of Budget
……2016-17……
* Council & Nondepartmental, City Manager's Office, Finance, and Human Resources
Administrative Services* $3,485,500
(52.24%)
Information Technology $1,518,000
(22.75%)
Building Maintenance $789,000 (11.83%)
GIS $457,400 (6.86%)
Permit Tracking $112,800 (1.69%)
Other Resources $61,100 (0.91%)
Beginning Balance $248,500 (3.72%)
372

CENTRAL SERVICES FUNDREQUIREMENT/STAFFING SUMMARIES
2014-15 2015-16Program Requirements Actual Actual Adopted Revised Proposed Approved Adopted_______________________________________________________________________________________________________Finance Department 1,415,178$ 1,444,354$ 1,503,800$ 1,503,800$ 1,616,800$ 1,616,800$ 1,616,800$ Council & Nondepartmental 205,829 217,522 211,700 211,700 205,400 205,400 205,400 City Manager's Office 901,955 856,998 862,500 862,500 972,300 972,300 972,300 IT Services 1,298,780 1,535,684 1,618,700 1,618,700 1,671,700 1,671,700 1,671,700 Human Resources 585,277 636,126 844,600 844,600 838,900 838,900 838,900 Facilities Maintenance 690,910 701,509 761,300 761,300 789,000 789,000 789,000 GIS Services 320,233 426,468 440,900 440,900 457,400 457,400 457,400 Permit Tracking 115,463 113,236 123,700 123,700 120,800 120,800 120,800 _______________________________________________________________________________________________________Total Requirements 5,533,625$ 5,931,897$ 6,367,200$ 6,367,200$ 6,672,300$ 6,672,300$ 6,672,300$ ______________________________________________________________________________________________________________________________________________________________________________________________________________
2014-15 2015-16Requirements by Type Actual Actual Adopted Revised Proposed Approved Adopted_______________________________________________________________________________________________________Personnel 3,927,565$ 4,068,614$ 4,418,900$ 4,418,900 4,742,700$ 4,742,700$ 4,742,700$ Materials & Services 1,606,060 1,863,285 1,948,300 1,948,300 1,929,600 1,929,600 1,929,600 _______________________________________________________________________________________________________Total Requirements 5,533,625$ 5,931,899$ 6,367,200$ 6,367,200$ 6,672,300$ 6,672,300$ 6,672,300$ ______________________________________________________________________________________________________________________________________________________________________________________________________________
Adopted Requirements Materials Adopted % of Fundby Program and Type Personnel & Services Budget Budget_______________________________________________________________________________________________________Finance Department 1,353,000$ 263,800$ 1,616,800$ 24.23%Council & Nondepartmental 17,800 187,600 205,400 3.08%
……2016-17…… ……2017-18……
……2016-17…… ……2017-18……
City Manager's Office 632,000 340,300 972,300 14.57%IT Services 1,312,500 359,200 1,671,700 25.05%Human Resources 691,300 147,600 838,900 12.57%Facilities Maintenance 375,000 414,000 789,000 11.83%GIS Services 310,400 147,000 457,400 6.86%Permit Tracking 50,700 70,100 120,800 1.81%_______________________________________________________________________________________________________Total Requirements 4,742,700$ 1,929,600$ 6,672,300$ 100.00%______________________________________________________________________________________________________________________________________________________________________________________________________________Percent of Fund Budget 71.08% 28.92% 100.00%________________________________________________________________________________________________________________________________________________________________________________________
2014-15 2015-16Staffing Summary (FTE) Actual Actual Adopted Revised Proposed Approved Adopted_______________________________________________________________________________________________________Council & Nondepartmental 7.000 7.000 7.000 7.000 7.000 7.000 7.000 City Manager's Office 4.700 3.700 3.700 3.700 4.700 4.700 4.700 IT Services 9.500 10.500 10.500 10.500 10.500 10.500 10.500 Human Resources 4.000 4.000 4.000 4.000 5.000 5.000 5.000 Facilities Maintenance 2.500 3.500 3.500 3.500 3.500 3.500 3.500 Finance Department 10.000 10.000 10.000 10.000 11.000 11.000 11.000 GIS Services 2.000 2.000 2.000 2.000 2.000 2.000 2.000 Permit Tracking 0.500 0.500 0.500 0.500 0.500 0.500 0.500 _______________________________________________________________________________________________________Total FTE 40.200 41.200 41.200 41.200 44.200 44.200 44.200 ______________________________________________________________________________________________________________________________________________________________________________________________________________
……2016-17…… ……2017-18……
373

PROGRAM NARRATIVE
CENTRAL SERVICES: FINANCE DEPARTMENT (701-10-1035) Responsible Manager/Title: Stewart Taylor, Finance Director
FUNCTIONS AND RESPONSIBILITIES Provide administration and management of the City’s
financial services including general ledger, budget preparation, payroll, purchasing, assessments, accounts payable and receivable, and treasury.
Maintain official records and legal documents of the City and provide for the recording of necessary records with Linn County, Benton County, and the state.
Prepare a Comprehensive Annual Financial Report (CAFR), Popular Annual Financial Report (PAFR), and annual budget document. Submit each to the Government Finance Officers Association (GFOA) to be considered for annual awards of excellence.
Administer risk management and franchise functions for the City.
STRATEGIES/ACTIONS
Strategic Plan Theme
Target Date Status Strategies/Actions
Budget Year 2016-2017
Effective Government 10/16 Ongoing Maximize efficiencies in payroll and time management through the use of NovaTime time and attendance software.
12/16
06/17
Completed
Partially completed
Implement Uniform Grant Guidance for federal reporting
Receive GFOA awards of excellence for the 2016 CAFR, PAFR, and Adopted Budget.
Budget Year 2017-2018
Effective Government 9/17 Identify an alternative to Eden financial soft-ware and a viable funding source.
01/17 Conduct a successful recruitment for a new Finance Director.
06/18 Receive GFOA awards of excellence for the 2017 CAFR, PAFR, and Adopted Budget.
PERFORMANCE MEASURES AND WORKLOAD INDICATORS
2014-2015 2015-2016 2016-2017* 2017-2018 Number of consecutive years - GFOA Distinguished 24 25 26 27 Budget Presentation Award. Number of consecutive years - GFOA Excellence in 31 32 33 34 Financial Reporting Award. Number of Accounts Payable payments. 7,249 5,934 3,049 6,098 Average number of active assessments. 175 122 157 157 Average number of monthly paychecks issued. 444 448 453 453 Number of RFPs, ITBs, and other formal purchasing 37 45 45 45 processes. Average number of documents recorded and filed each 78 80 80 80 month.
*YTD through December
STAFFING SUMMARY Budgeted FTEs 9.75 10.00 10.00 11.00
374

701: Central Services
10: Finance
2014-2015 2015-2016 2016-2017 2016-2017 2017-2018 %Description Actual Actual Adopted Revised Adopted Change
EXPENDITURESPersonnel Services 1,129,150 1,148,346 1,238,100 1,238,100 1,353,000 9.28 % Materials & Services 286,028 296,008 265,700 265,700 263,800 (0.72)% TOTAL EXPENDITURES 1,415,178 1,444,354 1,503,800 1,503,800 1,616,800 7.51 %
CITY OF ALBANY, OREGONPROG 1035: Finance Department
375

PROGRAM NARRATIVE
CENTRAL SERVICES: COUNCIL & NONDEPARTMENTAL (701-11-1027) Responsible Manager/Title: Wes Hare, City Manager
FUNCTIONS AND RESPONSIBILITIES
The seven-member City Council is responsible for establishing general policies that govern the functions and operations of the City, accomplished primarily through the adoption of ordinances and resolutions.
The Council meets in regular meetings on 24 occasions during the year. In addition, many special meetings and Council work sessions are held to study upcoming issues and develop an understanding of their impact upon the community.
Develop a balanced budget that reflects changing costs, revenues, and constitutional limitations.
The Council members represent the City in many areas of community activity; e.g., AMEDC, Linn-Benton Transit Committee, Cascades West Council of Governments, and Albany Visitors Association.
Publish City Bridges on-line monthly.
Implement multiyear Strategic Plan.
Use economic development resources to improve prosperity throughout the community.
STRATEGIES/ACTIONS
Strategic Plan Theme TargetDate Status Strategies/Actions
Budget Year 2016-2017
Effective Government 07/17 In Progress Complete new City Manager recruitment.
Healthy Economy 06/20 In Progress Implement contract with local manufacturers to create 250 jobs within five years.
Safe City 07/17 In Progress Complete construction of new police and fire stations.
Budget Year 2017-2018
Healthy Economy 06/20 Implement contract with local manufacturers to create 250 jobs within five years.
Safe City 09/17 Complete construction of new police and fire stations.
PERFORMANCE MEASURES AND WORKLOAD INDICATORS
2014-2015 2015-2016 2016-2017 2017-2018 Update the City’s Strategic Plan annually. Yes Yes Yes Yes
STAFFING SUMMARY
Budgeted FTEs 7.00 7.00 7.00 7.00
376

701: Central Services
11: City Manager's Office
2014-2015 2015-2016 2016-2017 2016-2017 2017-2018 %Description Actual Actual Adopted Revised Adopted Change
EXPENDITURESPersonnel Services 15,187 15,703 17,800 17,800 17,800 - %Materials & Services 190,641 201,819 193,900 193,900 187,600 (3.25)% TOTAL EXPENDITURES 205,828 217,522 211,700 211,700 205,400 (2.98)%
CITY OF ALBANY, OREGONPROG 1027: Council & Nondepartmental
377

PROGRAM NARRATIVE
CENTRAL SERVICES: CITY MANAGER’S OFFICE (701-11-1028) Responsible Manager/Title: Wes Hare, City Manager
FUNCTIONS AND RESPONSIBILITIES
Provide leadership, coordination, and management for the affairs of the City.
Provide oversight for the City Attorney contract, budget development, legislative activities, and public information.
Conduct annual review of City’s Strategic Plan.
Monitor legislative sessions.
Work with local businesses to assist with job creation.
STRATEGIES/ACTIONS
Strategic Plan Theme Target Date Status Strategies/Actions
Budget Year 2016-2017
Effective Government 07/17 In Progress Complete police and fire stations.
Budget Year 2017-2018
Effective Government 09/17 Complete police and fire stations.
09/17 Begin recruitment process for Finance Director.
10/17 Begin recruitment process for Human Resources Director.
PERFORMANCE MEASURES AND WORKLOAD INDICATORS
2014-2015 2015-2016 2016-2017* 2017-2018 Percent of departments that rate legal services 100% 91% 100% 100% as satisfactory or better.
* actual YTD thru 1-25-17
STAFFING SUMMARY
Budgeted FTEs 4.70 3.70 3.70 4.70
378

701: Central Services
11: City Manager's Office
2014-2015 2015-2016 2016-2017 2016-2017 2017-2018 %Description Actual Actual Adopted Revised Adopted Change
EXPENDITURESPersonnel Services 617,868 524,447 529,400 529,400 632,000 19.38 % Materials & Services 284,087 332,552 333,100 333,100 340,300 2.16 % TOTAL EXPENDITURES 901,955 856,999 862,500 862,500 972,300 12.73 %
CITY OF ALBANY, OREGONPROG 1028: City Manager's Office
379

PROGRAM NARRATIVE
CENTRAL SERVICES: INFORMATION TECHNOLOGY (701-13-1030) Responsible Manager/Title: Jorge Salinas, Assistant City Manager/CIO
FUNCTIONS AND RESPONSIBILITIES Responsible for maintenance and support of
network and virtual infrastructure, business applications, telephone system, server room operations, database systems, information system security, desktops, laptops, and mobile data terminals.
Provide system analyst and IT project management services, including gathering requirements and mapping business processes.
Provide Web and graphic services to all City Departments.
Manage software licensing program, assist departments in improving service through the effective use of technology, and provide limited software training to City employees.
Provide IT Help Desk services to all City departments, including installation and configuration of software and hardware-related equipment.
PERFORMANCE MEASURES AND WORKLOAD INDICATORS
2014-2015 2015-2016 2016-2017 2017-2018 Number of IT service requests per year. 5,459 6,165 6764 5,100
Monthly average closed calls. 454 513 563.7 425
System availability. 99.99% 99.99% 99.99% 99.99%
Number of servers and workstations supported. 620 619 625 654
Timeliness of services provided (Excellent or Good) 94% 92% 93.61% 90%
Quality of services provided (Excellent or Good) 95% 89.8% 91.49% 90%
STAFFING SUMMARY
Budgeted FTEs 8.50 9.50 10.50 10.50
STRATEGIES/ACTIONS
Strategic Plan Theme Target Date Status Strategies/Actions
Budget Year 2016-2017 Effective Government 11/16
Completed Upgrade Virtual Infrastructure (i.e.,
Storage Area Network (SAN), hosts and fiber channel switches).
04/17 In Progress Core network switch upgrade.
Budget Year 2017-2018
Effective Government 07/17 Phone system upgrade.
07/17 MS Office upgrade.
03/18 Cyber security testing/analysis.
05/18 Evaluate the feasibility of deploying a 311 solution for the City.
380

701: Central Services
13: Information Technology
2014-2015 2015-2016 2016-2017 2016-2017 2017-2018 %Description Actual Actual Adopted Revised Adopted Change
REVENUESCharges for Services 1,366,200 1,531,168 1,563,700 1,563,700 1,632,700 4.41 % Miscellaneous Revenue 1,067 2,070 - - - - %Investment Income 412 1,445 - - 2,000 - %Transfers In - - - - 17,100 - %Beginning Balance 30,123 99,023 55,000 55,000 19,900 (63.82)% TOTAL REVENUES 1,397,802 1,633,706 1,618,700 1,618,700 1,671,700 3.27 %
EXPENDITURESPersonnel Services 1,063,000 1,199,738 1,290,900 1,290,900 1,312,500 1.67 % Materials & Services 235,779 335,945 327,800 327,800 359,200 9.58 % TOTAL EXPENDITURES 1,298,779 1,535,683 1,618,700 1,618,700 1,671,700 3.27 %
Prog 1030: Information Technology Services Revenues less Expenditures 99,023 98,023 - - -
CITY OF ALBANY, OREGONPROG 1030: Information Technology Services
381

PROGRAM NARRATIVE
CENTRAL SERVICES: GEOGRAPHIC INFORMATION SERVICES (701-13-2010) Responsible Manager/Title: Richard Montague, Data Systems Manager
FUNCTIONS AND RESPONSIBILITIES
Coordinate the planning, implementation, and
maintenance of a computerized Geographic Information System (GIS) accessible to all departments. Evaluate and implement significant software upgrades.
Provide timely maintenance and enhancements for data sets including parcels, zoning, addressing, transportation, environ-mental, political, etc.
Provide data and record-keeping services.
Coordinate with other governmental agencies conducting mutually beneficial GIS projects, including Linn and Benton Counties and the cities of Corvallis and Lebanon.
Provide mapping services, analysis, application development, GIS software, and GIS training to participating City departments.
STRATEGIES/ACTIONS
Strategic Plan Theme Target Date Status Strategies/Actions
Budget Year 2016-2017
Effective Government 08/16
10/16
Complete
Complete
Implement BuildingEye software.
Complete Aerial Mapping Update Project.
Budget Year 2017-2018
Effective Government
1/18
Develop a routing map service and use it to enable the inspectors routing feature in Accela.
12/18 Work with Community Development to update the wetlands GIS layers to reflect new wetland delineations.
12/18 Complete upgrade to ArcGIS 10.3.
PERFORMANCE MEASURES AND WORKLOAD INDICATORS
2014-2015 2015-2016 2016-2017 2017-2018 Complete or schedule GIS user requests 90% 90% 90% 90% within three working days. As requests to create routine mapping and analysis products are received, GIS staff will review the project requirements with the submitting department. For smaller projects, GIS staff will complete the work within three working days of finalizing the project requirements. For larger projects, GIS staff will provide a schedule for completion of the project within three working days of finalizing the project requirements.
STAFFING SUMMARY
Budgeted FTEs 2.50 2.00 2.00 2.00
382

701: Central Services
13: Information Technology
2014-2015 2015-2016 2016-2017 2016-2017 2017-2018 %Description Actual Actual Adopted Revised Adopted Change
REVENUESCharges for Services 395,845 298,270 425,900 425,900 457,400 7.40 % Investment Income 849 1,350 - - - - %Beginning Balance 65,916 142,458 15,000 15,000 - (100.00)% TOTAL REVENUES 462,691 442,078 440,900 440,900 457,400 3.74 %
EXPENDITURESPersonnel Services 217,187 257,326 301,100 301,100 310,400 3.09 % Materials & Services 103,045 169,143 139,800 139,800 147,000 5.15 % TOTAL EXPENDITURES 320,232 426,469 440,900 440,900 457,400 3.74 %
Prog 2010: GIS Services Revenues less Expenditures 142,459 15,609 - - -
CITY OF ALBANY, OREGONPROG 2010: GIS Services
383

PROGRAM NARRATIVE
CENTRAL SERVICES: PERMIT TRACKING (701-13-2011) Responsible Manager/Title: Jorge Salinas, Assistant City Manager/CIO
FUNCTIONS AND RESPONSIBILITIES Provide daily user support and guidance to using
departments; develop documentation for system procedures.
Update Accela system to meet user expectations.
Design program reports for system users.
STRATEGIES/ACTIONS
Strategic Plan Theme Target Date Status Strategies/Actions
Budget Year 2016-2017
Effective Government 12/16 Complete Assist with the implementation of additional permit types for Accela Citizen Access.
Budget Year 2017-2018
Effective Government 12/17 Accela upgrade. This includes moving users to a new interface.
PERFORMANCE MEASURES AND WORKLOAD INDICATORS
2014-2015 2015-2016 2016-2017 2017-2018 Complete user requests within 94% 92% 93.61% 90% established customer expectations. As requests for new enhancements and additions are received, the program analyst will review the requirements with the submitting department. For smaller projects, the analyst will complete the work within two working days of finalizing the project requirements. For larger projects, the analyst will provide a schedule for project completion within two working days of finalizing the project requirements.
STAFFING SUMMARY Budgeted FTEs 0.50 0.50 0.50 0.50
384

701: Central Services
13: Information Technology
2014-2015 2015-2016 2016-2017 2016-2017 2017-2018 %Description Actual Actual Adopted Revised Adopted Change
REVENUESCharges for Services 116,900 106,073 118,700 118,700 112,800 (4.97)% Investment Income (1) 111 - - - - %Beginning Balance 10,813 12,249 5,000 5,000 8,000 60.00 % TOTAL REVENUES 127,712 118,433 123,700 123,700 120,800 (2.34)%
EXPENDITURESPersonnel Services 52,505 48,447 49,800 49,800 50,700 1.81 % Materials & Services 62,958 64,790 73,900 73,900 70,100 (5.14)% TOTAL EXPENDITURES 115,463 113,237 123,700 123,700 120,800 (2.34)%
Prog 2011: Permit Tracking Revenues less Expenditures 12,249 5,196 - - -
CITY OF ALBANY, OREGONPROG 2011: Permit Tracking
385

PROGRAM NARRATIVE
CENTRAL SERVICES: HUMAN RESOURCES (701-14-1032) Responsible Manager/Title: David Shaw, Human Resources Director
FUNCTIONS AND RESPONSIBILITIES
Provide leadership and expertise in attracting, retaining, and sustaining an effective and high-quality workforce committed to providing quality public service for a better Albany.
Increase diversity of the City’s applicant pools and workforce for underrepresented populations.
Continue and enhance the Wellness Program and Benefits Committee.
Provide recruitment, training and development, safety compliance, employee relations, benefit and compensation administration, and collective bargaining services to the City of Albany.
STRATEGIES/ACTIONS
Strategic Plan Theme Target Date Status Strategies/Actions
Budget Year 2016-2017
Effective Government 07/16 In Progress Negotiate a fiscally responsible collective bargaining agreement with the Albany Police Association.
07/16 In Progress Negotiate a fiscally responsible collective bargaining agreement with the IAFF Local 845 Fire Union.
01/17 Completed Implement new health insurance plan and VEBA for AFSCME, Nonbargaining, and Executive employees.
Budget Year 2017-2018
Effective Government 09/17 Negotiate a fiscally responsible collective bargaining agreement with the Albany Police Association.
09/17 Negotiate a fiscally responsible collective bargaining agreement with the IAFF Local 845 Fire Union.
01/18 Implement new health insurance plan and VEBA for IAFF Local 845 Fire Union and Albany Police Association employees.
PERFORMANCE MEASURES AND WORKLOAD INDICATORS
2014-2015 2015-2016 2016-2017* 2017-2018 Personnel Action forms processed. 791 761 674 750 Percent processed by monthly deadline. 99.8% 99.7% 100% 100% Recruitments. 44 48 30 45 Applications processed. 2,428 1,896 1,655 1,800 FMLA cases. 67 91 29 60 Worker’s Comp claims filed. 58 51 17 40
* Numbers are through January 20, 2017.
STAFFING SUMMARY
Budgeted FTEs 4.00 4.00 4.00 5.00
386

701: Central Services
14: Human Resources
2014-2015 2015-2016 2016-2017 2016-2017 2017-2018 %Description Actual Actual Adopted Revised Adopted Change
EXPENDITURESPersonnel Services 497,330 527,666 616,200 616,200 691,300 12.19 % Materials & Services 87,947 108,460 228,400 228,400 147,600 (35.38)% TOTAL EXPENDITURES 585,277 636,126 844,600 844,600 838,900 (0.67)%
CITY OF ALBANY, OREGONPROG 1032: Human Resources
387

PROGRAM NARRATIVE
Central Service Fund: Parks & Recreation Department, Facilities Maintenance (701-35-1033)
Responsible Manager/Title: Rick Barnett, Park Operations Supervisor
FUNCTIONS AND RESPONSIBILITIES
Provide both in-house and contractual services for building maintenance, repair, and renovation at seventeen City facilities including City Hall, libraries, fire stations, police station, park buildings, airport, train depot, operations, and transit.
STRATEGIES/ACTIONS
Strategic Plan Theme
Target Date Status Strategies/Actions
Budget Year 2016-2017
Effective Government 06/17 Completed Develop plan to replace aging HVAC system at City Hall.
06/17 Completed Continue to look for energy saving opportunities at all City facilities.
Budget Year 2017-2018
Effective Government 06/18 Complete carpet replacement first and second floors of City Hall.
06/18 Research solar power for Main Library and Fire Stations 12, 13 and 14.
PERFORMANCE MEASURES AND WORKLOAD INDICATORS 2014-2015 2015-2016 2016-2017 2017-2018 Number of work requests completed. 2,700 2,630 2,630 2,820 FTE per 50,000 sq. ft. of facilities. .75 .75 .75 .75 Avg. cost per unit of service, in-house. $2.30 sq. ft. $2.32 sq. ft. $2.34 sq. ft. $2.49 sq. ft. STAFFING SUMMARY Budgeted FTEs 3.50 3.50 3.50 3.50
388

701: Central Services
35: Parks
2014-2015 2015-2016 2016-2017 2016-2017 2017-2018 %Description Actual Actual Adopted Revised Adopted Change
REVENUESCharges for Services 709,000 552,984 761,300 761,300 789,000 3.64 % Beginning Balance 129,632 148,105 - - - - %TOTAL REVENUES 839,015 701,808 761,300 761,300 789,000 3.64 %
EXPENDITURESPersonnel Services 335,336 346,941 375,600 375,600 375,000 (0.16)% Materials & Services 355,574 354,568 385,700 385,700 414,000 7.34 % TOTAL EXPENDITURES 690,910 701,509 761,300 761,300 789,000 3.64 %
Prog 1033: Facilities Maintenance Revenues less Expenditures 148,105 299 - - -
CITY OF ALBANY, OREGONPROG 1033: Facilities Maintenance
389

PUBLIC WORKS CENTRAL SERVICES FUNDRESOURCE DETAIL
2017-18 % Change % of
2014-15 2015-16 Adopted Revised Adopted from FundResources Actual Actual Budget Budget Budget 2016-17 Budget___________________________________________________________________________________________________________Dept Charges - Water 2,332,473$ 2,666,494$ 3,118,000$ 3,118,000$ 2,566,600$ (17.68%) 29.68%Dept Charges - Sewer 2,652,266 3,016,506 3,071,900 3,071,900 2,864,200 (6.76%) 33.12%Dept Charges - Streets 688,353 744,188 708,300 708,300 634,600 (10.41%) 7.34%Dept Charges - Airport 16,019 12,117 11,900 11,900 10,800 (9.24%) 0.12%Dept Charges - Transit 95,190 77,390 110,300 110,300 114,800 4.08% 1.33%Dept Charges - CIP 789,648 840,551 1,009,000 1,009,000 1,031,300 2.21% 11.92%Dept Charges - Planning 31,906 35,421 38,400 38,400 36,300 (5.47%) 0.42%Dept Charges - Bldg Inspection 51,092 82,546 86,800 86,800 77,400 (10.83%) 0.89%Dept Charges - Elec Permit 5,674 10,466 9,200 9,200 8,600 (6.52%) 0.10%Dept Charges - Stormwater - - 346,400 346,400 1,237,900 257.36% 14.31%Miscellaneous Revenue 2,561 9,102 - - - - - Interest 2,210 4,355 - - 2,900 - 0.03%___________________________________________________________________________________________________________Total Current Resources 6,667,392 7,499,136 8,510,200 8,510,200 8,585,400 0.88% 99.26%___________________________________________________________________________________________________________Beginning Balance 617,913 179,765 68,500 68,500 63,600 (7.15%) 0.74%___________________________________________________________________________________________________________Total Resources 7,285,305$ 7,678,901$ 8,578,700$ 8,578,700$ 8,649,000$ 0.82% 100.00%______________________________________________________________________________________________________________________________________________________________________________________________________________________
SOURCE OF REVENUE - DEPARTMENTAL CHARGES FOR SERVICES
……2016-17……
Water $3,118,000 (36 64%)(36.64%)
Sewer $3,071,900 (36.1%)
Streets $708,300 (8.32%)
Airport $11,900 (0.14%) Transit $110,300 (1.3%)
CIP $1,009,000 (11.85%)
Planning $38,400 (0.45%)
Building $86,800 (1.02%)
Electric Permits $9,200 (0.11%)
Stormwater $1,237,900 (14.42%)
390

PUBLIC WORKS CENTRAL SERVICES FUNDREQUIREMENT/STAFFING SUMMARIES
2014-15 2015-16Program Requirements Actual Actual Adopted Revised Proposed Approved Adopted___________________________________________________________________________________________________________PW Administration 1,168,025$ 1,183,061$ 1,303,200$ 1,303,200$ 1,184,100$ 1,184,100$ 1,184,100$ Engineering Services 2,311,949 2,498,693 2,964,500 2,964,500 2,945,600 2,945,600 2,945,600 Operations Admin 541,333 528,614 561,500 561,500 566,100 566,100 566,100 Water Quality Control Service 339,450 356,224 391,700 391,700 523,700 523,700 523,700 PW Customer Services 1,143,031 1,186,257 1,379,300 1,379,300 1,391,100 1,391,100 1,391,100 Facilities & Maintenance Engineering
1,601,750 1,686,822 1,978,500 1,978,500 2,038,400 2,038,400 2,038,400
___________________________________________________________________________________________________________Total Requirements 7,105,538$ 7,439,671$ 8,578,700$ 8,578,700$ 8,649,000$ 8,649,000$ 8,649,000$ ______________________________________________________________________________________________________________________________________________________________________________________________________________________
PW-Public Works
2014-15 2015-16Requirements by Type Actual Actual Adopted Revised Proposed Approved Adopted___________________________________________________________________________________________________________Personnel 5,567,970$ 5,872,318$ 6,752,600$ 6,752,600$ 6,769,900$ 6,769,900$ 6,769,900$ Materials & Services 1,537,568 1,567,354 1,826,100 1,826,100 1,879,100 1,879,100 1,879,100 ___________________________________________________________________________________________________________Total Requirements 7,105,538$ 7,439,672$ 8,578,700$ 8,578,700$ 8,649,000$ 8,649,000$ 8,649,000$ ______________________________________________________________________________________________________________________________________________________________________________________________________________________
Adopted Requirements Materials Adopted % of Fundby Program and Type Personnel & Services Budget Budget___________________________________________________________________________________________________________PW Administration 996,900$ 187,200$ 1,184,100$ 13.68%Engineering Services 2,540,300 405,300 2,945,600 34.06%Operations Admin 223,100 343,000 566,100 6.55%Water Quality Control Service 461,900 61,800 523,700 6.06%PW Customer Services 787,800 603,300 1,391,100 16.08%Facilities & Maintenance Engineering
1,759,900 278,500 2,038,400 23.57%
___________________________________________________________________________________________________________Total Requirements 6,769,900 1,879,100 8,649,000$ 100.00%______________________________________________________________________________________________________________________________________________________________________________________________________________________Percent of Fund Budget 78.27% 21.73% 100.00%________________________________________________________________________________________________________________________________________________________________________________________________
2014-15 2015-16Staffing Summary (FTE) Actual Actual Adopted Revised Proposed Approved Adopted___________________________________________________________________________________________________________PW Administration 10.000 10.000 10.000 10.000 9.000 9.000 9.000 Engineering Services 17.000 20.000 19.000 19.000 19.000 19.000 19.000 Operations Admin 2.000 2.000 1.000 1.000 1.000 1.000 1.000 Water Quality Control Service 3.000 3.000 3.000 3.000 4.000 4.000 4.000 PW Customer Services 9.000 9.000 9.000 9.000 9.000 9.000 9.000 Facilities & Maintenance Engineering 13.000 13.000 15.000 15.000 15.000 15.000 15.000 ___________________________________________________________________________________________________________Total FTE 54.000 57.000 57.000 57.000 57.000 57.000 57.000 ______________________________________________________________________________________________________________________________________________________________________________________________________________________
……2016-17…… ……2017-18……
……2016-17…… ……2017-18……
……2016-17…… ……2017-18……
391

PROGRAM NARRATIVE
PUBLIC WORKS SERVICES FUND: PW ADMINISTRATION (705-50-2802) Responsible Manager/Title: Jeff Blaine, P.E., Public Works Engineering and
Community Development Director
FUNCTIONS AND RESPONSIBILITIES
This program provides funding for Public Works Administration Charges, which is an overhead cost to the Public Works (PW) and Community Development (CD) Departments’ programs in the Airport, Transit, Water, Sewer, Street, Stormwater, Planning, and Building Funds.
Provides leadership and administrative support for all operations and functions of the Public Works and Community Development Departments.
Provides process improvements in the administration of operation functions for the Department programs.
Maintains American Public Works Association Accreditation (APWA) for Best Management Practices.
Provide priorities and direction for funding and budget expenditures.
STRATEGIES/ACTIONS
Strategic Plan Theme Target Date Status Strategies/Actions
Budget Year 2016-2017
Effective Government 06/17 In Progress Evaluate and begin implementation of any needed changes for customer service improvements in CD and PW.
Budget Year 2017-2018
Effective Government 06/18 Prepare for APWA reaccreditation.
PERFORMANCE MEASURES AND WORKLOAD INDICATORS
2014-2015 2015-2016 2016-2017 2017-2018Number of years accredited by the American Public Works Association.
4 5 6 7
STAFFING SUMMARY Budgeted FTEs 10.00 10.00 10.00 9.00
392

705: Public Works Central Service
50: Public Works
2014-2015 2015-2016 2016-2017 2016-2017 2017-2018 %Description Actual Actual Adopted Revised Adopted Change
REVENUESCharges for Services 1,046,111 1,201,332 1,293,200 1,293,200 1,174,100 (9.21)% Transfers In 146,222 23,078 10,000 10,000 10,000 - %TOTAL REVENUES 1,191,104 1,230,668 1,303,200 1,303,200 1,184,100 (9.14)%
EXPENDITURESPersonnel Services 978,342 985,227 1,113,500 1,113,500 996,900 (10.47)% Materials & Services 189,683 197,834 189,700 189,700 187,200 (1.32)% TOTAL EXPENDITURES 1,168,025 1,183,061 1,303,200 1,303,200 1,184,100 (9.14)%
Prog 2802: PW Administration Revenues less Expenditures 23,079 47,607 - - -
CITY OF ALBANY, OREGONPROG 2802: PW Administration
393

PROGRAM NARRATIVE
PUBLIC WORKS SERVICES FUND: ENGINEERING SERVICES (705-50-2803) Responsible Manager/Title: Staci Belcastro, P.E., City Engineer
FUNCTIONS AND RESPONSIBILITIES
Manage the design and construction of capital improvement projects.
Manage public improvements constructed through the Local Improvement District (LID) process. Includes efforts to form the district, prepare the Engineer’s Report, conduct engineering designs, manage construction, and develop final assessments.
Coordinate with developers through the Site Improvement (SI) Project process to evaluate the adequacy of existing infrastructure and to issue permits for privately constructed public improvements.
Transportation Management responsibilities include traffic engineering and design, transportation planning, and development review.
Provide financial planning, System Development Charges (SDC) fee and rate-setting guidance, and policy development for the water, wastewater, stormwater, and transportation utilities.
Provide long-range facility planning services for the City’s water, wastewater, stormwater, and transportation facilities.
Manage administration of the sewer lateral replacement program.
Support Community Development in developing conditions of approval for land use applications.
Manage the City’s Erosion Prevention Sediment Control (EPSC) program for compliance with state of Oregon regulations and guidelines.
Manage the City Post-Construction Stormwater Quality program for compliance with local, state, and federal regulations and guidelines.
Oversee and develop the Bridge Maintenance Program. Provide interaction with the state highway department and subcontractor for National Bridge Inventory (NBI) bridge inspections.
STRATEGIES/ACTIONS
Strategic Plan Theme Target Date Status Strategies/Actions
Budget Year 2016-2017
Great Neighborhoods Safe City
06/17 In Progress Secure new NPDES discharge permit for A-M WRF, if DEQ initiates permit renewal for Albany.
06/17 In Progress Secure NPDES Phase II stormwater permit, if required by DEQ.
06/17 In Progress Develop draft wastewater facility plan and update SDC documents.
Budget Year 2017-2018
Great Neighborhoods Safe City
06/18 Complete wastewater SDC update.
394

PROGRAM NARRATIVE (continued)
PUBLIC WORKS SERVICES FUND: ENGINEERING SERVICES (705-50-2803)
Responsible Manager/Title: Staci Belcastro, P.E., City Engineer
PERFORMANCE MEASURES AND WORKLOAD INDICATORS
2014-2015 2015-2016 2016-2017 2017-2018
Number of new site improvement (SI) projects. 15 15 18 15 Number of capital projects in design or construction phase. 26 30 30 30 Number of local improvement district (LID) projects. 0 1 1 1 Number of sewer lateral replacement projects completed. 60 55 50 55 Number of development reviews performed annually. 70 65 65 55 Number of permits issued annually. 550 575 600 650 Update master plan every 10 to 15 years. Age of the current plan:
Water master plan 10 yr 11 yr 12 yr 13 yr Wastewater master plan 16 yr 17 yr 18 yr 19 yr Transportation master plan 5 yr 6 yr 7 yr 8 yr Storm drain master plan 26 yr 27 yr 28 yr 29 yr
STAFFING SUMMARY
Budgeted FTEs 17.00 19.00 19.00 19.00
395


705: Public Works Central Service
50: Public Works
2014-2015 2015-2016 2016-2017 2016-2017 2017-2018 %Description Actual Actual Adopted Revised Adopted Change
REVENUESCharges for Services 2,325,038 2,493,981 2,949,500 2,949,500 2,931,000 (0.63)% Miscellaneous Revenue 336 797 - - - - %Investment Income 68 2,546 - - 1,000 - %Beginning Balance 57,388 70,881 15,000 15,000 13,600 (9.33)% TOTAL REVENUES 2,382,830 2,568,205 2,964,500 2,964,500 2,945,600 (0.64)%
EXPENDITURESPersonnel Services 2,016,447 2,201,575 2,583,700 2,583,700 2,540,300 (1.68)% Materials & Services 295,502 292,618 380,800 380,800 405,300 6.43 % TOTAL EXPENDITURES 2,311,949 2,494,193 2,964,500 2,964,500 2,945,600 (0.64)%
Prog 2803: Engineering Services Revenues less Expenditures 70,881 74,012 - - -
CITY OF ALBANY, OREGONPROG 2803: Engineering Services
396

PROGRAM NARRATIVE
PUBLIC WORKS SERVICES FUND: OPERATIONS ADMINISTRATION (705-50-2805) Responsible Manager/Title: Chris Bailey, Public Works Operations Director
FUNCTIONS AND RESPONSIBILITIES
Provides management for the Operations work groups including Water Distribution, Wastewater Collection, Water and Wastewater Treatment Plants, Street Maintenance, Facilities Engineering, Transit, and Utility Facilities Maintenance.
Provides emergency on-call service for Public Works.
STRATEGIES/ACTIONS
Strategic Plan Theme Target Date Status Strategies/Actions
Budget Year 2016-2017
Effective Government 09/16 Completed Develop Operations facility improvement plans.
Safe City 12/16 In Progress Finalize Public Works Emergency Operations Plan.
Budget Year 2017-2018
Safe City 06/18 Finalize Public Works Emergency Operations Plan.
PERFORMANCE MEASURES AND WORKLOAD INDICATORS
2014-2015 2015-2016 2016-2017 2017-2018
Percent completion of Asset Management Program. 87.5% 91% 93% 100% Percent completion of PW Emergency Operations
Plan. 25% 50% 60% 75%
STAFFING SUMMARY
Budgeted FTEs 2.00 2.00 1.00 1.00
397

705: Public Works Central Service
50: Public Works
2014-2015 2015-2016 2016-2017 2016-2017 2017-2018 %Description Actual Actual Adopted Revised Adopted Change
REVENUESCharges for Services 453,020 551,536 551,500 551,500 555,400 0.71 % Beginning Balance 96,172 9,953 10,000 10,000 10,000 - %TOTAL REVENUES 551,286 562,906 561,500 561,500 566,100 0.82 %
EXPENDITURESPersonnel Services 230,593 254,410 210,200 210,200 223,100 6.14 % Materials & Services 310,740 274,204 351,300 351,300 343,000 (2.36)% TOTAL EXPENDITURES 541,333 528,614 561,500 561,500 566,100 0.82 %
Prog 2805: Operations Admin Revenues less Expenditures 9,953 34,292 - - -
CITY OF ALBANY, OREGONPROG 2805: Operations Admin
398

PROGRAM NARRATIVE
PUBLIC WORKS SERVICES FUND: WATER QUALITY CONTROL SERVICES (705-50-2806) Responsible Manager/Title: Kristin Preston, Utility Superintendent - Wastewater
FUNCTIONS AND RESPONSIBILITIES
Provides outreach for citizens of Albany on water conservation, stormwater runoff, and other issues of concern to the City. Provides educational outreach to schools within Albany on water and related environmental issues.
Performs laboratory tests on wastewater samples, stormwater samples, biosolids, and other tests as required. Coordinates contract lab sample collection and testing.
Provides water audits for Albany residents, identifies water conservation opportunities.
Assists in developing City response to regulatory requirements relating to water quality, including federal and state stormwater, Total Maximum Daily Load (TMDL), and pretreatment requirements.
STRATEGIES/ACTIONS
Strategic Plan Theme Target Date Status Strategies/Actions
Budget Year 2016-2017
Effective Government
06/17
Completed Continue to update website content regarding water quality information and events.
Great Neighborhoods Safe City
Effective Government
06/17
Ongoing Partner with the Parks Department and Calapooia Watershed Council on restoration projects along Periwinkle Creek.
Budget Year 2017-2018
Great Neighborhoods Safe City
Effective Government
06/18
Partner with the Parks Department and Calapooia Watershed Council on a restoration planting project along Periwinkle Creek in Bowman Park.
06/18
Complete a review of the City’s TMDL implementation activities for the previous five years and submit a summary report to DEQ.
PERFORMANCE MEASURES AND WORKLOAD INDICATORS 2014-2015 2015-2016 2016-2017 2017-2018Number of residential water conservation audits performed.
5 3 5 5
Tons of trash removed from local streams. 19 11 12 12 Number of laboratory tests performed in-house. 2,687 2,488 2,100 1,700 Number of area students receiving outreach programs. 1,123 1,434 1,200 1,200 Number of outreach events attended or supported. 15 14 15 15 Number of storm system inlets marked. 60 59 75 75
STAFFING SUMMARY
Budgeted FTEs 3.00 3.00 3.00 4.00
399

705: Public Works Central Service
50: Public Works
2014-2015 2015-2016 2016-2017 2016-2017 2017-2018 %Description Actual Actual Adopted Revised Adopted Change
REVENUESCharges for Services 348,258 350,053 386,700 386,700 518,400 34.06 % Miscellaneous Revenue 48 114 - - - - %Investment Income 109 185 - - 300 - %Beginning Balance 9,640 18,605 5,000 5,000 5,000 - %TOTAL REVENUES 358,055 368,957 391,700 391,700 523,700 33.70 %
EXPENDITURESPersonnel Services 297,417 306,919 323,800 323,800 461,900 42.65 % Materials & Services 42,033 49,305 67,900 67,900 61,800 (8.98)% TOTAL EXPENDITURES 339,450 356,224 391,700 391,700 523,700 33.70 %
Prog 2806: Water Quality Control Service Revenues less Expenditures 18,605 12,733 - - -
CITY OF ALBANY, OREGONPROG 2806: Water Quality Control Service
400
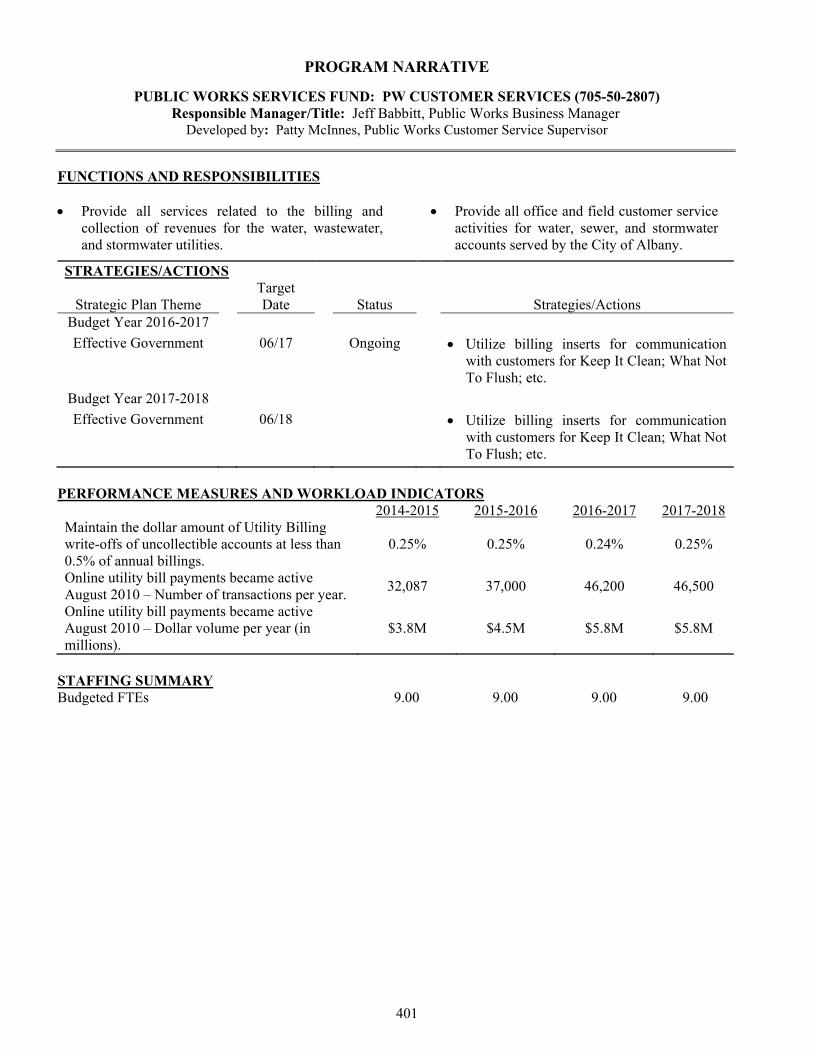
PROGRAM NARRATIVE
PUBLIC WORKS SERVICES FUND: PW CUSTOMER SERVICES (705-50-2807) Responsible Manager/Title: Jeff Babbitt, Public Works Business Manager
Developed by: Patty McInnes, Public Works Customer Service Supervisor
FUNCTIONS AND RESPONSIBILITIES Provide all services related to the billing and
collection of revenues for the water, wastewater, and stormwater utilities.
Provide all office and field customer service activities for water, sewer, and stormwater accounts served by the City of Albany.
STRATEGIES/ACTIONS
Strategic Plan Theme Target Date Status Strategies/Actions
Budget Year 2016-2017
Effective Government 06/17 Ongoing Utilize billing inserts for communication with customers for Keep It Clean; What Not To Flush; etc.
Budget Year 2017-2018
Effective Government 06/18 Utilize billing inserts for communication with customers for Keep It Clean; What Not To Flush; etc.
PERFORMANCE MEASURES AND WORKLOAD INDICATORS 2014-2015 2015-2016 2016-2017 2017-2018 Maintain the dollar amount of Utility Billing write-offs of uncollectible accounts at less than 0.5% of annual billings.
0.25% 0.25% 0.24% 0.25%
Online utility bill payments became active August 2010 – Number of transactions per year.
32,087 37,000 46,200 46,500
Online utility bill payments became active August 2010 – Dollar volume per year (in millions).
$3.8M $4.5M $5.8M $5.8M
STAFFING SUMMARY Budgeted FTEs 9.00 9.00 9.00 9.00
401

705: Public Works Central Service
50: Public Works
2014-2015 2015-2016 2016-2017 2016-2017 2017-2018 %Description Actual Actual Adopted Revised Adopted Change
REVENUESCharges for Services 1,155,444 1,189,299 1,370,800 1,370,800 1,381,100 0.75 % Miscellaneous Revenue 39 - - - - - %Investment Income (57) 481 - - - - %Beginning Balance 7,156 19,550 8,500 8,500 10,000 17.65 % TOTAL REVENUES 1,162,582 1,209,330 1,379,300 1,379,300 1,391,100 0.86 %
EXPENDITURESPersonnel Services 691,762 712,597 793,100 793,100 787,800 (0.67)% Materials & Services 451,269 473,660 586,200 586,200 603,300 2.92 % TOTAL EXPENDITURES 1,143,031 1,186,257 1,379,300 1,379,300 1,391,100 0.86 %
Prog 2807: PW Customer Services Revenues less Expenditures 19,551 23,073 - - -
CITY OF ALBANY, OREGONPROG 2807: PW Customer Services
402

PROGRAM NARRATIVE
PUBLIC WORKS SERVICES FUND: FACILITIES & MAINTENANCE ENGINEERING (705-50-2809) Responsible Manager/Title: Chris Bailey, Public Works Operations Director
Developed by: Mike Bryan, Public Works Technical Services Manager
FUNCTIONS AND RESPONSIBILITIES
Manage Public Works infrastructure asset data through the CarteGraph Maintenance Management Software (CMMS) system.
Assist in the review of existing infrastructure condition reports, and assist in developing plans for future rehabilitation/replacement work.
Manage preventive, predictive, and corrective maintenance management tasks including repairs and replacement of the various pieces of equipment at the Water Treatment Plants (WTPs) and Albany-Millersburg Water Reclamation Facility (AM WRF) as well as all remote sites.
Provide inventory support and control for the Operations department.
Oversee and develop Supervisory Control and Data Acquisition (SCADA) automated process control and monitoring systems for the WTPs and AM WRF and associated systems outside of the plants.
Perform weekly, bi-weekly, monthly, six- month, and annual inspections of eight reservoirs, five water pump stations, and 16 sewer lift stations as well as performing large-scale preventive maintenance and repairs at the treatment facilities. Perform most of the fabrication work for all of the sections in Public Works.
STRATEGIES/ACTIONS
Strategic Plan Theme Target Date Status Strategies/Actions
Budget Year 2016-2017
Safe City Effective Government
06/17 Completed Implement the recommended security upgrades from the SCADA security audit.
06/17 In Progress Complete the stormwater system integration project into the CMMS.
Budget Year 2017-2018
Effective Government 06/18 Complete the integration of the new CMMS software.
06/18 Integrate new workflow processes within public works utilizing the new OMS.
PERFORMANCE MEASURES AND WORKLOAD INDICATORS
2014-2015 2015-2016 2016-2017 2017-2018 CMMS: Percentage of total assets in the CMMS System Water 92% 95% 97% 100% Wastewater 92% 95% 97% 100% Streets 86% 90% 92% 100% Stormwater 80% 85% 87% 100% Maintenance: Number of after-hours call-outs. 38 50 46 60 SCADA: Total number of data points monitored and managed. 31,363 31,600 31,611 33,388 Total number of SCADA-related computers supported. 87 88 98 101
STAFFING SUMMARY
Budgeted FTEs 13.00 13.00 15.00 15.00
403

705: Public Works Central Service
50: Public Works
2014-2015 2015-2016 2016-2017 2016-2017 2017-2018 %Description Actual Actual Adopted Revised Adopted Change
REVENUESCharges for Services 1,334,750 1,699,478 1,958,500 1,958,500 2,022,500 3.27 % Miscellaneous Revenue 995 96 - - - - %Investment Income 2,369 1,565 - - 900 - %Beginning Balance 301,334 37,699 20,000 20,000 15,000 (25.00)% TOTAL REVENUES 1,639,448 1,738,838 1,978,500 1,978,500 2,038,400 3.03 %
EXPENDITURESPersonnel Services 1,353,409 1,411,590 1,728,300 1,728,300 1,759,900 1.83 % Materials & Services 248,340 275,232 250,200 250,200 278,500 11.31 % TOTAL EXPENDITURES 1,601,749 1,686,822 1,978,500 1,978,500 2,038,400 3.03 %
Prog 2809: Facilities & Maintenance Engineering Revenues less Expenditures 37,699 52,016 - - -
CITY OF ALBANY, OREGONPROG 2809: Facilities & Maintenance Engineering
404


CAPITAL BUDGET


City Manager’s Message
To the City Council and Citizens of Albany:
My last introduction to Albany’s Capital Improvement Program (CIP) emphasizes not only the
importance of capital planning, but the need to recognize that building sound infrastructure takes time.
Earthquakes, fire, floods and other catastrophes can destroy facilities quickly and without warning. The
task of building, rebuilding and maintaining never ends.
Albany can and should celebrate the completion of two new facilities that have been discussed and
planned for more than 20 years. The new fire and police stations should serve the community for
generations and allow us to focus on other capital priorities that need attention.
Our CIP attempts to allocate resources objectively by identifying projects where the need for
improvements is high due to the condition of the infrastructure and how heavily it is used. Projects that
tend to get deferred are those that are least visible and least likely to cause immediate problems. This
strategy makes sense, but can lead to expensive failures that might have been prevented with earlier
investment. Failed culverts on 2nd
and Belmont Avenues are good examples of projects that required
expensive replacements. Albany’s new stormwater utility will eventually help direct revenue to badly
needed improvements in a system that influences flooding, water quality, habitat and erosion, to name a
few. Unfortunately, there are few advocates for new box culverts and other critical infrastructure that
goes unnoticed until it fails.
Albany’s CIP makes no pretense of putting enough money in savings to replace the city’s infrastructure.
The costs of providing services every day imposes a significant financial burden on residents that makes it
difficult to save enough for replacement. Additionally, there is great variability in how long
infrastructure will last. Site-specific conditions can increase or decrease life expectancy, making it
difficult to predict when something should be replaced. Like most homeowners, we save to cover projects
like painting and borrow to pay for larger projects such as a new roof.
It has been my pleasure to work with our engineering and public works staff over the past 12 years to
maintain and improve the water, sewer, stormwater and street systems as well as parks and city buildings.
We have a well-established process that allows us to make the best use of the money we have, recognizing
that there is never enough to do all that should be done. My role in this process is relatively small and I
would like to particularly thank Jeff Babbitt for his part in coordinating the work needed to produce the
CIP. We are fortunate to have great public works staff who routinely do the work needed to maintain
critical city services. The CIP is an important part of this work.
Respectfully submitted,
Wes Hare, City Manager
405

Introduction
Decisions, Decisions, Decisions!
Strategic planning will focus our community strategies and actions
he City of Albany Strategic Plan is guided by three fundamental elements: our mission, our vision,
and our core values. Our mission statement is based on the principles of high quality and
continuous improvement. Our vision statement presents a compelling future toward which our
strategic plan is directed. Both our mission and our vision are founded on basic values that guide all our
actions and reflect what we expect from our employees and elected officials.
Our Mission: Providing quality public services for a better Albany community.
Our Vision: A vital and diverse community that promotes a high quality of life, great
neighborhoods, balanced economic growth, and quality public services.
If our mission and vision statements are to have any meaning, they must be accompanied by deliberate
planning efforts to move the organization and community toward a desired future. This requires clearly
defined goals, proactive objectives, committed leadership, and effective management under significant
forces of change. These forces include changing community demographics, new state and federal
mandates, fiscal constraints, changing economic conditions, emerging technologies, and many other
influences on our service delivery efforts. High-performing organizations are those that learn to anticipate
and adapt to change by creating value for those we serve, and motivation and meaning for those who
serve them. The best tool for accomplishing our community objectives is strategic planning. Therefore,
the Albany City Council has developed a strategic plan.
The four primary themes of the strategic plan are Great Neighborhoods, a Safe City, a Healthy Economy,
and an Effective Government.
Financial Planning
The Capital Improvement Program (CIP) is a planning document that identifies capital projects in the next
five-year horizon for elected officials, citizens, and staff. The first year of the CIP will be the basis for
developing the capital portion of the forthcoming City Budget for 2017-2018. This CIP shows the total
cost of a project in the year it is funded. Once a project appears in the first year of the CIP and makes it
into the budget, it does not appear again in the CIP because the project has moved beyond the planning
phase.
How to Use This Report
Each section of the report deals with a major infrastructure service the City
provides. You will find separate sections for accessibility, finance, parks, public
facilities, revitalization, stormwater, transportation, wastewater, and water. There is
also a community needs section showing the most important projects without secured
T
406

funding sources.
Each project scheduled over the next five years is individually identified. Each project shows the total
cost and the sources of money used to pay for it. In certain cases, special emphasis by way of a signpost
is shown for projects financed through General Obligation bonds or revenue bonds, along with those
projects qualifying for System Development Charge funding for some or all of their costs.
Example: .REVENUE BOND. …SDC…
Each project has a unique CIP identification number attached to it. Related projects occurring in different
areas, or over several years, are linked by use of a phase identifier. As a result, on any given project sheet,
you will also see all the related projects regardless of the CIP section in which they appear.
Throughout the CIP document there are many commonly-used acronyms. The following list provides
those most frequently used:
AC – Asbestos Cement
CARA – Central Albany Revitalization Area
HDPE – High Density Polyethylene
SDC – System Development Charges
STP – Surface Transportation Program
The CIP Process
Actually, it is fairly simple. This report is distributed to the City Council, Planning Commission, and
Budget Committee and copies are made available to the public at the libraries, City Hall, and on the City’s
website. A joint work session of the City Council, Planning Commission, and Budget Committee is held
to go over the proposed project list and give opportunity to ask questions to clarify issues and information.
Following the joint work session, a public hearing is held where everyone is invited to express feelings
about these plans for the future. Following the public hearing process, the City Council revises the CIP as
necessary and then adopts the final Program. This final version becomes the basis for projects found in
the City Budget.
Cross Check: Accomplishments and On-going Projects
The following list shows projects funded in prior CIPs and budgets that are currently in process or that
have been revised or completed. Because these and earlier continuing projects have been authorized and
funded, they no longer appear in the detail pages of the CIP.
407

ACCESSIBILITY
IN PROCESS #2004, Phase 2, Improved Pedestrian Crossings at Transit Stops (Phase 2)
Construction is currently scheduled for summer 2017.
PARKS
IN PROCESS #1892 Sunrise Park Playground Replacement After a long delay in securing wetland mitigation approval, this project is expected to be completed in
2017.
DEFERRED #2008 East Thornton Lake Natural Area Development This development project has been delayed indefinitely due to capital and operating budget constraints.
Planning and site design work will continue.
PUBLIC FACILITIES
IN PROCESS #1334 Downtown Fire Station The project is expected to be completed in summer 2017.
IN PROCESS #1335 Police Station Replacement The project is expected to be completed in summer 2017.
IN PROCESS #2179 Fire Station 14 Water Reclamation Project
The project is expected to be completed in Fiscal Year 2017-2018.
REVITALIZATION
IN PROCESS #1339 CARA Central Albany Building Revitalization Program This Central Albany Revitalization Area (CARA)-funded program offers technical assistance, loans, and
grants for the private redevelopment of commercial structures, as well as funding for specific public
infrastructure projects in the 919-acre Urban Renewal District.
IN PROCESS #2339 Albany Downtown Street Improvements Construction is currently scheduled for early 2017 and will be completed by the end of March for Phase 1,
and September for Phase 2.
STORMWATER
IN PROCESS #1958 Stormwater Master Plan This project is currently underway.
TRANSPORTATION
COMPLETED #2041 34th
Avenue Signal: Marion Street
COMPLETED #2045 34th
Avenue Signal: Hill Street
408

COMPLETED #2165 Update Airport Master Plan and Airport Layout Plan
IN PROCESS #2225 Oak Street Rehabilitation – 34th
to 38th
Avenue
Construction is currently scheduled for summer 2017.
IN PROCESS #2283 Pedestrian Crossing Improvements
Crossings in City rights-of-way are complete. Construction of crossings in ODOT rights-of-way is
currently scheduled for summer 2017.
IN PROCESS #2305 Crocker Lane Street Improvements
Construction is currently scheduled for summer 2017.
WASTEWATER
COMPLETED #1254 Umatilla Lift Station, Force Main, and Wet Well Projects
COMPLETED #2200 2016 Sewer Pipe Rehabilitation Projects
COMPLETED #2307 Maple Street Lift Station Pump Replacement Project
COMPLETED #2308 Collection System Access Improvements
COMPLETED #2329 Marion Street Lift Station
IN PROCESS #2204 2017 Collection System Rehabilitation Projects
Construction is currently scheduled for summer 2017.
IN PROCESS #2323 Cox Creek Interceptor Projects – P7
Construction is currently scheduled for summer 2018.
IN PROCESS #2324 Cox Creek Interceptor Projects – P8
Construction is currently scheduled for summer 2018.
IN PROCESS #2330 Cox Creek Interceptor Projects – P10A
Construction is currently scheduled for summer 2018.
WATER
COMPLETED #2219 College Park Drive, Pacific Boulevard to East End
COMPLETED #2286 Maple Street Pump Station Electrical Improvements
COMPLETED #2291 Meadow Wood Water Line
COMPLETED #2316 Vine Street WTP Electrical and Clearwell Improvements
IN PROCESS #1999 Albany-Millersburg Water Treatment Plant Sand Removal
Construction is currently scheduled for summer 2017.
IN PROCESS #2187 Canal Diversion Structures
Design is underway and construction is currently scheduled for summer 2018.
409

IN PROCESS #2300 Oak Street Water Line – 34th
to 38th
Avenue
Construction is currently scheduled for summer 2017.
IN PROCESS #2314 Crown Zellerbach Gate Evaluation and Improvements
Design is underway and construction is currently scheduled for summer 2018.
IN PROCESS #2315 Crocker LID Water Line
Design is underway and construction is currently scheduled for summer 2017.
IN PROCESS #2317 Downtown Water Line Improvements
Construction is currently scheduled for summer 2017.
IN PROCESS #2318 Industrial Way Water Line
Construction is currently scheduled for summer 2017.
IN PROCESS #2332 Backwash Ponds Improvements
Construction is currently scheduled for summer 2017.
IN PROCESS #2333 Maple, Broadway, and A-M WTP Reservoirs Seismic Valves
Construction is currently scheduled for summer 2017.
IN PROCESS #2335 Vine Street Water Treatment Plant Improvements
Construction is currently scheduled for summer 2017.
IN PROCESS #2337 Santiam-Albany Canal Bank Repair: 4th
Avenue to 5th
Avenue
Construction is currently scheduled for summer 2017.
410

Got a Question?
Some of the information and issues in this report can be rather complex. If you are having
trouble understanding something or have a question, your City staff stands ready and
willing to provide the information you need.
For information please contact:
City Manager’s Office
Marilyn Smith, 541-917-7507
Management Assistant/Public Information Officer
411

Finances
Paying for Capital Projects
A preliminary look at financing, pending further decisions
et us make it clear right at the top: there is not enough money available for all the projects the City
needs to do. In most cases the source of money determines which projects get included. For
instance, Water Fund revenue can only be spent on water projects. The money each of these funds
receives must be spent for the purposes for which the fund was created.
Sources of Funding
The table on the next page shows the relative breakdown of funding sources for all the projects contained
in the 2018-2022 CIP.
This chart shows a projection of funds needed for projects in any given year. As you can see, the relative
amounts of money can vary significantly and can change from year to year based on the projects being
constructed.
Grants are a one-time source of money. To rely on grants as a major source of improving our
infrastructure is a precarious approach. The money may or may not be there and is available only through
decisions made outside our community. While the City actively looks to get grants where available, we
still have to provide our own source of money for a portion of the cost, even on grant projects.
Any given project can have funding from more than one source. For instance, a major sewer upgrade
project may be funded by a combination of Sewer Rate revenue and Sewer Improvement System
Development Charges (SDC) revenue. Each project in this CIP will have all funding sources clearly
identified.
L
What is a Fund?
A fund is an accounting term that denotes a stand-alone operation that has its own set of accounting books. Even though it is part of the City, for financial purposes it operates as a separate service.
412

Projected Cost Totals by Funding Source
FUNDING SOURCE 2018 2019 2020 2021 2022 TOTAL
ADA Capital Reserves $0 $0 $95,000 $0 $0 $95,000
Community Development Block Grant $95,000 $0 $0 $0 $0 $95,000
GF Facilities Maintenance Projects $50,000 $0 $0 $0 $0 $50,000
Greater Albany Public Schools $950,000 $0 $0 $0 $0 $950,000
In Lieu of Franchise Fees $0 $0 $0 $579,000 $595,000 $1,174,000
Reserve: Capital Projects $50,000 $0 $0 $0 $0 $50,000
SDC Improvement - Sewer $155,800 $617,000 $0 $0 $0 $772,800
SDC Improvement – Transportation $911,200 $515,000 $0 $1,880,000 $0 $3,306,200
SDC Improvement – Water $113,600 $1,205,000 $0 $0 $0 $1,318,600
Sewer Rates/Operating Revenues $2,837,200 $2,602,000 $2,155,000 $5,356,000 $2,155,000 $15,105,200
State of Oregon $980,000 $1,256,000 $238,000 $546,000 $631,000 $3,651,000
Street Capital Reserves $1,483,800 $1,745,000 $40,000 $40,000 $40,000 $3,348,800
Water Rates/Operating Revenues $2,998,100 $2,580,000 $2,348,000 $1,399,000 $2,596,000 $11,921,100
TOTAL: $10,624,700 $10,520,000 $4,876,000 $9,800,000 $6,017,000 $41,837,700
413

Financing Projects with Bonds or Loans
The City finances capital projects primarily through taxes and fees for service. In order to stretch the
buying power of the available resources and to pay for big-ticket projects, the City may issue General
Obligation bonds or revenue bonds. Bonds are sold in the worldwide financial marketplace in order to get
the lowest interest rate possible. The federal tax code provides for municipal bonds that can be tax-
exempt for the people or institutions that buy them. Because of this tax break, the interest rate is usually
much lower than would be paid for a prime-rate loan from a bank. This saves the taxpayers money.
There are two types of bonds:
General Obligation (GO) bonds must be approved by a vote of the people before they can be issued. This
is because GO bonds result in an additional property tax above and beyond the property tax otherwise
paid. The bonds are secured by the revenue from the tax and the tax lasts only for the life of the bonds,
usually 15 to 20 years.
Revenue bonds are not backed by property taxes and, in Albany, also require a vote of the people.
Revenue bonds are repaid out of specific revenues, such as water rates for a water revenue bond.
In addition to bonds, the City can secure a loan from a bank or other source. In 2003, the City was able to
secure a loan from the State of Oregon Clean Water Revolving Loan Fund for the planned wastewater
projects at interest rates that were far better than what was available under bond programs.
It is important to remember bonds and loans are not a source of revenue; they are financing tools. The
sources of revenue to pay for the projects are the taxes or rates that secure the bonds or loan.
The Five-Year Plan in a Snapshot
The following table shows the total cost of projects authorized in each of the next five years for each
major category of capital projects. Some projects will be paid for in a single year, while other projects
will take three years or more to complete.
Occasionally new issues, changing cost and revenue realities, or shifts in City priorities will cause a
project, or a number of projects, to be either bumped forward or back in the five-year schedule. Any
changes of this nature would be reflected in future CIP documents.
414

Projected Cost Totals by Category
CATEGORY 2018 2019 2020 2021 2022 TOTAL
Accessibility $95,000 $0 $95,000 $0 $0 $190,000
Parks $0 $0 $0 $0 $0 $0
Public Facilities $100,000 $0 $0 $0 $0 $100,000
Revitalization $0 $0 $0 $0 $0 $0
Stormwater $0 $0 $0 $0 $0 $0
Transportation $4,325,000 $3,516,000 $278,000 $3,045,000 $1,266,000 $12,430,000
Wastewater $2,993,000 $3,219,000 $2,155,000 $5,356,000 $2,155,000 $15,878,000
Water $3,111,700 $3,785,000 $2,348,000 $1,399,000 $2,596,000 $13,239,700
GRAND TOTALS: $10,624,700 $10,520,000 $4,876,000 $9,800,000 $6,017,000 $41,837,700
415


Community Needs
Major Needs that Remain Unfunded
Projects to strengthen our community…if funding is made available
his section of the CIP highlights projects that are considered important but don’t have a funding plan
identified.
Riverfront Interceptor Lift Station and Force Main
The Riverfront Interceptor (RFI) provides sewer service to approximately 2,682 acres, which includes the
downtown core. The RFI does not have capacity to handle all tributary wastewater collection system
flows during heavy rainfall events, resulting in occasional unpermitted overflows to the Willamette River.
Additional development activities within the RFI basin will exacerbate the capacity problem, and the City
is at risk of DEQ regulatory enforcement action if unpermitted overflows continue. The least cost option
for addressing the capacity constraint is construction of an $11.5M lift station and force main project.
This cost exceeds the City’s current financial capabilities and a funding strategy needs to be identified.
Residential Utility Services
Several pockets of residential areas within city limits remain without City utilities. Most were annexed
after development under county jurisdiction, and most are characterized by moderate income households
and modest homes.
Albany Train/Multimodal Station
The Albany train/multimodal station has been a great success. The station is seeing high volumes of use
and often the existing parking is near or at capacity. To allow continued growth of the multiple
transportation services using the station to service the region, additional space for parking will need to be
developed.
Central Albany Revitalization
Central Albany remains a focus for public and private redevelopment and economic development activity.
While CARA funding has stimulated significant private investment, completion of the vision for central
Albany will require spending beyond the scope of the renewal agency. The following are among the
projects that do not have fully identified funding:
Public Spaces – The Central Albany Land Use and Transportation Study (CALUTS) Plan and the
Town Center Plan call for a suite of public spaces designed to enhance the central Albany area,
provide spatial organizing elements, offer alternate transportation options, and stimulate private
investment.
Water Avenue – The Water Avenue Streetscape Design Guide (2008) calls for reconstruction of
Water Avenue from Washington Street to Main Street. This will be a key investment to support
redevelopment of parcels along the river, including the riverfront housing in the Town Center
Plan concept. The scope and timing of this project is currently being reviewed by CARA.
T
416

Park Repair and Replacement Needs
There is a significant backlog of park repair and replacement projects. Examples of these projects include
the replacement of unsafe, 35-year-old playgrounds; ball field lighting systems; irrigation systems; walks
and parking lots; and park buildings/structures. The 2006 Parks Master Plan proposes several projects
that would address many of these needs through a funding mix including Parks SDCs, annual operating
dollars, private donations, and grants. Currently, the total backlog is estimated at $3.5 million. However,
these funds have not yet been secured. Without a new funding source, the backlog will not be adequately
addressed, requiring that facilities and equipment may be closed or removed when no longer serviceable.
Fire and Police Departments
Both Fire and Police emergency responders lack adequate local training facilities to develop new
skills and maintain proficiency and current capabilities. Emergency responders’ skills must be
maintained to safely and adequately handle the numerous high-risk and hazardous events they
encounter. The existing training tower and Fire Station 11 were demolished to accommodate
construction of a new main fire station. Construction of the new station does not include
replacing the training tower. A functional tower is an important training aid for firefighters, and
the lack of a tower can have an impact on the fire department’s Insurance Services Office rating
and ultimately the fire insurance rates paid by our community. At this time, the best solution is to
relocate the City bus storage from behind Fire Station 12, build a new training tower, and enhance
the training capabilities at that location.
Fire and Police facilities need to be maintained. Currently, two of the four fire stations parking
lots need to be replaced at a price of approximately $270,000. The parking lot at Fire Station 13
has large potholes from continuous heavy truck traffic and areas turning to gravel. Funding is not
available and this is creating significant maintenance issues for the Fire Department.
Fire Department emergency communications systems need to be upgraded. Current emergency
radios are problematic and a new County-wide system is needed. This is a major project that will
require much coordination and funding from multiple agencies or an outside grant.
Street Construction and Preventative Maintenance
The needs for street repair and improvement continue to grow while funding remains stagnant and
insufficient to address needs. Aging streets that cannot be properly maintained and invested in will fall
into disrepair and ultimately will require full reconstruction. Reconstruction of streets is several times
more expensive than ongoing repair and preventative maintenance.
The future revenue picture for streets is bleak. Gas tax and Surface Transportation Program (STP)
revenues are not anticipated to grow at a pace that sustains current levels of investment in infrastructure.
STP funding is also subject to federal approval, appropriation and allocation to Albany from the Albany
Area Metropolitan Planning Organization (AAMPO).
Stormwater Infrastructure
The City recently took action to establish a stormwater utility; thus creating the framework for a dedicated
funding source for stormwater activities. Initial service charges were set to cover the limited stormwater
activities already conducted by the City but previously funded using sewer and street funds, plus a modest
amount for complying with new regulatory requirements. Initial service charges will not fund routine
operation and maintenance (O&M) activities necessary to support an asset management approach to
managing our infrastructure, as is done for the water and sewer utilities. An asset management approach
417

is important to identify failing pipes that need to be replaced to prevent disruptions of service, street
flooding, and property damage.
The City is also undergoing a significant stormwater planning effort. The new stormwater plan will
identify short- and long-term capital improvements to address capacity constraints throughout the system
and utility extensions to serve growth. Looking ahead, it will be important to secure additional funding to
support an asset management approach for O&M activities, replace failing pipes, and replace undersized
pipes.
418

SCHEDULE OF CAPITAL EQUIPMENT Fiscal Year 2017-2018
Department: Program Name Budget Fund (Program Number) Capital Description Amount Total
Fire Department: Fire Emergency Services Extrication Equipment $ 40,000 (100-25-1208) Thermal Imaging Camera 10,000 $ 50,000 Equipment Replacement (217-10-1010) Type 1 Engine $ 500,000 Staff Vehicle 35,000 $ 535,000 Total Fire Department $585,000
Police Department: Police Ford Transit Van $ 28,000 (100-30-1301) $ 28,000 Total Police Department $28,000
Parks & Recreation Department: Aquatics Low Dive Board $ 29,000 (202-35-1410) $ 29,000 Total Parks & Recreation Department $29,000
Public Works Department: Transit (213-50-1106) Replace Vehicle 455-05 $ 440,000 (213-50-1107) Replace Vehicle 428-03 420,000 (213-50-1108) Replace Vehicle 825-11 50,000 Replace Vehicle 826-11 50,000 $960,000 Equipment Replacement (217-10-1010) Facilities Maintenance Vehicle $ 28,000 Replace Vehicle 507-01 35,000 Replace Vehicle 528-94 128,000 $191,000 Wastewater Treatment Plant WRF Server Room Fire Suppression $ 8,000 (601-50-2404) WRF DO/TSS Probes in VLR 16,000 WRF RAS Pump Rail 18,000 WRF UPS Backup 25,000 $ 67,000
419

SCHEDULE OF CAPITAL EQUIPMENT Fiscal Year 2017-2018
Continued Public Works Department (continued): Wastewater Collections WRF Server Room Fire Suppression $ 1,000 (601-50-2405) Flow Meter at College Green 10,000 $ 11,000 TWG Wetlands TWG Security Camera $ 7,000 (601-50-2411) $ 7,000 Water Canal WRF Server Room Fire Suppression $ 2,000 (615-50-2204) Replace CCTV Equipment at Diversion Dam 18,000 Upgrade Control Panel at Diversion Dam 28,000 $ 48,000 Vine Street WTP WRF Server Room Fire Suppression $ 4,000 (615-50-2206) Fiber Optic Communication for Radial Gate 14,000 $ 18,000 Water Distribution WRF Server Room Fire Suppression $ 1,000 (615-50-2206) Replacement Hatch Millersburg Vault 5,000 Refurbish Pump at NA Lift Station 17,500 Upgrade Millersburg Vault 18,000 Upgrade Motor Control NA Pump Station 40,000 $ 81,500 Albany-Millersburg WTP WRF Server Room Fire Suppression $ 4,000 (615-50-2207) Fiber Optic Communication for Reservoir 28,000 Allen-Bradley ControlLogix Redundancy Module 31,000 Life Cycle Process Control/Security CCTV 40,000 Membrane Modules at AM WTP 430,000 $ 533,000 Water Equipment Replacement Replace Vehicle 900-02 $ 40,000 (615-50-2311) Repl Membrane Modules at AM WTP 120,000 Replace Vehicle 914-01 70,000 $ 230,000 Total Public Works Department $2,146,500
TOTAL CAPITAL EQUIPMENT $2,788,500
420

SUMMARY OF CAPITAL REQUIREMENTS AND CAPITAL RESERVES - FISCAL YEAR 2017-18
General Parks & Risk Economic PublicProject Description Total Fund Recreation Grants Management Development Transit
CAPITAL PROJECTSCapital Equipment 2,788,500 78,000$ 29,000$ -$ -$ -$ 960,000$ Building Improvements 36,100 - - 36,100 - - - Albany Data Integration 400,000 - - - - - - Taxiway Connectors Design 25,000 - - 25,000 - - - AGIS Taxiway Construction 308,000 - - 308,000 - - - FTA 5307 -1% Safety Purchase 11,300 - - - - - 11,300 Renovation Projects 197,000 - 197,000 - - - - Comm Dev - Accessibility 125,000 - - 125,000 - - - Comm Dev - Public Improvements 239,300 - - 239,300 - - - Sunrise Park Play Replace 60,000 - 60,000 - - - - Operations Roof Replacements 100,000 50,000 - - - - - Station 13 Parking Lot - - - - - - - Sidewalk Infill Program 15,000 - - - - - - SS-17-01 Cox Creek Interceptor P7 1,430,000 - - - - - - SS-17-02 Cox Creek Interceptor P8 1,184,900 - - - - - - SS-17-03 2017 Collection System Rehab 765,000 - - - - - - SS-17-04 Marion Lift Station 70,000 - - - - - - SS-17-05 Cox Creek Interceptor P10A 1,285,000 - - - - - - SS-17-09 Lyon & Ellsworth Sewer Imp 245,000 - - - - - - SS-18-01 2018 Collection System Rehab 1,250,000 - - - - - - SS-18-02 Hill St Sewer Imp 665,000 - - - - - - SS-18-03 Santa Maria Sewer Imp 803,000 - - - - - - ST-13-05 Corvallis Albany Path 304,500 - - - - - - ST-16-01 Transit Stop Ped Imp (Ph 2) 200,000 - - - - - - ST-16-02 Crocker Lane & Valley View Dr 1,460,000 - - - - - - ST-17-01 Oak Street Rehab 34th-38th 612,000 - - - - - - ST-17-02 Grand Prairie Park CW/Waverly 40,000 - - - - - - ST-18-01 Hill St, Queen to 24th 2,700,000 - - - - - - ST-18-02 Santa Maria Street Imp 1,450,000 - - - - - - WC 13 01 Canal Diversion Structures 250 000
The City evaluates its service delivery systems according to established efficiency and effectiveness criteria to determine whether a service should beprovided with staff or by contract. It is the policy of the City to make every effort to construct public improvements at the least cost to the citizens ofAlbany. The following summary lists projects included in the 2017-18 budget. The projects may also be included in the City's five-year CapitalImprovements Program (CIP) for 2018-2023.
WC-13-01 Canal Diversion Structures 250,000 - - - - - - WL-16-01 Crocker LID Waterline 400,000 - - - - - - WC-16-01 CZ Gates Improvements 600,000 - - - - - - WL-16-03 Fire Line Backflow Install 90,000 - - - - - - WC-16-03 Canal Bank Repair Goltra 120,000 - - - - - - WL-17-01 CARA Water Line Imp 345,600 - - - - - - WL-17-02 Industrial Way Water Line 320,000 - - - - - - WL-17-03 Oak Street WL 34th-38th 253,700 - - - - - - WC-17-03 Canal Bank Repair 4th-5th 460,000 - - - - - - WL-17-04 Seismic Valves 130,000 - - - - - - WC-17-01 Raised Canal Embankment 150,000 - - - - - - WL-17-05 Lyon/Ellsworth Water Line Imp 485,000 - - - - - - WL-18-01 Lafayette et al WL 1,300,000 - - - - - - WL-18-02 Pine Meadows WL Repl 940,000 - - - - - - WL-18-03 Santa Maria WL 329,700 - - - - - - WTP-15-02 AM WTP Chemical Tank Rehab 60,000 - - - - - - WTP-17-01 Ponds Imp 308,000 - - - - - - WTP-17-02 Vine WTP Imp 290,000 - - - - - - WTP-18-01 Vine St WTP Accelator Imp 542,000 - - - - - - WWTP-13-01 WRF Solids Handling Imp Proj 500,000 - - - - - - W-12-02 AM WTP Sand Removal 443,000 - - - - - -
Capital Project Totals 27,086,600 128,000 286,000 733,400 - - 971,300
421

Capital CapitalReplacement Street Projects Sewer Water Stormwater Project Description
CAPITAL PROJECTS726,000$ -$ -$ 85,000$ 910,500$ -$ Capital Equipment
- - - - - - Building Improvements- - 400,000 - - - Albany Data Integration- - - - - - Taxiway Connectors Design- - - - - - AGIS Taxiway Construction- - - - - - FTA 5307 -1% Safety Purchase- - - - - - Renovation Projects- - - - - - Comm Dev - Accessibility- - - - - - Comm Dev - Public Improvements- - - - - - Sunrise Park Play Replace
50,000 - - - - - Operations Roof Replacements- - - - - - Station 13 Parking Lot- 15,000 - - - - Sidewalk Infill Program- - - 1,430,000 - - SS-17-01 Cox Creek Interceptor P7- - - 1,184,900 - - SS-17-02 Cox Creek Interceptor P8- - - 765,000 - - SS-17-03 2017 Collection System Rehab- - - 70,000 - - SS-17-04 Marion Lift Station- - - 1,285,000 - - SS-17-05 Cox Creek Interceptor P10A- - - 245,000 - - SS-17-09 Lyon & Ellsworth Sewer Imp- - - 1,250,000 - - SS-18-01 2018 Collection System Rehab- - - 665,000 - - SS-18-02 Hill St Sewer Imp- - - 803,000 - - SS-18-03 Santa Maria Sewer Imp- 304,500 - - - - ST-13-05 Corvallis Albany Path- 200,000 - - - - ST-16-01 Transit Stop Ped Imp (Ph 2)- - 1,460,000 - - - ST-16-02 Crocker Lane & Valley View Dr- 612,000 - - - - ST-17-01 Oak Street Rehab 34th-38th- 40,000 - - 0 - ST-17-02 Grand Prairie Park CW/Waverly- 2,700,000 - - 0 - ST-18-01 Hill St, Queen to 24th- 1,450,000 - - 0 - ST-18-02 Santa Maria Street Imp
250 000 WC 13 01 Canal Diversion Structures- - - - 250,000 - WC-13-01 Canal Diversion Structures- - - - 400,000 - WL-16-01 Crocker LID Waterline- - - - 600,000 - WC-16-01 CZ Gates Improvements- - - - 90,000 - WL-16-03 Fire Line Backflow Install- - - - 120,000 - WC-16-03 Canal Bank Repair Goltra- - - - 345,600 - WL-17-01 CARA Water Line Imp- - - - 320,000 - WL-17-02 Industrial Way Water Line- - - - 253,700 - WL-17-03 Oak Street WL 34th-38th- - - - 460,000 - WC-17-03 Canal Bank Repair 4th-5th- - - - 130,000 - WL-17-04 Seismic Valves- - - - 150,000 - WC-17-01 Raised Canal Embankment- - - - 485,000 - WL-17-05 Lyon/Ellsworth Water Line Imp- - - - 1,300,000 - WL-18-01 Lafayette et al WL- - - - 940,000 - WL-18-02 Pine Meadows WL Repl- - - - 329,700 - WL-18-03 Santa Maria WL- - - - 60,000 - WTP-15-02 AM WTP Chemical Tank Rehab- - - - 308,000 - WTP-17-01 Ponds Imp- - - - 290,000 - WTP-17-02 Vine WTP Imp- - - - 542,000 - WTP-18-01 Vine St WTP Accelator Imp- - - 500,000 - - WWTP-13-01 WRF Solids Handling Imp Proj- - - - 443,000 - W-12-02 AM WTP Sand Removal
776,000 5,321,500 1,860,000 8,282,900 8,727,500 - Capital Project Totals
continued
422

SUMMARY OF CAPITAL REQUIREMENTS AND CAPITAL RESERVES - FISCAL YEAR 2017-18, continued
General Parks & Risk Economic PublicProject Description Total Fund Recreation Grants Management Development Transit
CAPITAL RESERVESReserve: Pipe Over-sizing 20,000 - - - - - - Reserve: Connection Fees 744,100 - - - - - - Reserve: Replacement 6,139,200 - - - - - - Reserve: Equipment Replacement 1,212,300 - - - - - - Reserve: Building Replacement 93,400 - - - - - - Reserve: Street Connection Fees 163,900 - - - - - - Reserve: Building Maintenance 31,400 - - - - - - Reserve: Capital Projects 26,946,000 - 1,536,600 - - 300,700 - Reserve: Parks Capital Projects 50,000 - 50,000 - - - - Reserve: PepsiCo Settlement 186,600 - - - 186,600 - - Reserve: Facilities Maintenance 220,000 - - - - 220,000 - Reserve: Facilities Replacement 248,500 - - - - - - Reserve: Monteith House 11,700 - - - - - - Reserve: Waverly RH Land Mod Dep - WM 203,300 - - - - - - Reserve: Siemens Settlement 3,753,000 - - - - - - Reserve: Albany Transit 15,000 - - - - - - Reserve: Street Capital 72,200 - - - - - - Reserve: Stormwater Capital 200 - - - - - - Reserve: Stormwater Deferred Planting 5,000 - - - - - - Reserve: Stormwater In-Lieu-of Planting 5,000 - - - - - - Reserve: ODOT Safety Grant Match 30,000 - - - - - - Reserve: Lochner Road Imp 400,000 - - - - - - Reserve: ODOT I-5 EA 200,000 - - - - - - Reserve: Energy Trust 32,200 - - - - - - Reserve: Stormwater Drain Connection 112,800 - - - - - - Reserve Bus Barn 350,000 - - - - - -
Total Capital Reserves 41,245,800 - 1,586,600 - 186,600 520,700 -
Grand Totals 68,332,400 128,000$ 1,872,600$ 733,400$ 186,600$ 520,700$ 971,300$
423

Capital CapitalReplacement Street Projects Sewer Water Stormwater Project Description
CAPITAL RESERVES- - - 10,000 10,000 - Reserve: Pipe Over-sizing- - - 462,700 281,400 - Reserve: Connection Fees
6,139,200 - - - - - Reserve: Replacement- - - 726,200 408,700 77,400 Reserve: Equipment Replacement
93,400 - - - - - Reserve: Building Replacement- 163,900 - - - - Reserve: Street Connection Fees
31,400 - - - - - Reserve: Building Maintenance- 3,528,800 12,778,700 5,766,900 3,034,300 - Reserve: Capital Projects- - - - - - Reserve: Parks Capital Projects- - - - - - Reserve: PepsiCo Settlement- - - - - - Reserve: Facilities Maintenance
248,500 - - - - - Reserve: Facilities Replacement11,700 - - - - - Reserve: Monteith House
- 203,300 - - - - Reserve: Waverly RH Land Mod Dep - WM- - - 3,753,000 - - Reserve: Siemens Settlement- 15,000 - - - - Reserve: Albany Transit- 72,200 - - - - Reserve: Street Capital- - - - - 200 Reserve: Stormwater Capital- - - - - 5,000 Reserve: Stormwater Deferred Planting- - - - - 5,000 Reserve: Stormwater In-Lieu-of Planting- 30,000 - - - - Reserve: ODOT Safety Grant Match- 400,000 - - - - Reserve: Lochner Road Imp- 200,000 - - - - Reserve: ODOT I-5 EA
32,200 - - - - - Reserve: Energy Trust- - - - - 112,800 Reserve: Stormwater Drain Connection
350,000 - - - - - Reserve Bus Barn
6,906,400 4,613,200 12,778,700 10,718,800 3,734,400 200,400 Total Capital Reserves
7,682,400$ 9,934,700$ 14,638,700$ 19,001,700$ 12,461,900$ 200,400$ Grand Totals
424

Accessibility
Addressing Physical Barriers
he City recognizes that one of the characteristics of a truly great city is a commitment to ensuring
all members of the community have equal access to public and private facilities and amenities. We
strive to have an inclusive public infrastructure that adequately meets the needs of all citizens.
Through progressive efforts, Albany’s public facilities will become increasingly accessible to people of all
abilities.
Acknowledging We Cannot Remedy All Issues Now
From steep slopes to stairs, there are many barriers to accessibility around
the City. This is common in established cities, as much of the
infrastructure, including sidewalks, was constructed before accessibility
standards were enacted or even considered. The prevalence of these
barriers may make complete accessibility seem daunting. Careful planning
and proactive efforts ensures continued measurable progress will bring
considerable benefits to Albany’s citizens. In addition, because all new
projects are required to be accessible, the number of deficiencies
throughout the city will decline as the City continues to invest in replacing
infrastructure that has exceeded its design and functional life.
In compliance with the Americans with Disabilities Act (ADA), fixing accessibility deficiencies is
incorporated into the City’s transportation infrastructure upgrade plans. This includes incorporation into
transit improvement plans and the installation of new curb ramps where none exist. Staff will continue to
design and implement plans for disability access. Such plans for new projects will meet either the ADA
Standards for Accessible Design or the Access Board’s Accessibility Guidelines for Pedestrian Facilities
in the Public Right-of-Way.
Transitioning toward Accessible Facilities
The primary ADA construction projects identified in this CIP window are the improvements to the Dave
Clark Path and improvements on Washington Street. Other projects have been identified as areas in need
of improvements, and will be scheduled when funding has been identified. They include curb ramp
placement and sidewalk repair.
Separate from dedicated ADA projects, the City continues to make substantial investments in improving
accessibility throughout Albany. These efforts are typically paired with other required maintenance or
capital project activities. For instance, when a street overlay is planned, City staff evaluates the need for
curb ramp placement or replacement and incorporates this work into the overlay project. Many new
ADA-compliant curb ramps are added each year through this process. Over the last five years, 240 curb
ramps have been constructed or replaced in conjunction with planned capital projects. A small amount of
funding is also set aside each year to allow the City to address a limited number of complaint areas as they
arise. Another 22 ramps have been replaced in response to specific ADA concerns expressed by residents.
T
425

Under the City’s current ADA Transition Plan, over 75 percent of the public building improvements
called for in the plan have been completed. Funding limitations have made continued efforts on updating
the City’s ADA Transition Plan a challenge. However, progress is slowly being made towards a plan that
addresses the highest priority areas. As required by the Americans with Disabilities Act, complaint areas
are a first priority. The updated transition plan will set a path toward bringing the City’s infrastructure
into compliance with the ADA.
Private development proposals are also evaluated for accessibility compliance, inspections are performed
to ensure all new public and private construction meets accessibility requirements, and complaints about
inaccessible public and private elements and facilities are received and investigated. Such complaints
have included inaccessible walkways, deficient curb ramps, and inadequate accessible parking, among
other things. Enforcement action on private properties is taken when staff is not able to obtain voluntary
compliance. Our goal is to address access-related citizen concerns in a timely and productive manner
while continuing to transition City facilities toward improved accessibility.
Lastly, the City considers accessibility and evaluates ADA compliance as part of many other activities.
For example, the Parks Department plans to include an ADA component in their upcoming master plan,
ADA improvements have been incorporated into annual action plans for Community Development Block
Grants (CDBG), and accessibility has been considered in the City’s Emergency Management Plan.
Funding Summary
The following table shows the total amount of projects scheduled in each of the five years of this CIP,
broken down by the source of the funding. The costs shown are the projected construction costs in the
year the project is proposed. Each year we take the estimated cost of the projects and bring them up to
current year costs by applying the change in the Engineering News-Record (ENR) construction cost index
for Seattle. The future year costs then have an annual three percent inflation factor added in to estimate
the cost in the year proposed.
Projected Cost Totals
FUNDING SOURCE 2018 2019 2020 2021 2022 TOTAL
ADA Capital Reserves $0 $0 $95,000 $0 $0 $95,000
Community Development Block Grant $95,000 $0 $0 $0 $0 $95,000
GRAND TOTALS: $95,000 $0 $95,000 $0 $0 $190,000
426

Capital Improvement Program 2018-2022
The following projects have been identified for inclusion in this five-year Capital Improvement Program.
Each project shown below is explained in detail on the pages that follow. Projects are listed in the fiscal year order they are planned to occur, and in CIP ID# order within a given fiscal year set.
Funded Projects Summary & Detail
Title Projected Total CIP # Phase
Plan Year: 2017 - 2018
DAVE CLARK PATH ADA IMPROVEMENTS $95,0002216
$95,000Total for FY 2017 - 2018
Plan Year: 2019 - 2020
WASHINGTON STREET ADA IMPROVEMENTS – 2ND AVENUE TO 9TH AVENUE $95,0002172
$95,000Total for FY 2019 - 2020
$190,000Grand Total for Accessibility:
427

Capital Improvement Program 2018-2022
Plan FY: 2017-2018 DAVE CLARK PATH ADA IMPROVEMENTS
$95,000Total Cost:
Funding SourceActivity Projected Amount
Master Plan: Plan Element:
Category: Accessibility Classification:
Department: Public Works Department
This project will repair broken sidewalks and construct curb ramps along the on-street portion of the Dave Clark Path, which includes portions of Front Avenue. These improvements will complete an accessible route between downtown Albany and Bowman Park.
Operating Budget Impact: This project will reduce maintenance costs over the long term by fixing damaged sidewalks.
CIP Project #: 2216
Funding Sources For This Project:
COMMUNITY DEVELOPMENT BLOCK GRANT $95,000203-40-5100
$95,000Total:
428
Parks
Limited Resources Continue to Delay Parks
Projects
n 2006, the Albany City Council adopted the current Parks & Recreation Master Plan. This plan
guides the City’s investment in park acquisition, renovation, and new facility improvements. Parks
projects are funded by a mix of funds from outside grants, private donations, Parks System
Development Charges, and the Parks and Recreation Department’s annual operating fund. The slow-
down in the local economy reduced estimated revenues in each of our funding sources for park projects,
requiring adjustments to the schedules for several projects in this CIP.
A high priority of the Parks Master Plan is the replacement of grossly outdated and inadequate
playgrounds in existing parks. Since the adoption of the master plan, new playgrounds have been
installed in Eads, Takena, Swanson, Riverview Heights, Teloh Calapooia, and Burkhart parks. These
projects were accomplished through a mix of Parks Fund operating revenues, grants, donations, and Parks
SDCs. The playground at Sunrise Park has recently received an allocation from the City’s Community
Development Block Grant funding. This project was originally scheduled for completion in 2015.
However, wetlands have been delineated on site and must now be mitigated, delaying the project. Sunrise
Park is now scheduled for completion in 2017.
The remaining playground replacement projects must be suspended indefinitely due to a lack of reliable
funding. Projects at Henderson, Draper, Deerfield, Grand Prairie, Pineway, and Lehigh parks have been
deferred to future years.
No new Parks projects are included at this time for the FY 2018-2022 CIP. All other previously
scheduled Parks projects have been either delayed or suspended indefinitely due to a lack of predictable
funding over the next few years. The Parks Master Plan will be updated in 2017, resetting the list of
proposed projects, implementation schedule, and project financing.
I
429

Capital Improvement Program 2018-2022
The following projects have been identified as needed repairs and/or improvements to the City's infrastructure. In most cases, these projects are the result of a master plan process, which attempts to systematically look at the needs for public infrastructure over the next 10 to 20 years. These projects are considered "Unfunded" because either a source of funding has not been made available, or they will not be implemented within the five-year window this plan covers.
Unfunded Projects
Miscellaneous - Parks
CIP # Phase Year Title Projected Total
0 NEW HIKE/BIKE TRAIL DEVELOPMENT $500,0001937
$500,000Total for Unfunded Miscellaneous - Parks:
Park Development
CIP # Phase Year Title Projected Total
0 TIMBER RIDGE PARK ACQUISITION $300,0001321
0 TIMBER LINN PARK IMPROVEMENTS - PHASE 1B $400,0001886
0 TIMBER LINN PARK IMPROVEMENTS - PHASE 1C $600,0001887
0 COMMUNITY PARK DEVELOPMENT - PHASE 1 $1,500,0001895
0 NEIGHBORHOOD PARK DEVELOPMENT - TIMBER RIDGE SITE $300,0001903
0 NEIGHBORHOOD PARK DEVELOPMENT - TIMBER RIDGE SITE PHASE 2
$200,0001904
0 COMMUNITY PARK DEVELOPMENT - PHASE 2 $1,000,0001936
$4,300,000Total for Unfunded Park Development:
Park Renovations
CIP # Phase Year Title Projected Total
0 DEERFIELD PARK RENOVATION $400,0001893
$400,000Total for Unfunded Park Renovations:
Replacement Projects
CIP # Phase Year Title Projected Total
0 GRAND PRAIRIE PARK PLAYGROUND REPLACEMENT $150,0001889
0 DRAPER PARK PLAYGROUND REPLACEMENT $150,0001896
0 PINEWAY PARK PLAYGROUND REPLACEMENT $100,0001898
0 HENDERSON PARK PLAYGROUND REPLACEMENT $70,0001899
0 LEHIGH PARK PLAYGROUND REPLACEMENT $200,0002321
$670,000Total for Unfunded Replacement Projects:
$5,870,000Grand Total for Unfunded Parks:
430

Public Facilities
Issues Before the Community
he Albany City Council and other community leaders have been discussing the City’s public
facility needs for several years. Much of the discussion has been about the City’s emergency
facilities. Replacement of the downtown fire station (Station 11) and the police station are
underway and funding has been secured through litigation settlement proceeds, CARA funding, and a
General Obligation Bond, which was approved by voters in May 2015. After conducting an Invitation to
Bid process, the City awarded the construction contract for both facilities to the low bidder, Gerding
Builders, LLC, in the amount of $19,500,200. Gerding Builders began construction on both the police
station and downtown fire station in August 2016, with completion being slated for the summer/fall of
2017.
Emergency Facilities
The new downtown fire station will be located at 611 Lyon Street SE, on approximately 1.65 acres of
property. The replacement main fire station will be two stories, approximately 25,000 square feet, and will
house Fire Department Administration, Life Safety Services, Ambulance Billing, Emergency
Management, and one quarter of all Department emergency response operations. The new fire station will
be completed in the first quarter of Fiscal Year 2017-2018.
The new police station will be located in the 2600 block of Pacific Boulevard on 3.69 acres of property.
The replacement police station will be two stories, approximately 40,400 square feet, and will house all
Police Department operations. The new police station will be completed in the first quarter of Fiscal Year
2017-2018.
Additionally, both Fire and Police emergency responders lack adequate local training facilities to develop
new skills and maintain proficiency and current capabilities. Emergency responders’ skills must be
maintained to safely and adequately handle the numerous high-risk and hazardous events they encounter.
Currently training has been focused on property located behind Fire Station 12 on 34th Avenue; however,
City buses occupy space that is needed to expand current capacity. Additional efforts need to be taken to
relocate City buses so that consistent training is available for all emergency responders inside of Albany.
City Buildings
Many City buildings, including fire stations, need major maintenance work: parking lot replacement, roof
repairs, carpet, paint, and heating and cooling systems. Much of the work has been deferred year after
year in favor of other pressing needs.
Funding Summary
The City, counties, and schools get money for capital projects from the same source; local taxpayers. In
the fall of 2005, the Albany City Council established a reserve account to be used for one or more of the
City’s building needs. Ongoing projects have depleted these funds, and they have not been replenished
T
431

over the past few years due to funding other pressing needs. Funding for major facilities projects is
needed, as major repairs are needed, but not possible, out of yearly General Fund operating budgets. Staff
continues to look for additional sources of money to supplement available funds.
The following table shows the total amount of projects scheduled in each of the five years of this CIP,
broken down by the source of the funding. The costs shown are the projected construction costs in the
year the project is proposed. Each year we take the estimated cost of the projects and bring them up to
current year costs by applying the change in the Engineering News-Record (ENR) construction cost index
for Seattle. The future year costs then have an annual three percent inflation factor added in to estimate
the cost in the year proposed.
Projected Cost Totals
FUNDING SOURCE 2018 2019 2020 2021 2022 TOTAL
GF Facilities Maintenance Projects $50,000 $0 $0 $0 $0 $50,000
Reserve: Capital Projects $50,000 $0 $0 $0 $0 $50,000
GRAND TOTALS: $100,000 $0 $0 $0 $0 $100,000
432

Capital Improvement Program 2018-2022
The following projects have been identified for inclusion in this five-year Capital Improvement Program.
Each project shown below is explained in detail on the pages that follow. Projects are listed in the fiscal year order they are planned to occur, and in CIP ID# order within a given fiscal year set.
Funded Projects Summary & Detail
Title Projected Total CIP # Phase
Plan Year: 2017 - 2018
FIRE STATION 13 PARKING LOT REPLACEMENT $100,0002369
$100,000Total for FY 2017 - 2018
$100,000Grand Total for Public Facilities:
433

Capital Improvement Program 2018-2022
Plan FY: 2017-2018 FIRE STATION 13 PARKING LOT REPLACEMENT
$100,000Total Cost:
Funding SourceActivity Projected Amount
Master Plan: Plan Element:
Category: Public Facilities Classification: Fire Facilities
Department: Fire Department
CIP Project #: 2369
Funding Sources For This Project:
RESERVE: CAPITAL PROJECTS $50,000100-25-1208
GF FACILITIES MAINTENANCE PROJECTS $50,000217-10-2002
$100,000Total:
434


Capital Improvement Program 2018-2022
The following projects have been identified as needed repairs and/or improvements to the City's infrastructure. In most cases, these projects are the result of a master plan process, which attempts to systematically look at the needs for public infrastructure over the next 10 to 20 years. These projects are considered "Unfunded" because either a source of funding has not been made available, or they will not be implemented within the five-year window this plan covers.
Unfunded Projects
Fire Facilities
CIP # Phase Year Title Projected Total
0 DEVELOP EMERGENCY SERVICE TRAINING CAPABILITIES $2,500,0001943
0 UPDATE CURRENT RADIO SYSTEM TO 700/800 MHZ $2,000,0002180
0 FIRE STATION 12 PARKING LOT REPLACEMENT $170,0002368
$4,670,000Total for Unfunded Fire Facilities:
$4,670,000Grand Total for Unfunded Public Facilities:
435

Revitalization
Revitalization Underway!
CARA works to turn vision into reality
he Central Albany Revitalization Area’s (CARA’s) goal is to implement the community-based
Town Center Plan vision for revitalizing Central Albany.
As an urban renewal district, CARA’s funding comes from property tax dollars collected from
increases in property values (the tax increment above 2001 values), not by imposing new taxes. CARA is
able to fund activities within its 919-acre boundary from the Willamette River to the Queen Avenue/Ninth
Avenue/Pacific Boulevard area roughly between Geary Street and the Elm Street medical area.
The Results
To date, CARA has committed about $24 million on
projects that assist the revitalization of Central Albany.
Note: the unfunded projects in the CIP are based on
2001 dollars.
The majority of the projects have taken the form of
taxable public-private partnerships. These partnerships
have seen a CARA investment of roughly $10.2 million,
which has leveraged $85.8 million in private investments,
equating to a ratio of $1 of public money leveraging
$8.50 of private funds (see graph CARA Private Projects: % Public and Private Funds, below).
A breakdown of private project types
can be seen in graph: CARA
Allocations, Private Projects
(below). Funding from the urban
renewal district takes the form of
loans, grants, and forgivable loans.
T
Commercial24%
Industrial2%
Mixed Use34%
Residential40%
CARA Allocations, Private Projects
436

Goals of the CARA Plan
CARA has worked to meet the specific goals of the urban
renewal plan in the following ways:
Enhance public infrastructure in the downtown community:
Construction on Phase 1 of the new Downtown Streetscape
Project will begin early 2017. This 8.4 million dollar project
will upgrade sidewalk, asphalt pavement, and public right of
ways in order to promote healthy business growth in the
downtown community. Phase 2 will include street lighting,
street furniture, stormwater quality planters, and road work
that will coincide with the new fire station being completed
this summer. This level of upgrades has not been seen in the
downtown area in decades and will help provide the
foundation needed for the community to grow in a positive
manor.
Retain and Enhance the Value of Existing Private
Investment and Public Investment in the Area:
Projects include the funding of five economic
development projects, which created 145 new jobs in our
community, and through the strategic investment of
$510,000 leveraged $2.1 million of private investment.
Preserve the Historic Districts, Historic Resources, and
Existing Housing in the Area:
Over 92 historic preservation projects in the area have
been funded, including saving entire structures, store-
front rehabilitation, exterior work, significant interior
renovation, and reclamation of unused upper floor
spaces.
Provide an Enriching Environment and Livable
Neighborhoods:
CARA has been working with the East Salem Avenue
neighborhood to eliminate blight and create a strong
sense of community. This work has taken the form of a
$20,000 investment in a neighborhood community
garden, as well as a partnership to see the use of the old
mobile home park on East Salem Avenue converted to
54 units of workforce housing with construction which
began in 2014 and finished in 2015.
437

Create a Readily Identifiable Core that is Unique and Vibrant with a Mixture of Entertainment, Housing,
Specialty Shops, Offices, and Other Commercial Uses:
Financial assistance in the form of small grants totaling $262,000 for 60 small business owners in
the downtown core. Projects that create vitality and attract people including the Albany Historic
Carousel, the Pix Theatre, and ADA accessible event space in downtown.
Financial assistance towards the Ironworks project. This development, now completed, includes a
15,000 square-foot office building, seven LEED-certified town homes, and an apartment building.
In 2010, this project was the recipient of the Oregon Brownfield Award.
Provide a Safe and Convenient Transportation Network that Encourages Pedestrian and Bicycle Access
to and within the Town Center:
Installation of streetscape improvements along First Avenue in the downtown core.
Pilot block of the Broadalbin sidewalk expansion and public utilities upgrade between First and
Second Avenues.
Noncapital projects include installation of a fiber-optic line, the Riverfront and Retail Refinement
Plans, and others.
Ancillary benefits including a significant reduction in police calls to blighted properties which have since
been rehabilitated with CARA funding, as well as increased visitors and visitor spending in our
community.
Looking Forward
Fifteen years of the approximately 25-year Tax Increment Financing (TIF) funding have been completed.
The maximum indebtedness of the Area is $56,000,000, of which there is $37,767,405 remaining at the
end of FY 2015-2016. Efforts to further the goals of the Urban Renewal Plan and attract private
investment that supports revitalization of the urban center will be part of the future activities. CARA
approved funding for lights on the Dave Clark Path. Work on the downtown way finding signs continues.
Other key issues for CARA include waterfront development, highest and best use of downtown City-
owned properties, and continued improvement and restoration of downtown properties.
438


Capital Improvement Program 2018-2022
The following projects have been identified as needed repairs and/or improvements to the City's infrastructure. In most cases, these projects are the result of a master plan process, which attempts to systematically look at the needs for public infrastructure over the next 10 to 20 years. These projects are considered "Unfunded" because either a source of funding has not been made available, or they will not be implemented within the five-year window this plan covers.
Unfunded Projects
Development Partnerships
CIP # Phase Year Title Projected Total
0 PROPERTY ACQUISITION & ASSEMBLY $250,0001338
0 PROPERTY REDEVELOPMENT ASSISTANCE $1,000,0001341
0 PAINT PROGRAM $100,0001342
0 ALBANY SQUARE DEVELOPMENT $150,0001343
0 WATER AVENUE IMPROVEMENTS $2,000,0001344
0 RIVERFRONT HOUSING INFRASTRUCTURE $2,625,0001345
0 TRANSITION AREAS REDEVELOPMENT $1,250,0001346
0 HOUSING DEMONSTRATION $250,0001347
0 HOUSING DEVELOPMENT $825,0001348
0 HOUSING REHABILITATION $700,0001349
$9,150,000Total for Unfunded Development Partnerships:
General Facilities
CIP # Phase Year Title Projected Total
0 CANAL ESPLANADE $3,698,0001331
0 COMMUNITY GATEWAYS $626,0001333
$4,324,000Total for Unfunded General Facilities:
Infrastructure
CIP # Phase Year Title Projected Total
0 COMMUNICATIONS INFRASTRUCTURE $500,0001366
0 UNDERGROUND OVERHEAD UTILITIES $1,000,0001367
0 ROADS, WATER, SEWER, STORM SEWER, RAIL CROSSING $3,000,0001368
0 STREET REDEVELOPMENT $2,000,0001369
0 ALLEY REDEVELOPMENT $750,0001370
0 DOWNTOWN GRID SYSTEM $100,0001371
0 TRAFFIC CALMING $250,0001372
0 QUEEN AVENUE RAIL CROSSING $300,0001373
0 1ST AVENUE UNDERCROSSING $500,0001374
$8,400,000Total for Unfunded Infrastructure:
Pedestrian/Bicycle Connectivity
CIP # Phase Year Title Projected Total
0 WILLAMETTE RIVERFRONT PATH - CALAPOOIA CROSSING $1,000,0001375
0 WILLAMETTE RIVERWALK - BOWMAN/HARRISON CONNECTION $250,0001376
439

Capital Improvement Program 2018-2022
Year Title Projected Total CIP # Phase
0 CALAPOOIA RIVERWALK $500,0001377
0 8TH AVENUE CANAL ESPLANADE $500,0001379
0 THURSTON CANAL ESPLANADE $600,0001380
$2,850,000Total for Unfunded Pedestrian/Bicycle Connectivity:
Public Spaces & Facilities
CIP # Phase Year Title Projected Total
0 BROADALBIN STREET IMPROVEMENTS $360,0001352
0 ALBANY SQUARE $200,0001353
0 ALBANY LANDING $350,0001354
0 DOWNTOWN BEAUTIFICATION $300,0001356
0 AWNING PROGRAM $125,0001357
0 RIVERFRONT HOUSING AREA STREETSCAPE $120,0001358
0 MAIN STREET AREA STREETSCAPE $75,0001359
0 SIDEWALK PROGRAM $250,0001360
0 STREET TREE PLANTING $250,0001361
0 HISTORIC DISTRICTS SIGNAGE $200,0001362
0 DOWNTOWN PARKING AREAS $350,0001363
0 GOVERNMENT CENTER PARKING STRUCTURE $2,000,0001364
0 WATER AVENUE AREA PARKING STRUCTURE $1,500,0001365
0 PUBLIC FACILITIES $550,0001384
0 DOWNTOWN STREETSCAPE $560,0001990
$7,190,000Total for Unfunded Public Spaces & Facilities:
Watershed Health & Education
CIP # Phase Year Title Projected Total
0 WATERSHED HEALTH $265,0001381
0 RIPARIAN RESTORATION $50,0001382
0 ALBANY GROVE $75,0001383
$390,000Total for Unfunded Watershed Health & Education:
$32,304,000Grand Total for Unfunded Revitalization:
440

Stormwater
Protecting our Resources
Making Progress
lbany receives an average annual rainfall of approximately 42 inches. During rain events, it is
important to have infrastructure in place to manage the stormwater runoff. Infrastructure for
stormwater includes pipes and ditches and facilities to hold, infiltrate, and clean up stormwater in
a safe and efficient manner that protects against flooding while also minimizing impacts to the
environment. Albany has 131 miles of stormwater pipes, 70 miles of ditches, 2,320 manholes, 4,302
catch basins, along with 116 stormwater quality facilities.
In order to properly operate and maintain the stormwater system, it is important the City understand how
the existing stormwater system performs, plan for future infrastructure needs, adapt to new regulatory
requirements, and understand new methods and technologies for protecting Albany’s valuable water
resources.
Assessing Our System and Planning for the Future
Albany’s Strategic Plan identifies an objective to develop and implement an updated stormwater
management plan and financial plan to meet state and federal laws and regulations. Consistent with this
objective, the City is completing efforts to evaluate our existing system and plan for future growth. The
last master plan, completed in 1988, did not evaluate North Albany and does not reflect current
stormwater management practices, the current level of development within the community, or current
regulatory requirements. When the management plan is completed, a comprehensive project list will be
added to this section of the CIP.
One of the stormwater challenges the City is faced with is how to respond to new and upcoming
regulatory requirements mandated by the Environmental Protection Agency (EPA) and the Oregon
Department of Environmental Quality (DEQ). In June 2013, the City received approval of our second
five-year plan for complying with the Willamette River Total Maximum Daily Load (TMDL). Now that
Albany has passed the 50,000 population threshold, the City will be required to obtain a NPDES MS4
permit from DEQ. DEQ is drafting a new permit and Albany will be required to apply for coverage once
released. To comply with the approved TMDL plan and NPDES MS4 Phase II permit, the City will need
to make significant changes to our stormwater management practices within the five-year window of this
CIP.
Taking steps to address the Funding Challenge
Unlike the street, wastewater, and water utilities, stormwater management and maintenance activities have
not had a dedicated funding source. This changed when Council passed a resolution establishing
stormwater service charges on November 9, 2016. The stormwater service charges were implemented
March 1, 2017 and provide a dedicated funding source. However, initial service charges will not fund
routine operation and maintenance activities necessary to support an asset management approach to
managing our infrastructure.
A
441

Following completion of the master planning effort discussed above, Council can consider implementing
a stormwater System Development Charge (SDC). This SDC could be used as another component of a
stormwater funding methodology.
No new stormwater projects are proposed for funding at this time.
442

Transportation
Partnering with our neighbors
he City’s transportation system consists of city, state, and Linn and Benton county roads. The City
maintains 400 lane miles of improved streets, 21 traffic signals, 7,145 signs, and 61 miles of
painted pavement striping. The transportation network is the City’s single largest capital asset.
Federal regulations require that communities with populations greater than 50,000 and adjacent
communities within the “urbanized area” of the larger community form Metropolitan Planning
Organizations (MPOs). As a result, in 2013 the Albany Area Metropolitan Planning Organization
(AAMPO) was formed with the cities of Albany, Millersburg, Tangent, and Jefferson and Linn and
Benton counties. AAMPO provides a platform for Albany and our neighboring communities to work
together on regional planning efforts.
In past years, Albany’s street capital projects have primarily been funded from Surface Transportation
Program (STP) funding from the state, Sewer and Water in-lieu-of Franchise Fees that are transferred into
the Street Fund each year, state gas tax revenues, and Street SDCs. Historically, STP revenues have been
used to fund Albany’s largest street reconstruction projects. It has not been uncommon for multiple years’
worth of STP funding to be consolidated in order to fund a single project.
With the formation of AAMPO, Albany no longer directly receives STP funds from the state. The state
provides STP funds to AAMPO based on the entire urbanized area. It is then up to the AAMPO policy
board, made up of representatives of each agency, to decide how best to distribute the funds within the
AAMPO boundaries. This year’s CIP was developed based on AAMPO’s anticipated distribution of STP
funds. Future levels of gas tax and STP funding the City will receive are uncertain. Gas tax revenues are
not anticipated to grow at a pace that will allow historic funding levels. The STP funding is dependent on
the U.S. Congress’s funding of the Highway Trust Fund.
Financial Challenges Remain
Albany’s Strategic Plan identified an objective to maintain collector and
arterial streets in satisfactory or better condition and address local street
needs as funding allows. Due to a lack of financial resources, Albany’s
streets are not being maintained at a level that will allow all streets to
remain in “satisfactory” condition. The number of miles of streets has
grown, the cost to maintain streets is increasing, and the amount of money
available to fund street maintenance activities is not sufficient.
Without additional funding, the backlog of streets needing repair or reconstruction
will continue to grow significantly. Albany is not alone in this problem. The entire nationwide system is
declining. The creation of a transportation utility fee has been discussed in the past to help close the
annual funding gap in street maintenance but has not been implemented due to a concern of
overburdening citizens with utility fees.
T
443

Funding Summary
The following table shows the total value of projects scheduled in each of the five years of this CIP,
broken down by the source of the funding. The costs shown are the projected total costs in the year the
project is proposed.
Each year the estimated cost of the projects are brought up to current year costs by applying the change in
the Engineering News-Record (ENR) construction cost index for Seattle. The future year costs then have
an annual three percent inflation factor added in to estimate the cost in the year proposed.
Projected Cost Totals
FUNDING SOURCE 2018 2019 2020 2021 2022 TOTAL
Greater Albany Public Schools $950,000 $0 $0 $0 $0 $950,000
In Lieu of Franchise Fees $0 $0 $0 $579,000 $595,000 $1,174,000
SDC – Improvement – Transportation $911,200 $515,000 $0 $1,880,000 $0 $3,306,200
State of Oregon $980,000 $1,256,000 $238,000 $546,000 $631,000 $3,651,000
Street Capital Reserves $1,483,800 $1,745,000 $40,000 $40,000 $40,000 $3,348,800
GRAND TOTALS: $4,325,000 $3,516,000 $278,000 $3,045,000 $1,266,000 $12,430,000
444

Capital Improvement Program 2018-2022
The following projects have been identified for inclusion in this five-year Capital Improvement Program.
Each project shown below is explained in detail on the pages that follow. Projects are listed in the fiscal year order they are planned to occur, and in CIP ID# order within a given fiscal year set.
Funded Projects Summary & Detail
Title Projected Total CIP # Phase
Plan Year: 2017 - 2018
HILL STREET: QUEEN AVENUE TO 24TH AVENUE $2,700,0001002 6
SANTA MARIA STREET IMPROVEMENTS $1,450,0002124
BICYCLE AND PEDESTRIAN IMPROVEMENT GRANT MATCH $40,0002231
24TH AVENUE & GEARY STREET PEDESTRIAN IMPROVEMENTS $135,0002378
$4,325,000Total for FY 2017 - 2018
Plan Year: 2018 - 2019
HILL STREET: 24TH AVENUE TO 34TH AVENUE $3,476,0002207
BICYCLE AND PEDESTRIAN IMPROVEMENT GRANT MATCH $40,0002288
$3,516,000Total for FY 2018 - 2019
Plan Year: 2019 - 2020
DAVIDSON STREET REHABILITATION – 14TH AVENUE TO 16TH AVENUE $238,0002228
BICYCLE AND PEDESTRIAN IMPROVEMENT GRANT MATCH $40,0002306
$278,000Total for FY 2019 - 2020
Plan Year: 2020 - 2021
GIBSON HILL ROAD/CROCKER LANE ROUNDABOUT $1,803,0002064
24TH AVENUE REHABILITATION – JACKSON STREET TO GEARY STREET $1,202,0002226
BICYCLE AND PEDESTRIAN IMPROVEMENT GRANT MATCH $40,0002322
$3,045,000Total for FY 2020 - 2021
Plan Year: 2021 - 2022
5TH AVENUE OVERLAY – LYON STREET TO MAIN STREET $595,0002233
SALEM AVENUE OVERLAY: UNION PACIFIC RAILROAD TO CITY LIMITS $631,0002248
BICYCLE AND PEDESTRIAN IMPROVEMENT GRANT MATCH $40,0002370
$1,266,000Total for FY 2021 - 2022
$12,430,000Grand Total for Transportation:
445

Capital Improvement Program 2018-2022
Plan FY: 2017-2018 HILL STREET: QUEEN AVENUE TO 24TH AVENUE
$2,700,000Total Cost:SDC
Funding SourceActivity Projected Amount
Master Plan: Transportation Master Plan Plan Element: B3
Category: Transportation Classification: Street Reconstruction/Improvements
Department: Public Works Department
This project will rehabilitate heavily deteriorated pavement on Hill Street from Queen Avenue to 24th Avenue. The existing street is heavily deteriorated due to its age. In addition to new pavement, this street reconstruction project will widen Hill Street to accommodate two travel lanes, on-street parking and bike lanes on both sides of the street. Pedestrian activated crossing improvements will be constructed on Hill Street at the Albany Boys and Girls Club. Sewer improvements as shown in CIP 2373 in the Wastewater section of the CIP will also be coordinated with this project.
Operating Budget Impact: This project will reduce maintenance costs over the long term by reducing the amount of temporary patching and other maintenance of the deteriorated pavement.
CIP Project #: 1002 Phase: 6
YearPhase Projected TotalTitle
Related Projects:
Funding Sources For This Project:
Category
SDC - IMPROVEMENT - TRANSPORTATION $401,700250-50-2703
STATE OF OREGON $980,000250-50-2700
STREET CAPITAL RESERVES $1,318,300250-50-2700
$2,700,000Total:
2 HILL STREET: 24TH AVENUE TO 34TH AVENUE
$1,854,0002019 Water
6 HILL STREET: QUEEN AVENUE TO 24TH AVENUE
$2,700,0002018 Transportation
$4,554,000Grand Total - All Related Projects:
446

Capital Improvement Program 2018-2022
Plan FY: 2017-2018 SANTA MARIA STREET IMPROVEMENTS
$1,450,000Total Cost:SDC
Funding SourceActivity Projected Amount
Master Plan: Plan Element:
Category: Transportation Classification: Link Projects
Department: Public Works Department
This project includes construction of approximately 1,100 linear feet of new street and storm drain improvements. Currently there are no public improvements on this undeveloped property. This project is being completed in partnership with Greater Albany Public Schools to facilitate construction of a new elementary school and provide connectivity to existing development. Waterline improvements as shown in CIP 2371 in the Water section of the CIP and sewer improvements as shown in CIP 2377 in the Wastewater section of the CIP will also be coordinated with this project.
Operating Budget Impact: This project will increase maintenance costs over the long term by adding to the street system.
CIP Project #: 2124
Funding Sources For This Project:
GREATER ALBANY PUBLIC SCHOOLS $950,000250-50-2700
SDC - IMPROVEMENT - TRANSPORTATION $500,000250-50-2703
$1,450,000Total:
447

Capital Improvement Program 2018-2022
This is an annual dedication to provide funds for match requirements on bicycle and pedestrian grants that are made available annually by the Oregon Department of Transportation. Many of the grants available require a local match. This dedication will provide a funding source should appropriate opportunities arise. All grant opportunities will come before the City Council for approval prior to acceptance.
Operating Budget Impact: None. There is no impact to street maintenance costs because this is reserve funding for potential grants, should the opportunity arise.
Plan FY: 2017-2018 BICYCLE AND PEDESTRIAN IMPROVEMENT GRANT MATCH
$40,000Total Cost:
Funding SourceActivity Projected Amount
Master Plan: Plan Element:
Category: Transportation Classification: Pedestrian & Bikeway
Department: Public Works Department
CIP Project #: 2231
Funding Sources For This Project:
STREET CAPITAL RESERVES $40,000250-50-2700
$40,000Total:
448

Capital Improvement Program 2018-2022
Plan FY: 2017-2018 24TH AVENUE & GEARY STREET PEDESTRIAN IMPROVEMENTS
$135,000Total Cost:SDC
Funding SourceActivity Projected Amount
Master Plan: Plan Element:
Category: Transportation Classification: Pedestrian Projects
Department: Public Works Department
This project includes construction of pedestrian safety improvements at the intersection of 24th Avenue and Geary Street. Improvements include pedestrian-activated warning lights, infill sidewalk on the west side of Geary Street, a curb extension on the northwest corner of the intersection, and ADA accessibility improvements.
Operating Budget Impact: This project will not significantly impact operation and maintenance costs over the long term.
CIP Project #: 2378
Funding Sources For This Project:
STREET CAPITAL RESERVES $125,500250-50-2700
SDC - IMPROVEMENT - TRANSPORTATION $9,500250-50-2703
$135,000Total:
449

Capital Improvement Program 2018-2022
The following projects have been identified as needed repairs and/or improvements to the City's infrastructure. In most cases, these projects are the result of a master plan process, which attempts to systematically look at the needs for public infrastructure over the next 10 to 20 years. These projects are considered "Unfunded" because either a source of funding has not been made available, or they will not be implemented within the five-year window this plan covers.
Unfunded Projects
Airport
CIP # Phase Year Title Projected Total
0 REHABILITATE THE FIXED BASE OPERATOR BUILDING $222,0001697 1
0 REHABILITATE THE FIXED BASE OPERATOR BUILDING $250,0001697 2
0 REHABILITATE THE FIXED BASE OPERATOR BUILDING $298,0001697 3
0 ACQUIRE PROPERTY - RUNWAY 16 RPZ $37,0001700
0 SEWER EXTENSION TO NORTH HANGARS $751,0001880
0 RUNWAY 34 SAFETY OVERRUN PROTECTION $401,0001881
0 ALBANY AIRPORT SEWER EXTENSION $200,0001926
0 AIRPORT MASTER PLAN UPDATE & ENVIRONMENTAL ASSESSMENT $350,0001953
0 WEATHER REPORTING EQUIPMENT & INSTALLATION $200,0002163
0 CONSTRUCT TAXIWAY $162,5002164
0 APRON REHABILITATION $682,5002166
$3,554,000Total for Unfunded Airport:
Bicycle Projects
CIP # Phase Year Title Projected Total
0 14TH AVENUE SHARROWS (B1) $2,0002010
0 WAVERLY DRIVE BIKE SHARROWS (B2) $5,0002011
0 24TH AVENUE BIKE SHARROWS (B4) $5,0002013
0 JACKSON STREET BIKE LANES (B5) $674,0002014
0 CENTER STREET BIKE SHARROWS (B6) $6,0002015
0 US 20, NORTH ALBANY SHOULDER TO BIKE LANES (B7) $31,0002016
0 1ST AVENUE BIKE BOULEVARD (B8) $43,0002017
0 2ND AVENUE BIKE BOULEVARD (B9) $43,0002018
0 MADISON STREET - 7TH AVENUE BIKE BOULEVARD (B10) $40,0002019
0 7TH AVENUE BIKE BOULEVARD (B11) $95,0002020
0 TAKENA BIKE BOULEVARD (B12) $53,0002021
0 LIBERTY - LAKEWOOD BIKE BOULEVARD (B13) $76,0002022
0 12TH AVENUE (WEST) BIKE BOULEVARD (B14) $32,0002023
0 BAIN STREET BIKE BOULEVARD (B15) $49,0002024
0 SOUTH SHORE DRIVE BIKE BOULEVARD (B16) $33,0002025
0 SHORTRIDGE STREET BIKE BOULEVARD (B17) $27,0002026
0 24TH AVENUE BIKE BOULEVARD (B18) $13,0002027
0 38TH AND 39TH AVENUE BIKE BOULEVARDS (B19) $106,0002028
$1,333,000Total for Unfunded Bicycle Projects:
450

Capital Improvement Program 2018-2022
Year Title Projected Total CIP # Phase
Bridges
CIP # Phase Year Title Projected Total
0 7TH AVENUE AT ALBANY CANAL $77,0001063
0 9TH AVENUE AT ALBANY CANAL $70,0001064
0 10TH AVENUE AT ALBANY CANAL $49,0001065
0 11TH AVENUE AT ALBANY CANAL $42,0001066
0 SALEM AVENUE AT PERIWINKLE CREEK $56,0001069
$294,000Total for Unfunded Bridges:
Intersection Projects
CIP # Phase Year Title Projected Total
0 WAVERLY DRIVE/QUEEN AVENUE INTERSECTION ADD LANE(S) (I6) $72,0002036
0 WAVERLY DRIVE/GRAND PRAIRIE INTERSECTION ADD LANE(S) (I7) $175,0002037
0 US 20/NORTH ALBANY ROAD INTERSECTION ADD LANE(S) (I8) $40,0002038
0 US 20/SPRINGHILL DRIVE INTERSECTION ADD LANE(S) (I9) $14,0002039
0 KNOX BUTTE/CENTURY DRIVE INTERSECTION CONTROL CHANGE (I10)
$345,0002040
0 US 20 (LYON STREET)/2ND AVENUE INTERSECTION ADD LANE(S) (I12) $23,0002042
0 US 20/CLAY STREET SAFETY (I13) $185,0002043
0 OR 99E/34TH AVENUE INTERSECTION ADD LANE(S) (I14) $192,0002044
0 ELLINGSON ROAD/COLUMBUS STREET INTERSECTION CONTROL CHANGE (I16)
$345,0002046
0 WAVERLY DRIVE/14TH AVENUE INTERSECTION ADD LANE(S) (I17) $77,0002047
0 QUEEN AVENUE/GEARY STREET INTERSECTION ADD LANE(S) (I18) $1,901,0002048
0 WAVERLY DRIVE/34TH AVENUE INTERSECTION ADD LANE(S) (I19) $42,0002049
0 US 20 (ELLSWORTH STREET) INTERSECTION ADD LANE(S) (I20) $18,0002050
0 US 20 (LYON STREET)/1ST AVENUE INTERSECTION ADD LANE(S) (I21) $11,0002051
0 US 20 (ELLSWORTH STREET) INTERSECTION ADD LANE(S) (I23) $17,0002053
0 OR 99E/WAVERLY DRIVE INTERSECTION ADD LANE(S) (I24) $959,0002054
0 US 20/WAVERLY DRIVE INTERSECTION ADD LANE(S) (I25) $853,0002055
0 US 20/WAVERLY DRIVE INTERSECTION ADD LANE(S) (I26) $240,0002056
0 OR 99E/QUEEN AVENUE INTERSECTION ADD LANE(S) (I27) $894,0002057
0 OR 99E/34TH AVENUE INTERSECTION ADD LANE(S) (I28) $456,0002058
0 OR 99E/KILLDEER AVENUE INTERSECTION ADD LANE(S) (I29) $3,207,0002059
0 US 20/TIMBER STREET INTERSECTION ADD LANE(S) (I30) $571,0002060
0 US 20/TIMBER STREET INTERSECTION ADD LANE(S) (I31) $619,0002061
0 SPRINGHILL DRIVE/HICKORY STREET INTERSECTION CONTROL CHANGE (I34)
$345,0002063
0 TIMBER STREET EXTENSION/18TH AVENUE INTERSECTION CONTROL CHANGE (I36)
$1,513,0002065
0 OR 99E/29TH AVENUE INTERSECTION ADD LANE(S) (I37) $106,0002066
0 SALEM AVENUE/GEARY STREET INTERSECTION CONTROL CHANGE (I38)
$845,0002067
0 OR 99E/LYON STREET INTERSECTION ADD LANE(S) (I39) $205,0002068
0 OR 99E/53RD AVENUE INTERSECTION ADD LANE(S) (I40) $550,0002069
$14,820,000Total for Unfunded Intersection Projects:
451

Capital Improvement Program 2018-2022
Year Title Projected Total CIP # Phase
Link Projects
CIP # Phase Year Title Projected Total
0 53RD AVENUE EXTENSION (L1) $17,986,0002070
0 WAVERLY DRIVE ADD LANE(S) (L2) $1,394,0002071
0 WASHINGTON/CALAPOOIA/1ST/2ND AVENUE SAFETY (L3) $100,0002072
0 TIMBER STREET EXTENSION (L4) $3,674,0002073
0 MAIN STREET/7TH AVENUE/HILL STREET URBAN UPGRADE (L5) $1,292,0002074
0 LOCHNER - COLUMBUS CONNECTOR (L8) $2,742,0002076
0 NEW NORTH ALBANY CONNECTOR (L10) $5,818,0002078
0 SPICER DRIVE EXTENSION (WEST OF TIMBER STREET) (L11) $982,0002079
0 SPICER DRIVE EXTENSION (EAST OF TIMBER STREET) (L12) $1,666,0002080
0 GOLDFISH FARM ROAD EXTENSION (L13) $1,013,0002081
0 DOGWOOD AVENUE EXTENSION (L14) $3,294,0002082
0 NEW NORTH/SOUTH COLLECTOR (L15) $7,497,0002083
0 NEW EAST/WEST COLLECTOR (L16) $3,723,0002084
0 EXPO PARKWAY EXTENSION (SOUTH OF DUNLAP) (L17) $996,0002085
0 TIMBER STREET EXTENSION TO SOMERSET AVENUE (L18) $1,720,0002086
0 SOMERSET AVENUE EXTENSION (L19) $1,653,0002087
0 SANTA MARIA AVENUE EXTENSION (L20) $1,357,0002088
0 KNOX BUTTE ROAD WIDENING (L21) $4,647,0002089
0 KNOX BUTTE ROAD WIDENING (L22) $856,0002090
0 KNOX BUTTE ROAD WIDENING (L23) $1,256,0002091
0 KNOX BUTTE ROAD WIDENING (L24) $7,688,0002092
0 DUNLAP AVENUE EXTENSION (L25) $1,045,0002093
0 SPRINGHILL DRIVE WIDENING (L26) $3,406,0002094
0 US 20 WIDENING (L27) $8,351,0002095
0 ELLINGSON ROAD EXTENSION (L28) $4,430,0002096
0 OAK STREET (L30) $1,830,0002097
0 FESCUE STREET TO THREE LAKES ROAD CONNECTOR (L31) $886,0002098
0 FESCUE STREET EXTENSION (L32) $3,054,0002099
0 THREE LAKES ROAD REALIGNMENT (L33) $2,617,0002100
0 LOONEY LANE EXTENSION (L34) $914,0002101
0 ALBANY AVENUE WIDENING (L35) $1,177,0002102
0 SPRINGHILL DRIVE URBAN UPGRADE (L37) $4,158,0002104
0 SCENIC DRIVE URBAN UPGRADE (L38) $6,842,0002105
0 CENTURY DRIVE URBAN UPGRADE (L39) $3,199,0002106
0 GIBSON HILL ROAD URBAN UPGRADE (L40) $3,816,0002107
0 SKYLINE DRIVE URBAN UPGRADE (L41) $1,523,0002108
0 CROCKER LANE URBAN UPGRADE (L42) $4,529,0002109
0 VALLEY VIEW DRIVE URBAN UPGRADE (L43) $3,695,0002110
0 WEST THORNTON LAKE DRIVE URBAN UPGRADE (L44) $6,097,0002111
0 ALLEN LANE URBAN UPGRADE (L45) $2,689,0002112
0 COLUMBUS STREET URBAN UPGRADE (L46) $2,727,0002113
0 GRAND PRAIRIE ROAD URBAN UPGRADE (L47) $2,260,0002114
0 SPICER DRIVE URBAN UPGRADE (L48) $868,0002115
0 SCRAVEL HILL ROAD URBAN UPGRADE (L49) $9,699,0002116
0 QUARRY ROAD URBAN UPGRADE (L50) $3,493,0002117
0 SPICER ROAD URBAN UPGRADE (L51) $676,0002118
452

Capital Improvement Program 2018-2022
Year Title Projected Total CIP # Phase
0 GOLDFISH FARM ROAD URBAN UPGRADE (L52) $4,444,0002119
0 ELLINGSON ROAD URBAN UPGRADE (L53) $5,847,0002120
0 LOCHNER ROAD URBAN UPGRADE (L54) $5,756,0002121
0 THREE LAKES ROAD URBAN UPGRADE (L55) $4,856,0002122
0 US 20 - EAST OF I-5 URBAN UPGRADE (L56) $2,068,0002123
0 OAK STREET URBAN UPGRADE (L58) $2,445,0002125
0 WATER AVENUE URBAN UPGRADE (L59) $4,070,0002126
0 US 20 SUPERELEVATION AND WIDENING (L60) $3,122,0002127
0 THREE LAKES ROAD URBAN UPGRADE (L61) $1,879,0002128
$189,822,000Total for Unfunded Link Projects:
Miscellaneous - Transportation
CIP # Phase Year Title Projected Total
0 QUIET ZONE AT RAIL CROSSINGS $15,000,0002343
$15,000,000Total for Unfunded Miscellaneous - Transportation:
Multi-Use Path Projects
CIP # Phase Year Title Projected Total
0 QUEEN/GEARY PERIWINKLE PATH CROSSING IMPROVEMENT (M1) $46,0002129
0 OAK CREEK TRAIL (M2) $2,645,0002130
0 WEST TIMBER-LINN TRAIL (M3) $161,0002131
0 SOUTH WATERFRONT TRAIL (M4) $76,0002132
0 ALBANY-CORVALLIS MULTIUSE PATH (M5) $435,0002133
0 ALBANY-CORVALLIS MULTIUSE PATH (M6) $761,0002134
0 EAST TIMBER-LINN TRAIL (M7) $277,0002135
0 BAIN STREET/WAVERLY LAKE TRAIL (M8) $153,0002136
0 LEBANON TRAIL (M9) $581,0002137
0 PERIWINKLE TRAIL EXTENSION (M10) $1,528,0002138
0 EAST ALBANY WILLAMETTE RIVER BRIDGE (M11) $7,657,0002139
0 99E/OAK CREEK CROSSING IMPROVEMENT (M12) $129,0002140
0 US 20/99E UNDERCROSSING (M13) $1,500,0002141
$15,949,000Total for Unfunded Multi-Use Path Projects:
Pedestrian & Bikeway
CIP # Phase Year Title Projected Total
0 TAKENA STREET BIKE BOULEVARD $65,0001993
$65,000Total for Unfunded Pedestrian & Bikeway:
Pedestrian Projects
CIP # Phase Year Title Projected Total
0 SPRINGHILL DRIVE SIDEWALK (P1) $542,0002142
0 99E/24TH AVENUE CROSSING IMPROVEMENT (P2) $129,0002143
0 OR 99E: BURKHART TO WAVERLY CROSSING IMPROVEMENT (P3) $129,0002144
0 FERRY STREET SIDEWALK (P4) $725,0002145
453

Capital Improvement Program 2018-2022
Year Title Projected Total CIP # Phase
0 COLUMBUS STREET SIDEWALK (P5) $277,0002146
0 GEARY STREET SIDEWALK (P6) $791,0002147
0 AIRPORT ROAD SIDEWALK (P7) $485,0002148
0 KILLDEER AVENUE SIDEWALK (P8) $174,0002149
0 WAVERLY DRIVE SIDEWALK (P9) $88,0002150
0 SANTIAM-ALBANY CANAL PEDESTRIAN ESPLANADE (P10) $1,232,0002151
0 THURSTON STREET CANAL PEDESTRIAN ESPLANADE (P11) $1,863,0002152
0 GIBSON HILL ROAD SIDEWALK (P12) $220,0002153
0 KNOX BUTTE ROAD PEDESTRIAN IMPROVEMENT $70,0002208
$6,725,000Total for Unfunded Pedestrian Projects:
Street Reconstruction/Improvements
CIP # Phase Year Title Projected Total
0 BROADWAY STREET OVERLAY: 9TH AVENUE TO QUEEN AVENUE $291,0002182
0 FERRY STREET REPAIR AND OVERLAY: QUEEN AVENUE TO 34TH AVENUE
$521,0002183
0 WAVERLY DRIVE OVERLAY: SANTIAM HIGHWAY TO QUEEN AVENUE $303,0002184
0 24TH AVENUE REHABILITATION – LIBERTY STREET TO PACIFIC BOULEVARD
$467,0002227
0 THURSTON STREET REHABILITATION – QUEEN AVENUE TO SOUTH OF 19TH AVENUE
$579,0002230
0 38TH AVENUE REHABILITATION – 35TH AVENUE TO THURSTON STREET
$327,0002232
0 2ND AVENUE OVERLAY: ELLSWORTH STREET TO MAIN STREET $275,0002234
0 QUEEN AVENUE OVERLAY: BROADWAY STREET TO PACIFIC BOULEVARD
$263,0002235
0 34TH AVENUE OVERLAY: PACIFIC BOULEVARD TO LYON STREET $351,0002236
0 HICKORY STREET OVERLAY: NORTH ALBANY ROAD TO SPRINGHILL DRIVE
$175,0002237
0 TIMBER STREET OVERLAY: KNOX BUTTE ROAD TO DOGWOOD AVENUE
$158,0002238
0 DOGWOOD AVENUE OVERLAY: PRICE ROAD TO GOLDFISH FARM ROAD
$164,0002239
0 GEARY STREET OVERLAY: 24TH AVENUE TO 34TH AVENUE $280,0002240
0 1ST AVENUE OVERLAY: LYON STREET TO MAIN STREET $275,0002241
0 QUEEN AVENUE OVERLAY: SHERMAN STREET TO WAVERLY DRIVE $409,0002242
0 GEARY STREET OVERLAY: 17TH AVENUE TO 24TH AVENUE $292,0002243
0 PRICE ROAD OVERLAY: DOGWOOD AVENUE TO BLUE OX RV PARK $205,0002244
0 LOCHNER ROAD OVERLAY: OREGON YOUTH AUTHORITY FRONTAGE $129,0002245
0 GRAND PRAIRIE ROAD OVERLAY: GEARY STREET TO WAVERLY DRIVE
$292,0002246
0 QUEEN AVENUE OVERLAY: MARION STREET TO SHERMAN STREET $292,0002247
0 21ST AVENUE OVERLAY: WAVERLY DRIVE TO LEXINGTON STREET $117,0002249
0 LEXINGTON STREET OVERLAY: 21ST AVENUE TO GRAND PRAIRIE ROAD
$234,0002250
0 53RD AVENUE OVERLAY: CHINOOK DRIVE TO ELK RUN DRIVE $117,0002251
0 CHINOOK DRIVE OVERLAY: COUGAR DRIVE TO 53RD AVENUE $129,0002252
0 14TH AVENUE OVERLAY: SHORTRIDGE STREET TO END OF CONCRETE
$35,0002253
0 ELM STREET OVERLAY: 5TH AVENUE TO 24TH AVENUE $467,0002254
0 SANTIAM ROAD OVERLAY: MAIN STREET TO CLEVELAND STREET $152,0002255
0 MARION STREET OVERLAY: 24TH AVENUE TO 34TH AVENUE $193,0002256
454

Capital Improvement Program 2018-2022
Year Title Projected Total CIP # Phase
0 34TH AVENUE OVERLAY: LYON STREET TO WAVERLY DRIVE $614,0002257
0 NORTH ALBANY ROAD OVERLAY: PORTLAND & WESTERN RAILROAD TO U.S. HIGHWAY 20
$175,0002258
0 KILLDEER AVENUE OVERLAY: PACIFIC BOULEVARD TO AIRPORT ROAD
$158,0002259
0 5TH AVENUE OVERLAY: ELM STREET TO WASHINGTON STREET $129,0002260
0 GEARY/14TH/CLAY OVERLAYS $643,0002261
0 CLOVER RIDGE ROAD OVERLAY: KNOX BUTTE ROAD TO TRUAX CREEK BRIDGE
$240,0002262
0 53RD AVENUE OVERLAY: PACIFIC BOULEVARD TO ELK RUN DRIVE $158,0002263
0 NORTH ALBANY ROAD OVERLAY: GIBSON HILL ROAD TO WEST OF GALE STREET
$280,0002264
0 HILL STREET OVERLAY: 9TH AVENUE TO QUEEN AVENUE $275,0002265
0 GOLDFISH FARM ROAD OVERLAY: U.S. HIGHWAY 20 TO CREEL AVE $175,0002266
0 SOMERSET DRIVE OVERLAY: TIMBER RIDGE STREET TO KNOX BUTTE ROAD
$158,0002268
0 MARION STREET OVERLAY: 34TH AVENUE TO ALBANY & EASTERN RAILROAD TRACKS
$88,0002269
0 GOLDFISH FARM ROAD OVERLAY: KNOX BUTTE ROAD TO DOGWOOD AVENUE
$152,0002270
0 WAVERLY DRIVE OVERLAY: GRAND PRAIRIE ROAD TO 36TH AVENUE $263,0002271
0 GRAND PRAIRIE ROAD OVERLAY: WAVERLY DRIVE TO EAST OF LEXINGTON STREET
$199,0002272
0 SALEM AVENUE OVERLAY: SHERMAN STREET TO UNION PACIFIC RAILROAD
$187,0002273
0 GEARY STREET OVERLAY: FRONT AVENUE TO 6TH AVENUE $146,0002274
0 LIBERTY STREET OVERLAY: QUEEN AVENUE 24TH AVENUE $187,0002275
0 WAVERLY DRIVE OVERLAY: PACIFIC BOULEVARD TO SANTIAM HIGHWAY
$175,0002276
0 WAVERLY DRIVE OVERLAY: QUEEN AVENUE TO GRAND PRAIRIE ROAD
$269,0002277
0 DEL RIO AVENUE OVERLAY: COLUMBUS STREET TO WAVERLY DRIVE $88,0002278
0 TIMBER RIDGE STREET OVERLAY: SOMERSET DRIVE TO KNOX BUTTE ROAD
$234,0002279
$12,485,000Total for Unfunded Street Reconstruction/Improvements:
Study Projects
CIP # Phase Year Title Projected Total
0 ADA ACCESSIBILITY AUDIT (S1) $25,0002154
0 HIGHWAY 20 CORRIDOR AND DOWNTOWN REFINEMENT PLAN (S2) $250,0002155
0 SAFETY AUDIT (S3) $30,0002156
0 ALBANY TSP MPO UPDATE (S6) $350,0002157
0 WAYFINDING (S8) $25,0002158
0 INTERSTATE 5/OR 99E/KNOX BUTTE REFINEMENT PLAN (S9) $100,0002159
0 INTERSTATE 5/US 20 (SANTIAM) REFINEMENT PLAN (S10) $100,0002160
$880,000Total for Unfunded Study Projects:
Transit Projects
CIP # Phase Year Title Projected Total
0 PURCHASE OF BUS MAINTENANCE FACILITY PROPERTY $750,0002174
0 DESIGN AND CONSTRUCTION OF BUS MAINTENANCE FACILITY $500,0002175
455
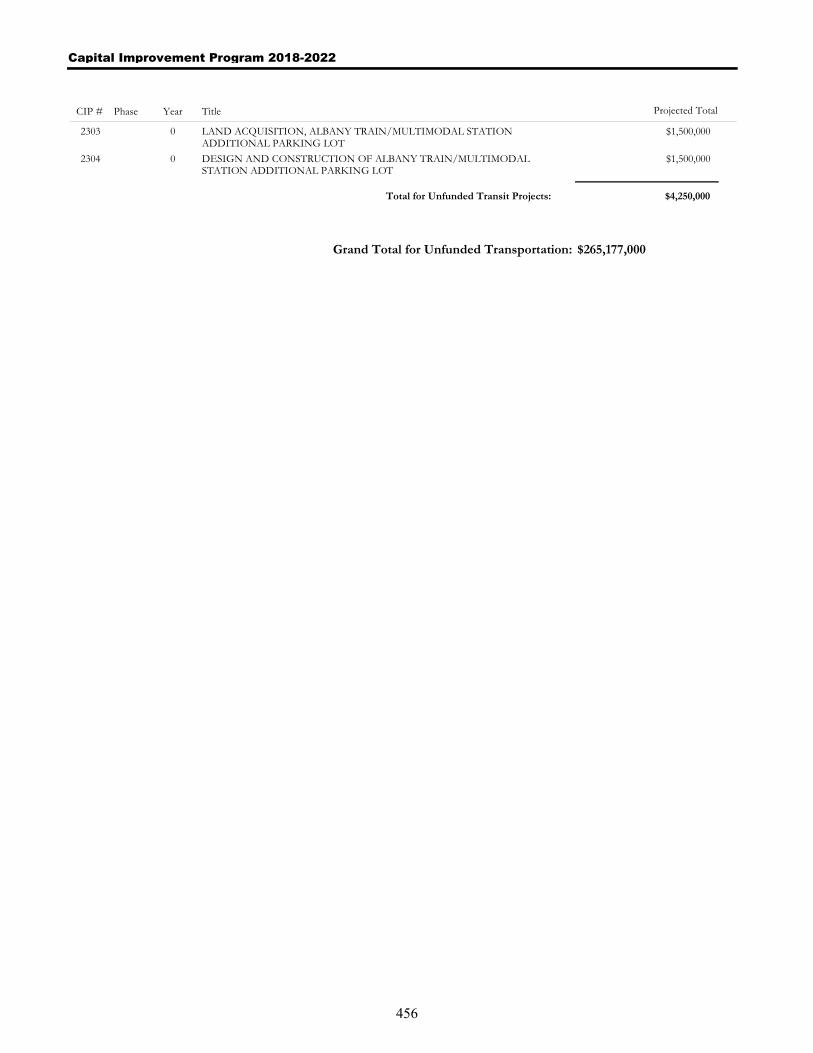
Capital Improvement Program 2018-2022
Year Title Projected Total CIP # Phase
0 LAND ACQUISITION, ALBANY TRAIN/MULTIMODAL STATION ADDITIONAL PARKING LOT
$1,500,0002303
0 DESIGN AND CONSTRUCTION OF ALBANY TRAIN/MULTIMODAL STATION ADDITIONAL PARKING LOT
$1,500,0002304
$4,250,000Total for Unfunded Transit Projects:
$265,177,000Grand Total for Unfunded Transportation:
456
Wastewater
Catching Up on Deferred Maintenance
Replacement Needs Prominent
he City’s wastewater system consists of a collection system that is made up of 194 miles of gravity
flow pipes, 7.2 miles of pressure pipes, 4,231 manholes, 11 sewer lift stations, the Water
Reclamation Facility, and Talking Water Gardens wetlands.
In 2012, City staff initiated an extensive condition assessment of the City’s wastewater system in order to
invest in collection system infrastructure in a prioritized and efficient manner. Of the City’s 194 miles of
gravity sewer pipes, approximately 20 miles are anticipated to require replacement or major repair within
the next 10 years, or risk complete failures with interruption of service and potential overflows into
basements. City staff will continue to reassess collection system infrastructure in order to identify and
prioritize the perpetual life replacement of the infrastructure.
The Albany City Council has set five-year planning goals for funding perpetual life replacement to avoid
wastewater main failures and disruption of sewer service to Albany citizens. This strategy requires a
commitment to seeking additional revenues in the coming years. The City Council will be evaluating
revenues, expenditures, system needs, and the state of the local economy annually to determine what
future revenue resource increases are appropriate. If wastewater rates are not raised according to the five-
year plan, it will not be possible to complete many of the projects listed in the five-year life of the
wastewater portion of the CIP and future CIPs will reflect these changes.
The wastewater projects identified in this year’s five-year window are consistent with Council’s direction
and represent the minimum necessary to begin restoring the condition of the collection system with the
goal of continued provision of uninterrupted service to the Albany community. Restoration of the
collection system helps reduce infiltration of groundwater and inflow of stormwater into the collection
system which can impact capacity requirements within the system and require additional capital
improvements for transportation and treatment of sewer flows.
Evaluating System Capacity Requirements
The City of Albany conducted a system-wide capacity analysis of the wastewater
collection system in 2015. The evaluation identified a number of locations
throughout town that are capacity limited and in need of eventual
replacement/expansion. A handful of the identified locations are significantly
limited and result in rainfall induced overflows that are not permitted under the
City’s discharge permit with DEQ. The cost to immediately address all of these
deficiencies far exceeds the City’s financial capabilities. Consequently, Council
prioritized improvements based on risks and established a funding strategy to
systematically construct improvements over time. However, the funding strategy will
not support the largest required improvement, the Riverfront Interceptor Lift Station and Force Main
Project, which remains unfunded at over $11 million. Efforts continue to identify a funding source for
this important project.
T
457

Funding Summary
The following table shows the total value of projects scheduled in each of the five years of this CIP,
broken down by the source of the funding. The costs shown are the projected total project costs in the
year the project is proposed.
Each year the estimated cost of the projects is adjusted to current year costs by applying the change in the
Engineering News-Record (ENR) construction cost index for Seattle. An annual three percent inflation
factor is added to estimate future year costs.
Projected Cost Totals
FUNDING SOURCE 2018 2019 2020 2021 2022 TOTAL
SDC – Improvement – Sewer $155,800 $617,000 $0 $0 $0 $772,800
Sewer Rates/Operating Revenues $2,837,200 $2,602,000 $2,155,000 $5,356,000 $2,155,000 $15,105,200
GRAND TOTALS: $2,993,000 $3,219,000 $2,155,000 $5,356,000 $2,155,000 $15,878,000
458

Capital Improvement Program 2018-2022
The following projects have been identified for inclusion in this five-year Capital Improvement Program.
Each project shown below is explained in detail on the pages that follow. Projects are listed in the fiscal year order they are planned to occur, and in CIP ID# order within a given fiscal year set.
Funded Projects Summary & Detail
Title Projected Total CIP # Phase
Plan Year: 2017 - 2018
LATERAL REPLACEMENT & BASEMENT PROTECTION $275,0002212
2018 COLLECTION SYSTEM REHABILITATION PROJECTS $1,250,0002215
HILL STREET SEWER IMPROVEMENTS $665,0002373
SANTA MARIA SEWER EXTENSION $803,0002377
$2,993,000Total for FY 2017 - 2018
Plan Year: 2018 - 2019
LATERAL REPLACEMENT & BASEMENT PROTECTION $275,0002292
2019 COLLECTION SYSTEM REHABILITATION PROJECTS $1,400,0002295
COX CREEK INTERCEPTOR PROJECTS - P10B $1,544,0002331
$3,219,000Total for FY 2018 - 2019
Plan Year: 2019 - 2020
LATERAL REPLACEMENT & BASEMENT PROTECTION $275,0002309
2020 COLLECTION SYSTEM REHABILITATION PROJECTS $1,880,0002312
$2,155,000Total for FY 2019 - 2020
Plan Year: 2020 - 2021
LATERAL REPLACEMENT & BASEMENT PROTECTION $275,0002327
2021 COLLECTION SYSTEM REHABILITATION PROJECTS $1,775,0002328
FERRY STREET INTERCEPTOR PROJECT - P15 $3,306,0002341
$5,356,000Total for FY 2020 - 2021
Plan Year: 2021 - 2022
LATERAL REPLACEMENT & BASEMENT PROTECTION $275,0002375
2022 COLLECTION SYSTEM REHABILITATION PROJECTS $1,880,0002376
$2,155,000Total for FY 2021 - 2022
$15,878,000Grand Total for Wastewater:
459

Capital Improvement Program 2018-2022
During FY 1999-2000, the City Council adopted three new programs to assist property owners with sanitary sewer lateral service issues.
The Basement Flooding Protection Loan Program provides a no-interest, ten-year loan to assist property owners with installation of backflow protection valves and sump pumps needed to protect buildings from flooding due to the sanitary sewer system.
The Council also adopted a Basement Flooding Protection Grant Program that provides limited City participation in the cost of basement flooding protection improvements. The grant program is targeted for properties that have experienced frequent flooding, have responded with good faith efforts to minimize the flooding risk, and in spite of these efforts, continue to experience basement flooding.
The lateral replacement program provides a one-time-only replacement of qualifying sanitary sewer service laterals on private property. Replacement of these laterals reduces the amount of infiltration entering the sanitary sewer system through cracks and breaks in older, deteriorated service lines.
Operating Budget Impact: This project will reduce sewer maintenance costs over the long term by reducing the amount of extraneous flow into the sanitary sewer system that is receiving treatment.
Plan FY: 2017-2018 LATERAL REPLACEMENT & BASEMENT PROTECTION
$275,000Total Cost:
Funding SourceActivity Projected Amount
Master Plan: Plan Element:
Category: Wastewater Classification: Miscellaneous - Wastewater
Department: Public Works Department
CIP Project #: 2212
Funding Sources For This Project:
SEWER RATES/OPERATING REVENUES $275,000601-50-2500
$275,000Total:
460

Capital Improvement Program 2018-2022
Plan FY: 2017-2018 2018 COLLECTION SYSTEM REHABILITATION PROJECTS
$1,250,000Total Cost:
Funding SourceActivity Projected Amount
Master Plan: Plan Element:
Category: Wastewater Classification: Sewer Mains
Department: Public Works Department
For this fiscal year approximately 6,900 feet of sewer mains are proposed for rehabilitation with Cured-in-place Pipe (CIPP) or Pipe Bursting. CIPP and pipe bursting are effective and cost-efficient ways to rehabilitate existing sewer mains that are at the end of their service. Both are forms of "trenchless technology," which means costly excavations and surface restorations are minimized. The following pipes have been prioritized based on the City's system-wide condition assessment: ID's for the subject lines are 5595, 5621, 5636, 5970, 5880, 6270, 6290, 5856, 5603, 5917, 5580, 6335, 5645, 6001, 6185, 7278, 117283, 152261, 5772, 6676, 7171, 5854, 7273, 5677, 5679. A larger map can be found at the end of the CIP document.
Operating Budget Impact: This project will reduce long-term operations and maintenance costs through reduction in emergency responses and reduction in infiltrating groundwater that must be pumped and treated.
CIP Project #: 2215
Funding Sources For This Project:
SEWER RATES/OPERATING REVENUES $1,250,000601-50-2500
$1,250,000Total:
461

Capital Improvement Program 2018-2022
Plan FY: 2017-2018 HILL STREET SEWER IMPROVEMENTS
$665,000Total Cost:
Funding SourceActivity Projected Amount
Master Plan: Plan Element:
Category: Wastewater Classification: Sewer Mains
Department: Public Works Department
This project will use Cured-in-place Pipe (CIPP) to rehabilitate approximately 200 feet of 8-inch, 240 feet of 10-inch, and 2,400 feet of 12-inch sewer lines. CIPP is a "trenchless technology" providing an effective and cost-efficient way to rehabilitate existing sewer mains that are at the end of their service. Street Improvements as shown in CIP 1002 in the Transportation section of the CIP will also be coordinated with this project.
Operating Budget Impact: This project will reduce long-term operations and maintenance costs through reduction in emergency responses and reduction in infiltrating groundwater that must be pumped and treated.
CIP Project #: 2373
Funding Sources For This Project:
SEWER RATES/OPERATING REVENUES $665,000601-50-2500
$665,000Total:
462

Capital Improvement Program 2018-2022
Plan FY: 2017-2018 SANTA MARIA SEWER EXTENSION
$803,000Total Cost:SDC
Funding SourceActivity Projected Amount
Master Plan: Plan Element:
Category: Wastewater Classification: Sewer Mains
Department: Public Works Department
This project includes construction of approximately 1,100 feet of new 18-inch sewer line. Currently there are no sewer lines on this undeveloped property located east of Timber Ridge Street. This project is being completed in partnership with Greater Albany Public Schools to facilitate construction of a new elementary school and provide connectivity to existing development. Extension of this sewer line will allow the Charlotte Lift Station and force main to be decommissioned. Street improvements as shown in CIP 2124 in the Transportation section of the CIP and water improvements as shown in CIP 2371 in the Water section of the CIP will also be coordinated with this project.
Operating Budget Impact: Construction of these improvements will allow for decommissioning an existing lift station, thus reducing maintenance costs.
CIP Project #: 2377
Funding Sources For This Project:
SEWER RATES/OPERATING REVENUES $647,200601-50-2500
SDC - IMPROVEMENT - SEWER $155,800601-50-2502
$803,000Total:
463


Capital Improvement Program 2018-2022
The following projects have been identified as needed repairs and/or improvements to the City's infrastructure. In most cases, these projects are the result of a master plan process, which attempts to systematically look at the needs for public infrastructure over the next 10 to 20 years. These projects are considered "Unfunded" because either a source of funding has not been made available, or they will not be implemented within the five-year window this plan covers.
Unfunded Projects
Interceptors/Collectors
CIP # Phase Year Title Projected Total
0 KNOX BUTTE ROAD COLLECTOR: UPSIZE LINE FROM CENTURY DRIVE LIFT STATION UPSTREAM TO ONYX STREET
$2,768,0001251
0 47TH AVENUE COLLECTOR: UPSIZE LINE FROM COLUMBUS STREET UPSTREAM TO END OF GRAVITY LINE
$1,046,0001253
0 FERRY STREET AND 28TH AVENUE $1,941,0001724
0 COX CREEK INTERCEPTOR $6,373,0001770
0 RIVERFRONT INTERCEPTOR $12,005,0001771
0 HILL STREET COLLECTOR: UPSIZE LINE FROM 7TH AVENUE TO 13TH AVENUE
$1,800,0002345
0 MARION STREET COLLECTORS $216,0002346
0 COLUMBUS STREET EXTENSION $1,720,0002348
0 SOMERSET DRIVE COLLECTORS $1,439,0002349
0 THREE LAKES ROAD COLLECTORS $4,584,0002351
0 HIGHWAY 20 COLLECTORS $2,964,0002353
0 KNOX BUTTE ROAD COLLECTORS $3,420,0002356
0 SPRINGHILL DRIVE COLLECTORS $3,322,0002359
0 WEST THORNTON LAKE COLLECTORS $1,843,0002362
0 COLUMBUS STREET COLLECTORS $412,0002364
0 CENTURY DRIVE - DRAPERVILLE COLLECTORS $10,830,0002366
$56,683,000Total for Unfunded Interceptors/Collectors:
Lift Stations
CIP # Phase Year Title Projected Total
0 NEW LIFT STATIONS: THORNTON LAKE, AND SPRING HILL DRIVE $885,0001255
0 NORTH ALBANY LIFT STATION $2,500,0002344
0 MARION STREET LIFT STATION IMPROVEMENTS $1,000,0002347
0 THREE LAKES ROAD LIFT STATION IMPROVEMENTS $850,0002352
0 HIGHWAY 20 LIFT STATION IMPROVEMENTS $850,0002354
0 KNOX BUTTE ROAD LIFT STATION IMPROVEMENTS $850,0002357
0 BURKHART CREEK LIFT STATION IMPROVEMENTS $850,0002358
0 SPRINGHILL DRIVE LIFT STATION IMPROVEMENTS $850,0002360
0 QUARRY ROAD LIFT STATION IMPROVEMENTS $850,0002361
0 WEST THORNTON LAKE LIFT STATION IMPROVEMENTS $850,0002363
0 COLUMBUS STREET LIFT STATION IMPROVEMENTS $105,0002365
0 CENTURY DRIVE LIFT STATION IMPROVEMENTS $1,650,0002367
$12,090,000Total for Unfunded Lift Stations:
464

Capital Improvement Program 2018-2022
Year Title Projected Total CIP # Phase
Sewer Mains
CIP # Phase Year Title Projected Total
0 ANNUAL COLLECTION SYSTEM REHABILITATION PROJECTS ($/YR) $2,600,0002340
0 MARION STREET SEWER MAIN EXTENSION $1,204,0002350
0 TIMBER LINN SEWER MAINS $3,261,0002355
$7,065,000Total for Unfunded Sewer Mains:
Talking Water Gardens
CIP # Phase Year Title Projected Total
0 TALKING WATER GARDENS: COMPLETE ENTRANCE/PARKING LOT LANDSCAPING
$130,0002190
0 TALKING WATER GARDENS: COMPLETE BRIDGE IMPROVEMENTS AND LANDSCAPING
$125,0002191
0 TALKING WATER GARDENS: REROUTE OVERHEAD POWER LINES $400,0002192
0 TALKING WATER GARDENS: ENTRANCE ROAD IMPROVEMENTS $700,0002193
$1,355,000Total for Unfunded Talking Water Gardens:
$77,193,000Grand Total for Unfunded Wastewater:
465

Water
Water Sustains All
Looking to the Future
s a result of the City’s partnership with the City of Millersburg,
investments in transmission main capacity, and targeting replacement
of leaky steel water lines, Albany water customers enjoy the security
of two safe reliable sources of drinking water, a distribution system with
capacity ready to serve growth, and stable operation and maintenance expenses.
These benefits are not shared by all other Oregon communities.
The City’s water system consists of a robust network of pipes, reservoirs, and pump stations. In all, the
water system is made up of 263 miles of pipes, seven pump stations, seven reservoirs, 18,899 service
lines, 1,820 hydrants, 7,233 valves, an 18-mile canal, and two water treatment plants.
In reviewing this year’s CIP document, it is evident that water system investments in the coming years are
primarily driven by perpetual life replacement needs. These projects are critical for realizing the full
benefits of past investments in our water system, meeting regulatory requirements, and providing safe and
reliable water service to our customers. The Albany City Council recognizes the importance of
maintaining our system and has provided direction regarding five-year planning goals for perpetual life
replacement. Meeting those goals requires a commitment to seeking additional revenues. The City
Council evaluates revenues, expenditures, system needs, and the state of the local economy annually to
determine what revenue increases are appropriate. If water rates are not raised according to the five-year
plan, it will not be possible to complete many of the projects listed in the five-year life of the water
portion of the CIP and future CIPs will reflect these changes.
The water system projects identified in this year’s five-year CIP are consistent with Council’s direction
and represent the minimum necessary for continued consistent quality water services and to support
economic development in the City.
Funding Summaries
The following table shows the total value of projects scheduled in each of the five years of this CIP,
broken down by the source of the funding. The costs shown are the projected total project costs in the
year the project is proposed.
Each year the estimated cost of the projects is adjusted to current year costs by applying the change in the
Engineering News-Record (ENR) construction cost index for Seattle. An annual three percent inflation
factor is added to estimate future year costs.
A
466

Projected Cost Totals
FUNDING SOURCE 2018 2019 2020 2021 2022 TOTAL
SDC – Improvement – Water $113,600 $1,205,000 $0 $0 $0 $1,318,600
Water Rates/Operating Revenues $2,998,100 $2,580,000 $2,348,000 $1,399,000 $2,596,000 $11,921,100
GRAND TOTALS: $3,111,700 $3,785,000 $2,348,000 $1,399,000 $2,596,000 $13,239,700
467

Capital Improvement Program 2018-2022
The following projects have been identified for inclusion in this five-year Capital Improvement Program.
Each project shown below is explained in detail on the pages that follow. Projects are listed in the fiscal year order they are planned to occur, and in CIP ID# order within a given fiscal year set.
Funded Projects Summary & Detail
Title Projected Total CIP # Phase
Plan Year: 2017 - 2018
LAFAYETTE, CLOVERDALE, PEACH TREE, CHERRY AND FAIRWAY AREA $1,300,0001606
PINE MEADOWS WATERLINE REPLACEMENT $940,0002290
VINE STREET WTP ACCELATOR IMPROVEMENTS $542,0002319
SANTA MARIA WATER LINE $329,7002371
$3,111,700Total for FY 2017 - 2018
Plan Year: 2018 - 2019
HILL STREET: 24TH AVENUE TO 34TH AVENUE $1,854,0001002 2
LINCOLN STREET, 12TH AVENUE TO 15TH AVENUE $387,0001596
18TH AVENUE: WAVERLY DRIVE TO WEST END $136,0002220
BELMONT AVENUE AREA WATER LINE REPLACEMENTS $1,008,0002221
ALBANY-MILLERSBURG WATER TREATMENT PLANT INTAKE GENERATOR $400,0002372
$3,785,000Total for FY 2018 - 2019
Plan Year: 2019 - 2020
WASHINGTON AND FERRY STREETS AREA; 9TH TO 14TH $1,097,0001594
DAVIDSON WATER LINE - 14TH AVENUE TO 16TH AVENUE $199,0002301
CANAL DREDGING - VINE STREET WTP TO 22ND AVENUE $530,0002336
SANTIAM-ALBANY CANAL BANK REPAIR: 5TH AVENUE TO 6TH AVENUE $522,0002342
$2,348,000Total for FY 2019 - 2020
Plan Year: 2020 - 2021
6TH AVENUE, ELM TO MAPLE AND WALNUT STREET, 6TH TO 7TH $208,0001587
24TH AVENUE WATER LINE, HILL TO GEARY STREET $699,0002003
WILLAMETTE AREA WATER LINE $492,0002222
$1,399,000Total for FY 2020 - 2021
Plan Year: 2021 - 2022
JEFFERSON STREET WATERLINE REPLACEMENT $345,0002188
ERMINE AREA WATER LINE - 22ND TO 27TH AVENUES & CLAY COURT TO WAVERLY DRIVE
$2,251,0002302
$2,596,000Total for FY 2021 - 2022
$13,239,700Grand Total for Water:
468

Capital Improvement Program 2018-2022
Plan FY: 2017-2018 LAFAYETTE, CLOVERDALE, PEACH TREE, CHERRY AND FAIRWAY AREA
$1,300,000Total Cost:
Funding SourceActivity Projected Amount
Master Plan: Water Supply Master Plan Plan Element: Program - 1
Category: Water Classification: Water Mains
Department: Public Works Department
This project will replace approximately 5,385 feet of deteriorated and undersized 2- and 4-inch steel water pipes with 8-inch ductile iron pipe. This project will increase fire flows in the general area.
Replacement locations include: Lafayette Street and Lafayette Place; Cloverdale, 13th to Putter Place; Peach Tree Lane, end of 6-inch main to dead end to the east; Cherry Lane, end of 6-inch main to dead end to the east; and Fairway, end of the 8-inch line to the dead end to the east.
Operating Budget Impact: This project will reduce maintenance costs over the long term. Replacement of these water mains will reduce the amount of water loss from the system and the number of emergency responses required to fix leaks.
CIP Project #: 1606
Funding Sources For This Project:
WATER RATES/OPERATING REVENUES $1,300,000615-50-2308
$1,300,000Total:
469

Capital Improvement Program 2018-2022
Plan FY: 2017-2018 PINE MEADOWS WATERLINE REPLACEMENT
$940,000Total Cost:
Funding SourceActivity Projected Amount
Master Plan: Plan Element:
Category: Water Classification: Water Mains
Department: Public Works Department
This project will replace approximately 4,000 feet of 8-inch asbestos cement water lines with new 8-inch ductile iron water lines. The existing pipes are deteriorated, requiring frequent maintenance, and have exceeded their service life.
Operating Budget Impact: This project will reduce maintenance costs over the long term by avoiding costs associated with large scale pipe failures common to asbestos cement water mains that have exceeded their service life.
CIP Project #: 2290
Funding Sources For This Project:
WATER RATES/OPERATING REVENUES $940,000615-50-2308
$940,000Total:
470

Capital Improvement Program 2018-2022
Plan FY: 2017-2018 VINE STREET WTP ACCELATOR IMPROVEMENTS
$542,000Total Cost:
Funding SourceActivity Projected Amount
Master Plan: Plan Element:
Category: Water Classification: Miscellaneous - Water
Department: Public Works Department
Accelator© is the trade name for the make and model of the solids contact clarifier which promotes settling of solids fromthe raw water in the treatment process. Accelator 2 is constructed of steel plates and while the turbine and other components are in generally good condition, the tube settlers have experienced significant wear and tear. This project will replace the existing tube settlers, clean and recoat the steel plate surfaces, and provide for a fiberglass grating over the top of the tubes to block sunlight and support foot traffic during inspections and washing activities. Accelator 1 is a concrete structure providing the same function as Accelator 2. Its tube settlers were replaced in 1998 and should be serviceable for many more years. A fiberglass cover will be installed to protect the settling tubes in Accelator 1 and the concrete surfaces in both the launder and the steel bridge will be cleaned and recoated.
Operating Budget Impact: This project will reduce maintenance costs in the long term by completing improvements to the Vine Street Water Treatment Plant.
CIP Project #: 2319
Funding Sources For This Project:
WATER RATES/OPERATING REVENUES $542,000615-50-2308
$542,000Total:
471

Capital Improvement Program 2018-2022
Plan FY: 2017-2018 SANTA MARIA WATER LINE
$329,700Total Cost:SDC
Funding SourceActivity Projected Amount
Master Plan: Plan Element:
Category: Water Classification: Water Mains
Department: Public Works Department
This project includes construction of approximately 650 linear feet of new 24-inch ductile iron water line. Currently there are no water mains on this undeveloped property. This project is being completed in partnership with Greater Albany Public Schools to facilitate construction of a new elementary school and provide connectivity to existing development. Street improvements as shown in CIP 2124 in the Transportation section of the CIP and sewer improvements as shown in CIP 2377 in the wastewater section of the CIP will also be coordinated with this project.
Operating Budget Impact: This project will increase maintenance costs over the long term by adding additional water mains to the distribution system.
CIP Project #: 2371
Funding Sources For This Project:
SDC - IMPROVEMENT - WATER $113,600615-50-2300
WATER RATES/OPERATING REVENUES $216,100615-50-2308
$329,700Total:
472

Capital Improvement Program 2018-2022
The following projects have been identified as needed repairs and/or improvements to the City's infrastructure. In most cases, these projects are the result of a master plan process, which attempts to systematically look at the needs for public infrastructure over the next 10 to 20 years. These projects are considered "Unfunded" because either a source of funding has not been made available, or they will not be implemented within the five-year window this plan covers.
Unfunded Projects
Miscellaneous - Water
CIP # Phase Year Title Projected Total
0 SANTIAM-ALBANY CANAL BANK REPAIR: 4TH AVENUE TO 12TH AVENUE
$1,832,0002320
0 VINE STREET WATER TREATMENT PLANT CHECK VALVE IMPROVEMENTS
$120,0002338
$1,952,000Total for Unfunded Miscellaneous - Water:
New Construction - Water
CIP # Phase Year Title Projected Total
0 MARION STREET & 41ST AVENUE TO COLLEGE PARK DRIVE $305,0001311
0 CENTRAL ALBANY TRANSMISSION PROJECT $6,153,0001640
0 DEVELOPMENT DRIVEN TRANSMISSION/DISTRIBUTION PROJECTS $5,718,0001641
0 SOUTH NEBERGALL LOOP WATER LINE $298,0001862
0 THREE LAKES ROAD WATERLINE EXTENSION (21ST AVE TO 2,500 FEET SOUTH)
$713,0001866
$13,187,000Total for Unfunded New Construction - Water:
Water Mains
CIP # Phase Year Title Projected Total
0 HILL STREET: 34TH TO 38TH AVENUE $384,0001002 4
0 STEEL LINE REPLACEMENT PROGRAM $10,033,0001314
0 SPRINGHILL DRIVE OFF COUNTRYMAN CIRCLE $137,0001558
0 RIDGEVIEW LANE NW $123,0001559
0 KOUNS DRIVE AREA TO SCENIC DRIVE $953,0001560
0 RONDO STREET AREA, HIGHWAY 20 TO KOUNS DRIVE $1,268,0001561
0 COUNTRYMAN CIRCLE, WEST SIDE $759,0001562
0 SCENIC DRIVE NW, VALLEY VIEW DRIVE TO DEAD END NORTH OF PALESTINE AVENUE
$1,118,0001564
0 KNOLLWOOD DRIVE, SOUTH OF POWERS AVENUE NW $101,0001565
0 SOX LANE NW, SOUTH OF POWERS AVENUE $116,0001566
0 OAK GROVE DRIVE, NORTH OF POWERS AND ALONG PALESTINE DRIVE
$740,0001568
0 VINE STREET, 6TH TO 7TH $57,0001569
0 CALAPOOIA STREET BETWEEN 5TH AND 6TH AVENUES $58,0001570
0 THORNTON LAKE DRIVE NW, REPLACE SERVICE CONNECTION $21,0001571
0 PARK TERRACE NW, OFF GIBSON HILL ROAD $195,0001573
0 FRANKLIN AVENUE WATER LINE REPLACEMENT $127,0001578
0 FRONT AVENUE, MAIN TO SHERMAN $38,0001580
0 MONTGOMERY STREET, WATER AVENUE TO 1ST AVENUE $34,0001581
473

Capital Improvement Program 2018-2022
Year Title Projected Total CIP # Phase
0 PACIFIC BOULEVARD, WAVERLY DRIVE TO ALBANY AVENUE $511,0001583
0 SKYLINE DRIVE, GIBSON HILL ROAD TO ORCHARD HEIGHTS DRIVE $196,0001585
0 JEFFERSON, MONTGOMERY, JACKSON AND 6TH AVENUE AREA $658,0001592
0 BROADALBIN STREET: 1ST TO 2ND AVENUE AND 3RD TO 4TH AVENUE $117,0001608
0 UNDERSIZED PIPELINES WITH HYDRANTS REPLACEMENT PROGRAM $4,858,0001746
0 PERPETUAL LIFE REPLACEMENT PROGRAM $102,887,0001747
0 CENTURY DRIVE WATER SYSTEM $1,405,0001782
0 DRAPERVILLE WATER SYSTEM $963,0001783
0 CEDAR CIRCLE WATER LINE $39,0001974
0 PRAIRIE PLACE WATER LINE $58,0001975
0 15TH AVENUE WATER LINE $80,0001976
0 PARK TERRACE WATER LINE $123,0001977
0 LAUREL COURT WATER LINE $53,0001978
0 THURSTON STREET: QUEEN AVENUE TO 20TH AVENUE $129,0002218
$128,339,000Total for Unfunded Water Mains:
Water Supply & Storage
CIP # Phase Year Title Projected Total
0 KNOX BUTTE RESERVOIR PROJECT, PHASE 1 $8,426,0001300 1
0 KNOX BUTTE RESERVOIR PROJECT, PHASE 2 $4,899,0001300 2
0 INCREASE LEVEL 2 PUMP STATION CAPACITY $14,0001634
0 VINE STREET WTP IMPROVEMENTS, PHASE 1 $1,376,0001636 1
0 VINE STREET WTP PROJECTS, PHASE 2 $6,321,0001636 2
0 ELLINGSON ROAD RESERVOIR PROJECT $6,037,0001639 1
0 ELLINGSON ROAD RESERVOIR PROJECT $4,738,0001639 2
0 JOINT WATER PROJECT, PHASE 2 $5,459,0001644
0 SANTIAM-ALBANY CANAL IMPROVEMENTS $250,0001675 11
0 SANTIAM-ALBANY CANAL IMPROVEMENTS $250,0001675 12
0 SANTIAM-ALBANY CANAL IMPROVEMENTS $304,0001675 13
0 MAPLE STREET RESERVOIR IMPROVEMENTS $284,0001749 2
0 NORTH ALBANY DISTRIBUTION PROJECTS $28,0001751 3
$38,386,000Total for Unfunded Water Supply & Storage:
$181,864,000Grand Total for Unfunded Water:
474

APPENDIX


RESOLUTION NO. 6613
BE IT RESOLVED that the Albany City Council hereby adopts the approved 2017- 18 budget in the total sum of
189, 144,900 now on file at the Albany City Hall.
BE IT FURTHER RESOLVED that the amounts for the fiscal year beginning July 1, 2017 , and for the purposes
shown below are hereby appropriated as follows:
GENERAL FUND
Nondepartmental
Materials & Services
Municipal Court
Public Safety Levy: FireFire & Life Safety
Fire Emergency ServicesPolice
Public Safety Levy: Police
Planning
LibraryTransfers Out
Contingency
Total GENERAL FUND
SPECIAL REVENUE FUNDS
PARKS & RECREATION
Sports Services
Children/Youth/Family Rec Services
Resource Developement Marketing ServicesPark Maintenance Services
Parks & Recreation Administration
Aquatic Services
Adult Recreation Services
Performance and Cultural Arts
Park Facilities Repair & Construction
Park SDC Projects
Senior Center Foundation
Parks Capital Improvement Program
Transfers Out
Contingency
Total PARKS & RECREATION
GRANTS
Personnel
Materials & Services
Capital
Total GRANTS
326,500
770, 500
1, 315, 000
972, 100
13, 166, 100
14, 652,300
1, 356, 000
1, 057,200
2, 805, 700
882, 900
1, 604,800
38, 909, 100
308, 000
419, 500
359,000
1, 455, 600
1, 514,800
878, 800
618, 500
673, 500
744,800
1, 801, 900
70, 300
110, 000
290,400
200,000
9, 445, 100
173, 500
788, 100
733, 400
1, 695, 000
475

SPECIAL REVENUE FUNDS, continued
BUILDING
Building InspectionElectrical Permit Program
2, 639, 100
251, 700
Total BUILDING 2, 890,800
RISK MANAGEMENT
Risk Management Reserve 1, 099,200
PepsiCo Settlement Projects 1, 992,800
Total RISK MANAGEMENT 3, 092, 000
ECONOMIC DEVELOPMENT
6, 079, 200
Economic Development Activities 1, 042, 500
Albany Municipal Airport 315, 500
Municipal Airport Capital Projects 304, 300
Transfers Out 647,200
Total ECONOMIC DEVELOPMENT 2, 309, 500
PUBLIC TRANSIT
Albany Transit System 1, 505, 200
Linn -Benton Loop 1, 120, 800
Paratransit System 713, 700
Total PUBLIC TRANSIT 3, 339, 700
PUBLIC SAFETY LEVY
Transfers Out 3, 464,600
Total PUBLIC SAFETY LEVY 3, 464, 600
CAPITAL REPLACEMENT
Equipment Replacement 6, 079, 200
City Facilities Replacement 144, 300
GF Facilities Maintenance Projects 75, 300
IT Equipment Replacement 1, 490, 400
Facilities Replacement 648, 500
Total CAPITAL REPLACEMENT 8, 437,700
STREETS
Personnel 832, 800
Materials & Services 2, 367,700
Capital 9, 934, 700
Transfers Out 1, 027,000
Contingency 379, 100
Total STREETS 14, 541, 300
476

DEBT SERVICE FUNDS
DEBT SERVICE
2002 LTD Tax Pension Bonds 865, 800
2004 Revenue Obligations 180, 400
Total DEBT SERVICE 1, 046,200
GENERAL OBLIGATION DEBT SERVICE
2015 Public Safety Facilities Bonds 1, 179, 100
Total GENERAL OBLIGATION DEBT SERVICE 1, 179, 100
CAPITAL PROJECT FUND
CAPITAL PROJECTS
Albany Data Integration Project 500, 000
LID Construction Projects 2, 233, 700
Public Safety Facilities 12, 005, 000
Transfers Out 33, 300
Total CAPITAL PROJECTS 14, 772,000
PERMANENT FUNDS
SENIOR CENTER ENDOWMENT
Transfers Out $ 52, 400
Total SENIOR CENTER ENDOWMENT $ 52, 400
LIBRARY TRUST
V. O. Torney Trust $ 13, 600
Manela Trust 70, 700
Total LIBRARY TRUST $ 84, 300
ENTERPRISE FUNDS
SEWER
Personnel
Materials & Services
Capital
Transfers Out
Debt Service
Contingency
Total SEWER
2, 109, 000
6, 655, 800
19, 001, 700
2, 063, 500
9, 010,600
994,500
39, 835, 100
477

ENTERPRISE FUNDS. continued
WATER
303, 000
Personnel 2, 515, 400
Materials & Services 6, 023, 700
Capital 12, 461, 900
Transfers Out 1, 043, 700
Debt Service 3, 538,600
Contingency 955, 300
Total WATER 26, 538,600
STORMWATER
Personnel 303, 000
Materials & Services 1, 590,700
Capital 200, 400
Transfers Out 39, 700
Contingency 57, 300
Total STORMWATER 2, 191, 100
INTERNAL SERVICE FUNDS
CENTRAL SERVICES
Finance Department 1, 616,800
Council & Nondepartmental 205, 400
City Manager's Office 972,300
Information Technology Services 1, 671, 700
GIS Services 457, 400
Permit Tracking 120, 800
Human Resources 838, 900
Facilities Maintenance 789,000
Total CENTRAL SERVICES 6, 672, 300
PUBLIC WORKS CENTRAL SERVICES
PW Administration 1, 184, 100
Engineering Services 2, 945, 600
Operations Admin 566, 100
Water Quality Control Service 523, 700
PW Customer Services 1, 391, 100
Facilities & Maintenance Engineering 2, 038,400
Total PUBLIC WORKS CENTRAL SERVICES 8, 649,000
478

BE IT FURTHER RESOLVED that the Albany City Council hereby imposes the taxes provided for in the adoptedbudget at a permanent rate of $6. 3984 per one thousand of assessed value, a local option rate of $1. 15 per one
thousand of assessed value, bonded debt service in the amount of $1, 110, 838, plus an adjustment for annexations,
and that these taxes are hereby levied upon all taxable property within said districts as of 1 a.m., July 1, 2017.
The following allocations and categorizations, subject to the limits of SECTION 1I113, Article XI, of the OregonConstitution, make the aggregate levy.
Gross tax levy
Public Safety Levy
Debt Service
Linn/Benton Sewer Certification
Passed by the Council:
Approved by the Mayor:
Subject
to the
General Excluded
Government from the
Limitation Limitation
6. 3984 per
1, 000 of
Assessed
Value
1. 15 per
1, 000 of
Assessed
Value
June 14, 2017
June 14, 2017
Effective Date: June 14, 2017
Mayor
ATTEST:
1, 110, 838
102, 000
479

CITY OF ALBANY
NOTICE OF BUDGET HEARING
The City of Albany will hold a PUBLIC HEARING on Wednesday, June 14, 2017, at 7: 15 p.m. inthe City Hall Council Chambers, 333 Broadalbin Street SW, Albany, for the purpose of discussingthe budget for the Fiscal Year beginning July 1, 2017, as approved by the City of Albany BudgetCommittee on May 11, 2017. The public is invited to present any written or oral testimony atthis time. Written testimony may be addressed to the Finance Director' s Office, 333 BroadalbinSW, Albany, OR 97321.
A copy of the Approved Budget document may be inspected between the hours of 8: 00 a.m. and5: 00 p.m. at City Hall, 333 Broadalbin Street SW, Albany.
A notice of the City of Albany Budget Committee Hearing is posted on the City' s website atwww. cityofalbany. net.
A summary of the budget is presented below. The budget includes $ 695, 600 from State RevenueSharing. The budget was prepared on a basis of accounting consistent with the basis of accountingused the preceding year. Major changes, if any and their affect on the budget are explained below.
FINANCIAL SUMMARY- RESOURCES
FINANCIAL SUMMARY- REQUIREMENTS BY OBJECT CLASSIFICATION
2015- 16 2016- 17 2017- 18
Actual Adopted Approved
Property taxes 25,929,999 26,988, 100 27,848,000
Othertaxes 5,941, 347 6, 105,200 6,376,400
Licenses & fees 4, 836,003 3, 668,200 3, 998,300
Intergovernmental resources 9,610,380 10, 526,900 11, 963, 400
Charges for service 48, 145,345 49,857,500 52, 148,600
Fines & forfeitures 718, 892 671, 500 636, 100
Assessment payments 527,492 55,900 85, 000
Other resources 21, 741, 586 916,900 1, 741, 500
Investment earnings 739,324 353, 800 354,400
Total Current Resources 118, 190,368 99, 144,000 105, 151, 700
Transfers in 13, 563,458 10,249,600 10, 046,800
Beginning balance 62,733, 592 78,250,700 72, 023, 800
Reserved beginning balance 1, 914,256 1, 911, 100 1, 843, 100
Beginning balance held in trust 83,485 79,500 79,500
Total Resources 196,485, 159 189,634,900 189, 144,900
FINANCIAL SUMMARY- REQUIREMENTS BY OBJECT CLASSIFICATION
2015- 16 2016- 17 2017- 18
Actual Adopted Approved
Personnel Services 45,432,741 50, 142, 800 51, 938,200
Materials and Services 33, 332,628 38, 574,200 40,044,200
Capital Projects 13, 573,225 72, 373, 300 68, 332,400
Transfers Out 11, 978,758 9, 989,700 9, 786,800
Debt Service 9,327, 187 14, 569,700 14, 772, 800
Contingencies 3, 853, 900 4, 191, 000
Unappropriated 131, 300 79, 500
Total Requirements 113, 644,539 189,634, 900 189, 144, 900
480

CITY OF ALBANY
NOTICE OF BUDGET HEARING
FINANCIAL SUMMARY - REQUIRIMENTS BY ORGANIZATIONAL UNIT
2015- 16 2016- 17 2017- 18
Actual Adopted Approved
10 - Finance 16,948,466 $ 45,442,700 $ 35, 054,200
FTE 14.375 14.375 15. 375
11 - City Manager's Office 2,418,381 2,627,600 2,867,400
FTE 11. 700 12.700 13. 700
13 - Information Technology 2, 770, 180 3,993, 300 3, 740,300
FTE 13. 000 13. 000 13. 000
14 - Human Resources 636, 126 844,600 838,900
FTE 4.000 4.000 5.000
25 - Fire 13, 518,034 14,491,200 15, 592,200
FTE 80.908 79.400 86.908
30 - Police 13, 475, 159 15,284,600 16, 174,500
FTE 89.875 92.250 98.250
35 - Parks & Recreation 7,093, 804 9,611, 100 10,286,500
FTE 30.275 31. 650 34.563
40- Community Development 2, 872, 132 4,695,200 4,792, 100
FTE 13. 600 13. 600 13. 698
45 - Library 2,637, 583 2,994,500 3,097,700
FTE 20.925 20.925 21. 200
50 - Public Works 51, 274,674 89,650, 100 96,701, 100
FTE 120.900 122.425 122.425
Total Requirements 113,644,539 $ 189,634,900 $ 189, 144,900
Total FTE 399.558 404.325 424. 118
Prominent Changes
Budget estimates are based on the continued slowed growth of the assessed values and also the
effects of compression on the Public Safety Levy.
Statement of Indebtedness (Debt Service)
The City has a General Obligation Bond rating of "AA3" from Moody' s Investors Service and arate of "AA-" from Standard & Poors. The ratings reflect the City' s growing tax base, stablefinancial position, and modest debt burden. Assessed value per capita is $ 72,265.
481

CITY OF ALBANY
NOTICE OF BUDGET HEARING
As of July 1, 2017, the City will have the following debt issues outstanding:
Total Debt Outstanding
General Obligation $ 17, 605, 000
Water Revenue 25, 570,000
Limited Tax Pension Obligation 5, 101, 484
Revenue Obligations 655, 000
TOTAL $ 43, 931, 484
Other Debt:
State Revolving FundSRF) Loan $ 51, 882, 125
2010 Wetlands 1, 889, 035
2011 SRF ARRA Loan 1, 550,000
55, 321, 160
Oregon Revised Statutes Chapter 287 provides a debt limit for General Obligation Bonds of three
percent of the true cash value ( TCV) of all taxable property within the City' s boundaries. As ofJune 30, 2017, the City' s net General Obligation Bonded debt will be well below the estimatedlimit of $109 million.
Summary of Property Tax Levies
The Budget Committee approved a total gross tax levy of $6. 3984/$ 1, 000 of the assessed
valuation.
The estimated assessed valuation for Fiscal Year 2017-2018 is $ 3, 989,437,523.
Gross tax levy: Subject to the General Government Limitation $ 6. 3984/$ 1, 000 of Assessed Value
Public Safety Levy $ 1. 15/$ 1, 000 of Assessed Value
Stewart Taylor
Finance Director
DATED THIS 31 st DAY OF MAY 2017.
Send: May 24, 2017Publish: May 31, 2017Post: May 31, 2017Remove: June 15, 2017
G (Administrative ServicesTinancelCommonM 112014 Final Budget Public Hearing Notice.docG: (Administrative Services Tinance WarylBudget Calendars & Noticing - COA 12017- 18 June. Final Budget Public HearingNotice.docx
482

CITY OF ALBANY NOTICE OF BUDGET HEARING
Th, C, % of ik,:; my hj! l holk: ! PJF31 C' HEARING rm Wodnfla-dav, Jurw 14. 2017 r, t 7 17, v rr, ia, the Cq Hiatt Councilctj')' nf' TO Rmild t1 Albriny, for the' purpose _)f discus, mnq the- had' pt tai tl"-, call ye' n f), g :" nlng July
1, .) p, vo I Iry he Git,, of Alb, iny Budriet Gotym)[ Iteo on t,,l, iy 11. 2017 Th, ja'. Lhu ttwilool tc prosent any
wr i, , 1 A! lt' Atfllony hr , Vjotte[) 42t'!' lwxov miiy he ti' the F, oumv Fite, Wi 333 f3, uidi3lbjn
S', 7 M, viy. OR 97321
Apjoovcd
A ,) v tJ tN App,. ve.] U,,,dqet document may be a' specled be4een tale hows of 8 00a. rn and 5:001)-m. at City Hdil, 333I3, SV". AIL'ilny.
A 01, _ a" v ,, A h' aRwt;0 Gommitlon H, axmg, s po,',Wd oi1ne City':; voh,, tit v) v. vvc yofiilbamy na
A t1w hod,; w paerilod below, The budool jtjctajaf( e bb95, 6C0 ftofy) Sjajm H<)ver;, i( 4 Sharing. Thr hudgelp, j d 11 . 1 at cowystenl with the twi" ls of a(xo1Anhllq used the prece'diml year Major changes. if
j"'. irci r Me,, l on the t);, dqe, we explainer! belovv
11NANCIALSUMMARY- RP1, O17lWLS
2015- I6 2,016- 17 0j7- 201? -; 8
ActualActuzil Adopted A ppioveal
11 " n' 92q' 499 s 26' 938"; 00 7. 848. 00O
5,) 41, 347 6' ht3"? W' 1 6_376, 100
fccs 1, 836,003 3, 6o8,_l0l) 3, 998, 30t1
9, 010,380 10, 526, 900 11, 9( 13400
1K 145, 31, 3 49, 857,%') 52, 1= 18. 60:)
718, 892 671' j00 636' 1 Ot)
pial} aur, lts 527. 492 5' 90') 8 ' 000
l," 141, 536 1) 16, 000 1, 741, 500
i9,3)21 90'
l I ' v t I I I t I I 18, 190, 3 63 99' 14 U 10, 1
131561, 458 10- 1- 19, 600 1 W! 16, M)
I I- ! ar , afincc 62, 711, 592 i I I I. Z, 023. 800
1, 911, 25t) ol jjt)o I' S
dhn, " hwld in lata'! 81,481 79, 500
196' 185' 159 189' r' 3 I Rat, s 111, 909
1, INAN( ' IA 1, S I dVINIA R Y - IM) l AREWNTS BY OBJ F)CL CLASS JFWA ( ION
2015- 16 2016- 17 71) 17- 18
Admil Adel); d Apjoovcd
S, 45A32, 741 1; 50, 14', 81) 41
cc' 3, I Q' ,629 3M74' 2Cl0 40, 0414, 201)
1 68; 1; 2A00
11, 978, 758 0, 780, 800
97- 327, 187 14569,?,)0 14, 712. 3O f
s 1, 851,900 1, 141. 000
a q p' J': ixvd 79, 501)
1, IN AM IA 1, St iVOAM'- ItI)QUIlduMENTS BY OW; AN IZA YIONALUNI'!'
2015- 16 2016- 1 i 2017- 18
Adwd AdoWed Appri, vcal
10, 948, 466 s 15: 111.'. 700 3? j6J.?W)
1 I1 1, 1, 375 14.37115.37`+
1, 11, 1"' c' ( A 1!- 2, 418, 381 2, 867,400
11, 700 12 13, 700
2, 770, 1 R()
1 13 000 13 000 1 1. 000)
I hoo"' I 1"'' ko" 03( 1, 126 841' 600 838, 900
4, 000 4, 000 5 Mi to
13, 518.03,S 14, 119 1, 00 15, 51 2, 200
80,908 1'). 400 R6-908
13, 1757159 1>. Z81 600 0, i -- Labii
89V5 Q'n " 5(; 98, 210
Rc':"' MM' 7,093, 804 9' 6 11, 100 10, n6,5011
30,275 31 00 3. 1. 563
2, 872, 13? 4, 605-200 4, 7W, l 00
If 13. 600 13' 00 13' 698
V, 1' 0' 1' w, 2, 6 47, 583 2, 991. 500 1, 097. 700
20. 925 200) 2, 21 1,0
51, 274, 674 89,0n, I Oo 46, 761, Io0
I E 120. 900 122A 12 . 41i
S 113, 044, 539 189,034,900 189, I44') 00
40,132, 424. 11811
483

P, ommenf G,aanges
Bi dgv* , st m . te, we , rased on the amhnued F'.owed growth of the es.. s's" A v tlurs and also lhr. 01(?GL; of axnprts51011
nr the' Puhhe 1;3 Ifety I e% y.
r nerd hd, bWedr a . Debt SerVICB
I I Cup h.i- t, rno,,.al O lrintrorl bund rdmg of AAS from Moody. In veswrs Sei ice and a Tato 01 ' AA from SlandardrWr,nJs reflex the Citys growing tax hasp, stable fmancia, posrtton, and modest debt harden. Assessed
A tJ Jul, ' Z017, lho CIty raid have the ludowing debt Is ues ouistandiny.
Tsta' Ds: bt Qutsfanrhng
iir: <;ralJbiiytc„ n 517. 605. 000
AI ifur Reke,,.uc 25. 570.000
I, n ' r ri i, x Ofhg. dinn 5 101. 484
R r Cit t , dtion`; 655. 000
TOTAL 543. 931, 484
Qil, cr Dchl-
g,, j,,; R- ; l> ina Fuwf
icJif L,. tvy 551. 882. 125
L , i n> 1. 889. 035
1 , Rt AvRA Lunn 1. 550. 000
r7 , i. F, Statue 0,e), Mw 987 provides a debt sand tot Gene,, 11 Obligation Bonds ( it 0hree percent of the, true cash
d e iTC'. (, I aiI tans , k proIwoly within the; Ctrs [,,outxdancs, As of JuneT), 201x, the G1ty' s net General ObigationL i d": d der , II tu; w< helow the estimated heat bl SI09 rnillic:n.
it Ii<i: ./ r. PI, -,party T, 1xT,1Leo,,
In', liurfrp- t C" p, n) ttrc approved i c, tal pros: tax levy v) S6 J984 of tho, a rased Voluanon.
fl r , r,. r.., t <,., , ns,c 1 ,;, l ktttol ae Fiscol Y .& 0'. i -201h i.
Gro -s I<;, e
Sib r: cI ic, , , rnen: d t u, ernm¢r^' t my( I.+ tlan 5f;. 3984' 51. 000 of Assessed Value;
P 1 r r;,I , levy t 1ia1. 000 of Aasessed Valuo
Stewart I iyl,or
1 - mance Director
DAI f D ` 1 ilS 31,, t DAY OF VAY2017.
1, 4_ _'-1 PUBLISH. May 31- 2017
484

State of Oregon
ss >
County of Linn
City of Albany/ City Managers OfficePO Box 490
Albany, OR 97321
ORDER NUMBER 74069
I, Jason Compton, being first duly sworn depose and say, that I amthe Legal Clerk of the Democrat -Herald, a newspaper of general
circulation, as defined by section 193. 010 O. R. S., published at 600Lyon St S. Albany, OR, in the aforesaid county and state; that a copyis hereto Annexed, was published in the entire issue of saidnewspaper.
PUBLISHED ON: 05/ 31/ 2017
Cyndi Rae Sprinkel -Hart, Notary
h( " ' • 1 Leg •
RECEIVED
JUN 5 2017
City of AlbanyManager's Office
485

GLOSSARY City of Albany FY 2016-2017 Account - A separate financial reporting unit for budgeting, management, or accounting purposes. All budgetary transactions, whether revenue or expenditure, are recorded in accounts. Accounting Standards - The Generally Accepted Accounting Principles (GAAP) promulgated by the Governmental Accounting Standards Board (GASB), which guides the recording and reporting of financial information by state and local governments. The standards establish such guidelines as when transactions are recognized, the types and purpose of funds, and the content and organization of the annual financial report. Accrual Basis of Accounting - A method of accounting in which revenues are recorded when measurable and earned, and expenses are recognized when obligations are incurred. Activity - A departmental effort that contributes to the accomplishment of a specific identified program strategy or action. Ad Valorem Taxes - Commonly referred to as property taxes; a property tax as a percentage of the value of taxable property; a tax based on the assessed value of the taxable property; a tax levied on both real and personal property according to the property’s valuation and the tax rate. Adopted Budget - The final budget appropriations approved by the City Council, which become the budget of the City. AFSCME - American Federation of State, County, and Municipal Employees. One of the union organizations representing bargaining employees of the City of Albany. AMEDC - Albany/Millersburg Economic Development Corporation. A non-profit organization the City contracts with to provide economic development coordination. Annexation - The incorporation of land into an existing city with a resulting change in the boundaries of that city. Appropriation - Legal authorization granted by the governing body to make expenditures and to incur obligations for specific purposes.
Approved Budget - The budget recommended by the Budget Committee for adoption by the City Council. The Council has limited authority to modify the budget. In no case may the City Council increase the tax levy approved by the Budget Committee, nor may the appropriation of any fund be increased more than 10 percent above that approved by the Budget Committee. Assessed Value - The value set by the County Assessor on real and personal taxable property as a basis for levying taxes. Assessment - An amount levied against a property for improvements specifically benefiting that property. Balanced Budget - A balanced budget means the total resources, including transfers in, less total expenditures, including transfers out, net to zero. Ballot Measure 5 - A 1.5 percent property tax measure passed by Oregon voters on November 6, 1990, limiting the consolidated tax rate for non-educational local governments to $10 per $1,000 of the assessed value. Effective date was July 1, 1991. Ballot Measure 47 - A statewide property tax limitation measure approved by voters in November 1996. The measure rolled back taxes to individual properties by either the amount paid in 1995 less 10 percent or the amount paid in 1994, whichever was less. It limited future tax increases to not more than 3 percent per year. It placed limits on the kinds of purchases that can be made with general obligation bonds. It imposed a double majority (50 percent turnout and 50 percent approval) requirement to approve new bonds or property tax levies (this portion of the measure was removed through voter approval in May 2010). Ballot Measure 50 - A statewide property tax limitation measure proposed by the Oregon Legislature and approved by voters on May 20, 1997. The measure was prompted by confusion over the meaning and language contained in Measure 47. It keeps most of the tax reduction intent of Measure 47, but attempts to make the system simpler and avoid legal challenges of the meaning of Measure 47.
486

GLOSSARY City of Albany FY 2016-2017 Bancroft - (also referred to as Bancroft Bonding Act). Oregon law (ORS 223.205) which allows property owners to make installment payments on assessments to specific property benefited by a City improvement. Property owners make scheduled payments to the City until assessment has been paid in full. Basis of Accounting – The method employed in the recording and reporting of transactions. Three bases are commonly recognized: the cash basis, the modified accrual basis, and the accrual basis. Beginning Fund Balance - The unexpended amount in a fund at fiscal year end, which is carried over into the next fiscal year. Bond - A written promise to pay a specific sum of money, called the face value or principal amount, at a specific date or dates in the future, called the maturity dates(s), together with periodic interest at a specified rate. The difference between a note and a bond is that the latter runs for a longer period of time and requires greater legal formality. Bond Refinancing - The payoff and re-issuance of bonds to obtain better interest rates and/or bond conditions. Budget - A plan of financial operation embodying an estimate of expenditures for a given purpose and/or period (typically a fiscal year) and the proposed means of financing the estimated expenditures and revenues. The budget is the financial plan for the City’s allocation of resources to provide services and accomplish the City’s objectives. Budget Calendar - The schedule of key dates, or events, which a government follows in the preparation and adoption of the budget. Budget Committee - A committee required by Oregon Local Budget Law (ORS 294.305) which must recommend a budget and approve the maximum tax levy. Budget Manual - A set of documents published in preparation for the budget year outlining the City’s budget policies, procedures, forms, and calendar.
Budget Message - Written explanation of the budget and the City’s financial plan and priorities presented to the Budget Committee by the City Manager, which is a requirement of Local Budget Law, ORS 294. Budget Officer - The person designated by the Governing Body to be responsible for the preparation of the budget and meeting legal deadlines. The designation is required by Oregon Local Budget Law (ORS 294.305). The Finance Director is the designated Budget Officer for the City of Albany. Budget Phases - The following are the major phases of the budget process:
Requested The requested appropriation for an activity as submitted to the City Manager. . Proposed The City Manager’s recommended budget to the Budget Committee and City Council. Approved The budget as approved by the Budget Committee and subsequently reviewed and certified by the City Council. Adopted The budget as passed by ordinance by the City Council.
CAFR (Comprehensive Annual Financial Report) - Prepared at the close of each fiscal year to show the actual audited condition of the City’s funds and serve as the official public record of the City’s financial status and activities. Capital Assets - Non-consumable assets of significant value ($5,000 or more) and having a useful life of more than one year. Capital assets are also called fixed assets. Capital Equipment - Operating equipment with unit costs of more than $5,000 and a useful life of more than one year. Capital Improvements - Expenditures related to acquisition, construction, expansion, or rehabilitation for improving an element of the government’s physical plant and/or infrastructure.
487

GLOSSARY City of Albany FY 2016-2017 Capital Improvement Program (CIP) - A plan for capital expenditures to be incurred each year over a fixed period of several future years setting forth each capital project, identifying the expected beginning and ending dates for each project, the amount to be expended in each year, and the method of financing those expenditures.
Capital Outlays - Expenditures for the acquisition of capital assets.
Capital Projects - Projects which purchase or construct capital assets. Typically a capital project encompasses a purchase of land and/or the construction of a building or facility.
Capital Reserve - An account used to segregate a portion of the government’s equity to be used for future capital program expenditures. The amount of capital reserve is roughly equal to the government’s annual equipment depreciation and an amount identified as being needed for future capital acquisition.
CARA - Central Albany Revitalization Area. An urban renewal district in downtown Albany.
Cash Basis of Accounting - The system of accounting under which revenues are accounted for only when received, and expenditures are accounted for only when paid.
Charter - Oregon law allows Municipal Corporations, upon a vote of the people, to establish a charter government. Commonly referred to as Home Rule, it allows a local government more flexibility in organization and legal authority. The City of Albany’s original Charter was adopted in 1891.
City Council - The governing body, consisting of the Mayor and six other elected persons, which sets policies and procedures for the functioning of the municipal government of the City of Albany.
City Match - The expenditure of City resources as the necessary condition for the award of a grant. Compression (Tax Limitation) - The Oregon Constitution sets limits on the amount of property taxes that can be collected from each property tax account. These limits are often called the “Measure 5 limits.” To figure these limits, taxes are divided into categories described in the constitution. The categories are: education and
general government. If taxes in either category exceed the limit for that property, the taxes are reduced or “compressed” until the limit is reached. Local option taxes are compressed first. If the local option tax is compressed to zero, and the limit still hasn’t been reached, the other taxes in the category are proportionally reduced.
Contingency - A budgetary reserve set aside for emergencies or unforeseen expenditures not otherwise budgeted for. Formal Council action is required for transfers from Contingency to an expenditure appropriation.
Contract - An agreement between the City and an individual, legal, or political entity, agreeing to provide certain things. If the City is to provide a service(s) for reimbursement, the department providing the service must indicate the appropriation necessary and identify the source and amount of funds to be received in its budget request.
COP (Certificate of Participation) - Provides long-term financing through a lease, installment sale agreement, or loan agreement.
Depreciation – The decrease in the value of an asset due to use or becoming out of date. The depreciation of general fixed assets is calculated using the straight-line method, which calculates annual expense by dividing the historical cost by the number of years of useful life.
Debt Service - Annual principal and interest payments that the local government owes on money it has borrowed.
Debt Service Fund - One or more funds established to account for expenditures used to repay the principal and interest on debt.
Defeasement - Relieving the City of a particular liability (such as a specific bond series) by refunding the liability through an escrow account. Legally defeased liabilities do not need to be appropriated each year as the escrow account is removed from the control of the City.
Development-related Fees - Those fees and charges generated by building, development, and growth in a community. Included are building and street permit fees, development review fees, zoning, platting, and subdivision fees.
488

GLOSSARY City of Albany FY 2016-2017 Disbursement - Payment for goods or services that have been delivered and invoiced.
Distinguished Budget Presentation Awards Program - A voluntary awards program administered by the Government Finance Officers Association of America and Canada to encourage governments to prepare effective and exceptional budget documents. Receiving this award is the highest form of recognition in governmental budgeting. Budgets are evaluated for effectiveness as a policy document, a financial plan, an operations guide, and a communication device.
Encumbrances - Obligations in the form of purchase orders, contracts, or salary commitments which are chargeable to an appropriation and for which a part of the appropriation is reserved. Obligations cease to be encumbrances when paid.
Enterprise Fund - A separate fund used to account for services supported primarily by service charges; examples are water and sewer funds.
Entitlement Program - A program in which funding is allocated according to eligibility criteria; all persons or governments that meet the criteria specified in law receive the benefit.
Equipment Replacement Reserves - Reserves designated for the purchase of new vehicles or operating equipment as existing equipment becomes obsolete or unusable.
Equipment Replacement Schedule - A schedule of annual purchases to replace major equipment and vehicles that have met or exceeded their useful life to the City.
Expenditure - For accounts that are kept on the accrual basis, the total charge incurred, whether paid or unpaid, including provision for retirement of unreported debt as a liability of a fund from which retained, and capital outlay. The modified accrual basis shows decreases in net financial resources and may include encumbrances. For accounts kept on the cash basis, the term covers only actual disbursement and the drawing of the check or warrant for these purposes, but not encumbrances, except that deferred employee compensation shall be included as a personal service expenditure where an approved deferred employee compensation plan is in effect for a municipal corporation.
Fiduciary Funds –
Agency Funds - Account for resources where the governmental unit acts solely as an agent in collecting and dispersing monies such as federal payroll monies. No fund balance is maintained and no appropriations are necessitated. These funds are accounted for on a modified accrual basis. Internal Service Funds - Account for goods and/or services provided to other funds or departments within the organization. Internal charges, set to cover costs of the goods or services, provide the revenue for these funds. Trust Funds - Account for resources where the governmental unit acts as a trustee either formally or informally for restricted fund users. Trust funds may be expendable (and thus subscribe to a modified accrual basis of accounting) for a specific project or service. Non-expendable trusts focus on the ongoing retention of earnings and subscribe to an accrual basis of accounting.
Fiscal Year (FY) - ORS 294.311(17) “Fiscal year” means for municipal corporations with the power to impose ad valorem property taxes, the fiscal year commencing on July 1 and closing on June 30, and for all other municipal corporations, an accounting period of 12 months ending on the last day of any month. This fiscal year is referred to using both calendar years. For example, a fiscal year beginning July 1, 2008, and ending June 30, 2009, would be called Fiscal Year 2008-09, or FY 08-09. Fixed Assets (also see Capital Assets) - Non-consumable assets of a tangible nature (such as buildings, furniture, and other equipment) that have a useful life greater than one year and cost more than $5,000. Franchise Fees - Fees charged to utilities for the use of public right-of-way. FTE - Full-Time Equivalent position. A part-time position converted to the decimal equivalent of a full-time position based on 2,080 hours per year.
489

GLOSSARY City of Albany FY 2016-2017 Fund - A budgetary and fiscal accounting mechanism for designating a sum of money or other resources set aside for providing services and achieving objectives in accordance with state and local laws, regulations, or other limitations. Each fund constitutes an independent budgetary, fiscal, and accounting entity. Fund Balance - The excess of the assets of a fund over its liabilities. Fund Transfer - A movement of resources as an expense in one fund to revenue in another fund. Transfers result in artificial inflation of the total budget, but provide a clearer picture of the true origins of revenue and expense.
Interfund transfers are appropriations that are transferred from one fund to another. Transfers must be made through formal adoption of a resolution by the City Council. Oregon Budget Law has several restrictions dealing with transfers; e.g., an appropriation may not be transferred from a Special Revenue Fund to the General Fund.
GAAP (Generally Accepted Accounting Principles) - Uniform minimum standards for financial accounting and recording, encompassing the conventions, rules, and procedures that define accepted accounting principles. GEMS – City of Albany dance group, “young jewels.” General Fund - The City’s major operating fund that includes all services authorized by the Council and the Charter not specifically provided for in other funds. The major source of revenue for this fund is usually property taxes. There are no restrictions as to the purposes for which the revenues in this fund can be used. General Obligation Bond (G. O. Bond) - A government pledge of full faith and credit to the repayment of the bonds issued by the government. The term is also used to refer to bonds that are to be repaid from taxes and other general revenues. Goal - A statement of direction, purpose, or intent based on the needs of the community, generally to be completed within a specified time period.
Governmental Funds - These funds subscribe to the modified accrual basis of accounting and include the following types of funds:
General Fund - see previous definition. Special Revenue Funds - Resources received are limited to a specifically defined use; e.g., the Street Fund. Debt Service Funds - Funds used for paying principal and interest of debt on non-enterprise funds. Capital Project Funds - Resources are used for purchase or construction of long-term fixed assets. Permanent Funds - Resources reported are legally restricted to the extent that only earnings, and not principal, may be used for the benefit of the government or its citizenry. Special Assessment Funds - Resources are received from specific beneficiaries of a particular service or projects expended from these funds. Note: City of Albany does not have a Special Assessment Fund. Internal Services Funds – Funds used to account for the financing of goods and/or services provided to various City Departments on a cost-reimbursement basis. Agency Fund – Fund used to account for assets held by a government as an agent for individuals, private organizations, other governments, and/or other funds.
Grant - A donation or contribution of assets (usually cash) by an organization or governmental unit to another organization or governmental unit. Grants are generally made for specific purposes. Infrastructure - The physical assets of a government (e.g., streets, water facilities, sewer facilities, public buildings, and parks). Interfund Transfers - The movement of monies between funds of the same government entity.
490

GLOSSARY City of Albany FY 2016-2017 Intergovernmental Revenue - Funds received from federal, state, and local government sources in the form of grants, shared revenues, and payments in lieu of taxes. Internal Service Charges - Charges to user departments for services provided internally by the City (e.g., data processing). Levy - The amount of ad valorem tax certified to the County Assessor by a local government for the support of governmental activities. The tax amount is spread (or levied) over the assessed value of property in that district. Liabilities - Debt or other legal obligations arising out of transactions in the past that must be liquidated, renewed, or refunded at some future date. Also included are items that involve probable future sacrifices of economic benefits, arising from present obligations of a municipal corporation to transfer assets or provide services to other entities in the future as a result of past transactions or events. The term does not include encumbrances. LID (Local Improvement District) - The property that is to be assessed for the cost or part of the cost of a local improvement and the property on which the local improvement is located. Line Item - Five-digit numerical classification of revenues and expenditures. Local Budget Law - Oregon Revised Statutes, Chapter 294, prescribes budgeting practices for municipalities within Oregon. Millage -Taxation stated as one tenth of a cent per dollar of valuation; as $ .001 used in calculations. A mill is the property tax rate that is based on the valuation of property. A tax rate of one mill produces one dollar of taxes on each $1,000 of assessed property value. Modified Accrual Basis of Accounting - The accrual basis of accounting adapted to the governmental fund types under which revenues and other financial sources (bond proceeds) are recognized when they become susceptible to accrual; that is, when they become both measurable and available to finance expenditures of the current period.
Municipal Code - A system of rules compiled and arranged by a municipal corporation, adopted, and used to regulate the conduct of its inhabitants and government. Municipal Corporation - Any county, city, port, school district, union high school district, community college district, or any other public or quasi-public corporation operated by a separate board or commission. Net Budget - The legally adopted budget less all interfund transfers and interdepartmental charges. OAR - Oregon Administrative Rules, rules of various state agencies and programs operation. Operating Expenses - Costs for personnel, materials, and equipment required for a department to function. Operating Revenue - Funds that government receives as income to pay for ongoing operations including taxes, fees from specific services, interest earnings, and grant revenues. Operating revenues are used to pay for day-to-day services. Ordinance - A formal legislative enactment by the governing board of a municipality. If it is not in conflict with any higher form of law, such as a state statute or constitutional provision, an ordinance has the full force and effect of law within the boundaries of the municipality to which it applies. The difference between an ordinance and a resolution is that the latter requires less legal formality and has a lower legal status. Ordinarily, the statutes or City Charter will specify or imply which legislative actions must be made by ordinance and which may be made by resolution. ORS - Oregon Revised Statutes, laws of the State of Oregon. Part-time Position - A position that has no full-time position authority. A part-time position will fit into one of the following categories:
Part-time, Regular - A position budgeted for less than 40 hours per week. The position is eligible for prorated City-paid benefits of the normal amount paid to full-time City employees, if the employee works more than 20 hours per week.
491

GLOSSARY City of Albany FY 2016-2017
Part-time, Temporary - A position budgeted for up to 1,040 hours per year. The position is not eligible for benefits. Intermittent - A position budgeted for up to 520 hours per year. The position is not eligible for benefits.
Performance Measure - Data collected to determine how effective or efficient a program is in achieving its objectives.
Effectiveness Measure - A qualitative and/or quantitative measure of the extent to which the performance of a series of related tasks achieves a desired result or objective: the ratio of actual to planned accomplishment of a specific objective. Efficiency Measure -The extent to which the process utilized by an organization to produce goods and/or services minimizes the use of resources. The ratio of a unit of goods and/or services produced to the amount of resources required to produce it. Input Measure - Measures the volume of resources, both monetary and non-monetary, used in delivering a program or service. Output Measure - Measures the quantity or volume of products and services provided.
PERS (Public Employees Retirement System) - A State of Oregon-defined benefit pension plan to which both employees and employer contribute. Plat - The map, drawing, or chart on which the subdivider’s plan of subdivision or partition is presented and which he/she submits for approval and intends in final form to record. Pooled Investments (Sweep Investments) - Liquid assets of various funds and sub-funds pooled together and invested to get the maximum investment earnings potential. Earnings go to each of the funds contributing to the pool on an approved basis. Property Tax Levy - The tax levy combining the general operating levy and the debt service levy imposed by the City.
Program Budget - A budget that allocates money to the functions or activities of a government rather than to specific items of cost or to specific departments. Proposed Budget - A draft of the budget document to be submitted to and reviewed by the Budget Committee and City Council. This begins the formal phase of budget deliberations by the Budget Committee. Purchase Order - A document issued to authorize a vendor or vendors to deliver specified merchandise or render a specified service for a stated estimated price. Outstanding purchase orders are encumbrances. Reserve Fund - A fund established to accumulate revenues to use for a specific purpose in the future. Resolution - An action of the governing body which requires less legal formality and has a lower legal status than an ordinance. Ordinarily, the statutes or City Charter will specify or imply those legislative actions that must be made by ordinance and those which may be made by resolution. Resources and Requirements – In budgeting, resources turn into revenues when the money is received. Requirements turn into expenditures when the money is spent. Requirements define what is needed to perform the functions of the City (fire, police, library, sewer, water, etc.) Revenues - The gross receipts and receivables that a governmental unit receives, such as: tax payments, licenses, fees for specific services, receipts from other governments, fines, forfeitures, grants, shared revenues, and interest income. Excluded from revenues are appropriations, allotments, and return of principal from investment of surplus funds. Revenue Bonds - Bonds issued pledging future revenues, usually water, sewer, or storm drainage charges, to make debt service payments. Risk Management - An organized attempt to protect a government’s assets against accidental loss in the most economical manner by identifying loss exposure, evaluating the risk, and treating the loss through risk control and financing.
492

GLOSSARY City of Albany FY 2016-2017 SDCs (System Development Charges) - Charges levied on new construction to help pay for additional expenses created by growth, or to compensate for already existing capacity in key facilities and systems which support the new development. Sinking Fund Reserves - A collection of restricted assets that will be used to meet future debt service requirements. Special Assessment - A compulsory levy made by a local government against certain properties to defray part or all of the costs of a specific improvement or service which is presumed to be of general benefit to the public and of special benefit to such properties. Special Revenue Fund - A fund properly authorized and used to finance particular activities from the receipts of specific taxes or other revenues. Supplemental Budget - A budget process used to increase appropriation authority made in the Adopted Budget. Tax Levy - Total amount of dollars raised in property taxes imposed by the City. Tax Rate - The amount of property tax to be paid for each $1,000 of a property’s assessed value. The tax rate is determined by dividing the assessed value of a district by the total tax levy approved for the district. The result is an amount, in dollars and cents, to be levied against each $1,000 of taxable property value. (See Ballot Measures 5, 49, and 50). Transfer - Amounts distributed from one fund to finance activities in another fund. Shown as an expenditure in the originating fund and a revenue in the receiving fund. Transient Occupancy/Room Tax - A tax placed on lodging facilities for the occupancy of a room. Trust Fund - A fund used to account for fiscal activities of assets held in trust by a local government.
Unappropriated Fund Balance - An amount set aside in the budget to be used as a cash carryover to the next year’s budget. It provides the local government with cash until tax money is received from the county treasurer in November. This amount cannot be transferred by resolution or used through a supplemental budget. User Charges - The payment of a fee for direct receipt of a public service by the one that benefits from the service.
493

ACRONYMS City of Albany FY 2017-2018 AAMPO – Albany Area Metropolitan Planning Organization ACP – Albany Community Pool ACWA – Association of Clean Water Agencies ADA – Albany Downtown Association ADA – Americans with Disabilities Act ADC – Albany Development Code AFSCME – American Federation of State, County, and Municipal Employees AMBAC – American Municipal Bonds Assurance Corporation AMC – Albany Municipal Code AMEDC – Albany Millersburg Economic Development Corporation AM WRF – Albany-Millersburg Water Reclamation Facility APAK – Albany Police & Kids APWA – American Public Works Association APD – Albany Police Department ARA – Albany Revitalization Agency ARRA – American Recovery and Reinvestment Act ATS – Albany Transit System AV – Assessed Value AVA – Albany Visitors Association AYSO – American Youth Soccer Organization BCSWD – Benton County Soil and Water District BEST – Building Exceptional Service Together BLM – Bureau of Land Management BULB – Bringing Up Learning & Behavior CAFR - Comprehensive Annual Financial Report
CAPER – Consolidated Annual Performance Evaluation Report CARA – Central Albany Revitalization Area CET – Construction Excise Tax CD – Community Development CDBG - Community Development Block Grant CIP - Capital Improvement Program CLG – Certified Local Government CMOM – Capacity Management Operation Maintenance COG – Oregon Cascades West Council of Governments COLA – Cost of Living Adjustment COPS – Community Oriented Policing Services CPAS – Children’s Performing Arts Series CRS – Community Rating System CMMS – Computerized Maintenance Management System CYF – Children, Youth, and Families CZ – Crown Zellerbach DARE – Drug Abuse Resistance Education DEQ – Department of Environmental Quality DFM – Deputy Fire Marshal DLCD – Department of Land Conservation and Development DMV – Department of Motor Vehicles DOJ – Department of Justice DUII – Driving Under the Influence of Intoxicants ELA – Engineering, Legal, & Administrative Fees EMMA – Electronic Municipal Market Access EMS - Emergency Medical Services
494

ACRONYMS City of Albany FY 2017-2018 EMT - Emergency Medical Technician EPA – Environmental Protection Agency EPSC – Erosion Prevention Sediment Control ERP – Enterprise Resource Planning ESD – Educational Service District ETLNA – East Thornton Lake Natural Area FAA – Federal Aviation Administration FEMA – Federal Emergency Management Agency FGP – Foster Grandparent FM – Force Main FMLA – Family Medical Leave Act FOG – Fats, Oils, and Grease Program FTA – Federal Transit Administration FTE - Full-Time Equivalent position FY – Fiscal Year GAAP - Generally Accepted Accounting Principles GAPS – Greater Albany Public Schools GASB – Governmental Accounting Standards Board GF – General Fund GFOA – Government Finance Officers Association GIS – Geographic Information System GO – General Obligation HBRR – Highway Bridge Replacement & Rehabilitation HPF – Historic Preservation Fund HUD – Housing and Urban Development
HMEP – Hazardous Materials Emergency Preparedness IAC – Information Access Corporation IAF – Improvement Assurance Fee IAFF – International Association of Fire Fighters ICMA – International City Managers Association IGA – Intergovernmental Agreement ILFF – In Lieu of Franchise Fees ILS – Integrated Library System IOF – Immediate Opportunity Fund IP – International Paper IT – Information Technology ITB – Invitation to Bid IPM – Integrated Pest Management JWP – Joint Water Project LBCC – Linn-Benton Community College LBL – Linn, Benton, and Lincoln Counties LCDC – Land Conservation & Development Commission LEML – Law Enforcement Medical Liability Assessment LID - Local Improvement District LINE – Linn County Interagency Narcotics Enforcement LS – Lift Station LT2 Rule– Long Term 2 Enhanced Surface Water Treatment Rule LTD – Limited MPO – Metropolitan Planning Organization NBI – National Bridge Inventory
495

ACRONYMS City of Albany FY 2017-2018 NDCIU – Non-Discharging Categorical Industrial User NFIP – National Floodplain Insurance Program NPDES – National Pollution Discharge Elimination System NWAAF – Northwest Art & Air Festival OAR – Oregon Administrative Rules OCF – Oregon Community Foundation ODOT – Oregon Department of Transportation OECD – Oregon Economic & Community Development OEDD – Oregon Economic Development Department OEM – Oregon Emergency Management OHSU – Oregon Health Sciences University OLCC – Oregon Liquor Control Commission O&M – Operation & Maintenance ORS – Oregon Revised Statutes OS – Operating System OS – Oregon State OSFM – Oregon State Fire Marshal OTIA – Oregon Transportation Investment Act OWEB – Oregon Water Enhancement Board P&R – Parks and Recreation PERS – Public Employees Retirement System PAFR – Popular Annual Financial Report PE – Professional Engineer PNCWA – Pacific Northwest Clean Water Association PW – Public Works REA – Railway Express Agency
RFD – Rural Fire District RFI – Riverfront Interceptor RFP – Request for Proposal RFQ – Request for Quotes RMTC – Regional Multimodal Transportation Center RMV – Real Market Value ROW – Right of Way RRP – Rental Rehabilitation Program RSVP – Retired Senior Volunteer Program SAFER – Staffing for Adequate Fire and Emergency Response SCADA – Supervisory Control & Data Acquisition SCBA – Self-Contained Breathing Apparatus SCF – Sewer Connection Fees SDCi – System Development Charge-Improvement SCDr – System Development Charge-Reimbursement SDCs – System Development Charges SHPO – State Historic Preservation Office SI – Site Improvement SIU – Significant Industrial User SOP – Standard Operating Procedure SPWRF – Special Public Works Revolving Fund SRF – State Revolving Fund STEAM – Science, Technology, Engineering, Art, and Math STF – Special Transportation Fund STP – Surface Transportation Program TCV – True Cash Value
496

ACRONYMS City of Albany FY 2017-2018 TDY – Teledyne Industries TE – Transportation Enhancement TEA – Transportation Equity Act TGM – Transportation and Growth Management TIC – True Interest Costs TLT – Transient Lodging Tax TMDL – Total Maximum Daily Load TRT – Transient Room Tax TSDC – Transportation System Development Charge TWG – Talking Water Gardens UCR – Uniform Crime Reporting UGM – Urban Growth Management USAR – Urban Search and Rescue UZA – Urbanized Area WL – Wetlands WRF – Water Reclamation Facility WTP – Water Treatment Plant WWTP – Wastewater Treatment Plant
YMCA – Young Men’s Christian Association
497
