city of baltimore of elections report_final.pdf · the bureau of the budget and management research...
TRANSCRIPT

BBMR‐13‐01ManagementResearchProject:BoardofElectionsJanuary2013
BureauoftheBudgetandManagementResearch Andrew Kleine, Chief
CityofBaltimore
ManagementResearchReport
The Bureau of the Budget and Management Research is an essential fiscal steward for the City of Baltimore. Our mission is to promote economy
and efficiency in the use of City resources and help the Mayor and City agencies achieve positive outcomes for the citizens of Baltimore. We do
this by planning for sustainability, exercising fiscal oversight, and performing analysis of resource management and service performance. We
value integrity, learning and innovating, excellent customer service, and team spirit.
BBMR‐13‐01
FURTHERSTEPSNEEDEDTOIMPROVECOST‐EFFECTIVENESSOFTHECONDUCTOFELECTIONS
January2013

(THIS PAGE INTENTIONALLY LEFT BLANK)

BBMR‐13‐01ManagementResearchProject:BoardofElectionsJanuary2013
Why BBMR Did This Study
The Board of Elections is authorized by
the Public General Laws of Maryland
and is empowered to make rules
consistent with State laws to ensure
the proper and efficient registration of
voters and conduct of elections. The
purpose of conducting this study is to
find ways to increase cost‐
effectiveness of the conduct of
elections and to examine alternative
voting methods so that Baltimore City
can chart the future of its own system
of election administration with the
most information possible.
What BBMR Recommends
To improve cost‐effectiveness of the
conduct of elections, BBMR
recommends the following actions:
1. Use the staffing model
recommended by BBMR to
determine the number of
election judges for each election
and reduce the number of poll
workers accordingly
2. Measure performance indicators
including average wait time,
voter satisfaction, and election
judges’ utilization rate
3. Reduce the number of precincts
4. Co‐locate precincts and
consolidate entry lines upon
further discussions with the State
Board
5. Explore the feasibility of
alternative voting methods,
particularly introducing
permanent absentee voting,
vote‐by‐mail, and vote centers in
Baltimore City
6. Expand the role of the Board of
Elections by including maximize voter turnout as one of its missions
To view the full report, including scope
and methodology, click on
BBMR‐13‐01
BureauoftheBudgetandManagementResearch Andrew Kleine, Chief
BBMRManagementResearchProjectFurtherStepsNeededtoImproveCost‐EffectivenessoftheConductofElections
What BBMR Found
Cost‐effectiveness of the conduct of elections in Baltimore City is currently not maximized. In‐depth
research of the conduct of elections shows that the administration of elections is not cost‐effective
because 1) polling places are overstaffed, 2) there are more precincts and polling places than necessary,
and 3) voter turnout has historically been low.
Baltimore City spent $2.1 million to conduct the 2011 Mayoral Primary election with a 25 percent voter
turnout. With 77,191 voters, cost per vote was $27.21. Although the cost of the 2008 Presidential General
Election (inflation‐adjusted to 2012 dollars) was higher, totaling $3.2 million, the high voter turnout
reduces cost per vote to $12.94, 53 percent lower than cost per vote in the 2011 Mayoral Primary Election.
2011MayoralPrimary
2010GubernatorialPrimary
2008PresidentialGeneral
# of Voters Voted 77,191 164,556 251,127
Voter Turnout 24.58% 48.16% 68.21%
Cost per Vote $26.52 $17.44 $12.94
When compared to other Maryland Counties, Baltimore City had the largest election administration
appropriation and the highest cost per registered voter:
CostofElection*
NumberofRegisteredVoters
CostperRegisteredVoter
CostperVote
Baltimore City $3,283,612 365,508 $8.98 $19.95
Baltimore County $2,595,010 492,869 $5.27 $8.94
Anne Arundel $2,389,600 331,101 $7.22 $11.69
Montgomery $2,398,915 573,431 $4.18 $8.14
Prince George's $2,541,700 517,500 $4.91 $10.87
*2010 Gubernatorial General Election
To increase cost‐effectiveness, Baltimore City should consider reducing the number of poll workers and
precincts, co‐locating precincts, and consolidating entry lines. Baltimore City should also examine
alternative voting methods that other states and cities have used to increase voter turnout while reducing
costs. Colorado’s vote centers, Oregon’s vote‐by‐mail, and West Virginia’s pilot online voting are
alternatives that Baltimore City should examine to better understand the feasibility of implementing
alternative voting methods. A reevaluation of the ways Baltimore City conducts elections would better
position the Board of Elections to be more competitive with administering elections in Baltimore City.
Summary of Savings Estimates of Recommended Alternatives
Alternatives SavingsfromUsingStaffing
Model
AdditionalSavings
CumulativeSavings($)
CumulativeSavings(%)
Use Staffing Model $127,266 ‐ $127,266 6.18%
Co‐Locate Precincts $127,266 $18,819 $146,085 7.14%
Consolidate Entry Lines $142,538 $21,561 $164,099 8.02%
Reduce Precincts $142,538 $21,561 $164,099 8.02%
Establish Vote Centers $191,200 ‐ $155,819* 7.61%
Changes to State Requirements $75,000** $101,522† $17,522 8.62%
* Vote centers’ cumulative savings is less than poll workers savings because of additional expenditure related to
transportation coordinators and contingency amount.
**Savings stem from reducing poll workers’ compensation rates.
†Addi onal Savings stem from savings related to fewer voting machines.

(THIS PAGE INTENTIONALLY LEFT BLANK)

BBMR‐13‐01ManagementResearchProject:BoardofElectionsJanuary2013
TableofContents
Letter to the Mayor 1
Background
Statutory Authority and History 2 Election Cycle 3 Responsibilities of the Board of Elections 3 Personnel 9 Priority Outcome and Performance Measures 9 Cost of Operations in Fiscal 2012 14
Findings
Cost‐Effectiveness is Not Maximized in the Conduct of Elections 17 Polling Places Have More Staff Than Necessary 20 More Precincts and Polling Places Than Necessary 25 Low Voter Turnout 33 Summary of Alternatives to Increase Cost‐Effectiveness 38 State Requirements 38
Other Jurisdictions’ Alternative Voting Methods Could Provide Insights to Enhance Cost‐Effectiveness 41 Vote Centers 41 Vote‐by‐Mail 42 Permanent Absentee Voting 45 Online Voting 46
Conclusions 46
Recommendations 46
Agency Comments and Evaluation 47
‐‐‐‐‐‐‐‐‐‐‐‐‐‐‐‐‐‐‐‐‐‐‐‐‐‐‐‐‐‐‐‐‐‐‐‐‐‐‐‐‐‐‐‐‐‐‐‐‐‐‐‐‐‐‐‐‐‐‐‐‐‐‐‐‐‐‐‐‐‐‐‐‐‐‐‐‐‐‐‐‐‐‐‐‐‐‐‐‐‐‐‐‐‐‐‐‐‐‐‐‐‐‐‐‐‐‐‐‐‐‐‐‐‐‐‐‐‐‐‐‐‐‐‐‐‐‐‐‐‐‐‐‐‐‐‐‐‐
Appendix I: Tables, Maps, and Documents 49
Appendix II: Scope and Methodology 84
Appendix III: Agency Comments 85
Appendix IV: BBMR Contact and Staff Acknowledgement 86

BBMR‐13‐01ManagementResearchProject:BoardofElectionsJanuary2013
Tables
Table 1: Election Cycles 3 Table 2: Training Program for Poll Workers in Fiscal 2012 4 Table 3: State Reimbursement Breakdown 5 Table 4: Cost for Voting Machine Preparation for One Election 6 Table 5: Cost of Post‐Election Maintenance and Battery Replacement in Fiscal 2012 6 Table 6: Cost of Voting Machine Preparation in Fiscal 2012 6 Table 7: Board of Elections’ Responsibilities 8 Table 8: Board of Election’ State Employees 9 Table 9: Fiscal 2013 Priority Measures 10 Table 10: BBMR Recommended Priority Measures 10 Table 11: Voters’ Arrival Rate 11 Table 12: Service Times of Registration Check and Voting 11 Table 13: Simulated Average Wait Time for Six Voting Machines 12 Table 14: Election Day Notification Log 13 Table 15: Expenditures by Activities 14 Table 16: Board of Elections’ Expenditures at the Downtown Office 15 Table 17: Board of Elections’ Expenditures at the Warehouse 15 Table 18: Election Administration Costs 16 Table 19: Cost‐Effectiveness of the Conduct of Elections 17 Table 20: Cost‐Effectiveness of Maryland Jurisdictions 17 Table 21: Cost‐Effectiveness in Major Cities 18 Table 22: Balanced Scorecard 19 Table 23: Estimated Number of Poll Workers for Election Day 22 Table 24: Estimated Number of Poll Workers for Early Voting Week 23 Table 25: Savings Generated by Using the New Staffing Model 23 Table 26: Precincts and Polling Places in April 2012 25 Table 27: Comparison among Cities 26 Table 28 Cost Before and After Co‐Location of Precincts 28 Table 29: Cost Before and After Co‐Location of Precincts without Staffing Change 29 Table 30: Cost Before and After Consolidation of Entry Lines 30 Table 31: Comparison of Costs between Traditional Precincts and Vote Centers 32 Table 32: Baltimore City’s Voter Turnout Compared to MD Jurisdictions 34 Table 33: Mayoral Elections’ Voter Turnout Compared to Major Cities 35 Table 34: Presidential Elections’ Voter Turnout Compared to Major Cities 35 Table 35: Larimer County Election Year Totals 36 Table 36: Larimer County and Colorado Voter Turnout 36 Table 38: Presidential General Elections (2000 and 2004) 37 Table 38: Cost‐Effectiveness of the Conduct of Elections 37 Table 39: Alternatives to Increase Cost‐Effectiveness 38 Table 40: Registered Voters per DRE Voting Machine 38 Table 41: Voting Machine Savings 39 Table 42: Chief Judges’ Compensation Rates 40 Table 43: Cost of Running the 2011 Mayoral Primary Election Using Vote‐By‐Mail 43 Table 44: Vote Centers in Combination with Permanent Absentee Voting 45 Table 45: Historical Voter Turnout in Baltimore City 49 Table 46: Historical Elections Costs 50 Table 47: T Test Results 51

BBMR‐13‐01ManagementResearchProject:BoardofElectionsJanuary2013
Table 48: Median Voter Turnout of Cities with a Population of Over 500,000 52 Table 49: Percentage of Votes by Precincts (in Percentage) 53 Table 50: Number of Poll Workers by Precincts 58 Table 51: Simulation Model of Average Wait Time of the 2008 Presidential General 67 Table 52: Simulated Wait Time for Vote Centers 73
Charts
Chart 1: Voting Station Flow 11 Chart 2: Average Wait Time as a Function of Average Voting Time 12 Chart 3: Fiscal 2012 Expenditures of the Board of Elections in Fiscal 2012 by Activities 14 Chart 4: Distribution of Number of Registered Voters per Election Judge 20 Chart 5: Cost Components of the 2011 Mayoral Primary Election 21 Chart 6: Number of Votes per Election Judge 24 Chart 7: Co‐Locating Additional Precincts 29 Chart 8: Consolidating Entry Lines 30 Chart 9: Vote Center Stations 41 Chart 10: Oregon’s Voter Turnout 1996‐2008 43 Chart 11: Historical Voter Turnout in Baltimore City 49 Chart 12: Correlation of Percentage of Voters at Each Precinct 51
‐‐‐‐‐‐‐‐‐‐‐‐‐‐‐‐‐‐‐‐‐‐‐‐‐‐‐‐‐‐‐‐‐‐‐‐‐‐‐‐‐‐‐‐‐‐‐‐‐‐‐‐‐‐‐‐‐‐‐‐‐‐‐‐‐‐‐‐‐‐‐‐‐‐‐‐‐‐‐‐‐‐‐‐‐‐‐‐‐‐‐‐‐‐‐‐‐‐‐‐‐‐‐‐‐‐‐‐‐‐‐‐‐‐‐‐‐‐‐‐‐‐‐‐‐‐‐‐‐‐‐‐‐‐‐‐‐‐
Maps Map 1: Polling places in Baltimore City in 2012 27 Map 2: Voter Turnout (by Districts) 79
‐‐‐‐‐‐‐‐‐‐‐‐‐‐‐‐‐‐‐‐‐‐‐‐‐‐‐‐‐‐‐‐‐‐‐‐‐‐‐‐‐‐‐‐‐‐‐‐‐‐‐‐‐‐‐‐‐‐‐‐‐‐‐‐‐‐‐‐‐‐‐‐‐‐‐‐‐‐‐‐‐‐‐‐‐‐‐‐‐‐‐‐‐‐‐‐‐‐‐‐‐‐‐‐‐‐‐‐‐‐‐‐‐‐‐‐‐‐‐‐‐‐‐‐‐‐‐‐‐‐‐‐‐‐‐‐‐‐
Documents
Document 1: Board of Estimates’ Approval of McAfee Election Services as a Selected Source 80
Document 2: Proposal by McAfee Election Services for the 2011 Mayoral General Election 81

(THIS PAGE INTENTIONALLY LEFT BLANK)

1
BureauoftheBudgetandManagementResearch Andrew Kleine, Chief
Bureau of the Budget and Management Research 100 N. Holliday Street, Baltimore, MD 21202
January 30, 2013
The Honorable Mayor Rawlings‐Blake,
The Board of Elections is authorized by the Public General Laws of Maryland and is empowered to make rules
consistent with State laws to ensure the proper and efficient registration of voters and conduct of elections. Its
specific responsibilities include maintaining a voter registration database, recruiting and training poll workers,
obtaining polling places, providing the public with information about registration and elections, serving as the
local board of canvassers, and, if necessary, hearing and deciding challenges and appeals concerning voter
registration, right to vote, and absentee ballots.
This management research project on the Board of Elections was conducted upon your request for the purpose
of finding ways to improve the cost‐effectiveness conducting of elections. The authority to conduct this project
comes from the Finance Department’s charter mandate to provide measures which might be taken to improve
the organization and administration of City government. Key issues examined in this management research
project include: 1) the cost of daily operations of the Board of Elections, 2) the full cost of conducting an
election, 3) the current cost‐effectiveness of election administration, 4) alternatives to increase cost‐
effectiveness and the savings estimates for each of the alternatives, and 5) potential positive and negative
outcomes for each of the alternatives.
To determine the cost of the Board’s daily operations and the full cost of conducting an election, BBMR analyzed
financial transactions in Fiscal Years 2009, 2011, and 2012 and interviewed officials with operational knowledge
of the service. To determine cost‐effectiveness of the conduct of elections, BBMR compared Baltimore with
other cities using a set of performance indicators. To recommend alternatives to increase cost‐effectiveness and
to estimate savings for each alternative, other states’ and cities’ practices are taken into consideration and a
scenario analysis for each alternative is conducted. Potential positive and negative outcomes for each of the
alternatives are based upon the current knowledge of the City populations’ demographics and the outcomes
other states and cities experienced when implementing the alternatives.
BBMR conducted this management research project from July to November 2012 in accordance with the
standards set forth in the BBMR Project Management Guide and the BBMR Research Protocol. Those standards
require that BBMR plans and performs the research project to obtain sufficient and appropriate evidence to
provide a basis for the conclusions and recommendations contained in this report. BBMR believes that the
evidence obtained provides a reasonable basis for the findings and conclusions in this report and that such
findings and conclusions are based on research project objectives. More information on the scope and
methodologies of this project can be found in the appendices.

2
BACKGROUND
STATUTORY AUTHORITY AND HISTORY
Baltimore City was first given authority over the administration of elections in 1776 when the Constitution of
Maryland granted the sheriff of each county the authority to serve as the election judge. In 1799, county courts
were authorized to appoint election judges for each election district, and by 1805, court judges were to appoint
three election judges for each election district annually.1 In 1865, the Mayor and City Council of Baltimore City
were granted the responsibility of appointing election judges by the General Assembly.
The Board of Supervisors of Elections was created in 1888 and was given the authorities previous held by
election judges. The Board was appointed by the Governor and was renamed the Board of Elections in 1999.
The function of the Board of Elections (“the Board”) is to “oversee the conduct of all elections held in Baltimore
City and ensure that the elections process is conducted in an open, convenient, and impartial manner.” 2
Members of the board are appointed to four‐year terms by the Governor, with consent by the Maryland State
Senate. The Board was originally comprised of three members and two substitutes. Membership of the Board
was changed to five members and no substitutes as of June 2011.
Timeline of the Conduct of Elections in Baltimore City
1776 The Constitution of Maryland granted authority to the sheriff of each Maryland county to serve as election judge
1799 The Act of 1799 authorized county courts to appoint election judges for each election district 1865 The Act of 1865 granted the responsibility of appointing election judges to the Mayor and
City Council of Baltimore City 1882 Election Day first became a State holiday The Act of 1882 authorized the re‐division of Baltimore City into election precincts, wards,
and legislative districts 1888 The Board of Supervisors of Elections was created and given the authorities previous held by
election judges 1915 Baltimore City began operating under a charter form of government and was given the
authority to regulate elections 1969 Maryland State Board of Elections was created to direct, support, monitor, and evaluate the
activities of the local boards of elections in Maryland 1999 The Board of Supervisors of Elections was renamed the Board of Elections 2002 The State Board began overseeing the upgrade and standardization of voting systems and
election procedures statewide. Baltimore stopped owning its own voting system and started leasing it from the State Board in 2006
2010 Statewide administration of early voting and absentee voting
1 Chapter 97, Act of 1805 2 From “Code Election Law Article, sec. 2‐202.”

3
ELECTION CYCLE
Baltimore City has been conducting off‐year elections with the elections of City officials falling on an odd‐
numbered year. Baltimore City Council Bill 12‐0023 was introduced in June 2012 to amend the charter, upon
voters’ approval, such that the election of the Mayor, the City Council, and the Comptroller would be held in
November 2016 and on the same date in every succeeding fourth year.
The amendment reduces the number of elections from six elections to four elections (including both primary
and general elections) every four years. It is estimated that the amendment would increase voter turnout and
reduce expenditures related to conducting elections by approximately $4 million every four years.
Table 1: Election Cycles
The2008ElectionCycle The2016ElectionCycleYear 1 Presidential Primary and General Mayoral and Presidential Primary and General
Year 2 No Election No Election
Year 3 Gubernatorial Primary and General Gubernatorial Primary and General
Year 4 Mayoral Primary and General No Election
RESPONSIBILITIES OF THE BOARD OF ELECTIONS
The Board of Elections is authorized by the Public General Laws of Maryland and is empowered to make rules
consistent with State laws to ensure the proper and efficient registration of voters and conduct of elections. The
responsibilities of the Board of Elections are separated into four categories: pre‐election, on Election Day, post‐
election, and routine responsibilities.
Pre‐Election Responsibilities
Facilitate Voter Registration
The Board facilitates voter registration using the Maryland Centralized Voting System (MDVoters). The system is
part of the statewide voter registration system and allows the Board to verify voters’ information and update
registration records. The Board confirms voter registration by mailing voter notification cards to registered
voters. There were 334,852 registered voters in Baltimore City in April 2012.
Recruit and Train Poll Workers3
The Board recruits and trains around 2,000 election judges and 300 voting machine technicians for each
election.4 There are four types of judges: chief judges, book judges, voting unit judges, and provisional ballot
judges. Chief judges are the supervisory officials and are responsible for checking the polling place before
Election Day, supervising the opening and closing of the polls, demonstrating the voting system, and returning
supplies needed to conduct the election. Book judges are responsible for verifying the registration of each voter
requesting a ballot and issuing voter authority cards and ballots. Voting unit judges are responsible for verifying
3 Poll workers include both election judges and voting machine technicians. 4 The average number of poll workers in the last six elections was 2,145.
4
ballots and voter authority card numbers and monitoring activities around the voting units. Provisional ballot
judges are mainly responsible for issuing provisional ballots.
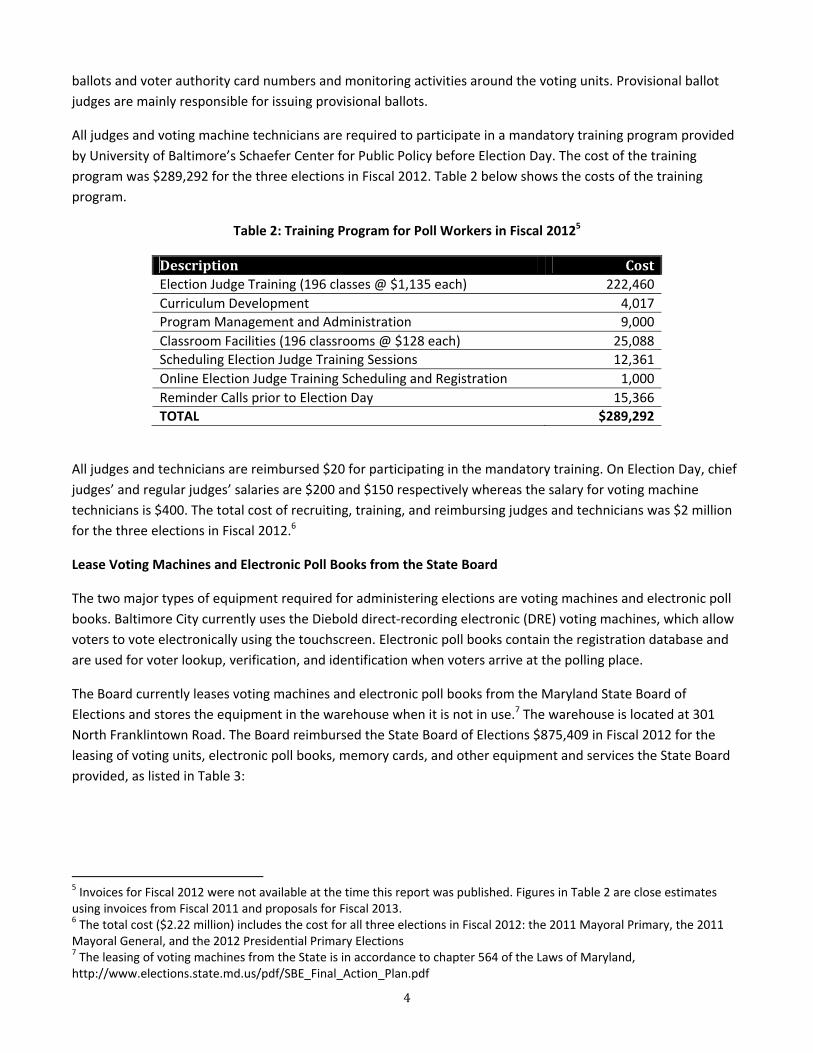
All judges and voting machine technicians are required to participate in a mandatory training program provided
by University of Baltimore’s Schaefer Center for Public Policy before Election Day. The cost of the training
program was $289,292 for the three elections in Fiscal 2012. Table 2 below shows the costs of the training
program.
Table 2: Training Program for Poll Workers in Fiscal 20125
Description CostElection Judge Training (196 classes @ $1,135 each) 222,460
Curriculum Development 4,017
Program Management and Administration 9,000
Classroom Facilities (196 classrooms @ $128 each) 25,088
Scheduling Election Judge Training Sessions 12,361
Online Election Judge Training Scheduling and Registration 1,000
Reminder Calls prior to Election Day 15,366
TOTAL $289,292
All judges and technicians are reimbursed $20 for participating in the mandatory training. On Election Day, chief
judges’ and regular judges’ salaries are $200 and $150 respectively whereas the salary for voting machine
technicians is $400. The total cost of recruiting, training, and reimbursing judges and technicians was $2 million
for the three elections in Fiscal 2012.6
Lease Voting Machines and Electronic Poll Books from the State Board
The two major types of equipment required for administering elections are voting machines and electronic poll
books. Baltimore City currently uses the Diebold direct‐recording electronic (DRE) voting machines, which allow
voters to vote electronically using the touchscreen. Electronic poll books contain the registration database and
are used for voter lookup, verification, and identification when voters arrive at the polling place.
The Board currently leases voting machines and electronic poll books from the Maryland State Board of
Elections and stores the equipment in the warehouse when it is not in use.7 The warehouse is located at 301
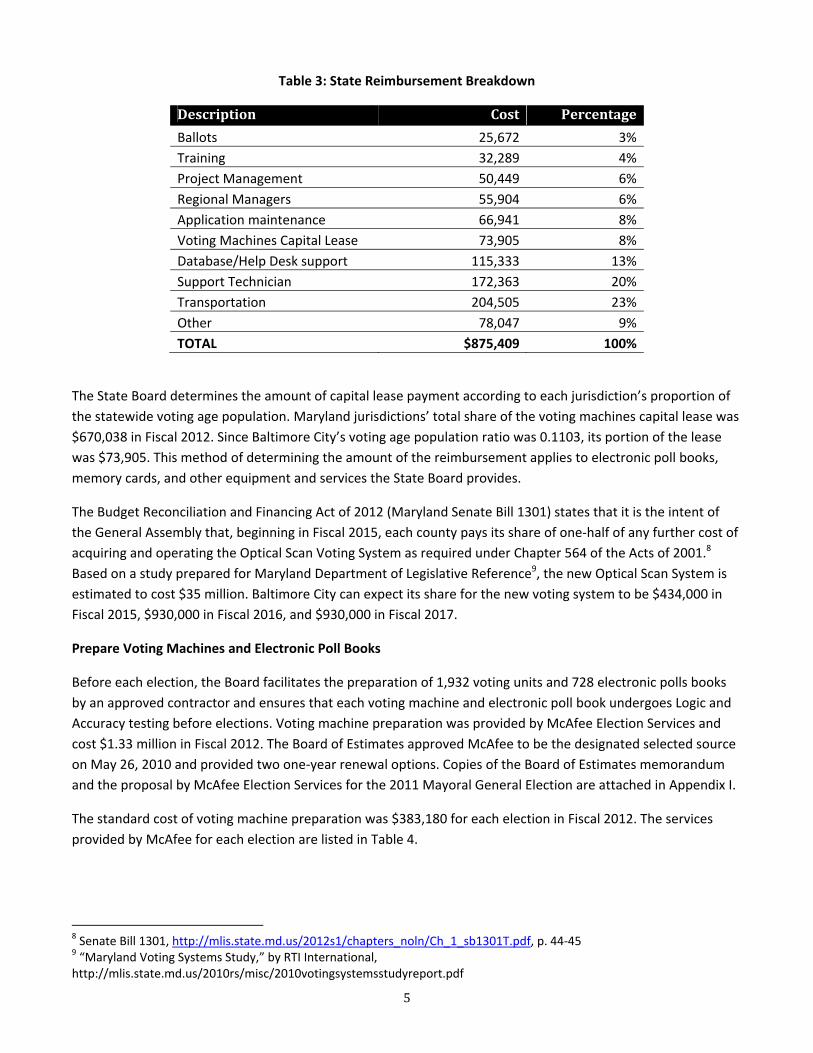
North Franklintown Road. The Board reimbursed the State Board of Elections $875,409 in Fiscal 2012 for the
leasing of voting units, electronic poll books, memory cards, and other equipment and services the State Board
provided, as listed in Table 3:
5 Invoices for Fiscal 2012 were not available at the time this report was published. Figures in Table 2 are close estimates using invoices from Fiscal 2011 and proposals for Fiscal 2013. 6 The total cost ($2.22 million) includes the cost for all three elections in Fiscal 2012: the 2011 Mayoral Primary, the 2011 Mayoral General, and the 2012 Presidential Primary Elections 7 The leasing of voting machines from the State is in accordance to chapter 564 of the Laws of Maryland, http://www.elections.state.md.us/pdf/SBE_Final_Action_Plan.pdf
5
Table 3: State Reimbursement Breakdown
Description Cost Percentage
Ballots 25,672 3%
Training 32,289 4%
Project Management 50,449 6%
Regional Managers 55,904 6%
Application maintenance 66,941 8%
Voting Machines Capital Lease 73,905 8%
Database/Help Desk support 115,333 13%
Support Technician 172,363 20%
Transportation 204,505 23%
Other 78,047 9%
TOTAL $875,409 100%
The State Board determines the amount of capital lease payment according to each jurisdiction’s proportion of
the statewide voting age population. Maryland jurisdictions’ total share of the voting machines capital lease was
$670,038 in Fiscal 2012. Since Baltimore City’s voting age population ratio was 0.1103, its portion of the lease
was $73,905. This method of determining the amount of the reimbursement applies to electronic poll books,
memory cards, and other equipment and services the State Board provides.
The Budget Reconciliation and Financing Act of 2012 (Maryland Senate Bill 1301) states that it is the intent of
the General Assembly that, beginning in Fiscal 2015, each county pays its share of one‐half of any further cost of
acquiring and operating the Optical Scan Voting System as required under Chapter 564 of the Acts of 2001.8
Based on a study prepared for Maryland Department of Legislative Reference9, the new Optical Scan System is
estimated to cost $35 million. Baltimore City can expect its share for the new voting system to be $434,000 in
Fiscal 2015, $930,000 in Fiscal 2016, and $930,000 in Fiscal 2017.
Prepare Voting Machines and Electronic Poll Books
Before each election, the Board facilitates the preparation of 1,932 voting units and 728 electronic polls books
by an approved contractor and ensures that each voting machine and electronic poll book undergoes Logic and
Accuracy testing before elections. Voting machine preparation was provided by McAfee Election Services and
cost $1.33 million in Fiscal 2012. The Board of Estimates approved McAfee to be the designated selected source
on May 26, 2010 and provided two one‐year renewal options. Copies of the Board of Estimates memorandum
and the proposal by McAfee Election Services for the 2011 Mayoral General Election are attached in Appendix I.
The standard cost of voting machine preparation was $383,180 for each election in Fiscal 2012. The services
provided by McAfee for each election are listed in Table 4.
8 Senate Bill 1301, http://mlis.state.md.us/2012s1/chapters_noln/Ch_1_sb1301T.pdf, p. 44‐45 9 “Maryland Voting Systems Study,” by RTI International, http://mlis.state.md.us/2010rs/misc/2010votingsystemsstudyreport.pdf

6
Table 4: Cost of Voting Machine Preparation for One Election
Description Calculations CostEARLY VOTING
Voting machine preparation (132 megabytes memory cards)
15 machines*6 locations @ $154.50 each 13,905
Electronic poll book preparation 3 books*6 locations @ $103 each 1,854
Technicians 12 hours*6 days*6 sites @ $82.40 each 35,597
Set up and break down at sites 6 sites @ $721 each 4,326
Early Voting Total $55,682
ELECTION DAY
Voting Machines preparation (32 megabytes memory cards)
1,842 machines @$133.90 each 246,643
Electronic poll book preparation 713 poll books @ $103 each 73,439
Nine trucks to deliver supplies 9 trucks@ $824 each 7,416
Election Day Total $327,498
TOTAL $383,180
With three elections in Fiscal 2012, the cost of voting machine preparation was $1.15 million.10 McAfee also
provided post‐election maintenance and battery replacement services, therefore driving the total cost of voting
machine maintenance up to $1.33 million in Fiscal 2012. The additional costs of post‐election maintenance and
battery replacement services are listed in Table 5:
Table 5: Costs of Post‐Election Maintenance and Battery Replacement in Fiscal 2012
Description Calculations CostPost‐election maintenance of voting machines
1,932 machines @ $36.05 each 69,469
Post‐election maintenance of electronic poll books
728 poll books @ $41.20 each 29,994
Replacement of batteries and software upgrades
728 units @ $45 each 32,760
Mock Election 240 hours @82.40 each 19,776
Hours for maintenance $400 hours @ 82.40 each 32,960
TOTAL $184,959
The cost of voting machine preparation by McAfee Election Services was $1.33 million in Fiscal 2012. Table 6
below shows the cost breakdown of voting machine preparation:
Table 6: Cost of Voting Machine Preparation in Fiscal 2012
Description Cost2011 Mayoral Primary 383,180
2011 Mayoral General 383,180
2012 Presidential Primary 383,180
Post‐Election Maintenance and Battery Replacement 184,959
TOTAL $1,334,499
10 Voting machine preparation in Fiscal 12=$383,180*3 elections=$1,149,540

7
Voting Machine preparation is a high cost component not only for Baltimore City but for other jurisdictions as
well. While this cost is necessary for the conduct of elections, BBMR recommends renegotiating the contract
with McAfee Election Services and determine if there is room for reduced costs.
Secures Polling Places and Early Voting Sites
The Board secures polling places and early voting sites and ensures that they comply with federal standards for
accessibility before each election. There is a rental fee of $350 for each of the private polling sites and a
custodian fee for each of the public polling sites, such as libraries and schools. The total cost of securing 57
private and 156 public polling sites was $121,237 in Fiscal 2012.
Provide the Public with Information about Registration and Elections The Board provides the public with information about registration and elections by mailing to eligible voting
populations provisional and absentee ballots, Election Day forms, voter’s cards, specimen ballots, voter
registration forms, early voting notifications, and guidelines on new voting systems. Additionally, the Board
prepares election materials, posters, contingency voter registration rosters, and contingency ballots before
Election Day and publishes on the Internet a list of proposed deletions of registrants from the voter registry no
later than 30 days before the close of registration prior to an election. The total cost of printing and mailing
ballots, voter’s cards, forms, and notifications was $105,652 in Fiscal 2012.
On Election Day
Prepare Polling Places
The Board staffs polling places with election judges and voting machine technicians and equips polling places
with tables, chairs, and voting machines on Election Day. If more than one precinct is located in a polling place,
the Board is responsible for separating the two precincts’ voting areas with signs and cordons so that voters
would be clearly directed to their respective voting areas. The cost of hauling tables and chairs to the polling
places was $17,811 in Fiscal 2012.
Provide and Process Absentee and Provisional Voting
The Board provides absentee voting for registered voters who are unable to get to a polling place on Election
Day or during early voting week, and no excuse is required for absentee voting. The Board facilitates absentee
voting by processing absentee requests from registered individuals (including armed forces, students, and
citizens out of state or country) and mails absentee ballots to those who request them.
The Board also provides provisional voting, a safeguard to ensure that individuals who claim they are registered
and eligible to vote will not be prevented from casting a ballot. Provisional ballots are provided on Election Day
and the Board is responsible for determining whether or not the individuals meet the criteria for their votes to
be counted.
Monitor Polling Places
The Board uses the Watch Center to coordinate the opening of polling places to ensure that all 213 polling
places and five early voting sites are opened on time on election morning and closed on time unless court‐

8
ordered extended hours are enforced. The Watch Center is staffed by representatives from the Board of
Elections, Baltimore City Police Department, Board of Education, Department of Public Works, and the Mayor’s
Office of CitiStat.
The Board also hires personnel from Baltimore City Police Department to deliver election materials and
electronic poll books to the polling places, to ensure the security of polling places, and to act as the Board of
Elections’ liaison if problems arise on Election Day. The total overtime costs of hiring Police personnel was
$98,400 in Fiscal 2012.
Arrange Transportation for Board members and Substitute Poll Workers
The Board hires the Yellow Cab Company to expedite the transportation of substitute elections judges and
voting machine technicians to the polling places. Taxi cabs are also used by Board Members and support staff to
visit and monitor polling places. The cost of hiring the Yellow Cab Company was $50,000 in Fiscal 2012.
Post‐Election
Canvassing of Votes and Other Post‐Election Responsibilities
The Board canvasses votes after each election and uploads the data to the GEM’s server after the canvassing of
votes is completed. The Board also certifies the results of the election, performs recounts, maintains election
records, and discards them in accordance with State and Federal law. Additionally, the Board hears and decides
challenges and appeals concerning voter registration, right to vote, and absentee ballots if necessary.
Routine Responsibilities
The Board’s routine responsibilities include maintaining a voter registration database, storing and maintaining
voting machines leased from the State Board of Elections, and reimbursing the State Board for payroll,
healthcare, retirement, voting system, and electronic poll books. The Board also maintains the warehouse,
works with BBMR to plan and monitor its budget, and reimburses the Mayor’s Office of Information Technology
for wiring, internet, and other support services. Table 7 below summarizes the Board of Elections’ four
categories of responsibilities:
Table 7: Board of Elections’ Responsibilities
Pre‐Election ElectionDay Post‐Election Facilitate voter registration
Recruit and train poll workers
Prepare voting units and electronic poll books
Secure polling places and early voting sites
Provide public with information
Prepare polling places
Provide absentee and provisional voting
Monitor polling places
Arrange transportation for Board members and substitute poll workers
Canvass and certify results
Perform recounts
Maintain election records
Hear appeals
RoutineResponsibilitiesMaintain voter registration database Store and maintain voting machines
Reimburse the State Board of Elections Maintain the warehouse Work with City agencies

9
Personnel
The Board of Elections currently has five board members who are funded by the City’s General Fund. Members
of the board are appointed to four‐year terms by the Governor, with consent by the Maryland State Senate.
There are also 34 state employees employed by the State Board of Elections. Baltimore City reimburses the
State Board approximately $1.3 million each year for the 34 Full‐Time Equivalent (FTE) employees. Table 8
summarizes the job titles and functions of the 34 state employees.
Table 8: Board of Elections State Employees
JobTitle TotalSalary
FTEs JobFunction(s)
Election Administration Officer 636,592 16 Assist election director
Supervise election clerks
Conduct studies and analyses of the program
Election Clerk 335,237 10 Register voters
Process absentee ballots
Compile and maintain voters' records
Election Data Application Specialist
141,384 4 Perform data entry
Election Deputy Director 69,974 1 Assist Election Director
Oversee day‐to‐day operations
Election Director 78,718 1 Direct elections
Supervise election staff
Election Information System Specialist
86,165 2 Coordinate, maintain, and troubleshoot election information systems
TOTAL $1,348,070 34
PRIORITY OUTCOME AND PERFORMANCE MEASURES
Priority Outcome
The conduct of elections is closely related the priority outcome of Innovative Government. Specifically, high
cost‐effectiveness of election administration can:
Increase the percentage of internal and external customers very satisfied with City services and business
functions (by increasing voters’ satisfaction)
Reduce the City’s Space Utilization Costs (by increasing utilization of polling places)
Increase citizens’ accessibility to City services (by increasing accessibility of polling places)
Performance Measures
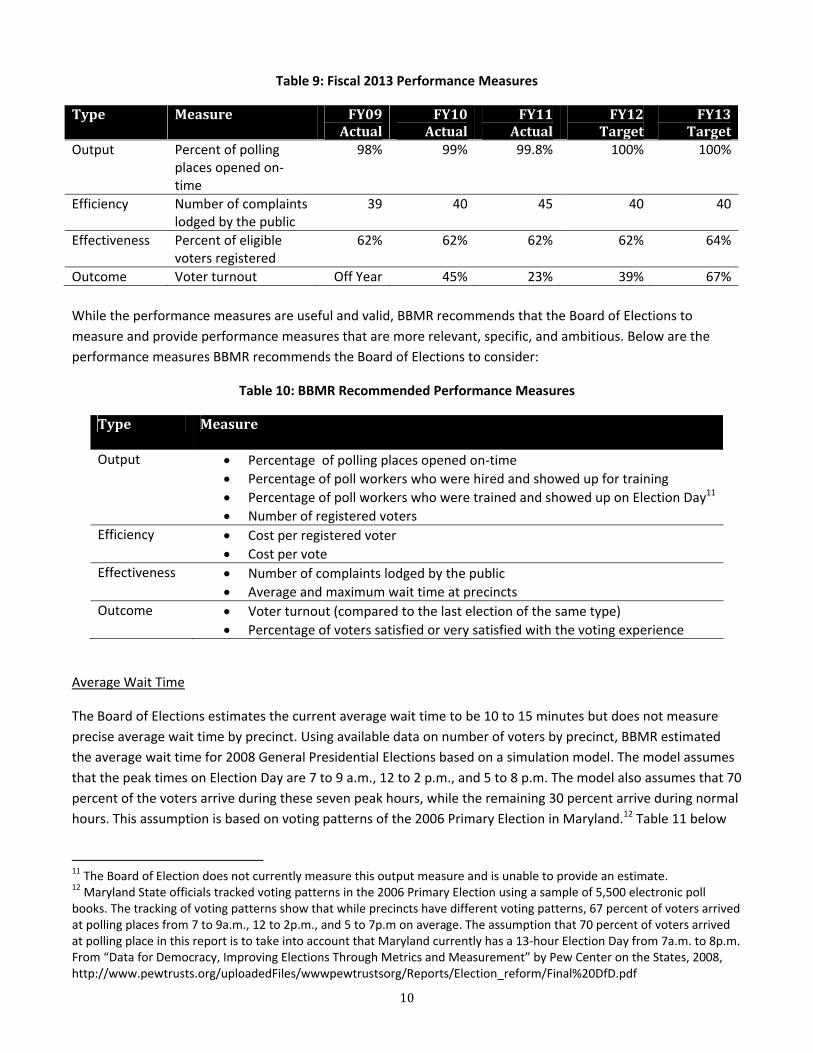
In preparation for the planning of the Fiscal 2013 budget, the Board of Elections provided performance
measures in its budget proposal, as shown in Table 9. The percentage of polling places opened on‐time and the
percentage of eligible voters registered remained stable from Fiscal 2009 through Fiscal 2011. Voter turnout
fluctuated depending on the type of election, and the number of complaints lodged by the public slightly
increased from 39 in Fiscal 2009 to 45 in Fiscal 2011.
10
Table 9: Fiscal 2013 Performance Measures
Type Measure FY09Actual
FY10Actual
FY11Actual
FY12Target
FY13Target
Output Percent of polling places opened on‐time
98% 99% 99.8% 100% 100%
Efficiency Number of complaints lodged by the public
39 40 45 40 40
Effectiveness Percent of eligible voters registered
62% 62% 62% 62% 64%
Outcome Voter turnout Off Year 45% 23% 39% 67%
While the performance measures are useful and valid, BBMR recommends that the Board of Elections to
measure and provide performance measures that are more relevant, specific, and ambitious. Below are the
performance measures BBMR recommends the Board of Elections to consider:
Table 10: BBMR Recommended Performance Measures
Type Measure
Output Percentage of polling places opened on‐time
Percentage of poll workers who were hired and showed up for training
Percentage of poll workers who were trained and showed up on Election Day11
Number of registered voters
Efficiency Cost per registered voter
Cost per vote
Effectiveness Number of complaints lodged by the public
Average and maximum wait time at precincts
Outcome Voter turnout (compared to the last election of the same type)
Percentage of voters satisfied or very satisfied with the voting experience
Average Wait Time
The Board of Elections estimates the current average wait time to be 10 to 15 minutes but does not measure
precise average wait time by precinct. Using available data on number of voters by precinct, BBMR estimated
the average wait time for 2008 General Presidential Elections based on a simulation model. The model assumes
that the peak times on Election Day are 7 to 9 a.m., 12 to 2 p.m., and 5 to 8 p.m. The model also assumes that 70
percent of the voters arrive during these seven peak hours, while the remaining 30 percent arrive during normal
hours. This assumption is based on voting patterns of the 2006 Primary Election in Maryland.12 Table 11 below
11 The Board of Election does not currently measure this output measure and is unable to provide an estimate. 12 Maryland State officials tracked voting patterns in the 2006 Primary Election using a sample of 5,500 electronic poll books. The tracking of voting patterns show that while precincts have different voting patterns, 67 percent of voters arrived at polling places from 7 to 9a.m., 12 to 2p.m., and 5 to 7p.m on average. The assumption that 70 percent of voters arrived at polling place in this report is to take into account that Maryland currently has a 13‐hour Election Day from 7a.m. to 8p.m. From “Data for Democracy, Improving Elections Through Metrics and Measurement” by Pew Center on the States, 2008, http://www.pewtrusts.org/uploadedFiles/wwwpewtrustsorg/Reports/Election_reform/Final%20DfD.pdf

11
summarizes the distribution of the number of voters per hour at a polling place using the actual data from
elections.
Table 11: Voters’ Arrival Rates (Voters per Hour) at Polling Place
PeakTimesArrivalRate NormalTimesArrivalRate
Range Election Year Election Year
2008 2010 2011 2008 2010 2011
Minimum Number of Voters per Hour
7 7 3 3 4 2
Maximum Number of Voters per Hour
251 159 84 126 79 42
Average Number of Voters per Hour
85 57 26 43 28 13
Using a simulation model according to the station flow of Chart 1 below, the average wait time during peak
hours of the 2008 General Election was 16 minutes with six voting machines at the polling place. Average wait
time for the 2010 and 2011 elections were significantly shorter because of lower turnouts, as shown in Table 11.
Chart 1: Voting Station Flow
Table 12 shows the probability of arrival rates and service times of registration check and voting used in the
simulations of previous elections:
Table 12: Service Times of Registration Check and Voting
Probability RegistrationCheckServiceTimes(min)
VotingBoothServiceTimes(min)
0.3 1.5 3
0.4 2 6
0.3 2.5 9
Table 13 shows the average wait time using the simulation model. The model assumes that an average voter
takes between 1.5 to 2.5 minutes for registration check and between 3 to 9 minutes to vote at the voting
booths.
BBMR validated the data by sending two staff to a polling place on Election Day in November 2012. Two BBMR
staff went to precinct 22002 from 7a.m. to 9a.m. on November 6, 2012 and tallied the number of people arrived
and their service times. Two hundred and eighteen voters arrived during the two‐hour window and average
registration and voter service times were 1.5 and 4.5 minutes respectively. While the data collected is not

12
statistically representative, it validates the simulation model and shows that the assumptions built‐in to the
model is realistic. The Board of Elections also confirms that this estimation of average wait time is realistic and
reasonable. Details of the simulation model used to predict wait time are in Table 50 in Appendix I.
Table 13: Simulated Average Wait Time for Six Voting Machines (3 to 9 Minutes Voting Time)
2008PresidentialGeneral
2010GubernatorialGeneral
2011MayoralPrimary
Voter Turnout 68.21% 48.16% 24.58%
Average Peak Hours Wait Time 16 minutes 2 minutes <1 minute
Average Normal Hours Wait Time <1 minute <1 minute <1 minute
Average wait time can be longer when there are more ballot questions. If voters take between 5 and 15 minutes
to vote because of an increased number of ballot questions, average wait time can increase to two hours during
peak hours with a 70 percent voter turnout. While it is unlikely that voters would take up to 15 minutes to
vote, the limited capacity of voting stations to cope with unexpected fluctuations in voter numbers or voting
time has been a major issue in many states. 13 Using the simulation model, Chart 2 shows the average wait time
during peak hours for an election with a 70 percent turnout using a range of average voting times:
Chart 2: Average Wait Time as a Function of Average Voting Time During Peak Hours
Election Day Notification Log
The Board of Elections keeps an Election Day Notification Log for each election. The notification log details all
the citizen complaints and inquiries as well as requests and notifications by poll workers and staff. Table 14
shows the categories and examples of notifications and complaints in the 2010 Gubernatorial General Election,
the 2011 Mayoral Primary Election, and the 2012 Presidential Primary Election.
13 From “Touchscreen Voting Machines Cause Long Lines and Disenfranchise Voters,” by William A. Edelstein and Arthur D. Edelstein, 2008, http://static.usenix.org/events/evt/tech/full_papers/Edelstein.pdf
0 09
50
90
135
180
0
20
40
60
80
100
120
140
160
180
200
0 2 4 6 8 10 12 14 16
Average
Wait Time (Minutes)
Average Voting Time (Minutes)
Relationship between Average Voting Time and Average Wait Time

13
Table 14: Election Day Notification Log
TypesofNotifications/Complaints
ExamplesofNotifications/Complaints
2010Gubernatorial
General
2011MayoralPrimary
2012PresidentialPrimary
Number Percentage Number Percentage Number Percentage
Election Judges Election Judge being late or not showing up
Insufficient Republican Judges
62 33% 70 47% 67 41%
Request for Supplies
Insufficient provisional ballots
Broken tables or chairs at polling places
65 35% 19 13% 28 17%
Polling Place Poll workers locked out of polling places before poll opens
Heat/AC not working property at polling places
19 10% 18 12% 15 9%
Challenger/Watcher Challengers did not have certifications
Challengers being too close to voting booths
9 5% 3 2% 0 0%
Voting Machines Voting machines not functioning
8 4% 4 3% 13 8%
Voter Registration Voters registered but were not found in Electronic Poll Books
7 4% 5 3% 2 1%
Provisional Ballots Voters had to vote using provisional ballots
4 2% 12 8% 5 3%
Absentee Ballots Inquiries about how to cast absentee ballots
3 2% 1 1% 1 1%
Voting Machine Technicians
Insufficient voting machine technicians
Technicians not being helpful 3 2% 2 1% 2 1%
Electronic Poll Books
Technical difficulties with Electronic Poll Books
1 1% 9 6% 16 10%
Other Complaints/ Inquiries
Inquiries about election judges’ lunch break
Inquiries about providing private booths for provisional voters
6 3% 7 5% 15 9%
TOTAL 187 100% 150 100% 164 100%
Table 14 shows that election judges were the most common type of notifications or complaints. Most of these
notifications concern election judges being late to polling places or not showing up. Other notifications related
to election judges include complaints regarding their behavior and attitude when assisting voters and requests
to staff polling places with more Republican judges. Request for supplies is the second most common type of
notifications or complaints. These notifications are made mostly because the polling place is short of provisional
ballots or other supplies.

E
T
s
T
t
m
c
w
Expenditures
The majority o
show the Boa
The Board of
the Board and
mainly for the
conduct of ele
warehouse re
by Activities
of the Board
rd of Election
Fiscal202011 May
2011 May
2012 Pres
Warehou
Daily Ope
TOTAL
Chart 3
Elections spe
d the mainten
e purpose of s
ections. Table
espectively:
COS
s
of Elections’ e
ns’ expenditu
Table 15
012Expendyoral Primary
yoral General
sidential Prim
use
erations at Do
: Expenditure
nt $749,792
nance of the w
storing voting
es 16 and 17 s
2012 PresidentPrimary30%
Wareho5%
FY12 Ex
ST OF OPERA
expenditures
res by activit
5: Expenditur
iturebyActy
l
mary
owntown Offi
es of the Boa
(11 percent o
warehouse, lo
g machines, e
show the bre
tial
use
Daily ODownt
xpenditures
14
ATIONS IN F
s are for the c
ies in Fiscal 2
res by Activit
tivities
ice
rd of Election
of total expen
ocated at 301
electronic pol
akdown of ex
201G
perations at town Office6%
s by the Boa
FISCAL 2012
conduct of ele
012:
ies in Fiscal 2
Cos 2,047,16
1,997,42
2,056,82
343,54
406,24
$6,904,08
ns in Fiscal 20
nditure) in Fis
1 North Frank
l books, and o
xpenditures o
2011 MPrim30
11 Mayoral General29%
rd of Electio
ections. Table
2012
st Percen65
28
26
47
45
82
012 by Activit
cal 2012 on t
klintown Road
other supplie
of the Downto
Mayoral mary0%
ons
e 15 and Char
ntage30%
29%
30%
5%
6%
100%
ties
the daily oper
d. The wareh
es necessary t
own office an
rt 3 below
rations of
ouse is
to the
nd the

15
Table 16: Board of Elections’ Expenditures at the Downtown Office
Fiscal2012DailyOperations’Expenditures Cost10% of Board members' Salary (5 Board Members)14 4,279
10% of Board members' Other Personnel Costs 1,582
10% of State Employees’ Salaries (34 State Employees) 154,194
Salaries for Temporary Employees 62,378
Office supplies 21,639
Office machines and furniture 17,457
Local Mileage and Subsistence Allowance 13,444
Municipal Telephone Exchange 26,000
Board membership (Maryland Association of Election Officials) 867
Stamps 28,747
Cable (Comcast) 783
Stamp machine 5,521
MOIT 69,355
TOTAL $406,245
Table 17: Board of Elections’ Expenditures at the Warehouse
Fiscal2012WarehouseExpenditures Cost
Voting Machines Maintenance 184,959
Salaries for Four Temporary Employees 46,698
Xerox copy machine 3,300
Waste management 1,039
Heating/AC servicing 10,542
Electrical work 6,656
Security Alarms 29,539
BGE/Constellation/Pepco Energy 59,119
Building maintenance 1,695
TOTAL $343,547
Election Administration Costs
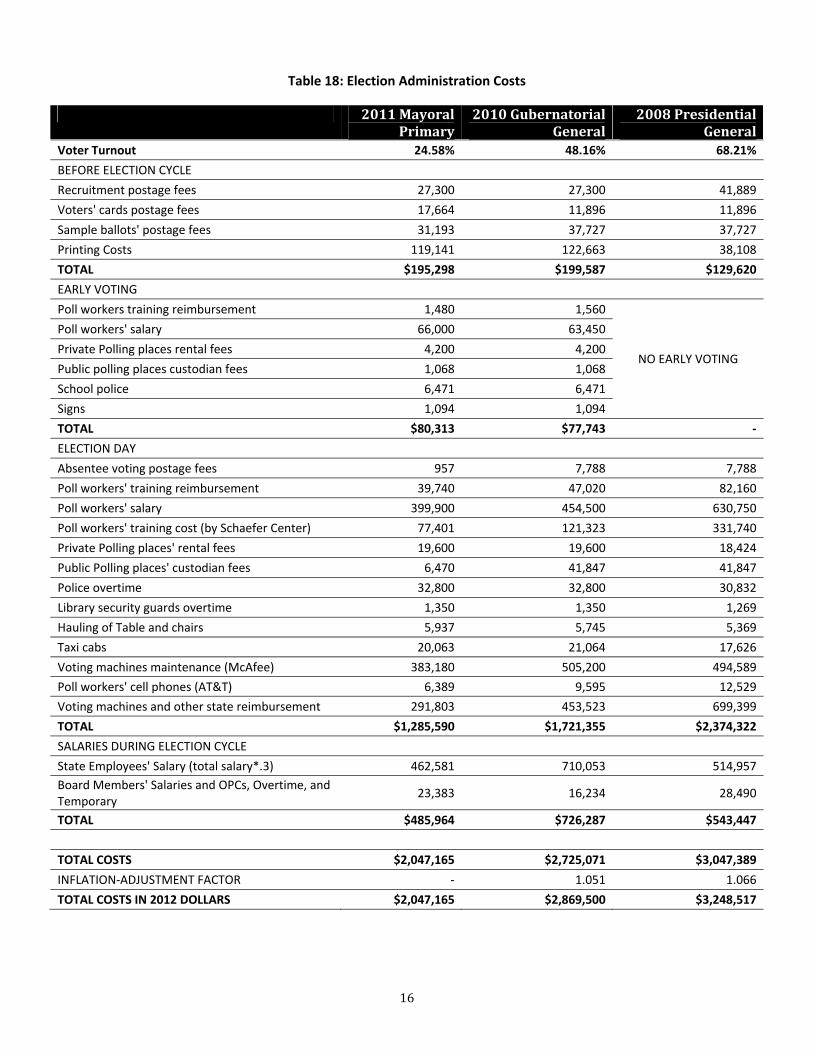
The cost of administering elections ranges from $2 to $3.2 million depending on the type of election, the
number of registered voters, and voter turnout. Table 18 below shows the costs of conducting the 2011 Mayoral
Primary, 2010 Gubernatorial General and 2008 Presidential General Elections15. Voter turnout figures are
obtained from the Maryland State Board of Elections and include absentee and provisional ballots. The election
cycle is from 45 days before to 10 days after Election Day. Historical voter turnout and costs of elections held
from 2008 to 2012 can be found in Tables 45 and 46 in Appendix I.
14 This report assumes that all employees spent 30 percent of their time on each of the three elections in Fiscal 2012 and 10 percent on the daily operations of the Board. 15 Because some cost figures of the 2008 Presidential General Election are unavailable or unreliable, selected data from the 2010 Gubernatorial General and 2011 Mayoral General Elections are used as the best substitutes.
16
Table 18: Election Administration Costs
2011MayoralPrimary
2010GubernatorialGeneral
2008PresidentialGeneral
Voter Turnout 24.58% 48.16% 68.21%
BEFORE ELECTION CYCLE
Recruitment postage fees 27,300 27,300 41,889
Voters' cards postage fees 17,664 11,896 11,896
Sample ballots' postage fees 31,193 37,727 37,727
Printing Costs 119,141 122,663 38,108
TOTAL $195,298 $199,587 $129,620
EARLY VOTING
Poll workers training reimbursement 1,480 1,560
NO EARLY VOTING
Poll workers' salary 66,000 63,450
Private Polling places rental fees 4,200 4,200
Public polling places custodian fees 1,068 1,068
School police 6,471 6,471
Signs 1,094 1,094
TOTAL $80,313 $77,743 ‐
ELECTION DAY
Absentee voting postage fees 957 7,788 7,788
Poll workers' training reimbursement 39,740 47,020 82,160
Poll workers' salary 399,900 454,500 630,750
Poll workers' training cost (by Schaefer Center) 77,401 121,323 331,740
Private Polling places' rental fees 19,600 19,600 18,424
Public Polling places' custodian fees 6,470 41,847 41,847
Police overtime 32,800 32,800 30,832
Library security guards overtime 1,350 1,350 1,269
Hauling of Table and chairs 5,937 5,745 5,369
Taxi cabs 20,063 21,064 17,626
Voting machines maintenance (McAfee) 383,180 505,200 494,589
Poll workers' cell phones (AT&T) 6,389 9,595 12,529
Voting machines and other state reimbursement 291,803 453,523 699,399
TOTAL $1,285,590 $1,721,355 $2,374,322
SALARIES DURING ELECTION CYCLE
State Employees' Salary (total salary*.3) 462,581 710,053 514,957
Board Members' Salaries and OPCs, Overtime, and Temporary
23,383 16,234 28,490
TOTAL $485,964 $726,287 $543,447
TOTAL COSTS $2,047,165 $2,725,071 $3,047,389
INFLATION‐ADJUSTMENT FACTOR ‐ 1.051 1.066
TOTAL COSTS IN 2012 DOLLARS $2,047,165 $2,869,500 $3,248,517

17
FINDINGS
COST‐EFFECTIVENESS IS NOT MAXIMIZED IN THE CONDUCT OF ELECTIONS
One way to measure cost‐effectiveness of the conduct of elections is to measure cost per vote. Baltimore City
spent $2.1 million to conduct the 2011 Mayoral Primary election with a 25 percent voter turnout. With 77,191
voters, cost per vote was $26.52. Although the cost of the 2008 Presidential General Election (inflation‐adjusted
to 2012 dollars) was higher, totaling $3.2 million, the high voter turnout reduces cost per vote to $12.94, 53
percent lower than cost per vote in the 2011 Mayoral Primary Election.
Table 19: Cost‐Effectiveness of the Conduct of Elections
2011 MayoralPrimary
2010 GubernatorialPrimary
2008PresidentialGeneral
Effectiveness Measures
Eligible Active voters 314,095 365,508 368,142
# of Votes Cast 77,191 164,556 251,127
Voter Turnout 24.58% 48.16% 68.21%
Maryland Voter Turnout N/A 54.02% 67.80%
Efficiency Measures
Number of Precincts 294 290 290
Cost of Election $2,047,165 $2,869,500 $3,248,517
Cost‐Effectiveness
Cost per Vote $26.52 $17.44 $12.94
Cost per vote increases when the number of votes decreases and/or when the cost of running an election
increases, as shown in Table 19. To examine the cost‐effectiveness of the conduct of elections in Baltimore City,
this report compares cost per registered voter and cost per vote of Baltimore City with that of other
jurisdictions.
All Maryland counties had two elections in Fiscal 2011—the Gubernatorial Primary and General Elections. Table
20 below shows each jurisdiction’s Fiscal 2011 budget and its cost per registered voter and cost per vote for the
2010 Gubernatorial General Election:
Table 20: Cost‐Effectiveness of Maryland Jurisdictions in the 2010 Gubernatorial General Election
FY11
BudgetCostperElection
#ofRegistered
Voters
#ofVotes
VoterTurnout
CostperRegistered
Voter
CostperVote
Baltimore City 6,567,223 3,283,612 365,508 164,556 45.02% $8.98 $19.95
Baltimore County 5,190,019 2,595,010 492,869 290,399 58.92% $5.27 $8.94
Anne Arundel 4,779,200 2,389,600 331,101 204,334 61.71% $7.22 $11.69
Montgomery 4,797,830 2,398,915 573,431 294,604 51.38% $4.18 $8.14
Prince George's 5,083,400 2,541,700 517,500 233,776 45.17% $4.91 $10.87
18
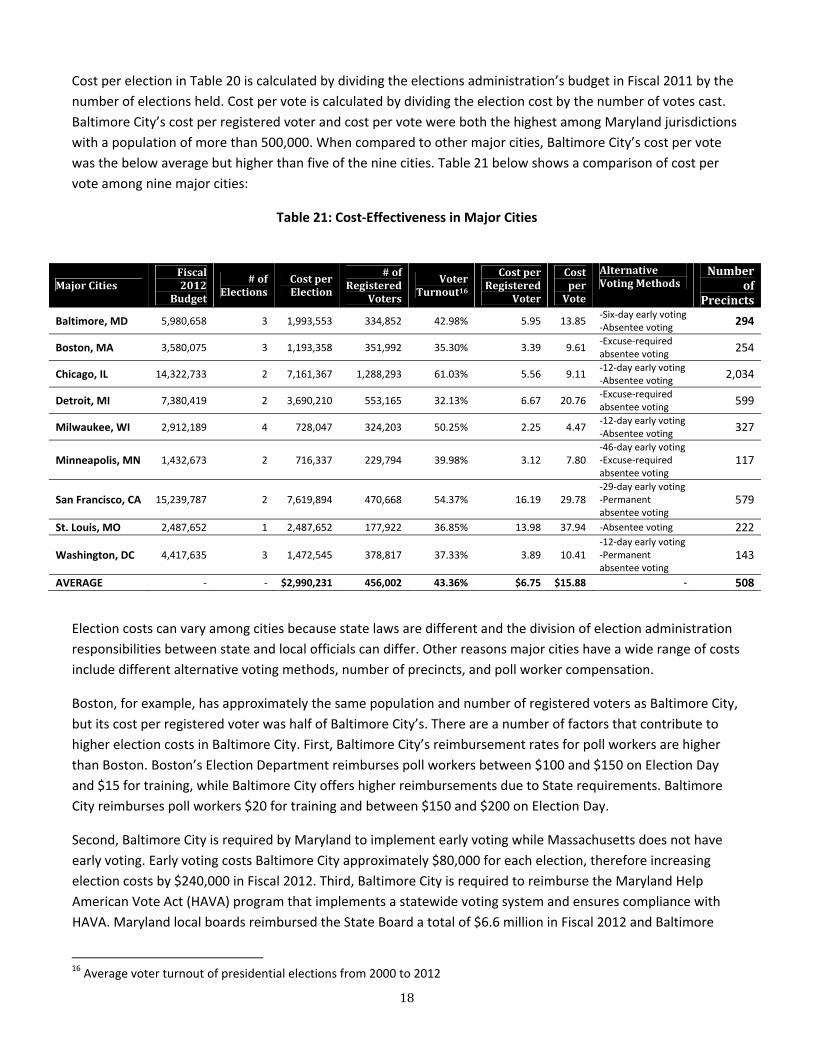
Cost per election in Table 20 is calculated by dividing the elections administration’s budget in Fiscal 2011 by the
number of elections held. Cost per vote is calculated by dividing the election cost by the number of votes cast.
Baltimore City’s cost per registered voter and cost per vote were both the highest among Maryland jurisdictions
with a population of more than 500,000. When compared to other major cities, Baltimore City’s cost per vote
was the below average but higher than five of the nine cities. Table 21 below shows a comparison of cost per
vote among nine major cities:
Table 21: Cost‐Effectiveness in Major Cities
MajorCitiesFiscal2012
Budget
#ofElections
CostperElection
#ofRegistered
Voters
VoterTurnout16
CostperRegistered
Voter
CostperVote
AlternativeVotingMethods
Numberof
Precincts
Baltimore, MD 5,980,658 3 1,993,553 334,852 42.98% 5.95 13.85 ‐Six‐day early voting‐Absentee voting
294
Boston, MA 3,580,075 3 1,193,358 351,992 35.30% 3.39 9.61 ‐Excuse‐required absentee voting
254
Chicago, IL 14,322,733 2 7,161,367 1,288,293 61.03% 5.56 9.11 ‐12‐day early voting‐Absentee voting
2,034
Detroit, MI 7,380,419 2 3,690,210 553,165 32.13% 6.67 20.76 ‐Excuse‐required absentee voting
599
Milwaukee, WI 2,912,189 4 728,047 324,203 50.25% 2.25 4.47 ‐12‐day early voting‐Absentee voting
327
Minneapolis, MN 1,432,673 2 716,337 229,794 39.98% 3.12 7.80 ‐46‐day early voting‐Excuse‐required absentee voting
117
San Francisco, CA 15,239,787 2 7,619,894 470,668 54.37% 16.19 29.78 ‐29‐day early voting‐Permanent absentee voting
579
St. Louis, MO 2,487,652 1 2,487,652 177,922 36.85% 13.98 37.94 ‐Absentee voting 222
Washington, DC 4,417,635 3 1,472,545 378,817 37.33% 3.89 10.41 ‐12‐day early voting‐Permanent absentee voting
143
AVERAGE ‐ ‐ $2,990,231 456,002 43.36% $6.75 $15.88 ‐ 508
Election costs can vary among cities because state laws are different and the division of election administration
responsibilities between state and local officials can differ. Other reasons major cities have a wide range of costs
include different alternative voting methods, number of precincts, and poll worker compensation.
Boston, for example, has approximately the same population and number of registered voters as Baltimore City,
but its cost per registered voter was half of Baltimore City’s. There are a number of factors that contribute to
higher election costs in Baltimore City. First, Baltimore City’s reimbursement rates for poll workers are higher
than Boston. Boston’s Election Department reimburses poll workers between $100 and $150 on Election Day
and $15 for training, while Baltimore City offers higher reimbursements due to State requirements. Baltimore
City reimburses poll workers $20 for training and between $150 and $200 on Election Day.
Second, Baltimore City is required by Maryland to implement early voting while Massachusetts does not have
early voting. Early voting costs Baltimore City approximately $80,000 for each election, therefore increasing
election costs by $240,000 in Fiscal 2012. Third, Baltimore City is required to reimburse the Maryland Help
American Vote Act (HAVA) program that implements a statewide voting system and ensures compliance with
HAVA. Maryland local boards reimbursed the State Board a total of $6.6 million in Fiscal 2012 and Baltimore
16 Average voter turnout of presidential elections from 2000 to 2012

19
City’s share was $875,409 in Fiscal 2012. Lastly, Baltimore has 40 more precincts than Boston, therefore
increasing costs related to poll worker reimbursements, rental of polling sites, and voting machines.
Washington, DC also has approximately the same population and number of registered voters as Baltimore City,
but its cost per registered voter was significantly lower than Baltimore City’s as well. The reason for lower
election costs in Washington, DC is because 1) Washington, DC’s poll workers reimbursement rates range
between $120 and $160 while Baltimore City’s reimbursement rates are $40 more, ranging from $150 to $200,
2) Washington, DC has a significantly lower number of precincts than that of Baltimore City, and 3) Washington,
DC hires about 500 fewer poll workers than Baltimore City does for each election.
This study also uses a scorecard to compare the operational efficiency of different cities. The efficiency
components used in this study include number of precincts per 1,000 units of population density, early voting
location and days, and the maximum poll worker reimbursement. Table 22 shows the scores for each efficiency
component, with ten being the highest score (most efficient) and zero being the lowest score (least efficient).
The balanced score is calculated by assigning equal weights to each efficiency component.
Table 22: Scorecard
NumberofPrecincts/1,000UnitsofPopulationDensity17
EarlyVotingLocationandDays
MaximumPollWorkerReimbursement
Score
Cities Number Score Location*Days Score18 Reimbursement Score
Baltimore, MD 38 3.8 6 sites*6 days 3.3 200 5.0 4.0
Boston, MA 20 7.3 N/A ‐ 150 6.7 7.0
Chicago, IL 171 0.8 3 sites*12 days 3.3 150 6.7 3.6
Detroit, MI 124 1.2 N/A ‐ 185 5.4 3.3
Milwaukee, WI 53 2.8 Municipal Building*12 days
10.0 100 10.0 7.6
Minneapolis, MN 17 8.8 City Hall*46 days 2.6 114 8.8 6.7
San Francisco, CA 33 4.4 City Hall*29 days 4.1 170 5.9 4.8
St. Louis, MO 43 3.4 N/A ‐ 195 5.1 4.2
Washington, DC 14 10.0 Judiciary Square*12 days
10.0 160 6.3 8.8
AVERAGE 57 4.7 ‐ 5.6 $158 6.6 5.6
The score takes operational efficiency factors into consideration, therefore allowing a more comprehensive
understanding of the efficiency of different cities. Table 22 shows that Boston, Milwaukee, and Washington, D.C.
are the most efficient in terms of their operations, with balanced scores of 7.0, 7.6, and 8.8 respectively. Detroit
and Chicago are the least efficient cities with the balanced scores of 3.3 and 3.6 respectively. Baltimore City
ranks below the average score of 5.6 with a balanced score of 4.0.
17 Population Density is calculated by dividing total population by land square miles. 18 Early voting score is calculated by multiplying the number of locations by the number of early voting days and converting the score to a ten‐point scale

20
To increase cost‐effectiveness, the cost of conducting an election needs to be reduced and/or voter turnout
needs to increase. In‐depth research of the conduct of elections in Baltimore City shows that low cost‐
effectiveness in conducting elections is due to several factors:
1. Polling places have more staff than necessary
2. There are more precincts and polling places than necessary
3. Low voter turnout
1. Polling Places Have More Staff Than Necessary
The Code of Maryland Regulations (“the Code”) currently requires each precinct to have a minimum of five poll
workers: two chief judges, two regular election judges, and one voting machine technician. In a precinct with
fewer than 200 registered voters, the Code allows the local board to provide two election judges for the
precinct.
Baltimore City had 290 precincts in the 2011 Mayoral Primary Election. Each precinct was staffed with between
three and 13 poll workers, adding up to a total of 1,987 poll workers with 146 poll workers who are substitute
judges, election night workers, and telephone operators. For all precincts, there were one voting machine
technician, two chief judges, and the rest were regular election judges.
The number of registered voters per election judge (including both chief judges and regular judges) at Baltimore
polling places ranged from 20 to 944, and the number of votes per election judges ranged from seven to 280. On
average, one election judge was hired for every 233 registered voters and 57 votes. Chart 4 shows the
distribution of the number of registered voters per election judge.
Chart 4: Distribution of the Number of Registered Voters per Election Judge
05
10
15
20
Pe
rcen
tage
(%
)
0 200 400 600 800 1000Number of Registered Voters per Election Judge
2011 Mayoral Primary ElectionNumber of Registered Voters per Election Judge
A
p
r
v
i
M
v
D
r
w
T
r
p
U
O
U
h
1
2
According to o
precinct is det
registered vot
votes per elec
n Chart 4. Th
Mayoral Prim
voters per ele
During the ea
rest regular ju
week.
The large rang
registered vot
precincts and
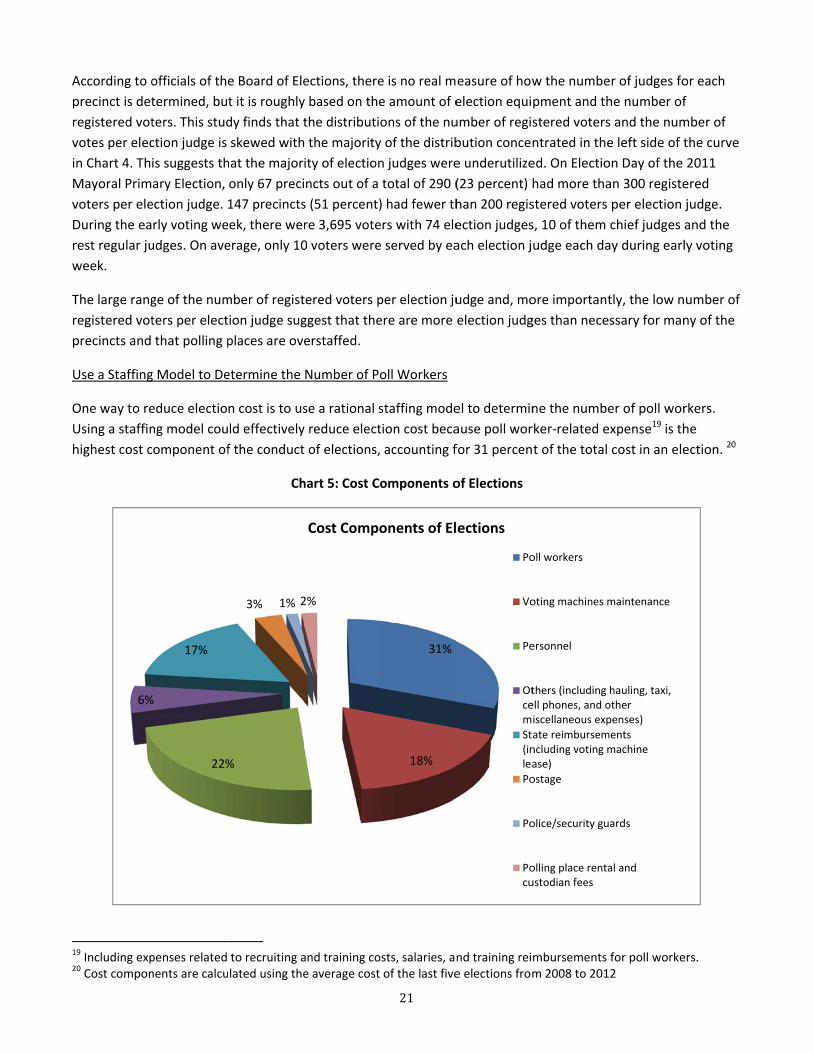
Use a Staffing
One way to re
Using a staffin
highest cost c
9 Including exp0 Cost compon
6%
officials of the
termined, bu
ters. This stud
ction judge is
is suggests th
ary Election,
ection judge. 1
rly voting we
udges. On ave
ge of the num
ters per elect
that polling p
g Model to De
educe electio
ng model cou
component of
penses related nents are calcu
22%
%
17%
e Board of Ele
t it is roughly
dy finds that t
skewed with
hat the major
only 67 preci
147 precincts
ek, there wer
erage, only 10
mber of regist
ion judge sug
places are ove
etermine the
n cost is to us
ld effectively
f the conduct
Ch
to recruiting alated using the
%
3% 1% 2
ections, there
y based on the
the distributi
the majority
ity of election
ncts out of a
s (51 percent)
re 3,695 vote
0 voters were
tered voters p
ggest that the
erstaffed.
Number of Po
se a rational s
y reduce elect
t of elections,
hart 5: Cost Co
and training coe average cost
2%
Cost Compo
21
e is no real m
e amount of e
ons of the nu
y of the distrib
n judges were
total of 290 (
) had fewer th
ers with 74 ele
e served by ea
per election ju
ere are more
oll Workers
staffing mode
tion cost beca
accounting f
omponents o
osts, salaries, anof the last five
31%
18%
onents of El
easure of how
election equi
umber of regi
bution conce
e underutilize
(23 percent)
han 200 regis
ection judges
ach election j
udge and, mo
election judg
el to determin
ause poll wor
for 31 percen
of Elections
nd training reie elections from
ections
Po
Vo
Pe
Otcem
St(inlea
Po
Po
Pocu
w the numbe
pment and th
stered voters
ntrated in the
ed. On Electio
had more tha
stered voters
s, 10 of them
udge each da
ore important
ges than nece
ne the numbe
rker‐related e
t of the total
mbursements m 2008 to 201
oll workers
oting machines m
ersonnel
thers (including ell phones, and oiscellaneous exp
ate reimbursemncluding voting mase)
ostage
olice/security gu
olling place rentaustodian fees
er of judges fo
he number of
s and the num
e left side of t
on Day of the
an 300 registe
per election
chief judges
ay during earl
tly, the low n
essary for man
er of poll wor
expense19 is th
cost in an ele
for poll worke12
maintenance
hauling, taxi,otherpenses)
mentsmachine
uards
al and
or each
f
mber of
the curve
2011
ered
judge.
and the
ly voting
umber of
ny of the
rkers.
he
ection. 20
ers.

22
To increase cost‐effectiveness, BBMR recommends the Board of Elections to use a staffing model to determine
the optimal number of poll workers for each precinct. Below are the steps BBMR recommends to estimate voter
turnout and the number of poll workers needed for each election.
Formula to Determine the Number of Poll Workers Needed
1. Calculate the percentage of votes at each precinct by dividing the number of votes at each precinct by
the total number of votes in the last ten elections and taking the average of the ten elections (Table 48
in Appendix I).
2. Estimate the overall voter turnout by taking the average of the last two elections of the same type plus a
contingency voter turnout of 5 percent (Table 48 in Appendix I).
3. Multiply voter turnout by the estimated percentage of votes to determine the estimated number of
votes at each precinct.
4. Maryland requires one voting machine for every 200 registered voters. Divide the number of registered
voters in each precinct by 200 to determine the number of voting machines needed at each precinct
5. Calculate the number of voters per voting machine.
6. Add a voting machine for precincts where the number of voters per voting machine is above the 90th
percentile. This can reduce average wait time for precincts with high voter turnout.
7. Maryland requires four election judges and one voting machine technician at each precinct. The number
of poll workers needed at each precinct=
4 judges + 1 voting machine technician + 1 additional judge for precincts with >10 voting machines
Even though overall voter turnout fluctuates depending on the type of election, as shown in Table 36 in
Appendix I, the percentage of votes at each precinct (number of votes at each precinct divided by total number
of votes) remains stable. Statistical tests show that the average percentage of the last 10 elections from 2006 to
2011 was a reasonably accurate predictor (98 percent confidence level) of the percentage of votes at each
precinct for the 2012 Presidential Election. Percentage of votes at each precinct in the last ten elections is shown
in Table 49 and details of the statistical tests of the model can be found in Table 47 in Appendix I.
Calculations for the 2011 Mayoral Primary Election
The model for estimating the number of poll workers needed is based on three factors: 1) the number of voting
machines, 2) the estimated percentage of votes at each precinct, and 3) the average voter turnout of the last
two elections of the same type. Table 23 shows how the number of poll workers for the 2011 Mayoral Primary
Election can be derived using the formula recommended:
Table 23: Estimated Number of Poll Workers for Election Day
Input Calculations OutputEstimated voter turnout [(38.57%+31.93%)/2]+5% 40.25%
Estimated number of votes 314,095*.4025 126,491
Number of voting machines 1 per every 200 registered voters 1,570
Number of additional voting machines for precincts with number of voters per voting machine above the 90th percentile
30
Total number of voting machines 1,570+30 1,600
Number of poll workers needed at each 2 regular judges+2 chief judges+ 1,461

23
precinct 1 voting machine tech + 1 additional judge for precincts with >10 voting machines
Total number of poll workers 1,461+100 substitute judges 1,561
Voter turnouts from the 2003 and 2007 Mayoral Primary data are used in the calculations. The 100 additional
poll workers are substitute judges that are needed to ensure polling places have adequate judges in cases when
election judges do not show up and/or when voter turnout is exceedingly high. Details of how the number of
poll workers is derived at each precinct are in Table 50 in Appendix I.
Using the model in Table 23, the number of voting machines is reduced from 1,686 to 1,600 and reduces the
number of poll workers on Election Day from 1,987 to 1,561. The 1,561 number of poll workers consist of 290
voting machine technician, 580 chief judges, 591 regular judges, and 100 substitute judges. A similar formula can
be applied to early voting week as well. Since early voting was not introduced in Baltimore City until 2010, only
historical data that dates back to 2010 was used:
Table 24: Estimated Number of Poll Workers of Early Voting Week
Input Calculations OutputNumber of votes/machines (as required by the state)
3,000/15 200
Number of election judges at each early voting site
2 chief judges + 1 voting machine tech +1 regular judge every 3 voting machines
8
Total number of poll workers for early voting
8 poll workers*5 sites 40
The Code states that the local board shall provide one voting unit for each 200 early voters at an early voting
center each day. The 15 voting machines are the number of voting machines Baltimore City currently uses for
each early voting site based on the number of votes estimated by the State Board.
Using the staffing model recommended by BBMR, the total number of poll workers would reduce from 2,061 to
1,601 for the 2011 Mayoral Primary Election. By reducing 426 poll workers on Election Day and 34 poll workers
during early voting week, the City would save $127,266 (6.22 percent).
Table 25: Savings Generated by Using New Staffing Model
ComponentCostBefore
UsingStaffingModel
CostAfterUsingStaffing
Model
PercentageChange
Poll workers 507,120 414,170 ‐18%
Training Costs 77,401 60,807 ‐21%
Postage 196,392 184,342 ‐6%
Polling place rental and custodian fees 31,338 31,338 0%
Police/security guards 40,621 40,621 0%
Voting machines lease payment and maintenance 383,180 383,180 0%
Other State reimbursements 291,803 291,803 0%
Personnel 485,964 485,964 0%
Others 33,346 27,674 ‐17%
TOTAL $2,047,165 $1,919,899 ‐6.22%

24
Reducing the number of election judges will not increase voters’ average wait time. The skewed distribution of
voters per election judge in Chart 6 shows that the efficiency of judges is currently not maximized because the
majority of the distribution is concentrated in the left side of the curve. The skewed distribution also implies that
there is an excessive amount of idle time with the number of election judges being employed currently.
Reducing the number of judges reduces the amount of idle time, therefore increasing productivity of the
election judges.
Chart 6: Number of Votes per Election Judge
One of the major concerns about reducing the number of poll workers is that the long queues during the
primary election in 2006 will happen again. The conduct of the September 2006 primary election was
disorganized in Maryland with long wait times because election judges did not show up, the delivery of supplies
was delayed, and electronic poll books were malfunctioning.21 After the election, the State Board did a major
investigation on the synchronization of electronic poll books and University of Baltimore’s Schaefer Center for
Public Policy was contracted for the recruitment and training of election judges in Baltimore City.22 The
likelihood that election judges do not show up on Election Day significantly reduces with the establishment of
the new recruitment and training programs. Additionally, too few election judges were employed for the 2006
primary election. The formula in Table 23 would require the hiring of 1,516 poll workers for that election instead
of the 1,375 who were employed.
21 From Minutes of the Maryland State Board Meeting, November 28, 2006. 22 From “In search of Decent Judges,” Baltimore Sun, September 15, 2006.
05
10
15
20
Pe
rcen
tage
(%
)
0 100 200 300Number of Votes per Election Judge
2011 Mayoral Primary ElectionNumber of Votes per Election Judge

25
2. More Precincts and Polling Places than Necessary
In 2012, there were 294 precincts and 213 polling places. There can be multiple precincts in one polling place,
and different precincts are separated within the polling place by cordons and signs. The Code requires each
precinct to be staffed with at least four election judges and one voting machine technician regardless of voter
turnout and at least one voting unit needs to be provided for every 200 registered voters and one electronic poll
book needs to be provided for every 550 registered voters.
In the 2011 Mayoral Primary Election, Enoch Pratt Library (a polling place) housed two precincts (precincts
12004 and 12005). The east side was designated for precinct 12004 and the west side was designated for
precinct 12005. The polling place was staffed with a total of at least eight election judges with at least four
judges at each precinct. The large number of precincts and polling places in Baltimore City significantly increases
the cost of conducting an election and reduces cost‐effectiveness.
When compared to other Maryland jurisdictions, the number of polling places per 100,000 population in
Baltimore City was 34.3 in 2012, 6.26 (22 percent) higher than the statewide average. The number of precincts
and polling places per square mile were 15 and 19 times higher than the statewide average respectively, while
population per square mile was only 13 times higher than the statewide average. This suggests that Baltimore
City has a disproportionately high number of precincts and polling places per square mile compared to other
Maryland jurisdictions.
Table 26: Precincts and Polling Places in April 2012
County PrecinctsPollingPlaces
PopulationLandarea(sq.miles)
PopulationperSq.Mile
#ofPrecinctsperSq.Mile
#ofPollingPlacesperSq.Mile
#ofPollingPlacesper100,000
Population
Allegany 36 36 75,087 424.16 177 0.08 0.08 47.94
Anne Arundel 189 157 537,656 414.9 1,296 0.46 0.38 29.20
Baltimore City 294 213 620,961 80.94 7,672 3.63 2.63 34.30
Baltimore County
227 201 805,029 598.3 1,346 0.38 0.34 24.97
Calvert 23 23 88,737 213.15 416 0.11 0.11 25.92
Caroline 8 8 33,066 319.42 104 0.03 0.03 24.19
Carroll 35 33 167,134 447.6 373 0.08 0.07 19.74
Cecil 19 17 101,108 346.27 292 0.05 0.05 16.81
Charles 43 43 146,551 457.75 320 0.09 0.09 29.34
Dorchester 31 20 32,618 540.77 60 0.06 0.04 61.32
Frederick 79 70 233,385 660.22 353 0.12 0.11 29.99
Garrett 19 18 30,097 647.1 47 0.03 0.03 59.81
Harford 76 73 244,826 437.09 560 0.17 0.17 29.82
Howard 111 88 287,085 250.74 1,145 0.44 0.35 30.65
Kent 10 9 20,197 277.03 73 0.04 0.03 44.56
Montgomery 238 230 971,777 491.25 1,978 0.48 0.47 23.67

26
Prince George's
235 220 863,420 482.69 1,789 0.49 0.46 25.48
Queen Anne's 16 16 47,798 371.91 129 0.04 0.04 33.47
St. Mary's 31 27 105,151 357.18 294 0.09 0.08 25.68
Somerset 23 12 26,470 319.72 83 0.07 0.04 45.33
Talbot 12 9 37,782 268.54 141 0.04 0.03 23.82
Washington 54 48 147,430 457.78 322 0.12 0.10 32.56
Wicomico 38 30 98,733 374.44 264 0.10 0.08 30.38
Worchester 18 18 51,454 468.28 110 0.04 0.04 34.98
Maryland 1,865 1,626 5,773,552 9,707.23 595 0.19 0.17 28.04
When compared to other major cities, the number of precincts per 1,000 units of population density in
Baltimore City was the fifth among the ten cities, following Chicago, Detroit, Milwaukee, and St. Louis.
Table 27: Comparison among Cities
Numberof
Precincts
Landarea
(sq.mile)Population
PopulationDensity
(Population/sq.Mile)
NumberofPrecinctsperSq.Mile
NumberofPrecincts/100,000
Population
NumberofPrecincts/
1,000unitsofPopulation
DensityBaltimore 294 80.94 620,961 7,672 3.63 47.35 38.32
Boston, MA 254 48.28 617,594 12,792 5.26 41.13 19.86
Chicago, IL 2,034 227.63 2,707,120 11,893 8.94 75.14 171.03
Detroit, MI 599 138.75 706,585 6,220 4.32 84.77 123.51
Milwaukee, WI 327 96.12 597,867 6,220 3.40 54.69 52.57
Minneapolis, MN 117 53.97 382,578 7,089 2.17 30.58 16.51
Richmond, VA 65 59.81 204,214 3,414 1.09 31.83 19.04
St. Louis, MO 222 61.91 318,069 5,138 3.59 69.80 32.69
San Francisco, CA 567 46.87 812,826 17,342 12.10 69.79 43.21
Washington, DC 143 61 601,723 9,864 2.34 23.77 14.50
Baltimore City’s high number of precincts and polling places per square mile and per 100,000 population when
compared with other Maryland jurisdictions and other major cities suggests that 1) the number of precincts and
polling places are higher than necessary and 2) polling places are not used in ways that maximize the use of
resources. Map 1 shows the 213 polling places in Baltimore City in 2012. Polling places were on average 0.62
miles away from each other.

27
Map 1: Polling places in Baltimore City in 2012
Co‐Locate Additional Precincts
One alternative to maximize the use of each polling places is to co‐locate additional precincts. Co‐locating
precincts means there would be more than one precinct at one polling place. The Code of Maryland states that a
polling place must be in the precinct that it serves unless no suitable location can be found within that precinct,

28
in which case the Board may establish the polling place in an adjacent precinct. Baltimore City would need to
have further discussions with the State if this alternative is to be implemented to ensure that co‐locating
precincts is in accordance with State law.
If precincts were co‐located, citizens from different precincts would go to the same polling place on Election
Day, and there would be different entry lines for citizens from different precincts. According to the list of polling
places in 2012, there were 34.3 polling places per 100,000 populations in Baltimore and polling places were on
average 0.62 miles away from each other23. If Baltimore City co‐locates precincts using the statewide average of
28 polling places per 100,000 population, there would still be 294 precincts but only 174 polling places. The
average distance between each location would increase from 0.62 to 0.68 miles.
By co‐locating precincts, there would only be minimal savings in any rental and custodian costs because some of
the savings would be offset by the extra cost of renting larger polling places. There will also be extra costs
related to programming voting machines to accommodate voters from more than one precinct. However, there
would be significant savings generated from fewer election judges and security guards, lower costs associated
with the hauling of tables and chairs and taxi cabs, and lower recruitment postage fees with fewer judges. Table
28 below shows the cost before and after co-locating precincts for the 2011 Mayoral Primary Election. The
estimated savings includes savings generated from reducing the number of poll workers.
Table 28: Cost Before and After Co‐Location of Precincts
Component CostBeforeCo‐Location
CostAfterCo‐Location
PercentageChange
Poll workers 507,120 414,970 ‐18%
Training Costs 77,401 60,807 ‐21%
Postage 196,392 178,185 ‐9%
Polling place rental and custodian fees 31,338 27,201 ‐13%
Police/security guards 40,621 33,183 ‐18%
Voting machines lease payment and maintenance 383,180 383,180 0%
Other State reimbursements 291,803 291,803 0%
Personnel 485,964 485,964 0%
Others 33,346 26,587 ‐20%
TOTAL $2,047,165 $1,901,080 ‐7.14%
Table 28 shows that the cumulative savings of reducing the number of poll workers to 1,561 and providing 174
polling places instead of the original 213 places is $146,085, a 7.14 percent decrease from the current cost. The
cost estimate for the co‐location scenario includes additional costs in obtaining larger polling sites, and the
additional savings compared to the scenario of reducing poll workers come from savings related to security
guards and police, the hauling of equipment, printing costs, postage, and taxi fees.
Cost savings in the co‐location of precincts is driven by the reduced number of poll workers. If the number of
poll workers remains unchanged from current practice, co‐locating precincts would only save one percent of
total election costs.
23 Distance between polling locations=(80.94 sq. miles/213 locations)^.5=0.62

29
Table 29: Cost Before and After Co‐Location of Precincts without Staffing Change
ComponentCostBeforeCo‐Location
CostAfterCo‐Location
PercentageChange
Poll workers 507,120 507,120 0%
Training Costs 77,401 77,401 0%
Postage 196,392 190,235 ‐3%
Polling place rental and custodian fees 31,338 27,201 ‐13%
Police/security guards 40,621 33,183 ‐18%
Voting machines lease payment and maintenance 383,180 383,180 0%
Other State reimbursements 291,803 291,803 0%
Personnel 485,964 485,964 0%
Others 33,346 32,259 ‐3%
TOTAL $2,047,165 $2,028,346 ‐1%
Chart 7: Co‐Locating Additional Precincts
Co‐locating precincts will not increase average wait time because the same number of voting machines and
election judges are used. Co‐locating precincts, however, may reduce the accessibility of polling places and thus
lower voter turnout. To increase voter turnout, BBMR recommends the Board of Elections to examine the
feasibility of coordinating transportation for voters who are unable to access polling places due to
inconveniences related to transportation. More detailed discussions of the use of transportation and health care
facilities coordinators to increase voter turnout can be found later in the report.
Consolidation of Entry Lines
If precincts were co‐located, citizens from different precincts would go to the same polling place designated for
those precincts on Election Day, but there would be different entry lines for citizens from different precincts and
each precinct would have its own set of election judges and voting units. By consolidating entry lines of co‐
Reduce 460 Poll Workers
(Saves $127,266)
Savings Related to Co‐Location of
Precincts
(Saves $18,819)
Co‐Locate Additional Precincts (Saves $146,085)
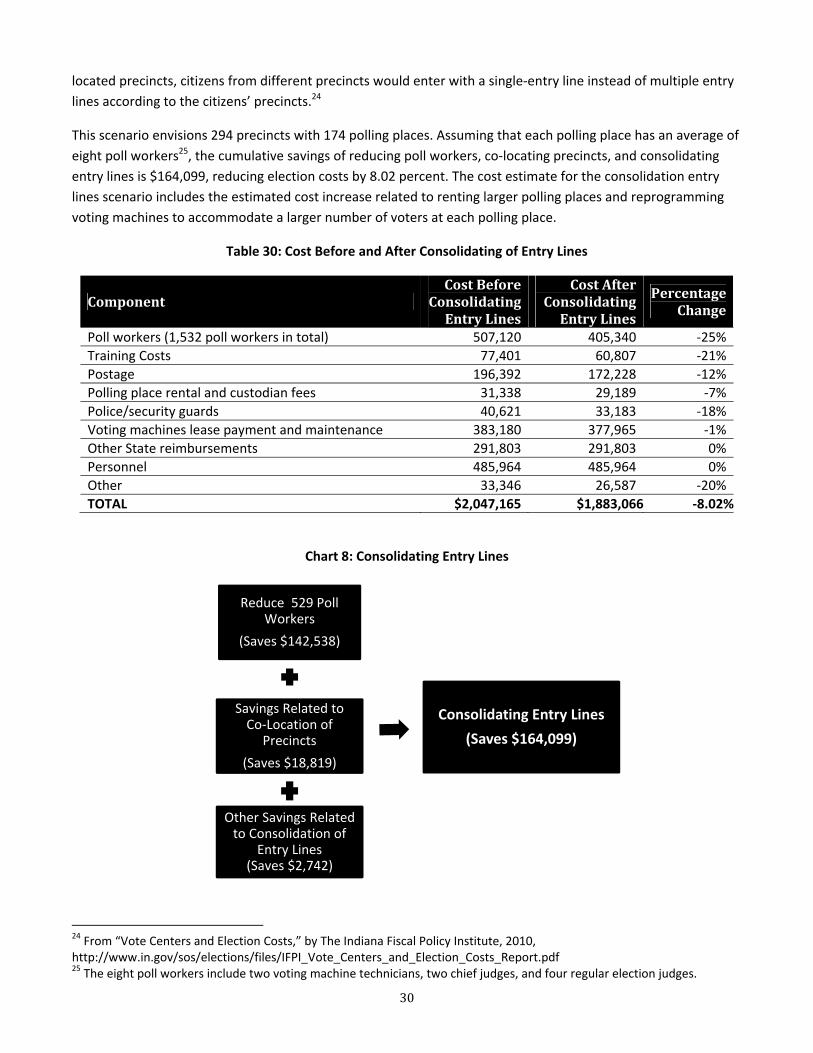
30
located precincts, citizens from different precincts would enter with a single‐entry line instead of multiple entry
lines according to the citizens’ precincts.24
This scenario envisions 294 precincts with 174 polling places. Assuming that each polling place has an average of
eight poll workers25, the cumulative savings of reducing poll workers, co‐locating precincts, and consolidating
entry lines is $164,099, reducing election costs by 8.02 percent. The cost estimate for the consolidation entry
lines scenario includes the estimated cost increase related to renting larger polling places and reprogramming
voting machines to accommodate a larger number of voters at each polling place.
Table 30: Cost Before and After Consolidating of Entry Lines
ComponentCostBefore
ConsolidatingEntryLines
CostAfterConsolidatingEntryLines
PercentageChange
Poll workers (1,532 poll workers in total) 507,120 405,340 ‐25%
Training Costs 77,401 60,807 ‐21%
Postage 196,392 172,228 ‐12%
Polling place rental and custodian fees 31,338 29,189 ‐7%
Police/security guards 40,621 33,183 ‐18%
Voting machines lease payment and maintenance 383,180 377,965 ‐1%
Other State reimbursements 291,803 291,803 0%
Personnel 485,964 485,964 0%
Other 33,346 26,587 ‐20%
TOTAL $2,047,165 $1,883,066 ‐8.02%
Chart 8: Consolidating Entry Lines
24 From “Vote Centers and Election Costs,” by The Indiana Fiscal Policy Institute, 2010, http://www.in.gov/sos/elections/files/IFPI_Vote_Centers_and_Election_Costs_Report.pdf 25 The eight poll workers include two voting machine technicians, two chief judges, and four regular election judges.
Reduce 529 Poll Workers
(Saves $142,538)
Savings Related toCo‐Location of
Precincts
(Saves $18,819)
Other Savings Related to Consolidation of
Entry Lines(Saves $2,742)
Consolidating Entry Lines
(Saves $164,099)

31
Average wait time remains the same when entry lines are consolidated. Although the number of poll workers is
reduced with fewer polling places, the number of voting machines remains the same and the higher number of
voters at each polling places are served by a proportionately higher number of poll workers. The reduction in the
number of poll workers therefore only results in reduced idle time and does not increase wait time for voters.
Reduce the Number of Precincts
The scenario of consolidating entry lines can also be applied to reducing the number of precincts. If Baltimore
City reduces the number of precincts from 294 to 174, the fiscal impact is the same as consolidating entry lines
for co‐located precincts, reducing election costs by 8.02 percent. Reducing the number of precincts is,
however, a more direct alternative to save costs and can potentially cause less confusion to voters than the
alternative of consolidating entry lines of co‐located precincts.
While reducing the number of precincts is a more direct way to reduce election costs, there are legal issues
involved. There is currently no legal requirement for a certain number of precincts in Baltimore City. The
Maryland Code currently authorizes the local board to create and alter the boundaries for precincts, designate
the location for polling places, and combine or abolish precincts, according to Election Law Article, Section 2‐
303.
There are, however, various issues that Baltimore City needs to consider when reducing the number of
precincts. First, the Code mandates that a precinct may not be created, and the boundaries of a precinct may
not be changed, so as to cross any district boundary. 26 The State Board of Elections defines district as Ward,
Council District, Legislative District, or Congressional District. Second, reducing the number of precincts would
reduce the accessibility of polling places. Baltimore City voters, unlike voters in other jurisdictions, often walk to
a polling place instead of driving. This is a unique requirement that Baltimore City needs to consider when
reducing the number of precincts.
Establish Vote Centers
Under current practice, most polling places have one precinct, and when multiple precincts are co‐located in a
polling place, voters from different precincts are separated by cordons and signs so that they can be served by
the appropriate set of poll workers and voting machines specific to their precincts. By establishing vote centers,
voters choose to vote in any one of several larger, strategically located polling sites throughout the City on
Election Day instead of using traditional neighborhood precincts.
This scenario envisions 30 vote centers in Baltimore City on Election Day, and the five polling places for the six‐
day early voting week remains unchanged. The 30 vote centers would be located throughout the City such that
they would be around 1.64 miles away from one another.27 For each vote center, there would be 10 chief
judges, 15 regular judges, five voting machine technicians, and five trouble shooters.28 Troubleshooters are
responsible for traffic flow through the vote center and for identifying technology issues that arise.
26 COMAR 33.15.02.02 27 The land area of Baltimore City is 80.94 square miles. Distance between each vote center=(80.94/30)^.5=1.64 miles. 28 The number of poll workers is determined using the vote center model in Colorado. The use of vote centers decreased the number of Election judges needed by 50 percent in Larimer County, Colorado in 2003.
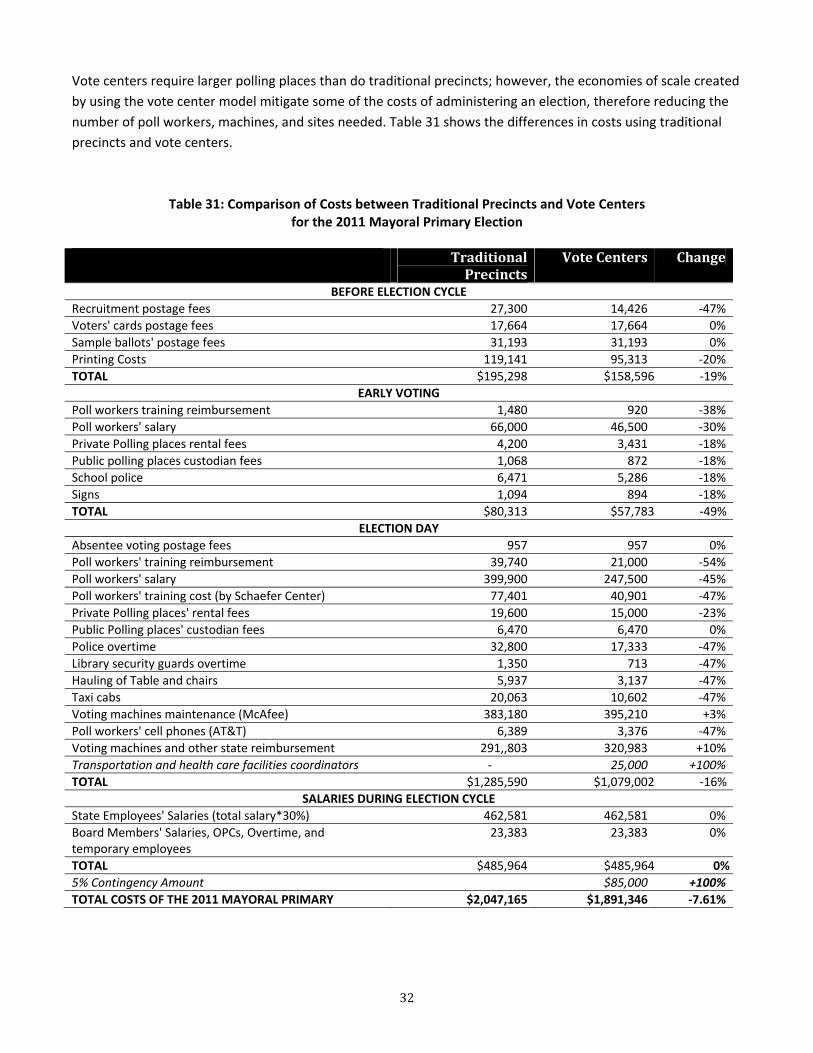
32
Vote centers require larger polling places than do traditional precincts; however, the economies of scale created
by using the vote center model mitigate some of the costs of administering an election, therefore reducing the
number of poll workers, machines, and sites needed. Table 31 shows the differences in costs using traditional
precincts and vote centers.
Table 31: Comparison of Costs between Traditional Precincts and Vote Centers for the 2011 Mayoral Primary Election
Traditional
PrecinctsVoteCenters Change
BEFORE ELECTION CYCLE
Recruitment postage fees 27,300 14,426 ‐47%
Voters' cards postage fees 17,664 17,664 0%
Sample ballots' postage fees 31,193 31,193 0%
Printing Costs 119,141 95,313 ‐20%
TOTAL $195,298 $158,596 ‐19%
EARLY VOTING
Poll workers training reimbursement 1,480 920 ‐38%
Poll workers' salary 66,000 46,500 ‐30%
Private Polling places rental fees 4,200 3,431 ‐18%
Public polling places custodian fees 1,068 872 ‐18%
School police 6,471 5,286 ‐18%
Signs 1,094 894 ‐18%
TOTAL $80,313 $57,783 ‐49%
ELECTION DAY
Absentee voting postage fees 957 957 0%
Poll workers' training reimbursement 39,740 21,000 ‐54%
Poll workers' salary 399,900 247,500 ‐45%
Poll workers' training cost (by Schaefer Center) 77,401 40,901 ‐47%
Private Polling places' rental fees 19,600 15,000 ‐23%
Public Polling places' custodian fees 6,470 6,470 0%
Police overtime 32,800 17,333 ‐47%
Library security guards overtime 1,350 713 ‐47%
Hauling of Table and chairs 5,937 3,137 ‐47%
Taxi cabs 20,063 10,602 ‐47%
Voting machines maintenance (McAfee) 383,180 395,210 +3%
Poll workers' cell phones (AT&T) 6,389 3,376 ‐47%
Voting machines and other state reimbursement 291,,803 320,983 +10%
Transportation and health care facilities coordinators ‐ 25,000 +100%
TOTAL $1,285,590 $1,079,002 ‐16%
SALARIES DURING ELECTION CYCLE
State Employees' Salaries (total salary*30%) 462,581 462,581 0%
Board Members' Salaries, OPCs, Overtime, and temporary employees
23,383 23,383 0%
TOTAL $485,964 $485,964 0%
5% Contingency Amount $85,000 +100%
TOTAL COSTS OF THE 2011 MAYORAL PRIMARY $2,047,165 $1,891,346 ‐7.61%
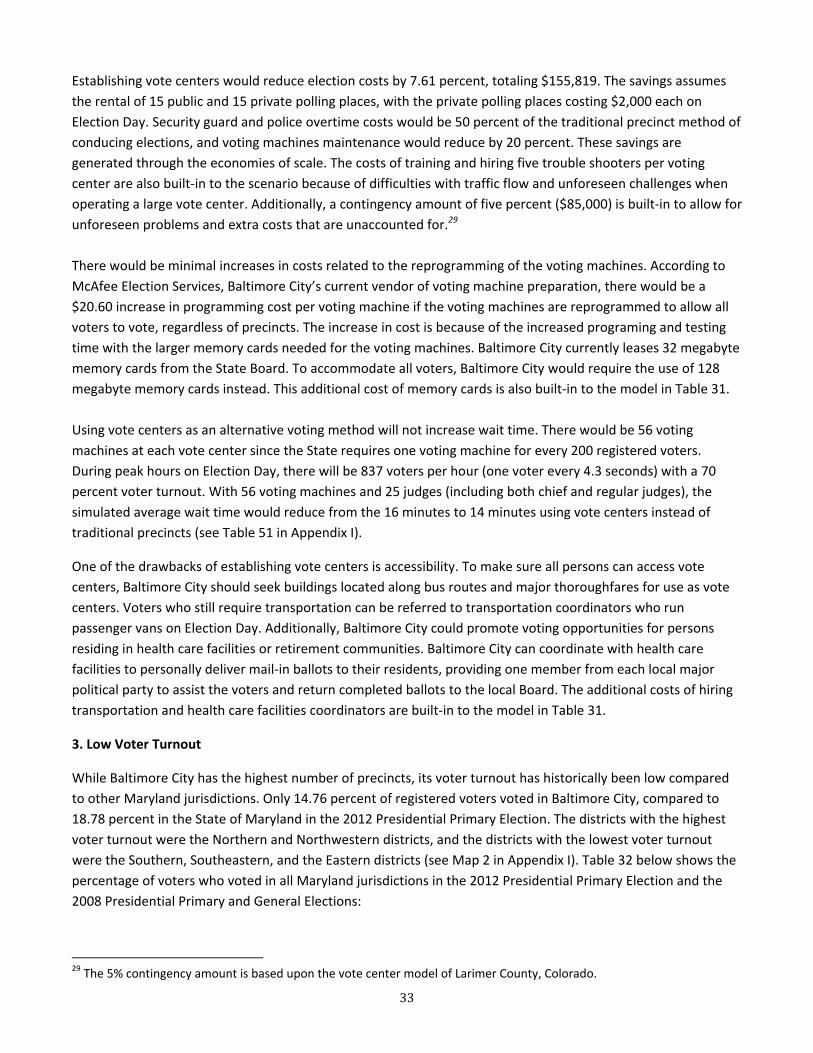
33
Establishing vote centers would reduce election costs by 7.61 percent, totaling $155,819. The savings assumes
the rental of 15 public and 15 private polling places, with the private polling places costing $2,000 each on
Election Day. Security guard and police overtime costs would be 50 percent of the traditional precinct method of
conducing elections, and voting machines maintenance would reduce by 20 percent. These savings are
generated through the economies of scale. The costs of training and hiring five trouble shooters per voting
center are also built‐in to the scenario because of difficulties with traffic flow and unforeseen challenges when
operating a large vote center. Additionally, a contingency amount of five percent ($85,000) is built‐in to allow for
unforeseen problems and extra costs that are unaccounted for.29
There would be minimal increases in costs related to the reprogramming of the voting machines. According to
McAfee Election Services, Baltimore City’s current vendor of voting machine preparation, there would be a
$20.60 increase in programming cost per voting machine if the voting machines are reprogrammed to allow all
voters to vote, regardless of precincts. The increase in cost is because of the increased programing and testing
time with the larger memory cards needed for the voting machines. Baltimore City currently leases 32 megabyte
memory cards from the State Board. To accommodate all voters, Baltimore City would require the use of 128
megabyte memory cards instead. This additional cost of memory cards is also built‐in to the model in Table 31.
Using vote centers as an alternative voting method will not increase wait time. There would be 56 voting
machines at each vote center since the State requires one voting machine for every 200 registered voters.
During peak hours on Election Day, there will be 837 voters per hour (one voter every 4.3 seconds) with a 70
percent voter turnout. With 56 voting machines and 25 judges (including both chief and regular judges), the
simulated average wait time would reduce from the 16 minutes to 14 minutes using vote centers instead of
traditional precincts (see Table 51 in Appendix I).
One of the drawbacks of establishing vote centers is accessibility. To make sure all persons can access vote
centers, Baltimore City should seek buildings located along bus routes and major thoroughfares for use as vote
centers. Voters who still require transportation can be referred to transportation coordinators who run
passenger vans on Election Day. Additionally, Baltimore City could promote voting opportunities for persons
residing in health care facilities or retirement communities. Baltimore City can coordinate with health care
facilities to personally deliver mail‐in ballots to their residents, providing one member from each local major
political party to assist the voters and return completed ballots to the local Board. The additional costs of hiring
transportation and health care facilities coordinators are built‐in to the model in Table 31.
3. Low Voter Turnout
While Baltimore City has the highest number of precincts, its voter turnout has historically been low compared
to other Maryland jurisdictions. Only 14.76 percent of registered voters voted in Baltimore City, compared to
18.78 percent in the State of Maryland in the 2012 Presidential Primary Election. The districts with the highest
voter turnout were the Northern and Northwestern districts, and the districts with the lowest voter turnout
were the Southern, Southeastern, and the Eastern districts (see Map 2 in Appendix I). Table 32 below shows the
percentage of voters who voted in all Maryland jurisdictions in the 2012 Presidential Primary Election and the
2008 Presidential Primary and General Elections:
29 The 5% contingency amount is based upon the vote center model of Larimer County, Colorado.

34
Table 32: Baltimore City’s Voter Turnout Compared to MD Jurisdictions
County 2012PresidentialPrimaryVoterTurnout
2008PresidentialGeneralVoterTurnout
2008PresidentialPrimaryVoterTurnout
Allegany 28.39% 71.35% 31.47%
Anne Arundel 21.26% 79.43% 45.24%
Baltimore City 14.76% 68.21% 38.25%
Baltimore County 19.72% 76.59% 42.67%
Calvert 20.85% 79.95% 35.14%
Caroline 20.30% 75.92% 44.44%
Carroll 17.58% 80.91% 32.77%
Cecil 24.42% 72.60% 28.61%
Charles 18.02% 80.57% 48.73%
Dorchester 22.27% 79.78% 49.51%
Frederick 23.56% 83.46% 40.18%
Garrett 28.67% 71.88% 35.80%
Harford 22.63% 83.03% 43.06%
Howard 19.55% 83.55% 43.60%
Kent 31.18% 79.62% 52.94%
Montgomery 15.81% 79.55% 45.14%
Prince George's 15.33% 76.58% 48.33%
Queen Anne's 25.26% 82.79% 42.82%
St. Mary's 22.20% 77.57% 44.85%
Somerset 19.25% 77.46% 44.38%
Talbot 28.96% 82.92% 48.72%
Washington 28.75% 73.07% 34.66%
Wicomico 20.97% 80.14% 48.86%
Worchester 23.35% 80.45% 47.55%
State of Maryland 18.78% 77.63% 42.86%
Baltimore City’s turnout has historically been low compared to other major cities as well. When compared to
nine other cities’ voter turnout in mayoral elections from 1979 to 2003, Baltimore City’s median turnout was
third to the lowest:
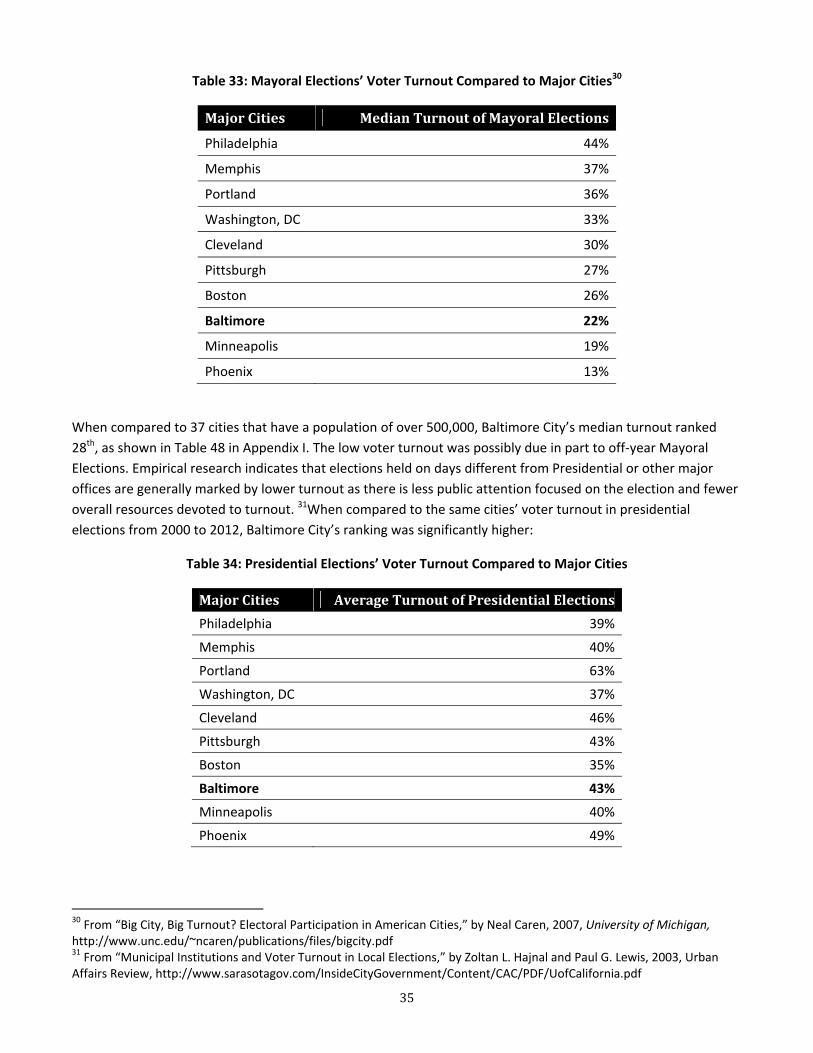
35
Table 33: Mayoral Elections’ Voter Turnout Compared to Major Cities30
MajorCities MedianTurnoutofMayoralElections
Philadelphia 44%
Memphis 37%
Portland 36%
Washington, DC 33%
Cleveland 30%
Pittsburgh 27%
Boston 26%
Baltimore 22%
Minneapolis 19%
Phoenix 13%
When compared to 37 cities that have a population of over 500,000, Baltimore City’s median turnout ranked
28th, as shown in Table 48 in Appendix I. The low voter turnout was possibly due in part to off-year Mayoral
Elections. Empirical research indicates that elections held on days different from Presidential or other major
offices are generally marked by lower turnout as there is less public attention focused on the election and fewer
overall resources devoted to turnout. 31When compared to the same cities’ voter turnout in presidential
elections from 2000 to 2012, Baltimore City’s ranking was significantly higher:
Table 34: Presidential Elections’ Voter Turnout Compared to Major Cities
MajorCities AverageTurnoutofPresidentialElections
Philadelphia 39%
Memphis 40%
Portland 63%
Washington, DC 37%
Cleveland 46%
Pittsburgh 43%
Boston 35%
Baltimore 43%
Minneapolis 40%
Phoenix 49%
30 From “Big City, Big Turnout? Electoral Participation in American Cities,” by Neal Caren, 2007, University of Michigan, http://www.unc.edu/~ncaren/publications/files/bigcity.pdf 31 From “Municipal Institutions and Voter Turnout in Local Elections,” by Zoltan L. Hajnal and Paul G. Lewis, 2003, Urban Affairs Review, http://www.sarasotagov.com/InsideCityGovernment/Content/CAC/PDF/UofCalifornia.pdf

36
Increase Voter Turnout
Maryland has experimented with various alternative voting methods to increase voter turnout over the years.
Maryland started implementing Election Day as a State holiday in 1882, but evidence indicates that Election Day
holiday does not increase voter turnout when turnout data from States with Election Day State holidays are
compared with the turnout data from States without Election Day holidays and with the entire country.32In
2010, Maryland implemented early voting, allowing voters to vote at any early voting site during the six‐day
early voting week before Election Day. There is currently no evidence that early voting week has an impact on
voter turnout.
To increase voter turnout in municipal elections, Baltimore City will be aligning the mayoral elections with
presidential elections starting in 2016. Empirical evidence indicates that controlling for other factors, municipal
elections that coincide with presidential elections increase voter turnout by 36 percent compared to off‐cycle
municipal elections.33 To address the fundamental goal of increasing civic engagement, however, Baltimore City
should examine other alternate voting methods to increase voter turnout.
As mentioned in the report earlier, establishing vote centers can generate significant savings and increase cost-
effectiveness. Although there is no hard evidence that establishing vote centers can increase voter turnout,
voter turnout increased significantly following the introduction of vote centers in Larimer County, Colorado in
2003. Voter turnout increased from 62 percent to 79 percent from 2000 to 2004 (both presidential general
elections), as shown in Table 35:
Table 35: Larimer County Election Year Totals
VotingMethod
Election Year TotalRegistered
TotalEarlyVoted
VoteCenterorPrecinct
Voting
TotalVoted
VoterTurnout
Vote Center General 2004 199,129 92,933 52,481 147,112 78.88%
Precinct Voting
General 2002 188,168 45,560 48,919 95,276 50.63%
General 2000 191,124 61,402 57,582 119,201 62.37%
General 1998 166,700 30,370 56,484 86,875 52.11%
Voter turnout in Colorado increased by 14 percent from 2000 to 2004, whereas the voter turnout increase in
Larimer County was 26 percent. The significantly larger increase in voter turnout in Larimer County versus
Colorado as a whole suggests that the increased convenience of vote centers as opposed to traditional precincts
encouraged more votes in the 2004 General Election.
Table 36: Larimer County and Colorado Voter Turnout
2000GeneralElection
2004GeneralElection %Change
Larimer County 62.37% 78.88% 26%
Colorado 53.7% 61.2% 14%
32 From “Alternative Voting Methods,” by U.S. Election Assistance Commission, 2008, http://www.eac.gov/assets/1/workflow_staging/Page/54.PDF 33 From “Municipal Elections in California: Turnout, Timing, and Competitions,” by Zoltan L. Hajnal, Paul G Lewis, and Huge Louch, 2002.

37
The increase in voter turnout in Larimer County was also the largest when compared to other major cities’ voter
turnout in the 2000 and 2004 Presidential Elections, as shown in Table 37:
Table 37: Presidential General Elections (2000 and 2004)
Population2000
PresidentialGeneral
2004Presidential
General%Change
Larimer County 305,525 62% 79% 26%
Philadelphia 1,536,471 55% 64% 16%
Memphis 652,050 42% 44% 4%
Portland 593,820 78% 85% 9%
Washington, DC 601,723 58% 60% 3%
Cleveland 393,806 58% 68% 18%
Pittsburgh 307,484 64% 70% 10%
Boston 617,594 55% 59% 6%
Baltimore 620,961 63% 70% 11%
Minneapolis 387,753 82% 70% ‐15%
Phoenix 1,469,471 75% 78% 5%
Increased voter turnout in Larimer County could be due in part to increased public relations work performed by
local officials. Early in the process of establishing vote centers, local officials contracted with an outside public
relations expert to address the voter education challenges of the project. Because vote centers represented a
major change to the traditional voting process, election officials developed a comprehensive plan for
systematically informing voters of and preparing them for the new system of voting on Election Day.
The Larimer County vote center example suggests that vote centers can increase voter turnout under three
conditions: 1) vote centers are strategically located such that it provides additional convenience to voters, 2)
effective publicity work is performed early in the process to inform and prepare voters, and 3) vote centers are
well‐equipped with enough election judges and voting machines on Election Day. The goal of examining the
feasibility of vote centers is to find ways to reduce election costs and increase voter turnout in Baltimore City,
both of which are essential to increasing cost‐effectiveness, as shown in Table 38:
Table 38: Cost‐Effectiveness of the Conduct of Elections
2011MayoralPrimary
2010 GubernatorialPrimary
2008PresidentialGeneral
# of Votes 77,191 164,556 251,127
Voter Turnout 24.58% 48.16% 68.21%
Cost of Election $2,047,165 $2,869,500 $3,248,517
Cost per Vote $26.52 $17.44 $12.94
While cost per vote is a valid and useful cost‐effectiveness indicator, the Board of Elections should consider
having a wider range of performance indicators. BBMR recommends that the Board measures average wait
time, voter satisfaction, and election judges’ utilization rate by precinct.

38
Summary of Alternatives to Increase Cost‐Effectiveness
The low cost‐effectiveness of conducting elections in Baltimore City is due to several factors: 1) polling places
have more staff than necessary, 2) there are more precincts and polling places than necessary, and 3) low voter
turnout. The table below shows how each alternative can tackle these problems and reduce the cost of
conducting elections, with using the staffing model generating the most savings. Baltimore City would need to
have further discussions with the State Board if these alternatives are to be implemented to ensure that the way
Baltimore City conducts elections is still in accordance to State law.
Table 39: Alternatives to Increase Cost‐Effectiveness
Alternatives SavingsfromUsingStaffingModel
AdditionalSavings
CumulativeSavings($)
CumulativeSavings(%)
Use Staffing Model $127,266 ‐ $127,266 6.18%
Co‐Locate Precincts $127,266 $18,819 $146,085 7.14%
Consolidate Entry Lines $142,538 $21,561 $164,099 8.02%
Reduce Precincts $142,538 $21,561 $164,099 8.02%
Establish Vote Centers $191,200 ‐ $155,81934 7.61%
State Requirements
Voting Machines
The current number of voting machines on Election Day is determined by the State requirement that one voting
unit needs to be provided for every 200 registered voters. This requirement is higher than the nationwide
average. The average number of registered voters per voting unit for all the states in the U.S. that use Diebold
Recording Electronic (DRE) voting machines is 353. Table 40 below shows the number of registered voters and
voters per voting units in states that use DRE voting machines in the 2010 Gubernatorial Election.
Table 40: Registered Voters per DRE Voting Machine35
State NumberofRegistered
Voters
NumberofDRE
Machines
RegisteredVotersperDRE
Machine
VotersperDREMachine
Delaware 623,425 1,338 466 237
Georgia 5,748,459 26,436 217 99
Indiana 4,329,977 20,951 207 86
Louisiana 2,935,062 8,941 328 145
Maryland 3,468,287 15,209 228 123
New Jersey 5,135,830 11,244 457 194
34 Vote centers’ cumulative savings is less than poll workers savings because of additional expenditure related to transportation coordinators and contingency amount 35 The 2010 Election Administration and Voting Survey, Election Assistance Commission,
http://www.eac.gov/assets/1/Documents/990‐281_EAC_EAVS_508_revised.pdf

39
Pennsylvania 8,220,759 11,305 727 359
South Carolina 2,630,363 10,302 255 132
Tennessee 3,952,404 8,633 458 188
Texas 13,262,432 34,210 388 148
Virginia 5,032,135 8,040 626 275
AVERAGE 5,030,830 14,237 353 156
If Baltimore City uses the nationwide average of one voting machine per 353 registered voters instead of 200
registered voters, only 920 voting machines would be needed instead of 1,600. Reducing the number of voting
machines from 1,600 to 920 would reduce voting machine leasing and maintenance costs by $101,521 per
election.
Table 41: Voting Machines’ Savings
OneVotingMachineper200RegisteredVoters
OneVotingMachineper353RegisteredVoters
Savings(%)
Voting Machine Lease 24,635 14,165 ‐43%
Voting Machine Maintenance
383,180 292,128 ‐24%
TOTAL $407,815 $306,293 ‐24.89%
It is the intent of the General Assembly to acquire the new Optical Scan Voting System beginning in Fiscal 2015.36
Based on a study prepared for Maryland Department of Legislative Reference, 37 the new Optical Scan System is
estimated to cost the State Board $35 million. Baltimore City can expect its share for the new voting system to
be $434,000 in Fiscal 2015, $930,000 in Fiscal 2016, and $930,000 in Fiscal 2017.
BBMR recommends that the State Board of Elections consider the feasibility of reducing the number of voting
machines required as the State acquires the new optical scan voting system for all Maryland Counties in Fiscal
2015. BBMR also recommends a voting machine requirement based on the number of estimated votes instead
of registered voters to increase the productivity of voting machines and maximize the use of resources.
If Baltimore City uses the nationwide average of 156 votes per voting machine and estimates the number of
voting machines needed based on the expected number of votes, the 2011 Mayoral Primary Election would only
require 592 voting machines instead of 1,600. The 595 voting machines already include 100 contingency voting
machines. Reducing the number of voting machines from 1,600 to 595 would reduce costs by $150,500, a 7.4
percent decrease in election costs.
36 Senate Bill 1301, http://mlis.state.md.us/2012s1/chapters_noln/Ch_1_sb1301T.pdf, p. 44‐45 37 “Maryland Voting Systems Study,” by RTI International, http://mlis.state.md.us/2010rs/misc/2010votingsystemsstudyreport.pdf

40
Election Judges
Election Judges’ Compensation
The Code of Maryland currently requires local boards to compensate regular election judges $150 and chief
judges $200 on Election Day. The compensation rates are the highest among comparison cities, as shown in
Table 42 below.
Table 42: Chief Judges’ Compensation Rates
Cities ChiefJudges’CompensationRates
Baltimore, MD 200
Boston, MA 150
Chicago, IL 150
Detroit, MI 185
Milwaukee, WI 100
Minneapolis, MN 114
San Francisco, CA 170
St. Louis, MO 195
Washington, DC 160
AVERAGE $158
BBMR recommends the State Board to explore the feasibility of reducing election judges’ compensation rates to
the national average. Reducing election judges’ compensation rates would significantly reduce cost because
expenditure related poll workers is the highest cost component in election administration, as discussed earlier in
the report. If Baltimore City compensates election judges using the national average compensation rates,
election costs would reduce by $75,000 per election.
Early Voting
All Maryland jurisdictions are required to conduct early voting that lasts for six days as a result of the passage of
House Bill 1179 in 2008. The operation of 46 early voting centers in Maryland costs around $2.6 million per
election, and since Maryland implemented early voting in 2010, voter turnout has not increased with only 2.4
percent of registered voters who used early voting centers in the 2010 and 2012 primary elections and 6.3
percent in the 2010 general election.38
Early voting costs Baltimore City around $80,000 per election. The cost includes rental costs of polling places,
voting machines maintenance cost, and training and compensation for poll workers. BBMR recommends the
State to use other major cities as an example and conduct early voting at City Hall or other municipal buildings
to reduce costs and to continue providing early voting to Maryland voters.
38 From “Early Voting Costs Counties $2.6 M, but hasn’t increased voter turnout yet,” by Glynis Kazanjian, Maryland Reporter, September 10, 2012, http://marylandreporter.com/2012/09/10/early‐voting‐costs‐counties‐2‐6m‐but‐hasnt‐increased‐turnout‐yet/

41
OTHER JURISDICTIONS’ ALTERNATIVE VOTING METHODS COULD PROVIDE INSIGHTS TO ENHANCE
COST‐EFFECTIVENESS
As Baltimore City’s Board of Elections examines alternatives to enhance cost‐effectiveness, alternative voting
methods employed by other states and cities could provide insights for the City’s efforts. Alternative voting
methods examined in this report include:
1. Vote centers
2. Vote‐by‐mail
3. Permanent absentee voting
4. Online voting
The goal of examining different alternative voting methods is so that Baltimore City can chart the future of its
own system of election administration with the most information possible.
1. Vote Centers
Colorado was a pioneer in experimenting with vote centers. More than 20 counties in Colorado have used the
vote center model in at least one election. Phoenix, Arizona also recently started using the vote center model,
using 26 vote centers in its last election.
Vote centers are located in high‐profile, major‐traffic areas rather than in neighborhood schools or churches,
and voters are not restricted to vote at his/her precinct only. This new method of voting could reduce the
number of provisional ballots needed for each election, because any registered voter can choose to vote in any
vote center. The chart below shows how vote centers are administered:
Chart 9: Vote Center Stations
Greeter
Verify ID and signature Provisional Ballot Table
Computer Station
1) Witness signature card
2) Check ID
3) Verify voter registration in poll book
Ballot Station
Judges receive signature card
and give DRE access card Voting Booth
Exit
Return access card
Entry Line
No ID or not
in Poll Book

42
By having a smaller number of polling places, administrators can recruit the most efficient poll workers to serve
on Election Day instead of staffing hundreds of small, individual precincts. Fewer provisional ballots need to be
issued since a registered individual cannot vote in the “wrong” polling place with the establishment of vote
centers. Larger polling places also allow more adequate parking logistics and a more effective deployment of
resources.39
While vote centers seem to be more cost‐efficient, there are other costs that might offset savings. First, vote
centers require more specialized training for poll workers because of increased complexities of a large polling
site. There is also the need to staff “trouble shooters” at each vote center to be responsible for traffic flow
through the vote center and for identifying technology issues that arise. Second, traditional public polling sites
such as libraries and schools might not have sufficient space to accommodate the large number of voters, and
the price volatility of the rental costs of larger sites poses the risk of increased cost. Third, while vote centers are
strategically located and should provide increased convenience, some voters might find them less accessible
than the traditional precincts. There might be a need to hire transportation and health care facilities
coordinators to provide transportation for voters who have difficulties accessing the vote centers. These are a
few costs that need to be accounted for when exploring the option of establishing vote centers in Baltimore City.
Following the introduction of vote centers in Larimer County, Colorado in 2003, voter turnout increased
significantly. Voter turnout increased from 62 percent to 79 percent from 2000 to 2004, as mentioned earlier in
the report. While there are many advantages with vote centers such as increased turnout and reduced cost, the
result would be far worse than a traditional precinct should there be any technical or operational error. In
Denver, for example, voters had to wait for two to three hours at the City’s 55 vote centers because of the
repeated failure of electronic poll books in the 2006 General Election.40 Approximately 18,000 to 20,000 voters
(20 percent of the anticipated turnout) left the vote centers without casting a ballot because of the wait time. 41
2. Vote‐by‐Mail
The States of Oregon and Washington currently conduct all elections by mail. A ballot is automatically mailed to
every registered voter in advance of the election, and the traditional in‐person voting precincts are not available.
Vote‐by‐mail in Oregon began in 1981 as an effort to increase voter turnout. The 1981 legislation had many
restrictions, requiring the elections division of the Secretary of State’s office to adopt an administrative
authorization rule for the jurisdiction if local election officials wanted to conduct a vote‐by‐mail election. By
1998, the increasing number of voters who applied for absentee voting led local election officials to initiate vote‐
by‐mail in primary and general elections. In 2000, Oregon for the first time initiated vote‐by‐mail for the entire
Presidential election cycle.42 While there is no hard evidence that there is a causal relationship between vote‐by‐
mail and voter turnout, there was an overall increase in voter turnout since the introduction of vote‐by‐mail in
primary and general elections in Oregon.
39 From “Alternative Voting Methods,” by U.S. Election Assistance Commission, 2008, http://www.eac.gov/assets/1/workflow_staging/Page/54.PDF 40 From “Report on Denver Electronic Poll Problems,” http://electionupdates.caltech.edu/2007/01/09/report‐on‐denver‐electronic‐pollbook‐problems/ 41 From “Voter Centers ‘a Total Fiasco’,” by Monte Whaley and Joey Bunch, Denver Post, http://www.denverpost.com/ci_4627496 42 From “Alternative Voting Methods,” by U.S. Election Assistance Commission, 2008.

43
Chart 10: Oregon’s Voter Turnout: 1996‐2008
There are certain advantages with vote‐by‐mail. First, the administration of elections becomes less complicated
when the pressures involved in recruiting, training, and managing poll workers are eliminated. Second, without
in‐person voting, officials have no need to secure numerous polling places. Third, voter registration lists tend to
be more accurate because the frequent mailing of non‐forwardable ballots provides local election officials with
updated information about the actual home addresses of the voters when mail is returned as undeliverable.
Furthermore, soft evidence indicates that vote‐by‐mail elections might cost less to administer than precinct‐
based elections and may increase voter turnout.43
There were 334,852 registered voters in April 2012 in Baltimore City. Using this figure as the cost driver, vote‐by‐
mail would cost $1.9 millon, a 6.9 percent decrease in election costs compared to the traditional precinct
voting method. This amount already includes a 10 percent contingency amount to account for costs that are
unaccounted for in this study.
Table 43: Cost of Running the 2011 Mayoral Primary Election Using Vote‐By‐Mail
Component Calculations CostVoters Cards’ Postage Fees 334,852*$.44 147,335
Ballots’ Postage Fees (including return mail postage)
334,852*$.44*2 294,670
Printing Costs 334,852*$1 334,852
Pitney‐Bowes Relia‐Vote44 (Ballot Processing machine)
215,000*5/3 elections 358,330
Coding Accuracy Support System (Address coding software upgrade)
$1,000 annual fee/3 elections 333
43 From “A report to the Best Practices and Vision Commission Office of the Colorado Secretary of State,” by Peggy Cuciti and Allan Wallis, University of Colorado Denver, 2011, http://www.sos.state.co.us/pubs/elections/BestPractices/CUDenverElectionReformStudy02012011.pdf 44 From Jefferson County, CO’s Five‐Year Capital Improvement Plan, http://jeffco.us/jeffco/portal_uploads/Citizen_Budget_Review_Panel/march_31/GF_CEF_Projects_03312009.pdf
71%
80%
87% 86%
50%
55%
60%
65%
70%
75%
80%
85%
90%
95%
100%
1996 2000 2004 2008
Oregon's Voter Turnout: 1996‐2008

44
Temporary Employees45 (for canvassing of votes)
(334,852*2 minutes per vote)*$10.79 hourly rate/60 minutes
120,435
State Employees’ Salaries Total Salary*30% 462,581
Board Members’ Salaries Total Salary*30% 13,550
10% Contingency Amount 10% of total cost 173,209
TOTAL $1,905,298
The estimated cost includes the costs of leasing mail and ballot processing equipment and purchasing address
coding software upgrades. The ballot processing equipment46 (Relia‐Vote) is a large volume envelope processing
and tracking system that prints barcodes that are unique to voters, scans and stamps envelopes for outgoing
mail, and verifies voters’ signature. The major savings in the scenario compared to the traditional precinct voting
method are the savings related to poll workers and voting machine maintenance, two of the biggest cost
components in conducting elections. In Fiscal 2012, the Board of Elections spent $2 million and $1.33 million on
poll workers and voting machine maintenance respectively for conducting three elections. Eliminating these two
cost components alone would save $1.1 million for each election in Fiscal 2012.
Administrative Challenges
While vote‐by‐mail reduces costs and can potentially increase voter turnout, it has many administrative
challenges. To prevent fraud in voting, Baltimore City would need to purchase mail processing equipment that
has a voter signature verification function, so that if the signature on the ballot secrecy envelope does not
match the signature on file with the Board of Elections, the ballot would be rejected. The process of verification,
however, increases administrative costs and time. The second challenge with vote‐by‐mail is that people are
transient and do not always cancel their voter registrations when they move, which allows for the possibility of
ballots being sent to addresses at which voters no longer live. According to the 2010 Census, 130,740 (44
percent) housing units in Baltimore were renter occupied whereas only 119,163 (40 percent) housing units were
owner occupied. The higher percentage of renter occupied housing units in Baltimore City than the nationwide
average (35 percent) suggests that Baltimore has a more transient population. Additionally, 37 percent of
Baltimore citizens said they were likely or very likely to move out of Baltimore in the next one to three years
according to the 2012 Baltimore Citizen Survey.47 The high percentage of renters and the likelihood of Baltimore
residents to leave Baltimore increase the possibility of returned ballots and reduce the effectiveness of
implementing vote‐by‐mail.
Legal Challenges
The most significant legal dispute over Oregon’s vote‐by‐mail elections was a lawsuit in federal court challenging
the State’s authority to expand voting in federal elections beyond Election Day. The federal court ruled that
Oregon was in compliance with the federal Election Day because elections were not “consummated” before
45 The hourly rate of $10.79 per hour is the current hourly rate for temporary employees working in the Downtown office. 46 Other ballot processing equipment manufactured by other vendors include 1) Mail in Ballot Tracker (MiBT) by VoteHere, 2) Secure Ballot System (SBS) by Integrity Voting Systems (a division of K&H Integrated Print Solutions), and 3) Automated Signature Verification by VoteRemote Suite (Diebold), http://www.sos.wa.gov/documentvault/BallotTrackingSystemsReportJanuary2007‐1852.pdf 47 From “2012 Baltimore Citizen Survey,” by University of Baltimore, 2012.

45
Election Day when voters voted by mail.48 Although the legal dispute of vote‐by‐mail was settled by federal
court, Baltimore City would need to work with the Maryland State Senate and the State Board of Elections to
settle the legal issues involved with vote‐by‐mail.
With the administrative and legal challenges involved, it might not be feasible for Baltimore City to implement
vote‐by‐mail at this point. Baltimore City can nonetheless explore alternative forms of vote‐by‐mail to reduce
election costs and increase voter turnout, as discussed below.
3. Permanent Absentee Voting While it might not be feasible for Baltimore City to administer elections through vote‐by‐mail, allowing
alternative forms of vote‐by‐mail could increase cost‐effectiveness. One of the alternative forms of vote‐by‐mail
is permanent absentee voting. Maryland currently allows absentee voting, but absentee voters must apply and
register for each primary and general election. Permanent absentee voting, on the other hand, allows the voter
to automatically receive an absentee ballot for all future elections once a voter opts in, and does not require the
voter to state any reason for absentee voting. Permanent absentee voting basically gives voters the option to
vote by mail or to vote at the actual polling sites. The cost of allowing permanent absentee voting might
increase election costs in the initial years of implementation, but would allow Baltimore City to examine
whether vote‐by‐mail is a feasible alternative to conduct elections and determine if such an investment is
worthwhile.
If permanent absentee voting is implemented in combination with vote centers, voter turnout will likely
increase. Table 44 shows that using vote centers would cost $1,891,346 per election. Assuming that voter
turnout would increase by five percent because of increased absentee voting, permanent absentee voting in
combination with establishing vote centers would cost $1.99 million for the 2011 Mayoral Election, a 2.6 percent
decrease compared to current costs.
Table 44: Vote Centers in Combination with Permanent Absentee Voting
Component Calculations CostVoters Cards’ Postage Fees 16,742*$.44 7,367
Ballots’ Postage Fees (including return mail postage)
16,742*$.44*2
7,367
Printing Costs 16,742*$1 16,743
Pitney‐Bowes Relia‐Vote (Ballot Processing machine)
215,000/3 elections 71,667
Coding Accuracy Support System (Address coding software upgrade)
$1000 annual fee/3 elections 333
Vote Centers 1,891,346
TOTAL $1,994,823
48 From “The Voting Integrity Project, Inc. et al v,” by Phil Keisling, Secretary of State of Oregon, 259 F.3d 1169, 1176 (9th Cir. 2001).

46
4. Online Voting
West Virginia initiated a pilot program in 2010 to provide deployed military and overseas citizens the
opportunity to cast their ballot over the internet. During the 2010 general election, 125 West Virginia voters
from eight counties cast their ballot online, representing a 162 percent increase over the participation in the
2010 primary. The 76 percent online‐vote return rate far exceeds the average 58 percent absentee ballot return
rate experienced by counties using standard mail as the ballot transmission method.
While online voting can save costs and increase turnout, the idea is still in its embryonic stage with many who
are concerned about its security. The District of Columbia canceled its online voting plans in 2010 after
University of Michigan computer experts were able to infiltrate the system and remotely change votes. While it
is premature at this time to introduce online voting, Baltimore City can still explore options to initiate a pilot
program to understand the effect of online voting on voter turnout.
CONCLUSIONS
Cost‐effectiveness is currently not maximized in the conduct of elections in Baltimore City. This study shows that
the conduct of elections is not cost‐effective because 1) polling places have more staff than necessary, 2) there
are more precincts and polling places than necessary, and 3) voter turnout has historically been low in Baltimore
City. To maximize cost‐effectiveness, Baltimore City needs to examine ways to reduce costs and increase voter
turnout. Alternative voting methods practiced by other cities and states, such as vote centers and vote‐by‐mail,
could provide insights to enhance cost‐effectiveness. Changes to state requirements related to election judges
and voting machines can also generate significant savings. A reevaluation of the ways Baltimore City conducts
elections would better position the Board of Elections to be more competitive with administering elections in
Baltimore City.
RECOMMENDATIONS
To improve the cost‐effectiveness of the conduct of elections, BBMR recommends the following actions:
1. Use the staffing model recommended by BBMR to determine the number of election judges for each
election and reduce the number of poll workers accordingly
2. Measure performance indicators including average wait time, voter satisfaction, and election judges’
productivity rates (such as number of votes per judge)
3. Reduce the number of precincts
4. Co‐locate precincts and consolidate entry lines upon further discussions with the State Board
5. Explore the feasibility of alternative voting methods, particularly introducing permanent absentee voting,
vote‐by‐mail, and vote centers in Baltimore City
6. Expand the role of the Board of Elections by including maximizing voter turnout as one of its missions

47
AGENCYCOMMENTS
BBMR held an exit conference after a draft of this report was provided to the Board of Elections. BBMR verified
the data and the facts in the report and discussed the feasibility of implementing recommended alternatives at
the exit conference. The written comments provided by the Board of Elections are reprinted in Appendix III.
The Board of Elections verified that the data used in this study was accurate. The data verified includes the cost
of administering elections, the cost components of election administration, and cost per vote and per registered
voter.
The Board of Elections did not concur with any of the recommended alternatives provided by BBMR. BBMR
recommended the Board of Elections to use the formula stated in this report to determine the number of
election judges needed and reduce the number of poll workers accordingly. The Board of Elections states that
they cannot further reduce the number of poll workers hired because the agency is required to prepare and
staff for a 100 percent voter turnout. The Board of Elections also states that there is no way to estimate voter
turnout accurately for any given election. The Board of Elections currently hires around 2,000 poll workers for
each election regardless of voter turnout.
BBMR’s second recommendation to the Board of Elections is to measure performance indicators including
average wait time, voter satisfaction, and election judges’ productivity rates. The Board of Elections did not
concur with the recommendation, stating that these performance measures can only be measured on Election
Day and the Board of Elections staff does not have the capacity or resources to measure performance on
Election Day because of the large amount of responsibilities they have on Election Day.
BBMR’s third recommendation is to consider co‐locating additional precincts and consolidating entry lines. The
Board of Elections states the there are three issues with this recommendation. First, consolidating entry lines
would pose significant challenges to the agency because of the need for larger polling places, which are difficult
to obtain and secure. Second, voting machines would need to be re‐programmed to accommodate voters from
multiple precincts. Third, the Board of Elections foresees a lower voter satisfaction because of the
inconveniences involved in the consolidation of entry lines.
BBMR’s fourth recommendation is to explore the feasibility of alternative voting methods such as vote centers,
permanent absentee voting, and vote‐by‐mail. The Board of Election made it clear that implementing alternative
voting methods are at the discretion not of the local board but of the State Board of Elections and Maryland
General Assembly.
BBMR’s last recommendation for the Board of Elections is to expand the role of the agency by including
maximizing voter turnout as one of its missions. The Board of Elections states that they are already mailing out
flyers and specimen ballots before elections and the agency does not have additional measures that can
maximize voter turnout.

48
This report is being sent to Armstead Jones, Director of the Board of Elections, Abigail Goldman, Deputy Director
of the Board of Elections, and Ann MacNeille, Assistant Attorney General of the Office of the Attorney General.
We will also make copies available on our website at:
http://www.baltimorecity.gov/Government/AgenciesDepartments/Finance/BudgetManagementResearch.aspx.
If you have any questions about this report, please contact Vieen Leung at 410‐396‐4964.
Andrew Kleine, Chief
Bureau of the Budget and Management Research,
Department of Finance

49
APPENDIXI
Table 45: Historical Voter Turnout in Baltimore City
Year ElectionType VoterTurnout
2004 Presidential Primary 20.07%
2004 Presidential General 70.01%
2006 Gubernatorial Primary 33.64%
2006 Gubernatorial General 47.10%
2007 Mayoral Primary 38.57%
2007 Mayoral General 16.88%
2008 Presidential Primary 38.25%
2008 Presidential General 68.21%
2010 Gubernatorial Primary 22.78%
2010 Gubernatorial General 45.02%
2011 Mayoral Primary 24.58%
2011 Mayoral General 13.38%
2012 Presidential Primary 14.76%
Chart 11: Historical Voter Turnout in Baltimore
0.00%
10.00%
20.00%
30.00%
40.00%
50.00%
60.00%
70.00%
80.00%
2004 2004 2006 2006 2007 2007 2008 2008 2010 2010 2011 2011 2012
Historical Voter Turnout in Baltimore City

50
Table 46: Historical Elections Costs
2012 Presidential Primary
2011 M
ayoral G
eneral
2011 M
ayoral Primary
2010 Gubernatorial General
2008 Presidential General
Voter Tu
rnout
14.76%
13.38%
24.58%
48.16%
68.21%
BEFORE ELEC
TION CYC
LE
Recruitmen
t postage fees
24,527
24,527
27,300
27,300
41,889
Voters' cards postage fees
14,286
8,941
17,664
11,896
11,896
Sam
ple ballots' postage fees
27,059
36,193.00
31,193
37,727
37,727
Baltimore Sun Advertisem
ent
2,291
‐
‐
‐
‐
Printing Costs
71,496
73,523
119,141
122,663
38,108
TOTA
L
$139,659
$143,184
$195,298
$199,587
$129,620
EARLY VOTING
Poll workers training reim
bursem
ent
1,360
1,000
1,480
1,560
NO EARLY VOTING
Poll workers' salary
63,400
43,800
66,000
63,450
Private Polling places rental fees
4,200
4,200
4,200
4,200
Public polling places custodian fees
2,200
1,068
1,068
1,068
School police
6,471
6,471
6,471
6,471
Signs
1,094
1,094
1,094
1,094
TOTA
L
$78,725
$57,633
$80,313
$77,843
‐
ELECTION DAY
Absentee voting postage fees
808
1,202
957
7,788
7,788
Poll workers' training reim
bursem
ent
41,060
38,320
39,740
47,020
82,160
Poll workers' salary
411,200
389,250
399,900
454,500
630,750
Poll workers' training cost (by Schaefer
Cen
ter)
134,490
77,401
77,401
121,323
331,740
Private Polling places' ren
tal fees
19,950
19,600
19,600
19,600
18,424
Public Polling places' custodian fees
6,470
41,847
6,470
41,847
41,847
Police overtim
e
32,800
32,800
32,800
32,800
30,832
Library security guards overtim
e
1,350
1,350
1,350
1,350
1,269
Hauling of Table and chairs
5,937
5,937
5,937
5,745
5,369
Taxi cabs
15,000
16,168
20,063
21,064
17,626
Voting machines m
aintenance
(Mcafee)
383,181
383,180
383,180
505,200
494,589
Poll workers' cell phones (AT&
T)
8,429
11,789
6,389
9,595
12,529
Voting machines and other state
reim
bursem
ent
291,803
291,803
291,803
453,523
699,399
TOTA
L
$1,352,477
$1,310,647
$1,285,590
$1,721,355
$2,374,322
SALARIES DURING ELECTION CYC
LE
State Employees' Salary (total
salary*.3)
462,581
462,581
462,581
710,053
514,957
Board M
embers' Salaries and OPCs,
Overtim
e, and Tem
porary
23,383
23,383
23,383
16,234
28,490
TOTA
L
$485,964
$485,964
$485,964
$726,287
$543,447
TOTA
L COSTS FO
R THE 2012
PRESIDEN
TIAL PRIM
ARY ELECTION
$2,056,826
$1,997,428
$2,047,165
$2,725,071
$3,047,389
INFLATION‐ADJUSTMEN
T FA
CTO
R
‐
‐
1.053
1.066
TOTA
L COSTS IN 2012 DOLLARS
$2,056,826
$1,997,428
$2,047,165
$2,869,500
$3,248,517

51
Statistical Tests
The results of a paired t‐test comparing the average percentage of votes at each precinct for the last 10 elections from
2006 to 2011 and the percentage of votes at the 2012 Presidential Primary shows that the difference in percentage is
statistically insignificant.
Table 47: T Test Results
The result of the t‐test shows that the model is 98 percent confident that the average percentage of votes at each
precinct in the last 10 elections is the same as the percentage of votes at each precinct in the 2012 Presidential Primary
Election. Additionally, the two variables are almost perfectly correlated, as shown in Chart 12:
Chart 12: Correlation of Percentage of Votes at Each Precinct
Pr(T < t) = 0.4889 Pr(|T| > |t|) = 0.9779 Pr(T > t) = 0.5111 Ha: mean(diff) < 0 Ha: mean(diff) != 0 Ha: mean(diff) > 0
Ho: mean(diff) = 0 degrees of freedom = 289 mean(diff) = mean(Presidential - Average) t = -0.0278 diff 290 -.0001838 .0066228 .112782 -.0132188 .0128512 Average 290 .3450114 .0085559 .1457024 .3281715 .3618513Presid~l 290 .3448276 .0130903 .2229202 .3190631 .3705921 Variable Obs Mean Std. Err. Std. Dev. [95% Conf. Interval] Paired t test
Percentage ofVotes in EachPrecinct in the
2012Presidential
Election
AveragePercentage ofVotes in EachPrecinct in the10 Electionsfrom 2006 to
2011
0
.5
1
0 .5 1
0
.5
1
0 .5 1
Average Percentage in the 10 Elections from 2006 to 2011 vs. Percentage in the 2012 Presidential Primary ElectionCorrelation of Percentage of Votes at Each Precinct

52
Table 48: Median Voter Turnout of Cities with Over 500,000 Populations50
49 Median Turnout of Mayoral Elections from 1979 to 2003. 50 From “Big City, Big Turnout? Electoral Participation in American Cities,” by Neal Caren, University of Michigan, 2007.
Cities First Election Total Number of Elections
Voting Population (2000)
Median Turnout49
Atlanta 1981 8 305,624 24%
Austin 1979 18 438,460 20%
Baltimore 1979 6 475,527 22%
Boston 1979 12 388,579 26%
Buffalo 1981 6 209,860 33%
Charlotte 1979 9 371,067 24%
Chicago 1979 8 1,789,020 48%
Cincinnati 2001 1 242,247 36%
Cleveland 1981 11 331,843 30%
Columbus 1979 6 510,843 32%
Dallas 1985 9 675,591 14%
Denver 1979 12 372,817 34%
Detroit 1981 11 630,777 26%
El Paso 1983 10 318,154 16%
Fort Worth 1989 4 331,930 5%
Houston 1983 9 1,094,370 28%
Indianapolis 1987 5 561,329 31%
Jacksonville 1979 6 520,068 30%
Kansas City 1979 14 315,069 24%
Los Angeles 1981 8 1,834,370 26%
Memphis 1979 10 452,455 37%
Milwaukee 1980 10 399,352 25%
Minneapolis 1979 12 264,333 19%
Nashville 1987 7 400,227 25%
New Orleans 1990 6 346,200 40%
New York 1981 6 4,683,500 29%
Oklahoma City 1979 7 353,047 12%
Philadelphia 1979 7 1,071,780 44%
Phoenix 1979 11 775,596 13%
Pittsburgh 1981 5 257,622 27%
Portland, OR 1980 7 381,178 36%
San Antonio 1979 15 750,609 14%
San Diego 1979 13 776,625 31%
San Francisco 1979 13 553,675 41%
San Jose 1982 8 494,192 27%
Seattle 1981 11 431,375 35%
St. Louis 1981 5 247,667 29%
Washington 1982 6 411,044 33%

53
Table 49: Percentage of Votes by Precincts (in Percentage)
Precinct 2012 Prim
2011 Prim
2011 Gen
2010 Prim
2010 Gen
2008 Prim
2008 Gen
2007 Prim
2007 Gen
2006 Prim
2006 Gen
Average
PRECINCT 01001 0.21 0.24 0.19 0.31 0.32 0.22 0.27 0.29 0.17 0.24 0.33 0.26
PRECINCT 01002 0.31 0.39 0.40 0.45 0.33 0.38 0.42 0.29 0.34 0.35 0.75 0.41
PRECINCT 01003 0.23 0.23 0.26 0.35 0.32 0.32 0.40 0.56 0.26 0.27 0.92 0.39
PRECINCT 01004 0.49 0.40 0.43 0.54 0.63 0.45 0.54 0.89 0.39 0.43 0.58 0.53
PRECINCT 01005 0.52 0.52 0.55 0.73 0.94 0.63 0.72 0.40 0.58 0.60 0.40 0.61
PRECINCT 02001 0.17 0.19 0.26 0.20 0.62 0.19 0.23 0.34 0.20 0.18 0.82 0.32
PRECINCT 02002 0.29 0.29 0.33 0.41 0.46 0.35 0.37 0.28 0.34 0.32 0.24 0.34
PRECINCT 02003 0.35 0.37 0.37 0.47 0.77 0.43 0.49 0.21 0.36 0.38 0.17 0.40
PRECINCT 03001 0.24 0.27 0.24 0.27 0.33 0.26 0.32 0.24 0.24 0.26 0.25 0.27
PRECINCT 03002 0.05 0.11 0.06 0.08 0.17 0.09 0.15 0.24 0.08 0.04 0.33 0.13
PRECINCT 03003 0.28 0.27 0.26 0.34 0.26 0.26 0.34 0.25 0.26 0.25 0.27 0.28
PRECINCT 04001 0.18 0.14 0.20 0.16 0.23 0.18 0.25 0.13 0.13 0.10 0.17 0.17
PRECINCT 04002 0.16 0.10 0.14 0.12 0.32 0.22 0.34 0.35 0.12 0.10 0.29 0.21
PRECINCT 04003 0.16 0.12 0.12 0.14 0.30 0.14 0.15 0.71 0.12 0.13 0.70 0.26
PRECINCT 05001 0.24 0.31 0.24 0.21 0.15 0.23 0.32 0.34 0.26 0.29 0.27 0.26
PRECINCT 05002 0.11 0.08 0.11 0.08 0.30 0.10 0.07 0.27 0.15 0.13 0.24 0.15
PRECINCT 06001 0.18 0.24 0.27 0.17 0.66 0.22 0.25 0.46 0.20 0.18 0.35 0.30
PRECINCT 06002 0.08 0.11 0.12 0.08 0.28 0.09 0.12 0.20 0.10 0.11 0.21 0.14
PRECINCT 06003 0.12 0.12 0.14 0.10 0.24 0.10 0.10 0.24 0.10 0.11 0.21 0.15
PRECINCT 06004 0.26 0.28 0.42 0.27 0.35 0.28 0.27 0.39 0.28 0.24 0.31 0.31
PRECINCT 06005 0.30 0.45 0.41 0.46 0.17 0.40 0.51 0.30 0.30 0.34 0.29 0.36
PRECINCT 07001 0.19 0.21 0.18 0.14 0.22 0.13 0.22 0.40 0.13 0.09 0.37 0.21
PRECINCT 07002 0.04 0.05 0.03 0.04 0.32 0.08 0.07 0.38 0.08 0.06 0.59 0.17
PRECINCT 07003 0.30 0.45 0.45 0.31 0.31 0.36 0.48 0.26 0.38 0.39 0.24 0.36
PRECINCT 07004 0.33 0.48 0.48 0.32 0.42 0.42 0.51 0.43 0.37 0.41 0.41 0.42
PRECINCT 08001 0.33 0.39 0.36 0.44 0.56 0.39 0.31 0.46 0.40 0.48 0.47 0.43
PRECINCT 08002 0.27 0.29 0.30 0.23 0.28 0.26 0.33 0.60 0.24 0.24 0.39 0.32
PRECINCT 08003 0.35 0.36 0.38 0.31 0.35 0.38 0.44 0.67 0.32 0.35 0.27 0.38
PRECINCT 08004 0.10 0.09 0.10 0.09 0.38 0.10 0.11 0.31 0.12 0.11 0.30 0.17
PRECINCT 08005 0.36 0.42 0.38 0.38 0.40 0.41 0.44 0.23 0.47 0.42 0.29 0.38
PRECINCT 08006 0.42 0.47 0.40 0.35 0.34 0.39 0.45 0.31 0.41 0.43 0.31 0.38
PRECINCT 08007 0.08 0.11 0.10 0.07 0.25 0.10 0.11 0.24 0.11 0.10 0.13 0.13
PRECINCT 08008 0.13 0.19 0.21 0.16 0.26 0.17 0.19 0.10 0.22 0.18 0.33 0.20
PRECINCT 08009 0.16 0.23 0.23 0.18 0.30 0.22 0.26 0.31 0.24 0.21 0.61 0.28
PRECINCT 08010 0.94 1.09 1.30 0.95 0.30 0.97 0.88 0.50 1.10 1.03 0.36 0.85
PRECINCT 08011 0.15 0.14 0.16 0.13 0.55 0.14 0.14 0.31 0.15 0.15 0.37 0.22
PRECINCT 09001 0.15 0.15 0.12 0.16 0.32 0.16 0.17 0.43 0.16 0.13 0.56 0.24
PRECINCT 09002 0.24 0.23 0.22 0.24 0.34 0.24 0.23 0.50 0.29 0.22 0.32 0.28
PRECINCT 09003 0.38 0.39 0.42 0.41 0.12 0.36 0.37 0.39 0.40 0.37 0.15 0.34
PRECINCT 09004 0.81 0.74 0.76 0.80 0.15 0.68 0.53 0.09 0.68 0.66 0.23 0.53
PRECINCT 09005 0.68 0.56 0.60 0.61 0.24 0.58 0.47 0.31 0.58 0.58 0.41 0.49
PRECINCT 09006 0.79 0.73 0.68 0.73 0.65 0.75 0.58 0.58 0.72 0.70 0.18 0.63
PRECINCT 09007 0.53 0.50 0.48 0.49 0.42 0.50 0.47 0.20 0.53 0.50 0.20 0.43
PRECINCT 09008 0.25 0.30 0.28 0.24 0.18 0.31 0.37 0.21 0.33 0.31 0.16 0.27
PRECINCT 09009 0.25 0.22 0.22 0.23 0.20 0.23 0.24 0.16 0.24 0.21 0.17 0.21
PRECINCT 09010 0.25 0.30 0.30 0.24 0.09 0.26 0.30 0.13 0.24 0.25 0.31 0.24
PRECINCT 09011 0.04 0.04 0.03 0.03 0.17 0.04 0.07 0.25 0.05 0.05 0.33 0.11
PRECINCT 09012 0.37 0.39 0.38 0.33 0.35 0.39 0.39 0.08 0.45 0.41 0.06 0.32
PRECINCT 09013 0.20 0.24 0.22 0.19 0.95 0.22 0.22 0.50 0.26 0.22 0.32 0.33
PRECINCT 09014 0.30 0.33 0.30 0.27 0.26 0.32 0.34 0.99 0.37 0.36 0.40 0.40
PRECINCT 09015 0.40 0.46 0.40 0.37 0.38 0.36 0.41 0.27 0.42 0.34 1.11 0.45
PRECINCT 10001 0.24 0.32 0.28 0.25 0.77 0.26 0.28 0.47 0.27 0.26 0.30 0.35
PRECINCT 10002 0.41 0.41 0.36 0.35 0.40 0.32 0.30 0.32 0.43 0.35 0.38 0.36
PRECINCT 10003 0.05 0.10 0.09 0.07 0.86 0.08 0.12 1.12 0.09 0.08 0.40 0.30
PRECINCT 10004 0.11 0.16 0.16 0.11 0.28 0.14 0.15 0.29 0.14 0.14 0.88 0.24
PRECINCT 11001 0.23 0.32 0.26 0.29 0.66 0.29 0.35 0.58 0.20 0.23 0.25 0.34
PRECINCT 11002 0.15 0.14 0.16 0.13 0.14 0.13 0.12 0.14 0.17 0.10 0.72 0.20
PRECINCT 11003 0.40 0.44 0.49 0.46 0.39 0.43 0.34 0.17 0.42 0.42 0.20 0.38
PRECINCT 11004 0.20 0.17 0.16 0.17 0.06 0.17 0.21 0.11 0.20 0.21 0.17 0.16
PRECINCT 11005 0.08 0.11 0.10 0.10 0.21 0.11 0.13 0.41 0.08 0.10 0.10 0.14
PRECINCT 11006 0.41 0.40 0.47 0.44 0.23 0.45 0.50 0.86 0.44 0.38 0.23 0.44
PRECINCT 11007 0.26 0.34 0.31 0.27 0.37 0.30 0.34 0.41 0.22 0.25 0.22 0.30
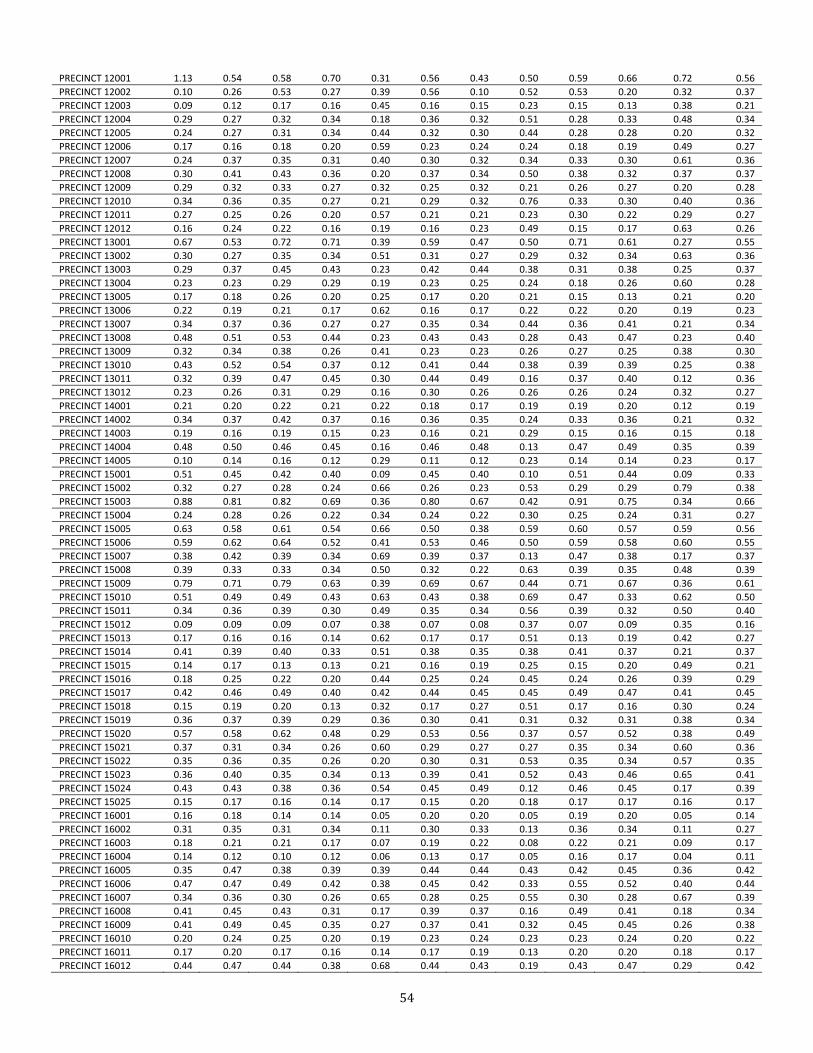
54
PRECINCT 12001 1.13 0.54 0.58 0.70 0.31 0.56 0.43 0.50 0.59 0.66 0.72 0.56
PRECINCT 12002 0.10 0.26 0.53 0.27 0.39 0.56 0.10 0.52 0.53 0.20 0.32 0.37
PRECINCT 12003 0.09 0.12 0.17 0.16 0.45 0.16 0.15 0.23 0.15 0.13 0.38 0.21
PRECINCT 12004 0.29 0.27 0.32 0.34 0.18 0.36 0.32 0.51 0.28 0.33 0.48 0.34
PRECINCT 12005 0.24 0.27 0.31 0.34 0.44 0.32 0.30 0.44 0.28 0.28 0.20 0.32
PRECINCT 12006 0.17 0.16 0.18 0.20 0.59 0.23 0.24 0.24 0.18 0.19 0.49 0.27
PRECINCT 12007 0.24 0.37 0.35 0.31 0.40 0.30 0.32 0.34 0.33 0.30 0.61 0.36
PRECINCT 12008 0.30 0.41 0.43 0.36 0.20 0.37 0.34 0.50 0.38 0.32 0.37 0.37
PRECINCT 12009 0.29 0.32 0.33 0.27 0.32 0.25 0.32 0.21 0.26 0.27 0.20 0.28
PRECINCT 12010 0.34 0.36 0.35 0.27 0.21 0.29 0.32 0.76 0.33 0.30 0.40 0.36
PRECINCT 12011 0.27 0.25 0.26 0.20 0.57 0.21 0.21 0.23 0.30 0.22 0.29 0.27
PRECINCT 12012 0.16 0.24 0.22 0.16 0.19 0.16 0.23 0.49 0.15 0.17 0.63 0.26
PRECINCT 13001 0.67 0.53 0.72 0.71 0.39 0.59 0.47 0.50 0.71 0.61 0.27 0.55
PRECINCT 13002 0.30 0.27 0.35 0.34 0.51 0.31 0.27 0.29 0.32 0.34 0.63 0.36
PRECINCT 13003 0.29 0.37 0.45 0.43 0.23 0.42 0.44 0.38 0.31 0.38 0.25 0.37
PRECINCT 13004 0.23 0.23 0.29 0.29 0.19 0.23 0.25 0.24 0.18 0.26 0.60 0.28
PRECINCT 13005 0.17 0.18 0.26 0.20 0.25 0.17 0.20 0.21 0.15 0.13 0.21 0.20
PRECINCT 13006 0.22 0.19 0.21 0.17 0.62 0.16 0.17 0.22 0.22 0.20 0.19 0.23
PRECINCT 13007 0.34 0.37 0.36 0.27 0.27 0.35 0.34 0.44 0.36 0.41 0.21 0.34
PRECINCT 13008 0.48 0.51 0.53 0.44 0.23 0.43 0.43 0.28 0.43 0.47 0.23 0.40
PRECINCT 13009 0.32 0.34 0.38 0.26 0.41 0.23 0.23 0.26 0.27 0.25 0.38 0.30
PRECINCT 13010 0.43 0.52 0.54 0.37 0.12 0.41 0.44 0.38 0.39 0.39 0.25 0.38
PRECINCT 13011 0.32 0.39 0.47 0.45 0.30 0.44 0.49 0.16 0.37 0.40 0.12 0.36
PRECINCT 13012 0.23 0.26 0.31 0.29 0.16 0.30 0.26 0.26 0.26 0.24 0.32 0.27
PRECINCT 14001 0.21 0.20 0.22 0.21 0.22 0.18 0.17 0.19 0.19 0.20 0.12 0.19
PRECINCT 14002 0.34 0.37 0.42 0.37 0.16 0.36 0.35 0.24 0.33 0.36 0.21 0.32
PRECINCT 14003 0.19 0.16 0.19 0.15 0.23 0.16 0.21 0.29 0.15 0.16 0.15 0.18
PRECINCT 14004 0.48 0.50 0.46 0.45 0.16 0.46 0.48 0.13 0.47 0.49 0.35 0.39
PRECINCT 14005 0.10 0.14 0.16 0.12 0.29 0.11 0.12 0.23 0.14 0.14 0.23 0.17
PRECINCT 15001 0.51 0.45 0.42 0.40 0.09 0.45 0.40 0.10 0.51 0.44 0.09 0.33
PRECINCT 15002 0.32 0.27 0.28 0.24 0.66 0.26 0.23 0.53 0.29 0.29 0.79 0.38
PRECINCT 15003 0.88 0.81 0.82 0.69 0.36 0.80 0.67 0.42 0.91 0.75 0.34 0.66
PRECINCT 15004 0.24 0.28 0.26 0.22 0.34 0.24 0.22 0.30 0.25 0.24 0.31 0.27
PRECINCT 15005 0.63 0.58 0.61 0.54 0.66 0.50 0.38 0.59 0.60 0.57 0.59 0.56
PRECINCT 15006 0.59 0.62 0.64 0.52 0.41 0.53 0.46 0.50 0.59 0.58 0.60 0.55
PRECINCT 15007 0.38 0.42 0.39 0.34 0.69 0.39 0.37 0.13 0.47 0.38 0.17 0.37
PRECINCT 15008 0.39 0.33 0.33 0.34 0.50 0.32 0.22 0.63 0.39 0.35 0.48 0.39
PRECINCT 15009 0.79 0.71 0.79 0.63 0.39 0.69 0.67 0.44 0.71 0.67 0.36 0.61
PRECINCT 15010 0.51 0.49 0.49 0.43 0.63 0.43 0.38 0.69 0.47 0.33 0.62 0.50
PRECINCT 15011 0.34 0.36 0.39 0.30 0.49 0.35 0.34 0.56 0.39 0.32 0.50 0.40
PRECINCT 15012 0.09 0.09 0.09 0.07 0.38 0.07 0.08 0.37 0.07 0.09 0.35 0.16
PRECINCT 15013 0.17 0.16 0.16 0.14 0.62 0.17 0.17 0.51 0.13 0.19 0.42 0.27
PRECINCT 15014 0.41 0.39 0.40 0.33 0.51 0.38 0.35 0.38 0.41 0.37 0.21 0.37
PRECINCT 15015 0.14 0.17 0.13 0.13 0.21 0.16 0.19 0.25 0.15 0.20 0.49 0.21
PRECINCT 15016 0.18 0.25 0.22 0.20 0.44 0.25 0.24 0.45 0.24 0.26 0.39 0.29
PRECINCT 15017 0.42 0.46 0.49 0.40 0.42 0.44 0.45 0.45 0.49 0.47 0.41 0.45
PRECINCT 15018 0.15 0.19 0.20 0.13 0.32 0.17 0.27 0.51 0.17 0.16 0.30 0.24
PRECINCT 15019 0.36 0.37 0.39 0.29 0.36 0.30 0.41 0.31 0.32 0.31 0.38 0.34
PRECINCT 15020 0.57 0.58 0.62 0.48 0.29 0.53 0.56 0.37 0.57 0.52 0.38 0.49
PRECINCT 15021 0.37 0.31 0.34 0.26 0.60 0.29 0.27 0.27 0.35 0.34 0.60 0.36
PRECINCT 15022 0.35 0.36 0.35 0.26 0.20 0.30 0.31 0.53 0.35 0.34 0.57 0.35
PRECINCT 15023 0.36 0.40 0.35 0.34 0.13 0.39 0.41 0.52 0.43 0.46 0.65 0.41
PRECINCT 15024 0.43 0.43 0.38 0.36 0.54 0.45 0.49 0.12 0.46 0.45 0.17 0.39
PRECINCT 15025 0.15 0.17 0.16 0.14 0.17 0.15 0.20 0.18 0.17 0.17 0.16 0.17
PRECINCT 16001 0.16 0.18 0.14 0.14 0.05 0.20 0.20 0.05 0.19 0.20 0.05 0.14
PRECINCT 16002 0.31 0.35 0.31 0.34 0.11 0.30 0.33 0.13 0.36 0.34 0.11 0.27
PRECINCT 16003 0.18 0.21 0.21 0.17 0.07 0.19 0.22 0.08 0.22 0.21 0.09 0.17
PRECINCT 16004 0.14 0.12 0.10 0.12 0.06 0.13 0.17 0.05 0.16 0.17 0.04 0.11
PRECINCT 16005 0.35 0.47 0.38 0.39 0.39 0.44 0.44 0.43 0.42 0.45 0.36 0.42
PRECINCT 16006 0.47 0.47 0.49 0.42 0.38 0.45 0.42 0.33 0.55 0.52 0.40 0.44
PRECINCT 16007 0.34 0.36 0.30 0.26 0.65 0.28 0.25 0.55 0.30 0.28 0.67 0.39
PRECINCT 16008 0.41 0.45 0.43 0.31 0.17 0.39 0.37 0.16 0.49 0.41 0.18 0.34
PRECINCT 16009 0.41 0.49 0.45 0.35 0.27 0.37 0.41 0.32 0.45 0.45 0.26 0.38
PRECINCT 16010 0.20 0.24 0.25 0.20 0.19 0.23 0.24 0.23 0.23 0.24 0.20 0.22
PRECINCT 16011 0.17 0.20 0.17 0.16 0.14 0.17 0.19 0.13 0.20 0.20 0.18 0.17
PRECINCT 16012 0.44 0.47 0.44 0.38 0.68 0.44 0.43 0.19 0.43 0.47 0.29 0.42
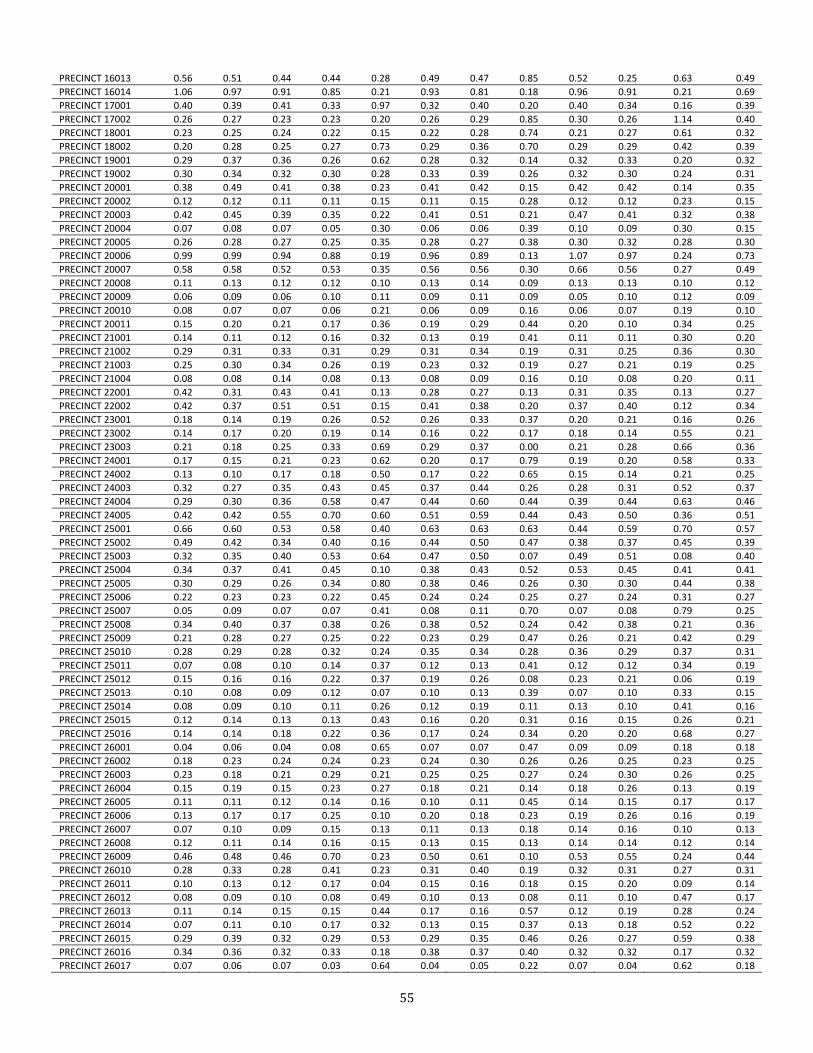
55
PRECINCT 16013 0.56 0.51 0.44 0.44 0.28 0.49 0.47 0.85 0.52 0.25 0.63 0.49
PRECINCT 16014 1.06 0.97 0.91 0.85 0.21 0.93 0.81 0.18 0.96 0.91 0.21 0.69
PRECINCT 17001 0.40 0.39 0.41 0.33 0.97 0.32 0.40 0.20 0.40 0.34 0.16 0.39
PRECINCT 17002 0.26 0.27 0.23 0.23 0.20 0.26 0.29 0.85 0.30 0.26 1.14 0.40
PRECINCT 18001 0.23 0.25 0.24 0.22 0.15 0.22 0.28 0.74 0.21 0.27 0.61 0.32
PRECINCT 18002 0.20 0.28 0.25 0.27 0.73 0.29 0.36 0.70 0.29 0.29 0.42 0.39
PRECINCT 19001 0.29 0.37 0.36 0.26 0.62 0.28 0.32 0.14 0.32 0.33 0.20 0.32
PRECINCT 19002 0.30 0.34 0.32 0.30 0.28 0.33 0.39 0.26 0.32 0.30 0.24 0.31
PRECINCT 20001 0.38 0.49 0.41 0.38 0.23 0.41 0.42 0.15 0.42 0.42 0.14 0.35
PRECINCT 20002 0.12 0.12 0.11 0.11 0.15 0.11 0.15 0.28 0.12 0.12 0.23 0.15
PRECINCT 20003 0.42 0.45 0.39 0.35 0.22 0.41 0.51 0.21 0.47 0.41 0.32 0.38
PRECINCT 20004 0.07 0.08 0.07 0.05 0.30 0.06 0.06 0.39 0.10 0.09 0.30 0.15
PRECINCT 20005 0.26 0.28 0.27 0.25 0.35 0.28 0.27 0.38 0.30 0.32 0.28 0.30
PRECINCT 20006 0.99 0.99 0.94 0.88 0.19 0.96 0.89 0.13 1.07 0.97 0.24 0.73
PRECINCT 20007 0.58 0.58 0.52 0.53 0.35 0.56 0.56 0.30 0.66 0.56 0.27 0.49
PRECINCT 20008 0.11 0.13 0.12 0.12 0.10 0.13 0.14 0.09 0.13 0.13 0.10 0.12
PRECINCT 20009 0.06 0.09 0.06 0.10 0.11 0.09 0.11 0.09 0.05 0.10 0.12 0.09
PRECINCT 20010 0.08 0.07 0.07 0.06 0.21 0.06 0.09 0.16 0.06 0.07 0.19 0.10
PRECINCT 20011 0.15 0.20 0.21 0.17 0.36 0.19 0.29 0.44 0.20 0.10 0.34 0.25
PRECINCT 21001 0.14 0.11 0.12 0.16 0.32 0.13 0.19 0.41 0.11 0.11 0.30 0.20
PRECINCT 21002 0.29 0.31 0.33 0.31 0.29 0.31 0.34 0.19 0.31 0.25 0.36 0.30
PRECINCT 21003 0.25 0.30 0.34 0.26 0.19 0.23 0.32 0.19 0.27 0.21 0.19 0.25
PRECINCT 21004 0.08 0.08 0.14 0.08 0.13 0.08 0.09 0.16 0.10 0.08 0.20 0.11
PRECINCT 22001 0.42 0.31 0.43 0.41 0.13 0.28 0.27 0.13 0.31 0.35 0.13 0.27
PRECINCT 22002 0.42 0.37 0.51 0.51 0.15 0.41 0.38 0.20 0.37 0.40 0.12 0.34
PRECINCT 23001 0.18 0.14 0.19 0.26 0.52 0.26 0.33 0.37 0.20 0.21 0.16 0.26
PRECINCT 23002 0.14 0.17 0.20 0.19 0.14 0.16 0.22 0.17 0.18 0.14 0.55 0.21
PRECINCT 23003 0.21 0.18 0.25 0.33 0.69 0.29 0.37 0.00 0.21 0.28 0.66 0.36
PRECINCT 24001 0.17 0.15 0.21 0.23 0.62 0.20 0.17 0.79 0.19 0.20 0.58 0.33
PRECINCT 24002 0.13 0.10 0.17 0.18 0.50 0.17 0.22 0.65 0.15 0.14 0.21 0.25
PRECINCT 24003 0.32 0.27 0.35 0.43 0.45 0.37 0.44 0.26 0.28 0.31 0.52 0.37
PRECINCT 24004 0.29 0.30 0.36 0.58 0.47 0.44 0.60 0.44 0.39 0.44 0.63 0.46
PRECINCT 24005 0.42 0.42 0.55 0.70 0.60 0.51 0.59 0.44 0.43 0.50 0.36 0.51
PRECINCT 25001 0.66 0.60 0.53 0.58 0.40 0.63 0.63 0.63 0.44 0.59 0.70 0.57
PRECINCT 25002 0.49 0.42 0.34 0.40 0.16 0.44 0.50 0.47 0.38 0.37 0.45 0.39
PRECINCT 25003 0.32 0.35 0.40 0.53 0.64 0.47 0.50 0.07 0.49 0.51 0.08 0.40
PRECINCT 25004 0.34 0.37 0.41 0.45 0.10 0.38 0.43 0.52 0.53 0.45 0.41 0.41
PRECINCT 25005 0.30 0.29 0.26 0.34 0.80 0.38 0.46 0.26 0.30 0.30 0.44 0.38
PRECINCT 25006 0.22 0.23 0.23 0.22 0.45 0.24 0.24 0.25 0.27 0.24 0.31 0.27
PRECINCT 25007 0.05 0.09 0.07 0.07 0.41 0.08 0.11 0.70 0.07 0.08 0.79 0.25
PRECINCT 25008 0.34 0.40 0.37 0.38 0.26 0.38 0.52 0.24 0.42 0.38 0.21 0.36
PRECINCT 25009 0.21 0.28 0.27 0.25 0.22 0.23 0.29 0.47 0.26 0.21 0.42 0.29
PRECINCT 25010 0.28 0.29 0.28 0.32 0.24 0.35 0.34 0.28 0.36 0.29 0.37 0.31
PRECINCT 25011 0.07 0.08 0.10 0.14 0.37 0.12 0.13 0.41 0.12 0.12 0.34 0.19
PRECINCT 25012 0.15 0.16 0.16 0.22 0.37 0.19 0.26 0.08 0.23 0.21 0.06 0.19
PRECINCT 25013 0.10 0.08 0.09 0.12 0.07 0.10 0.13 0.39 0.07 0.10 0.33 0.15
PRECINCT 25014 0.08 0.09 0.10 0.11 0.26 0.12 0.19 0.11 0.13 0.10 0.41 0.16
PRECINCT 25015 0.12 0.14 0.13 0.13 0.43 0.16 0.20 0.31 0.16 0.15 0.26 0.21
PRECINCT 25016 0.14 0.14 0.18 0.22 0.36 0.17 0.24 0.34 0.20 0.20 0.68 0.27
PRECINCT 26001 0.04 0.06 0.04 0.08 0.65 0.07 0.07 0.47 0.09 0.09 0.18 0.18
PRECINCT 26002 0.18 0.23 0.24 0.24 0.23 0.24 0.30 0.26 0.26 0.25 0.23 0.25
PRECINCT 26003 0.23 0.18 0.21 0.29 0.21 0.25 0.25 0.27 0.24 0.30 0.26 0.25
PRECINCT 26004 0.15 0.19 0.15 0.23 0.27 0.18 0.21 0.14 0.18 0.26 0.13 0.19
PRECINCT 26005 0.11 0.11 0.12 0.14 0.16 0.10 0.11 0.45 0.14 0.15 0.17 0.17
PRECINCT 26006 0.13 0.17 0.17 0.25 0.10 0.20 0.18 0.23 0.19 0.26 0.16 0.19
PRECINCT 26007 0.07 0.10 0.09 0.15 0.13 0.11 0.13 0.18 0.14 0.16 0.10 0.13
PRECINCT 26008 0.12 0.11 0.14 0.16 0.15 0.13 0.15 0.13 0.14 0.14 0.12 0.14
PRECINCT 26009 0.46 0.48 0.46 0.70 0.23 0.50 0.61 0.10 0.53 0.55 0.24 0.44
PRECINCT 26010 0.28 0.33 0.28 0.41 0.23 0.31 0.40 0.19 0.32 0.31 0.27 0.31
PRECINCT 26011 0.10 0.13 0.12 0.17 0.04 0.15 0.16 0.18 0.15 0.20 0.09 0.14
PRECINCT 26012 0.08 0.09 0.10 0.08 0.49 0.10 0.13 0.08 0.11 0.10 0.47 0.17
PRECINCT 26013 0.11 0.14 0.15 0.15 0.44 0.17 0.16 0.57 0.12 0.19 0.28 0.24
PRECINCT 26014 0.07 0.11 0.10 0.17 0.32 0.13 0.15 0.37 0.13 0.18 0.52 0.22
PRECINCT 26015 0.29 0.39 0.32 0.29 0.53 0.29 0.35 0.46 0.26 0.27 0.59 0.38
PRECINCT 26016 0.34 0.36 0.32 0.33 0.18 0.38 0.37 0.40 0.32 0.32 0.17 0.32
PRECINCT 26017 0.07 0.06 0.07 0.03 0.64 0.04 0.05 0.22 0.07 0.04 0.62 0.18

56
PRECINCT 26018 0.27 0.82 0.87 0.66 0.67 0.57 0.38 0.78 0.53 0.66 0.69 0.66
PRECINCT 26019 0.37 0.41 0.42 0.32 0.69 0.35 0.35 0.83 0.33 0.38 0.69 0.48
PRECINCT 26020 0.18 0.17 0.19 0.11 0.55 0.15 0.17 0.77 0.12 0.12 0.62 0.30
PRECINCT 26021 0.17 0.63 0.71 0.54 0.48 0.41 0.65 0.44 0.51 0.47 0.52 0.53
PRECINCT 26022 0.17 0.17 0.17 0.16 0.23 0.18 0.18 0.42 0.14 0.17 0.21 0.20
PRECINCT 26023 0.21 0.24 0.18 0.21 0.52 0.24 0.27 0.25 0.16 0.18 0.51 0.28
PRECINCT 26024 0.47 0.54 0.44 0.41 0.47 0.50 0.54 0.62 0.37 0.41 0.47 0.48
PRECINCT 26025 0.31 0.28 0.27 0.23 0.40 0.34 0.39 0.58 0.39 0.29 0.39 0.36
PRECINCT 26026 0.34 0.35 0.33 0.35 0.47 0.39 0.41 0.36 0.38 0.36 0.49 0.39
PRECINCT 26027 0.32 0.33 0.30 0.32 0.18 0.35 0.34 0.34 0.31 0.30 0.18 0.29
PRECINCT 26028 0.32 0.30 0.27 0.23 0.34 0.28 0.29 0.23 0.26 0.24 0.34 0.28
PRECINCT 26029 0.87 0.92 0.75 0.85 0.27 1.02 1.02 0.45 0.82 0.91 0.26 0.73
PRECINCT 26030 0.19 0.20 0.17 0.19 0.23 0.22 0.22 0.31 0.19 0.24 0.10 0.21
PRECINCT 26031 0.16 0.14 0.15 0.18 0.11 0.17 0.18 0.12 0.18 0.15 0.10 0.15
PRECINCT 27001 0.44 0.54 0.50 0.51 0.35 0.56 0.54 0.12 0.56 0.51 0.35 0.45
PRECINCT 27002 0.23 0.21 0.26 0.26 0.10 0.21 0.18 0.30 0.26 0.25 0.50 0.25
PRECINCT 27003 0.19 0.20 0.23 0.22 0.29 0.20 0.18 0.34 0.22 0.20 0.14 0.22
PRECINCT 27004 0.16 0.13 0.15 0.16 0.18 0.14 0.15 0.14 0.15 0.15 0.23 0.16
PRECINCT 27005 0.52 0.54 0.58 0.57 0.22 0.59 0.58 0.20 0.57 0.57 0.24 0.46
PRECINCT 27006 0.67 0.71 0.60 0.69 0.28 0.78 0.75 0.28 0.63 0.72 0.26 0.57
PRECINCT 27007 0.31 0.29 0.29 0.27 0.19 0.31 0.31 0.23 0.27 0.24 0.46 0.29
PRECINCT 27008 0.54 0.53 0.52 0.59 0.48 0.63 0.61 0.55 0.52 0.58 0.11 0.51
PRECINCT 27009 0.33 0.33 0.34 0.37 0.47 0.35 0.36 0.13 0.31 0.35 0.08 0.31
PRECINCT 27010 0.20 0.18 0.17 0.21 0.13 0.17 0.18 0.09 0.17 0.19 0.35 0.18
PRECINCT 27011 0.55 0.48 0.44 0.58 0.06 0.55 0.59 0.42 0.43 0.54 0.18 0.43
PRECINCT 27012 0.13 0.11 0.10 0.14 0.17 0.12 0.14 0.16 0.01 0.11 0.08 0.11
PRECINCT 27013 0.48 0.44 0.46 0.52 0.21 0.58 0.67 0.07 0.49 0.49 0.06 0.40
PRECINCT 27014 0.65 0.56 0.60 0.63 0.15 0.65 0.64 0.08 0.60 0.62 0.18 0.47
PRECINCT 27015 0.64 0.54 0.55 0.52 0.06 0.54 0.51 0.16 0.54 0.52 0.16 0.41
PRECINCT 27016 0.21 0.20 0.22 0.22 0.09 0.19 0.18 0.12 0.21 0.20 0.23 0.19
PRECINCT 27017 0.40 0.41 0.41 0.41 0.21 0.38 0.32 0.20 0.43 0.40 0.13 0.33
PRECINCT 27018 0.57 0.58 0.56 0.58 0.15 0.55 0.45 0.11 0.68 0.53 0.20 0.44
PRECINCT 27019 0.20 0.20 0.18 0.20 0.36 0.20 0.19 0.17 0.16 0.19 0.04 0.19
PRECINCT 27020 0.68 0.62 0.56 0.56 0.15 0.71 0.68 0.06 0.65 0.68 0.14 0.48
PRECINCT 27021 0.71 0.68 0.57 0.60 0.87 0.72 0.67 0.09 0.54 0.63 0.11 0.55
PRECINCT 27022 1.14 0.97 0.96 0.89 0.09 0.91 0.76 1.03 0.90 0.90 0.26 0.77
PRECINCT 27023 0.28 0.22 0.24 0.24 0.29 0.23 0.17 0.12 0.24 0.23 0.39 0.24
PRECINCT 27024 0.28 0.20 0.19 0.18 0.41 0.20 0.17 0.27 0.21 0.21 0.37 0.24
PRECINCT 27025 0.52 0.47 0.51 0.48 0.48 0.44 0.38 0.43 0.49 0.47 0.84 0.50
PRECINCT 27026 0.36 0.37 0.34 0.35 0.28 0.30 0.25 0.31 0.35 0.33 0.45 0.33
PRECINCT 27027 0.64 0.57 0.51 0.53 0.32 0.52 0.49 0.52 0.56 0.52 0.32 0.49
PRECINCT 27028 0.51 0.43 0.40 0.41 0.58 0.43 0.38 0.24 0.43 0.41 0.34 0.40
PRECINCT 27029 0.31 0.27 0.24 0.26 0.22 0.28 0.26 0.40 0.27 0.25 0.66 0.31
PRECINCT 27030 0.50 0.40 0.39 0.34 0.19 0.42 0.41 0.51 0.36 0.36 0.21 0.36
PRECINCT 27031 0.75 0.69 0.59 0.63 0.34 0.68 0.62 0.27 0.57 0.61 0.42 0.54
PRECINCT 27032 0.65 0.68 0.60 0.67 0.12 0.67 0.62 0.31 0.61 0.66 0.13 0.51
PRECINCT 27033 0.74 0.73 0.71 0.75 0.38 0.79 0.67 0.16 0.73 0.71 0.39 0.60
PRECINCT 27034 0.49 0.45 0.43 0.39 0.40 0.47 0.43 0.48 0.51 0.44 0.25 0.43
PRECINCT 27035 0.85 0.85 0.75 0.78 0.31 0.85 0.80 0.26 0.87 0.75 0.30 0.65
PRECINCT 27036 0.29 0.25 0.25 0.25 0.38 0.24 0.27 0.31 0.28 0.27 0.41 0.29
PRECINCT 27037 0.22 0.20 0.22 0.30 0.10 0.22 0.20 0.41 0.19 0.24 0.10 0.22
PRECINCT 27038 0.41 0.41 0.47 0.47 0.39 0.45 0.38 0.10 0.53 0.46 0.17 0.38
PRECINCT 27039 0.36 0.31 0.31 0.38 0.31 0.32 0.26 0.20 0.29 0.35 0.37 0.31
PRECINCT 27040 0.53 0.45 0.42 0.62 0.46 0.56 0.48 0.46 0.44 0.57 0.50 0.50
PRECINCT 27041 0.66 0.58 0.57 0.76 0.12 0.66 0.53 0.35 0.52 0.69 0.06 0.48
PRECINCT 27042 0.70 0.50 0.50 0.70 0.23 0.60 0.49 0.07 0.50 0.64 0.25 0.45
PRECINCT 27043 0.38 0.32 0.34 0.41 0.31 0.31 0.24 0.09 0.26 0.39 0.35 0.30
PRECINCT 27044 0.43 0.45 0.42 0.53 0.21 0.51 0.38 0.34 0.36 0.51 0.26 0.40
PRECINCT 27045 0.48 0.56 0.52 0.73 0.18 0.70 0.53 0.17 0.59 0.73 0.16 0.49
PRECINCT 27046 0.32 0.33 0.29 0.45 0.16 0.34 0.26 0.10 0.39 0.37 0.15 0.28
PRECINCT 27047 0.24 0.22 0.31 0.26 0.31 0.27 0.28 0.15 0.26 0.26 0.36 0.27
PRECINCT 27048 0.55 0.47 0.48 0.42 0.37 0.39 0.29 0.29 0.49 0.39 0.37 0.40
PRECINCT 27049 1.00 0.96 0.87 1.16 0.68 1.08 0.80 0.48 0.88 1.25 0.65 0.88
PRECINCT 27050 0.56 0.55 0.50 0.57 0.38 0.51 0.37 0.77 0.51 0.58 0.36 0.51
PRECINCT 27051 0.11 0.11 0.12 0.06 0.85 0.08 0.06 0.46 0.14 0.10 0.80 0.28
PRECINCT 27052 0.74 0.80 0.68 0.71 0.34 0.72 0.72 0.99 0.78 0.79 0.39 0.69

57
PRECINCT 27053 0.45 0.42 0.38 0.34 0.38 0.40 0.41 0.39 0.47 0.43 0.39 0.40
PRECINCT 27054 0.14 0.13 0.08 0.10 0.47 0.12 0.14 0.47 0.14 0.12 0.46 0.22
PRECINCT 27055 0.16 0.18 0.18 0.13 0.52 0.19 0.21 0.53 0.22 0.20 0.53 0.29
PRECINCT 27056 0.24 0.25 0.25 0.23 0.82 0.26 0.28 0.94 0.30 0.24 0.80 0.44
PRECINCT 27057 0.61 0.57 0.53 0.48 0.31 0.55 0.54 0.33 0.65 0.55 0.30 0.48
PRECINCT 27058 0.18 0.17 0.16 0.14 0.77 0.15 0.17 0.55 0.18 0.17 0.53 0.30
PRECINCT 27059 0.26 0.25 0.21 0.19 0.59 0.23 0.23 0.74 0.27 0.23 0.65 0.36
PRECINCT 27060 0.53 0.26 0.26 0.24 0.25 0.26 0.24 0.36 0.31 0.25 0.80 0.32
PRECINCT 27061 0.20 0.08 0.13 0.35 0.41 0.04 0.03 0.46 0.12 0.06 0.26 0.19
PRECINCT 27062 0.49 0.54 0.53 0.63 0.44 0.55 0.58 0.57 0.57 0.64 0.11 0.52
PRECINCT 27063 0.63 0.46 0.48 0.56 0.45 0.44 0.43 0.48 0.46 0.54 0.38 0.47
PRECINCT 27064 0.55 0.43 0.43 0.66 0.63 0.47 0.45 0.36 0.36 0.58 0.46 0.48
PRECINCT 27065 0.99 0.79 0.86 1.21 0.39 0.90 0.86 0.55 0.79 1.22 0.44 0.80
PRECINCT 27066 0.70 0.55 0.58 0.80 0.53 0.60 0.58 0.47 0.50 0.88 0.75 0.62
PRECINCT 27067 0.62 0.53 0.59 0.67 0.20 0.57 0.56 0.69 0.51 0.66 0.38 0.54
PRECINCT 28001 0.41 0.33 0.33 0.32 0.24 0.32 0.36 0.19 0.29 0.31 0.23 0.29
PRECINCT 28002 0.95 0.78 0.79 0.76 0.66 0.80 0.62 0.21 0.93 0.83 0.25 0.66
PRECINCT 28003 0.14 0.14 0.14 0.12 0.40 0.13 0.12 0.47 0.15 0.14 0.67 0.25
PRECINCT 28004 0.25 0.23 0.22 0.21 0.11 0.21 0.18 0.52 0.24 0.23 0.43 0.26
PRECINCT 28005 0.65 0.56 0.53 0.52 0.24 0.53 0.46 0.12 0.57 0.49 0.15 0.42
PRECINCT 28006 0.92 0.80 0.73 0.72 0.35 0.76 0.65 0.13 0.85 0.74 0.12 0.59
PRECINCT 28007 0.44 0.43 0.43 0.35 0.43 0.41 0.35 0.16 0.47 0.42 0.23 0.37
PRECINCT 28008 0.57 0.46 0.43 0.42 0.18 0.43 0.40 0.24 0.45 0.41 0.32 0.37
PRECINCT 28009 0.47 0.39 0.41 0.43 0.13 0.51 0.52 0.46 0.47 0.47 0.39 0.42
PRECINCT 28010 0.71 0.68 0.64 0.59 0.34 0.69 0.60 0.14 0.65 0.62 0.14 0.51
PRECINCT 28011 0.87 0.74 0.73 0.74 0.67 0.71 0.57 0.20 0.87 0.73 0.35 0.63
PRECINCT 28012 0.17 0.12 0.13 0.14 0.51 0.14 0.11 0.00 0.14 0.12 0.13 0.17
PRECINCT 28013 0.44 0.39 0.36 0.32 0.29 0.37 0.36 0.20 0.47 0.45 0.63 0.39
PRECINCT 28014 0.17 0.16 0.13 0.17 0.38 0.15 0.16 0.32 0.12 0.17 0.27 0.20
PRECINCT 28015 0.81 0.65 0.69 0.77 0.11 0.80 0.76 0.65 0.69 0.73 0.39 0.63
TOTAL 100 100 100 100 100 100 100 100 100 100 100 100

58
Table 50: Number of Poll Workers by Precinct
PrecinctAverage%ofVotesinEach
Precinct
Voterturnout
(40.25%)
Registeredvoters
NumberofVotingMachines(1per
every200Registered
Voters)
VotesperMachine
AdditionalVotingMachineforPrecinctswith>90thPercentileofNumberofVotersperVotingMachine
TotalVoting
Machines
TotalNumberof
PollWorkers
PRECINCT 01001
0.0026
327 802 4 82 4 5
PRECINCT 01002
0.0041
518 992 5 104 5 5
PRECINCT 01003
0.0039
490 1467 7 67 7 5
PRECINCT 01004
0.0053
667 1643 8 81 8 5
PRECINCT 01005
0.0061
768 1627 8 94 8 5
PRECINCT 02001
0.0032
410 1443 7 57 7 5
PRECINCT 02002
0.0034
429 995 5 86 5 5
PRECINCT 02003
0.0040
506 554 3 183 3 5
PRECINCT 03001
0.0027
341 580 3 118 3 5
PRECINCT 03002
0.0013
170 753 4 45 4 5
PRECINCT 03003
0.0028
348 919 5 76 5 5
PRECINCT 04001
0.0017
213 428 2 100 2 5
PRECINCT 04002
0.0021
266 1263 6 42 6 5
PRECINCT 04003
0.0026
332 1309 7 51 7 5
PRECINCT 05001
0.0026
331 1843 9 36 9 5
PRECINCT 05002
0.0015
192 819 4 47 4 5
PRECINCT 06001
0.0030
379 1150 6 66 6 5
PRECINCT 06002
0.0014
180 519 3 69 3 5
PRECINCT 06003
0.0015
185 521 3 71 3 5
PRECINCT 06004
0.0031
391 705 4 111 4 5
PRECINCT 06005
0.0036
459 1326 7 69 7 5
PRECINCT 07001
0.0021
265 3091 15 17 15 6
PRECINCT 07002
0.0017
215 1249 6 34 6 5
PRECINCT 07003
0.0036
457 1215 6 75 6 5
PRECINCT 07004
0.0042
537 1644 8 65 8 5
PRECINCT 08001
0.0043
539 955 5 113 5 5
PRECINCT 08002
0.0032
402 1021 5 79 5 5
PRECINCT 08003
0.0038
485 1267 6 77 6 5
PRECINCT 08004
0.0017
215 990 5 43 5 5
PRECINCT 08005
0.0038
483 2101 11 46 11 6
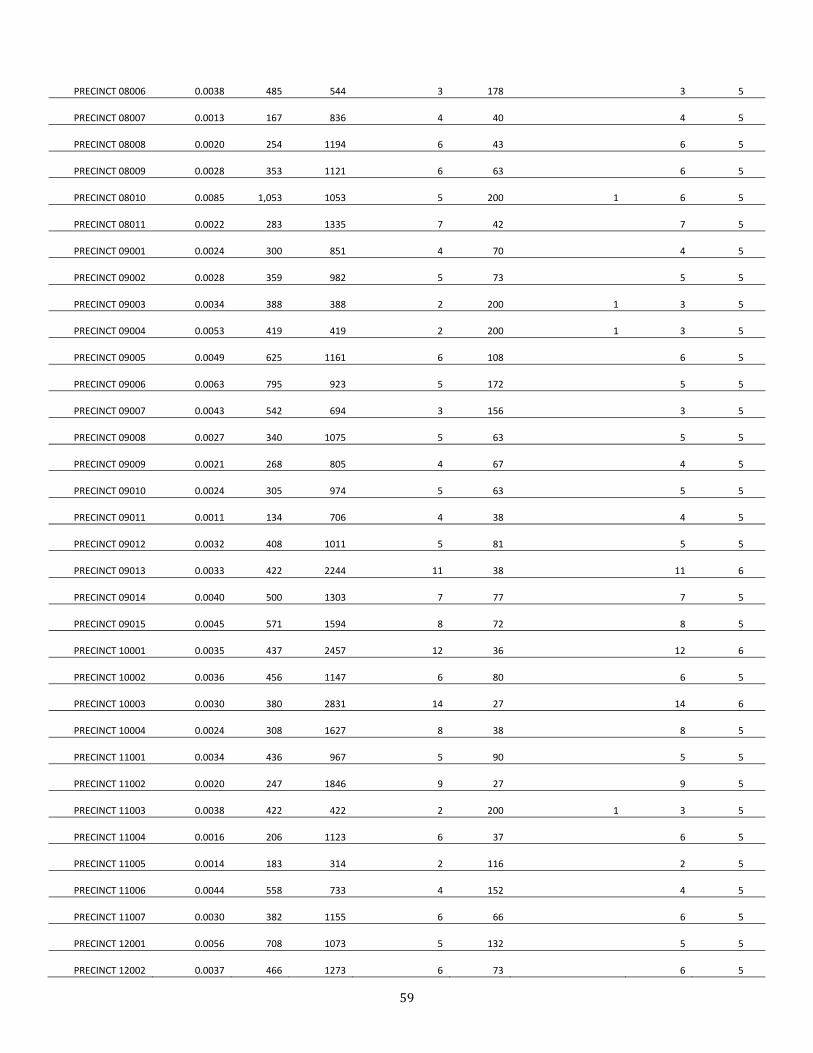
59
PRECINCT 08006
0.0038
485 544 3 178 3 5
PRECINCT 08007
0.0013
167 836 4 40 4 5
PRECINCT 08008
0.0020
254 1194 6 43 6 5
PRECINCT 08009
0.0028
353 1121 6 63 6 5
PRECINCT 08010
0.0085
1,053 1053 5 200 1 6 5
PRECINCT 08011
0.0022
283 1335 7 42 7 5
PRECINCT 09001
0.0024
300 851 4 70 4 5
PRECINCT 09002
0.0028
359 982 5 73 5 5
PRECINCT 09003
0.0034
388 388 2 200 1 3 5
PRECINCT 09004
0.0053
419 419 2 200 1 3 5
PRECINCT 09005
0.0049
625 1161 6 108 6 5
PRECINCT 09006
0.0063
795 923 5 172 5 5
PRECINCT 09007
0.0043
542 694 3 156 3 5
PRECINCT 09008
0.0027
340 1075 5 63 5 5
PRECINCT 09009
0.0021
268 805 4 67 4 5
PRECINCT 09010
0.0024
305 974 5 63 5 5
PRECINCT 09011
0.0011
134 706 4 38 4 5
PRECINCT 09012
0.0032
408 1011 5 81 5 5
PRECINCT 09013
0.0033
422 2244 11 38 11 6
PRECINCT 09014
0.0040
500 1303 7 77 7 5
PRECINCT 09015
0.0045
571 1594 8 72 8 5
PRECINCT 10001
0.0035
437 2457 12 36 12 6
PRECINCT 10002
0.0036
456 1147 6 80 6 5
PRECINCT 10003
0.0030
380 2831 14 27 14 6
PRECINCT 10004
0.0024
308 1627 8 38 8 5
PRECINCT 11001
0.0034
436 967 5 90 5 5
PRECINCT 11002
0.0020
247 1846 9 27 9 5
PRECINCT 11003
0.0038
422 422 2 200 1 3 5
PRECINCT 11004
0.0016
206 1123 6 37 6 5
PRECINCT 11005
0.0014
183 314 2 116 2 5
PRECINCT 11006
0.0044
558 733 4 152 4 5
PRECINCT 11007
0.0030
382 1155 6 66 6 5
PRECINCT 12001
0.0056
708 1073 5 132 5 5
PRECINCT 12002
0.0037
466 1273 6 73 6 5
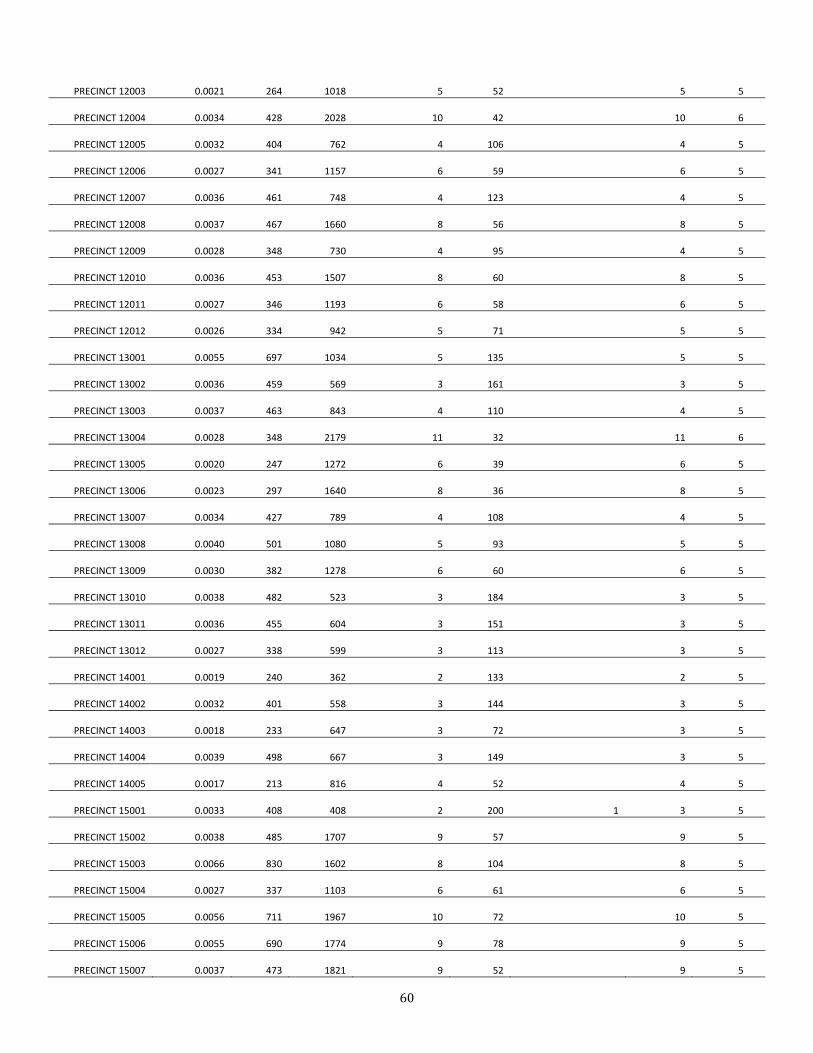
60
PRECINCT 12003
0.0021
264 1018 5 52 5 5
PRECINCT 12004
0.0034
428 2028 10 42 10 6
PRECINCT 12005
0.0032
404 762 4 106 4 5
PRECINCT 12006
0.0027
341 1157 6 59 6 5
PRECINCT 12007
0.0036
461 748 4 123 4 5
PRECINCT 12008
0.0037
467 1660 8 56 8 5
PRECINCT 12009
0.0028
348 730 4 95 4 5
PRECINCT 12010
0.0036
453 1507 8 60 8 5
PRECINCT 12011
0.0027
346 1193 6 58 6 5
PRECINCT 12012
0.0026
334 942 5 71 5 5
PRECINCT 13001
0.0055
697 1034 5 135 5 5
PRECINCT 13002
0.0036
459 569 3 161 3 5
PRECINCT 13003
0.0037
463 843 4 110 4 5
PRECINCT 13004
0.0028
348 2179 11 32 11 6
PRECINCT 13005
0.0020
247 1272 6 39 6 5
PRECINCT 13006
0.0023
297 1640 8 36 8 5
PRECINCT 13007
0.0034
427 789 4 108 4 5
PRECINCT 13008
0.0040
501 1080 5 93 5 5
PRECINCT 13009
0.0030
382 1278 6 60 6 5
PRECINCT 13010
0.0038
482 523 3 184 3 5
PRECINCT 13011
0.0036
455 604 3 151 3 5
PRECINCT 13012
0.0027
338 599 3 113 3 5
PRECINCT 14001
0.0019
240 362 2 133 2 5
PRECINCT 14002
0.0032
401 558 3 144 3 5
PRECINCT 14003
0.0018
233 647 3 72 3 5
PRECINCT 14004
0.0039
498 667 3 149 3 5
PRECINCT 14005
0.0017
213 816 4 52 4 5
PRECINCT 15001
0.0033
408 408 2 200 1 3 5
PRECINCT 15002
0.0038
485 1707 9 57 9 5
PRECINCT 15003
0.0066
830 1602 8 104 8 5
PRECINCT 15004
0.0027
337 1103 6 61 6 5
PRECINCT 15005
0.0056
711 1967 10 72 10 5
PRECINCT 15006
0.0055
690 1774 9 78 9 5
PRECINCT 15007
0.0037
473 1821 9 52 9 5

61
PRECINCT 15008
0.0039
492 1773 9 56 9 5
PRECINCT 15009
0.0061
768 1145 6 134 6 5
PRECINCT 15010
0.0050
628 1688 8 74 8 5
PRECINCT 15011
0.0040
505 1624 8 62 8 5
PRECINCT 15012
0.0016
208 1155 6 36 6 5
PRECINCT 15013
0.0027
336 1319 7 51 7 5
PRECINCT 15014
0.0037
471 905 5 104 5 5
PRECINCT 15015
0.0021
260 1257 6 41 6 5
PRECINCT 15016
0.0029
372 1065 5 70 5 5
PRECINCT 15017
0.0045
565 1631 8 69 8 5
PRECINCT 15018
0.0024
304 985 5 62 5 5
PRECINCT 15019
0.0034
435 917 5 95 5 5
PRECINCT 15020
0.0049
621 1655 8 75 8 5
PRECINCT 15021
0.0036
460 1717 9 54 9 5
PRECINCT 15022
0.0035
449 497 2 181 2 5
PRECINCT 15023
0.0041
517 617 3 167 3 5
PRECINCT 15024
0.0039
487 1621 8 60 8 5
PRECINCT 15025
0.0017
213 697 3 61 3 5
PRECINCT 16001
0.0014
176 279 1 126 1 5
PRECINCT 16002
0.0027
341 401 2 170 2 5
PRECINCT 16003
0.0017
210 269 1 156 1 5
PRECINCT 16004
0.0011
142 259 1 110 1 5
PRECINCT 16005
0.0042
527 1233 6 85 6 5
PRECINCT 16006
0.0044
559 1510 8 74 8 5
PRECINCT 16007
0.0039
493 1732 9 57 9 5
PRECINCT 16008
0.0034
426 730 4 117 4 5
PRECINCT 16009
0.0038
483 1052 5 92 5 5
PRECINCT 16010
0.0022
284 1171 6 48 6 5
PRECINCT 16011
0.0017
219 503 3 87 3 5
PRECINCT 16012
0.0042
531 577 3 184 3 5
PRECINCT 16013
0.0049
617 2025 10 61 10 6
PRECINCT 16014
0.0069
492 492 2 200 1 3 5
PRECINCT 17001
0.0039
494 2481 12 40 12 6
PRECINCT 17002
0.0040
512 527 3 194 3 5

62
PRECINCT 18001
0.0032
404 677 3 119 3 5
PRECINCT 18002
0.0039
489 884 4 111 4 5
PRECINCT 19001
0.0032
405 1676 8 48 8 5
PRECINCT 19002
0.0031
389 919 5 85 5 5
PRECINCT 20001
0.0035
441 925 5 95 5 5
PRECINCT 20002
0.0015
190 576 3 66 3 5
PRECINCT 20003
0.0038
475 815 4 116 4 5
PRECINCT 20004
0.0015
192 761 4 50 4 5
PRECINCT 20005
0.0030
377 1410 7 54 7 5
PRECINCT 20006
0.0073
917 1090 5 168 5 5
PRECINCT 20007
0.0049
521 521 3 200 1 4 5
PRECINCT 20008
0.0012
149 506 3 59 3 5
PRECINCT 20009
0.0009
115 686 3 34 3 5
PRECINCT 20010
0.0010
133 431 2 62 2 5
PRECINCT 20011
0.0025
316 1369 7 46 7 5
PRECINCT 21001
0.0020
248 543 3 91 3 5
PRECINCT 21002
0.0030
379 460 2 165 2 5
PRECINCT 21003
0.0025
315 502 3 126 3 5
PRECINCT 21004
0.0011
145 692 3 42 3 5
PRECINCT 22001
0.0027
346 1385 7 50 7 5
PRECINCT 22002
0.0034
431 705 4 122 4 5
PRECINCT 23001
0.0026
334 2295 11 29 11 6
PRECINCT 23002
0.0021
268 1747 9 31 9 5
PRECINCT 23003
0.0036
459 1602 8 57 8 5
PRECINCT 24001
0.0033
423 1425 7 59 7 5
PRECINCT 24002
0.0025
314 1655 8 38 8 5
PRECINCT 24003
0.0037
465 1380 7 67 7 5
PRECINCT 24004
0.0046
515 515 3 200 1 4 5
PRECINCT 24005
0.0051
646 1724 9 75 9 5
PRECINCT 25001
0.0057
313 313 2 200 1 3 5
PRECINCT 25002
0.0039
498 2034 10 49 10 6
PRECINCT 25003
0.0040
509 1500 8 68 8 5
PRECINCT 25004
0.0041
513 1106 6 93 6 5
PRECINCT 25005
0.0038
483 964 5 100 5 5

63
PRECINCT 25006
0.0027
339 705 4 96 4 5
PRECINCT 25007
0.0025
312 954 5 65 5 5
PRECINCT 25008
0.0036
450 1845 9 49 9 5
PRECINCT 25009
0.0029
366 1407 7 52 7 5
PRECINCT 25010
0.0031
266 266 1 200 1 2 5
PRECINCT 25011
0.0019
244 851 4 57 4 5
PRECINCT 25012
0.0019
244 1523 8 32 8 5
PRECINCT 25013
0.0015
187 1105 6 34 6 5
PRECINCT 25014
0.0016
205 1742 9 24 9 5
PRECINCT 25015
0.0021
263 1220 6 43 6 5
PRECINCT 25016
0.0027
344 928 5 74 5 5
PRECINCT 26001
0.0018
228 736 4 62 4 5
PRECINCT 26002
0.0025
313 1207 6 52 6 5
PRECINCT 26003
0.0025
313 799 4 78 4 5
PRECINCT 26004
0.0019
246 674 3 73 3 5
PRECINCT 26005
0.0017
210 387 2 108 2 5
PRECINCT 26006
0.0019
241 366 2 132 2 5
PRECINCT 26007
0.0013
163 571 3 57 3 5
PRECINCT 26008
0.0014
175 891 4 39 4 5
PRECINCT 26009
0.0044
557 1023 5 109 5 5
PRECINCT 26010
0.0031
386 875 4 88 4 5
PRECINCT 26011
0.0014
176 966 5 36 5 5
PRECINCT 26012
0.0017
219 1088 5 40 5 5
PRECINCT 26013
0.0024
300 1275 6 47 6 5
PRECINCT 26014
0.0022
276 791 4 70 4 5
PRECINCT 26015
0.0038
474 1715 9 55 9 5
PRECINCT 26016
0.0032
399 1849 9 43 9 5
PRECINCT 26017
0.0018
233 1802 9 26 9 5
PRECINCT 26018
0.0066
838 1248 6 134 6 5
PRECINCT 26019
0.0048
603 1128 6 107 6 5
PRECINCT 26020
0.0030
376 760 4 99 4 5
PRECINCT 26021
0.0053
676 1793 9 75 9 5
PRECINCT 26022
0.0020
258 1972 10 26 10 5
PRECINCT 26023
0.0028
350 1485 7 47 7 5
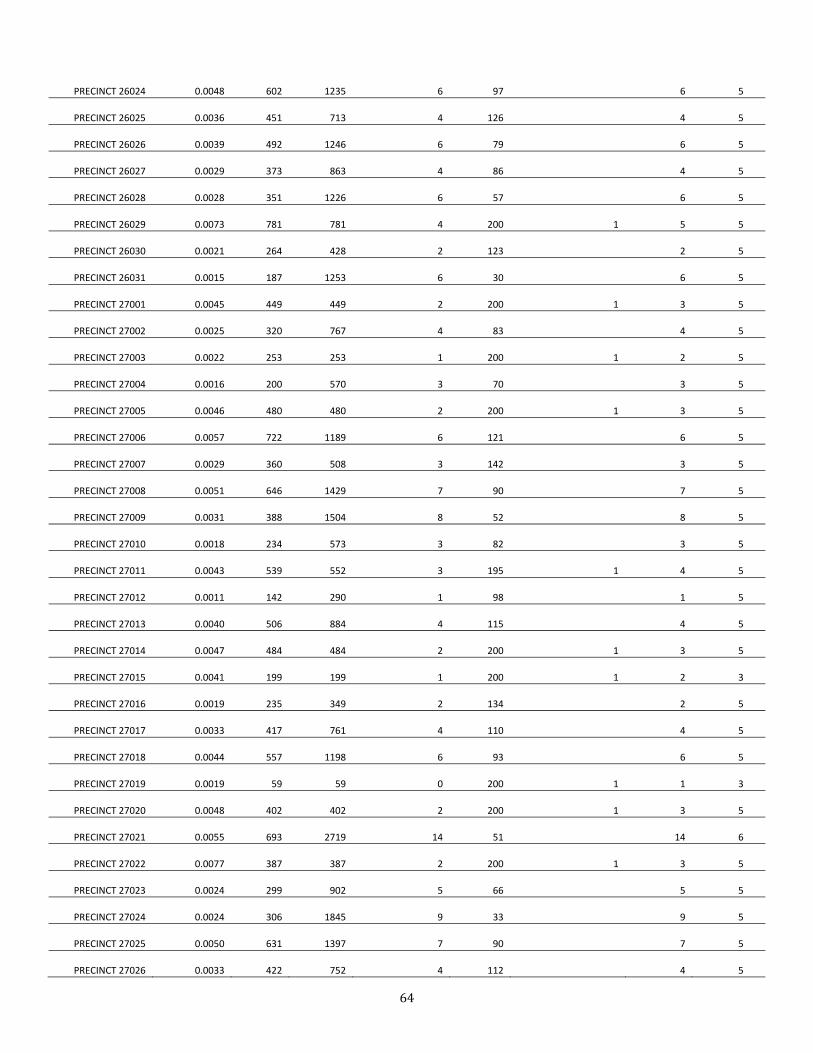
64
PRECINCT 26024
0.0048
602 1235 6 97 6 5
PRECINCT 26025
0.0036
451 713 4 126 4 5
PRECINCT 26026
0.0039
492 1246 6 79 6 5
PRECINCT 26027
0.0029
373 863 4 86 4 5
PRECINCT 26028
0.0028
351 1226 6 57 6 5
PRECINCT 26029
0.0073
781 781 4 200 1 5 5
PRECINCT 26030
0.0021
264 428 2 123 2 5
PRECINCT 26031
0.0015
187 1253 6 30 6 5
PRECINCT 27001
0.0045
449 449 2 200 1 3 5
PRECINCT 27002
0.0025
320 767 4 83 4 5
PRECINCT 27003
0.0022
253 253 1 200 1 2 5
PRECINCT 27004
0.0016
200 570 3 70 3 5
PRECINCT 27005
0.0046
480 480 2 200 1 3 5
PRECINCT 27006
0.0057
722 1189 6 121 6 5
PRECINCT 27007
0.0029
360 508 3 142 3 5
PRECINCT 27008
0.0051
646 1429 7 90 7 5
PRECINCT 27009
0.0031
388 1504 8 52 8 5
PRECINCT 27010
0.0018
234 573 3 82 3 5
PRECINCT 27011
0.0043
539 552 3 195 1 4 5
PRECINCT 27012
0.0011
142 290 1 98 1 5
PRECINCT 27013
0.0040
506 884 4 115 4 5
PRECINCT 27014
0.0047
484 484 2 200 1 3 5
PRECINCT 27015
0.0041
199 199 1 200 1 2 3
PRECINCT 27016
0.0019
235 349 2 134 2 5
PRECINCT 27017
0.0033
417 761 4 110 4 5
PRECINCT 27018
0.0044
557 1198 6 93 6 5
PRECINCT 27019
0.0019
59 59 0 200 1 1 3
PRECINCT 27020
0.0048
402 402 2 200 1 3 5
PRECINCT 27021
0.0055
693 2719 14 51 14 6
PRECINCT 27022
0.0077
387 387 2 200 1 3 5
PRECINCT 27023
0.0024
299 902 5 66 5 5
PRECINCT 27024
0.0024
306 1845 9 33 9 5
PRECINCT 27025
0.0050
631 1397 7 90 7 5
PRECINCT 27026
0.0033
422 752 4 112 4 5

65
PRECINCT 27027
0.0049
614 1441 7 85 7 5
PRECINCT 27028
0.0040
510 1271 6 80 6 5
PRECINCT 27029
0.0031
393 841 4 93 4 5
PRECINCT 27030
0.0036
455 578 3 158 3 5
PRECINCT 27031
0.0054
683 698 3 196 1 4 5
PRECINCT 27032
0.0051
614 614 3 200 1 4 5
PRECINCT 27033
0.0060
761 1041 5 146 5 5
PRECINCT 27034
0.0043
539 1462 7 74 7 5
PRECINCT 27035
0.0065
793 793 4 200 1 5 5
PRECINCT 27036
0.0029
368 506 3 145 3 5
PRECINCT 27037
0.0022
274 1460 7 38 7 5
PRECINCT 27038
0.0038
483 1001 5 96 5 5
PRECINCT 27039
0.0031
392 1523 8 52 8 5
PRECINCT 27040
0.0050
560 560 3 200 1 4 5
PRECINCT 27041
0.0048
613 1115 6 110 6 5
PRECINCT 27042
0.0045
567 889 4 127 4 5
PRECINCT 27043
0.0030
382 682 3 112 3 5
PRECINCT 27044
0.0040
501 617 3 162 3 5
PRECINCT 27045
0.0049
617 624 3 198 1 4 5
PRECINCT 27046
0.0028
358 462 2 155 2 5
PRECINCT 27047
0.0027
340 689 3 99 3 5
PRECINCT 27048
0.0040
501 1393 7 72 7 5
PRECINCT 27049
0.0088
1,114 1998 10 112 10 5
PRECINCT 27050
0.0051
644 1151 6 112 6 5
PRECINCT 27051
0.0028
351 2511 13 28 13 6
PRECINCT 27052
0.0069
875 1072 5 163 5 5
PRECINCT 27053
0.0040
506 1546 8 65 8 5
PRECINCT 27054
0.0022
283 1494 7 38 7 5
PRECINCT 27055
0.0029
365 2289 11 32 11 6
PRECINCT 27056
0.0044
552 1136 6 97 6 5
PRECINCT 27057
0.0048
608 2199 11 55 11 6
PRECINCT 27058
0.0030
377 592 3 127 3 5
PRECINCT 27059
0.0036
455 1397 7 65 7 5
PRECINCT 27060
0.0032
409 1268 6 64 6 5

66
PRECINCT 27061
0.0019
246 1321 7 37 7 5
PRECINCT 27062
0.0052
652 1434 7 91 7 5
PRECINCT 27063
0.0047
592 1376 7 86 7 5
PRECINCT 27064
0.0048
610 1411 7 86 7 5
PRECINCT 27065
0.0080
479 479 2 200 1 3 5
PRECINCT 27066
0.0062
640 640 3 200 1 4 5
PRECINCT 27067
0.0054
677 1887 9 72 9 5
PRECINCT 28001
0.0029
368 1730 9 43 9 5
PRECINCT 28002
0.0066
836 1388 7 120 7 5
PRECINCT 28003
0.0025
313 488 2 128 2 5
PRECINCT 28004
0.0026
325 728 4 89 4 5
PRECINCT 28005
0.0042
526 1116 6 94 6 5
PRECINCT 28006
0.0059
742 1540 8 96 8 5
PRECINCT 28007
0.0037
466 1794 9 52 9 5
PRECINCT 28008
0.0037
472 849 4 111 4 5
PRECINCT 28009
0.0042
483 483 2 200 1 3 5
PRECINCT 28010
0.0051
643 1028 5 125 5 5
PRECINCT 28011
0.0063
799 1788 9 89 9 5
PRECINCT 28012
0.0017
203 203 1 200 1 2 5
PRECINCT 28013
0.0039
487 1098 5 89 5 5
PRECINCT 28014
0.0020
255 1206 6 42 6 5
PRECINCT 28015
0.0063
340 340 2 200 1 3 5
TOTAL 1 121,909* 314,095 1,570 27,349 30 1,600 1,461
*The total number of votes is different from the overall turnout (314,095*.4025=126,423) because the number of votes exceeds the number of registered
voters in a few precincts. In those cases, the number of votes equals the number of registered voters, therefore causing the small difference between the
total number of votes and overall vote turnout.

67
Table 51: Sim
ulation M
odel of Average
Wait Time for the 2008 Presidential Election (Peak
Hours of Noon to 2 p.m
.)
Customer
Inter‐
arrival
Time
Arrival
Time
Service
Time
Server #1
Start
En
d
Server #2
Start
En
d
Server #3
Start
En
d
Server #4
Start
En
d
Server #5
Start
En
d
Server #6
Start
En
d
Wait
Time
Total
Time
(min)
(hr:min)
(min)
(hr:min)
(hr:min)
(hr:min)
(hr:min)
(hr:min)
(hr:min)
(hr:min)
(hr:min)
(hr:min)
(hr:min)
(hr:min)
(hr:min)
(hr:min)
(hr:min)
1
0.64
12:00
3
12:00
12:03
0:00
0:03
2
0.43
12:01
6
12:01
12:07
0:00
0:06
3
0.43
12:02
6
12:02
12:08
0:00
0:06
4
0.64
12:03
3
12:03
12:06
0:00
0:03
5
0.43
12:04
6
12:04
12:10
0:00
0:06
6
1.60
12:04
9
12:04
12:13
0:00
0:09
7
1.60
12:06
9
12:06
12:15
0:00
0:09
8
1.60
12:07
3
12:07
12:10
0:00
0:03
9
0.64
12:07
9
12:07
12:16
0:00
0:09
10
0.64
12:09
6
12:09
12:15
0:00
0:06
11
0.94
12:10
6
12:10
12:16
0:00
0:06
12
1.60
12:10
9
12:10
12:19
0:00
0:09
13
0.43
12:11
6
12:13
12:19
0:02
0:08
14
0.43
12:12
9
12:15
12:24
0:03
0:12
15
1.60
12:12
9
12:15
12:24
0:02
0:11
16
0.64
12:13
9
12:16
12:25
0:03
0:12
17
0.43
12:14
6
12:16
12:22
0:01
0:07
18
1.60
12:15
9
12:19
12:28
0:04
0:13
19
1.60
12:16
6
12:19
12:25
0:03
0:09
20
0.43
12:17
6
12:22
12:28
0:05
0:11
21
0.94
12:19
6
12:24
12:30
0:05
0:11
22
0.94
12:19
9
12:24
12:33
0:05
0:14

68
23
0.94
12:20
6
12:25
12:31
0:05
0:11
24
0.43
12:21
3
12:25
12:28
0:04
0:07
25
0.64
12:22
9
12:28
12:37
0:06
0:15
26
0.64
12:23
9
12:28
12:37
0:05
0:14
27
1.60
12:24
6
12:28
12:34
0:04
0:10
28
0.64
12:24
6
12:30
12:36
0:05
0:11
29
0.64
12:25
3
12:31
12:34
0:05
0:08
30
0.94
12:27
6
12:33
12:39
0:06
0:12
31
1.60
12:28
3
12:34
12:37
0:06
0:09
32
0.64
12:28
6
12:34
12:40
0:05
0:11
33
0.64
12:29
3
12:36
12:39
0:06
0:09
34
1.60
12:31
3
12:37
12:40
0:06
0:09
35
0.43
12:32
9
12:37
12:46
0:05
0:14
36
0.94
12:32
3
12:37
12:40
0:05
0:08
37
0.64
12:33
9
12:39
12:48
0:05
0:14
38
0.43
12:34
9
12:39
12:48
0:05
0:14
39
0.64
12:34
6
12:40
12:46
0:05
0:11
40
0.94
12:36
6
12:40
12:46
0:04
0:10
41
0.94
12:37
9
12:40
12:49
0:03
0:12
42
0.43
12:38
6
12:46
12:52
0:07
0:13
43
0.43
12:39
9
12:46
12:55
0:07
0:16
44
0.64
12:40
6
12:46
12:52
0:06
0:12
45
0.64
12:41
9
12:48
12:57
0:06
0:15
46
0.64
12:42
9
12:48
12:57
0:05
0:14
47
1.60
12:43
9
12:49
12:58
0:06
0:15
48
1.60
12:44
6
12:52
12:58
0:07
0:13

69
49
0.64
12:45
6
12:52
12:58
0:07
0:13
50
0.64
12:47
9
12:55
13:04
0:08
0:17
51
0.64
12:48
9
12:57
13:06
0:09
0:18
52
0.43
12:48
3
12:57
13:00
0:08
0:11
53
0.64
12:49
6
12:58
13:04
0:08
0:14
54
0.64
12:49
6
12:58
13:04
0:08
0:14
55
0.94
12:50
6
12:58
13:04
0:08
0:14
56
0.64
12:51
9
13:00
13:09
0:08
0:17
57
1.60
12:52
6
13:04
13:10
0:11
0:17
58
0.64
12:53
9
13:04
13:13
0:11
0:20
59
1.60
12:54
3
13:04
13:07
0:10
0:13
60
1.60
12:54
6
13:04
13:10
0:10
0:16
61
1.60
12:55
6
13:06
13:12
0:11
0:17
62
1.60
12:56
6
13:07
13:13
0:10
0:16
63
0.94
12:58
9
13:09
13:18
0:11
0:20
64
0.94
12:58
6
13:10
13:16
0:11
0:17
65
0.64
12:59
3
13:10
13:13
0:11
0:14
66
0.64
12:59
9
13:12
13:21
0:12
0:21
67
1.60
13:00
9
13:13
13:22
0:13
0:22
68
0.94
13:01
9
13:13
13:22
0:12
0:21
69
1.60
13:02
3
13:13
13:16
0:11
0:14
70
0.43
13:03
9
13:16
13:25
0:12
0:21
71
0.43
13:05
9
13:16
13:25
0:11
0:20
72
0.64
13:06
6
13:18
13:24
0:11
0:17
73
0.64
13:07
9
13:21
13:30
0:14
0:23
13:08
6
13:22
13:28
0:14
0:20

70
74
1.60
75
0.64
13:09
9
13:22
13:31
0:13
0:22
76
0.94
13:10
3
13:24
13:27
0:13
0:16
77
0.94
13:11
3
13:25
13:28
0:13
0:16
78
0.94
13:11
6
13:25
13:31
0:14
0:20
79
0.64
13:12
6
13:27
13:33
0:15
0:21
80
0.94
13:12
9
13:28
13:37
0:15
0:24
81
1.60
13:13
3
13:28
13:31
0:15
0:18
82
0.64
13:14
6
13:30
13:36
0:15
0:21
83
1.60
13:15
6
13:31
13:37
0:16
0:22
84
0.94
13:16
9
13:31
13:40
0:14
0:23
85
1.60
13:17
3
13:31
13:34
0:14
0:17
86
1.60
13:18
3
13:33
13:36
0:15
0:18
87
0.64
13:18
3
13:34
13:37
0:16
0:19
88
1.60
13:20
6
13:36
13:42
0:16
0:22
89
0.94
13:21
6
13:36
13:42
0:15
0:21
90
0.64
13:22
6
13:37
13:43
0:14
0:20
91
0.43
13:23
6
13:37
13:43
0:14
0:20
92
0.94
13:24
9
13:37
13:46
0:13
0:22
93
0.94
13:25
9
13:40
13:49
0:15
0:24
94
0.64
13:25
3
13:42
13:45
0:16
0:19
95
0.94
13:26
9
13:42
13:51
0:15
0:24
96
0.64
13:28
9
13:43
13:52
0:15
0:24
97
0.43
13:29
6
13:43
13:49
0:13
0:19
98
0.64
13:30
6
13:45
13:51
0:14
0:20
99
0.64
13:32
6
13:46
13:52
0:14
0:20
13:32
9
13:49
13:58
0:16
0:25

71
100
0.94
101
1.60
13:34
3
13:49
13:52
0:15
0:18
102
0.43
13:35
3
13:51
13:54
0:16
0:19
103
0.43
13:35
3
13:51
13:54
0:15
0:18
104
0.64
13:36
9
13:52
14:01
0:15
0:24
105
1.60
13:37
3
13:52
13:55
0:15
0:18
106
0.94
13:37
9
13:52
14:01
0:15
0:24
107
0.64
13:39
3
13:54
13:57
0:15
0:18
108
0.64
13:39
9
13:54
14:03
0:14
0:23
109
0.94
13:41
9
13:55
14:04
0:14
0:23
110
0.64
13:43
6
13:57
14:03
0:14
0:20
111
0.43
13:43
3
13:58
14:01
0:14
0:17
112
0.64
13:44
9
14:01
14:10
0:16
0:25
113
0.94
13:45
9
14:01
14:10
0:16
0:25
114
1.60
13:46
3
14:01
14:04
0:15
0:18
115
1.60
13:46
3
14:03
14:06
0:16
0:19
116
0.94
13:47
6
14:03
14:09
0:16
0:22
117
0.94
13:48
9
14:04
14:13
0:15
0:24
118
1.60
13:49
6
14:04
14:10
0:15
0:21
119
1.60
13:50
6
14:06
14:12
0:16
0:22
120
1.60
13:50
9
14:09
14:18
0:18
0:27
121
1.60
13:51
6
14:10
14:16
0:19
0:25
122
0.64
13:51
9
14:10
14:19
0:19
0:28
123
0.43
13:53
6
14:10
14:16
0:17
0:23
124
0.94
13:53
6
14:12
14:18
0:18
0:24
125
0.94
13:55
6
14:13
14:19
0:18
0:24

72
126
0.64
13:56
3
14:16
14:19
0:20
0:23
127
0.94
13:57
6
14:16
14:22
0:19
0:25
128
0.64
13:58
6
14:18
14:24
0:19
0:25
Average
Wait Time from 13:00 to 14:00
15.29
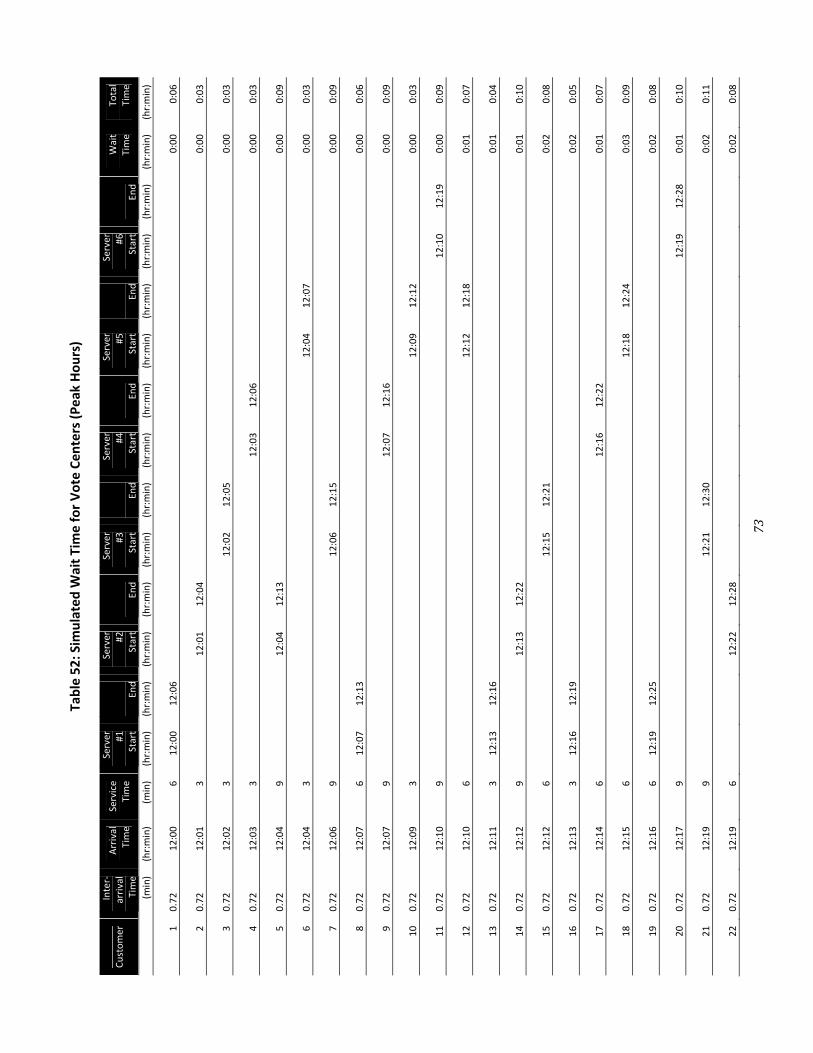
73
Table 52: Sim
ulated W
ait Time for Vote Centers (Peak Hours)
Customer
Inter‐
arrival
Time
Arrival
Time
Service
Time
Server
#1
Start
En
d
Server
#2
Start
En
d
Server
#3
Start
En
d
Server
#4
Start
En
d
Server
#5
Start
En
d
Server
#6
Start
En
d
Wait
Time
Total
Tim
e
(min)
(hr:min)
(min)
(hr:min)
(hr:min)
(hr:min)
(hr:min)
(hr:min)
(hr:min)
(hr:min)
(hr:min)
(hr:min)
(hr:min)
(hr:min)
(hr:min)
(hr:min)
(hr:min)
1
0.72
12:00
6
12:00
12:06
0:00
0:06
2
0.72
12:01
3
12:01
12:04
0:00
0:03
3
0.72
12:02
3
12:02
12:05
0:00
0:03
4
0.72
12:03
3
12:03
12:06
0:00
0:03
5
0.72
12:04
9
12:04
12:13
0:00
0:09
6
0.72
12:04
3
12:04
12:07
0:00
0:03
7
0.72
12:06
9
12:06
12:15
0:00
0:09
8
0.72
12:07
6
12:07
12:13
0:00
0:06
9
0.72
12:07
9
12:07
12:16
0:00
0:09
10
0.72
12:09
3
12:09
12:12
0:00
0:03
11
0.72
12:10
9
12:10
12:19
0:00
0:09
12
0.72
12:10
6
12:12
12:18
0:01
0:07
13
0.72
12:11
3
12:13
12:16
0:01
0:04
14
0.72
12:12
9
12:13
12:22
0:01
0:10
15
0.72
12:12
6
12:15
12:21
0:02
0:08
16
0.72
12:13
3
12:16
12:19
0:02
0:05
17
0.72
12:14
6
12:16
12:22
0:01
0:07
18
0.72
12:15
6
12:18
12:24
0:03
0:09
19
0.72
12:16
6
12:19
12:25
0:02
0:08
20
0.72
12:17
9
12:19
12:28
0:01
0:10
21
0.72
12:19
9
12:21
12:30
0:02
0:11
22
0.72
12:19
6
12:22
12:28
0:02
0:08

74
23
0.72
12:20
6
12:22
12:28
0:02
0:08
24
0.72
12:21
6
12:24
12:30
0:02
0:08
25
0.72
12:22
6
12:25
12:31
0:02
0:08
26
0.72
12:23
3
12:28
12:31
0:04
0:07
27
0.72
12:24
9
12:28
12:37
0:04
0:13
28
0.72
12:24
3
12:28
12:31
0:03
0:06
29
0.72
12:25
6
12:30
12:36
0:04
0:10
30
0.72
12:27
9
12:30
12:39
0:03
0:12
31
0.72
12:28
3
12:31
12:34
0:02
0:05
32
0.72
12:28
9
12:31
12:40
0:02
0:11
33
0.72
12:29
9
12:31
12:40
0:02
0:11
34
0.72
12:31
9
12:34
12:43
0:02
0:11
35
0.72
12:32
9
12:36
12:45
0:04
0:13
36
0.72
12:32
9
12:37
12:46
0:04
0:13
37
0.72
12:33
9
12:39
12:48
0:06
0:15
38
0.72
12:34
6
12:40
12:46
0:05
0:11
39
0.72
12:34
9
12:40
12:49
0:06
0:15
40
0.72
12:36
6
12:43
12:49
0:06
0:12
41
0.72
12:37
6
12:45
12:51
0:08
0:14
42
0.72
12:38
9
12:46
12:55
0:07
0:16
43
0.72
12:39
9
12:46
12:55
0:07
0:16
44
0.72
12:40
6
12:48
12:54
0:08
0:14
45
0.72
12:41
9
12:49
12:58
0:07
0:16
46
0.72
12:42
6
12:49
12:55
0:07
0:13
47
0.72
12:43
6
12:51
12:57
0:08
0:14
48
0.72
12:44
9
12:54
13:03
0:09
0:18
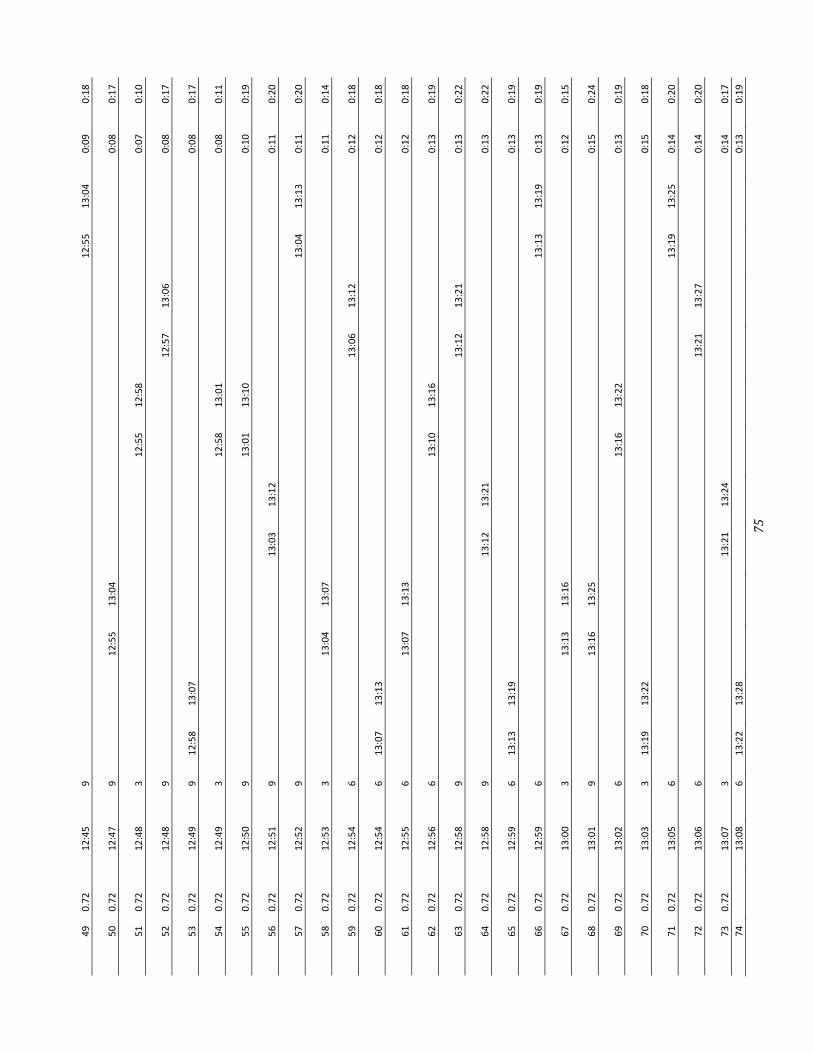
75
49
0.72
12:45
9
12:55
13:04
0:09
0:18
50
0.72
12:47
9
12:55
13:04
0:08
0:17
51
0.72
12:48
3
12:55
12:58
0:07
0:10
52
0.72
12:48
9
12:57
13:06
0:08
0:17
53
0.72
12:49
9
12:58
13:07
0:08
0:17
54
0.72
12:49
3
12:58
13:01
0:08
0:11
55
0.72
12:50
9
13:01
13:10
0:10
0:19
56
0.72
12:51
9
13:03
13:12
0:11
0:20
57
0.72
12:52
9
13:04
13:13
0:11
0:20
58
0.72
12:53
3
13:04
13:07
0:11
0:14
59
0.72
12:54
6
13:06
13:12
0:12
0:18
60
0.72
12:54
6
13:07
13:13
0:12
0:18
61
0.72
12:55
6
13:07
13:13
0:12
0:18
62
0.72
12:56
6
13:10
13:16
0:13
0:19
63
0.72
12:58
9
13:12
13:21
0:13
0:22
64
0.72
12:58
9
13:12
13:21
0:13
0:22
65
0.72
12:59
6
13:13
13:19
0:13
0:19
66
0.72
12:59
6
13:13
13:19
0:13
0:19
67
0.72
13:00
3
13:13
13:16
0:12
0:15
68
0.72
13:01
9
13:16
13:25
0:15
0:24
69
0.72
13:02
6
13:16
13:22
0:13
0:19
70
0.72
13:03
3
13:19
13:22
0:15
0:18
71
0.72
13:05
6
13:19
13:25
0:14
0:20
72
0.72
13:06
6
13:21
13:27
0:14
0:20
73
0.72
13:07
3
13:21
13:24
0:14
0:17
74
13:08
6
13:22
13:28
0:13
0:19

76
0.72
75
0.72
13:09
9
13:22
13:31
0:13
0:22
76
0.72
13:10
3
13:24
13:27
0:13
0:16
77
0.72
13:11
3
13:25
13:28
0:13
0:16
78
0.72
13:11
9
13:25
13:34
0:13
0:22
79
0.72
13:12
3
13:27
13:30
0:15
0:18
80
0.72
13:12
3
13:27
13:30
0:14
0:17
81
0.72
13:13
9
13:28
13:37
0:14
0:23
82
0.72
13:14
3
13:28
13:31
0:13
0:16
83
0.72
13:15
6
13:30
13:36
0:15
0:21
84
0.72
13:16
9
13:30
13:39
0:13
0:22
85
0.72
13:17
3
13:31
13:34
0:13
0:16
86
0.72
13:18
9
13:31
13:40
0:13
0:22
87
0.72
13:18
3
13:34
13:37
0:15
0:18
88
0.72
13:20
3
13:34
13:37
0:14
0:17
89
0.72
13:21
6
13:36
13:42
0:15
0:21
90
0.72
13:22
9
13:37
13:46
0:14
0:23
91
0.72
13:23
6
13:37
13:43
0:13
0:19
92
0.72
13:24
3
13:37
13:40
0:13
0:16
93
0.72
13:25
3
13:39
13:42
0:14
0:17
94
0.72
13:25
6
13:40
13:46
0:14
0:20
95
0.72
13:26
3
13:40
13:43
0:14
0:17
96
0.72
13:28
3
13:42
13:45
0:14
0:17
97
0.72
13:29
9
13:42
13:51
0:12
0:21
98
0.72
13:30
3
13:43
13:46
0:12
0:15
99
0.72
13:32
9
13:43
13:52
0:11
0:20
100
13:32
6
13:45
13:51
0:12
0:18
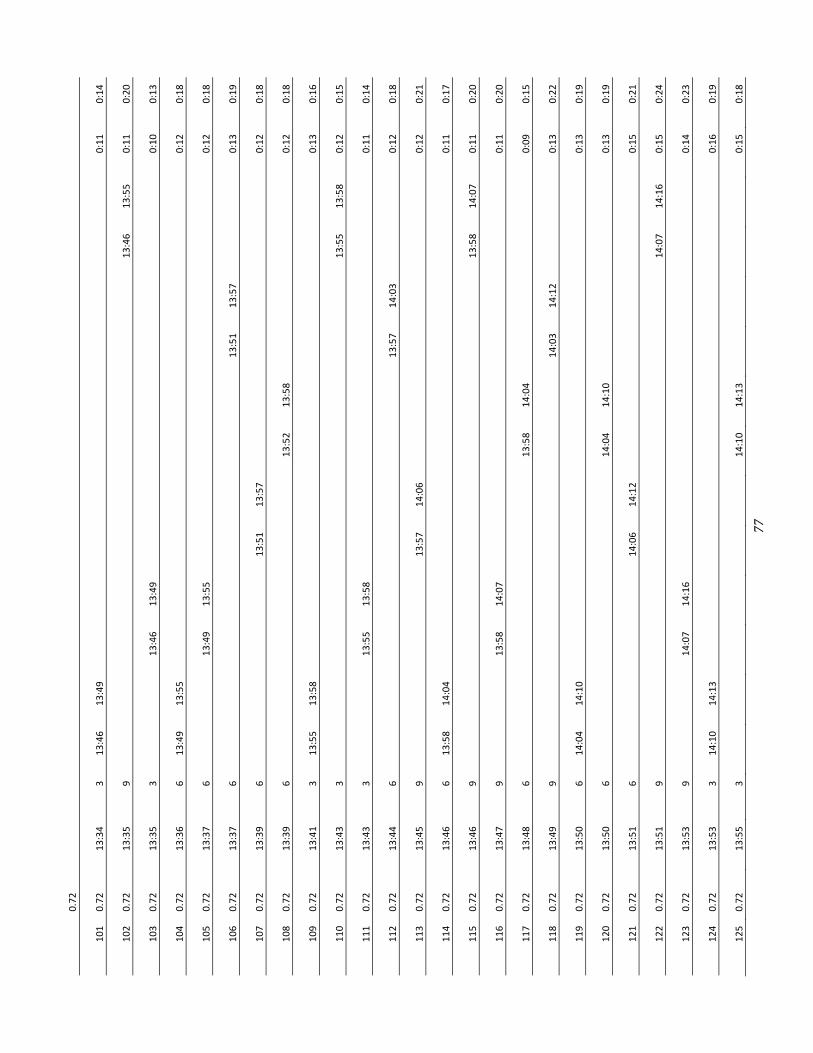
77
0.72
101
0.72
13:34
3
13:46
13:49
0:11
0:14
102
0.72
13:35
9
13:46
13:55
0:11
0:20
103
0.72
13:35
3
13:46
13:49
0:10
0:13
104
0.72
13:36
6
13:49
13:55
0:12
0:18
105
0.72
13:37
6
13:49
13:55
0:12
0:18
106
0.72
13:37
6
13:51
13:57
0:13
0:19
107
0.72
13:39
6
13:51
13:57
0:12
0:18
108
0.72
13:39
6
13:52
13:58
0:12
0:18
109
0.72
13:41
3
13:55
13:58
0:13
0:16
110
0.72
13:43
3
13:55
13:58
0:12
0:15
111
0.72
13:43
3
13:55
13:58
0:11
0:14
112
0.72
13:44
6
13:57
14:03
0:12
0:18
113
0.72
13:45
9
13:57
14:06
0:12
0:21
114
0.72
13:46
6
13:58
14:04
0:11
0:17
115
0.72
13:46
9
13:58
14:07
0:11
0:20
116
0.72
13:47
9
13:58
14:07
0:11
0:20
117
0.72
13:48
6
13:58
14:04
0:09
0:15
118
0.72
13:49
9
14:03
14:12
0:13
0:22
119
0.72
13:50
6
14:04
14:10
0:13
0:19
120
0.72
13:50
6
14:04
14:10
0:13
0:19
121
0.72
13:51
6
14:06
14:12
0:15
0:21
122
0.72
13:51
9
14:07
14:16
0:15
0:24
123
0.72
13:53
9
14:07
14:16
0:14
0:23
124
0.72
13:53
3
14:10
14:13
0:16
0:19
125
0.72
13:55
3
14:10
14:13
0:15
0:18

78
126
0.72
13:56
6
14:12
14:18
0:16
0:22
127
0.72
13:57
3
14:12
14:15
0:14
0:17
128
0.72
13:58
6
14:13
14:19
0:14
0:20
Average
Wait Time from 13:00 to 14:00
13:38

79
Map 2: Voter Turnout (by Districts) in the 2012 Presidential Primary Election

Document 1: Boaard of Estimaates’ Approva
80
al of McAfee Election Servvices as a Seleected Sourcee
. .-......- "'" -Joseph D. Mazza. CPPO, CilY PUrch 'ng Agent
Bureau of Purch ,.. __ -+-=_1 East B l~m.Q.te ~tree. Suite19.1l _
: 1)
TO onorable President and Members of the Board of Estjm les
Dear President and Members:
ACTIO REOUESTED 0
May 18,2010
The Board is requested to approve an a&r«ment and selected source award for llri tio Number 06000 - EI dloD e",i to McAfee Election Services, Inc., 3409 McF 'r Lan ThonotQASSa. FL 33592. Period covered is May 26. 2010 through April 30,2011 with two ofttwyear renewaJ options.
MOU TO $135, 0.00
26,660.00
CK .ROUNDIEXPL TJO:
D : Account No.: 100 1-000000-\800-] 84500~ 035
ot Avail Ie (FY2011 Funds)
The Bo d of Elections wishes to eng ge McAfee Electi 0 Services to prepare, inspect and maintain the Diebold louch screen voting units. -poll books, Judge's Portfolios and ddi. tion 1 services 8S may be required by the Cily and State of Maryland Board of Elections. The eontr lor in~ plh kn wledge of the equipment, City's voting process, and precinct sites and i eo id red e best SO ceo
Board or Eledlo
Living Wage is not applicable.
n eb e : Agreements (5 originaJ copies); MWBOO Goal Sheet
APPROVED BY BOARD OF ESTIMATES
DATE AY 26 am CLERK JDM:wrg #0433

Doocument 2: Prroposal by McAfee Electio
81
on Services foor the 2011 MMayoral Geneeral Election

82
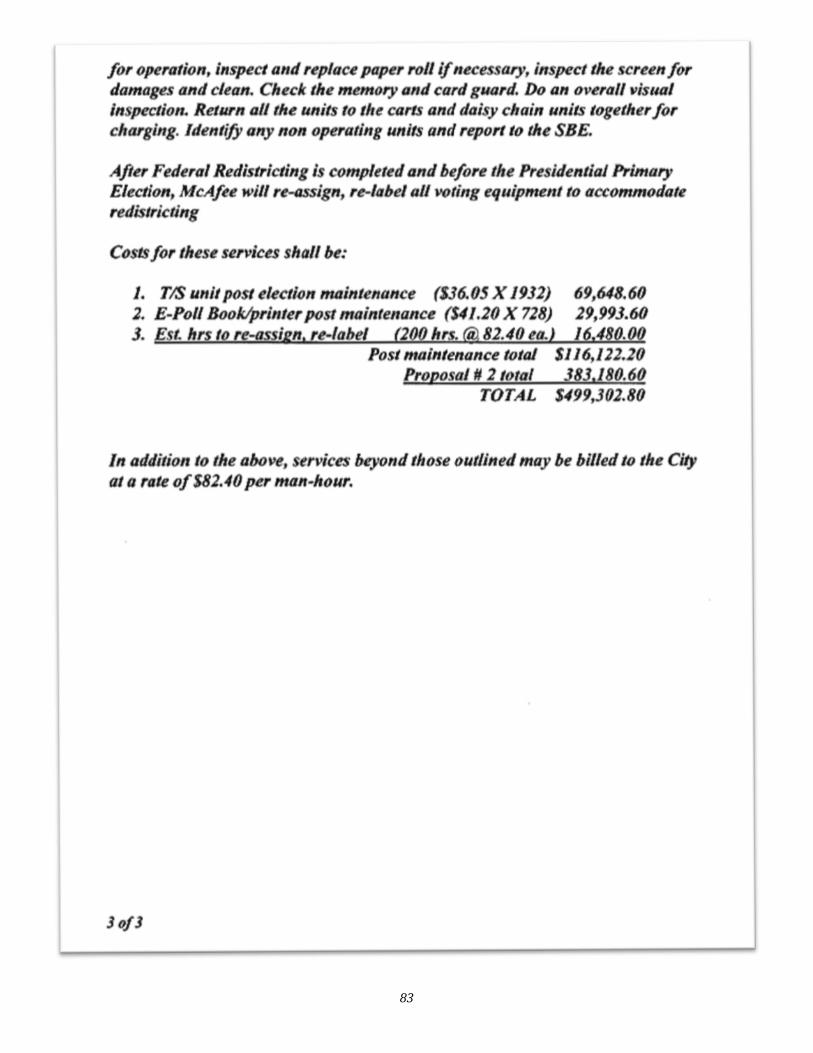
83
f()r operation, in P CI and r 'Place paper ro/l if ne ary, in :pecl the creen for dama and clean. Check the memory and card ua,d. Do an ov '01/ vi ual in :p clion. Relurn all the unit to the car and do; ~ hain uni tog th , for charging. Id nlify any non operating unit. and report to the SBE.
Aft r ede,al Redi trl ting; ()mpltted and helor the Pre ,denttal Primary Eleclion, McAfee will re i n, re label all volin equipmenllo a ommodale redistricting
C() for the e services shall be:
1. TIS unil po t elecllo" mIIinl nonce (. 36.05 X 1912) 69,648.60 2. E·PolI Book/printer post maintenance ($41.20 X 728) 29,99.60 3. . I. h, to,·a i,n., .. lob I (200 h, . @ 81.40 ea.) /6.480.00
Po I maintenance total 116 122.20 Pro 0 al # 2 total J83180.60
TOTAL 499302.80
In addilion t() IAe above erv; b nd Ih -e outlined may he billed 10 the City at a rate of 82.40 per man-hour.
30/3
for operation. in peel and r 'Place paper roll if ne ary in peet the creen for dama and clean. Check the memory and card uard. Do an o~ roll vi ual In :peelion. Return all th unit to the car and dai ~ chain un; tog th r for charging. Id nlify any non operating unit. and reporl to the SBE.
Aft r de,al Red; 1,1 ting; ompleted and before the Pre identiaJ Primary Election McAfee will re ; n, re-Iabel all volin equipment to accommodate redi$t,i ling
Co for Ihe e services shall be:
1. TIS unit pO$l el Clio" fIUlml nonce (. '36.05 X 1912) 69648.60 2. E-Poll Book/printer po t maintenance (S41.20 X 728) 29,993.60 J. E t. h~ 10,. -0 ~ ilm." -label (200 h, . @ 82.40 ~(L) 16.480.00
Po t mainl nance total J 16 122.20 Pro () al N 210lal 383 180.60
TOTAL 499302.80
In addition to til above, eTv; beyond tho -e outlined may be billed to the City at a rale of 82.40 per mon-hour.
30/3
84
APPENDIXII:SCOPEANDMETHODOLOGY
The objectives of this study are to 1) determine the cost of daily operations of the Board of Elections, 2)
determine the full cost of conducting an election, 3) determine the current cost‐effectiveness of election
administration, 4) recommend alternatives to increase cost‐effectiveness and savings estimates for each
of the alternatives, and 5) estimate potential positive and negative outcomes for each of the
alternatives.
To determine the cost of daily operation and the full cost of conducting an election, invoices, adopted
budgets, and general ledgers of Fiscal Years 2009, 2011, and 2012 are used to reconcile figures and
determine the most accurate cost to reflect the expenditures of the agency. When invoices are not
available, conversations with the agency helped to determine the most accurate costs. In cases where
certain cost figures do not match, the cost figure in the general ledger is assumed to be the most
accurate figure.
To determine the current cost‐effectiveness of election administration, performance data is obtained
from the agency and is then calculated to get the final numbers for cost‐effectiveness and performance.
Cost‐effectiveness and performance indicators include voter turnout, cost per vote, and number of
precincts and polling places per square mile and per 100,000 populations. Cost‐effectiveness and
performance data are then compared to that of Maryland jurisdictions and other major cities to
determine the cost‐effectiveness of Baltimore City’s election administration.
To recommend alternatives to increase cost‐effectiveness and estimate savings for each alternative,
other cities’ practices are taken into consideration and a scenario analysis for each alternative is
conducted. The scenario analyses are hypothetical analyses and therefore do not reflect true savings if
Baltimore City were to implement any of the alternatives recommended.
Potential positive and negative outcomes for each of the alternatives are based upon the current
knowledge of the City populations’ demographics and the outcomes other states and cities experienced
when implementing the alternatives.
BBMR conducted this management research project from July 2012 to November 2012 in accordance
with the standards set forth in the BBMR Project Management Guide and the BBMR Research Protocol.
Those standards require that BBMR plans and performs the research project to obtain sufficient and
appropriate evidence to provide a basis for the conclusions and recommendations contained in this
report. BBMR believes that the evidence obtained provides a reasonable basis for the findings and
conclusions in this report and that such findings and conclusions are based on research project
objectives.
APPENNDIXIII::COMMEENTSFR
85
ROMTHEEBOARDDOFELECTIONS
Decembe 4 20 12
Oe..- r Jindr&fI' ne
?ease ConSidel' IIIIS letter (0 be this Slate agency's formal w n response to eu~'s s ma-y Of "Agency Comments and E alIabor( at the meetf1g I attended er and r C n erne on No em er 20, 2012
At the meeting Ms Goldman, ~Ie, and I tned to convey (hat tile anagement Researdl PrOjeC documertt does not suffiaend account lor e slatus of the Elecron Board as a Slate n. Slatulori subject to e regJlabOns set by I e Slate Boarel 0( E ens The State Board selS standards !of e voting s s em we use. \he SIB ng andeQUlIlmenlol pol ng places. and e maintenance of registralion lists
There Ole, whatel'9f the merits m'9hl be 0 atema ve methods of YCCIO and ot !If measures e<Xlmmended III the report. thIS Board bound 10 IoIlow the unlfOlm elecbOn law as I as the regul boos and duecoons ISSUed by Ihe Slate Board to all local boards For example, we must piovlde at least one mach,ne for every 200 olers elecbon JUdges from the majOnty and minonty parnes. and lech leal staff for eactl poIng place. and OUI precillcts may not cross d I1lclbnes The Board SImi rIy haS htt!e a Ihonl)' WIth rega"d 10 ea Iy YOIlng da s and centers
I explalfled !hat I also beJ '19 In sa Ing money. but that Ihe Board's aM my funclions do not lIloode ma ing predlcbOnS as 10 Idl candidates and bailor Quesll<lllS 'II moo ale e Olers" each PfecrlC , e en I we could do so ao:::ura As t be imagined. decisIOnS not to allocate resources to a QI'I9n preanct CXlUId 91 an ClJIpearance 0 parusanshl Ihal would ardly serve the jl\JbI"lC weU
The Board has not deva ed resources 0 venfylng the 51 ' 'cs III lI1e report and I id no intend 0 con ey In e meeting I ert er I or 1t1e fi'l(!-mernber Soard had done so. e <ld 10 COfl'19 a assesslllg 'perfonnance" through per- oter costs and waiting iVnes IS problel'nabC vhen one is add es . 9 is Board's miSSIOll . hich is he pl'OVlS'OO, 10 I r9g1 tered leiS arid illl n egrlty. of the means b ich they can exercise their rigl'lt to 'IOIe We explar1ed that w ng hmes a y b poI\M1g place, by !he p,yscal aah es of the YO! S and by the need for many vo e,s 10 su mfl provISIOnal ballots, Ich are labor 'nlen e e explatled that combll'llng preancts InlO one poI~g place difflCU given lIIe limited supp 0 places hat can ha die large numbelS of people and. In yevent, o e leads 10 confuslOIl and longer a IS.
'I respect 0 pol ng place e r9Vlew e poll g places th ell
abon t shOlAd be danflBd thallhe Board. IA aooord<J'lOO th Stale Board directions engages poWtlg place e ualOrs who iSIS 01 en erla provided by ltle Sta Boatd e Board members and I, also s poling places
WIlli respect to r tum~ul efforts explaned Iha lI1e Board merrbefs and I eque tty address CIViC and other groups and dlSlribu e malenals ~ e as e CIt to hang ba'lners over the s eels. and it has done so 0 a ~nu ad baSIS, 10 accotdance WIth lis policies. and we uld encourage e Qr 10 Increase ilS e1Ions In al egara I' It can '(I(e nOle !nat some Of me proposeo COSt-Culling measures at poINng places WOUld I ely na e a ega e Impact on VOIer I n-oul as the pnospect 01 lIa ellng to polls 01 a ng longer to ole may de er people
here IS one a ea In ich the City m'9ht be abl to a ()d e penses and en a'lCe our etriden and lila uid be the pr~ payment 0( e endors' bil we submit to tile City fOl payment Fal often. we recet second notJces fOl ~ we have already sobmiUed. somellmes Ihreatenlflglhe er aborl 0( IIIe sefVlCe, and 0 en tile '119 on lale fees. I tile CI IfIdee<j pa stile lale ctlil ges trial appear on these !)IUs, tllilt O'le<lSure m,oght be pful
We appreoate the thoug I and e QI en 10 producng the Proted dOCllmen It you ha e crl quesbons please call me at 410.396-5570.
cc' Inda amone. AdnumstralOl Slate Bo d awretnce Cager, Board Preslden
Ann MacNeilte. Boa'd AltOlA9Y
129 ' Baltimore. Mal)-Iand 212Ql.~)2 7 · TTY' 10- -61

86
APPENDIXIV:BBMRCONTACTANDACKNOWLEDGEMENTS
BBMR Contact and Acknowledgements Vieen Leung [email protected] 410‐396‐4964 BBMR Mission
The Bureau of the Budget and Management Research is an essential fiscal steward for the City of
Baltimore. Our mission is to promote economy and efficiency in the use of City resources and help the
Mayor and City agencies achieve positive outcomes for the citizens of Baltimore. We do this by planning
for sustainability, exercising fiscal oversight, and performing analysis of resource management and
service performance. We value integrity, learning and innovating, excellent customer service, and team
spirit.
Obtaining Copies of BBMR All BBMR reports are made available at no charge on Management Research Reports our website at: http://www.baltimorecity.gov/Government/AgenciesDepartments/Finance/BudgetManagementResearch.aspx.
Contacting BBMR Please contact us by phone at 410‐396‐4941 or by fax at 410‐396‐4236.