city of charlottesville fiscal year 2020 energy and water
TRANSCRIPT

1 | P a g e
City of Charlottesville Fiscal Year 2020 Annual Energy and Water Performance Report Fall 2020

City FY2020 Annual Energy and Water Performance Report
2 | P a g e
Table of Contents Introduction .................................................................................................................................................. 3
Glossary ......................................................................................................................................................... 4
Actions .......................................................................................................................................................... 7
Operations ................................................................................................................................................ 8
Strategies Implemented ........................................................................................................................ 8
Strategies Planned/FY2021 Outlook ..................................................................................................... 9
Technology ............................................................................................................................................. 10
Strategies Implemented ...................................................................................................................... 10
Strategies Planned/FY2021 Outlook ................................................................................................... 13
People (Behavior) ................................................................................................................................... 14
Strategies Implemented ...................................................................................................................... 14
Strategies Planned/FY2021 Outlook ................................................................................................... 16
Performance ............................................................................................................................................... 18
EUI and ENERGY STAR Scores ................................................................................................................ 19
Portfolio Performance ............................................................................................................................ 21
Electricity ............................................................................................................................................. 23
Natural Gas ......................................................................................................................................... 25
Water and Sewer ................................................................................................................................ 27
Greenhouse Gas Emissions ................................................................................................................. 30
Green Building Certifications ................................................................................................................. 31
FY2021 Outlook ...................................................................................................................................... 32
Appendix ..................................................................................................................................................... 33
Appendix 1: City of Charlottesville Building Groups ............................................................................... 33
Appendix 2: City of Charlottesville Energy and Water Management Policy ........................................... 34
Appendix 4: 2019 CCS Annual Energy and Water Performance Report ................................................. 37
Appendix 5: EnergyCAP Dashboard info & Link ...................................................................................... 38
Appendix 6: City Benchmarked Facilities and ENERGY STAR Scores ...................................................... 39
Appendix 7: Detailed Utility Usage and Costs for FY2019 and FY2020 .................................................. 40
City FY2020 Annual Energy and Water Performance Report
3 | P a g e
Introduction
Since the adoption of the City Council vision of becoming “A Green City” in 2006, the City of Charlottesville has endeavored to develop programs that help reduce the impact of energy and water usage in the community, such as through the Commercial Energy Loan Fund (CELF) and utility rebates for energy and water efficient equipment. Taking responsibility for the municipal side, the City implemented practices that ultimately improve energy and water performance in municipal operations, including upgrading lighting and water fixtures across the municipal portfolio in 2008 and installing solar photovoltaic systems on seven City-owned facilities.
In 2019, the City set a community-wide climate action goal of achieving a 45% reduction in greenhouse gas emissions by 2030 and carbon neutrality by 2050. Although the municipal portion of the total Charlottesville community greenhouse gas (GHG) emissions footprint is a limited 2.9%, the City demonstrates leadership by taking necessary actions that improve efficiency, reduce the reliance on fossil fuels, and decrease greenhouse gas emissions (City of Charlottesville 2016 Greenhouse Gas Inventory, pg. 11).
The City of Charlottesville’s Energy and Water Management Program (EWMP) monitors and manages energy and water usage at over 70 municipal sites. Through the EWMP, the City tracks the energy and water usage at these facilities to gauge performance, coordinates with the City’s Facilities Maintenance and Facilities Development teams on building operations and improvement projects, works with staff to develop strategies that expand the renewable energy footprint of buildings, and engages with staff, faculty, and students to help lessen their impact on energy and water usage.
This report provides an overview of the actions that helped to further the priorities of the Energy and Water Management Program and the energy and water performance of all the City’s municipal buildings throughout the 2020 fiscal year. The City’s performance was reviewed on an account, building, and building group level, where building groups are categories of similar use types of the City’s municipal facilities such as schools, fire stations, and offices (See a list of all the City’s facilities and building groups included in this report in Appendix 1).
The Energy and Water Management Team proposed the City’s first Energy and Water Management Policy which was signed in July 2019 by the City Manager (Appendix 2). The policy provided clear standards and expectations for management of energy and water efficiency in the City’s facilities. Although many of the standards (particularly
operational) were already being implemented, the policy provided support and context for these efforts. To further solidify the efforts of the EWMP in City schools,
the Charlottesville School Board passed the Resolution for Charlottesville City Schools Energy and Water Performance (Appendix 3) in April 2019 which committed efforts to implement actions that improve energy and water performance of the schools.
The importance of the policy and resolution cannot be overstated as these commitments contribute to the City’s community-wide greenhouse gas emissions
goals and larger sustainability efforts.

City FY2020 Annual Energy and Water Performance Report
4 | P a g e
Glossary
Building Automation System (BAS): A control system in buildings that allows monitoring and control of heating, ventilation, and air conditioning (HVAC) systems, lighting, and other building equipment through a common interface.
Building Groups: Building groups are categories of typical use-types of the City’s municipal facilities developed by the Energy and Water Management Team to compare similar types of facilities with each other and with national standards (e.g., fire stations, schools, and offices). Specific City facilities within a building group are defined in Appendix 1.
Benchmarking: The practice of comparing the measured utility performance of a building over time to itself or relative to other similar buildings.
Better Business Challenge (BBC): Local challenge being hosted by the Community Climate Collaborative to bring businesses together to work toward reducing their overall greenhouse gas impact and improve efficiency in their buildings.
Calendar Year (CY): Unit of time looking at measurements made from January 1st through December 31st of that year.
Capital Improvement Project (CIP): Project requiring capital expenditure and specified approval annually for City and School budgets.
Charlottesville City Schools (CCS): Charlottesville City Schools are the City of Charlottesville’s public school division. Charlottesville City Schools are a building group in the City facilities portfolio represented as the “Schools” building group.
City Facilities: City facilities represents all facilities and buildings that are managed and/or owned by the City of Charlottesville and are included in this report. In this report City and municipal are used synonymously. The City’s facilities are listed in their respective building group in Appendix 1.
Coronavirus (COVID-19): The coronavirus is an infectious disease that impacted the entire world brought on by a newly discovered coronavirus in 2019, giving it the name COVID-19.
Cubic Feet (cf): Unit of measurement used for natural gas and water utility consumption.
Department of Mines, Minerals, and Energy (DMME): Virginia state agency established to facilitate energy, geology, and mining programs within Virginia.
Energy and Water Management Program (EWMP): A program run by the Energy and Water Management Team that manages utility usage for all City facilities.
Energy and Water Management Team (EWMT): A group of Public Works Department staff with representation from the Facilities Maintenance, Facilities Development, and Environmental Sustainability Divisions that manages and facilitates the Energy and Water Management Program.
Energy Performance Contract (EPC): An agreement between an entity and a contractor (typically an ESCO) to perform building upgrade services that provide guaranteed energy savings.
City FY2020 Annual Energy and Water Performance Report
5 | P a g e
Energy Services Company (ESCO): A contractor that provides the services agreed to in an energy performance contract.
EnergyCAP: Software platform used by the City to monitor and manage utility usage and costs.
ENERGY STAR Score: An energy performance indicator ranging from 1 to 100 established by the Environmental Protection Agency’s (EPA) ENERGY STAR program. This performance indicator compares a building’s utility performance to other similar building types with normalization of weather and operational differences (e.g., occupancy, plug load, and operating hours). A higher ENERGY STAR score indicates a better building performance where a score of 50 represents a building with a median energy performance compared to similar building types across the nation.
Energy Use Intensity (EUI): The EUI is a measure of how much energy a building uses per square foot. To calculate the EUI, the total energy usage (e.g., electricity and natural gas) is converted to a common unit known as kilo-British thermal units (kBtu) and is then divided by the total square footage of the building. Typical EUIs can range from 40 – 70 kBtu/sf depending on the property type and the lower EUI value, the less energy intensive the facility.
Fiscal Year (FY): Unit of time looking at measurements made from July 1st through June 30th of the following calendar year.
Greenhouse Gas (GHG): Gases that absorb infrared radiation and contribute to the greenhouse effect (warming) of the Earth. The primary greenhouse gases include water vapor, carbon dioxide, methane, nitrous oxide, and ozone.
Heating, Ventilation, and Air Conditioning (HVAC): Equipment or system that controls thermal comfort within a built environment. Includes equipment such as air handlers, chillers, cooling towers, and boilers.
HVAC Schedules: Setting that determines when components of the HVAC system turn on and turn off daily.
Kilo British Thermal Units (kBtu): Unit of measurement for energy. One Btu (British Thermal Unit) is defined as the amount of heat required to raise the temperature of one pound of water by one-degree Fahrenheit. 1 kBtu is equal to 1,000 Btus.
Kilowatt-hour (kWh): Unit of measurement for power, the rate at which energy is generated or consumed. Used to measure electricity consumption.
Light-Emitting Diode (LED): A semiconductor that emits light when current passes through it. LEDs typically use less energy and last longer than traditional light sources (e.g., incandescent, fluorescent, halogen).
Leadership in Energy and Environmental Design (LEED): An internationally accepted green building rating system developed by the US Green Building Council.
Metric Tons of Carbon Dioxide Equivalent (MTCO2e): Unit used for aggregating greenhouse gases (e.g., carbon dioxide, methane, nitrous oxide) into one common unit. The global warming potential for each greenhouse gas (how much heat each gas traps in the atmosphere, relative to carbon dioxide) is used to convert the emissions of that gas to a carbon dioxide equivalent measured in metric tons.

City FY2020 Annual Energy and Water Performance Report
6 | P a g e
Photo Voltaic (PV) System: A system that generates electric power by using solar cells to convert sunlight into direct current electricity.
Solar Power Purchase Agreement (PPA): A financial agreement with a developer where the developer facilitates the design and installation of a solar system and charges the customer a fixed electricity rate for the power generated, typically below the current market electricity rate. The developer maintains the system through the end of the contract term and at the end, the customer may choose to extend the contract, purchase the system, or have the developer remove it.
STEM (Science, Technology, Engineering, and Mathematics): Grade school subject that brings in concepts of science, technology, engineering, and mathematicises together in one academic discipline. At Charlottesville City Schools, this subject is called “iSTEM” which stands for Instructional STEM.
UtilityTrac: Software platform previously used by the City to monitor and manage utility usage and costs.
Weather Normalization: A method of estimating the impact of weather on energy consumption and adjusting consumption to remove weather variance from year to year. Typically uses degree days (the number of days that exceed or go below a balance point temperature multiplied by the extent to which the daily average deviates from the balance point temperature). If the average temperature is above the balance point, that day would be considered a cooling degree day (CDD). If the average temperature is below the balance point, that day would be considered a heating degree day (HDD).
WE@Work (Water and Energy at Work): WE@Work is a program developed by the Energy and Water Management Program focusing on engagement and education of City staff to improve behaviors that could impact energy and water usage in the workplace.

City FY2020 Annual Energy and Water Performance Report
7 | P a g e
Actions
The Energy and Water Management Program (EWMP) has identified three focus areas for organizing actions related to improving energy and water performance: operations, technology, and people. This three-prong approach ensures that the program comprehensively addresses the most influential factors that affect energy and water usage in facilities by evaluating building operations, building equipment, and occupant use (Image 1). In July 2019, the Charlottesville City Manager signed the City’s first Energy and Water Management Policy setting new operational, technological, and behavioral standards for all City buildings and employees around energy and water efficiency (Appendix 2). Many of the operational standards were already being implemented by City staff and now have a dedicated policy to institutionalize these actions and efforts. The EWMP is responsible for this policy being implemented across all City facilities and provides support when necessary.
Image 1: The Energy and Water Management Program involves the interactions of all three focus areas (operations, technology, and people) to implement energy and water efficiency across City facilities.
In April 2019, the Charlottesville School Board passed the Resolution for Charlottesville City Schools Energy and Water Performance (Appendix 3), committing to working with the City of Charlottesville to implement actions that improve energy and water performance of Charlottesville City Schools (CCS). These included prioritizing strategies that reduce the energy and water usage of existing facilities, adhering to high performance building standards for any new construction or renovations, and expanding the amount of energy derived from clean energy sources. The EWMP has partnered with the CCS Administration to support actions that speak to the priorities stated in the CCS resolution. These include tracking the energy and water usage at school facilities to gauge performance, coordinating with the City’s Facilities Maintenance and Facilities Development teams on building operations and improvement projects, working with City staff to develop strategies that expand the renewable energy footprint of the schools, and engaging with students and faculty to help lessen their impact on energy and water usage (Appendix 4).
City FY2020 Annual Energy and Water Performance Report
8 | P a g e
Operations
Efficient operations of City facilities represent the lowest cost but potentially the highest impact opportunities for achieving energy and water use reductions. These include examining the control and maintenance of heating, ventilation, and air conditioning (HVAC) systems and lighting in facilities, then aligning this with the current needs of building occupants. The goal is to run equipment optimally and efficiently and eliminate unnecessary operations. Many times, shifting occupant needs (ad hoc events or meetings) present difficulties in consistently maintaining comfort and minimizing unneeded operations, but they also provide opportunities to fine-tune equipment schedules and enhance current communication and scheduling processes. These typical actions have virtually no additional cost and can produce real savings (energy, water, and dollars).
Strategies Implemented
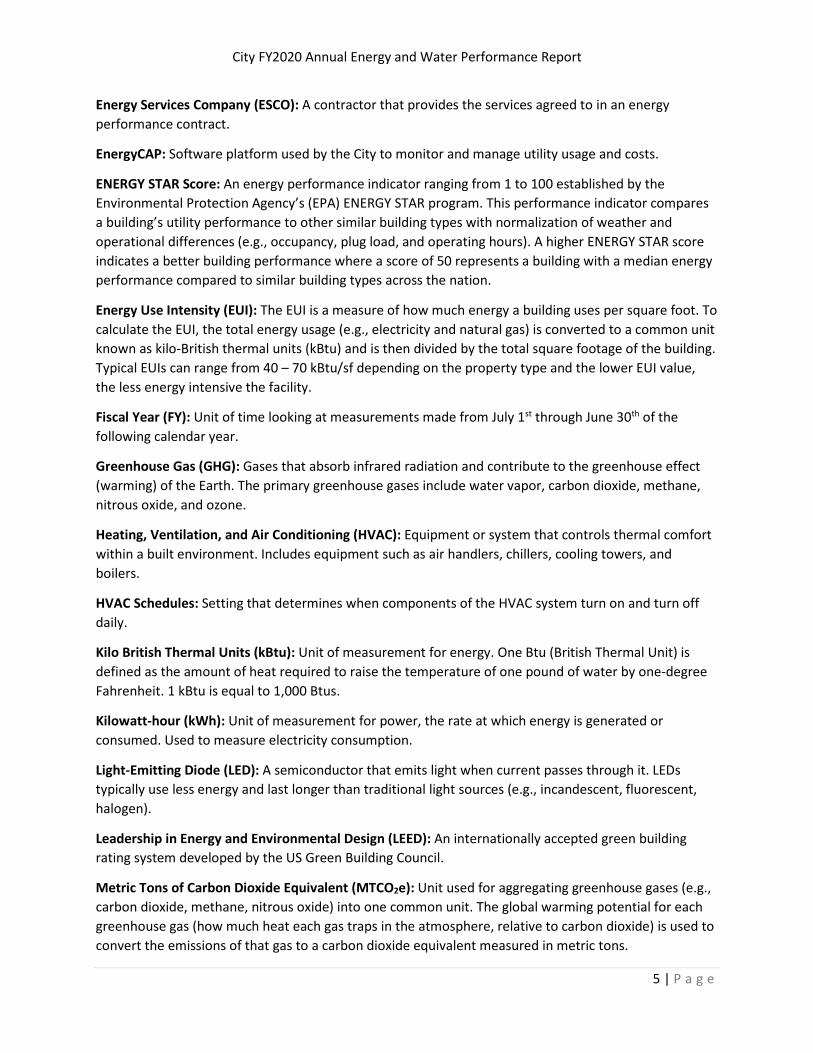
Establishing an Energy and Water Management Team (EWMT) To properly manage efficiency in City buildings, various perspectives must be brought together to manage and implement strategies cohesively and consistently including stages of design, construction, renovation, maintenance, and operations. To ensure such a comprehensive approach, the City formed the Energy and Water Management Team (EWMT). The Team is comprised of staff from Facilities Maintenance (responsible for managing the operations and maintenance of facilities), Facilities Development (responsible for constructing and renovating facilities), and Environment Sustainability (responsible for evaluating efficiency opportunities and aligning with larger environmental goals) Divisions (Image 2). With these three divisions represented, energy and water strategies can be vetted from not only the building operations perspective (existing equipment that is in the building), but from the development perspective (future renovations and new equipment) as well. One of the primary goals of this Team is to deliver the EWMP.
Utility Tracking and Investigation Each month the EWMT reviews the utility usage (electricity, natural gas, and water and sewer) of all City facilities. The EWMT is looking for abnormal or inconsistent trends that may indicate an operational issue like a toilet running or an air handling unit running longer than normal. Utility usage is compared to previous years as well as the previous month and include normalization for variation in weather. Through this tracking, the EWMT has been able to identify potential issues with building operations,
Image 2: The Energy and Water Management Team (EWMT) is currently comprised of Kirk Vizzier (Environmental Sustainability), Jill Greiner (Environmental Sustainability), Kristel Riddervold (Environmental Sustainability and Facilities Development), and Mark Zavicar (Facilities Maintenance) and are seen here coordinating via Zoom during COVID-19.

City FY2020 Annual Energy and Water Performance Report
9 | P a g e
investigate these issues by talking to appropriate staff, and facilitate work orders to address problems when necessary. As a result, several instances of City building equipment issues causing unnecessary operations or water leaks have been fixed preventing the unchecked waste of that utility. The EWMT uses EnergyCAP software (discussed on page 11) to monitor utility usage and costs effectively and efficiently. During the coronavirus (COVID-19) pandemic, the EWMT provided monthly and more comprehensive quarterly updates on the impact responses to COVID-19 had on utility usage and costs.
Reviewing HVAC Schedules and Communication Processes As a best practice, it is important to periodically review the HVAC scheduling process to ensure that staff are communicating HVAC needs through the appropriate channels and that the schedules accurately align with actual facility use. In some cases, HVAC schedules may be adjusted due to changing occupant needs and may not have be revisited to see if this new schedule remains appropriate. Through regular reviews of schedules, instances when the HVAC was scheduled to run for a reserved event where the event had been cancelled or changed resulting in unnecessary HVAC usage, were identified and corrected.
In addition to HVAC schedules matching the needs of the occupants, at times, schedules can conflict with the building’s ability to reach satisfactory indoor air temperatures based on the changing outside temperature. Schedules are periodically adjusted because of a specific need during a colder or warmer time of year (starting up earlier to make sure the building is at the occupied temperature set points when occupants arrive) but these are not always adjusted back to normal settings. For example, if a year has a colder winter and the heating system is set to come on earlier to reach occupied temperatures, that same schedule could remain in place after outside temperatures become milder, although this longer operation is not necessary. It is important to review these schedules and adjust as needed to keep up with changing conditions. The EWMT works with the Facilities Maintenance teams and City staff to review and confirm appropriate schedules.
Strategies Planned/FY2021 Outlook
Looking further into FY2021, the EWMT will continue to monitor utilities and City operations to ensure that systems are only running when necessary. HVAC schedule reviews will be a priority, which is especially dependent on effective communication of HVAC needs and consistent reminders to keep calendars up to date. The Facilities Maintenance teams have been on the “front lines” of making efficiency adjustments in real time and will continue to be the most important actors in maintaining and improving operational efficiency. As some City facilities have been largely vacant or low occupancy due to closures for the Coronavirus (COVID-19) pandemic, Facilities Maintenance teams have performed measures to save energy and water including putting building systems in set-back mode, performing remote monitoring of system operations through building automation systems (BAS), and responding to emergency calls on-site as needed. The City is continuing to explore expansion of resources related to BAS monitoring and energy management.
In October 2018, the EWMT identified that some of the main areas in City Hall were operating longer than necessary, and through further review of occupant needs, schedules were adjusted. This change was a 30 hour per week reduction in HVAC operations, which trimmed off approximately one month of electricity usage for the building.

City FY2020 Annual Energy and Water Performance Report
10 | P a g e
Technology
Building equipment (e.g., HVAC, BAS/control systems, lighting, plumbing fixtures) continues to increase in efficiency and offers greater abilities to control and reduce energy and water usage at City facilities. Although opportunities exist to upgrade building equipment within the City’s portfolio, cost tends to be the limiting factor. The City has been able to annually implement a few projects that cycle in more efficient systems that will ultimately improve the efficiency of the City’s facilities. The lowest cost upgrades tend to be associated with lighting while HVAC systems and building envelope (includes roof, windows, building façade/curtain wall) improvements are at the higher end. The existing funding mechanisms have allowed for incremental upgrades of equipment over time that address equipment efficiency. These may not always be visible, as for example, HVAC equipment replacement and installation of newer and more sophisticated BAS are usually not noticeable to the public, but the improvements on the energy and water side can be seen in the utility usage.
Strategies Implemented
Installation of LED Lighting Over the years, the City has gradually replaced lighting with light-emitting diodes (LEDs) in municipal facilities. Lighting upgrades, including LEDs and lighting controls (e.g., dimmers and occupancy sensors), are incorporated into renovation projects where feasible and as required by updated energy codes. Areas in City Hall, the City Yard Warehouse, Public Works/Public Utilities Administration Building, Circuit Courthouse, and Smith Aquatics Center have had lighting upgrades and future projects are being planned. Additionally, lighting at the McIntire Park softball field was upgraded to LEDs in 2018.
The City has replaced exterior high intensity discharge (HID) lighting at school buildings with more efficient LEDs. This includes wall pack lighting on the sides of most school facilities and parking lot pole lighting at Charlottesville High School. Interior lighting has been upgraded as funding allows with ongoing modernization projects. In FY2019 and FY2020, the City implemented lighting upgrades at Jackson-Via Elementary and Greenbrier Elementary, switching from fluorescent to LED lighting fixtures. At Jackson-Via Elementary, a modernization project included an LED upgrade component with enhanced lighting controls (occupancy sensors with dimming capabilities) for the lower level classrooms and commons of the school. In addition, older Smartboards were replaced with LED touchscreen Smartboards that use less energy. At Greenbrier Elementary, hallway fluorescent lighting was converted to LEDs, with dimming control and solar tube skylights being considered as future additions. Although these projects did not address all lighting in the facilities, it did lower the lighting energy footprint of the schools and made incremental progress toward high efficiency lighting and lighting controls
Upgrades to Building Automation Systems Building automation systems (BAS) located at each facility control the HVAC system and lighting (in some cases). The BAS provides the ability to monitor HVAC settings and schedules that have a direct impact on energy usage from building operations. Newer systems tend to have more advanced capabilities to monitor specific settings, trend performance data, and generally a more intuitive interface that better equips Facilities Maintenance staff to control the building. An advanced BAS also aids in the ability to implement energy management strategies through programming algorithms to auto-adjust for changing building conditions or getting real-time data to the maintenance team to make operational adjustments quickly.
City FY2020 Annual Energy and Water Performance Report
11 | P a g e
BAS’s have been upgraded at most schools including Greenbrier Elementary (2015), Burnley-Moran Elementary (2016), Walker Upper Elementary (2017) Jackson-Via Elementary (2018), and Johnson Elementary (2019), and CATEC (jointly with Albemarle County) currently underway with a typical schedule of upgrading one school per year. After the BAS was installed at Johnson Elementary, the Facilities Maintenance team continued to coordinate with the contractor to ensure that programing within the system was accurate and included necessary schedules and settings. The system installation was completed in August 2019 with a few programming changes occurring in October 2019 that corrected some errors. The new system included upgraded thermostats, and after installation, the Facilities Maintenance team provided an overview of how to operate the thermostats to the school’s principal.
Project Rebate Programs Through the PJM Regional Transmission Organization In 2018, the City entered into an agreement to participate in the Energy Efficiency program offered by the Pennsylvania, Jersey, Maryland (PJM) Regional Transmission Organization, the organization that manages the electric grid across portions of the Mid-Atlantic and Mid-West regions of the United States. The Energy Efficiency program offers financial incentives to organizations to implement projects that improve energy efficiency and reduce the energy usage at a location. These can include lighting upgrade projects, HVAC equipment replacement projects, and building envelope improvement projects. CPOWER, a curtailment service provider, helps facilitate the program and is the third-party that the City works with to verify projects that are submitted for this program. Projects have the opportunity to receive a quarterly financial incentive for up to four years after the projects are completed.
The EWMT submitted a chiller replacement project that was implemented at Charlottesville High School in 2016 along with an air handling unit (AHU) replacement at City Hall from 2017. These were approved and starting in Fall 2019, PJM provided a payment of approximately $500 that will continue to be paid each quarter throughout 2020. Since the chiller replacement at Charlottesville High School was completed in 2016 and 2017 was the first full year of savings, 2020 marks the fourth year after installation and will be the last year the project is eligible for payment. Payments for the AHU upgrade at City Hall will continue through 2021. The City has designated a fund that is earmarked for energy and water efficiency to allocate these payments, and the EWMT will continue to submit new (eligible) projects for this program to capture additional funding to be reinvested into efficiency projects.
EnergyCAP Utility Tracking Software The EWMT utilizes a utility tracking and management software called EnergyCAP to compile all of the utility accounts and facilities in the City together for efficient and effective analysis and management. Initially, in 2005, staff internally developed a Microsoft Access database to collect and process the City’s utility data. UtilityTrac, a utility tracking software obtained in October 2012 provided enhanced analysis and data management services. In FY2020, the EWMT switched to EnergyCAP, as the software provides automatic utility bill updates for any of City’s utility accounts rather than updating the data manually and is a widely-used platform by other Virginia localities. EnergyCAP is a well-established utility tracking software that has continued to roll out new tracking features including the recent improvements in data submissions to ENERGY STAR Portfolio Manager and pulling ENERGY STAR scores for tracking and reporting within EnergyCAP.
In the winter of 2020, the EWMT received a multi-day long training on the software and shortly afterwards officially launched the software use. The EWMT uses EnergyCAP to regularly review the utility data of each facility to inform monthly reports and identify trends or issues that might require

City FY2020 Annual Energy and Water Performance Report
12 | P a g e
further investigation. Other features in the EnergyCAP software include utility bill review and audits, auto-generated reports, interval data and sub-meter tracking, and greenhouse gas emissions calculations to name a few. There are also several viewable dashboards the EWMT has made available to various groups in the City where more frequent review and information on their specific facilities’ performance is helpful (notably Parks, Recreation & Sports, and Schools). The data provided in this report can also be viewable and interacted with in an EnergyCAP dashboard outlined in Appendix 5.
Water Sub-Meters In order to more accurately track water usage of high-water consuming accounts and receive notifications of issues or leaks daily rather than during the EWMT’s monthly utility review, the City has installed water sub-meters in a few locations. Currently, the City has water sub-meters at two locations: on a water line that supplies the Crow Pool facility that gets its water from Walker Upper Elementary and CCS Administration Building; and on the Police Department’s cooling tower that gets its water from the City Hall Complex building. These sub-meters are managed separately from the primary water utility accounts and receive daily (Crow Pool) and hourly (Police Department’s cooling tower) water use data. The Police Department’s cooling tower submeter is a regular utility meter that utilizes a technology that can read the number of mechanical turns from the meter and sends the information via Wi-Fi to a receiver to then update a cloud dashboard regularly (Image 3). These remote reading adaptors are a great opportunity to get instant readings on older, mechanical water meters. Both these sub-meters have provided essential information including email notifications around potential water leaks that have resulted in next day response rather than having to rely in billing information to identify potential leaks, which can have as much as a month delay. This has been particularly helpful for Crow Pool in coordination with the Parks and Recreation staff around when the pool is being filled or when there is an issue that needs to be investigated. The sub-meter at Crow Pool also allows for an exact utility cost to be calculated for Parks and Recreation that is taken out of the larger water and sewer bill to CCS for Walker Upper Elementary facilities. The EWMT is looking to utilize additional water sub-meters in areas that need regular usage checks and notifications to address facilitates prone to water leaks or issues.
Solar The first solar photovoltaic (PV) systems on City facilities were installed at Charlottesville High School, ecoREMOD Energy House, and the Facilities Maintenance Building (Table 1). To continue this effort, the City established the CitySolar program which aims to expand solar power across municipal facilities. This includes incorporating systems into new construction buildings, such as Fontaine Fire Station, and at existing buildings, such as the Smith Aquatics Center (Image 4). The electricity produced by Image 4: Solar PV system on the roof of
Smith Aquatics Center.
Image 3: Water submeter and remote reading technology for Police
Department’s cooling tower unit.

City FY2020 Annual Energy and Water Performance Report
13 | P a g e
these systems is used directly at the site and most energy production data is tracked and monitored by the EWMT.
In September 2017, the solar PV systems at City facilities surpassed 1 gigawatt hour (1,000,000 kilo-watt hours) of electricity production and to date have produced over 1.7 gigawatt hours of electricity, avoiding 1,285 metric tons of CO2 emissions.
Table 1: Solar photovoltaic systems installed to date at City facilities.
Facility Installed Capacity (kW) Year Installed Location
Charlottesville High School 111.8 2012/2013 Roof and ground mount City Yard Warehouse 44.3 2016 Roof
ecoREMOD Energy House 5.8 2011 Roof Facilities Maintenance Building 21.1 2012 Roof
Fontaine Fire Station 17.7 2016 Roof Lugo McGinness Academy 9.4 2015 Roof
Smith Aquatics Center 40.5 2016 Roof
Strategies Planned/FY2021 Outlook
Looking into FY2021, a selection of HVAC and BAS projects are going to be moving forward. The BAS at City Hall is going to be upgraded to ensure that equipment controllers and communications devices used by the BAS are up to date and functioning properly. The upgraded BAS will have advanced programming in place to make it easier to monitor and manage operations as effectively as possible. Additionally, Walker Upper Elementary is scheduled for two rooftop air handling unit replacements that will improve fresh air circulation in the gym and auditorium. Hallway console units are scheduled to be replaced at Walker Upper and Venable Elementary this fiscal year as well.
Traditionally, most projects are part of the capital improvement program (CIP) and, due to funding limitations, project funding may be limited or deferred due to other City project priorities. This causes equipment upgrades to take place at a gradual but planned pace. The EWMT is investigating an alternative method for financing and implementing projects called an energy performance contract. This is a budget-neutral approach whereby an energy savings company (ESCO) identifies and implements energy and water savings projects with a guaranteed annual utility savings that covers the cost of the projects each year. This means that if projects are implemented and the City does not see the projected utility savings, the ESCO is required to pay back the difference. The City implemented an EPC in 2008 using a similar model to this to upgrade lighting and water fixtures but with improvements in technology, it is important to revisit this opportunity.
The EWMT has been in discussions with the Department of Mines, Minerals, and Energy (DMME) - the Virginia state agency that offers access and assistance to public entities in going through the Energy Performance Contract (EPC) process. The EWMT is developing a plan to initiate the first no-cost, no-commitment step of the process, which consists of soliciting a back-of-envelope audit from prequalified ESCOs. This step will inform the potential selection of a provider for the energy performance contract.

City FY2020 Annual Energy and Water Performance Report
14 | P a g e
Due to precautions taken during the Coronavirus (COVID-19) pandemic, this process has been delayed but has recently been resumed.
Expanding the amount of energy derived from renewable sources will be a key strategy for the municipal sector portion of the City's Climate Action Plan which is currently under development. Solar is the primary technology being considered, and multiple avenues for adding more capacity are being reviewed. These include power purchase agreements (PPAs) to install solar energy systems onsite at facilities and accessing offsite solar through virtual power purchase agreements (VPPAs). Solar systems installed at school locations provide the opportunity for a more tangible learning experience about renewable energy. Onsite solar power systems reduce the need for grid-purchased electricity, but system size and generation potential are limited by roof and ground space. Offsite solar provides the opportunity to access higher capacity systems that will produce larger amounts of solar energy. Although these systems would not tie directly to municipal facilities, the City can retain the environmental and carbon-free attributes from the power generated, thereby reducing its greenhouse gas emissions. The City is evaluating how best to achieve the largest greenhouse gas reductions while achieving the direct benefits of onsite solar.
People (Behavior)
Strategies Implemented
Employee Outreach and Engagement The EWMT worked to get the message of saving energy and water out to employees before the Energy and Water Management Policy was signed. They participated in the Employee Bazaar in Spring 2019 where they had Employee Checklists (Image 6) providing quick ways to save in their office, an example of a linear LED office light, and water bottles to make the switch to reusable from plastic (Image 5). This was a great opportunity to connect with City staff about the importance of this program and its goals. Additionally, the Water Conservation Program gives all new City government employees a reusable water bottle at their new employee orientation to encourage their commitment to saving water, reporting leaks, and using a reusable water bottle. This program has been going on for several years, preceding the establishment of the EWMP.
Image 5: EWMT at the City’s Employee Bazaar with information about how to save energy and water in their offices.

City FY2020 Annual Energy and Water Performance Report
15 | P a g e
To support the large amount of information related to the policy, potential questions related to the policy, and resources to help save energy and water at the workplace, the EWMT developed an intranet website for staff with all resources and updates. The website content was then updated to the new internal City website in April 2020, and content continues to be added and updated (Energy and Water Management Program Intranet City Website).
Images 6 & 7: 6 EWMP Checklist for City Staff. 7: Power point slide reminding staff to not use space heaters that was put up on display TVs located in common areas and emailed out to staff.
During the winter of FY2020, several messages were put out around energy conservation. Space heater use typically increases when the temperature drops outside, and in order to ensure staff knew the use of these were not allowed in City facilities, an announcement and poster were sent out focused on all City staff (Image 7). This was also paired with information about hot and cold comfort issues and a recommendation to use the work order process to notify Facilities Maintenance staff to help identify the problem rather than try and mask it with a space heater, which ultimately causes more heating and cooling issues for the space. In FY2020, the EWMT was brought in to assist with addressing hot and cold issues by helping educate staff members around expected office temperatures and troubleshooting solutions when necessary. Lastly, during the holidays, the EWMT provided a note of clarification around the use of holiday lights with regards to compliance with the City’s policy.
Better Business Challenge The City and CCS are part of the current Better Business Challenge being hosted by the Community Climate Collaborative. This challenge encourages the entire Charlottesville area to improve the performance of their buildings through monitoring and making improvements. The EWMT is helping manage the City’s participation in the challenge which goes through the Spring of 2021 (Image 8). Many of the program initiatives of the EWMP align with those of the Better Business Challenge, so the EWMT intends to use the challenge to further encourage changes and involvement to improve the City’s energy and water efficiency.
Image 8: City of Charlottesville accepting their Better Business
Challenge participation for 2020/2021.

City FY2020 Annual Energy and Water Performance Report
16 | P a g e
Energy and Water Management Campaign at CCS With the signing of the Resolution for Charlottesville City Schools Energy and Water Performance in the Spring of 2019, the City and CCS developed a new partnership to help implement energy and water efficiency into our schools and create a consistent and engaging message around saving water and energy to staff and students (Appendix 3). Through this new partnership, the EWMT quarterly meetings with each school’s principal to discuss school performance and a new educational initiative that will be rolled out to each school (Image 9, Appendix 4). In addition, school-specific opportunities to collaborate with teachers on projects that would align well with CCS and the EWMT’s education goals are discussed. With the engagement of the school principal around educational messages, the principal helped provide their school’s unique connection through school announcements and newsletters (with text provided by the EWMT) around the quarterly educational message and a few energy and water saving tips that could be applied at school. Each quarter, the EWMT identified themes with an energy and water saving message and tips supported with announcements, information on CCS’s website, and posters or activity sheets (CCS’s Energy and Water Conservation Website).
Specific class engagement was developed through principal meetings and discussions with the CCS iSTEM Coordinator. The EWMT met with all CCS iSTEM teachers at the beginning of the school year in 2019 to discuss their education goals and initiatives and offer resources for any interested teachers. Several iSTEM teachers from Charlottesville High School and Buford Middle School reached out for data around their specific schools’ energy and water usage including some interval (30 minute) electricity data for students to interpret and graph.
Strategies Planned/FY2021 Outlook
WE@Work The EWMT has been working on a new program focused on staff engagement and working on their behaviors related to saving energy and water in the office. This program is called WE@Work, standing for “Water and Energy at Work”, and is a structured set of steps that help workplaces increase their efficiency and change behaviors (Image 10). The program is divided up into three tiers, which include incentives for completing each tier. The EWMT hopes to launch the program in FY2021; however, COVID-19 will likely delay a larger launch of this program.
Image 9: EWMT members with Charlottesville High School Principal
with Fall 2019 Quarter Poster.
Image 10: WE@Work Logo for EWMP’s workplace engagement program standing for Water and
Energy at Work.

City FY2020 Annual Energy and Water Performance Report
17 | P a g e
Energy and Water Management Campaign at CCS At CCS, the EWMT plans to continue education and outreach efforts at each school including quarterly focuses through announcements and posters or activity sheets during the school year. Further classroom engagement opportunities will be explored with each school to find appropriate ways to engage students when learning about similar topics. Also, EWMT hopes to install mirror clings in all school bathrooms that encourage students to turn the water off when not in use and report water leaks. The outreach about these were postponed during Spring 2020 due to COVID-19 impacts to the school year. Additionally, the EWMT is working with CCS to determine the most appropriate and effective means of educating students about energy and water management throughout the 2020/2021 school year as school operations shift due to COVID-19.
Case Study: Think Global, Act Local Classroom Engagement The assistant principal at Clark Elementary helped connect the EWMT with one of their teachers, Ms. Ashley Riley, working on communication with the fourth-grade classes. Ms. Riley had her students work on marketing pitches around the idea of “Think Global, Act Local” and their task was to apply this idea by marketing to their fellow students about the EWMP and how to engage them to save water. The EWMT presented at each fourth-grade class about the EWMP and provided context around the larger goal of this initiative as well as provided lots of marketing examples from the Water Conservation Program’s extensive community outreach campaigns. Unfortunately, the final pitch from students was cancelled due to COVID-19 impacts on the school year, but the students enjoyed working on a project that would have had a direct impact on their school.

City FY2020 Annual Energy and Water Performance Report
18 | P a g e
Performance Energy and water performance can be influenced by several factors including those that are within our control, such as building equipment efficiency, building operations, and occupant behavior, and those that are outside our control, such as weather. Replacing inefficient equipment may seem like the highest priority but managing operations to maximize efficiency and educating occupants on best practices can have a major impact on performance. Since weather varies from year to year, it’s necessary to normalize (adjust data to account for weather changes) so that a warmer winter one year (requiring less natural gas usage) will not artificially seem like an improvement in a building’s energy performance.
Changes in occupancy can also have an effect on both energy and water usage. Building occupancy tends to have a more direct effect on water usage, due to domestic water usage for restrooms. Occupancy’s effect on energy usage only comes through if operations of those spaces changes to adjust for the low occupancy. For example, if a space becomes unoccupied but the HVAC is still running on the normal schedule for that area, nothing has changed with the energy usage. Therefore, it is important to track when and where spaces within our facilities are being used so that unoccupied areas can have reduced HVAC and lighting operations.
FY2020 has been a unique year for tracking the City’s utility performance primarily the result of a national pandemic that impacted the world in the Spring of 2020, COVID-19. As a result of COVID-19, the City shut down most City facilities and reduced occupancy in those that needed to remain open starting around mid-March 2020 and continuing through the end of FY2020. With low or no occupancy in many City facilities, there was a significant reduction in usage and costs associated with utilities from mid-March through end of June 2020 (Figure 1 and Figure 3). The following Portfolio Performance section of this report goes into further detail around the impact of COVID-19 to the City’s utility usage and spending. The impacts of COVID-19 on utility usage and how to address the changes in facility occupancy and performance are still actively being investigated. Although many of these facilities have a reduced capacity, there is also additional cleaning and increased airflow needed to help reduce the transmission of COVID-19, which could in turn increase utility usage (potentially even long-term). The EWMT continues to track the impacts of COVID-19 and research how to best handle such a unique year in the City’s portfolio performance. Ultimately, savings and reductions in utility usage in FY2020 should not necessarily be attributed to performance or behavior improvements to save energy and water. The detailed analysis of the City’s performance will need to be further assessed to fully understand how and to what extent the City’s reductions were the result of COVID-19 versus other energy and water saving efforts.
The City’s portfolio performance was assessed by looking at each utility account, each building, and each building group. Building groups are categories of typical use types of the City’s facilities and a way to compare similar types of facilities to each other within a building group and to national standards. The EWMT has identified 11 building groups which represent the various 70+ City facilities, and Appendix 1 references which specific facility falls under each building group (Table 2). This performance section reports primarily on information and trends at the building group level with a few individual facilities highlighted.

City FY2020 Annual Energy and Water Performance Report
19 | P a g e
Table 2: The City’s 11 building groups and important portfolio performance metrics. Source for Regional Average EUI
Building Group Gross Floor
Area (sq. ft.)
Site Energy Use
Intensity Regional Average
EUI
FY2020 Energy Change
FY2020 Water
Change
(kBtu/sf) (compared to FY2019)
(compared to FY2019)
Courthouses 59,886 33.7 101.2 -14% -13% Fire Stations 60,660 48.5 63.5 0% -7% Libraries 46,945 63.9 71.6 -12% -39% Offices 243,550 48.6 52.9 0% -11% Parks -- -- -- -6% -13% Recreation & Sports 121,953 112.2 50.8 -19% 3% Schools 845,984 49.2 48.5 -10% -21% Street Lights & Traffic Signals -- -- -- 0.1% -- Transit & Parking* 235,292 26.1 56.2 1% -25% Vehicle Charging Stations -- -- -- -5% -- Warehouses & Fleet Mixed Use 88,908 -- -14% 9%
Offices** 43,340 54.5 52.9 Vehicle Repair*** 45,568 65.0 47.9
* Includes bus terminals and parking garages. Regional Average EUI is for bus terminals. **Includes Facilities Maintenance building, Pupil Transportation building, and CAT Transit Operations Center (EUI is weighted average). **Includes City Yard Warehouse and City Yard Wash Facility (EUI is weighted average).
EUI and ENERGY STAR Scores
To measure performance, we compare each building to itself overtime to see how energy and water usage has changed over the years. For energy, we also compare buildings to each other using metrics known as Energy Use Intensity (EUI) and ENERGY STAR scores. The EUI is a measure of how much energy (electricity, natural gas, etc.) a building uses per square foot and the lower the EUI, the better. Site EUI (listed in Table 2) is a measure of the energy that is used at the building/property directly, whereas Source EUI is a measure of what is used on site as well as production and delivery losses that may have occurred while getting the electricity to the site. Source EUI is used in some cases as a more complete representation of environmental impact but is typically not as accessible (goes beyond what is listed on the electric bill).
EUI allows an organization to compare smaller buildings to larger buildings even though the larger building will likely use more energy. Although it is appropriate to compare the EUI of office buildings to the EUI of other office buildings, the EUI should not be used to compare offices to other types of buildings, such as schools and fire stations. The differing use cases make these inaccurate comparisons of performance. City of Charlottesville fire stations, libraries, offices, and schools building groups on average have a lower EUI compared to the regional average for their representative building groups. This is attributed to strides made in the past to upgrade lighting to high-efficiency fluorescent (2008/2009), phase-in of more efficient HVAC equipment, and a push to have new buildings meet green

City FY2020 Annual Energy and Water Performance Report
20 | P a g e
building standards (e.g., Fontaine Fire Station achieved LEED Platinum certification). It is important to point out that the EUI for the recreation & sports building group is twice as large as the average regional EUI but gives an incomplete picture. The regional average EUI for gymnasiums, fitness centers, skating rinks, and pools are averaged together as one EUI by ENERGY STAR. However, natatoriums are extremely more energy intensive than these other facility types (it’s not uncommon to see EUI above 300 kBtu/sf) and although Smith Aquatics Center and Crow Pool have averaged around 250 kBtu/sf, this still skews the EUI high for this recreation & sports building group.
Another measure of performance is the ENERGY STAR score. The City has 37 facilities benchmarked using ENERGY STAR Portfolio Manager, an online tool that allows buildings to receive a score based on the level of energy efficiency compared to similar facilities across the nation. For example, schools are compared to other schools to give a 1-100 score, where the higher the score the more efficient the building is. An ENERGY STAR score of 50 means that the school is performing at the 50th percentile of schools nationwide while a score of 75 means that the school is performing in the top 25%. Buildings need to have a score of 75 or higher before pursuing ENERGY STAR certification. ENERGY STAR for buildings is a measure of operational performance at that point in time and is meant to be reviewed and applied for annually. Although there is a cost for the review and certification, achieving consistent multi-year certifications is seen as a goal for many organizations.
The City achieved ENERGY STAR certification in 2009 for facilities that met the prerequisite score of 75 (Table 3). As buildings across the nation have gotten more efficient, ENERGY STAR has adjusted the Portfolio Manager tool to account for this, which raises the bar for achieving higher ENERGY STAR scores. This means it is harder to achieve an ENERGY STAR score of 75 in 2020 than it was in 2009 if facilities have not kept up with the nation’s pace of efficiency improvements.
Eight City facilities had reached a 75 score by the end of FY2019 and ten facilities by the end of FY2020, including City Hall Complex, Public Works Administration building, Johnson Elementary School, and Lugo McGinness Academy, but have not yet been certified. As occupancy and operations were reduced drastically in Spring/Summer 2020 due to COVID19 response, the ENERGY STAR scores became inflated, representing an inaccurate view of energy performance for many facilities. The City is finetuning space attributes in ENERGY STAR Portfolio Manager to reflect the shift in operations across the 37 benchmarked facilities (Appendix 6) and is pursuing ENERGY STAR certification where possible for eligible facilities.
ENERGY STAR Certified (2009) Burnley-Moran Elementary Charlottesville High School
City Hall Complex Clark Elementary
Greenbrier Elementary Jackson-Via Elementary
Johnson Elementary Venable Elementary Table 3: ENERGY STAR Certified Facilities in 2009.

City FY2020 Annual Energy and Water Performance Report
21 | P a g e
Portfolio Performance
Figure 1: The City’s utility spending for the past 6 fiscal years for each commodity type across all City facilities. The yellow dotted line is the overall trend in spending over time across all 6 years.
Overall, the City’s portfolio spends over $2.279 million for energy and water utilities annually, which has been on a slight upward trend over the past years excluding FY2020 (Figure 1) (Note: Total utility spend is $2.907 million once all street light & traffic signal accounts are included, a portion of which are currently excluded from this report as described further below). This increase is due in part to increasing utility rates but also changing operations year to year of the various facilities. Electricity makes up the majority (73%) of the City’s utility costs with water and sewer as the next largest at 19% of cost and natural gas contributing to less than 10% of utility costs (Figure 2). FY2020 had the lowest cost and usage for each utility since FY2015 (Figure 1). This significant decline was the result of COVID-19 reducing the usage of all City facilities starting around Mid-March 2020 and continuing through the end of the fiscal year. With schools, recreation/sports, and many office facilities (the City’s
$0
$500,000
$1,000,000
$1,500,000
$2,000,000
$2,500,000
$3,000,000
FY2015 FY2016 FY2017 FY2018 FY2019 FY2020
Municipal Utility Spending
Electric Natural Gas Water & Sewer
Figure 2: The City’s annual utility spending broken down by commodity type for FY2020 across all City facilities.

City FY2020 Annual Energy and Water Performance Report
22 | P a g e
highest utility users) shut down during this time, the City saw a large decline in utility usage. When looking at the last three months of FY2020 (April – June) compared to the same months in FY2019, and when the majority of the City’s facilities were at its lowest usage in FY2020, the City saw $262,093.19 (41%) in utility savings (Figure 3). The month of May saw the largest savings (comparing FY2020 to FY2019 Costs) with $108,735.02 and these usage and savings trends are continuing to be seen in FY2021 as a result of COVID-19 impacting the City’s operations and facility occupancy. With FY2020 having a significant event impact the City’s usage and utility spending, there is a new challenge for determining true savings from energy and water conservation initiatives. As a result, usage and savings declines will need to be further reviewed and compared to future years as the City’s operations changes and hopefully returns to a more normal schedule post-COVID-19.
Figure 3: Monthly utility savings from all City facilities comparing 2020 monthly costs to 2019 monthly costs to show the impact of COVID-19. The total utility savings for each month are indicated in bold above each month’s stacked bar in the figure.
The year FY2015 was used as a performance baseline for utility tracking as it is the earliest full year of utility usage that includes all the current facilities in use by the City. The EWMP uses FY2015 as a comparison baseline when determining long term trends and changes. The year FY2016 is used as the City’s weather normalization standard (all energy data is adjusted according to deviation from FY2016 heating and cooling degree days) as it represents a typical and expected weather trend for Charlottesville, Virginia. Normalizing for weather removes the effects from varying outside temperature from year to year (colder or warmer years) and allows utility performance to be evaluated based on non-weather events, such as efficiency projects or adjustments to operations.
When reviewing the performance of each building group, a general goal of 2% reduction in utility consumption has been used as an annual target. This goal was presented by the EWMT as a point of comparison for the facilities’ performance and is not an official goal; however, it is an attainable goal in
$80,312.97
$108,735.02
$73,045.20
$0
$20,000
$40,000
$60,000
$80,000
$100,000
$120,000
April May June
Util
ity S
avin
gs
Utility Savings for City Facilities in 2020 Compared to 2019
Electric Natural Gas Water

City FY2020 Annual Energy and Water Performance Report
23 | P a g e
most settings that would help keep utility spending from increasing year to year. Overall, the goal of the EWMP and City is to reduce our utility consumption and utility costs through efficient management of those utilities and improved behaviors. If the 2% reduction per year was applied to the baseline usage in FY2015, FY2020 would ideally show a 10% reduction in utility usage. Although FY2020 is a unique year as a result of COVID-19, usage in FY2020 has declined when comparing to the FY2015 baseline year in each utility (Figure 1). The City saw a 10% decline in electricity usage, a 2% decline in natural gas usage, and an 7% decline in water usage compared to FY2015. The test of this decline will come after COVID-19’s impact to utility usage subsides as previous fiscal year trends did not hold to the 2% annual reduction. In addition, the general goal of a 2% reduction in utility usage annually is currently being re-evaluated as part of the City’s climate action process to ensure reductions are aligning appropriately with the City’s larger climate action goals.
The figures and data from this report can be viewed through an interactive dashboard on EnergyCAP. See the appendix for further instructions regarding how to access this information (Appendix 5).
Electricity
Figure 4: The City’s electricity usage (weather normalized) for the past 6 fiscal years across all City facilities and partitioned out by building group.
As stated above, electricity makes up the bulk of spending for utilities at 73% of total utility costs. Electricity use across the City’s building portfolio has had some fluctuation since FY2015 (baseline year) but it has for the most part remained steady through FY2019 (Figure 4). As stated previously, adjustments to operations in response to COVID-19 in the last quarter of FY2020 caused major reductions across all utilities making that year an anomaly. Electricity usage dropped 9% in FY2020
0
5,000,000
10,000,000
15,000,000
20,000,000
25,000,000
FY2015 FY2016 FY2017 FY2018 FY2019 FY2020
Usa
ge (k
Wh)
Municipal Electricity Usage by Building Group
Courthouses Fire Stations LibrariesOffices Parks Recreation & SportsSchools Street Lights & Traffic Signals Transit & ParkingVehicle Charging Stations Warehouses & Fleet Mixed Use Total Usage Linear Trendline

City FY2020 Annual Energy and Water Performance Report
24 | P a g e
compared to FY2019 and 10% compared to FY2015, which cannot all be credited to improvements in building efficiency (Appendix 7.1). However, without the concerted efforts of Facilities Maintenance teams to reduce equipment operations to only operate when necessary, these reductions would have been much less during this period.
Electricity use at facilities is mainly tied to the cooling and ventilation systems, indoor/outdoor lighting, and equipment plug load. Beyond facilities, the City portfolio also includes street lights & traffic signals, and vehicle charging stations.
Figure 5: The City’s electricity usage (weather normalized) for each building group over the past 6 fiscal years.
When looking at the City’s portfolio by building group, most groups have trended down over the past 6 years (Figure 4 & 5). However, schools have continued to see an increase in electricity usage through FY2019 and since schools make up nearly 50% of the electricity usage of the City’s portfolio, it tends to drive the overall performance of the portfolio. This electricity increase is mostly related to two factors: construction and renovation projects and expanded after-hours/summer activities.
Construction and renovation projects are typically performed during the summer in schools in order to minimize disruptions during the school year. Summer is also the most electricity-intensive time period as this is the peak of the cooling season when HVAC systems are trying to keep up with warmer temperatures and higher humidity. Most construction projects require significant back and forth foot traffic and activity that sometimes requires doors to be left open longer, allowing conditioned air to escape. Best practices for minimizing open door duration can be recommended to contractors (even required) but are difficult to enforce consistently. The result is that increased electricity use can be incurred during the construction period. Additionally, BAS installations have been implemented each
0
1,000,000
2,000,000
3,000,000
4,000,000
5,000,000
6,000,000
7,000,000
8,000,000
9,000,000
10,000,000
Usa
ge (k
Wh)
Municipal Electricity Usage by Building Group
FY2015
FY2016
FY2017
FY2018
FY2019
FY2020

City FY2020 Annual Energy and Water Performance Report
25 | P a g e
year at one school since 2015 and require fine-tuning after installation to get the HVAC system running properly, so a portion of the increases are the result of inefficient HVAC temperatures and scheduling during this process. The EWMT is consulting industry best practices and successful methods for working with contractors more effectively to manage energy use during projects.
After-school and weekend activities (athletic practices, clubs, church service) and summer activities (camps, athletic practices) tend to vary year to year at schools and recreation facilities. These activities require HVAC and lighting systems to run in many areas (sometimes the whole facility). This can cause fluctuations in the electricity that is seen year to year at each facility. When larger facilities, particularly schools, start operating for longer hours, the portfolio tends to see an overall shift in electricity use. In 2019, Charlottesville High School had an increase in summer camps that required greater daily HVAC and lighting operations throughout July and August compared to 2018. Charlottesville High School electricity usage is the largest from any facility in the City’s portfolio, and a small shift here can cause large shifts at the portfolio-level. Although electricity use for after-hours and summertime activities is seemingly a necessity rather than something that can be managed and reduced, the EWMT worked with Charlottesville High School staff in January 2020 to determine when HVAC and lighting in portions of the school could be shut-off if not being used during these activity periods and educated staff on the appropriate method for scheduling.
Offices and recreation & sports facilities have the second and third highest electricity usage after schools in the portfolio. City Hall and City Hall Annex are the largest office buildings in the City’s portfolio and subsequently have the largest impact on the performance of the offices building group. Smith Aquatics Center has the highest electricity use in the recreation & sports user group and the most energy intensive facility in the entire portfolio (highest kBtu/sf) due to HVAC operation needed to consistently manage ventilation, humidity, and varied space temperature throughout the facility. Beyond schools, the offices and recreation & sports building groups tend to have the most impact on the portfolio’s electricity usage, so focusing efforts on improving performance at City Hall, City Hall Annex, and Smith Aquatics Center has become a more targeted priority.
Street lights & traffic signals as a building group are not fully represented in this report as historical data for some street light accounts are still being gathered for analysis. The annual electricity usage for the excluded accounts is approximately 3,860,347 kWh ($627,540 cost) and will be factored into future reporting.
Natural Gas
In FY2020, natural gas represented approximately 9% of utility spending in the City’s building portfolio. Schools, recreation& sports, and offices facilities have the highest usage of the portfolio due to the size of the facilities and type of use. In most cases, natural gas is used for space heating and water heating and in schools, it is also used by kitchen appliances.
The portfolio showed an increasing trend from FY2015 – FY2018, driven mostly by schools where increased natural gas for space heating was occurring (Figure 6). However, throughout FY2019 and into FY2020, the portfolio saw a drop in natural gas compared to previous years, in part due to improvements in efficiency around operations of heating systems. Facilities Maintenance teams across all facilities investigated areas to reduce unnecessary heating by adjusting schedules and equipment settings to trim up operations while working with all City staff to ensure that comfort is being

City FY2020 Annual Energy and Water Performance Report
26 | P a g e
maintained. The teams have made this a standard practice to perform during the heating season each year. The 7% reduction (Appendix 7.2) in FY2020 compared to FY2019 is also attributed to reduced operations of facilities due to COVID-19 in April, May, and June 2020. This was the end of the heating season so the shutdowns had less impact on natural gas overall than electricity but the City’s facility portfolio did see reductions of 58% in April, 27% in May, and 20% in June.
Figure 6: The City’s natural gas usage (weather normalized) for the past 6 fiscal years across all City facilities and partitioned out by building group.
Recreation & sports facilities saw a 14% drop in natural gas in FY2020 compared to FY2019 (Appendix 7.2) because of COVID-19 shutdowns at facilities such as Smith Aquatics Center and Crow Pool. Offices actually saw an increase of 14% overall, driven mainly by space heating at City Hall Complex and City Hall Annex to keep space temperatures comfortable in areas with reduced occupancy (less people means less body heat and less heat from office equipment use). In late summer 2017 (FY2018), Charlottesville High School experienced a natural gas leak during the summer which caused a major spike in natural gas usage, which can be seen in FY2018 usage and was the main driver for the increase seen at the City portfolio level that year (Figure 7). The issue was addressed but not before a considerable amount of natural gas loss had occurred.
0
5,000,000
10,000,000
15,000,000
20,000,000
25,000,000
30,000,000
35,000,000
FY2015 FY2016 FY2017 FY2018 FY2019 FY2020
Usa
ge (C
ubic
Fee
t)
Municipal Natural Gas Usage by Building Group
Courthouses Fire Stations LibrariesOffices Parks Recreation & SportsSchools Transit & Parking Warehouses & Fleet Mixed UseTotal Usage Linear Trendline

City FY2020 Annual Energy and Water Performance Report
27 | P a g e
It is important to note that both FY2018 (skewing high) and FY2020 (skewing low) are anomalies so savings compared to FY2018 and the savings seen in FY2020 need to be normalized further to determine more accurate usage savings numbers related to efficiency improvements.
Figure 7: The City’s natural gas usage (weather normalized) for each building group over the past 6 fiscal years.
Water and Sewer
In FY2020, 19% of total utility costs were for water and sewer at City municipal facilities. Water and sewer costs and water consumption have fluctuated over the past six years with a slight decline in usage over time (Figure 8). When comparing FY2015 (baseline year) water usage to FY2020 usage, there is a 7% decline. This declining rate is close to the general 2% reduction goal in usage annually with 10% decline as the target for FY2020. The increase and fluctuation associated with water and sewer costs and usage for water can be associated with the addition of a few new water accounts over the past six years particularly for irrigation and parks accounts as well as a few large water leaks that have occurred over the past five years. FY2018 most notably had the City’s highest water usage, which can be attributed to several parks facilities that had very large water leaks (Figure 8 & 9). Because many of these facilities are outside and are already high users of water like pools and splash grounds, their water leaks are often harder to identify and fix. Since FY2018, water usage has declined, a trend that can be seen across almost all of the City’s building groups (Figure 8).
0
2,000,000
4,000,000
6,000,000
8,000,000
10,000,000
12,000,000
14,000,000
16,000,000
18,000,000
Usa
ge (C
ubic
Fee
t)
Municipal Natural Gas Usage by Building Group
FY2015
FY2016
FY2017
FY2018
FY2019
FY2020

City FY2020 Annual Energy and Water Performance Report
28 | P a g e
Figure 8: The City’s water usage for the past 6 fiscal years across all City facilities and partitioned out by building group.
Figure 9: The City’s water usage for each building group over the past 6 fiscal years.
0
500,000
1,000,000
1,500,000
2,000,000
2,500,000
3,000,000
3,500,000
4,000,000
4,500,000
5,000,000
FY2015 FY2016 FY2017 FY2018 FY2019 FY2020
Usa
ge (C
ubic
Fee
t)Municipal Water Usage by Building Group
Courthouses Fire Stations LibrariesOffices Parks Recreation & SportsSchools Transit & Parking Warehouses & Fleet Mixed UseTotal Usage Linear Trendline
0
200,000
400,000
600,000
800,000
1,000,000
1,200,000
1,400,000
1,600,000
1,800,000
2,000,000
Usa
ge (C
ubic
Fee
t)
Municipal Water Usage by Building Group
FY2015
FY2016
FY2017
FY2018
FY2019
FY2020

City FY2020 Annual Energy and Water Performance Report
29 | P a g e
Schools, parks, and recreation & sports building groups are the City’s highest water users consistently each year (making up 37%, 29%, 14% respectively of FY2020’s total water usage) (Figure 8). These three building groups see high numbers of people using these facilities and some include water specific features like pools and spray grounds. Domestic daily water usage is heavily impacted by the number of people in a building particularly from the use of toilets. FY2020 has seen the lowest usage over six years; however, this is likely a result of COVID-19. With most of the City’s facilities including schools and all recreational & sports (which makes up over 65% of the City’s water usage in FY2020) shutting down from approximately mid-March through the end of the fiscal year, water usage was expected and observed to decline in FY2020 (Figure 3). When just looking at the last three months of the FY2020 (April – June 2020) compared these months in FY2019, it was estimated that the City saved just under 100 thousand dollars from reduced water usage as a result of COVID-19 with an average monthly reduction in usage of about 285,000 cubic feet of water (72% reduction) (Figure 3). This trend in reduced usage is continuing into FY2021 as facilities continue to be used differently or reduced occupancy through COVID-19. Although water usage is on a downward trend, when comparing FY2020 to other years including the FY2015 baseline year, additional analysis and trend watch needs further assessment to establish how COVID-19 has impacted FY2020 and future years. The 7% decline in usage from FY2015 to FY2020 is the outcome the EWMT is looking for; however, based on previous year’s water usage we are not seeing any decline in total usage until FY2020. Although the usage and cost decline are from actual changes in building usage, it is unlikely we will see this continued decline in usage if facility occupancy returns to pre-COVID-19 numbers.
When comparing FY2019 to FY2020, we see a 15% decline in usage and 13% decline in water and sewer costs (Appendix 7.3). The change in cost of water and sewer was not as high as the change in water usage as a result of the approximate 1% increase in water utility rates and 2% increase sewer utility rates references in the City of Charlottesville Utility Rate Report. As mentioned, the declining trend for usage and cost is likely attributed to primarily COVID-19 and the resulting changes in use of the facilities. When looking across each building group, only the recreation & sports and warehouses & fleet mixed use building groups saw an increase in usage, 3% and 9% respectively (Figure 9, Appendix 7.3). The increase for recreation & sports facilities can be attributed to the fact that the gym space at Key Recreation Center was used as a temporary shelter because of COVID-19 to increase shelter capacity, and there were water leaks identified at Meadow Creek Golf Course and Smith Aquatic Center in FY2020 that contributed to the 3% increase in usage. The increase in usage in the warehouses & fleet mixed use building group is driven solely by a large increase in usage for the Transit Operation Center (78% increase in usage from FY2019 to FY2020) due to a water meter failure resulting in correcting usage and a water leak in FY2020; whereas all other facilities in this building group saw a decline in usage including Facilities Maintenance having a 54% decline in usage from last fiscal year. Even a few running toilets can cause water usage to spike during a particular year. The EWMT has been closely monitoring water usage at each facility and has been very quick to report abnormal spikes or trends in water usage for further investigation by the Facilities Maintenance team.

City FY2020 Annual Energy and Water Performance Report
30 | P a g e
Greenhouse Gas Emissions
On July 1, 2019, the City of Charlottesville committed to a community-wide greenhouse gas (GHG) reduction goal of 45% below the 2011 inventory year by 2030 and carbon-neutrality by 2050.
Since 2011, the portfolio has seen some fluctuation but mostly a downward trend (18.4% reduction by FY2015 and 37.5% in total by FY2020) in greenhouse gas emissions (Figure 10). This reduction is in part due to the electric grid becoming cleaner (generating energy from cleaner sources), so although electricity usage has remained fairly steady over the past 6 years, the electricity used is producing less emissions. The reduction seen in FY2020 also is attributed to reductions in operations at facilities due to COVID-19, which must be treated as an anomaly.
Electricity is the source of most greenhouse gas emissions from City buildings so strategies that reduce electricity have the potential to have the greatest impact on emissions (Figure 11). Electricity can also get cleaner overtime as renewable sources, such as solar and wind, continue to be installed at the grid-level and onsite. Although advancements are being made in cleaner natural gas (e.g., renewable natural gas), it is still a fossil fuel and use of this will likely continue to
Figure 10: Greenhouse gas emissions for the past 6 years across all City and school facilities.
Figure 11: The City’s Greenhouse gas emissions by fuel type (percentage).
0
2,000
4,000
6,000
8,000
10,000
12,000
14,000
FY2015 FY2016 FY2017 FY2018 FY2019 FY2020
Met
ric T
ons o
f CO
2e
Municipal Greenhouse Gas Emissions
Metric Tons of C02e 2011 GHG Baseline

City FY2020 Annual Energy and Water Performance Report
31 | P a g e
produce greenhouse gas emissions for the foreseeable future. As stated in the “City of Charlottesville 2016 Greenhouse Gas Inventory”, the two options for reducing greenhouse gas emissions are from switching to a fuel source that produces less emissions and from reducing energy use through efficiency and conservation measures. Both of these approaches will continue to be utilized to reduce the City’s greenhouse gas footprint. Please note that the streetlight accounts that were excluded in the electricity analysis are excluded from this greenhouse gas analysis as well, due to missing historical information, but will be incorporated in future reporting once obtained. The additional greenhouse gases associated with these accounts are approximately 1,100 MTCO2e.
Green Building Certifications
In 2008, the Charlottesville City Council adopted a resolution to implement green building practices for City construction projects (2008 Green Building Resolution). This resolution outlined the use of the USGBC (U.S. Green Building Council) LEED (Leadership in Energy and Environmental Design) program to guide the design and construction of City facilities. As a result, the City has been able to achieve LEED status on numerous building projects (Table 4, View on the interactive CityGreen Map).
The City will continue to use USGBC’s LEED as a guide for design and construction projects and will monitor the development of other green building certification programs that could help City projects achieve a greater level of sustainability.
Project Year LEED Level Downtown Transit Station 2008 Gold EcoREMOD 2009 Platinum Smith Aquatic Center 2010 Platinum Charlottesville Area Transit 2012 Gold Facilities Maintenance Building 2013 Gold Fontaine Fire Station 2014 Platinum Circuit Court - Renovation 2020 Gold
Table 4: Municipal LEED Building Projects

City FY2020 Annual Energy and Water Performance Report
32 | P a g e
FY2021 Outlook
The City will be enhancing filtration in HVAC systems (including UV and Bi-polar Ionization systems) along with using portable HEPA filters for mitigation of COVID-19 in most facilities. This will likely increase the energy usage required from HVAC systems and could have an impact on overall energy usage at these facilities. However, the EWMP is expecting, with the program’s continual review of utilities and involvement in identifying opportunities to help save as well as the impacts from COVID-19, that there will be reductions seen across all utilities’ consumption in FY2021. The EWMP plans to establish clear reduction goals for City’s facilities for each utility that are in line with meeting the City of Charlottesville’s Climate Action Plan and greenhouse gas emission reduction goals. The EWMP will continue to review utility performance monthly and investigate opportunities to improve efficiency through operations, technology, and behavior strategies. Through an Energy Performance Contract (if pursued), the program hopes to identify a myriad of opportunities to improve efficiency at most of the municipal facilities and to estimate approximate cost savings from these improvements over the life of the contract. Through some form of Power Purchase Agreement (if pursued), the program hopes to realize a shift in electricity purchases that are both cost-saving and emissions-reducing. In addition, partnerships between the City and CCS and outreach with City staff have allowed for considerable progress to be made on energy and water efficiency, and the EWMP is looking forward to building on this momentum to impact behavioral changes. COVID-19 will continue to be a challenge in FY2021 as building usage and occupancy continues to be variable and different than previous years. The EWMP will continue to research how to best track and normalize for utility changes from COVID-19 so that savings can be more accurately attributed to efficiency improvements from the City’s progress.

33 | P a g e
Appendix Appendix 1: City of Charlottesville Building Groups City of Charlottesville’s building groups and specific buildings used and referenced in the report.

34 | P a g e
Appendix 2: City of Charlottesville Energy and Water Management Policy
City of Charlottesville Energy and Water Management Policy signed July 26, 2019 (Login Required: City of Charlottesville Intranet Website)

City FY2020 Annual Energy and Water Performance Report
35 | P a g e
Appendix 3: Resolution for Charlottesville City Schools Energy and Water Performance

City FY2020 Annual Energy and Water Performance Report
36 | P a g e
Resolution for Charlottesville City Schools Energy and Water Performance (PDF)

City FY2020 Annual Energy and Water Performance Report
37 | P a g e
Appendix 4: 2019 CCS Annual Energy and Water Performance Report
2019 CCS Executive Summary and Annual Energy and Water Performance Report (PDF)
The City of Charlottesville’s Energy and Water Management Program (EWMP), which monitors and manages energy and water usage at over 70 City sites, has partnered with the Charlottesville City School (CCS) Administration to support actions that speak to the priorities stated in the CCS Energy and Water Performance Resolution passed in April 2019. This Resolution includes efforts to track and reduce energy and water usage, improve building operations, and increase education and awareness. The 2019 CCS Annual Energy and Water Performance Report provides an overview of the actions performed that helped to further the priorities of the CCS resolution and improve the energy and water performance of CCS facilities throughout the 2019 calendar year. The EWMP has set a general guide of a 2% reduction in utility consumption at each school to help provide an attainable goal and means of comparison from a school’s previous year performance. CCS’s utility spending has seen a steady increase over the past 5 years. This trend is the result of increasing utility rates and changes in building operational schedules with the largest increase in spending coming from electricity costs. Natural gas has seen a declining trend in usage over the past five years with the help of warmer weather but also improved operations of facilities’ heating systems. This is particularly highlighted at Buford Middle School and Walker Upper Elementary, where there was a 37% and 24% reduction respectively in natural gas usage between 2018 and 2019. Water usage has also seen a decline in usage over the past 4 years as a result of improved operational equipment and response times to water leaks particularly at Charlottesville High School and Venable Elementary which saw decreases of 26% and 23% respectively when comparing 2018 to 2019 water usage. When reviewing the performance of CSS facilities, using energy use intensity (EUI) and ENERGY STAR scores, which provides values that are comparable regardless of building size, most CCS facilities perform better than the region’s average for EUI and median score for ENERGY STAR. This further validates that the performances of CCS buildings are moving in the correct direction, and still have room to improve. Ultimately, improved performance of CCS facilities will reduce greenhouse gas (GHG) emissions and help with the City’s community-wide GHG reduction goals. Currently, CCS facilities make up approximately 40% of the municipal GHG contribution and there has been a leveling off over the past 5-years in emission levels. Efforts to reduce our utility usage and implement clean energy strategies like switching to lower-emissions fuel sources will help reduce CCS’s GHG footprint and help meet Charlottesville’s 45% reduction goal (below 2011 inventory emissions) by 2030 and carbon-neutrality by 2050. 2019 CCS Performance Report Dashboard A Dashboard of all the data included in the 2019 Annual Performance Report with interactive options and more detailed data can be viewed at

City FY2020 Annual Energy and Water Performance Report
38 | P a g e
Appendix 5: EnergyCAP Dashboard info & Link
EnergyCAP FY2020 City Performance Report Dashboard Link (Try opening dashboard using Chrome web browser for best results)
This dashboard is an interactive option for viewing the data put forth in this report using the EWMT utility tracking software, EnergyCAP. The figures in this dashboard are all slight variations of the data provided in this report. The data in this dashboard are for all City facilities; however, you can further filter the data specific for one facility using the “Filter by building or building group” feature in the upper right. Start typing the name of the facility or building group (from Appendix 1) and select the correct name from the auto-generated list and the data will update with your new filtered view. Many of the figures and graphs offer the ability to interact including hovering over the figures to get detailed information and changing time views of the data using the slide bar above or below a graph. Most data presented in these figures are static and are focused on FY2020; however, a few are continually updated with data over time but still include FY2020 numbers and some are showing calendar year views, not fiscal year.
Any questions about this data or dashboard can be directed to [email protected].

City FY2020 Annual Energy and Water Performance Report
39 | P a g e
Appendix 6: City Benchmarked Facilities and ENERGY STAR Scores
Facilities ENERGY STAR Score*
FY2015 FY2019 FY2020
Buford Middle School 43 42 59
Burnley-Moran Elementary School 33 61 72
Bypass Firehouse 202.1 kBtu/sf 174.4 kBtu/sf 176.4 kBtu/sf
Central Fire House 157.8 kBtu/sf 157.5 kBtu/sf 121.0 kBtu/sf
Central Library 192.9 kBtu/sf 205.2 kBtu/sf 177.5 kBtu/sf
Charlottesville High School 71 61 68
Circuit Court 39 70 99
City Hall Annex 39 44 40
City Hall Complex 81 89 89
Clark Elementary School 37 38 54
Community Attention Main Office (909 E Market St.) 39 44 42
CAFF Office (414 4th St.) 84 80 87
Crow Pool/Center 342.6 kBtu/sf 332.3 kBtu/sf 280.8 kBtu/sf
Downtown Transit Station 54 59 55
Facilities Maintenance 99 99 99
Fontaine Fire Station 121.2 kBtu/sf 127.3 kBtu/sf 124.2 kBtu/sf
Gordon Avenue Library 136.3 kBtu/sf 102.3 kBtu/sf 96.3 kBtu/sf
Greenbrier Elementary School 51 59 70
DHS Administration (907 E Jefferson St.) 40 66 74
Jackson-Via Elementary School 65 60 70
Jessup House * 87 80
Johnson Elementary School 71 74 76
Juvenile & Domestic Relations Court 46 39 48
Key Recreation Center 99.0 kBtu/sf 99.7 kBtu/sf 90.9 kBtu/sf
Lugo-McGinness Academy 82 90 93
Market St Parking Garage 63.7 kBtu/sf 65.6 kBtu/sf 64.1 kBtu/sf
Onesty Pool 239.4 kBtu/sf 379.1 kBtu/sf 228.9 kBtu/sf
Preston-Morris Building 70 80 86
Public Works Administration 73 83 86
Pupil Transportation 99 99 99
Smith Aquatic Center 656.3 kBtu/sf 569.6 kBtu/sf 439.5 kBtu/sf
Tonsler Park 107 kBtu/sf 142.7 kBtu/sf 139.7 kBtu/sf
Transit Operation Center 149.5 kBtu/sf 148.3 kBtu/sf 140.6 kBtu/sf
Venable Elementary School 52 56 62
Venable School Annex 1 3 3
Walker Upper Elementary School 40 35 41
Wheeler Building 41 51 56
* Property types that aren't eligible for ENERGY STAR scores use weather normalized source EUI (kBtu/sf) in Portfolio Manager.

40 | P a g e
Appendix 7: Detailed Utility Usage and Costs for FY2019 and FY2020
Appendix 7.1: City of Charlottesville’s electric usage and costs for each building group in FY2019 and FY2020 with percent comparison. Usage is weather normalized.
Building Group Electricity (kWh) Electricity Cost
FY2019 FY2020 % Change FY2019 FY2020 % Change Courthouses 620,926 531,901 -14% $57,109 $52,692 -8% Fire Stations 728,729 727,441 0% $62,350 $60,486 -3% Libraries 649,668 570,314 -12% $61,512 $54,576 -11% Offices 2,628,525 2,636,193 0% $236,390 $230,967 -2% Parks 583,007 545,459 -6% $63,829 $57,133 -10% Recreation & Sports 2,676,754 2,158,308 -19% $226,572 $195,009 -14% Schools 9,253,265 8,334,767 -10% $923,696 $815,221 -12% Street Lights & Traffic Signals* 93,138 93,269 0.1% $16,486 $16,428 -0.3% Transit & Parking 1,222,290 1,232,734 1% $111,177 $108,454 -2% Vehicle Charging Stations 3,917 3,717 -5% $569 $547 -4% Warehouses & Fleet Mixed Use 787,258 679,020 -14% $73,172 $62,861 -14% Total 19,247,477 17,495,586 -9% $1,832,861 $1,651,162 -10%
*Note that some accounts for Streetlights/Traffic Signals have been excluded where historical data needs to be obtained but will be included in future reporting as data is compiled. This represents approximately 3,860,347 kWh and $627,540.

City FY2020 Annual Energy and Water Performance Report
41 | P a g e
Appendix 7.2: City of Charlottesville’s natural gas usage and costs for each building group in FY2019 and FY2020 with percent comparison. Usage is weather normalized.
Building Group Natural Gas (cubic feet) Natural Gas Cost
FY2019 FY2020 % Change FY2019 FY2020 % Change Courthouses 736,462 207,098 -72% $7,757 $1,575 -80% Fire Stations 1,033,652 450,650 -56% $10,686 $4,127 -61% Libraries 995,540 977,921 -2% $9,927 $7,344 -26% Offices 2,387,410 2,725,173 14% $24,359 $20,702 -15% Parks 440,216 624,886 42% $4,987 $5,143 3% Recreation & Sports 6,261,449 5,395,338 -14% $62,435 $39,811 -36% Schools 12,751,845 11,916,560 -7% $130,474 $83,357 -36% Street Lights & Traffic Signals - - - - - - Transit & Parking 1,904,834 1,881,864 -1% $18,204 $13,429 -26% Vehicle Charging Stations - - - - - - Warehouses & Fleet Mixed Use 2,708,651 2,919,417 8% $28,472 $22,583 -21% Total 29,220,060 27,098,908 -7% $297,301 $198,070 -33%
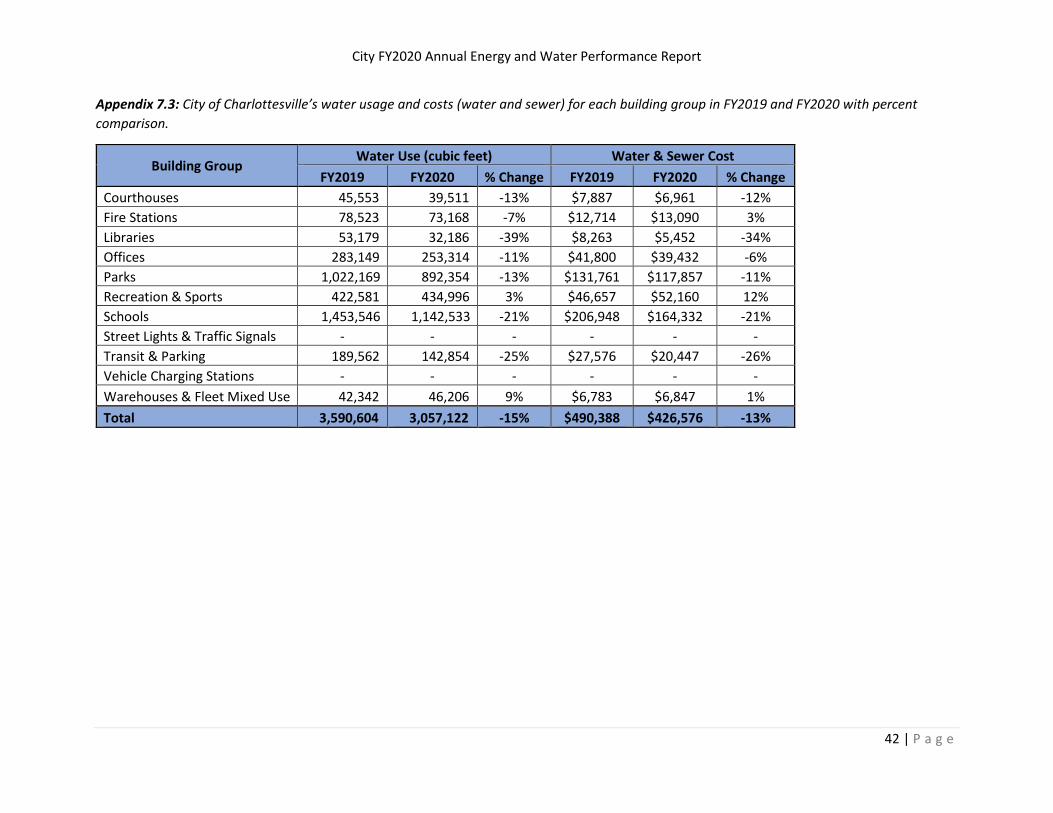
City FY2020 Annual Energy and Water Performance Report
42 | P a g e
Appendix 7.3: City of Charlottesville’s water usage and costs (water and sewer) for each building group in FY2019 and FY2020 with percent comparison.
Building Group Water Use (cubic feet) Water & Sewer Cost
FY2019 FY2020 % Change FY2019 FY2020 % Change Courthouses 45,553 39,511 -13% $7,887 $6,961 -12% Fire Stations 78,523 73,168 -7% $12,714 $13,090 3% Libraries 53,179 32,186 -39% $8,263 $5,452 -34% Offices 283,149 253,314 -11% $41,800 $39,432 -6% Parks 1,022,169 892,354 -13% $131,761 $117,857 -11% Recreation & Sports 422,581 434,996 3% $46,657 $52,160 12% Schools 1,453,546 1,142,533 -21% $206,948 $164,332 -21% Street Lights & Traffic Signals - - - - - - Transit & Parking 189,562 142,854 -25% $27,576 $20,447 -26% Vehicle Charging Stations - - - - - - Warehouses & Fleet Mixed Use 42,342 46,206 9% $6,783 $6,847 1% Total 3,590,604 3,057,122 -15% $490,388 $426,576 -13%