city of cleveland annual
TRANSCRIPT

2006
Annual
Report
City of Cleveland
Division of Water Pollution Control


Letters . . . . . . . . . . . . . . . . . 2-3
Our Underground Network . . . . . . 4
Healthy Solutions for Cleaner Waterways . . . . . . . . . . 5
Extended Hours, New Equipment =Improved Customer Service . . . . . . 6-7
Sustaining, Restoring & Modernizingthe System . . . . . . . . . . . . . . . 8-9
Reaching Out . . . . . . . . . . . . . . 10
Looking Ahead . . . . . . . . . . . . . 11
Auditor’s Letter . . . . . . . . . . . . 12
Financials . . . . . . . . . . . . . . . 13-28
Contents

Frank G. JacksonMayorCity of Cleveland
Dear Friends:
The City of Cleveland is committed
to improving the quality of life
of residents by delivering the
highest level of service to the
community. Maintaining public
health standards is essential to an
effective and viable future and can
only be accomplished through
hard work, communication, and
dedication between government,
businesses and neighborhoods.
The Division of Water Pollution
Control (WPC) and each of its
employees play a significant part
in protecting the health and
welfare of our citizens and are
committed to maintaining a free-
flow of sanitary and clear water by
eliminating potential blockages
and conditions that could result
From City CouncilCleveland City Council extends its appreciation to the staff of Water Pollution Control (WPC) for the continuous hard work and commitment.
WPC makes an important impact on the quality of Cleveland’s drinking water and provides and invaluable service to the citizens of the City of Cleveland. While the network of piping that WPC services is invisible to the eye, its
2
in loss of service, personal injury,
or property damage. In 2006,
WPC accomplished all of its
performance measures and in
many instances, exceeded the
projected figures. WPC employees
have made public health and
quality of life a first priority for the
citizens of Cleveland. Additionally,
through WPC’s continued efforts,
we will preserve and strengthen
Cleveland’s basic infrastructure,
improve service capabilities, and
protect our environment.
I am extremely appreciative
of Water Pollution Control’s
commitment to providing excellent
service and dedication to making
Cleveland a City of Choice. I look
forward to many more years of
continued success and
quality service.
upkeep and the ongoing level of investment required is essential to maintaining access to quality water, which is one of Cleveland’s greatest assets.
Cleveland City Council salutes Water Pollution Control on another successful year and looks forward to the Division maintaining the high level of service for the residents of the City of Cleveland.
Martin J. SweeneyPresidentCleveland City Council
Matt ZoneChairmanPublic Utilities CommitteeCleveland City Council
From the Mayor

Julius CiacciaDirectorDepartment of Public Utilities
The year 2006 marked a
significant change in operations
of the Division of Water Pollution
Control–the first ever extended
business hours from a five-day
work week to a seven-day work
week, and the initiation of two
work shifts. Business hours are
extended to 7:00 p.m. daily, and
expanded to include Saturdays
and Sundays. As a result, WPC
enhanced the service we provide
to both our residential and
commercial customers. Equally
important, we reduced expenses
by saving more than $100,000 in
overtime costs. This new extended
shift enables WPC to work more
effectively and efficiently, and
gives the citizens of Cleveland
easier access to our Customer
Service, Inspection and
Maintenance Units.
The addition of a new television
inspection unit with water jetting
capabilities has reduced travel
time and man-hours by combining
our resources (inspection and
jetting) which allow our inspection
and maintenance crews to be
more responsive to our citizens.
3
From the Director& the Commissioner
WPC continues to play an
important role in improving
the environment by providing
maintenance and repair services
for the City of Cleveland sewer
system. While providing a vital and
continuous service to the residents
and businesses within the City of
Cleveland, the Division of Water
Pollution Control is committed
to responsible fiscal management
and proper stewardship of its vital
utility infrastructure.
We are grateful to WPC employees,
both for their long and proud
tradition of providing excellent
service to our ratepayers, and their
willingness to give back. Working
together as a team, we are utilizing
advances in engineering and
technology, while understanding
that the residents and businesses
in the City of Cleveland depend
on an excellent workforce. It is our
pleasure to help contribute to an
enhanced quality of life through
the environmentally responsible
stewardship of the City’s sewer
system, which is an essential
foundation of a great city.Ollie ShawCommissionerDivision of Water Pollution Control

To provide for the free-flow of surface water by cleaning and maintaining a network of sewers and sewer connections.
Mission Statement
4
Cleveland citizens.
Serving approximately 138,000 residential and commercial customers, the WPC sewer collection system transfers sewage and storm water drainage from its point of origin to sewage processing facilities for treatment and disposal. WPC employees are the guardians of Cleveland’s sewer system. We are responsible for managing and maintaining the sewer and storm water collections systems.
the city’s collection systems are
remaining are separate sanitary
streets and roofs through a single pipe. Separate sanitary sewer systems only transport domestic, commercial and industrial wastewater. Storm water systems collect and carry untreated runoff from rainstorms and melting snow into nearby streams, lakes, rivers or other waterways.
The underground network is made up of 1,200 miles of sewer lines under the city’s streets that keep surface water moving freely. Laid end to end,
Our Underground Network
these pipes would reach from Cleveland to Dallas, Texas. The 127,000 catch basins collect rainwater as well as capture sediment, debris and other pollutants and help it pass to adjoining lateral pipes. Where required by topography (that is, a need to travel uphill), 18 pump stations lift the wastewater to higher ground to continue flowing to treatment plants.
Regular cleaning and maintenance of the massive system is vital to keeping the sewer system free of natural and man-made obstructions such as leaves, debris and litter, which can block catch basins and create flooding problems. WPC service crews perform daily maintenance to make sure the sanitary and storm water sewer systems operate efficiently.
From its origins as a rudimentary underground system in the 1800s to its current network of sewers, catch basins and pump stations, the Division of Water Pollution Control continues to play an important role in maintaining the health and well being of Cleveland citizens.
Approximately 90 percent of the city’s collection systems are combined sewers, while the remaining are separate sanitary sewer systems. Combined sewers are designed to carry both the wastewater from homes and businesses as well as storm water runoff from streets and roofs through a
Our Underground Network
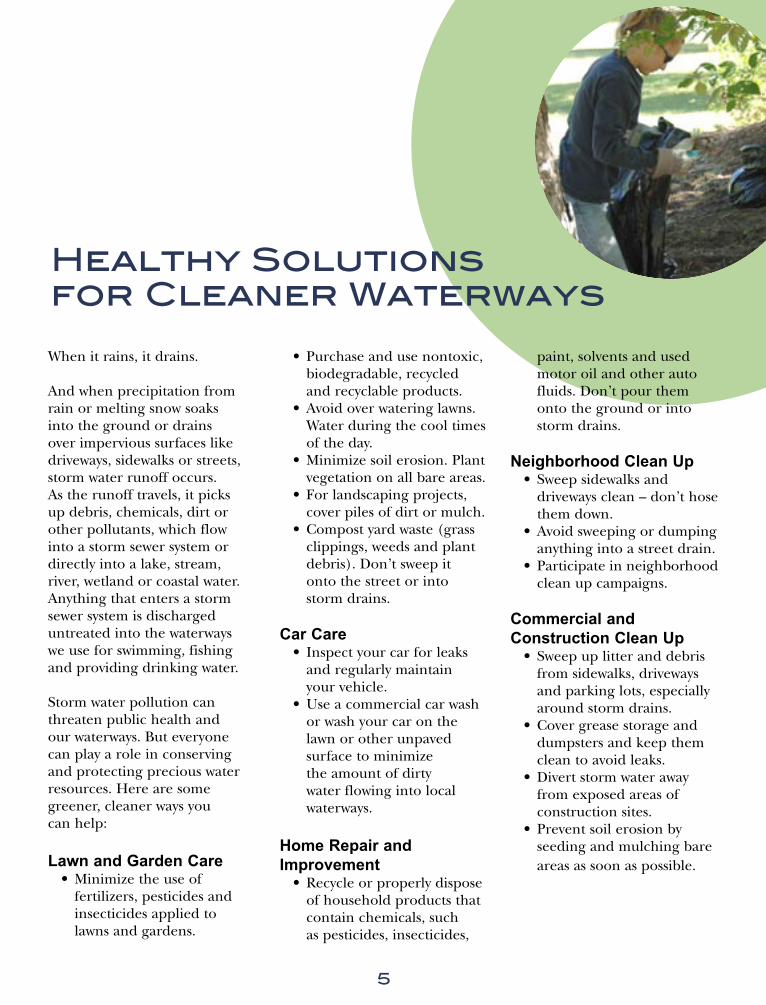
Healthy Solutions for Cleaner WaterwaysWhen it rains, it drains.
And when precipitation from rain or melting snow soaks into the ground or drains over impervious surfaces like driveways, sidewalks or streets, storm water runoff occurs. As the runoff travels, it picks up debris, chemicals, dirt or other pollutants, which flow into a storm sewer system or directly into a lake, stream, river, wetland or coastal water. Anything that enters a storm sewer system is discharged untreated into the waterways we use for swimming, fishing and providing drinking water.
Storm water pollution can threaten public health and our waterways. But everyone can play a role in conserving and protecting precious water resources. Here are some greener, cleaner ways you can help:
Lawn and Garden Care• Minimize the use of
fertilizers, pesticides and insecticides applied to lawns and gardens.
5
• Purchase and use nontoxic, biodegradable, recycled and recyclable products.
• Avoid over watering lawns. Water during the cool times of the day.
• Minimize soil erosion. Plant vegetation on all bare areas.
• For landscaping projects, cover piles of dirt or mulch.• Compost yard waste (grass
clippings, weeds and plant debris). Don’t sweep it onto the street or into storm drains.
Car Care
• Inspect your car for leaks and regularly maintain your vehicle.
• Use a commercial car wash or wash your car on the lawn or other unpaved surface to minimize the amount of dirty water flowing into local waterways.
Home Repair and Improvement
• Recycle or properly dispose of household products that contain chemicals, such as pesticides, insecticides,
paint, solvents and used motor oil and other auto fluids. Don’t pour them onto the ground or into storm drains.
Neighborhood Clean Up• Sweep sidewalks and
driveways clean – don’t hose them down.
• Avoid sweeping or dumping anything into a street drain.
• Participate in neighborhood clean up campaigns.
Commercial and Construction Clean Up
• Sweep up litter and debris from sidewalks, driveways and parking lots, especially around storm drains.
• Cover grease storage and dumpsters and keep them clean to avoid leaks.
• Divert storm water away from exposed areas of construction sites.
• Prevent soil erosion by seeding and mulching bare areas as soon as possible.

6
Longer Business Hours For the first time ever, WPC customers with sewer-related problems can call as early as 7 a.m. and as late as 7 p.m. 7 days per week to get an inspector to investigate the concern, and have a maintenance crew dispatched to the location for service. The new plan extends the regular work week from five days to seven days. Business hours are from 7 a.m. to 7 p.m. weekdays
and 9 a.m. to 7 p.m. on Saturdays and Sundays.
WPC began looking at best practices that would provide quality service to customers as well as reduce operational costs. After conducting an analysis of customer calling patterns, WPC discovered that a significant number of Customer Service calls occurred in the evening and on the weekends. In addition,
Extended Hours, New Equipment = Improved Customer Service
studies showed that the after-hours calls also resulted in considerable overtime costs for WPC. Extending the hours of operation helped accomplish both goals. Before the time extension, however, calls received before or after business hours went to workers “on call,” often delaying response time and incurring overtime expense for WPC. The new arrangement has enabled WPC to redeploy and

7
reschedule employees and reduce overtime costs by more than 40 percent, an annual savings of $105,264.
Call UsDuring regular business hours,
call WPC at (216) 664-2513Mondays – Fridays,
7 a.m. – 7 p.m.
Saturdays and Sundays, 9 a.m. – 7 p.m.
After 7 p.m., call (216) 664-2000
New Equipment Boosts Productivity With the purchase of a new television inspection unit with water jetting capabilities, customers can receive more efficient and effective service. WPC now has two dual-purpose units that help complete the cleaning and inspection of sewer connections. Having two units, which are assigned to different geographical areas, reduces travel time for service crews between jobs, saves on gas and provides overall greater efficiency.
In addition, hand-held power equipment was purchased for the crews. This equipment enables each crew to be issued their own equipment, which improved efficiency by minimizing delays.
Storeroom EfficiencyThe number of inventory items ordered in 2006 was reduced by 50 percent from the previous year, thanks to an historical review of inventory items and processing of larger orders of commonly used items. The result–a cost savings to WPC. Safety Awareness IncreasesWPC boosted employee safety training, resulting in fewer injuries on the job and lost time claims. In 2006, there were 51 on-the-job injuries and 18 lost time claims, compared to the previous year in which there were 70 injuries and 28 lost time claims.
2006 Collection System Maintenance Results Highest Ever
• Completed the cleaning of 17,499 catch basins• Completed the cleaning of 595,417 feet of sewers• Completed the TV inspection of 197,416 feet of pipe

Basement flooding, sewage odors, catch basin blockages and other problems signal trouble within the sewer and storm water collection systems. If it is a matter of aging or defective sewer mains or insufficient capacity, WPC Maintenance Unit and Engineering Unit work together to identify infrastructure problems,
Sustaining, Restoring & Modernizing the System
8
then prioritize and schedule for sustaining, restoring and modernizing the network. In 2006, WPC improved the reliability and efficiency of its wastewater system by investing $2,638,721 on the design, upgrade, rehabilitation and replacement of sewer mains and other infrastructure in 11 residential and commercial neighborhoods.

Sewer ReplacementWhen officials at Norfork Southern reported sewage puddles and odors by its railroad tracks near West 44th Street, WPC responded quickly to assess the emergency. But once engineers and maintenance crews carefully investigated, they discovered a more devastating problem–a deteriorating main sewer line caused by multiple collapses in the sewer. WPC engineers recommended replacing the existing sewer. The result–redesign, relocation of the sewer 25 feet north of the original piping, and replacement of 750 feet of sanitary sewer using ductile iron pipe to meet railroad standards. The $133,109 project took eight months to design and one month for construction.
Basement FloodingIn the residential neighborhood of West 130th street between Lorain Avenue and Triskett Road, complaints to WPC from homeowners about basement flooding were escalating. WPC crews used the division’s television inspection camera to detect structural deterioration of the existing sewer. In addition, the team conducted an analysis to determine the sewer’s design and capacity to manage the water flow. The restoration project consisted of replacing the 78-year-old sewer main (pipes and manholes) of existing 15 inch combined sewer with 2,400 feet of larger 15 inch, 21 inch, 24 inch and 30 inch separate sewers–a total investment of $652,743. Once construction was completed, the city’s Division of Streets stepped in to resurface West 130th Street from Lorain to Triskett–curb to curb.
Storm SewerOn the eastside, residents in Ward 1 near Kerruish Park were also calling about flooding in their basements. Historically, water from the existing separate sewer from Lee Road to East 177th Street flowed directly into a stream near the park. When sewer crews investigated, they discovered that the sanitary sewer originally built in 1928 was too close to the storm sewer. They found a way to increase the capacity of water flowing into the stream by replacing approximately 1,300 feet of the existing 8 inch sanitary sewer with a new 12 inch sanitary sewer on Throckley Avenue, between Lee Road and East 177th Street at a cost of $380,010.
9

Keeping the community informed about WPC services, how to reach us in an emergency, how to prevent sewer problems before they worsen, and what to do to help conserve our natural resources are high priorities. WPC participates in various activities and events to educate the community about conserving, protecting and managing our water resources.
In 2006, as part of its Storm Water Phase II Educational and Community Involvement commitment, WPC reached out to school children, families, churches, senior groups and City Council members at community festivals, safety and wellness events, Ward Clubs, career days, engineering conferences and at the Kirby Avenue headquarters. WPC conducted informational presentations, hosted tours, gave briefings and distributed a combined total of 92,000 fact sheets, brochures and other literature and promotional items.
WPC employees are not only dedicated to providing reliable and quality service to Cleveland’s citizens; they are equally committed to sharing their time and knowledge. Employees continue to tutor “adopted” students at Forest Hill Parkway Academy as part of WPC’s partnership with the Cleveland Municipal School District.
And to say, “thank you for all you do,” WPC recognized employees for outstanding on-the-job performance, safety consciousness, leadership, and community involvement at the division’s annual Employee Recognition Ceremony.
Just as important as conducting outreach and education is listening to what customers say about the service we provide. One way for customers to offer comments, feedback and suggestions is by completing the online (www.clevelandwpc.com/survey) Customer Satisfaction and Flood surveys following a service call. Survey input gives WPC a measure of how well we are doing.
10
Among a myriad of activities, WPC employees:
• Joined individuals from more than 20 municipal and community organizations for the 7th Annual Big Creek Chevy Branch Clean Up.
• Hosted more than 2,000 Cleveland school children at National Public Works & Safety Week.
• Spoke to students about careers at Oliver Hazard Perry Elementary School and Forest Hill Parkway Academy.
• Participated in environmental education outreach activities at EarthFest.
• Demonstrated preventive maintenance practices using WPC’s television inspection truck during the Annual Tops Kids Fest.
• Staffed an informational booth at the City of Cleveland’s National Night Out Against Crime celebration.
WPC employees are not Among a myriad of activities,
ReachingOut

11
LAPTOPS IMPLEMENTATIONPart of the new Ellipse Work Management System (WMS) upgrade is the setup and configuration of laptops to be used by inspectors in the field. These laptops will have the capability to connect to the Ellipse web view version wirelessly.
The Ellipse web view version provides the user with complete functionality without the software being installed on their laptops. Query and filter options can be sorted by crew, individual, priority, work order number, description, schedule dates, location/area, etc.
GEOGRAPHICAL INFORMATION SYSTEM (GIS)Geographical Information System (GIS) is a system for capturing, storing, analyzing and managing data and associated attributes which are spatially referenced to a Datum line. It is a computer system
capable of integrating, storing, editing, analyzing, sharing and displaying geographically-referenced information. GIS is a tool that allows users to create interactive queries (user created searches), analyze the spatial information, edit data, maps and present the results of all these operations on a map using Geo-coding.
GIS technology can be used for scientific investigations, resource management, asset management, environmental impact assessment, urban planning, cartography, criminology, history, sales, marketing and logistics. For example, GIS might be used to find wetlands that need protection from pollution. Also, in the engineering section, GIS will be used to plan and design new projects, to identify locations that need preventive maintenance and to identify problems throughout the system that need to be addressed.
WORK MANAGEMENT SYSTEM (ELLIPSE) UPGRADESThe following are components of the work management system upgrades that can be utilized to make us more efficient.
I. Work Planner allows us to be proactive in terms of scheduling preventive maintenance and other jobs.
II. LinkOne Software allows us to order pump station parts, e.g. valves, motors, shafts, etc. much more efficiently.
III. Document Management gives us the ability to attach photos, scanned work orders and Word documents that relate to a specific work order.
IV. The new version of the work management system includes a vehicle preventive maintenance module that will allow us to schedule preventive maintenance tasks such as: oil changes, air filter replacements and tire rotations.
LookingAhead

To the Honorable Frank G. Jackson, Mayor, Members of Council, and the Audit Committee:
We have audited the accompanying basic financial statements of the Division of Water Pollution Control, Department of Public Utilities, City of Cleveland, Cuyahoga County, Ohio, (the Division) as of and for the years ended December 31, 2006 and December 31, 2005, as listed in the table of contents. These financial statements are the responsibility of the Division’s management. Our responsibility is to express opinions on these financial statements based on our audits.
We conducted our audits in accordance with auditing standards generally accepted in the United States of America Those standards require that we plan and perform the audits to reasonably assure whether the financial statements are free of material misstatement. An audit includes examining, on a test basis, evidence supporting the amounts and disclosures in the financial statements. An audit also includes assessing the accounting principles used and significant estimates made by management, as well as evaluating the overall financial statement presentation. We believe that our audits provide a reasonable basis for our opinions.
As described in Note A, the financial statements present only the Division, and do not purport to, and do not, present fairly the financial position of the City of Cleveland as of December 31, 2006 and December 31, 2005, and the respective changes in its financial position and cash flows for the years then ended in conformity with accounting principles generally accepted in the United States of America.
In our opinion, the financial statements referred to above present fairly, in all material respects, the financial position of the Division of Water Pollution Control, Department of Public Utilities, City of Cleveland, Cuyahoga County, Ohio, as of December 31, 2006 and December 31, 2005, and the respective changes in financial position and its cash flows for the years then ended in conformity with accounting principles generally accepted in the United States of America.
Management’s Discussion and Analysis is not a required part of the basic financial statements but is supplementary information the accounting principles generally accepted in the United States of America requires. We have applied certain limited procedures, which consisted principally of inquiries of management regarding the methods of measurement and presentation of the required supplementary information. However, we did not audit the information and express no opinion on it.
Mary Taylor, CPAAuditor of State
June 29, 2007
IndependentAccountant’s
Report
ADDITIONAL INFORMATION
This financial report is designed to provide a general overview of the Division’s finances. Questions concerning any of the information provided in this report or requests for additional information should be addressed to the Office of the Finance Director, City Hall, Room 104, 601 Lakeside Avenue, Cleveland, Ohio 44114.
Lausche Building615 Superior Ave., NW / Twelfth Floor Cleveland, OH 44113-1801
Telephone: (216) 787-3665 (800) 626-2297
Fax: (216) 787-3361www.auditor.state.oh.us
12
Financial Summary
Auditor of StateMary Taylor, CPA

13
Management’s Discussion and Analysis
GENERALAs management of the City of Cleveland’s (the “City”) Department of Public Utilities, Division of Water Pollution Control (the “Division”), we offer readers of the Division’s financial statements this narrative overview and analysis of the financial activities of the Division for the years ended December 31, 2006 and 2005. Please read this information in conjunction with the Division’s basic financial statements and footnotes that begin on page 21.
The Division was created for the purpose of supplying sewer services to customers within the Cleveland metropolitan area. Embarking with a rudimentary system in the late 1800’s, the Cleveland sewer systemdeveloped as the City itself expanded. Until the early 1970’s, the City operated the entire system and managed all aspects of sewage treatment and disposal.
In 1972, a court order created the Northeast Ohio Regional Sewer District (NEORSD) and transferred the operation of all wastewater treatment plants and interceptors to the district during December 1973.
The City retained responsibility for the sewer collector system in Cleveland. The Division serves a significant portion of the entire metropolitan area by managing the sanitary sewage and storm water drainage collection system. The sewer collection
system transfers sanitary and storm sewage from its point of origin to an interceptor sewer or treatment plant for processing. The system is comprised of 1,200 miles of sewer lines with attendant catch basins and includes 18 pump/lift stations. The Division is also responsible for thecleaning of 127,000 catch basins and for maintaining two storm detention basins.
The Division currently has 129,592 customer accounts in the City of Cleveland of which 96% are residential and 4% commercial. Also, in 2006, the Division’s sewers transported 2,439,491 mcf’s (thousand cubic feet) of water.
The Division’s Capital Improvement program is supported by a “pay as you go” system funded by its operating revenue and loans. Since the Division has a low debt burden, its capital improvements are funded from cash reserves and loans, therefore the Division could still maintain an unencumbered cash balance allowing the current debts to be repaid. Maintaining this same approach helps the Division stabilize rate increase requirements and control rates charged to its customers.
OVERVIEW OF THE FINANCIAL STATEMENTSThis discussion and analysis is intended to serve as an introduction to the Division’s basic financial statements.
The accompanying financial statements present financial information for the City’s Division of Water Pollution Control Fund, in which the City accounts for the operations of the Department of Public Utilities Division of Water Pollution Control. A fund is a grouping of related accounts that is used tomaintain control over resources that have been segregated for specific activities or objectives. The City, like other state and local governments, uses fund accounting to ensure and demonstrate compliance with finance related legal requirements.
The Division of Water Pollution Control Fund is considered an enterprise fund because the operations of the Division are similar to a private sector business enterprise. Accordingly, in accounting for the activities of the Division, the economic resources measurement focus and the accrual basis of accounting is used. This issimilar to businesses in the private sector.
The basic financial statements of the Division can be found on pages 21-29 of this report.
The notes to the financial statements provide additional information that is essential to a full understanding ofthe data provided in the basic financial statements. The notes to the basic financial statements can be found on pages 21-28 of this report.
FINANCIAL HIGHLIGHTS• The assets of the Division exceeded its
liabilities (net assets) by $84,856,000, $84,746,000 and $85,600,000 at December 31, 2006, 2005 and 2004, respectively. Of these amounts, $21,759,000, $22,450,000 and $26,666,000 (unrestricted net assets) at December 31, 2006, 2005 and 2004, respectively , may be used to meet the Division’s ongoing obligations to customers and creditors.
• In 2006, operations expenses increased by $137,000 and maintenance
expenses decreased by $1,046,000. Operating revenues decreased by $444,000. Consequently, the Division had an operating loss of $1,209,000. Nevertheless, the investment income increased by $747,000.
• Regular sewage rates increased from $7.89 per thousand cubic feet in 2004 to $8.28 per thousand cubic feet in 2005. Also, homestead sewage rates increased from $4.71 in 2004 to $4.91 in 2005. During 2006, there were no changes.
• During 2006 and 2005, the Division’s net capital assets increased by $400,000 and $2,743,000, respectively. The major additions during 2006 and 2005 were for sewer line replacements and purchases of furniture, fixtures, equipment and vehicles, offset by depreciation expense.
• The Division’s total debt decreased in 2006 and 2005 by 7.31% and 6.63%, respectively, due to the continued scheduled debt payments made during the year.
COMPARISON OF CURRENT YEAR’S AND PRIOR YEARS’ DATA
C I T Y O F C L E V E L A N D , O H I O D E PA RT M E N T O F P U B L I C U T I L I T I E S D I V I S I O N O F WAT E R P O L L U T I O N C O N T R O L

(in thousands) Balance Balance Jan. 1, 2005 Additions Reductions Dec. 31, 2005
Land $ 297 $ $ $ 297 Utility plant 111,112 6,436 117,548Buildings, structures and improvements 2,567 91 2,658Furniture, fixture, equipment & vehicles 8,177 2,710 (72) 10,815Construction in progress 3,995 7,266 (9,232) 2,029 Total 126,148 16,503 (9,304) 133,347Less: Accumulated depreciation (61,099) (4,525) 69 (65,555)Capital assets, net $ 65,049 $ 11,978 $ (9,235) $ 67,792
(in thousands) Balance Balance Jan. 1, 2006 Additions Reductions Dec. 31, 2006
Land $ 297 $ $ $ 297 Utility plant 117,548 2,187 119,735Buildings, structures and improvements 2,658 2,658Furniture, fixture, equipment and vehicles 10,815 443 (404) 10,854Construction in progress 2,029 5,131 (2,545) 4,615 Total 133,347 7,761 (2,949) 138,159Less: Accumulated depreciation (65,555) (4,815) 403 (69,967)Capital assets, net $ $67,792 $ 2,946 $ (2,546) $ 68,192
Current Assets: There was a $1,738,000 increase in current assets due to the increase in net accounts receivable of $5,806,000, a decrease in cash and cash equivalents and investments of $4,188,000 which was offset by a decrease in due from other City Divisions of $14,000 mainly attributed to the $199,000 payment received from the Division of Water in 2006. In 2005, there was a $4,462,000 increase in current assets due to the increase in net accounts receivable of $5,717,000 related to the 2005 rate increase, an increase in cash and cash equivalents and investments of $1,772,000 which was offset by a decrease in Due from other City Divisions of $2,701,000 mainly attributed to the $1,964,000 payment received from the Division of Water. In 2004, there was a $2,876,000 increase in current assets due to the increase in customer net accounts receivable of $4,289,000 related to the 2004 rate increase, an increase in Due from other City divisions of $600,000 attributed to the Division of Water and a decrease in cash and investments of $2,432,000 which was used for the division operations.
Capital Assets: The Division’s investment in capital assets as of December 31, 2006 amounted to $68,192,000 (net of accumulated depreciation). The total increase in the Division’s investment in net capital assets for the current year was .59%, primarily due to utility plant sewer main renovations and purchases of furniture, fixtures,
During the year, utility plant sewer line capital additions were $2,187,000. Major capital projects/expenses forthe year included:
• West 122nd St. Sewer Replacement
• East 94th St. Sewer Replacement
• West 123rd St. Sewer Replacement
• West 130th St. Sewer Replacement
• West 162nd St. Sewer Replacement
• Purchase of Vehicles
During 2005, utility plant sewer line capital additions were $6,436,000. Major capital projects/expensesincluded:
• Euclid Corridor Project
• Rockwell Avenue Sewer & Water Main
• Broadview Road Sewer System
• Various Emergency Sewer Repairs
• West 122nd St. Sewer Replacement
• East 94th St. Sewer Replacement
• Purchase of Vehicles
Additional information on the Division’s capital assets, including commitments made for future capital expenditures, can be found in Notes A and D.
CONDENSED BALANCE SHEET INFORMATIONProvided below is the condensed balance sheet information for the Division as of December 31, 2006, 2005 and 2004: (in thousands) 2006 2005 2004Assets: Capital assets, net $ 68,192 $ 67,792 $ 65,049 Restricted assets 413 367 542 Current assets 84,839 83,101 78,639 Total assets 153,444 151,260 144,230Net Assets and Liabilities:Net Assets: Invested in capital assets, net of related debt 63,097 62,296 58,934 Unrestricted 21,759 22,450 26,666 Total net assets 84,856 84,746 85,600Liabilities: Long-term obligations 4,880 5,321 5,723 Current liabilities 63,708 61,193 52,907 Total liabilities 68,588 66,514 58,630
Total net assets and liabilities $ 153,444 $ 151,260 $ 144,230
equipment and vehicles. During 2005 and 2004, the Division’s investment in capital assets amounted to $67,792,000 and $65,049,000, respectively. The total increases were 4.22% in 2005 and 1.7% in 2004. A summary of the activity in the Division’s capital assets during the years ended December 31, 2006 and 2005 is as follows:
Management’s Discussion and Analysis (cont.)
14
C I T Y O F C L E V E L A N D , O H I O D E PA RT M E N T O F P U B L I C U T I L I T I E S D I V I S I O N O F WAT E R P O L L U T I O N C O N T R O L

Management’s Discussion and Analysis (cont.)
Current Liabilities: Total current liabilities increased by $2,515,000. The major components were an increase of $3,993,000 in amounts due for billings on behalf of others which was partially offset by a decrease of $1,988,000 in Due to other City departments. During 2005, total current liabilities increased by $8,286,000. The major components of the increase were an increase of $5,520,000 in amounts due for billings on behalf of others resulting from the 2005 sewage rate increase, an increase of $2,051,000 in Due to other City departments mainly as a result of $1,500,000 owed to the Division of Water for payments made on behalf of the Division in relation to the Euclid Corridor Project and $178,000 due to Utilities Administration and the Division of Utilities Fiscal Control.
Long-Term Debt: At the end of the current year, the Division had total debt outstanding of $5,094,000 associated with five OWDA construction loans and two OPWC construction loans. These loans are payable by revenues generated by the Division. At the end of the 2005 and 2004, the Division had total debt outstanding of $5,496,000 and $5,886,000, respectively, associated with these loans. These loans are payable by revenues generated by the Division.
Additional information on the Division’s long-term debt can be found in Note B on pages 23-24.
Net Assets: Net assets serve as a useful indicator of a government’s financial position. In the case of the Division, assets exceeded liabilities by $84,856,000, $84,746,000 and $85,600,000 at December 31, 2006, 2005 and 2004, respectively.
By far, the largest portion of the Division’s net assets, $63,097,000 or 74% and $62,296,000 or 74%, at December 31, 2006 and 2005, respectively, reflects its investment in capital assets (e.g., land, buildings, utility plant, machinery and equipment), net of accumulated depreciation, less any related, still-outstanding debt used to acquire those assets. The Division uses these capital
(in thousands) Balance Debt Debt Debt Balance Jan. 1, 2006 Issued Refunded Retired Dec. 31, 2006 Ohio Water DevelopmentAuthority Loans (OWDA) $ 5,112 $ $ $ (377) $ 4,735
Ohio Public WorksCommission Loans (OPWC) 384 (25) 359
Total $ 5,496 $ $ $ (402) $ 5,094
The activity in the Division’s debt obligations outstanding during the year ended December 31, 2006 is summarized below:
The activity in the Division’s debt obligations outstanding during the year ended December 31, 2005 is summarized below:
(in thousands) Balance Debt Debt Debt Balance Jan. 1, 2005 Issued Refunded Retired Dec. 31, 2005 Ohio Water DevelopmentAuthority Loans (OWDA) $ 5,474 $ $ $ (362) $ 5,112
Ohio Public WorksCommission Loans (OPWC) 412 (28) 384
Total $ 5,886 $ $ $ (390) $ 5,496
15
C I T Y O F C L E V E L A N D , O H I O D E PA RT M E N T O F P U B L I C U T I L I T I E S D I V I S I O N O F WAT E R P O L L U T I O N C O N T R O L
assets to provide services to its customers. Consequently, these assets are not available for future spending. Although the Division’s investment in capital assets is reported net of related debt, it should be noted that the resources needed to repay this debt must be provided from other sources since the capital assets themselves cannot be used to liquidate these liabilities.
The remaining balance of net assets, $21,759,000 or 26% and $22,450,000 or 26% at December 31, 2006 and 2005, respectively, are unrestricted and may be used to meet the Division’s ongoing obligations to customers and creditors.

Management’s Discussion and Analysis (cont.)
Operating revenues:Total operating revenues amounted to $19,614,000. $19,160,000 (98%) was from the sale of sewer services tocustomers and $454,000 (2%) was from miscellaneous services and sales. In 2005, total operating revenues, which increased by $156,000, amounted to $20,058,000 of which $19,723,000 (98%) were from the sale of sewer services to customers. The Division also had $335,000 from miscellaneous services and sales.
Operating expenses:In 2006, total operating expenses decreased by $619,000 (2.9%). This decrease was mainly due to a reductionin maintenance costs. In 2005, the total operating expenses increased by $1,111,000 (5.5%). This increase wasprimarily due to increases of $435,000 in operations costs and $630,000 in maintenance costs.
Non-operating revenues and expenses:In 2006, investment income increased by $747,000 (99.60%). In 2005, investment income increased by $378,000 (102%). The increases in both years were primarily due to higher interest rates.
CONDENSED STATEMENT OF REVENUES, EXPENSES ANDCHANGES IN NET ASSETS INFORMATIONThe Division’s operations during 2006 increased its net assets by $110,000 and during 2005 decreased its net assets by $854,000, respectively. Provided below are the key elements of the Division’s results of operations as of and for the years ended December 31, 2006, 2005 and 2004:
(in thousands) 2006 2005 2004
Operating revenues $ 19,614 $ 20,058 $ 19,902
Operating expenses 20,823 21,442 20,331
Operating income (1,209) (1,384) (429)
Non-operating revenue (expense):
Investment income 1,497 750 372
Interest expense (206) (221) (235)
Other 28 1 2
Total non-operating revenue (expense), net 1,319 530 139
Increase (Decrease) in net assets 110 (854) (290)
Net assets, beginning of year 84,746 85,600 85,890
Net assets, end of year $ 84,856 $ 84,746 $ 85,600
16
C I T Y O F C L E V E L A N D , O H I O D E PA RT M E N T O F P U B L I C U T I L I T I E S D I V I S I O N O F WAT E R P O L L U T I O N C O N T R O L

17
Management’s Discussion and Analysis (cont.)
FACTORS EXPECTED TO IMPACT THE DIVISION’S FUTUREFINANCIAL POSITION OR RESULTS OF OPERATIONSSewage rate increases will continue to have a positive impact on the fi nancial position of the Division:
PER MCF (Thousand cubic feet)
EFFECTIVE REGULAR HOMESTEAD
January 1, 2006 $ 8.28 $4.91
January 1, 2007 $10.28 $6.10
January 1, 2008 $11.53 $6.84
In June 2006, legislation was passed for the above sewer rates increases that will enable the Division to continue to maintain and provide superior sewer services to its customers.
The installation of a Supervisory Control and Data Acquisition (SCADA) system has greatly enhanced pump station maintenance from a central location at the Kirby Road Main Facility. The system has assisted in discovering problems in a timely manner and has reduced the manpower needed to check lift stations.
Monitoring sewer lines electronically from a central location has enabled the Division to utilize its limited manpower effi ciently. The system is vital in the Division’s desire to minimize the potential for any futureenvironmental hazards.
C I T Y O F C L E V E L A N D , O H I O D E PA RT M E N T O F P U B L I C U T I L I T I E S D I V I S I O N O F WAT E R P O L L U T I O N C O N T R O L
ADDITIONAL INFORMATIONThis fi nancial report is designed to provide a general overview of the Division’s fi nances. Questionsconcerning any of the information provided in this report or requests for additional information should beaddressed to the Offi ce of the Finance Director, City Hall, Room 104, 601 Lakeside Avenue, Cleveland, Ohio 44114.
ADDITIONAL INFORMATIONThis fi nancial report is designed to provide a general overview of the Division’s fi nances. Questionsconcerning any of the information provided in this report or requests for additional information should beaddressed to the Offi ce of the Finance Director, City Hall, Room 104, 601 Lakeside Avenue, Cleveland, Ohio 44114.

Balance Sheets
18
For the Years Ended December 31, 2006 and 2005 (in thousands) 2006 2005ASSETSCAPITAL ASSETS Land $ 297 $ 297 Utility plant 119,735 117,548 Buildings, structures and improvements 2,658 2,658 Furniture, fixtures, equipment and vehicles 10,854 10,815 133,544 131,318 Less: Accumulated depreciation (69,967) (65,555) 63,577 65,763 Construction in progress 4,615 2,029
CAPITAL ASSETS, NET 68,192 67,792
RESTRICTED ASSETS Cash and cash equivalents 413 367
CURRENT ASSETS Cash and cash equivalents 16,618 13,516 Investments 11,936 19,226 Receivables: Accounts receivable - net of allowance for doubtful accounts of $627,000 in 2006 & $642,000 in 2005 53,182 47,376 Unbilled revenue 2,151 1,986 Due from other City of Cleveland departments, divisions or funds 588 602 Accrued interest receivable 97 120 Materials and supplies - at average cost 267 275
TOTAL CURRENT ASSETS 84,839 83,101
TOTAL ASSETS $ 153,444 $ 151,260
NET ASSETS AND LIABILITIESNET ASSETS Invested in capital assets, net of related debt $ 63,097 $ 62,296 Unrestricted 21,759 22,450
TOTAL NET ASSETS 84,856 84,746
LIABILITIESLONG-TERM OBLIGATIONS - excluding amounts due within one year: OWDA loans 4,343 4,735 OPWC loans 335 360 Accrued wages and benefits 202 226
TOTAL LONG-TERM OBLIGATIONS 4,880 5,321
CURRENT LIABILITIES Current portion of long-term debt, due within one year 416 402 Accounts payable 435 186 Construction payable 1,359 995 Amounts due for billing on behalf of others 56,947 52,954 Due to other City of Cleveland departments, divisions or funds 3,092 5,080 Current portion of accrued wages and benefits 1,394 1,511 Other accrued expenses 65 65
TOTAL CURRENT LIABILITIES 63,708 61,193
TOTAL LIABILITIES 68,588 66,514
TOTAL NET ASSETS AND LIABILITIES $ 153,444 $ 151,260 See notes to financial statements.
C I T Y O F C L E V E L A N D , O H I O D E PA RT M E N T O F P U B L I C U T I L I T I E S D I V I S I O N O F WAT E R P O L L U T I O N C O N T R O L

19
Statements of Revenues, Expenses and Changes in Net AssetsFor the Years Ended December 31, 2006 and 2005 (in thousands) 2006 2005OPERATING REVENUESCharges for services $ 19,614 $ 20,058
TOTAL OPERATING REVENUES 19,614 20,058
OPERATING EXPENSESOperations 8,201 8,064Maintenance 7,807 8,853Depreciation 4,815 4,525
TOTAL OPERATING EXPENSES 20,823 21,442
OPERATING INCOME (LOSS) (1,209) (1,384)
NON-OPERATING REVENUE (EXPENSE)Investment income 1,497 750Interest expense (206) (221)Other 28 1
TOTAL NON-OPERATING REVENUE (EXPENSE), NET 1,319 530
INCREASE (DECREASE) IN NET ASSETS 110 (854)
NET ASSETS, BEGINNING OF YEAR 84,746 85,600
NET ASSETS, END OF YEAR $ 84,856 $ 84,746 See notes to financial statements.
C I T Y O F C L E V E L A N D , O H I O D E PA RT M E N T O F P U B L I C U T I L I T I E S D I V I S I O N O F WAT E R P O L L U T I O N C O N T R O L

Statement of Cash Flows
20
For the Years Ended December 31, 2006 and 2005 (in thousands) 2006 2005CASH FLOWS FROM OPERATING ACTIVITIESCash received from customers $ 18,889 $ 19,355Cash payments to suppliers for goods or services (6,822) (6,492)Cash payments to employees for services (9,114) (8,630)Agency activity on behalf of other sewer authorities (1,713) 2,692 NET CASH PROVIDED BY OPERATING ACTIVITIES 1,240 6,925
CASH FLOWS FROM NONCAPITAL FINANCING ACTIVITIESWorkers compensation refund 2 1 NET CASH PROVIDED BY NONCAPITAL FINANCING ACTIVITIES 2 1
CASH FLOWS FROM CAPITAL AND RELATEDFINANCING ACTIVITIESAcquisition and construction of capital assets (6,297) (5,466)Principal paid on long-term debt (401) (390)Interest paid on long-term debt (206) (221) NET CASH USED FOR CAPITAL AND RELATED FINANCING ACTIVITIES (6,904) (6,077)
CASH FLOWS FROM INVESTING ACTIVITIESPurchase of investment securities (405) (260)Proceeds from sale and maturity of investment securities 7,695 405Interest received on investments 1,520 748 NET CASH PROVIDED BY (USED FOR) INVESTING ACTIVITIES 8,810 893
NET INCREASE (DECREASE) IN CASH AND CASH EQUIVALENTS 3,148 1,742
CASH AND CASH EQUIVALENTS, beginning of year 13,883 12,141 CASH AND CASH EQUIVALENTS, end of year 17,031 13,883
RECONCILIATION OF OPERATING INCOME TO NET CASH PROVIDED BY OPERATING ACTIVITIES
OPERATING INCOME (LOSS) $ (1,209) $ (1,384)Adjustments to reconcile operating incometo net cash provided by operating activities: Depreciation 4,815 4,525Changes in assets and liabilities: Accounts receivable, net (5,806) (5,717) Accrued and unbilled revenue (165) 242 Due from other City of Cleveland departments, divisions or funds 14 2,701 Materials and supplies, net 8 86 Accounts payable 248 42 Amounts due for billings on behalf of others 3,993 5,520 Due to other City of Cleveland departments, divisions or funds (518) 581 Accrued wages and benefits (140) 329
TOTAL ADJUSTMENTS 2,449 8,309
NET CASH PROVIDED BY OPERATING ACTIVITIES $ 1,240 $ 6,925
C I T Y O F C L E V E L A N D , O H I O D E PA RT M E N T O F P U B L I C U T I L I T I E S D I V I S I O N O F WAT E R P O L L U T I O N C O N T R O L
See notes to financial statements.

21
Notes to Financial Statements
NOTE A - SUMMARY OF SIGNIFICANT ACCOUNTING POLICIES
The Division of Water Pollution Control (the “Division”) is reported as an enterprise fund of the City of Cleveland’s Department of Public Utilities and is a part of the City of Cleveland’s (the “City’s”) primary government. The Division was created for the purpose of supplying sewer services to customers within the metropolitan area. The following is a summary of the more significant accounting policies.
Reporting Model and Basis of Accounting: The accounting policies and financial reporting practices of the Division comply with accounting principles generally accepted in the United States of America applicable to governmental units. In November 2003, the GASB issued Statement No. 42, Accounting and Financial Reporting for Impairment of Capital Assets and for Insurance Recoveries, which is effective for the yearended December 31, 2005. The Division has determined that GASB Statement No. 42 has no impact on its financial statements as of December 31, 2005. In May 2004, the GASB issued Statement No. 44, Economic Condition Reporting: The Statistical Section, which is effective for the year ended December 31, 2006. The Division has determined that GASB Statement No. 44 has no impact on its financial statements as of December 31, 2006. In June 2005, the GASB issued Statement No. 47, Accounting for Termination Benefits, which is effective for the year ended December 31, 2006. The Division has determined that GASB Statement No. 47 has no impact on its financial statements as of December 31, 2006.
The Division’s net assets are accounted for in the accompanying balance sheets and the net assets are divided into the following categories:
• Amount invested in capital assets, net of related debt.• Remaining unrestricted amount.
In addition, certain additional financial information regarding the Division is included in these footnotes. Theimplementation of the new GASB statements did not result in a change in the Division’s beginning net asset/equity balance as previously reported.
Basis of Accounting: The Division’s financial statements are prepared under the accrual basis of accounting. Under this method, revenues are recognized when earned and measurable and expenses are recognized as incurred. Under GASB Statement No. 20, Accounting and Financial Reporting for Proprietary Activities, all Proprietary Funds will continue to follow Financial Accounting Standards Board (FASB) standards issued on or before November 30, 1989. However, from that date forward, Proprietary Funds will have the option of either 1) choosing not to apply future FASB standards (including amendments of earlier pronouncements), or 2) continuing to follow new FASB pronouncements (unless they conflict with GASB pronouncements). The City has chosen not to apply future FASB standards.
Revenues: Revenues are derived primarily from sales of sewer services to residential, commercial and industrial customers based upon actual water consumption. Sewer rates are authorized by City Council and billings are made on a cyclical basis. Estimates for services between the end of the various cycles and the end of the year are recorded as unbilled revenue.
Accounts Receivables: The Division’s share of the accounts receivable balance is $5,103,000 and $4,967,000, net of allowance for doubtful accounts of $627,000 and $642,000, for 2006 and 2005, respectively. The remaining accounts receivable balances of $48,079,000 and $42,409,000 for 2006 and 2005, respectively, belong to the North East Ohio Regional Sewer District and other municipalities in the GreaterCleveland Region and are offset by the corresponding amounts due for billings on behalf of others.
For the Years Ended December 31, 2006 and 2005
C I T Y O F C L E V E L A N D , O H I O D E PA RT M E N T O F P U B L I C U T I L I T I E S D I V I S I O N O F WAT E R P O L L U T I O N C O N T R O L

NOTE A - SUMMARY OF SIGNIFICANT ACCOUNTING POLICIES(continued)
Statement of Cash Flows: The Division utilizes the direct method of reporting for the statement of cash flows as defined by the Governmental Accounting Standards Board (GASB) Statement No. 9, Reporting Cash Flows of Proprietary and Non-Expendable Trust Funds and Governmental Entities That Use Proprietary Fund Accounting. In a statement of cash flows, cash receipts and cash payments are classified according to operating, non-capital financing, capital and related financing, and investment activities.
Cash and Cash Equivalents: Cash and cash equivalents represent cash on hand and cash deposits maintained by the City Treasurer on behalf of the Division. Cash equivalents are defined as highly liquid investments with maturity of three months or less when purchased and include certificates of deposit, U.S. Treasury bills, State Treasury Asset Reserve of Ohio (STAROhio) and repurchase agreements. The City’s policy is to enter into repurchase agreements with local commercial banks and to obtain confirmation of securities pledged.
Investments: The Division follows the provisions of GASB Statement No. 31, Accounting and Financial Reporting for Certain Investments and External Investment Pools, which requires governmental entities to report certain investments at fair value in the balance sheet and recognize the corresponding change in the fair value of investments in the year in which the change occurred. The fair value is based on quoted market rates.
The City has invested funds in STAROhio during year 2006 and 2005. STAROhio is an investment pool managed by the State Treasurer’s Office, which allows governments within the State to pool their funds for investment purposes. STAROhio is not registered with the SEC as an investment company, but does operate in a manner consistent with Rule 2a7 of the Investment Company Act of 1940. Investments in STAROhio arevalued at STAROhio’s share price, which is the price the investment could be sold for on December 31, 2006 and 2005.
Capital Assets and Depreciation: Capital assets are stated on the basis of historical cost or, if contributed, at fair market value as of the date received. Depreciation is computed by allocating the cost of capital assets over the estimated useful lives of the assets using the straight-line method. A capital asset is defined as a tangible item with a useful life in excess of one year and an individual cost of more than $5,000 for furniture, fixtures, equipment and vehicles and $10,000 for all other assets. When capital assets are disposed of, thecost and related accumulated depreciation are removed from the accounts with gains or losses on disposition being reflected in operations. The estimated useful lives are as follows: Utility plant 10 to 75 years
Building, structures and improvements 20 to 60 years
Furniture, fixtures, equipment and vehicles 5 to 15 years
22
Notes to Financial Statements
Compensated Absences: The Division accrues for compensated absences such as vacation, sick leave and compensatory time using the termination payment method specified under GASB Statement No. 16, Accounting for Compensated Absences. These amounts are recorded as accrued wages and benefits in theaccompanying balance sheets. The portion of the compensated absence liability that is not expected to be paid or utilized within one year is reported as a long-term liability.
Normally, all vacation time is to be taken in the year available. The Division allows employees to carryover up to 80 hours of vacation from one year to the next with proper approval. Sick days not taken may be accumulated until retirement. An employee is paid one-third of accumulated sick leave upon retirement, calculated at the three-year average base salary rate, with the balance being forfeited.
C I T Y O F C L E V E L A N D , O H I O D E PA RT M E N T O F P U B L I C U T I L I T I E S D I V I S I O N O F WAT E R P O L L U T I O N C O N T R O L
For the Years Ended December 31, 2006 and 2005

23
Notes to Financial Statements
Long-term debt outstanding at December 31, 2006 and 2005 is as follows:
(in thousands) Interest Original Rate Issuance 2006 2005
Ohio Water Development Authority (OWDA) loans payable annually through 2017 4.04% - 4.18% $ 7,897 $ 4,735 $ 5,112
Ohio Public Works Commission (OPWC) loans payable annually through 2022 0% 481 359 384 $ 8 ,378 5,094 5,496
Less:Current portion (416) (402)
Total Long-Term Debt $ 4,678 $ 5,094
C I T Y O F C L E V E L A N D , O H I O D E PA RT M E N T O F P U B L I C U T I L I T I E S D I V I S I O N O F WAT E R P O L L U T I O N C O N T R O L
Summary: Changes in long-term obligations for the year ended December 31, 2006 are as follows:
(in thousands) Balance Balance Due Within Jan. 1, 2006 Increase Decrease Dec. 31, 2006 One Year Ohio Water Development Authority (OWDA)loans payable annually through 2017 $ 5,112 $ $ ( 377) $ 4,735 $ 392
Ohio Public Works Commission Loanspayable annually through 2022 384 (25) 359 24
Total loans 5,496 ( 402) 5,094 416
Accrued wages and benefits 1,737 (141) 1,596 1,394
Total $ 7,233 $ $ ( 543) $ 6,690 $ 1,810
Summary: Changes in long-term obligations for the year ended December 31, 2005 are as follows:
(in thousands) Balance Balance Due Within Jan. 1, 2005 Increase Decrease Dec. 31, 2005 One Year Ohio Water Development Authority (OWDA)loans payable annually through 2017 $ 5,474 $ $ ( 362) $ 5,112 $ 377
Ohio Public Works Commission Loanspayable annually through 2022 412 (28) 384 25
Total loans 5,886 (390) 5,496 402
Accrued wages and benefits 1,408 329 1,737 1,511
Total $ 7,294 $ 329 $ ( 390) $ 7,233 $ 1,913
For the Years Ended December 31, 2006 and 2005
NOTE B - LONG-TERM OBLIGATIONS

24
Notes to Financial StatementsC I T Y O F C L E V E L A N D , O H I O D E PA RT M E N T O F P U B L I C U T I L I T I E S D I V I S I O N O F WAT E R P O L L U T I O N C O N T R O L
NOTE B - LONG-TERM DEBT (continued)
Minimum principal and interest payments on long-term debt are as follows:
(in thousands) Principal Interest Total
2007 $ 416 $ 190 $ 6062008 432 174 6062009 450 157 6072010 467 140 6072011 486 121 6072012-2016 2,572 306 2,8782017-2021 260 3 2632022-2025 11 11
Total $ 5,094 $ 1,091 $ 6,185
The Ohio Water Development Authority and Ohio Public Works Commission Loans are being paid from the revenues derived from operations of the Division.
Water Pollution Control Loans: Under Title VI of the Clean Water Act, Congress created the State Revolving Fund (SRF). The SRF program provides federal capitalization grants to states, in addition to the 20% state matching funds, are used to capitalize state level revolving loan funds. Besides the traditional typesof municipal wastewater treatment projects, Congress expanded the potential use of SRF funds to include correction of combined sewer overflows, major sewer rehabilitation and new collector sewers.
In Ohio, this SRF program is known as the Water Pollution Control Loan Fund and is jointly administered by the Ohio EPA and the Ohio Water Development Authority. Principal balances on loans increase as project costs are incurred. Interest accrues on principal amounts outstanding during the construction period and is combined with the principal balance upon completion of the project. The repayment period for each loan commences no later than the 1st of January or July following the expected completion date of the project to which it relates utilizing an estimate of total eligible project costs as the preliminary loan amount. Construction loans and design loans are to be repaid in semi-annual payments of principal and interest
over a period of twenty years and five years, respectively. The Division had five SRF loan awards related to projects as of December 31, 2006.
In addition, the Division had two OPWC loan awards as of December 31, 2006. The loan related projects are for sewer repair and replacement at the Hamlet and Adolpha Streets intersection, and a storm water detention basin project at Kerruish Park. Both loans are interest-free and principal repayment will be made from the Division’s operating revenues.
For the Years Ended December 31, 2006 and 2005
NOTE C - DEPOSITS AND INVESTMENTS
Deposits: The Division’s carrying amount of deposits at the years ended December 31, 2006 and December 31, 2005 totaled $1,979,000 and $1,808,000 and the Division’s bank balances were $1,646,000 and $1,520,000, respectively. The difference represents normal reconciling items. Based on the criteria describedin GASB Statement No. 3, Deposits with Financial Institutions, Investments (including Repurchase Agreements), and Reverse Repurchase Agreements, the entire bank balances for both years were insured or collateralized with securities held by the City or by its agent in the City’s name.
Custodial credit risk for deposits is the risk that in the event of bank failure, the Division will not be able to recover deposits or collateral for securities that are in possession of an outside party. At year end, the Division’s deposits were fully insured or collateralized. All deposits are collateralized with eligible securities pledged and deposited either with the City or with a qualified trustee by the financial institution as security forrepayment of all public monies deposited in the financial institution whose market value at all times is equal to at least 110% of the carrying value of the deposits being secured.
Investments: The City’s investment policies are governed by state statutes and City
ordinances which authorize the City to invest in obligations of the U.S. Treasury, agencies and instrumentalities; bonds and other State obligations; certificates of deposit; U.S. Government Money Market Mutual Funds; STAROhio; guaranteed investment contracts; and repurchase transactions. Such repurchase transactions must be purchased from financial institutions or registered broker/dealers. Repurchase transactions are not to exceed a period of one year and confirmation of securities pledged must be obtained.
Under City policy, investments are limited to repurchase agreements, U.S. Government securities, certificatesof deposit, investments in certain money market mutual funds, and STAROhio. Generally, investments are recorded in segregated accounts by way of book entry through the banks’ commercial or trust department and are kept at the Federal Reserve Bank in the depository institutions’ separate custodial account for the City, apart from the assets of the depository institution. Ohio statute prohibits the use of Reverse Repurchase Agreements.
Investment securities are exposed to various risks such as interest rate, market and credit. Market values of securities fluctuate based on the magnitude of changing market conditions; significant changes in market conditions could materially affect portfolio value.
Interest rate risk: As a means of limiting its exposure to fair value losses caused by rising interest rates, the Division invests primarily in short-term investments maturing within five years from the date of purchase. The intent is to avoid the need to sell securities prior to maturity. Investment maturities are disclosed in the table on the following page.
Custodial Credit Risk: For an investment, custodial credit risk is the risk that, in the event of the failure of the counterparty, the Division will not be able to recover the value of the investments or collateral securities that are in the possession of an outside party.

25
Notes to Financial StatementsC I T Y O F C L E V E L A N D , O H I O D E PA RT M E N T O F P U B L I C U T I L I T I E S D I V I S I O N O F WAT E R P O L L U T I O N C O N T R O L
NOTE C - DEPOSITS AND INVESTMENTS (continued)
Credit Risk: The Division’s investments as of December 31, 2006 and 2005 include U.S. Agencies, Victory Federal Money Market Funds, Allegiant Government Money Market Funds, STAROhio and mutual funds. The Division maintains the highest ratings for their investments. Investments in FHLMC, FNMA, FFCB and FHLB agency securities are rated AAA by Standard & Poor’s. Investments in the Victory Money Market Fund, Allegiant Government Money Market Fund and STAROhio carry a rating of AAAm, which is the highest money market fund rating
For the Years Ended December 31, 2006 and 2005
given by Standard & Poor’s. Ohio law requires that STAROhio maintain the highest rating provided by at least one nationally recognized standard rating service. The Division has no investment policy that would further limit its investment choices.
Concentration of Credit Risk: The Division places a limitation on the amount it may invest in any one issuer to minimize the concentration of credit risk. The Division had the following investments at December 31, 2006 and 2005, which include those classified as cash and cash equivalents in the balance sheet in accordance with the provisions of GASB Statement No. 9 since they have a maturity of three months or less:
As of December 31, 2005, the investments in U.S. Agency Obligations, STAROhio and mutual funds are approximately 62%, 21% and 17%, respectively, of the Division’s total investments.
(in thousands) Investment Maturities 2006 2005Type of Fair 2006 Fair 2005 Less than 1 - 5 5 YearsInvestment Value Cost Value Cost One Year Years or More
U.S. Agency Obligations $ 11,936 $ 12,005 $ 19,226 $ 19,632 $ 11,936 $ $
STAROhio 10,111 10,111 6,647 6,647 10,111
Investment in Mutual Funds 4,941 4,941 5,428 5,428 4,941
Total Investments 26,988 27,057 31,301 31,707 26,988 Total Deposits 1,979 1,979 1,808 1,808 1,979
Total Deposits and Investments $ 28,967 $ 29,036 $ 33,109 $ 33,515 $ 28,967 $ $.

26
Notes to Financial StatementsC I T Y O F C L E V E L A N D , O H I O D E PA RT M E N T O F P U B L I C U T I L I T I E S D I V I S I O N O F WAT E R P O L L U T I O N C O N T R O L
NOTE D - CAPITAL ASSETS
Capital Asset Activity: Capital asset activity for the year ended December 31, 2006 was as follows:
(in thousands) Balance Balance Jan. 1, Dec. 31, 2006 Additions Reductions 2006
Capital assets, not being depreciated: Land $ 297 $ $ $ 297 Construction in progress 2,029 5,131 (2,545) 4,615Total capital assets, not being depreciated 2,326 5,131 (2,545) 4,912
Capital assets, being depreciated: Utility plant 117,548 2,187 119,735 Buildings, structures and improvements 2,658 2,658 Furniture, fixtures, equipment and vehicles 10,815 443 (404) 10,854Total capital assets, being depreciated 131,021 2,630 (404) 133,247Less: Accumulated depreciation (65,555) (4,815) 403 (69,967)
Total capital assets being depreciated, net 65,466 ( 2,185) (1) 63,280
Capital assets, net $ 67,792 $ 2,946 $ (2,546) $ 68,192
For the Years Ended December 31, 2006 and 2005
Capital Asset Activity: Capital asset activity for the year ended December 31, 2006 was as follows:
(in thousands) Balance Balance Jan. 1, Dec. 31, 2006 Additions Reductions 2006
Capital assets, not being depreciated: Land $ 297 $ $ $ 297 Construction in progress 3,995 7,266 (9,232) 2,029Total capital assets, not being depreciated 4,292 7,266 ( 9,232) 2,326
Capital assets, being depreciated: Utility plant 111,112 6,436 117,548 Buildings, structures and improvements 2,567 91 2,658 Furniture, fixtures, equipment and vehicles 8,177 2,710 (72) 10,815Total capital assets, being depreciated 121,856 9,237 (72) 131,021Less: Accumulated depreciation ( 61,099) (4,525) 69 ( 65,555)
Total capital assets being depreciated, net 60,757 4,712 (3) 65,466
Capital assets, net $ 65,049 $ 11,978 $ ( 9,235) $ 67,792
Commitments: The Division had outstanding commitments of approximately $4,791,000 and $5,781,000 for future capital expenditures at December 31, 2006 and 2005, respectively. It is anticipated that these commitments will be financed from the Division’s cash balances. However, at the discretion of the Division, additional long-term debt may be issued in the future to finance a portion of the costs.

27
Notes to Financial StatementsC I T Y O F C L E V E L A N D , O H I O D E PA RT M E N T O F P U B L I C U T I L I T I E S D I V I S I O N O F WAT E R P O L L U T I O N C O N T R O L
NOTE E - EMPLOYEES RETIREMENT PLAN
All full-time employees participate in the Ohio Public Employees Retirement System (OPERS). OPERS administers three separate pension plans as described below:1) The Traditional Pension Plan (TP)
– a cost-sharing, multiple-employer defined benefit pension plan.
2) The Member-Directed Plan (MD) – a defined contribution plan in which the member invests both member and employer contributions (employer contributions vest over five years at 20% per year). Under the Member-Directed Plan members accumulate retirement assets equal to the value of member and (vested) employer contributions plus any investment earnings.
3) The Combined Plan (CO) – a cost-sharing, multiple-employer defined benefit pension plan. Under the
Combined Plan, employer contributions are invested by OPERS to provide a formula retirement
benefit similar in nature to the Traditional Pension Plan benefit. Member contributions, the investment of which is self-directed by the members, accumulate retirement assets in a manner similar to the Member-Directed Plan.
OPERS provides retirement, disability, survivor and death benefits and annual cost-of-living adjustments to members of the Traditional Pension and Combined Plans. Members of the Member-Directed Plan do not qualify for ancillary benefits. Authority to establish and amend benefits is provided by state statute per Chapter 145 of the Ohio Revised Code. OPERS issues a stand-alone financial report. Interested parties may obtain a copy by making a written request to OPERS, 277 East Town Street, Columbus, Ohio 43215-4642 or by calling (614) 222-5601 or 1-800-222-7377.
The Ohio Revised Code provides statutory authority for member and employer contributions. Member and employer
contribution rates were consistent across all three plans (TP, MD and CO). Member contribution rates were 9.0% in 2006 and 8.5% in 2005 and 2004 and employer contribution rates were 13.70% of covered payroll in 2006 and 13.55% of covered payroll in 2005 and 2004. The Division’s required employer contributions to OPERS for the pension portion of all the plans for the years ending December 31, 2006, 2005 and 2004 were approximately $580,000, $580,000 and $589,000 each year, respectively. The requiredpayments due in 2006, 2005 and 2004 have been made.
NOTE F - OTHER POST-EMPLOYMENT BENEFITS
Ohio Public Employees Retirement System: Ohio Public Employees Retirement System (OPERS) administers three separate pension plans: The Traditional Pension Plan (TP) – a cost-sharing, multiple employer defined benefit pension plan; the Member-Directed Plan (MD) – a defined contribution plan; and the Combined Plan (CO) – a cost-sharing, multiple-employer defined benefit pension plan that has elements of both a defined benefit and defined contribution plan. OPERS provides retirement, disability and survivor benefits as well as postretirement health care coverage to qualifying members of both the Traditional Pension and the Combined Plans. Members of the Member-Directed Plan do not qualify for ancillary benefits, including postemployment health care coverage. In order to qualify for postretirement health care coverage, age and service retirees under the Traditional Pension and Combined Plans must have 10 or more years of qualifying Ohio service credit. Health care coverage for disability benefit recipients and qualified survivor benefit recipients is available. The health care coverage provided by OPERS is considered to be an Other Postemployment Benefit (OPEB) as described in GASB Statement No. 12.
A portion of each employer’s contribution to OPERS is set aside for the funding of postretirement health care. The Ohio Revised Code provides statutory authority for employer contributions. The Division’s contribution rate was 13.70% of covered payroll in 2006 and 13.55% of covered payroll in 2005 and 2004, and 4.50% wasused to fund health care for the year in 2006 and 4.00% was used to fund health care for the year in 2005 and 2004. The Ohio Revised Code provides the statutory authority requiring public employers to fund postretirement health care through their contributions to OPERS. The assumptions and calculations below were based on OPERS’ latest actuarial review performed as of December 31, 2005. The individual entry age actuarial cost method of valuation is used in determining the present value of OPEB. The difference between assumed and actual experience (actuarial gains and losses) becomes part of the unfunded actuarial accrued liability. All investments are carried at market value. For actuarial valuation purposes, a smoothed market approach is used. Under this approach, assets are adjusted to reflect 25% of unrealized market appreciation or depreciation on investment assets annually, not to exceed a 12% corridor. The investment assumption rate for 2005 was 6.50%. An annual increase of 4.00%, compounded annually, is the base portion of the individual pay increase assumption. This assumes no change in the number of active employees. Additionally, annual pay increases, over and above the 4.00% base increase, were assumed to range from 0.50% to 6.30%.
Health care costs were assumed to increase at the projected wage inflation rate plus an additional factor ranging from .50% to 6% for the next 9 years. In subsequent years (10 and beyond) health care costs were assumed to increase at 4% (the projected wage inflation rate). OPEBs are advance-funded on an actuarially determined basis. The Traditional Pension and Combined Plans had 369,214 active contributing participants as of December 31, 2006. The number of active contributing participants for both plans used in December 31, 2005, actuarial valuation was 358,804.
For the Years Ended December 31, 2006 and 2005

28
Notes to Financial StatementsC I T Y O F C L E V E L A N D , O H I O D E PA RT M E N T O F P U B L I C U T I L I T I E S D I V I S I O N O F WAT E R P O L L U T I O N C O N T R O L
For the Years Ended December 31, 2006 and 2005
NOTE F - OTHER POST-EMPLOYMENT BENEFITS (continued)
The employer contribution rate of 13.70% is the actuarially determined contribution requirements for OPERS. The Division’s actual contributions for 2006 which were to fund postemployment benefits were approximately $284,000. $11.1 billion represents the actuarial value of OPERS’ net assets available for OPEB at December 31, 2005. Based on the actuarial cost method used, the actuarial valuation as of December 31, 2005, reported the actuarial accrued liability and the unfunded actuarial accrued liability for OPEB at $31.3 billion and $20.2 billion, respectively.
The Health Care Preservation Plan (HCPP) adopted by the OPERS Retirement Board on September 9, 2004,will be effective January 1, 2007. OPERS took additional actions to improve the solvency of the Health Care Fund in 2005 by creating a separate investment pool for health care assets. Member and employer contribution rates increased as of January 1, 2006, and January 1, 2007, which will allow additional funds to be allocated to the health care plan.
NOTE G - CONTINGENT LIABILITIES AND RISK MANAGEMENT
Contingent Liabilities: Various claims are pending against the City involving the Division for personal injuries, property damage and other matters. The City is responsible for the suits. The City’s management is of the opinion that ultimate settlement of such claims will not result in a material adverse effect on the Division’s financial position, results of operations or cash flows.
Risk Management: The Division is exposed to various risks of loss related to torts; thefts of, damage to and destruction of assets; errors and omissions; injuries to employees; and natural disasters. The Division is generally self-insured. No
material losses, including incurred but not reported losses, occurred in 2006 or 2005.
The City provides the choice of four separate health insurance plans for its employees. These plans are provided by two different insurers through commercial insurance. Operating funds are charged a monthly rate per employee, by type of coverage. The Division participates in the State of Ohio workers’ compensation retrospective rating program.
In accordance with GASB Statement No. 10, claims liabilities are reported when it is probable that a loss has occurred and the amount of the loss can be reasonably estimated. Liabilities include an amount for claims that have been incurred but not reported. The result of the process to estimate the claims liability is not anexact amount as it depends on many complex factors, such as inflation, changes in legal doctrines, and damage awards. Accordingly, claims are re-evaluated periodically to consider the effects of inflation, recent claim settlement trends (including frequency and amount of pay-outs), and other economic and social factors.
The estimate of the claims liability also includes amounts for incremental claim adjustment expenses related to specific claims and other claim adjustment expenses, regardless of whether allocated to specific claims. Estimated recoveries, for example from salvage or subrogation, are another component of the claims liability estimate. Claims liability for the Division is immaterial.
NOTE H - RELATED PARTY TRANSACTIONS
Revenues and Accounts Receivable: The Division provides sewer services to the City, including its various departments and divisions. Standard consumption rates are charged, except for the Division of Fire, public buildings and certain other facilities owned by the City, which by ordinance are provided free sewer services.
Billing and collection services for the Division are performed by the Division of Water for a fee. This fee is based on the number of billings made on behalf of the Division during the year at the same rates as charged to other users of the billing system. Fees paid to the Division of Water for such services were approximately$2,257,000 and $2,320,000 in 2006 and 2005, respectively.
Operating Expenses: The Division is provided various intra-city services. Charges are based on actual use oron a reasonable pro rata basis. The more significant costs for the years ended December 31 were as follows:
(in thousands) 2006 2005
Electricity purchases $ 183 $ 215
Street construction and maintenance 210 222
City administration 601 302
Motor vehicle maintenance 430 402
Utilities administration and fiscal control 239 235
Employee and other services provided by the Division of Water 162 880
NOTE I - CUYAHOGA COUNTY REAL PROPERTY TAXES
The Division is required by ordinance to keep records of the estimated property taxes which would be payable to Cuyahoga County were it subject to such taxes. The estimated property taxes for the Division, based on book value of real estate at the current tax rates, would have been approximately $8,887 and $10,617 for the years ended December 31, 2006 and 2005, respectively.


back cover
www.clevelandwpc.com
12302 Kirby Avenue
(216) 664-2513
Cleveland, OH 44108