city of cockburn community perception results 2015
TRANSCRIPT

CATALYSE® empowering decision makers © 2015
Community Perceptions 2015
June 2015

. . . . . . . . . . . . . . . . . . . . . . . . . . . . . . . . . . . . .
Contents
2
Strategic Insights 3
The study 11
Overall perceptions 13
Governance and communication 17
Environment 28
Social 56

Strategic Insights
3

. . . . . . . . . . . . . . . . . . . . . . . . . . . . . . . . . . . . .
64
55 54
41 40
61 54
43
67 64 63 63 63 61 60 59 58 56 54 54 51 45
40 40 39
26
City of Cockburn
Growth Councils
Neighbouring Councils
Other Councils
Average result for overall satisfaction with [INSERT COUNCIL] as a ‘place to live’ and as a ‘governing organisation’.
2 in 3 highly satisfied with overall performance; placing the City 2nd
4
Ind
ust
ry A
vera
ge 5
3
The City of Cockburn is performing well and is leading the way among Growth Councils
and Neighbouring Councils!
Includes Wanneroo, Armadale, Mandurah and Serpentine Jarrahdale.
Includes Melville, Fremantle and Kwinana.
% of respondents rating overall satisfaction 8+ out of 10

. . . . . . . . . . . . . . . . . . . . . . . . . . . . . . . . . . . . .
Overall satisfaction with the City as the governing organisation
Council’s leadership within the community
Having a good understanding of the community’s needs
Cockburn Soundings – Council’s newsletter
Efforts to promote and adopt sustainable practices
Access to housing that meets community needs
Facilities and services for families and children
Facilities, services and care available for seniors
Opportunities to be included and connected to the community
The City is the Industry Leader in 9 areas
5
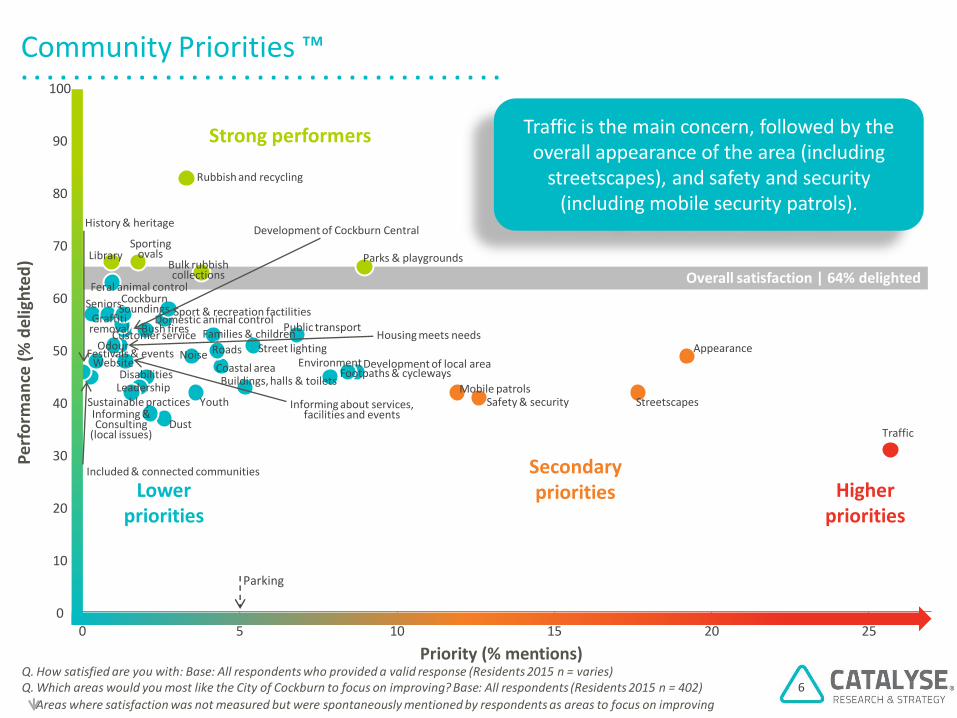
. . . . . . . . . . . . . . . . . . . . . . . . . . . . . . . . . . . . . Community Priorities ™
Q. How satisfied are you with: Base: All respondents who provided a valid response (Residents 2015 n = varies) Q. Which areas would you most like the City of Cockburn to focus on improving? Base: All respondents (Residents 2015 n = 402) Areas where satisfaction was not measured but were spontaneously mentioned by respondents as areas to focus on improving
6
Strong performers
Youth
Seniors
Families & children
Disabilities
Festivals & events
Included & connected communities
Environment
Safety & security
Appearance
Coastal area
Public transport Housing meets needs
Bush fires
Noise
Dust
Odour
History & heritage
Leadership
Customer service
Library
Development of Cockburn Central
Development of local area
Rubbish and recycling
Bulk rubbish collections
Sustainable practices
Domestic animal control
Feral animal control
Roads
Traffic
Street lighting
Footpaths & cycleways
Parks & playgrounds Sporting
ovals
Streetscapes
Sport & recreation factilities
Buildings, halls & toilets Mobile patrols
Graffiti removal
Informing & Consulting
(local issues)
Informing about services, facilities and events
Cockburn Soundings
Website
0 5 10 15 20 25
Priority (% mentions)
100
90
80
70
60
50
40
30
20
10
0
Per
form
ance
(%
del
igh
ted
)
Lower priorities
Parking
Overall satisfaction | 64% delighted
Secondary priorities Higher
priorities
Traffic is the main concern, followed by the overall appearance of the area (including
streetscapes), and safety and security (including mobile security patrols).

. . . . . . . . . . . . . . . . . . . . . . . . . . . . . . . . . . . . .
Traffic congestion hot spots include Gateways Shopping Centre, Fiona Stanley Hospital and many individually named roads and intersections.
Residents would like improved road design with roundabouts, traffic lights, turning arrows, speed humps, chicanes and other traffic management devices used appropriately to improve flow and safety. Better public transport is also requested.
Roe Highway continues to be topical with some calling for a stronger stance from Council.
Coming in and out of Murdoch Chase (entrance at Murdoch Drive and Farrington Road) the roundabout is too busy and there are far too many traffic lights. The layout is a problem and a safety concern for residents.
The traffic trying to get out from The Grange and from Dunraven Drive across Beeliar Drive is shocking. The traffic struggle so much to get across,
there needs to be a big roundabout or traffic lights.
Driving on Spearwood Ave heading east, when turning right onto Stock Road heading towards Rockingham, there's no right turning arrow just the
green light where we are supposed to turn when traffic is clear and its so dangerous I feel very unsafe when trying to cross those lights.
I would like Bibra Lake and North Lake to be maintained, I do not want the Roe Highway to go through as it is a place of natural beauty which should
not be disturbed.
Addressing community priorities | traffic
7

. . . . . . . . . . . . . . . . . . . . . . . . . . . . . . . . . . . . .
Residents are mostly concerned with antisocial behaviour, including hooning, burnouts, off-road motorbikes, loitering around shopping centres, rocks being thrown at passing vehicles, and vandalism.
They suggest more supervision and policing, with an increase in the frequency and visibility of mobile security patrols and greater power to act. Speed humps or chicanes are also suggested to prevent speeding cars and motorbikes.
I rarely see security patrols in my street and I have heard that cars are being vandalised in the Cockburn central car park. Kids have been
throwing rocks at cars and buses.
Provide more frequent security patrol in my area to control off road motorcyclists for the safety of residents as well as rock throwers.
The security patrol is a good idea but its useless as they have no authority and get intimidated by…individuals whom are loud and
abusive.
Provide speed humps on Lakes Blvd for public safety as cars are frequently speeding and it is very dangerous for kids and pedestrians.
Addressing community priorities | safety and security
8
. . . . . . . . . . . . . . . . . . . . . . . . . . . . . . . . . . . . .
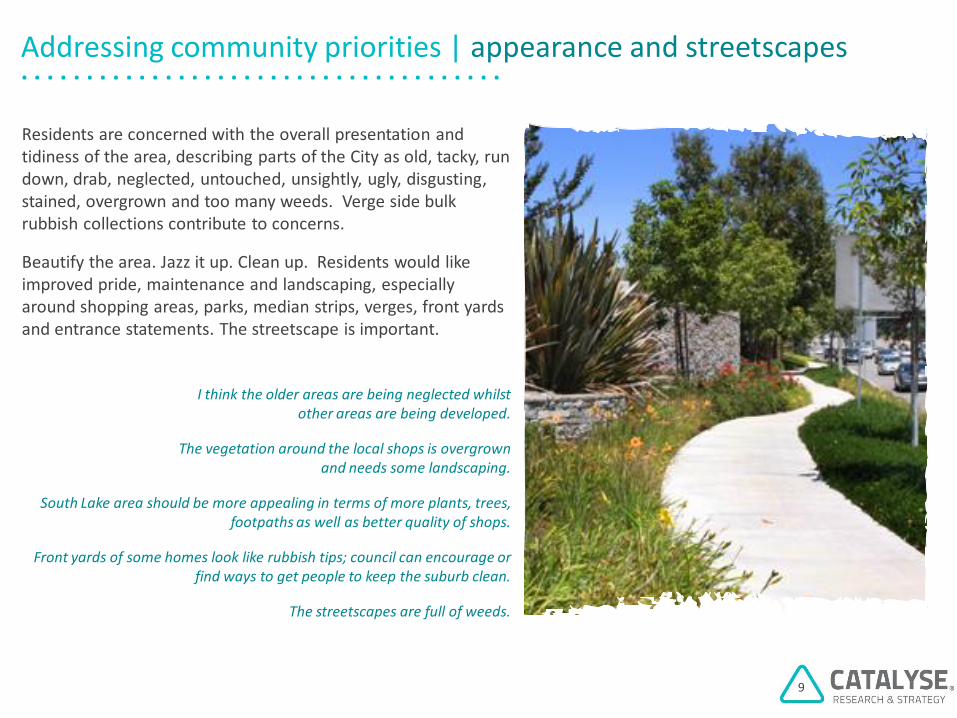
Residents are concerned with the overall presentation and tidiness of the area, describing parts of the City as old, tacky, run down, drab, neglected, untouched, unsightly, ugly, disgusting, stained, overgrown and too many weeds. Verge side bulk rubbish collections contribute to concerns.
Beautify the area. Jazz it up. Clean up. Residents would like improved pride, maintenance and landscaping, especially around shopping areas, parks, median strips, verges, front yards and entrance statements. The streetscape is important.
I think the older areas are being neglected whilst other areas are being developed.
The vegetation around the local shops is overgrown and needs some landscaping.
South Lake area should be more appealing in terms of more plants, trees, footpaths as well as better quality of shops.
Front yards of some homes look like rubbish tips; council can encourage or find ways to get people to keep the suburb clean.
The streetscapes are full of weeds.
Addressing community priorities | appearance and streetscapes
9

. . . . . . . . . . . . . . . . . . . . . . . . . . . . . . . . . . . . .
While some residents are pro-development, looking forward to the Power Station redevelopment and other projects, others are concerned about increasing density. Sustainability and protecting the local environment are important development issues. Some believe there has been too much disturbance along the coast, and they are keen to protect the wetlands from Roe extension plans. Others express concerns with the impact of development on traffic and congestion.
Sustainability, in terms of the development in the area, we need regulations on the types of buildings and infrastructure to help the
environment and be more green.
I think they need to plan more sustainably for the future rather than just selling large areas of land to developers for profits and not necessarily for
the better of the community and the environment.
There is too much disturbance to the sound, to nature.
Would be great if coastal area in North Coogee and power station areas was developed as soon as possible.
I am worried about the new developments (the power station and bush land at Manning Park) that are going up to 10 stories high as it will create
more peak hour traffic and congestion
I'd like them to stop the Roe Highway because of the wet lands.
Addressing community priorities | sustainable development
10

The study
11

. . . . . . . . . . . . . . . . . . . . . . . . . . . . . . . . . . . . . 49
51
34
39
27
9
31
35
16
16
33
36
30
80
8
11
10
1
12
Male
Female
18-34yrs
35-54 yrs
55+ yrs
Younger singles / couples (18-34)
Families with younger children (0-12)
Families with older children (13+)
Mature singles / couples (35-64)
Seniors (65+)
Central Ward
East Ward
West Ward
Own
Rent
Other
Disability or impairment
Aboriginal or Torres Strait Islander
Culturally and Linguistically Diverse
The study
12
% of respondents - weighted
In April/May 2015, the City of Cockburn administered the
CATALYSE® Community Perceptions Survey.
Purpose: to better understand the needs of residents
living in the City of Cockburn and to evaluate community
perceptions against key performance indicators in the
Strategic Community Plan.
Methodology: the survey was conducted by phone with
402 randomly selected residents.
Interviewing was completed by the ECU Survey Research
Centre between 22 April and 8 May 2015. Quotas were
set by age, gender and location and weighting applied to
match the population profile.
16% of people contacted qualified for the study and
agreed to take part. 30% were screened out because
age, gender or location quotas were full.
Sampling precision is +/- 5% at the 95% confidence
interval.
Unweighted
45
55
16
49
35

Overall perceptions
13

. . . . . . . . . . . . . . . . . . . . . . . . . . . . . . . . . . . . .
93
4
3
86
65
93
95
91
90
87
70
70
Satisfied (6+)
Neutral (5)
Dissatisfied (0-4)
Council Score
Industry High
Industry Average
2015
2014
2013
2012
2011
2010
Q. How satisfied are you with...? Please give a rating out of 10, where 10 is totally satisfied and 0 is totally dissatisfied. Base: All respondents who provided a valid response, excludes ‘don’t know’ (Residents 2015 n = 400)
Overall satisfaction with the City as a place to live
14
RESIDENT SATISFACTION
INDUSTRY STANDARDS
Delighted (8+)
SATISFACTION HISTORY
% of respondents
% of respondents Delighted Dissatisfied Male 63% 4% Female 76% 3% Younger singles / couples (18-34) 64% 0% Families with younger children (0-12) 67% 8% Families with older children (13+) 65% 2% Older singles / couples (35-64) 70% 3% Seniors (65+) 87% 1% Own / paying mortgage 67% 4% Rent 76% 0% Central Ward 70% 4% East Ward 64% 4% West Ward 77% 1% Disability or impairment 64% 3% Culturally and Linguistically Diverse 50% 1%
^Small sample size (n < 30) = significant variance %%
Satisfaction is very high.
• 93% are satisfied
• 3% are dissatisfied
Satisfaction is greater among seniors and females.
NA

. . . . . . . . . . . . . . . . . . . . . . . . . . . . . . . . . . . . .
88
8
4
57
40
88
91
86
82
79
57
57
Satisfied (6+)
Neutral (5)
Dissatisfied (0-4)
Council Score
Industry High
Industry Average
2015
2014
2013
2012
2011
2010
Q. How satisfied are you with...? Please give a rating out of 10, where 10 is totally satisfied and 0 is totally dissatisfied. Base: All respondents who provided a valid response, excludes ‘don’t know’ (Residents 2015 n = 386)
Overall satisfaction with the City as a governing organisation
15
RESIDENT SATISFACTION
INDUSTRY STANDARDS
Delighted (8+)
SATISFACTION HISTORY
% of respondents
% of respondents Delighted Dissatisfied Male 53% 3% Female 61% 4% Younger singles / couples (18-34) 59% 5% Families with younger children (0-12) 57% 2% Families with older children (13+) 49% 2% Older singles / couples (35-64) 53% 5% Seniors (65+) 74% 6% Own / paying mortgage 56% 4% Rent 66% 0% Central Ward 60% 6% East Ward 55% 4% West Ward 57% 2% Disability or impairment 51% 4% Culturally and Linguistically Diverse 52% 2%
^Small sample size (n < 30) = significant variance %%
Satisfaction is high, with the City setting the Industry Standard!
• 88% are satisfied
• 4% are dissatisfied
Satisfaction is greater among seniors.
NA
Industry High

. . . . . . . . . . . . . . . . . . . . . . . . . . . . . . . . . . . . .
75
14
11
46
28
75
78
67
64
68
66
41
41
Satisfied (6+)
Neutral (5)
Dissatisfied (0-4)
Council Score
Industry High
Industry Average
2015
2014
2013
2012
2011
2010
Q. How satisfied are you with...? Please give a rating out of 10, where 10 is totally satisfied and 0 is totally dissatisfied. Base: All respondents who provided a valid response, excludes ‘don’t know’ (Residents 2015 n = 290)
Value for money from Council rates
16
RESIDENT SATISFACTION
INDUSTRY STANDARDS
Delighted (8+)
SATISFACTION HISTORY
% of respondents
% of respondents Delighted Dissatisfied Male 37% 13% Female 44% 9% Younger singles / couples (18-34) 37% 11% Families with younger children (0-12) 47% 15% Families with older children (13+) 33% 12% Older singles / couples (35-64) 35% 7% Seniors (65+) 52% 9% Own / paying mortgage 41% 11% Rent NA NA Central Ward 38% 8% East Ward 39% 17% West Ward 46% 8% Disability or impairment 35% 12% Culturally and Linguistically Diverse 39% 10%
^Small sample size (n < 30) = significant variance %%
Satisfaction is relatively high.
• 75% are satisfied
• 11% are dissatisfied
Satisfaction is greater among seniors.
There is most room to improve perceptions among those in the East Ward.

Governance and communications
17

. . . . . . . . . . . . . . . . . . . . . . . . . . . . . . . . . . . . .
78
14
9
43
26
78
69
69
67
58
59
43
43
Satisfied (6+)
Neutral (5)
Dissatisfied (0-4)
Council Score
Industry High
Industry Average
2015
2014
2013
2012
2011
2010
Q. How satisfied are you with...? Please give a rating out of 10, where 10 is totally satisfied and 0 is totally dissatisfied. Base: All respondents who provided a valid response, excludes ‘don’t know’ (Residents 2015 n = 293)
Council’s leadership within the community
18
RESIDENT SATISFACTION
INDUSTRY STANDARDS
Delighted (8+)
SATISFACTION HISTORY
% of respondents
% of respondents Delighted Dissatisfied Male 34% 9% Female 53% 8% Younger singles / couples (18-34)^ 36% 27% Families with younger children (0-12) 40% 4% Families with older children (13+) 41% 9% Older singles / couples (35-64) 40% 12% Seniors (65+) 59% 5% Own / paying mortgage 44% 8% Rent^ 47% 17% Central Ward 44% 6% East Ward 39% 10% West Ward 46% 11% Disability or impairment^ 54% 12% Culturally and Linguistically Diverse^ 48% 4%
^Small sample size (n < 30) = significant variance %%
Satisfaction is relatively high, up significantly by 9% points and setting the industry standard!
• 78% are satisfied
• 9% are dissatisfied
Satisfaction is greater among females and seniors.
There is most room to improve perceptions among younger singles and couples.
▲
Priority 2% Familiar 73%
Industry High

. . . . . . . . . . . . . . . . . . . . . . . . . . . . . . . . . . . . .
27
48
11
9 4 2
Strongly agree
Somewhat agree
Neutral
Somewhat disagree
Strongly disagree
Don't know
Q. How strongly do you agree or disagree that: Base: All respondents who provided a valid response (Residents 2015 n = 402)
The City of Cockburn has a good understanding of the community’s needs
19
COMMUNITY PERSPECTIVES
INDUSTRY COMPARISONS: % total agree
74 74 53
Council High Average
HISTORY: % total agree
% of respondents
58 58 66 71 74
2010 2011 2012 2013 2014 2015
74% agree that the City of Cockburn has a good understanding of the community’s needs; up 16% points over the past four years and setting the Industry Standard.
Seniors are the most likely to agree.
Those with a disability are the most likely to disagree.
^Small sample size (n < 30) = significant variance %%
NA
% of respondents Agree Disagree Male 76% 12% Female 73% 13% Younger singles / couples (18-34) 77% 6% Families with younger children (0-12) 76% 14% Families with older children (13+) 69% 16% Older singles / couples (35-64) 67% 17% Seniors (65+) 86% 5% Own / paying mortgage 75% 15% Rent 68% 8% Central Ward 77% 10% East Ward 74% 14% West Ward 72% 14% Disability or impairment 66% 22% Culturally and Linguistically Diverse 69% 10%
Industry High
. . . . . . . . . . . . . . . . . . . . . . . . . . . . . . . . . . . . .
76
15
10
40
26
76
71
72
64
59
62
38
38
Satisfied (6+)
Neutral (5)
Dissatisfied (0-4)
Council Score
Industry High
Industry Average
2015
2014
2013
2012
2011
2010
Q. Please give a rating out of 10, where 10 is totally satisfied and 0 is totally dissatisfied. Base: All respondents who provided a valid response, excludes ‘don’t know’ (Residents 2015 n = 350)
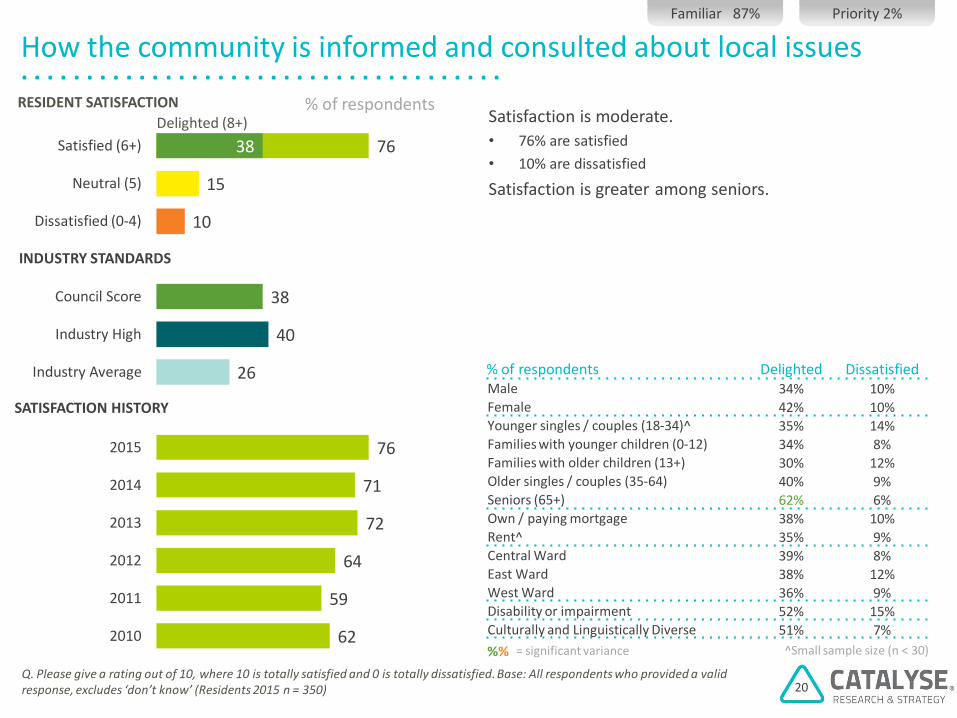
How the community is informed and consulted about local issues
20
RESIDENT SATISFACTION
INDUSTRY STANDARDS
Delighted (8+)
SATISFACTION HISTORY
% of respondents
% of respondents Delighted Dissatisfied Male 34% 10% Female 42% 10% Younger singles / couples (18-34)^ 35% 14% Families with younger children (0-12) 34% 8% Families with older children (13+) 30% 12% Older singles / couples (35-64) 40% 9% Seniors (65+) 62% 6% Own / paying mortgage 38% 10% Rent^ 35% 9% Central Ward 39% 8% East Ward 38% 12% West Ward 36% 9% Disability or impairment 52% 15% Culturally and Linguistically Diverse 51% 7%
^Small sample size (n < 30) = significant variance %%
Satisfaction is moderate.
• 76% are satisfied
• 10% are dissatisfied
Satisfaction is greater among seniors.
Priority 2% Familiar 87%

. . . . . . . . . . . . . . . . . . . . . . . . . . . . . . . . . . . . .
27
38
14
12
6 3 Strongly agree
Somewhat agree
Neutral
Somewhat disagree
Strongly disagree
Don't know
Q. How strongly do you agree or disagree that: Base: All respondents who provided a valid response (Residents 2015 n = 400)
The City has developed and communicated a clear vision for the area I am fairly clear about what the area is going to look and feel like in 10 years time
21
COMMUNITY PERSPECTIVES
INDUSTRY COMPARISONS: % total agree
65 66 43
Council High Average
HISTORY: % total agree
% of respondents
46 53 60 63 65
2010 2011 2012 2013 2014 2015
65% agree that The City of Cockburn has developed and communicated a clear vision for the area.
CALD residents, those who’ve seen the City’s Update and who received the calendar are the most likely to agree.
Those in the Central Ward and those with a disability are more likely to disagree.
^Small sample size (n < 30) = significant variance %%
NA
% of respondents Agree Disagree Seen or read update in local newspaper 71% 18% Received calendar 75% 14% Male 65% 15% Female 64% 21% Younger singles / couples (18-34) 54% 18% Families with younger children (0-12) 68% 16% Families with older children (13+) 61% 19% Older singles / couples (35-64) 63% 22% Seniors (65+) 70% 16% Own / paying mortgage 66% 18% Rent 73% 13% Central Ward 58% 22% East Ward 69% 15% West Ward 66% 18% Disability or impairment 56% 29% Culturally and Linguistically Diverse 77% 16%

. . . . . . . . . . . . . . . . . . . . . . . . . . . . . . . . . . . . .
81
12
7
52
41
81
80
76
48
48
Satisfied (6+)
Neutral (5)
Dissatisfied (0-4)
Council Score
Industry High
Industry Average
2015
2014
2013
2012
2011
2010
Q. How satisfied are you with...? Please give a rating out of 10, where 10 is totally satisfied and 0 is totally dissatisfied. Base: All respondents who provided a valid response, excludes ‘don’t know’ (Residents 2015 n = 371)
How the community is informed about Council services, facilities and events
22
RESIDENT SATISFACTION
INDUSTRY STANDARDS
Delighted (8+)
SATISFACTION HISTORY
% of respondents
% of respondents Delighted Dissatisfied Male 38% 10% Female 57% 5% Younger singles / couples (18-34) 36% 7% Families with younger children (0-12) 50% 8% Families with older children (13+) 42% 11% Older singles / couples (35-64) 49% 5% Seniors (65+) 58% 2% Own / paying mortgage 49% 7% Rent 42% 11% Central Ward 46% 5% East Ward 51% 6% West Ward 45% 11% Disability or impairment 56% 7% Culturally and Linguistically Diverse 51% 21%
^Small sample size (n < 30) = significant variance %%
Satisfaction is high.
• 81% are satisfied
• 7% are dissatisfied
There is most room to improve perceptions among males, younger singles and couples, and CALD residents.
Priority 1% Familiar 92%
NA
NA
NA

. . . . . . . . . . . . . . . . . . . . . . . . . . . . . . . . . . . . .
88
6
6
57
40
88
84
83
81
81
79
57
57
Satisfied (6+)
Neutral (5)
Dissatisfied (0-4)
Council Score
Industry High
Industry Average
2015
2014
2013
2012
2011
2010
Q. How satisfied are you with...? Please give a rating out of 10, where 10 is totally satisfied and 0 is totally dissatisfied. Base: All respondents who provided a valid response, excludes ‘don’t know’ (Residents 2015 n = 329)
Cockburn Soundings | Council’s newsletter
23
RESIDENT SATISFACTION
INDUSTRY STANDARDS
Delighted (8+)
SATISFACTION HISTORY
% of respondents
% of respondents Delighted Dissatisfied Male 46% 9% Female 67% 4% Younger singles / couples (18-34)^ 63% 0% Families with younger children (0-12) 54% 10% Families with older children (13+) 50% 7% Older singles / couples (35-64) 56% 4% Seniors (65+) 72% 3% Own / paying mortgage 59% 6% Rent^ 55% 11% Central Ward 54% 10% East Ward 59% 3% West Ward 60% 5% Disability or impairment 61% 5% Culturally and Linguistically Diverse 67% 10%
^Small sample size (n < 30) = significant variance %%
Satisfaction is high, and trending up.
• 88% are satisfied
• 6% are dissatisfied
Satisfaction is greater among females, seniors and CALD residents.
Priority 1% Familiar 82%
Industry High

. . . . . . . . . . . . . . . . . . . . . . . . . . . . . . . . . . . . .
43
53
4
Yes
No
Unsure
Q. In the past 12 months, have you seen or read the City’s Update in the local newspaper. This is the regular, one page advertising that provides news about Council activities. Base: Those who provided a valid response (2012 n = 400; 2013 n = 401; 2014 n = 401)
Reach of the City’s Update in the local newspaper
24
% of respondents
In the past 12 months, have you seen or read the City’s Update in the local newspaper?
53 49 52 43
2012 2013 2014 2015
HISTORY: % seen or read
Over the past 12 months, 43% have seen or read the City’s Update in the local newspaper, down significantly by 9% points.
Reach is greater among seniors.
Reach is lower among younger singles and couples.
^Small sample size (n < 30) = significant variance %%
▼
% of respondents Seen/read City’s Update Male 43% Female 44% Younger singles / couples (18-34) 23% Families with younger children (0-12) 43% Families with older children (13+) 41% Older singles / couples (35-64) 49% Seniors (65+) 56% Own / paying mortgage 47% Rent 41% Central Ward 44% East Ward 43% West Ward 44% Disability or impairment 52% Culturally and Linguistically Diverse 50%
. . . . . . . . . . . . . . . . . . . . . . . . . . . . . . . . . . . . .
78
15
7
50
37
78
85
78
81
77
83
48
48
Satisfied (6+)
Neutral (5)
Dissatisfied (0-4)
Council Score
Industry High
Industry Average
2015
2014
2013
2012
2011
2010
Q. How satisfied are you with...? Please give a rating out of 10, where 10 is totally satisfied and 0 is totally dissatisfied. Base: All respondents who provided a valid response, excludes ‘don’t know’ (Residents 2015 n = 223)
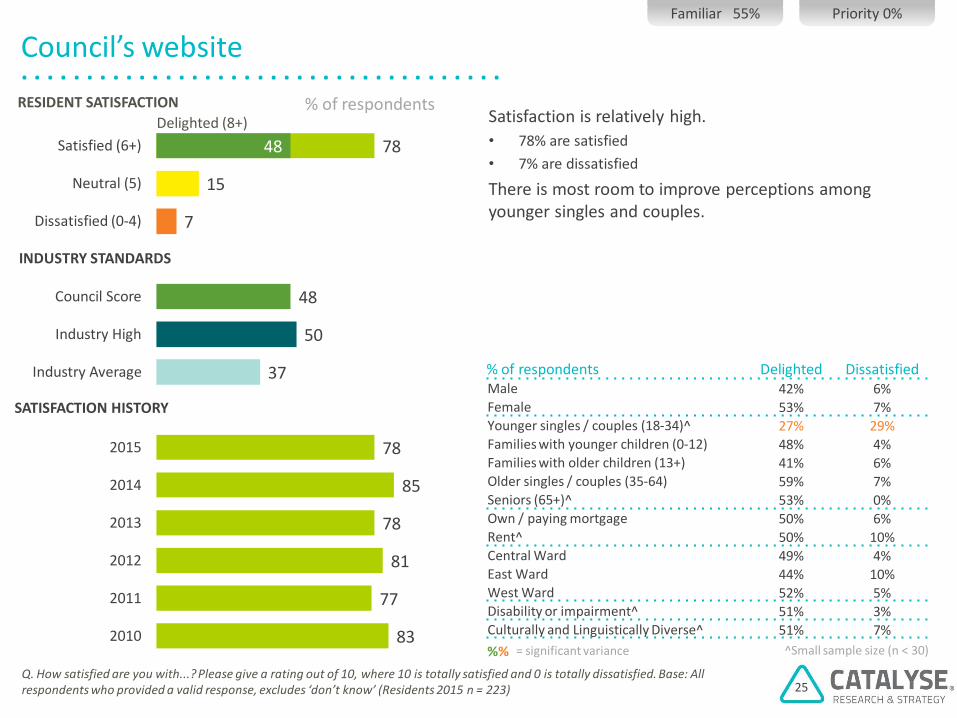
Council’s website
25
RESIDENT SATISFACTION
INDUSTRY STANDARDS
Delighted (8+)
SATISFACTION HISTORY
% of respondents
% of respondents Delighted Dissatisfied Male 42% 6% Female 53% 7% Younger singles / couples (18-34)^ 27% 29% Families with younger children (0-12) 48% 4% Families with older children (13+) 41% 6% Older singles / couples (35-64) 59% 7% Seniors (65+)^ 53% 0% Own / paying mortgage 50% 6% Rent^ 50% 10% Central Ward 49% 4% East Ward 44% 10% West Ward 52% 5% Disability or impairment^ 51% 3% Culturally and Linguistically Diverse^ 51% 7%
^Small sample size (n < 30) = significant variance %%
Satisfaction is relatively high.
• 78% are satisfied
• 7% are dissatisfied
There is most room to improve perceptions among younger singles and couples.
Priority 0% Familiar 55%

. . . . . . . . . . . . . . . . . . . . . . . . . . . . . . . . . . . . .
69
19
7 2 4 Displayed
Stored
Disposed
Other
Don't know
51
37
13
Yes
No
Unsure
Q. Has your household received a copy of the City of Cockburn’s 2014 wall calendar? Base: Those who provided a valid response (2012 n = 399; 2013 n = 399; 2014 n = 401; 2015 n = 402) Q. Have you displayed, stored or disposed of your calendar? Base: Those who received the calendar and provided a valid response (2012 n = 125; 2013 n = 171; 2014 n = 177; 2015 n = 203)
2014 wall calendar
% of respondents
Has your household received a copy of the City of Cockburn’s 2014 wall calendar?
31 43 44 51
2012 2013 2014 2015
HISTORY: % received calendar
Have you displayed, stored or disposed of your calendar?
Base: respondents who received the calendar
66 69 64 69
2012 2013 2014 2015
HISTORY: % displayed calendar
(n = 203)
26
▲

. . . . . . . . . . . . . . . . . . . . . . . . . . . . . . . . . . . . .
85
10
5
61
42
85
78
80
78
72
79
54
54
Satisfied (6+)
Neutral (5)
Dissatisfied (0-4)
Council Score
Industry High
Industry Average
2015
2014
2013
2012
2011
2010
Q. How satisfied are you with...? Please give a rating out of 10, where 10 is totally satisfied and 0 is totally dissatisfied. Base: All respondents who provided a valid response, excludes ‘don’t know’ (Residents 2015 n = 312)
Level of customer service
27
RESIDENT SATISFACTION
INDUSTRY STANDARDS
Delighted (8+)
SATISFACTION HISTORY
% of respondents
% of respondents Delighted Dissatisfied Male 49% 5% Female 60% 5% Younger singles / couples (18-34)^ 54% 8% Families with younger children (0-12) 54% 6% Families with older children (13+) 51% 5% Older singles / couples (35-64) 50% 4% Seniors (65+) 69% 4% Own / paying mortgage 52% 6% Rent^ 70% 0% Central Ward 65% 7% East Ward 46% 5% West Ward 52% 4% Disability or impairment 54% 5% Culturally and Linguistically Diverse 67% 2%
^Small sample size (n < 30) = significant variance %%
Satisfaction is high, up significantly by 7% points.
• 85% are satisfied
• 5% are dissatisfied
Satisfaction is greater among seniors, females, renters, CALD residents and those in the Central Ward.
▲
Priority 1% Familiar 78%

Environment
28

. . . . . . . . . . . . . . . . . . . . . . . . . . . . . . . . . . . . .
95
2
3
87
73
95
96
95
96
95
91
83
83
Satisfied (6+)
Neutral (5)
Dissatisfied (0-4)
Council Score
Industry High
Industry Average
2015
2014
2013
2012
2011
2010
Q. How satisfied are you with...? Please give a rating out of 10, where 10 is totally satisfied and 0 is totally dissatisfied. Base: All respondents who provided a valid response, excludes ‘don’t know’ (Residents 2015 n = 400)
Rubbish and recycling collections, the green lid and yellow lid bins
29
RESIDENT SATISFACTION
INDUSTRY STANDARDS
Delighted (8+)
SATISFACTION HISTORY
% of respondents
% of respondents Delighted Dissatisfied Male 77% 3% Female 89% 3% Younger singles / couples (18-34) 94% 0% Families with younger children (0-12) 82% 3% Families with older children (13+) 76% 5% Older singles / couples (35-64) 81% 0% Seniors (65+) 91% 3% Own / paying mortgage 82% 3% Rent 87% 5% Central Ward 86% 3% East Ward 77% 4% West Ward 86% 2% Disability or impairment 86% 2% Culturally and Linguistically Diverse 82% 4%
^Small sample size (n < 30) = significant variance %%
Satisfaction is very high.
• 95% are satisfied
• 3% are dissatisfied
Satisfaction is greater females, younger singles and couples, and seniors.
There is most room to improve perceptions among families with older children.
Priority 3% Familiar 99%

. . . . . . . . . . . . . . . . . . . . . . . . . . . . . . . . . . . . .
87
6
7
79
55
87
84
87
82
82
81
65
65
Satisfied (6+)
Neutral (5)
Dissatisfied (0-4)
Council Score
Industry High
Industry Average
2015
2014
2013
2012
2011
2010
Q. How satisfied are you with...? Please give a rating out of 10, where 10 is totally satisfied and 0 is totally dissatisfied. Base: All respondents who provided a valid response, excludes ‘don’t know’ (Residents 2015 n = 388)
Verge-side bulk rubbish collections
30
RESIDENT SATISFACTION
INDUSTRY STANDARDS
Delighted (8+)
SATISFACTION HISTORY
% of respondents
% of respondents Delighted Dissatisfied Male 60% 9% Female 70% 5% Younger singles / couples (18-34) 77% 0% Families with younger children (0-12) 70% 9% Families with older children (13+) 53% 9% Older singles / couples (35-64) 67% 11% Seniors (65+) 66% 4% Own / paying mortgage 64% 8% Rent 79% 6% Central Ward 73% 7% East Ward 59% 9% West Ward 62% 4% Disability or impairment 76% 8% Culturally and Linguistically Diverse 71% 4%
^Small sample size (n < 30) = significant variance %%
Satisfaction is high.
• 87% are satisfied
• 7% are dissatisfied
Satisfaction is greater among females and those in the Central Ward.
There is most room to improve perceptions among families with older children.
Priority 4% Familiar 97%

. . . . . . . . . . . . . . . . . . . . . . . . . . . . . . . . . . . . .
81
12
8
42
29
81
77
69
61
60
42
42
Satisfied (6+)
Neutral (5)
Dissatisfied (0-4)
Council Score
Industry High
Industry Average
2015
2014
2013
2012
2011
2010
Q. How satisfied are you with...? Please give a rating out of 10, where 10 is totally satisfied and 0 is totally dissatisfied. Base: All respondents who provided a valid response, excludes ‘don’t know’ (Residents 2015 n = 280)
Efforts to promote and adopt sustainable practices
31
RESIDENT SATISFACTION
INDUSTRY STANDARDS
Delighted (8+)
SATISFACTION HISTORY
% of respondents
% of respondents Delighted Dissatisfied Male 35% 10% Female 48% 6% Younger singles / couples (18-34)^ 41% 0% Families with younger children (0-12) 40% 9% Families with older children (13+) 40% 12% Older singles / couples (35-64) 42% 10% Seniors (65+) 52% 2% Own / paying mortgage 43% 7% Rent^ 44% 10% Central Ward 48% 9% East Ward 40% 10% West Ward 37% 4% Disability or impairment^ 48% 13% Culturally and Linguistically Diverse^ 43% 12%
^Small sample size (n < 30) = significant variance %%
Satisfaction is high, and trending up.
• 81% are satisfied
• 8% are dissatisfied
Satisfaction is greater among females and seniors.
Priority 2% Familiar 70%
NA
Industry High

. . . . . . . . . . . . . . . . . . . . . . . . . . . . . . . . . . . . .
81
11
7
54
35
81
78
78
80
69
75
45
45
Satisfied (6+)
Neutral (5)
Dissatisfied (0-4)
Council Score
Industry High
Industry Average
2015
2014
2013
2012
2011
2010
Q. How satisfied are you with...? Please give a rating out of 10, where 10 is totally satisfied and 0 is totally dissatisfied. Base: All respondents who provided a valid response, excludes ‘don’t know’ (Residents 2015 n = 362)
Conservation and environmental management
32
RESIDENT SATISFACTION
INDUSTRY STANDARDS
Delighted (8+)
SATISFACTION HISTORY
% of respondents
% of respondents Delighted Dissatisfied Male 37% 7% Female 53% 8% Younger singles / couples (18-34) 40% 20% Families with younger children (0-12) 50% 8% Families with older children (13+) 35% 4% Older singles / couples (35-64) 42% 13% Seniors (65+) 61% 2% Own / paying mortgage 42% 8% Rent 67% 8% Central Ward 51% 6% East Ward 38% 6% West Ward 47% 10% Disability or impairment 50% 5% Culturally and Linguistically Diverse 45% 4%
^Small sample size (n < 30) = significant variance %%
Satisfaction is high.
• 81% are satisfied
• 7% are dissatisfied
Satisfaction is greater among seniors.
There is most room to improve perceptions among males, younger singles and couples, families with older children and those in the East Ward.
Priority 8% Familiar 90%

. . . . . . . . . . . . . . . . . . . . . . . . . . . . . . . . . . . . .
81
8
11
81
72
66
64
59
47
47
Satisfied (6+)
Neutral (5)
Dissatisfied (0-4)
Council Score
Industry High
Industry Average
2015
2014
2013
2012
2011
2010
Q. How satisfied are you with...? Please give a rating out of 10, where 10 is totally satisfied and 0 is totally dissatisfied. Base: All respondents who provided a valid response, excludes ‘don’t know’ (Residents 2015 n = 338)
How the coastal area is being planned, developed and managed
33
RESIDENT SATISFACTION
INDUSTRY STANDARDS
Delighted (8+)
SATISFACTION HISTORY
% of respondents
% of respondents Delighted Dissatisfied Male 43% 12% Female 51% 9% Younger singles / couples (18-34)^ 46% 8% Families with younger children (0-12) 49% 11% Families with older children (13+) 43% 13% Older singles / couples (35-64) 44% 13% Seniors (65+) 55% 9% Own / paying mortgage 47% 11% Rent^ 50% 2% Central Ward 51% 5% East Ward 41% 8% West Ward 50% 18% Disability or impairment 39% 17% Culturally and Linguistically Diverse 56% 8%
^Small sample size (n < 30) = significant variance %%
Satisfaction is high, up significantly by 9% points.
• 81% are satisfied
• 11% are dissatisfied
There is most room to improve perceptions among those with a disability.
▲
Priority 4% Familiar 84%
NA
NA
NA

. . . . . . . . . . . . . . . . . . . . . . . . . . . . . . . . . . . . .
87
7
6
56
46
87
80
82
81
76
81
54
54
Satisfied (6+)
Neutral (5)
Dissatisfied (0-4)
Council Score
Industry High
Industry Average
2015
2014
2013
2012
2011
2010
Q. How satisfied are you with...? Please give a rating out of 10, where 10 is totally satisfied and 0 is totally dissatisfied. Base: All respondents who provided a valid response, excludes ‘don’t know’ (Residents 2015 n = 349)
Bush fire prevention and control
34
RESIDENT SATISFACTION
INDUSTRY STANDARDS
Delighted (8+)
SATISFACTION HISTORY
% of respondents
% of respondents Delighted Dissatisfied Male 51% 6% Female 57% 7% Younger singles / couples (18-34) 34% 0% Families with younger children (0-12) 55% 6% Families with older children (13+) 51% 4% Older singles / couples (35-64) 58% 13% Seniors (65+) 63% 4% Own / paying mortgage 54% 6% Rent^ 69% 10% Central Ward 56% 5% East Ward 51% 7% West Ward 55% 7% Disability or impairment 49% 4% Culturally and Linguistically Diverse 58% 5%
^Small sample size (n < 30) = significant variance %%
Satisfaction is high.
• 87% are satisfied
• 6% are dissatisfied
Satisfaction is greater among seniors.
There is most room to improve perceptions among younger singles and couples, and older singles and couples.
Priority 2% Familiar 87%

. . . . . . . . . . . . . . . . . . . . . . . . . . . . . . . . . . . . .
77
12
11
77
79
70
64
47
70
49
49
Satisfied (6+)
Neutral (5)
Dissatisfied (0-4)
Council Score
Industry High
Industry Average
2015
2014
2013
2012
2011
2010
Q. How satisfied are you with...? Please give a rating out of 10, where 10 is totally satisfied and 0 is totally dissatisfied. Base: All respondents who provided a valid response, excludes ‘don’t know’ (Residents 2015 n = 360)
Issues relating to noise
35
RESIDENT SATISFACTION
INDUSTRY STANDARDS
Delighted (8+)
SATISFACTION HISTORY
% of respondents
% of respondents Delighted Dissatisfied Male 47% 8% Female 52% 14% Younger singles / couples (18-34) 55% 6% Families with younger children (0-12) 57% 13% Families with older children (13+) 46% 13% Older singles / couples (35-64) 41% 7% Seniors (65+) 52% 9% Own / paying mortgage 47% 12% Rent 55% 8% Central Ward 60% 8% East Ward 46% 14% West Ward 40% 12% Disability or impairment 37% 15% Culturally and Linguistically Diverse 54% 3%
^Small sample size (n < 30) = significant variance %%
Satisfaction is relatively high.
• 77% are satisfied
• 11% are dissatisfied
There is most room to improve perceptions among those with a disability.
Priority 3% Familiar 90%
NA
NA

. . . . . . . . . . . . . . . . . . . . . . . . . . . . . . . . . . . . .
59
17
24
59
64
70
64
47
70
37
37
Satisfied (6+)
Neutral (5)
Dissatisfied (0-4)
Council Score
Industry High
Industry Average
2015
2014
2013
2012
2011
2010
Q. How satisfied are you with...? Please give a rating out of 10, where 10 is totally satisfied and 0 is totally dissatisfied. Base: All respondents who provided a valid response, excludes ‘don’t know’ (Residents 2015 n = 323)
Issues relating to dust
36
RESIDENT SATISFACTION
INDUSTRY STANDARDS
Delighted (8+)
SATISFACTION HISTORY
% of respondents
% of respondents Delighted Dissatisfied Male 32% 24% Female 43% 24% Younger singles / couples (18-34)^ 14% 46% Families with younger children (0-12) 34% 30% Families with older children (13+) 38% 24% Older singles / couples (35-64) 34% 12% Seniors (65+) 52% 12% Own / paying mortgage 34% 25% Rent^ 41% 26% Central Ward 30% 30% East Ward 37% 28% West Ward 45% 11% Disability or impairment 37% 18% Culturally and Linguistically Diverse 29% 27%
^Small sample size (n < 30) = significant variance %%
Satisfaction is moderate, but declining.
• 59% are satisfied
• 24% are dissatisfied
Satisfaction is greater among seniors.
There is most room to improve perceptions among younger singles and couples, families with younger children, and those in the Central and East Wards.
Priority 3% Familiar 80%
NA
NA

. . . . . . . . . . . . . . . . . . . . . . . . . . . . . . . . . . . . .
80
9
12
80
72
70
64
47
70
51
51
Satisfied (6+)
Neutral (5)
Dissatisfied (0-4)
Council Score
Industry High
Industry Average
2015
2014
2013
2012
2011
2010
Q. How satisfied are you with...? Please give a rating out of 10, where 10 is totally satisfied and 0 is totally dissatisfied. Base: All respondents who provided a valid response, excludes ‘don’t know’ (Residents 2015 n = 324)
Issues relating to odour
37
RESIDENT SATISFACTION
INDUSTRY STANDARDS
Delighted (8+)
SATISFACTION HISTORY
% of respondents
% of respondents Delighted Dissatisfied Male 49% 12% Female 53% 11% Younger singles / couples (18-34) 44% 13% Families with younger children (0-12) 53% 14% Families with older children (13+) 45% 14% Older singles / couples (35-64) 43% 10% Seniors (65+) 73% 1% Own / paying mortgage 49% 12% Rent^ 74% 0% Central Ward 41% 21% East Ward 60% 10% West Ward 52% 4% Disability or impairment 49% 14% Culturally and Linguistically Diverse 51% 9%
^Small sample size (n < 30) = significant variance %%
Satisfaction is high.
• 80% are satisfied
• 12% are dissatisfied
Satisfaction is greater among seniors, renters and those in the East Ward.
There is most room to improve perceptions among those in the Central Ward.
▲
Priority 1% Familiar 81%
NA
NA

. . . . . . . . . . . . . . . . . . . . . . . . . . . . . . . . . . . . .
64
35
1
Yes
No
Unsure
Q. Do you have a cat in your household? Base: All respondents (2015 n = 402) Q. Were you aware that state legislation now requires cats to be sterilised, micro-chipped and registered with the City of Cockburn? Base: All respondents (2015 n = 402)
Cat ownership + awareness of state legislation on cat ownership
38
% of respondents
Were you aware that state legislation now requires cats to be sterilised, micro-chipped and registered with the City of Cockburn?
20% of households have a cat.
64% of respondents are aware that state legislation now requires cats to be sterilised, micro-chipped and registered with the City of Cockburn.
Awareness of the new state legislation is higher among those with a cat, those who’ve seen the City’s Update and those who’ve received the calendar.
^Small sample size (n < 30) = significant variance %%
% of respondents Aware Cat Legislation Have a cat 74% Do not have a cat 61% Seen City’s Update 71% Have not seen City’s Update 57% Received calendar 71% Have not received calendar 58% Male 65% Female 63% Younger singles / couples (18-34) 29% Families with younger children (0-12) 67% Families with older children (13+) 64% Older singles / couples (35-64) 76% Seniors (65+) 71% Own / paying mortgage 66% Rent 64% Central Ward 60% East Ward 65% West Ward 68% Disability or impairment 64% Culturally and Linguistically Diverse 66%

. . . . . . . . . . . . . . . . . . . . . . . . . . . . . . . . . . . . .
86
8
6
86
79
78
76
62
71
56
56
Satisfied (6+)
Neutral (5)
Dissatisfied (0-4)
Council Score
Industry High
Industry Average
2015
2014
2013
2012
2011
2010
Q. How satisfied are you with...? Please give a rating out of 10, where 10 is totally satisfied and 0 is totally dissatisfied. Base: All respondents who provided a valid response, excludes ‘don’t know’ (Residents 2015 n = 320)
Domestic animal control (such as dogs and cats)
39
RESIDENT SATISFACTION
INDUSTRY STANDARDS
Delighted (8+)
SATISFACTION HISTORY
% of respondents
% of respondents Delighted Dissatisfied Male 52% 5% Female 61% 7% Younger singles / couples (18-34)^ 54% 0% Families with younger children (0-12) 57% 10% Families with older children (13+) 58% 4% Older singles / couples (35-64) 53% 8% Seniors (65+) 52% 3% Own / paying mortgage 54% 7% Rent^ 63% 11% Central Ward 63% 4% East Ward 55% 5% West Ward 51% 10% Disability or impairment 56% 9% Culturally and Linguistically Diverse 69% 10%
^Small sample size (n < 30) = significant variance %%
Satisfaction is high, and up significantly by 7% points.
• 86% are satisfied
• 6% are dissatisfied
Views are similar across the community.
▲
Priority 3% Familiar 80%
NA
NA

. . . . . . . . . . . . . . . . . . . . . . . . . . . . . . . . . . . . .
83
10
8
83
80
80
77
62
71
63
63
Satisfied (6+)
Neutral (5)
Dissatisfied (0-4)
Council Score
Industry High
Industry Average
2015
2014
2013
2012
2011
2010
Q. How satisfied are you with...? Please give a rating out of 10, where 10 is totally satisfied and 0 is totally dissatisfied. Base: All respondents who provided a valid response, excludes ‘don’t know’ (Residents 2015 n = 231)
Feral animal control (such as foxes and rabbits)
40
RESIDENT SATISFACTION
INDUSTRY STANDARDS
Delighted (8+)
SATISFACTION HISTORY
% of respondents
% of respondents Delighted Dissatisfied Male 57% 7% Female 69% 9% Younger singles / couples (18-34)^ 79% 0% Families with younger children (0-12) 59% 10% Families with older children (13+) 63% 9% Older singles / couples (35-64) 58% 13% Seniors (65+) 59% 4% Own / paying mortgage 63% 6% Rent^ 55% 12% Central Ward 69% 5% East Ward 61% 5% West Ward 57% 15% Disability or impairment^ 64% 7% Culturally and Linguistically Diverse 71% 17%
^Small sample size (n < 30) = significant variance %%
Satisfaction is high.
• 83% are satisfied
• 8% are dissatisfied
Satisfaction is greater among females and younger singles and couples.
There is most room to improve perceptions in the West Ward and among CALD residents.
Priority 1% Familiar 57%
NA
NA

. . . . . . . . . . . . . . . . . . . . . . . . . . . . . . . . . . . . .
85
6
9
59
33
85
55
55
Satisfied (6+)
Neutral (5)
Dissatisfied (0-4)
Council Score
Industry High
Industry Average
2015
2014
2013
2012
2011
2010
Q. How satisfied are you with...? Please give a rating out of 10, where 10 is totally satisfied and 0 is totally dissatisfied. Base: All respondents who provided a valid response, excludes ‘don’t know’ (Residents 2015 n = 377)
How cockburn central is being developed
41
RESIDENT SATISFACTION
INDUSTRY STANDARDS
Delighted (8+)
SATISFACTION HISTORY
% of respondents
% of respondents Delighted Dissatisfied Male 53% 10% Female 57% 9% Younger singles / couples (18-34) 58% 6% Families with younger children (0-12) 54% 7% Families with older children (13+) 59% 7% Older singles / couples (35-64) 36% 17% Seniors (65+) 60% 15% Own / paying mortgage 51% 11% Rent 73% 8% Central Ward 54% 8% East Ward 54% 8% West Ward 57% 13% Disability or impairment 52% 13% Culturally and Linguistically Diverse 64% 2%
^Small sample size (n < 30) = significant variance %%
Satisfaction is high.
• 85% are satisfied
• 9% are dissatisfied
Satisfaction is greater among renters.
There is most room to improve perceptions among older singles and couples.
Priority 1% Familiar 94%
NA
NA
NA
NA
NA

. . . . . . . . . . . . . . . . . . . . . . . . . . . . . . . . . . . . .
76
10
13
76
46
46
Satisfied (6+)
Neutral (5)
Dissatisfied (0-4)
Council Score
Industry High
Industry Average
2015
2014
2013
2012
2011
2010
Q. How satisfied are you with...? Please give a rating out of 10, where 10 is totally satisfied and 0 is totally dissatisfied. Base: All respondents who provided a valid response, excludes ‘don’t know’ (Residents 2015 n = 384)
How your local area is being developed
42
RESIDENT SATISFACTION
INDUSTRY STANDARDS
Delighted (8+)
SATISFACTION HISTORY
% of respondents
% of respondents Delighted Dissatisfied Male 42% 11% Female 50% 14% Younger singles / couples (18-34) 52% 0% Families with younger children (0-12) 48% 14% Families with older children (13+) 43% 16% Older singles / couples (35-64) 32% 15% Seniors (65+) 56% 10% Own / paying mortgage 46% 13% Rent^ 46% 19% Central Ward 47% 12% East Ward 52% 9% West Ward 39% 18% Disability or impairment 46% 18% Culturally and Linguistically Diverse 52% 14%
^Small sample size (n < 30) = significant variance %%
Satisfaction is relatively high.
• 76% are satisfied
• 13% are dissatisfied
There is most room to improve perceptions among older singles and couples, those living in the West Ward and those with a disability.
Priority 9% Familiar 96%
NA
NA
NA
NA
NA
NA
NA

. . . . . . . . . . . . . . . . . . . . . . . . . . . . . . . . . . . . .
80
14
6
62
40
80
75
68
46
46
Satisfied (6+)
Neutral (5)
Dissatisfied (0-4)
Council Score
Industry High
Industry Average
2015
2014
2013
2012
2011
2010
Q. How satisfied are you with...? Please give a rating out of 10, where 10 is totally satisfied and 0 is totally dissatisfied. Base: All respondents who provided a valid response, excludes ‘don’t know’ (Residents 2015 n = 303)
How local history and heritage is preserved and promoted
43
RESIDENT SATISFACTION
INDUSTRY STANDARDS
Delighted (8+)
SATISFACTION HISTORY
% of respondents
% of respondents Delighted Dissatisfied Male 40% 7% Female 51% 5% Younger singles / couples (18-34)^ 30% 0% Families with younger children (0-12) 43% 11% Families with older children (13+) 40% 9% Older singles / couples (35-64) 53% 1% Seniors (65+) 57% 5% Own / paying mortgage 44% 6% Rent 60% 0% Central Ward 46% 8% East Ward 39% 5% West Ward 53% 5% Disability or impairment 49% 5% Culturally and Linguistically Diverse 52% 9%
^Small sample size (n < 30) = significant variance %%
Satisfaction is high, trending up.
• 80% are satisfied
• 6% are dissatisfied
Satisfaction is greater among seniors.
There is most room to improve perceptions among younger singles and couples, families with younger children and those in the East Ward.
Priority 0% Familiar 75%
NA
NA
NA

. . . . . . . . . . . . . . . . . . . . . . . . . . . . . . . . . . . . .
79
13
9
51
46
79
79
70
76
77
51
51
Satisfied (6+)
Neutral (5)
Dissatisfied (0-4)
Council Score
Industry High
Industry Average
2015
2014
2013
2012
2011
2010
Q. How satisfied are you with...? Please give a rating out of 10, where 10 is totally satisfied and 0 is totally dissatisfied. Base: All respondents who provided a valid response, excludes ‘don’t know’ (Residents 2015 n = 277)
Access to housing that meets your needs
44
RESIDENT SATISFACTION
INDUSTRY STANDARDS
Delighted (8+)
SATISFACTION HISTORY
% of respondents
% of respondents Delighted Dissatisfied Male 48% 11% Female 53% 7% Younger singles / couples (18-34) 42% 0% Families with younger children (0-12) 53% 7% Families with older children (13+) 46% 13% Older singles / couples (35-64) 51% 10% Seniors (65+) 59% 9% Own / paying mortgage 51% 8% Rent 58% 9% Central Ward 56% 6% East Ward 52% 5% West Ward 43% 17% Disability or impairment 46% 12% Culturally and Linguistically Diverse 42% 25%
^Small sample size (n < 30) = significant variance %%
Satisfaction is relatively high.
• 79% are satisfied
• 9% are dissatisfied
Satisfaction is greater among seniors.
There is most room to improve perceptions among CALD residents.
Priority 1% Familiar 69%
NA
Industry High

. . . . . . . . . . . . . . . . . . . . . . . . . . . . . . . . . . . . .
84
9
8
84
84
78
78
71
78
49
49
Satisfied (6+)
Neutral (5)
Dissatisfied (0-4)
Council Score
Industry High
Industry Average
2015
2014
2013
2012
2011
2010
Q. How satisfied are you with...? Please give a rating out of 10, where 10 is totally satisfied and 0 is totally dissatisfied. Base: All respondents who provided a valid response, excludes ‘don’t know’ (Residents 2015 n = 401)
The general appearance of the local area
45
RESIDENT SATISFACTION
INDUSTRY STANDARDS
Delighted (8+)
SATISFACTION HISTORY
% of respondents
% of respondents Delighted Dissatisfied Male 40% 8% Female 57% 8% Younger singles / couples (18-34) 59% 6% Families with younger children (0-12) 51% 12% Families with older children (13+) 44% 6% Older singles / couples (35-64) 46% 10% Seniors (65+) 55% 5% Own / paying mortgage 46% 10% Rent 62% 2% Central Ward 51% 9% East Ward 47% 7% West Ward 47% 9% Disability or impairment 50% 7% Culturally and Linguistically Diverse 54% 0%
^Small sample size (n < 30) = significant variance %%
Satisfaction is high.
• 84% are satisfied
• 8% are dissatisfied
Satisfaction is greater among females and seniors.
Priority 19% Familiar 100%
NA
NA

. . . . . . . . . . . . . . . . . . . . . . . . . . . . . . . . . . . . .
90
7
3
59
57
90
80
79
84
79
75
57
57
Satisfied (6+)
Neutral (5)
Dissatisfied (0-4)
Council Score
Industry High
Industry Average
2015
2014
2013
2012
2011
2010
Q. How satisfied are you with...? Please give a rating out of 10, where 10 is totally satisfied and 0 is totally dissatisfied. Base: All respondents who provided a valid response, excludes ‘don’t know’ (Residents 2015 n = 312)
Graffiti removal services
46
RESIDENT SATISFACTION
INDUSTRY STANDARDS
Delighted (8+)
SATISFACTION HISTORY
% of respondents
% of respondents Delighted Dissatisfied Male 53% 4% Female 60% 3% Younger singles / couples (18-34)^ 38% 0% Families with younger children (0-12) 58% 5% Families with older children (13+) 56% 4% Older singles / couples (35-64) 55% 5% Seniors (65+) 68% 0% Own / paying mortgage 56% 3% Rent^ 79% 0% Central Ward 53% 6% East Ward 59% 3% West Ward 57% 1% Disability or impairment 60% 8% Culturally and Linguistically Diverse 73% 5%
^Small sample size (n < 30) = significant variance %%
Satisfaction is very high.
• 90% are satisfied
• 3% are dissatisfied
Satisfaction is greater among seniors, renters and CALD residents.
There is most room to improve perceptions among younger singles and couples.
▲
Priority 1% Familiar 78%

. . . . . . . . . . . . . . . . . . . . . . . . . . . . . . . . . . . . .
85
8
7
59
37
85
84
81
77
78
81
50
50
Satisfied (6+)
Neutral (5)
Dissatisfied (0-4)
Council Score
Industry High
Industry Average
2015
2014
2013
2012
2011
2010
Q. How satisfied are you with...? Please give a rating out of 10, where 10 is totally satisfied and 0 is totally dissatisfied. Base: All respondents who provided a valid response, excludes ‘don’t know’ (Residents 2015 n = 399)
Maintenance of local roads
47
RESIDENT SATISFACTION
INDUSTRY STANDARDS
Delighted (8+)
SATISFACTION HISTORY
% of respondents
% of respondents Delighted Dissatisfied Male 45% 10% Female 55% 5% Younger singles / couples (18-34) 64% 12% Families with younger children (0-12) 49% 6% Families with older children (13+) 46% 10% Older singles / couples (35-64) 42% 9% Seniors (65+) 58% 2% Own / paying mortgage 50% 7% Rent 51% 15% Central Ward 53% 6% East Ward 51% 7% West Ward 47% 10% Disability or impairment 41% 10% Culturally and Linguistically Diverse 52% 6%
^Small sample size (n < 30) = significant variance %%
Satisfaction is high.
• 85% are satisfied
• 7% are dissatisfied
Views are similar across the community.
Priority 4% Familiar 99%

. . . . . . . . . . . . . . . . . . . . . . . . . . . . . . . . . . . . .
84
10
6
56
46
84
85
82
78
79
79
51
51
Satisfied (6+)
Neutral (5)
Dissatisfied (0-4)
Council Score
Industry High
Industry Average
2015
2014
2013
2012
2011
2010
Q. How satisfied are you with...? Please give a rating out of 10, where 10 is totally satisfied and 0 is totally dissatisfied. Base: All respondents who provided a valid response, excludes ‘don’t know’ (Residents 2015 n = 394)
Street lighting
48
RESIDENT SATISFACTION
INDUSTRY STANDARDS
Delighted (8+)
SATISFACTION HISTORY
% of respondents
% of respondents Delighted Dissatisfied Male 47% 5% Female 55% 6% Younger singles / couples (18-34) 46% 0% Families with younger children (0-12) 49% 9% Families with older children (13+) 41% 7% Older singles / couples (35-64) 60% 2% Seniors (65+) 68% 7% Own / paying mortgage 53% 5% Rent 54% 8% Central Ward 55% 3% East Ward 47% 6% West Ward 53% 8% Disability or impairment 52% 9% Culturally and Linguistically Diverse 53% 10%
^Small sample size (n < 30) = significant variance %%
Satisfaction is high.
• 84% are satisfied
• 6% are dissatisfied
Satisfaction is greater among seniors.
Priority 5% Familiar 98%

. . . . . . . . . . . . . . . . . . . . . . . . . . . . . . . . . . . . .
67
14
19
53
34
67
64
62
56
63
65
31
31
Satisfied (6+)
Neutral (5)
Dissatisfied (0-4)
Council Score
Industry High
Industry Average
2015
2014
2013
2012
2011
2010
Q. How satisfied are you with...? Please give a rating out of 10, where 10 is totally satisfied and 0 is totally dissatisfied. Base: All respondents who provided a valid response, excludes ‘don’t know’ (Residents 2015 n = 386)
The management and control of traffic on local roads
49
RESIDENT SATISFACTION
INDUSTRY STANDARDS
Delighted (8+)
SATISFACTION HISTORY
% of respondents
% of respondents Delighted Dissatisfied Male 29% 20% Female 34% 17% Younger singles / couples (18-34) 35% 17% Families with younger children (0-12) 26% 23% Families with older children (13+) 32% 14% Older singles / couples (35-64) 31% 23% Seniors (65+) 34% 13% Own / paying mortgage 32% 20% Rent^ 30% 12% Central Ward 31% 20% East Ward 27% 22% West Ward 38% 14% Disability or impairment 41% 23% Culturally and Linguistically Diverse 50% 12%
^Small sample size (n < 30) = significant variance %%
Satisfaction is moderate, and trending up.
• 67% are satisfied
• 19% are dissatisfied
Satisfaction is greater among CALD residents.
There is most room to improve perceptions among families with younger children, older singles and couples, those with a disability, and those in the Central and East Wards.
Priority 26% Familiar 96%

. . . . . . . . . . . . . . . . . . . . . . . . . . . . . . . . . . . . .
94
3
4
76
58
94
91
87
89
86
88
66
66
Satisfied (6+)
Neutral (5)
Dissatisfied (0-4)
Council Score
Industry High
Industry Average
2015
2014
2013
2012
2011
2010
Q. How satisfied are you with...? Please give a rating out of 10, where 10 is totally satisfied and 0 is totally dissatisfied. Base: All respondents who provided a valid response, excludes ‘don’t know’ (Residents 2015 n = 392)
Parks and playgrounds
50
RESIDENT SATISFACTION
INDUSTRY STANDARDS
Delighted (8+)
SATISFACTION HISTORY
% of respondents
% of respondents Delighted Dissatisfied Male 65% 4% Female 67% 4% Younger singles / couples (18-34) 71% 0% Families with younger children (0-12) 66% 7% Families with older children (13+) 61% 2% Older singles / couples (35-64) 65% 6% Seniors (65+) 74% 1% Own / paying mortgage 66% 4% Rent 59% 10% Central Ward 67% 4% East Ward 64% 4% West Ward 66% 3% Disability or impairment 63% 2% Culturally and Linguistically Diverse 64% 4%
^Small sample size (n < 30) = significant variance %%
Satisfaction is very high, and trending up.
• 94% are satisfied
• 4% are dissatisfied
Views are similar across the community.
Priority 9% Familiar 97%

. . . . . . . . . . . . . . . . . . . . . . . . . . . . . . . . . . . . .
91
6
4
76
58
91
93
87
89
86
88
67
67
Satisfied (6+)
Neutral (5)
Dissatisfied (0-4)
Council Score
Industry High
Industry Average
2015
2014
2013
2012
2011
2010
Q. How satisfied are you with...? Please give a rating out of 10, where 10 is totally satisfied and 0 is totally dissatisfied. Base: All respondents who provided a valid response, excludes ‘don’t know’ (Residents 2015 n = 366)
Sporting ovals
51
RESIDENT SATISFACTION
INDUSTRY STANDARDS
Delighted (8+)
SATISFACTION HISTORY
% of respondents
% of respondents Delighted Dissatisfied Male 63% 3% Female 71% 5% Younger singles / couples (18-34) 67% 0% Families with younger children (0-12) 74% 4% Families with older children (13+) 61% 3% Older singles / couples (35-64) 65% 5% Seniors (65+) 68% 2% Own / paying mortgage 67% 4% Rent 71% 4% Central Ward 68% 5% East Ward 66% 3% West Ward 67% 3% Disability or impairment 62% 2% Culturally and Linguistically Diverse 77% 7%
^Small sample size (n < 30) = significant variance %%
Satisfaction is very high.
• 91% are satisfied
• 4% are dissatisfied
Views are similar across the community.
Priority 2% Familiar 91%
. . . . . . . . . . . . . . . . . . . . . . . . . . . . . . . . . . . . .
82
8
11
52
37
82
78
74
71
42
42
Satisfied (6+)
Neutral (5)
Dissatisfied (0-4)
Council Score
Industry High
Industry Average
2015
2014
2013
2012
2011
2010
Q. How satisfied are you with...? Please give a rating out of 10, where 10 is totally satisfied and 0 is totally dissatisfied. Base: All respondents who provided a valid response, excludes ‘don’t know’ (Residents 2015 n = 378)
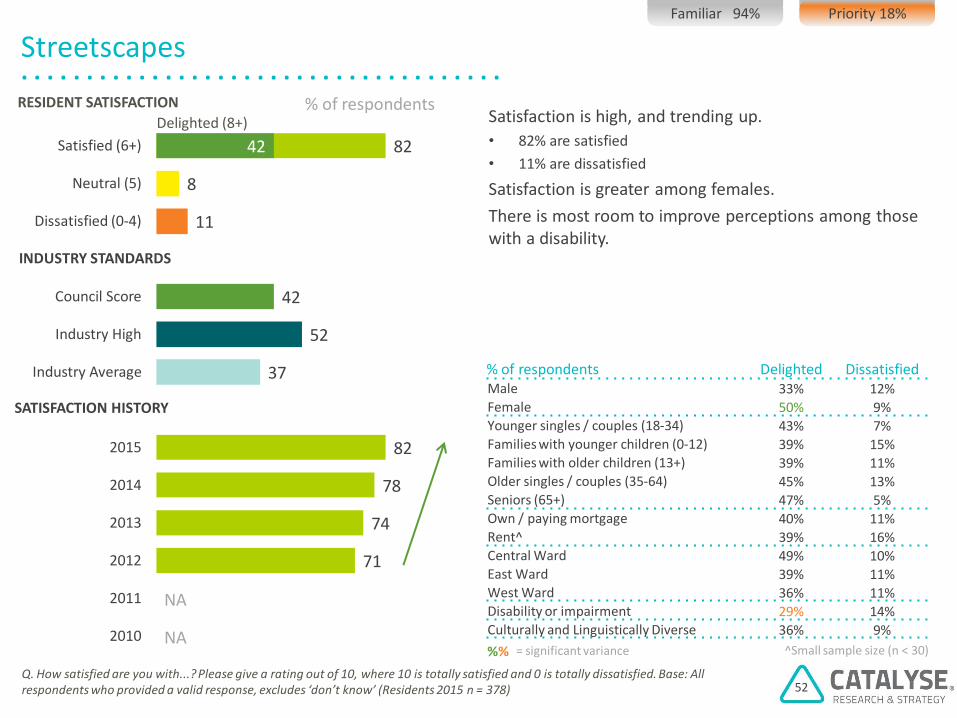
Streetscapes
52
RESIDENT SATISFACTION
INDUSTRY STANDARDS
Delighted (8+)
SATISFACTION HISTORY
% of respondents
% of respondents Delighted Dissatisfied Male 33% 12% Female 50% 9% Younger singles / couples (18-34) 43% 7% Families with younger children (0-12) 39% 15% Families with older children (13+) 39% 11% Older singles / couples (35-64) 45% 13% Seniors (65+) 47% 5% Own / paying mortgage 40% 11% Rent^ 39% 16% Central Ward 49% 10% East Ward 39% 11% West Ward 36% 11% Disability or impairment 29% 14% Culturally and Linguistically Diverse 36% 9%
^Small sample size (n < 30) = significant variance %%
Satisfaction is high, and trending up.
• 82% are satisfied
• 11% are dissatisfied
Satisfaction is greater among females.
There is most room to improve perceptions among those with a disability.
Priority 18% Familiar 94%
NA
NA

. . . . . . . . . . . . . . . . . . . . . . . . . . . . . . . . . . . . .
83
9
8
55
34
83
75
71
72
70
71
43
43
Satisfied (6+)
Neutral (5)
Dissatisfied (0-4)
Council Score
Industry High
Industry Average
2015
2014
2013
2012
2011
2010
Q. How satisfied are you with...? Please give a rating out of 10, where 10 is totally satisfied and 0 is totally dissatisfied. Base: All respondents who provided a valid response, excludes ‘don’t know’ (Residents 2015 n = 330)
Community buildings, halls and toilets
53
RESIDENT SATISFACTION
INDUSTRY STANDARDS
Delighted (8+)
SATISFACTION HISTORY
% of respondents
% of respondents Delighted Dissatisfied Male 38% 5% Female 48% 11% Younger singles / couples (18-34)^ 47% 0% Families with younger children (0-12) 40% 11% Families with older children (13+) 41% 9% Older singles / couples (35-64) 45% 3% Seniors (65+) 49% 6% Own / paying mortgage 41% 8% Rent^ 51% 13% Central Ward 45% 8% East Ward 47% 4% West Ward 36% 13% Disability or impairment 42% 21% Culturally and Linguistically Diverse 42% 8%
^Small sample size (n < 30) = significant variance %%
Satisfaction is high, up significantly by 8% points.
• 83% are satisfied
• 8% are dissatisfied
Satisfaction is greater among females.
There is most room to improve perceptions among those with a disability, and in the West Ward.
▲
Priority 5% Familiar 82%
. . . . . . . . . . . . . . . . . . . . . . . . . . . . . . . . . . . . .
80
7
14
77
51
80
76
79
64
59
53
53
Satisfied (6+)
Neutral (5)
Dissatisfied (0-4)
Council Score
Industry High
Industry Average
2015
2014
2013
2012
2011
2010
Q. How satisfied are you with...? Please give a rating out of 10, where 10 is totally satisfied and 0 is totally dissatisfied. Base: All respondents who provided a valid response, excludes ‘don’t know’ (Residents 2015 n = 382)
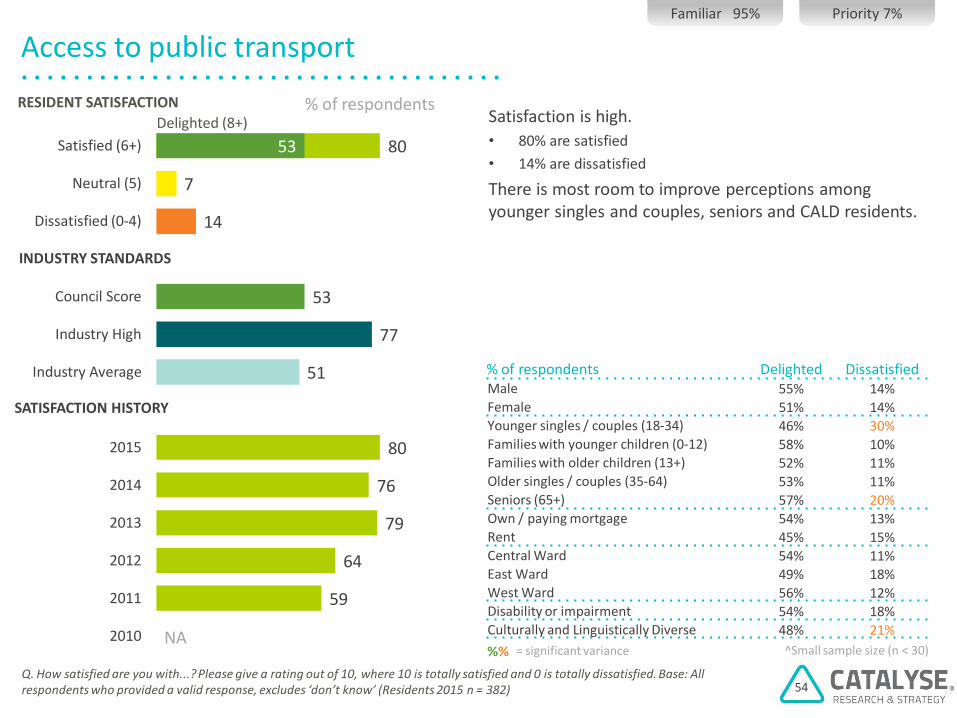
Access to public transport
54
RESIDENT SATISFACTION
INDUSTRY STANDARDS
Delighted (8+)
SATISFACTION HISTORY
% of respondents
% of respondents Delighted Dissatisfied Male 55% 14% Female 51% 14% Younger singles / couples (18-34) 46% 30% Families with younger children (0-12) 58% 10% Families with older children (13+) 52% 11% Older singles / couples (35-64) 53% 11% Seniors (65+) 57% 20% Own / paying mortgage 54% 13% Rent 45% 15% Central Ward 54% 11% East Ward 49% 18% West Ward 56% 12% Disability or impairment 54% 18% Culturally and Linguistically Diverse 48% 21%
^Small sample size (n < 30) = significant variance %%
Satisfaction is high.
• 80% are satisfied
• 14% are dissatisfied
There is most room to improve perceptions among younger singles and couples, seniors and CALD residents.
Priority 7% Familiar 95%
NA

. . . . . . . . . . . . . . . . . . . . . . . . . . . . . . . . . . . . .
82
7
11
52
38
82
80
81
74
77
77
46
46
Satisfied (6+)
Neutral (5)
Dissatisfied (0-4)
Council Score
Industry High
Industry Average
2015
2014
2013
2012
2011
2010
Q. How satisfied are you with...? Please give a rating out of 10, where 10 is totally satisfied and 0 is totally dissatisfied. Base: All respondents who provided a valid response, excludes ‘don’t know’ (Residents 2015 n = 393)
Footpaths and cycleways
55
RESIDENT SATISFACTION
INDUSTRY STANDARDS
Delighted (8+)
SATISFACTION HISTORY
% of respondents
% of respondents Delighted Dissatisfied Male 42% 14% Female 51% 7% Younger singles / couples (18-34) 46% 19% Families with younger children (0-12) 44% 14% Families with older children (13+) 40% 8% Older singles / couples (35-64) 51% 12% Seniors (65+) 56% 4% Own / paying mortgage 48% 11% Rent 42% 17% Central Ward 48% 7% East Ward 46% 16% West Ward 45% 9% Disability or impairment 48% 18% Culturally and Linguistically Diverse 50% 13%
^Small sample size (n < 30) = significant variance %%
Satisfaction is high.
• 82% are satisfied
• 11% are dissatisfied
There is most room to improve perceptions among younger singles and couples, those with a disability, and in the East Ward.
Priority 8% Familiar 98%

Social
56

. . . . . . . . . . . . . . . . . . . . . . . . . . . . . . . . . . . . .
82
10
8
45
27
82
77
73
71
70
70
42
42
Satisfied (6+)
Neutral (5)
Dissatisfied (0-4)
Council Score
Industry High
Industry Average
2015
2014
2013
2012
2011
2010
Q. How satisfied are you with...? Please give a rating out of 10, where 10 is totally satisfied and 0 is totally dissatisfied. Base: All respondents who provided a valid response, excludes ‘don’t know’ (Residents 2015 n = 311)
Facilities and services for youth
57
RESIDENT SATISFACTION
INDUSTRY STANDARDS
Delighted (8+)
SATISFACTION HISTORY
% of respondents
% of respondents Delighted Dissatisfied Male 36% 6% Female 49% 9% Younger singles / couples (18-34)^ 49% 8% Families with younger children (0-12) 37% 9% Families with older children (13+) 39% 8% Older singles / couples (35-64) 38% 5% Seniors (65+) 60% 6% Own / paying mortgage 40% 9% Rent^ 56% 9% Central Ward 52% 7% East Ward 43% 8% West Ward 30% 9% Disability or impairment 36% 14% Culturally and Linguistically Diverse 38% 15%
^Small sample size (n < 30) = significant variance %%
Satisfaction is high, and trending up.
• 82% are satisfied
• 8% are dissatisfied
Satisfaction is greater among seniors, females, renters and those in the Central Ward.
There is most room to improve perceptions among those in the West Ward.
Priority 4% Familiar 77%

. . . . . . . . . . . . . . . . . . . . . . . . . . . . . . . . . . . . .
89
7
5
53
37
89
85
83
79
53
53
Satisfied (6+)
Neutral (5)
Dissatisfied (0-4)
Council Score
Industry High
Industry Average
2015
2014
2013
2012
2011
2010
Q. How satisfied are you with...? Please give a rating out of 10, where 10 is totally satisfied and 0 is totally dissatisfied. Base: All respondents who provided a valid response, excludes ‘don’t know’ (Residents 2015 n = 332)
Facilities and services for families and children
58
RESIDENT SATISFACTION
INDUSTRY STANDARDS
Delighted (8+)
SATISFACTION HISTORY
% of respondents
% of respondents Delighted Dissatisfied Male 46% 5% Female 60% 4% Younger singles / couples (18-34)^ 64% 0% Families with younger children (0-12) 56% 7% Families with older children (13+) 49% 7% Older singles / couples (35-64) 47% 3% Seniors (65+) 60% 0% Own / paying mortgage 51% 5% Rent^ 63% 12% Central Ward 51% 2% East Ward 55% 4% West Ward 51% 8% Disability or impairment 50% 2% Culturally and Linguistically Diverse 59% 7%
^Small sample size (n < 30) = significant variance %%
Satisfaction is high, and trending up.
• 89% are satisfied
• 5% are dissatisfied
Satisfaction is greater among females, younger singles and couples, and seniors.
Priority 4% Familiar 83%
NA
NA
Industry High

. . . . . . . . . . . . . . . . . . . . . . . . . . . . . . . . . . . . .
85
11
4
57
41
85
83
76
74
72
77
57
57
Satisfied (6+)
Neutral (5)
Dissatisfied (0-4)
Council Score
Industry High
Industry Average
2015
2014
2013
2012
2011
2010
Q. How satisfied are you with...? Please give a rating out of 10, where 10 is totally satisfied and 0 is totally dissatisfied. Base: All respondents who provided a valid response, excludes ‘don’t know’ (Residents 2015 n = 235)
Facilities, services and care available for seniors
59
RESIDENT SATISFACTION
INDUSTRY STANDARDS
Delighted (8+)
SATISFACTION HISTORY
% of respondents
% of respondents Delighted Dissatisfied Male 51% 3% Female 62% 5% Younger singles / couples (18-34)^ 58% 13% Families with younger children (0-12) 56% 2% Families with older children (13+) 50% 6% Older singles / couples (35-64) 52% 2% Seniors (65+) 72% 2% Own / paying mortgage 57% 4% Rent^ 63% 0% Central Ward 57% 3% East Ward 52% 9% West Ward 62% 0% Disability or impairment 49% 8% Culturally and Linguistically Diverse^ 50% 8%
^Small sample size (n < 30) = significant variance %%
Satisfaction is high, and trending up.
• 85% are satisfied
• 4% are dissatisfied
Satisfaction is greater among seniors.
Priority 0% Familiar 58%
Industry High

. . . . . . . . . . . . . . . . . . . . . . . . . . . . . . . . . . . . .
80
11
8
51
33
80
76
71
65
71
74
45
45
Satisfied (6+)
Neutral (5)
Dissatisfied (0-4)
Council Score
Industry High
Industry Average
2015
2014
2013
2012
2011
2010
Q. How satisfied are you with...? Please give a rating out of 10, where 10 is totally satisfied and 0 is totally dissatisfied. Base: All respondents who provided a valid response, excludes ‘don’t know’ (Residents 2015 n = 223)
Access to services and facilities for people with disabilities
60
RESIDENT SATISFACTION
INDUSTRY STANDARDS
Delighted (8+)
SATISFACTION HISTORY
% of respondents
% of respondents Delighted Dissatisfied Male 46% 3% Female 45% 13% Younger singles / couples (18-34)^ 66% 0% Families with younger children (0-12) 42% 10% Families with older children (13+) 42% 9% Older singles / couples (35-64) 43% 9% Seniors (65+) 50% 7% Own / paying mortgage 41% 9% Rent^ 41% 10% Central Ward 47% 8% East Ward 49% 8% West Ward 39% 8% Disability or impairment 35% 19% Culturally and Linguistically Diverse^ 40% 10%
^Small sample size (n < 30) = significant variance %%
Satisfaction is high, and trending up.
• 80% are satisfied
• 8% are dissatisfied
There is most room to improve perceptions among those with a disability and females.
Priority 2% Familiar 55%

. . . . . . . . . . . . . . . . . . . . . . . . . . . . . . . . . . . . .
67
33
1
Yes
No
Unsure
Q. Were you aware that a new integrated health facility has opened up in Cockburn Central, offering a range of medical, health and social services, a new library and café? Base: All respondents (2015 n = 402)
Awareness of the integrated health facility
61
% of respondents
Were you aware that a new integrated health facility has opened up in Cockburn Central, offering a range of medical, health and social services, a new library and café?
67% of respondents were aware that a new integrated health facility had opened up in Cockburn Central, offering a range of medical, health and social services, a new library and café.
Awareness is higher among females, those with a disability, those who have seen the City’s Update and those who have received a calendar.
Awareness is lower among younger singles and couples, CALD residents and in the West Ward.
^Small sample size (n < 30) = significant variance %%
% of respondents Aware health facility Seen City’s Update 79%
Have not seen City’s Update 55%
Received calendar 74%
Have not received calendar 64%
Male 60%
Female 73%
Younger singles / couples (18-34) 41%
Families with younger children (0-12) 72%
Families with older children (13+) 64%
Older singles / couples (35-64) 69%
Seniors (65+) 73%
Own / paying mortgage 69%
Rent 66%
Central Ward 68%
East Ward 75%
West Ward 54%
Disability or impairment 79%
Culturally and Linguistically Diverse 53%

. . . . . . . . . . . . . . . . . . . . . . . . . . . . . . . . . . . . .
80
10
10
45
39
80
80
77
45
45
Satisfied (6+)
Neutral (5)
Dissatisfied (0-4)
Council Score
Industry High
Industry Average
2015
2014
2013
2012
2011
2010
Q. How satisfied are you with...? Please give a rating out of 10, where 10 is totally satisfied and 0 is totally dissatisfied. Base: All respondents who provided a valid response, excludes ‘don’t know’ (Residents 2015 n = 353)
Opportunities to be included and connected to your community
62
RESIDENT SATISFACTION
INDUSTRY STANDARDS
Delighted (8+)
SATISFACTION HISTORY
% of respondents
% of respondents Delighted Dissatisfied Male 37% 10% Female 53% 11% Younger singles / couples (18-34)^ 50% 7% Families with younger children (0-12) 51% 10% Families with older children (13+) 38% 12% Older singles / couples (35-64) 43% 10% Seniors (65+) 52% 6% Own / paying mortgage 46% 10% Rent^ 53% 17% Central Ward 52% 8% East Ward 38% 14% West Ward 45% 9% Disability or impairment 51% 14% Culturally and Linguistically Diverse 36% 16%
^Small sample size (n < 30) = significant variance %%
Satisfaction is high.
• 80% are satisfied
• 10% are dissatisfied
Satisfaction is greater among females.
There is most room to improve perceptions among families with older children, CALD residents and those living in the East Ward.
Priority 0% Familiar 88%
NA
NA
NA
Industry High

. . . . . . . . . . . . . . . . . . . . . . . . . . . . . . . . . . . . .
88
7
5
72
52
88
87
86
81
79
75
58
58
Satisfied (6+)
Neutral (5)
Dissatisfied (0-4)
Council Score
Industry High
Industry Average
2015
2014
2013
2012
2011
2010
Q. How satisfied are you with...? Please give a rating out of 10, where 10 is totally satisfied and 0 is totally dissatisfied. Base: All respondents who provided a valid response, excludes ‘don’t know’ (Residents 2015 n = 364)
Sport and recreation facilities
63
RESIDENT SATISFACTION
INDUSTRY STANDARDS
Delighted (8+)
SATISFACTION HISTORY
% of respondents
% of respondents Delighted Dissatisfied Male 56% 5% Female 60% 5% Younger singles / couples (18-34) 47% 6% Families with younger children (0-12) 53% 9% Families with older children (13+) 56% 4% Older singles / couples (35-64) 61% 5% Seniors (65+) 67% 1% Own / paying mortgage 59% 6% Rent^ 59% 4% Central Ward 68% 3% East Ward 57% 7% West Ward 47% 5% Disability or impairment 54% 4% Culturally and Linguistically Diverse 55% 0%
^Small sample size (n < 30) = significant variance %%
Satisfaction is high.
• 88% are satisfied
• 5% are dissatisfied
Satisfaction is greater among seniors and those in the Central Ward.
There is most room to improve perceptions among younger singles and couples, and those in the West Ward.
Priority 3% Familiar 90%

. . . . . . . . . . . . . . . . . . . . . . . . . . . . . . . . . . . . .
94
4
2
74
60
94
90
89
90
92
67
67
Satisfied (6+)
Neutral (5)
Dissatisfied (0-4)
Council Score
Industry High
Industry Average
2015
2014
2013
2012
2011
2010
Q. How satisfied are you with...? Please give a rating out of 10, where 10 is totally satisfied and 0 is totally dissatisfied. Base: All respondents who provided a valid response, excludes ‘don’t know’ (Residents 2015 n = 321)
Library and information services
64
RESIDENT SATISFACTION
INDUSTRY STANDARDS
Delighted (8+)
SATISFACTION HISTORY
% of respondents
% of respondents Delighted Dissatisfied Male 59% 2% Female 74% 2% Younger singles / couples (18-34)^ 50% 0% Families with younger children (0-12) 72% 1% Families with older children (13+) 63% 2% Older singles / couples (35-64) 69% 2% Seniors (65+) 76% 3% Own / paying mortgage 66% 2% Rent^ 84% 3% Central Ward 74% 1% East Ward 61% 3% West Ward 67% 2% Disability or impairment 73% 2% Culturally and Linguistically Diverse 72% 0%
^Small sample size (n < 30) = significant variance %%
Satisfaction is very high.
• 94% are satisfied
• 2% are dissatisfied
Satisfaction is greater among females, families with younger children, seniors, renters, those with a disability, CALD residents and those in the Central Ward.
Priority 1% Familiar 80%
NA

. . . . . . . . . . . . . . . . . . . . . . . . . . . . . . . . . . . . .
83
9
7
62
43
83
77
82
75
77
86
50
50
Satisfied (6+)
Neutral (5)
Dissatisfied (0-4)
Council Score
Industry High
Industry Average
2015
2014
2013
2012
2011
2010
Q. How satisfied are you with...? Please give a rating out of 10, where 10 is totally satisfied and 0 is totally dissatisfied. Base: All respondents who provided a valid response, excludes ‘don’t know’ (Residents 2015 n = 360)
Festivals, events and cultural activities
65
RESIDENT SATISFACTION
INDUSTRY STANDARDS
Delighted (8+)
SATISFACTION HISTORY
% of respondents
% of respondents Delighted Dissatisfied Male 41% 9% Female 60% 6% Younger singles / couples (18-34) 32% 0% Families with younger children (0-12) 63% 6% Families with older children (13+) 36% 13% Older singles / couples (35-64) 60% 7% Seniors (65+) 61% 0% Own / paying mortgage 53% 8% Rent^ 60% 0% Central Ward 53% 11% East Ward 49% 5% West Ward 50% 7% Disability or impairment 44% 12% Culturally and Linguistically Diverse 45% 7%
^Small sample size (n < 30) = significant variance %%
Satisfaction is high, up significantly by 6% points.
• 83% are satisfied
• 7% are dissatisfied
Satisfaction is greater among females.
There is most room to improve perceptions among younger singles and couples, and families with older children.
▲
Priority 1% Familiar 89%
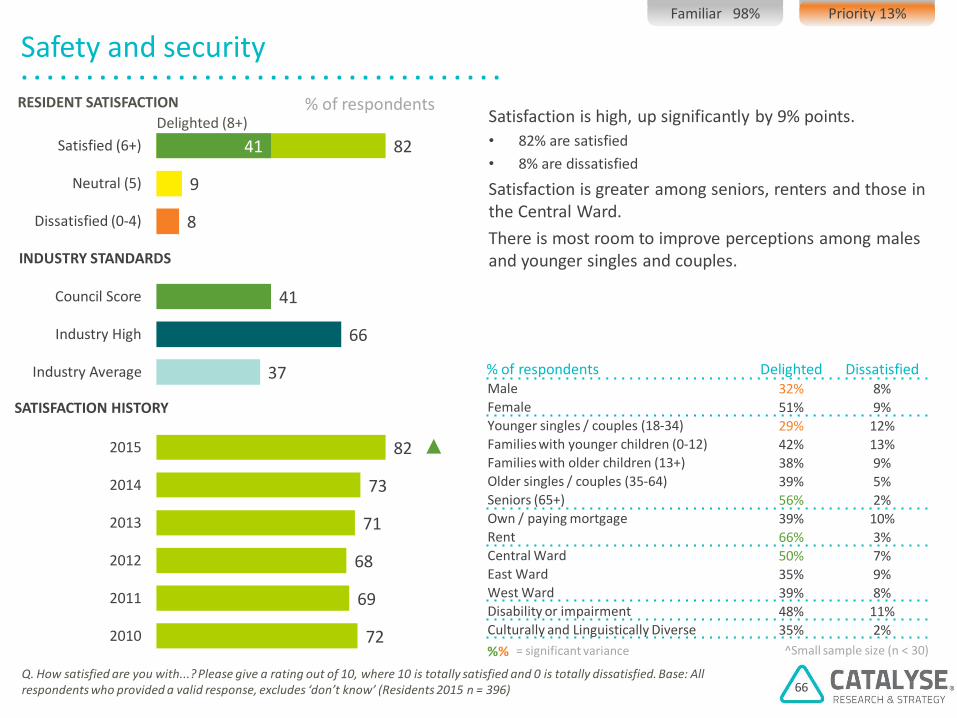
. . . . . . . . . . . . . . . . . . . . . . . . . . . . . . . . . . . . .
82
9
8
66
37
82
73
71
68
69
72
41
41
Satisfied (6+)
Neutral (5)
Dissatisfied (0-4)
Council Score
Industry High
Industry Average
2015
2014
2013
2012
2011
2010
Q. How satisfied are you with...? Please give a rating out of 10, where 10 is totally satisfied and 0 is totally dissatisfied. Base: All respondents who provided a valid response, excludes ‘don’t know’ (Residents 2015 n = 396)
Safety and security
66
RESIDENT SATISFACTION
INDUSTRY STANDARDS
Delighted (8+)
SATISFACTION HISTORY
% of respondents
% of respondents Delighted Dissatisfied Male 32% 8% Female 51% 9% Younger singles / couples (18-34) 29% 12% Families with younger children (0-12) 42% 13% Families with older children (13+) 38% 9% Older singles / couples (35-64) 39% 5% Seniors (65+) 56% 2% Own / paying mortgage 39% 10% Rent 66% 3% Central Ward 50% 7% East Ward 35% 9% West Ward 39% 8% Disability or impairment 48% 11% Culturally and Linguistically Diverse 35% 2%
^Small sample size (n < 30) = significant variance %%
Satisfaction is high, up significantly by 9% points.
• 82% are satisfied
• 8% are dissatisfied
Satisfaction is greater among seniors, renters and those in the Central Ward.
There is most room to improve perceptions among males and younger singles and couples.
▲
Priority 13% Familiar 98%

. . . . . . . . . . . . . . . . . . . . . . . . . . . . . . . . . . . . .
71
11
18
71
73
71
67
66
54
42
42
Satisfied (6+)
Neutral (5)
Dissatisfied (0-4)
Council Score
Industry High
Industry Average
2015
2014
2013
2012
2011
2010
Q. How satisfied are you with...? Please give a rating out of 10, where 10 is totally satisfied and 0 is totally dissatisfied. Base: All respondents who provided a valid response, excludes ‘don’t know’ (Residents 2015 n = 353)
Mobile security patrols
67
RESIDENT SATISFACTION
INDUSTRY STANDARDS
Delighted (8+)
SATISFACTION HISTORY
% of respondents
% of respondents Delighted Dissatisfied Male 39% 19% Female 45% 18% Younger singles / couples (18-34) 50% 19% Families with younger children (0-12) 45% 20% Families with older children (13+) 39% 22% Older singles / couples (35-64) 38% 13% Seniors (65+) 43% 15% Own / paying mortgage 41% 19% Rent^ 50% 12% Central Ward 48% 13% East Ward 44% 17% West Ward 31% 27% Disability or impairment 34% 26% Culturally and Linguistically Diverse 41% 14%
^Small sample size (n < 30) = significant variance %%
Satisfaction is relatively high.
• 71% are satisfied
• 18% are dissatisfied
There is most room to improve perceptions among those with a disability, and in the West Ward.
Priority 12% Familiar 88%
NA
NA

. . . . . . . . . . . . . . . . . . . . . . . . . . . . . . . . . . . . .
83
15 Yes
No
Unsure
Q. Are you aware of CoSafe, the mobile security patrol that operates in the City of Cockburn? Base: Those who provided a valid response (2011 n = 401; 2012 n = 400; 2013 n = 401; 2014 n = 401; 2015 n = 402)
Awareness of CoSafe
68
% of respondents
Are you aware of CoSafe, the mobile security patrol that operates in the City of Cockburn?
50
79 74 86 83
2011 2012 2013 2014 2015
HISTORY: % seen or read
83% are aware of CoSafe.
There is most room to improve awareness in the East Ward and among CALD residents.
^Small sample size (n < 30) = significant variance %%
% of respondents Aware CoSafe Male 83% Female 84% Younger singles / couples (18-34) 81% Families with younger children (0-12) 84% Families with older children (13+) 82% Older singles / couples (35-64) 88% Seniors (65+) 81% Own / paying mortgage 85% Rent 80% Central Ward 89% East Ward 79% West Ward 83% Disability or impairment 84% Culturally and Linguistically Diverse 70%

CATALYSE® empowering decision makers © 2015
CATALYSE® Pty Ltd ABN 20 108 620 855 a: Office 3, 996 Hay Street,
Perth WA 6000 p: PO Box 8007,
Cloisters Square WA 6850 t: +618 9226 5674 f: +618 9226 5676 e: [email protected] w: catalyse.com.au

CATALYSE is proud to support Indigenous artists.
“Fireworks” is the exciting work of Yinjaa-Barni Artist, Maudie Jerrold.
Yinjaa-Barni Artists are traditional owners from the Fortescue River region. Their paintings
depict the remarkable country of the Pilbara in Western Australia's north-west. The contrasts
of the harsh environment with the hidden gorges of cool water, the seeds and flowers
bursting out after rain, are moments that belong to the great Creation stories of the Marrga.
Other works may be viewed at the Japingka Gallery in Fremantle [www.japingka.com.au].