city of conway, comprehensive plan the housing element element... · the housing element of the...
TRANSCRIPT

City of Conway, Comprehensive Plan
The Housing Element
The Housing Element of the City of Conway’s
Comprehensive Plan includes an analysis of existing
housing by location, type, age, condition, owner and
renter occupancy, affordability, and projections of
housing needs to accommodate existing and future
population as identified in the Population and Economic
Development elements.
The City of Conway has a very diverse stock of housing
options including century-old historic homes, apartment
communities, student housing, assisted living and nursing
homes, and new housing stock at a variety of price points.
This wealth of housing choice accommodates all ages
and income levels.
Housing Inventory and Trends
Older neighborhoods have remained stable for the
majority of areas in Conway. During the housing crises
and recession that followed, housing prices in these
neighborhoods were affected, but not as much as
newer neighborhoods were. Prior to the recession,
multiple subdivisions along the outskirts of the City
were planned and approved, but remained largely
unbuilt as a result of the downfall in the housing
industry. Since 2014, a major rebound has occurred
and nearly all of these subdivisions are now built out.
During the fall of 2016, housing permitting reached all
time high levels, without signs of a market driven
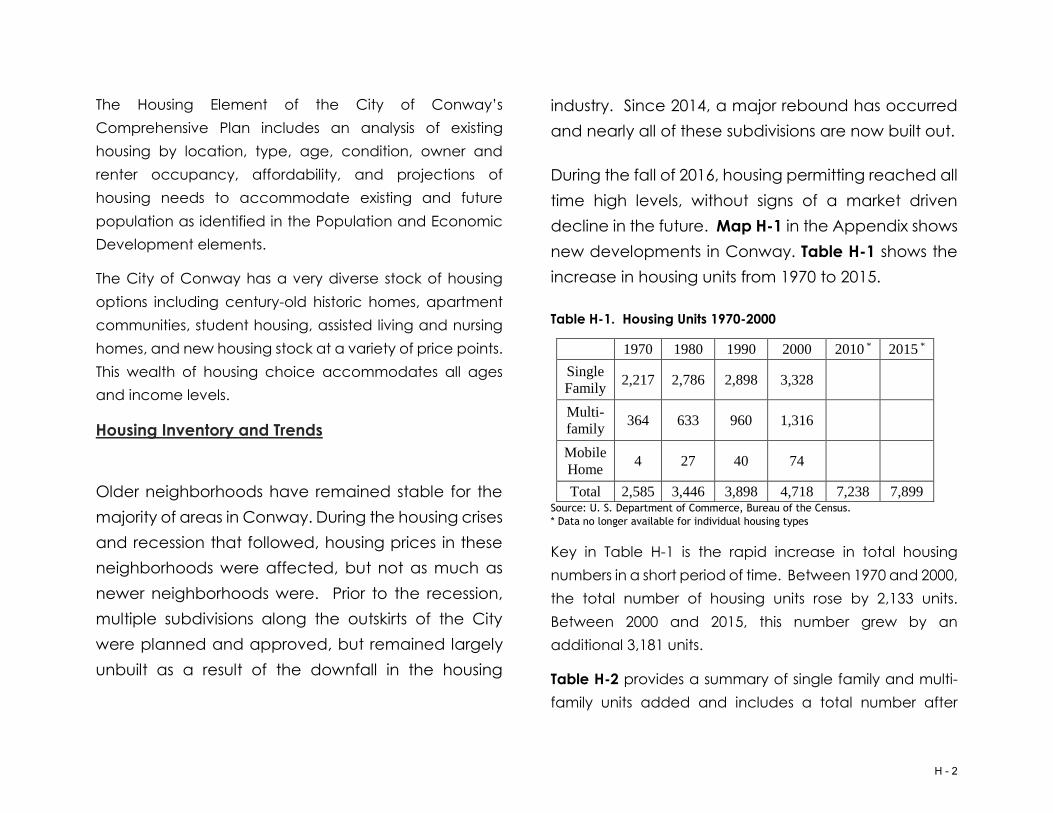
decline in the future. Map H-1 in the Appendix shows
new developments in Conway. Table H-1 shows the
increase in housing units from 1970 to 2015.
Table H-1. Housing Units 1970-2000
1970 1980 1990 2000 2010 * 2015 *
Single
Family 2,217 2,786 2,898 3,328
Multi-
family 364 633 960 1,316
Mobile
Home 4 27 40 74
Total 2,585 3,446 3,898 4,718 7,238 7,899 Source: U. S. Department of Commerce, Bureau of the Census.
* Data no longer available for individual housing types
Key in Table H-1 is the rapid increase in total housing
numbers in a short period of time. Between 1970 and 2000,
the total number of housing units rose by 2,133 units.
Between 2000 and 2015, this number grew by an
additional 3,181 units.
Table H-2 provides a summary of single family and multi-
family units added and includes a total number after
H - 2

subtracting the units demolished for years 2000 through
2015. The percentage change over this time period is also
shown.
Table H-2. New Housing Units Added 2000-2016 Year Units New
Units
Single
Family
New
Units
Multi-
Family
Demolished Total %
Change
2000 4,718 58 64 29 4,811 2.0
2001 4,811 50 78 41 4,898 1.8
2002 4,898 73 190 23 5,138 4.8
2003 5,138 91 160 24 5,365 4.4
2004 5,365 103 8 23 5,453 1.6
2005 5,453 163 215 1 5,830 6.9
2006 5,830 259 213 10 6,292 7.9
2007 6,292 91 121 1 6 6,498 3.2
2008 6,498 82 87 13 6,654 2.4
2009 6,654 83 48 2 8 6,777 1.8
2010 6,777 71 6 10 6,844 1
2011 6,844 45 120 3 8 7,001 2.2
2012 7,001 28 0 22 7,007 .09
2013 7,007 150 143 4 13 7,287 3.9
2014 7,287 193 58 5 9 7,529 3.3
2015 7,529 252 2 7 7,776 3.2
2016 7,776 380 4 8 8,152 4.5 Source: Conway Building Department, 2017
(1) 108 units student housing
(2) 16 units student housing
(3) 120 units student housing
(4) 143 units student housing
(5) 58 units student housing
More single family homes were permitted in 2016
than in any year since the housing crisis began in the
mid-2000s. In fact, 121 more single family homes
were permitted in 2016 than in 2006, the former
peak of the single family market. This represents an
increase in nearly 32% in 2016 in yearly comparisons
over the former peak and a 4.5% increase since
2015 in overall housing units.
The rapid growth of Coastal Carolina University and
Horry Georgetown Technical College has also led to
an increased demand for student housing. While
this is classified as multi-family housing, it has a
distinctly different impact on the surrounding areas.
As CCU and HGTC continue to expand and improve
their educational opportunities, their enrollment also
continues to grow, causing more demand for this
type of housing.
Household Types
A healthy housing market is exemplified by a variety
of housing types. This variety is detailed in Table H-3
shown below. Single-family homes are the most
common housing type in Conway with 5,215 of the
H - 3

7,804 housing units being 1unit detached structures.
Despite single-family homes being the most
prevalent, this percentage of overall housing
decreased from 2000 to 2014 by 3.7% (from 70.5% to
66.8%). Mobile Homes, which are not permitted in the
City of Conway, decreased by 44 units during this
same time period. Multi-family units increased from
1,316 to 2,559 units. The addition of student housing
developments supporting Coastal Carolina University
is largely responsible for this increase.
Table H-3. Units by Type of Structure 1990-2014
1990 % of
total
2000 % of
total
2014 % of
total
1,
detached
2898 74.4 3,328 70.5 5,215 66.8
1,
attached
59 1.5 109 2.3 261 3.3
2 268 6.9 306 6.5 272 3.5
3 or 4 258 6.6 442 9.4 513 6.6
5 to 9 313 8.0 265 5.6 922 11.8
10 or
more
62 1.6 194 4.1
10-19 384 4.9
20 or
more
207 2.7
Mobile
Home
40 1.0 74 1.6 30 0.4
Source: U. S. Department of Commerce, Bureau of the Census: 1990, 2000, 2014
Graphic H-1. Housing Type by Percentage
Occupancy
Although the number of owner occupied units has
risen in number, the overall percentage of owner
occupied units has dropped. Table H-4 outlines the
occupancy data for 2000 through 2014. Graph H-2
illustrates occupancy from 1980 through 2014.
Single Family, 70.10%
Multi-Family, 29.50%
Mobile Homes, 0.40%
H - 4

Table H-4. Occupancy 2000 – 2014
2000 % 2010 % 2014 %
Owner Occupied Units
2,589 60.8 3,791 59.5 3,820 58
Renter Occupied Units
1,670 39.2 2,584 40.5 2,791 42
Total Occupied Units
4,259 100 6,375 100 6,611 100
Source: U. S. Department of Commerce, Bureau of the Census and the S. C.
Office of Statistics and Research
Graphic H-2. Occupancy 1980 - 2014
Source: U. S. Department of Commerce, Bureau of the Census and the S. C.
Office of Statistics and Research
A further discussion on Occupancy of Housing units
concerns vacancy rates. Vacant housing units create
numerous problems for a community: increased
likelihood of criminal activity, a source of dilapidation
and decay, property maintenance issues, and dark spots
in neighborhoods (unlit street-fronts that invite crime).
Table H-5 details the increasing vacancy rates in
Conway, which has risen from 6.8% in 1980 to 14% in 2010.
2178 23222589
3791 3820
1268 13331670
25842791
1980 1990 2000 2010 2014
Owner Occupied Renter Occupied
H - 5

Table H-5. Vacancy, 1980-2000
1980 1990 2000 2010
Vacant Units 184 243 524 1,017
Vacancy Rate 6.8% 8.4% 11% 14%
Renter
Occupied
5.3% 7.0% 4.7%
Owner
Occupied
1.5% 1.4% 1.6%
Source: U. S. Department of Commerce, Bureau of the Census: 1980,1990, 2000, 2010
Age and Condition
Table H-6 and the accompanying Graphic H-3 illustrate
the age of housing stock in the City of Conway. Although
the City has a proud historic core with many grand historic
homes, including the National Register listed
Conwayborough Neighborhood, the majority of the
homes in Conway are newer, being built in the last twenty-
five years (4,495 units, 50.2%).
Table H-6. Age Distribution of Housing Stock
Year # Of Units % Of Total
Total Housing
Units 8,942
Built 1939 or
earlier 310 3.5
Built 1940-1949 297 3.3
Built 1950-1959 601 6.7
Built 1960-1969 888 9.9
Built 1970-1979 1,360 15.2
Built 1980-1989 991 11.1
Built 1990-1999 1,126 12.6
Built 2000-2009 2,172 24.2
Built 2010-2015 1,197 13.4
* Source: U. S. Department of Commerce, Bureau of the Census: 2014.
** Source: Conway Building Department, 2015
H - 6

Graphic H-3. Age of Housing Stock by %
Source: U. S. Department of Commerce, Bureau of the Census: 2014.
Source: Conway Building Department, 2015
One troubling statistic is the loss of historic or
potentially historic homes. In 2000, there were 404
homes in the city built prior to 1939. That number has
fallen by nearly 25% in one Census period. Equally
concerning is the loss of homes from the other
potentially historic periods (anything 50 years old or
greater). Table H-7 outlines the loss of these housing
units between the 2000 Census and the 2014
American Community Survey results.
Table H-7. Loss of Potentially Historic Housing Units
# Of Units 2014
# Of Units 2000
% Loss
Built 1939 or earlier
310 404 23.2%
Built 1940-1949
297 536 44.6%
Built 1950-1959
601 706 14.9%
Source: U. S. Department of Commerce, Bureau of the Census: 2000. Source: U. S. Department of Commerce, Bureau of the Census: 2014.
Housing Affordability
The Department of Housing and Urban Development
(HUD) defines affordable housing as when the
occupant(s) spends no more than 30% of their gross
household income towards their total gross housing
costs, regardless of whether they rent or own.
Housing costs include rent or mortgage costs, utilities,
and insurance.
H - 7

Table H-8. Median Sales Price
Zip Code 2007 2010 2014
29526 $182,500 $146,000 $150,000
29527 $161,080 $123,000 $120,000 Source: Multiple Listing Service, 2007, 2010, 3014.
In 2015, the median family income in Conway was
$34,615. According to the American Community
Survey during the same time period, the median
housing value for the City of Conway was $144,500.
Based on current interest rates for a 30 year fixed rate
mortgage (approximately 5%), and a 5 percent
down payment, median priced homes are not
affordable to median income families using HUD
guidelines. The monthly payment for a $140,000
mortgage with PMI, Insurance and taxes is nearly
$1,000. Based upon the median family income
stated above, the monthly gross income is $2,885.
30% of the monthly income is $865.00.
A search of Realtor.com’s website shows nearly 20
properties for sale in the City at less than $90,000. This
price point does meet the affordable definition as
defined by HUD. So while the median home price
may not be “Affordable” a housing stock meeting
the definition of HUD is available within the City limits.
Further, Table H-9 outlines the Census Bureau’s
statistics on Housing Values as of 2014. Again, over
20% of the housing stock values are under $100,000
which would fall within an “affordable” level as
defined by HUD.
Table H-9. Housing Value, 2014
Value Number of Units % of Total
Less than $50,000 220 5.8
$50,000 - $99,999 585 15.3
$100,000-$149,999 1,218 31.9
$150,000-$199,999 749 19.6
$200,000-$299,999 764 20.0
$300,000-$499,999 235 6.2
$500,000-$999,999 49 1.3
$1,000,000 or more 0 0
Total 3,820 100.0 Source: U. S. Department of Commerce, Bureau of the Census: 2014
Another factor to consider in an analysis of
affordable housing is the rental market. The HUD
formula is the same for both the homeowner and the
renter, no more than 30% of gross household income.
Table H-10 details the Rental Costs for the years 2010
and 2014.
H - 8

Table H-10. Rental Costs - 2010 & 2014
Rent Number
of Units
2010
% of
Units
Number
of Units
2014
% of
Units
Less than $200 171 6.8 207 7.9
$200-$299 225 8.9 232 8.8
$300-$499 405 16.0 355 13.5
$500 - $699 923 36.6 800 30.4
$700 - $999 516 20.4 493 18.7
$1,000-$1,499 224 8.9 446 16.9
$1,500 or
more
61 2.4 101 3.8
No rent paid 59 x 157 x
Total 2,525 100% 2,634 100%
Source: U. S. Department of Commerce, Bureau of the Census: 2010 and 2014
The 2014 median household income, according to
the Census Bureau, was $35,479, or $2,956 monthly.
30% of the median income is $887, which is the
monthly rental rate required to be considered
“affordable”. Here, as much as 80% of the rental
market of Conway is within the “affordable” range.
Federally Subsidized Housing
The US Department of Housing and Urban
Development (HUD) subsidizes housing in the City of
Conway through programs managed by the Housing
Authority of Conway. The Housing Authority operates
multiple housing developments and single family
homes as well as administrating a Section 8 Voucher
program. Table H-11 details the housing options
provided by the Housing Authority. In all, the Housing
Authority provides nearly 300 multi-family units, 20
single family homes, and 386 Section 8 Housing
vouchers.
The Housing Authority qualifies individuals for their
programs under established HUD guidelines. To
qualify, families must earn less than 80% of the
median family income for the City and is based upon
family size and other factors.
H - 9

Table H-10. Housing Authority – Housing and Programs
Program Elderly/Disabled
occupied
Total
Units/bedrooms
Section 8
New
Construction
Apartments
Sanders
Village
8 26 /1-3
Lee Haven
54
32/0-1
Section 8
Vouchers
Recipient
chooses
housing
154 386/varies
Public
Housing -
Scattered
Sites
single
family
homes
6 20/varies
Public
Housing
Apartments
Darden
Terrace
37 100/1-5
Huckabee
Heights
35 100/1-5
Holt
Gardens
24 40/1-5
Source: Housing Authority of Conway: 2016
Of concern is the concentration of Section 8
vouchers issued in the City. Graphic H-4 illustrates the
concentrations of subsidized housing in Horry County.
The largest concentrations are within the City of
Conway. According to the Assessment of Fair
Housing that is being drafted by Horry County in
cooperation with the Cities of Conway and Myrtle
Beach, the same areas where this concentration of
subsidies exists, is also the source of racial
segregation, low school proficiency, lower labor
participation, and exposure to poverty.
Graphic H-4. Horry County Subsidized Housing 2015
Source: Horry County AFH Draft, 2017, HUD 2015.
H - 10

Graphic H-5. Conway Subsidized Housing 2015
Source: Horry County AFH Draft, 2017, HUD 2015.
Barriers to Affordable Housing
As previously discussed, an abundance of
“affordable” housing options exist in the City of
Conway. However, the City does limit affordability in
several ways. The City prohibits the location of
manufactured housing within the City limits. Further,
the City adopted a Complete Streets approach to
development in 2011 which requires new subdivisions
to build roads with curbing and gutter, street trees
and sidewalks, all of which contribute to higher
development costs which are passed on to the
consumer in the cost of the homes.
Housing Organizations and Programs
The City of Conway partners with numerous entities
and participates in many programs which aim to
improve the housing situations in the City. Table H-11
describes many of these in detail.
H - 11
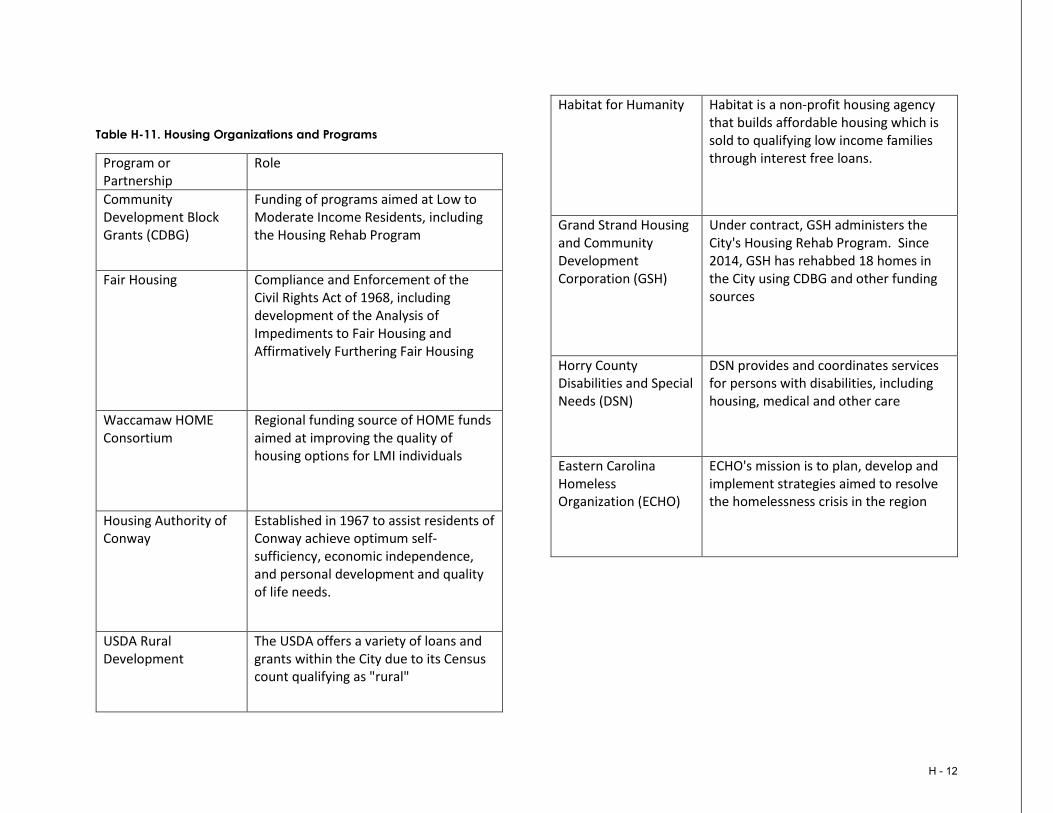
Table H-11. Housing Organizations and Programs
Program or Partnership
Role
Community Development Block Grants (CDBG)
Funding of programs aimed at Low to Moderate Income Residents, including the Housing Rehab Program
Fair Housing Compliance and Enforcement of the Civil Rights Act of 1968, including development of the Analysis of Impediments to Fair Housing and Affirmatively Furthering Fair Housing
Waccamaw HOME Consortium
Regional funding source of HOME funds aimed at improving the quality of housing options for LMI individuals
Housing Authority of Conway
Established in 1967 to assist residents of Conway achieve optimum self-sufficiency, economic independence, and personal development and quality of life needs.
USDA Rural Development
The USDA offers a variety of loans and grants within the City due to its Census count qualifying as "rural"
Habitat for Humanity Habitat is a non-profit housing agency that builds affordable housing which is sold to qualifying low income families through interest free loans.
Grand Strand Housing and Community Development Corporation (GSH)
Under contract, GSH administers the City's Housing Rehab Program. Since 2014, GSH has rehabbed 18 homes in the City using CDBG and other funding sources
Horry County Disabilities and Special Needs (DSN)
DSN provides and coordinates services for persons with disabilities, including housing, medical and other care
Eastern Carolina Homeless Organization (ECHO)
ECHO's mission is to plan, develop and implement strategies aimed to resolve the homelessness crisis in the region
H - 12

Population and Housing Projections
The population of the City of Conway has grown
dramatically in the last two decades. In the decennial
Census of 2010, the population of Conway was 17,103.
The 2015 American Community Survey population
estimate for Conway is 21,053, a five year rise of nearly
19%. Assuming a more conservative growth rate of 25%
every ten years, Conway will exceed 30,000 people by
2030.
The current Census statistics show the average household
size of 2.49 persons per household. This would require
nearly 3,600 new homes to be constructed by 2030, or 23
houses per month from 2017 through 2030.
Summary of Findings
The largest ten-year growth period in Conway was in the
housing boom of 2000-2009, however, this period was also
marred, in part, by the beginning of the housing recession.
The rebound from the housing recession has been
profound. In the five-year period leading up to the
drafting of this plan, a 13.4% growth rate was obtained
using the same comparable 10-year comparison rate.
New construction data for 2016 shows equally robust
growth as the preceding year.
In addition to being an ideal place to live in its own right,
the City of Conway also offers a less expensive alternative
to living in the tourism mecca of the Grand Strand.
Retirees moving from the north to the warmer climates of
Coastal South Carolina will continue to choose Conway
as their southern home.
Maintaining a stock of affordable housing will be a
challenge as the City continues to grow and prosper.
Balancing housing growth and its impact on the quality of
life of all Conway residents will be a great challenge and
opportunity facing Conway over the next ten years.
H - 13
Goal
Support the affordable housing efforts of public,
private and non-profit entities to meet the housing
needs of all of Conway’s citizens.
Objective: Educate and build consensus within the
Conway community about the need for
affordable housing.
Strategies: Continue the integration of affordable
housing concepts into the City
comprehensive planning process.
Continue to promote the recognition of
affordable housing as an economic
development issue.
Create partnerships where possible to
avoid duplication of efforts and pool
resources in development efforts.
Build support for affordable housing in
the financial community.
Continue working with Horry County
Community Development Department
to promote affordable housing options
Objective : Develop a comprehensive approach to
increase affordable housing
opportunities in the Conway area.
Strategies: Coordinate City efforts with other
potential providers of affordable housing
(private, public and non-profit) to
maximize the potential for affordable
housing development.
Consider providing incentives to private
developers to lower development costs
and encourage the development of
affordable housing.
Work with the development community
to identify technical assistance and
financial incentives to encourage an
increase in affordable housing units.
H - 14

Encourage mixed use projects in order to
improve the feasibility and affordability
of projects.
Seek funding from a variety of sources –
federal, state and private foundations.
Continue to monitor availability of
affordable housing within the City to
assure that a variety of housing options
exists
Goal
Promote the preservation of existing housing in
established neighborhoods and encourage a mix of
housing types with quality site development to
maintain Conway’s sense of place and promote the
health, safety, and welfare of its citizens.
Objective: Develop a strategic approach to use
historic preservation as a tool for
improving the existing housing stock and
adding to the housing stock in order to
maintain and create stable housing
environments in Conway’s older
neighborhoods and downtown.
Strategies: Promote incentives for historic
preservation of homes and income
producing properties such as federal
and state tax credits and the City’s
policy on building permits in downtown.
Encourage and assist neighborhood
associations and watch groups so that
they will remain active.
Foster the development of new
neighborhood associations and watch
groups.
Develop a public awareness effort
centered around historic preservation
and the positive economic impact it has
on property.
Create incentives for downtown upper
floor housing.
Objective: Encourage quality design and
construction of all housing units and site
improvements.
H - 15

Strategies: Explore development approaches such
as smart growth as a means of
achieving a higher level of design.
Update the zoning ordinance and land
development regulations as needed to
assure they remain current in terms of site
design and construction techniques.
Update the building codes to assure
they remain current.
Promote site design that limits land
disturbance, protects trees, reduces
storm water runoff and minimizes
environmental impacts.
Encourage and promote connectivity of
open spaces within developments to
maximize their potential for
development and use.
Goal
Support steps to increase community services and
shelter for individuals and families with special needs.
Objective: Foster the development of housing that
will meet the needs of special
populations.
Strategies: Assist agencies in seeking federal, state
and private funds to provide housing for
special needs populations.
Work with agencies to locate potential
sites for special needs housing.
Provide technical assistance to
agencies on code matters as they relate
to special needs requirements.
Objective: Encourage renovations to existing units
that would also serve the needs of
special needs populations.
Strategies: Encourage the development
community to consider revisions to plans
H - 16
that would better serve special needs
populations.
Review plan submittals for compliance
with American with Disabilities Act
(ADA).
Goal
Expand efforts to assure the merits and goals of Fair
Housing are followed.
Objective: Continue to promote fair housing
awareness to the Conway community.
Strategies: Add to the fair housing awareness
promotion efforts such as Fair Housing
Month to gain support for fair housing
initiatives among the general public,
local decision-makers, financial
institutions, and the private sector.
Capitalize on others efforts in the area
that promote fair housing and address
fair housing issues.
Objective: Address the fair housing requirements as
needed to comply with HUD regulations.
Strategies: Stay knowledgeable of any changes in
Fair Housing laws.
Comply with the required distribution of
fair housing information as outlined by
HUD.
Continue to provide the City’s website
and access channel to advertise Fair
Housing Law.
Participate with Horry County and other
municipalities to complete necessary
Fair Housing Plans to comply with HUD
regulations, including the AFFH Plan.
Goal
Support organizations that address the housing and
other needs of the homeless in the Conway area.
Objective: Seek ways to participate in improving
the agencies’ efforts to meet the needs
of the homeless in the Conway area.
H - 17

Strategies: Continue to participate in the ECHO and
goal of better servicing the homeless
community.
Identify possible ways to assist the
agencies in addressing other needs as
well as housing.
Objective: Support agencies that address the issues
that prevent homelessness.
Strategies: Use the City’s website and public access
channel to advertise agencies that
provide services such as rental or
mortgage assistance for the at risk to
become homeless persons.
Encourage groups such as local law
enforcement agencies, and agencies
that provide services to the homeless to
include in their count efforts identifying
the at risk persons as well as the
homeless.
Continue offering services to the
homeless population during periods of
extreme weather.
H - 18