city of dayton, ohio comprehensive annual financial report
TRANSCRIPT

CITY OF DAYTON, OHIO Comprehensive Annual Financial Report For the Year Ended December 31, 2004 PREPARED BY: Department of Finance Cheryl J. Garrett, Director Candy H. Carr, Acting Accounting and Treasury Manager
MISSION STATEMENT as stewards of the public trust,
our mission is to provide leadership,
excellent services and participatory government
to enhance the quality of life and
sense of community for all who live, work,
raise families, or conduct business in Dayton.

THIS PAGE INTENTIONALLY LEFT BLANK

1
CITY OF DAYTON, OHIO
COMPREHENSIVE ANNUAL FINANCIAL REPORT FOR THE YEAR ENDED DECEMBER 31, 2004
Table of Contents
Title Page INTRODUCTORY SECTION Table of Contents . . . . . . . . . . . . . . . . . . . . . . . . . . . . . . . . . . . . . . . . . . . . . . . . . . . . . . . . . . . 1-3 Letter of Transmittal . . . . . . . . . . . . . . . . . . . . . . . . . . . . . . . . . . . . . . . . . . . . . . . . . . . . . . . . 5-7 Organization Chart . . . . . . . . . . . . . . . . . . . . . . . . . . . . . . . . . . . . . . . . . . . . . . . . . . . . . . . . . 8 Certificate of Achievement for Excellence in Financial Reporting. . . . . . . . . . . . . . . . . . . . . . . . . . . . 9 FINANCIAL SECTION Independent Auditors’ Report . . . . . . . . . . . . . . . . . . . . . . . . . . . . . . . . . . . . . . . . . . . . . . 11-12 Management’s Discussion and Analysis . . . . . . . . . . . . . . . . . . . . . . . . . . . . . . . . . . . . . . . . 13-29 Basic Financial Statements: Government-wide Financial Statements: Statement of Net Assets . . . . . . . . . . . . . . . . . . . . . . . . . . . . . . . . . . . . . . . . . . . . . . 32-33 Statement of Activities . . . . . . . . . . . . . . . . . . . . . . . . . . . . . . . . . . . . . . . . . . . . . . 34-35
Fund Financial Statements: Balance Sheet - Governmental Funds . . . . . . . . . . . . . . . . . . . . . . . . . . . . . . . . . . . . . . 36
Reconciliation of Total Governmental Fund Balances to Net Assets Of Governmental Activities. . . . . . . . . . . . . . . . . . . . . . . . . . . . . . . . . . . . . . . . . . .
37
Statement of Revenues, Expenditures and Changes in Fund Balances - Governmental Funds . . . . . . . . . . . . . . . . . . . . . . . . . . . . . . . . . . . . . .
38
Reconciliation of the Statement of Revenues, Expenditures and Changes in Fund Balances of Governmental Funds to the Statement of Activities. . . . . . . . . . . . . . . . . . . . . .
39
Statement of Revenues, Expenditures and Changes in Fund Balances - Budget and Actual (Non-GAAP Budgetary Basis) - General Fund . . . . . . . . . . . . . . . . . . . . . . . . . . . . . . . . . . . . . . . . . . . . . . . . . . 40 Statement of Net Assets - Proprietary Funds . . . . . . . . . . . . . . . . . . . . . . . . . . . . . . . . . . . 42-45 Statement of Revenues, Expenses and Changes in Net Assets – Proprietary Funds . . . . . . . . . . . . . . . . . . . . . . . . . . . . . . . . . . . . . . . . . 46-47 Statement of Cash Flows - Proprietary Funds . . . . . . . . . . . . . . . . . . . . . . . . . . . . . . . . . . 48-51 Statement of Fiduciary Net Assets - Fiduciary Fund . . . . . . . . . . . . . . . . . . . . . . . . . . . . . . . . 52 Index of Notes to the Basic Financial Statements . . . . . . . . . . . . . . . . . . . . . . . . . . . . . . . . . . 53-54 Notes to the Basic Financial Statements. . . . . . . . . . . . . . . . . . . . . . . . . . . . . . . . . . . . . . . 55-102

2
CITY OF DAYTON, OHIO
COMPREHENSIVE ANNUAL FINANCIAL REPORT FOR THE YEAR ENDED DECEMBER 31, 2004
Table of Contents
(Continued)
Combining Statements and Individual Fund Schedules: Combining Statements – Nonmajor Governmental Funds Fund Descriptions . . . . . . . . . . . . . . . . . . . . . . . . . . . . . . . . . . . . . . . . . . . . . . .105-106 Schedule of Revenue, Expenditures, and Changes in Fund Balance - Budget and Actual (Non-GAAP Budgetary Basis) - General Fund . . . . . . . . . . . . . . . . . . . .107 Combining Balance Sheet – Nonmajor Governmental Funds . . . . . . . . . . . . . . . . . . . . . . . .108 Combining Statement of Revenues, Expenditures and Changes in Fund Balances - Nonmajor Governmental Funds . . . . . . . . . . . . . . . . . . . . . . . . . . . . .109 Combining Balance Sheet – Nonmajor Special Revenue Funds . . . . . . . . . . . . . . . . . . . . . . .110-111
Combining Statement of Revenues, Expenditures and Changes in Fund Balances - Nonmajor Special Revenue Funds . . . . . . . . . . . . . . . . . . . . . . . . . . . .112-113
Schedule of Revenue, Expenditures, and Changes in Fund Balance - Budget and Actual (Non-GAAP Budgetary Basis) - Street Fund . . . . . . . . . . . . . . . . . . . . . . . . . .114 Schedule of Revenue, Expenditures, and Changes in Fund Balance - Budget and Actual (Non-GAAP Budgetary Basis) - Highway Maintenance Fund . . . . . . . . . . . . . . . . .115 Schedule of Revenue, Expenditures, and Changes in Fund Balance - Budget and Actual (Non-GAAP Budgetary Basis) - Law Enforcement Fund. . . . . . . . . . . . . . . . . . . .116 Schedule of Revenue, Expenditures, and Changes in Fund Balance - Budget and Actual (Non-GAAP Budgetary Basis) - Miscellaneous Grants Fund. . . . . . . . . . . . . . . . . .117 Schedule of Revenue, Expenditures, and Changes in Fund Balance - Budget and Actual (Non-GAAP Budgetary Basis) - Other Special Revenue Funds . . . . . . . . . . . . . . . . . . . . . . . . . . . . . . . . . . . . . . . .118 Schedule of Revenue, Expenditures, and Changes in Fund Balance - Budget and Actual (Non-GAAP Budgetary Basis) - Debt Service Fund . . . . . . . . . . . . . . . . . . . . . . . . . . . . . . . . . . . . . . . . . . . . . .119 Combining Balance Sheet – Nonmajor Capital Projects Funds . . . . . . . . . . . . . . . . . . . . . . . .120
Combining Statement of Revenues, Expenditures and Changes in Fund Balances - Nonmajor Capital Projects Funds . . . . . . . . . . . .
. . . . . . . . . . . . . . . . .
121

3
CITY OF DAYTON, OHIO
COMPREHENSIVE ANNUAL FINANCIAL REPORT
FOR THE YEAR ENDED DECEMBER 31, 2004
Table of Contents (Continued)
Combining Statements – Nonmajor Enterprise Funds Fund Descriptions . . . . . . . . . . . . . . . . . . . . . . . . . . . . . . . . . . . . . . . . . . . . . . .
122
Combining Statement of Net Assets – Nonmajor Enterprise Funds . . . .. . . . . . . . . . . . . . . . .123 Combining Statement of Revenues, Expense and Changes in Net Assets - Nonmajor Enterprise Funds . . . . . . . . . . . . . . . . . . . . . . . . . . . . . . . . .124 Combining Statement of Cash Flows – Nonmajor Enterprise Funds . . . . . . . . . . . . . . . . . . . .125 Combining Statements – Internal Service Funds Fund Descriptions . . . . . . . . . . . . . . . . . . . . . . . . . . . . . . . . . . . . . . . . . . . . . . . .
126
Combining Statement of Net Assets – Internal Service Funds . . . . . . . . . . . . . . . . . . . . . . . . .127 Combining Statement of Revenues, Expense and Changes in Net Assets - Internal Service Funds . . . . . . . . . . . . . . . . . . . . . . . . . . . . . . . . . . . .128 Combining Statement of Cash Flows – Internal Service Funds . . . . . . . . . . . . . . . . . . . . . . . .129 Combining Statements – Fiduciary Funds Fund Descriptions . . . . . . . . . . . . . . . . . . . . . . . . . . . . . . . . . . . . . . . . . . . . . . .
130
Combining Statement of Changes in Assets and Liabilities - Agency . . . . . . . . . . . . . . . . . . . .131-133 STATISTICAL SECTION
Statistical Section Description . . . . . . . . . . . . . . . . . . . . . . . . . . . . . . . . . . . . . . . . . . . . .135 General Governmental Expenditures by Function – Last Ten Years . . . . . . . . . . . . . . . . . . . . . . . . .136-137General Governmental Revenues by Source – Last Ten Years . . . . . . . . . . . . . . . . . . . . . . . . . . . . .138-139Property Tax Levies and Collections – Last Ten Years. . . . . . . . . . . . . . . . . . . . . . . . . . . . . . . . .140 Assessed Value and Estimated True Value of Taxable Property – Last Ten Years. . . . . . . . . . . . . . . . . . . . . . . . . . . . . . . . . . . . . . . . . . .141 Property Tax Rates – Direct and Overlapping Governments – Last Ten Years . . . . . . . . . . . . . . . . . . . . . . . . . . . . . . . . . . . . . . . . . . . .142-143Special Assessments Billings and Collections – Last Ten Years . . . . . . . . . . . . . . . . . . . . . . . . . . . .144 Ratio of Net General Obligation Bonded Debt to Assessed Value and Net Bonded Debt Per Capita – Last Ten Years . . . . . . . . . . . . . . . . . . . . . . . . . . . . . . .145 Computation of Legal Debt Margins . . . . . . . . . . . . . . . . . . . . . . . . . . . . . . . . . . . . . . . . . .146 Computation of Direct and Overlapping General Obligation Bonded Debt . . . . . . . . . . . . . . . . . . . . . . . . . . . . . . . . . . . . . . . . . . .147 Ratio of Annual Debt Principal and Interest Expenditures for General Obligation Bonded Debt to Total General Governmental Expenditures – Last Ten Years . . . . . . . . . . . . . . . . . . . . . . . . . . . . . . . . . . . . . . . . . . . .148 Revenue Bond Coverage Dayton International Airport and Water Funds – Last Ten Years . . . . . . . . . . . . . . . . . . . . . . . . . . . . . . . . . . . . . . . . . . . . .149-150Demographic Statistics – Last Ten Years . . . . . . . . . . . . . . . . . . . . . . . . . . . . . . . . . . . . . . . . . . .151 Property Values, Construction and Bank Deposits – Last Ten Years. . . . . . . . . . . . . . . . . . . . . . . . . .152 Principal Taxpayers. . . . . . . . . . . . . . . . . . . . . . . . . . . . . . . . . . . . . . . . . . . . . . . . . . . . . . . . .153-154Miscellaneous Statistics . . . . . . . . . . . . . . . . . . . . . . . . . . . . . . . . . . . . . . . . . . . . . . . . .155

4
THIS PAGE INTENTIONALLY LEFT BLANK

5

6

7


THIS PAGE INTENTIONALLY LEFT BLANK
10

INDEPENDENT AUDITORS’ REPORT The Honorable Members of the City Commission City of Dayton, Ohio We have audited the accompanying financial statements of the governmental activities, the business-type activities, the discretely presented component unit, each major fund, and the aggregate remaining fund information of the City of Dayton, Ohio as of and for the year ended December 31, 2004, which collectively comprise the City’s basic financial statements as listed in the table of contents. These financial statements are the responsibility of the City of Dayton, Ohio’s management. Our responsibility is to express opinions on these financial statements based on our audit. We did not audit the financial statements of the CityWide Development Corporation, which represent all the assets and revenues of the discretely presented component unit. Those financial statements were audited by other auditors whose report thereon has been furnished to us, and our opinion, insofar as it relates to the amounts included for the discretely presented component unit, is based on the report of the other auditors. We conducted our audit in accordance with auditing standards generally accepted in the United States of America and the standards applicable to financial audits contained in Government Auditing Standards, issued by the Comptroller General of the United States. Those standards require that we plan and perform the audit to obtain reasonable assurance about whether the financial statements are free of material misstatement. An audit includes examining, on a test basis, evidence supporting the amounts and disclosures in the financial statements. An audit also includes assessing the accounting principles used and significant estimates made by management, as well as evaluating the overall financial statement presentation. We believe that our audit and the report of other auditors provide a reasonable basis for our opinion. In our opinion, based on our audit and the report of other auditors, the financial statements referred to above present fairly, in all material respects, the respective financial position of the governmental activities, the business-type activities, the discretely presented component unit, each major fund, and the aggregate remaining fund information of the City of Dayton, Ohio, as of December 31, 2004, and the respective changes in financial position and cash flows, where applicable, thereof and the respective budgetary comparison for the general fund for the year then ended in conformity with accounting principles generally accepted in the United States of America.
11

In accordance with Government Auditing Standards, we have also issued our report dated June 24, 2005 on our consideration of the City of Dayton, Ohio’s internal control over financial reporting and our tests of its compliance with certain provisions of laws, regulations, contracts, and grants. That report is an integral part of an audit performed in accordance with Government Auditing Standards and should be considered in assessing the results of our audit. Management’s Discussion and Analysis on pages 13-29 are not a required part of the basic financial statements but are supplementary information required by the Governmental Accounting Standards Board. We have applied certain limited procedures, which consisted principally of inquiries of management regarding the methods of measurement and presentation of the required supplementary information. However, we did not audit the information and express no opinion on it. Our audit was conducted for the purpose of forming opinions on the financial statements that collectively comprise the City of Dayton, Ohio’s basic financial statements. The introductory section, combining and individual non-major fund financial statements, and statistical tables are presented for purposes of additional analysis and are not a required part of the basic financial statements. The combining and individual non-major fund financial statements have been subjected to the auditing procedures applied in the audit of the basic financial statements and, in our opinion, are fairly stated in all material respects in relation to the basic financial statements taken as a whole. The introductory and statistical sections have not been subjected to the auditing procedures applied in the audit of the basic financial statements and, accordingly, we express no opinion on these sections. Cincinnati, Ohio June 24, 2005
12

CITY OF DAYTON, OHIO
MANAGEMENT’S DISCUSSION AND ANALYSIS FOR THE YEAR ENDED DECEMBER 31, 2004 UNAUDITED
13
The management’s discussion and analysis of the City of Dayton’s (the “City”) financial performance provides an overall review of the City’s financial activities for the fiscal year ended December 31, 2004. The intent of this discussion and analysis is to look at the City’s financial performance as a whole; readers should also review the basic financial statements and the notes to the basic financial statements to enhance their understanding of the City’s financial performance. Financial Highlights Key financial highlights for 2004 are as follows:
The total net assets of the City increased $25,849,321. Net assets of governmental activities increased $16,638,896 or 5.48% over 2003 and net assets of business-type activities increased $9,210,425 or 2.16% over 2003.
General revenues accounted for $152,003,533 of total governmental activities revenue. Program specific
revenues accounted for $56,917,921 or 27.14% of total governmental activities revenue. The City had a special item of $781,586 for the sale of capital assets.
The City had $193,064,144 in expenses related to governmental activities; $56,917,921 of these expenses was
offset by program specific charges for services, grants or contributions. The remaining expenses of the governmental activities of $136,146,223 were offset by general revenues (primarily property taxes, income taxes and unrestricted grants and entitlements) of $152,003,533.
The general fund had revenues of $162,531,493 in 2004. This represents a decrease of $2,327,555 from 2003
revenues. The expenditures of the general fund, which totaled $150,473,141 in 2004, increased $2,509,206 from 2003. The net decrease in fund balance for the general fund was $3,291,174 or 8.29%.
Net assets for the business-type activities, which are made up of the Dayton International Airport, Water,
Sewer, Storm Water and Golf enterprise funds, increased in 2004 by $9,210,425. This increase in net assets was due primarily to capital contributions received from passenger facility charges and intergovernmental grants and subsidies coupled with adequate charges for services revenue to cover operating expenses.
In the general fund, the actual revenues came in $948,361 lower than they were in the final budget and actual
expenditures were $6,210,588 less than the amount in the final budget. Budgeted revenues increased $5,365,000 from the original to the final budget due primarily to an increase in projected income tax revenue and state shared taxes. Budgeted expenditures decreased $414,400 from the original to the final budget as a result of projected decreases in public safety costs by the City.
Using this Annual Financial Report This annual report consists of a series of financial statements and notes to those statements. These statements are organized so the reader can understand the City as a financial whole, an entire operating entity. The statements then proceed to provide an increasingly detailed look at specific financial activities. The Statement of Net Assets and Statement of Activities provide information about the activities of the whole City, presenting both an aggregate view of the City’s finances and a longer-term view of those finances. Fund financial statements provide the next level of detail. For governmental funds, these statements tell how services were financed in the short-term as well as what remains for future spending. The fund financial statements also look at the City’s most significant funds with all other nonmajor funds presented in total in one column.

CITY OF DAYTON, OHIO
MANAGEMENT’S DISCUSSION AND ANALYSIS FOR THE YEAR ENDED DECEMBER 31, 2004 UNAUDITED
14
Reporting the City as a Whole Statement of Net Assets and the Statement of Activities While this document contains a large number of funds used by the City to provide programs and activities, the view of the City as a whole looks at all financial transactions and asks the question, “How did we do financially during 2004?” The Statement of Net Assets and the Statement of Activities answer this question. These statements include all assets and liabilities using the accrual basis of accounting similar to the accounting used by most private-sector companies. This basis of accounting will take into account all of the current year’s revenues and expenses regardless of when cash is received or paid. These two statements report the City’s net assets and changes in those assets. This change in net assets is important because it tells the reader that, for the City as a whole, the financial position of the City has improved or diminished. The causes of this change may be the result of many factors, some financial, some not. Non-financial factors include the City’s property tax base, current property tax laws in Ohio restricting revenue growth, facility conditions, required community programs and other factors. In the Statement of Net Assets and the Statement of Activities, the City is divided into two distinct kinds of activities: Governmental Activities - Most of the City’s programs and services are reported here including police, fire, street and highway maintenance, HUD program operations, community and economic development and general administration. These services are funded primarily by property and income taxes and intergovernmental revenues including federal and state grants and other shared revenues. Business-Type Activities - These services are provided on a charge for goods or services basis to recover all or a significant portion of the expenses of the goods or services provided. The City’s airport, water, sewer, storm water and golf operations are reported here. Reporting the City’s Most Significant Funds Fund Financial Statements A fund is a grouping of related accounts that is used to maintain control over resources that have been segregated for specific activities or objectives. The City, like other state and local governments, uses fund accounting to ensure and demonstrate compliance with finance-related legal requirements. All of the funds of the City can be divided into three categories: governmental funds, proprietary funds, and fiduciary funds. Fund financial reports provide detailed information about the City’s major funds. The City uses many funds to account for a multitude of financial transactions. However, these fund financial statements focus on the City’s most significant funds. The analysis of the City’s major governmental and proprietary funds begins on page 20. Governmental Funds Governmental funds are used to account for essentially the same functions reported as governmental activities in the government-wide financial statements. However, unlike the government-wide financial statements, governmental fund financial statements focus on near-term inflows and outflows of spendable resources, as well as on balances of spendable resources available at the end of the fiscal year. Such information may be useful in evaluating a government’s near-term financing requirements.

CITY OF DAYTON, OHIO
MANAGEMENT’S DISCUSSION AND ANALYSIS FOR THE YEAR ENDED DECEMBER 31, 2004 UNAUDITED
15
Because the focus of the governmental funds is narrower than that of the government-wide financial statements, it is useful to compare the information presented for governmental funds with similar information presented for governmental activities in the government-wide financial statements. By doing so, the readers may better understand the long-term impact of the government’s near-term financing decisions. Both the governmental fund balance sheet and the governmental fund statement of revenues, expenditures, and changes in fund balances provide a reconciliation to facilitate this comparison between governmental funds and governmental activities. The City maintains a multitude of individual governmental funds. The City has segregated these funds into major and nonmajor funds. The City’s major governmental funds are the General fund, Debt service fund and Capital Improvement fund. Information for major funds is presented separately in the governmental fund balance sheet and in the governmental statement of revenues, expenditures, and changes in fund balances. Data from the other governmental funds are combined into a single, aggregated presentation. The basic governmental fund financial statements can be found on pages 36-40 of this report and further detail on the City’s major and nonmajor governmental funds can by found on pages 59-60 of this report. Proprietary Funds The City maintains two different types of proprietary funds. Enterprise funds are used to report the same functions presented as business-type activities in the government-wide financial statements. The City uses enterprise funds to account for its airport, water, sewer, storm water and golf operations. The City reports the Airport fund, Water fund and Sewer fund as major enterprise funds. These major funds are presented separately in the proprietary fund financial statements. The Storm Water fund and the Golf fund are considered nonmajor funds and are combined into a single, aggregated presentation in the proprietary fund financial statements. Internal service funds are an accounting device used to accumulate and allocate costs internally among the City’s various functions. The basic proprietary fund financial statements can be found on pages 42-51 of this report. Fiduciary Funds Fiduciary funds are used to account for resources held for the benefit of parties outside the City. Fiduciary funds are not reflected in the government-wide financial statement because the resources of those funds are not available to support the City’s own programs. The accounting used for fiduciary funds is much like that used for proprietary funds. Agency funds are the City’s only fiduciary fund type. The basic fiduciary fund financial statement can be found on page 52 of this report. Notes to the Basic Financial Statements The notes provide additional information that is essential to a full understanding of the data provided in the government-wide and fund financial statements. These notes to the basic financial statements can be found on pages 53-102 of this report. Government-Wide Financial Analysis The Statement of Net Assets provides the perspective of the City as a whole. The table below provides a summary of the City’s net assets for 2004 compared to 2003:

CITY OF DAYTON, OHIO
MANAGEMENT’S DISCUSSION AND ANALYSIS FOR THE YEAR ENDED DECEMBER 31, 2004 UNAUDITED
16
Net Assets
Restated RestatedGovernmental Governmental Business-Type Business-Type
Activities Activities Activities Activities Total Total 2004 2003 2004 2003 2004 2003
AssetsCurrent and other assets 166,815,938$ 162,962,878$ 140,970,641$ 146,223,464$ 307,786,579$ 309,186,342$ Capital assets 286,424,283 270,373,520 425,526,088 416,477,726 711,950,371 686,851,246
Total assets 453,240,221 433,336,398 566,496,729 562,701,190 1,019,736,950 996,037,588
LiabilitiesLong-term liabilities outstanding 100,571,490 82,097,984 109,736,764 112,702,829 210,308,254 194,800,813 Other liabilities 32,137,297 47,345,876 20,566,443 23,015,264 52,703,740 70,361,140
Total liabilities 132,708,787 129,443,860 130,303,207 135,718,093 263,011,994 265,161,953
Net AssetsInvested in capital assets, net of related debt 207,581,135 188,610,596 309,060,125 293,481,592 516,641,260 482,092,188 Restricted 63,442,672 53,916,504 - - 63,442,672 53,916,504 Unrestricted 49,507,627 61,365,438 127,133,397 133,501,505 176,641,024 194,866,943
Total net assets 320,531,434$ 303,892,538$ 436,193,522$ 426,983,097$ 756,724,956$ 730,875,635$
Over time, net assets can serve as a useful indicator of a government’s financial position. At December 31, 2004, the City’s assets exceeded liabilities by $756,724,956. At year-end, net assets were $320,531,434 and $436,193,522 for the governmental activities and the business-type activities, respectively. Capital assets reported on the government-wide statements represent the largest portion of the City’s assets. At year-end, capital assets represented 69.82% of total assets. Capital assets include land, construction in progress (CIP), land improvements, buildings and improvements, furniture, fixtures and equipment, vehicles and infrastructure. Capital assets, net of related debt to acquire the assets at December 31, 2004, were $207,581,135 and $309,060,125 in the governmental activities and business-type activities, respectively. These capital assets are used to provide services to citizens and are not available for future spending. Although the City’s investment in capital assets is reported net of related debt, it should be noted that the resources to repay the debt must be provided from other sources, since capital assets may not be used to liquidate these liabilities. As of December 31, 2004, the City is able to report positive balances in all three categories of net assets, both for the government as a whole, as well as for its separate governmental and business-type activities. A portion of the City’s net assets, $63,442,672, represents resources that are subject to external restriction on how they may be used. In the governmental activities, the remaining balance of unrestricted net assets of $49,507,627 may be used to meet the government’s ongoing obligations to citizens and creditors.

CITY OF DAYTON, OHIO
MANAGEMENT’S DISCUSSION AND ANALYSIS FOR THE YEAR ENDED DECEMBER 31, 2004 UNAUDITED
17
The table below shows the changes in net assets for fiscal years 2004 and 2003. Change in Net Assets
Governmental Governmental Business-Type Business-TypeActivities Activities Activities Activities Total Total
2004 2003 2004 2003 2004 2003 RevenuesProgram revenues: Charges for services and sales 28,523,521$ 30,102,580$ 115,856,533$ 116,882,670$ 144,380,054$ 146,985,250$ Operating grants and contributions 18,789,989 19,791,048 - - 18,789,989 19,791,048 Capital grants and contributions 9,604,411 10,307,490 14,794,084 14,845,098 24,398,495 25,152,588
Total program revenues 56,917,921 60,201,118 130,650,617 131,727,768 187,568,538 191,928,886
General revenues: Property taxes 19,496,591 18,641,542 - - 19,496,591 18,641,542 Income taxes 108,438,846 108,520,891 - - 108,438,846 108,520,891 Unrestricted grants 20,377,849 19,081,383 - - 20,377,849 19,081,383 Interest 1,706,199 3,579,657 1,032,922 3,604,829 2,739,121 7,184,486 Miscellaneous 1,984,048 2,952,997 - - 1,984,048 2,952,997
Total general revenues 152,003,533 152,776,470 1,032,922 3,604,829 153,036,455 156,381,299
Special item: Gain from sale of assets 781,586 - - - 781,586 -
Total revenues 209,703,040 212,977,588 131,683,539 135,332,597 341,386,579 348,310,185
Expenses: Downtown 5,031,993 5,418,423 - - 5,031,993 5,418,423 Youth, education and human services 2,208,479 2,535,385 - - 2,208,479 2,535,385 Community development 20,163,040 21,769,149 - - 20,163,040 21,769,149 Economic development 6,411,508 10,494,459 - - 6,411,508 10,494,459 Leadership and quality of life 45,891,870 45,111,428 - - 45,891,870 45,111,428 Corporate responsibility 15,950,738 17,020,585 - - 15,950,738 17,020,585 Public safety and justice 92,954,582 89,976,989 - - 92,954,582 89,976,989 Other 507,896 986,660 - - 507,896 986,660 Interest and fiscal charges 3,944,038 3,430,708 - - 3,944,038 3,430,708 Dayton International Airport - - 39,961,191 35,502,289 39,961,191 35,502,289 Water - - 47,152,642 45,628,781 47,152,642 45,628,781 Sewer - - 28,903,051 27,210,776 28,903,051 27,210,776 Other enterprise funds: Golf - - 2,472,685 3,118,857 2,472,685 3,118,857 Storm water - - 3,983,545 2,636,386 3,983,545 2,636,386
Total expenses 193,064,144 196,743,786 122,473,114 114,097,089 315,537,258 310,840,875
Increase in net assets before transfers 16,638,896 16,233,802 9,210,425 21,235,508 25,849,321 37,469,310
Transfers - (913,666) - 913,666 - -
Change in net assets 16,638,896$ 15,320,136$ 9,210,425$ 22,149,174$ 25,849,321$ 37,469,310$

CITY OF DAYTON, OHIO
MANAGEMENT’S DISCUSSION AND ANALYSIS FOR THE YEAR ENDED DECEMBER 31, 2004 UNAUDITED
18
Governmental Activities Governmental activities net assets increased $16,638,896 in 2004. This increase is a result of slightly decreasing revenues and expenses versus amounts reported in the prior year. Public safety and justice, which primarily supports the operations of the police and fire departments accounted for $92,954,582 of the total expenses of the City. These expenses were partially funded by $15,049,321 in direct charges to users of the services. Leadership and quality of life expenses totaled $45,891,870. Leadership and quality of life expenses were partially funded by $6,769,017 in direct charges to users of the services. The state and federal government contributed to the City a total of $18,789,989 in operating grants and contributions and $9,604,411 in capital grants and contributions. These revenues are restricted to a particular program or purpose. Of the total capital grants and contributions, $8,491,921, subsidized leadership and quality of life programs and $1,063,955 subsidized economic development programs. General revenues totaled $152,003,533, and amounted to 72.49% of total governmental revenues. These revenues primarily consist of property and income tax revenue of $127,935,437. The other primary source of general revenues is grants and entitlements not restricted to specific programs, including local government and local government revenue assistance, making up $20,377,849. The Statement of Activities shows the cost of program services and the charges for services and grants offsetting those services. The following table shows, for governmental activities, the total cost of services and the net cost of services. That is, it identifies the cost of these services supported by tax revenue and unrestricted State grants and entitlements. As can be seen in the Graph below, the City is highly dependent upon property and income taxes as well as unrestricted grants and entitlements to support its governmental activities.
Governmental Activities – Program Revenues vs. Total Expenses
$193,064,144 $196,743,786
$56,917,921 $60,201,118
$-
$50,000,000
$100,000,000
$150,000,000
$200,000,000
Fiscal Year 2004 Fiscal Year 2003
Program Revenues Expenses

CITY OF DAYTON, OHIO
MANAGEMENT’S DISCUSSION AND ANALYSIS FOR THE YEAR ENDED DECEMBER 31, 2004 UNAUDITED
19
Governmental Activities
Total Cost of Net Cost of Total Cost of Net Cost ofServices Services Services Services
2004 2004 2003 2003 Program Expenses: Downtown 5,031,993$ 4,526,784$ 5,418,423$ 4,959,409$ Youth, education and human services 2,208,479 371,537 2,535,385 205,662 Community development and neighborhoods 20,163,040 11,083,753 21,769,149 10,771,182 Economic development 6,411,508 2,569,952 10,494,459 1,724,151 Leadership and quality of life 45,891,870 23,341,683 45,111,428 27,230,352 Corporate responsibility 15,950,738 13,535,781 17,020,585 14,572,819 Public safety and justice 92,954,582 76,828,405 89,976,989 73,259,082 Other 507,896 456,800 986,660 893,483 Interest and fiscal charges 3,944,038 3,431,528 3,430,708 2,926,528
Total Expenses 193,064,144$ 136,146,223$ 196,743,786$ 136,542,668$ The dependence upon general revenues for governmental activities is apparent, with 70.52% of expenses supported through taxes and other general revenues.
Governmental Activities – General and Program Revenues
$152,003,533 $152,776,470
$56,917,921 $60,201,118
$781,586 $-$-$25,000,000$50,000,000$75,000,000
$100,000,000$125,000,000$150,000,000$175,000,000
Fiscal Year2004
Fiscal Year2003
Special Item Program Revenues General Revenues

CITY OF DAYTON, OHIO
MANAGEMENT’S DISCUSSION AND ANALYSIS FOR THE YEAR ENDED DECEMBER 31, 2004 UNAUDITED
20
Business-Type Activities Business-type activities include the airport, water, sewer, storm water and golf enterprise funds. These programs had program revenues of $130,650,617, general revenues of $1,032,922 and expenses of $122,473,114 for 2004. The graph below shows the business-type activities assets, liabilities and net assets at year-end.
Net Assets in Business – Type Activities
$566,496,729 $562,701,190
$436,193,522 $426,983,097
$130,303,207 $135,718,093$-
$100,000,000$200,000,000$300,000,000$400,000,000$500,000,000$600,000,000
2004 2003 (Restated)
Liabilities Net Assets Assets
Financial Analysis of the Government’s Funds As noted earlier, the City uses fund accounting to ensure and demonstrate compliance with finance-related legal requirements. Governmental Funds The focus of the City’s governmental funds is to provide information on near-term inflows, outflows, and balances of spendable resources. Such information is useful in assessing the City’s financing requirements. In particular, unreserved fund balance may serve as a useful measure of the City’s net resources available for spending at year-end. The City’s governmental funds (as presented on the balance sheet on page 36) reported a combined fund balance of $94,172,565 which is $5,262,060 above last year’s total of $88,910,505 (as restated). The December 31, 2003 fund balances have been restated as described in Note 3 to the basic financial statements. The schedule below indicates the fund balances and the total change in fund balances as of December 31, 2004 for all major and nonmajor governmental funds.
RestatedFund Balances Fund Balances Increase
12/31/04 12/31/03 (Decrease)
Major Funds: General 36,407,607$ 39,698,781$ (3,291,174)$ Debt service 15,333,393 17,839,709 (2,506,316) Capital improvement 24,124,850 12,969,121 11,155,729 Other Nonmajor Governmental Funds 18,306,715 18,402,894 (96,179)
Total 94,172,565$ 88,910,505$ 5,262,060$

CITY OF DAYTON, OHIO
MANAGEMENT’S DISCUSSION AND ANALYSIS FOR THE YEAR ENDED DECEMBER 31, 2004 UNAUDITED
21
General Fund The City’s general fund balance decreased $3,291,174, primarily due to a decrease in revenues from 2003 in the amount of $2,327,555 and an increase in expenditures from 2003 in the amount of $2,509,206. The table that follows assists in illustrating the revenues of the general fund.
2004 2003 Amount Amount
RevenuesTaxes 134,946,711$ 133,795,158$ 0.86 %Charges for services 18,261,799 19,682,367 (7.22) %Licenses and permits 1,750,643 2,014,392 (13.09) %Fines and forfeitures 1,535,094 1,420,200 8.09 %Investment income 2,286,681 3,365,179 (32.05) %Special assessments 339,721 327,656 3.68 %Intergovernmental 1,579,154 1,453,282 8.66 %Other 1,831,690 2,800,814 (34.60) %
Total 162,531,493$ 164,859,048$ (1.41) %
Percentage Change
Licenses and permits revenue decreased $263,749 or 13.09% from the prior year. This decrease is attributed to a decrease in the number of licenses and permits issued by the City of Dayton in 2004. The decrease in other revenue is due to a decrease in the miscellaneous items collected by the City. All other revenue remained comparable to 2003.
Revenues – Fiscal Year 2004
Investment Income1.41%Fines and Forfeitures
0.94%
Licenses and permits1.08%
Charges for Services11.24%
Intergovernmental0.97%
Other Revenues1.13%
Special assessment0.21%
Taxes83.02%

CITY OF DAYTON, OHIO
MANAGEMENT’S DISCUSSION AND ANALYSIS FOR THE YEAR ENDED DECEMBER 31, 2004 UNAUDITED
22
Revenues – Fiscal Year 2003
Investment Income2.04%Fines and Forfeitures
0.86%
Licenses and permits1.22%
Charges for Services11.94%
Intergovernmental0.88%
Other Revenues1.70%
Special assessment0.20%
Taxes81.16%
The table that follows assists in illustrating the expenditures of the general fund.
2004 2003 Amount Amount
ExpendituresDowntown 3,606,582$ 3,112,343$ 15.88 %Youth, education and human services 214,881 181,204 18.59 %Community development and neighborhoods 11,248,295 11,032,510 1.96 %Economic development 2,739,633 2,817,334 (2.76) %Leadership and quality of life 28,193,800 26,935,463 4.67 %Corporate responsibility 13,944,134 14,619,628 (4.62) %Public safety and justice 90,124,997 87,506,358 2.99 %Other expenses 366,142 711,570 (48.54) %Capital outlay - 1,047,525 (100.00) %Debt service 34,677 - 100.00 %
Total 150,473,141$ 147,963,935$ 1.70 %
Percentage Change
The most significant increase was in the areas of youth, education and human services, downtown and debt service. While these increases are significant as a percentage the individual amounts are not significant compared to the whole. Capital outlay expenditures decreased due to the City not entering into any capital leases during 2004. The amount reported for 2004 is representative of what is expected in the future. All other expenditures remained comparable to 2003.

CITY OF DAYTON, OHIO
MANAGEMENT’S DISCUSSION AND ANALYSIS FOR THE YEAR ENDED DECEMBER 31, 2004 UNAUDITED
23
Debt Service The City’s debt service fund balance decreased $2,506,316 primarily due to a reduction in the amount of property tax revenue allocated to the fund. The following table illustrates the revenues of the debt service fund.
2004 2003 Amount Amount
RevenuesTaxes 324,391$ 3,665,441$ (91.15) %Intergovernmental 974,855 404,071 141.26 %Special assessments 246,528 222,686 10.71 %Other 150,000 150,000 - %
Total 1,695,774$ 4,442,198$ (61.83) %
Percentage Change
2004 2003 Amount Amount
ExpendituresDowntown 560,000$ 560,000$ - %Leadership and quality of life 6,922 - 100.00 %Corporate responsibility 345,442 325,728 6.05 %Other 123,982 247,269 (49.86) %Principal retirement 8,192,386 7,310,173 12.07 %Interest and fiscal charges 4,048,914 3,253,644 24.44 %
Total 13,277,646$ 11,696,814$ 13.52 %
Percentage Change
Expenditures - Fiscal Year 2004
Economic development
1.82%
Leadership and quality o f
life18.74%
Corporate responsibility
9.27%
Youth, education and
human services
0.14%
Community development
and neighborhood
s7.48%
Downtown2.40%
Other0.24%
Debt service0.02%
Public safety and justice
59.89%
Expenditures - Fiscal Year 2003
Economic development
1.90%
Leadership and quality o f
life18.20%
Corporate responsibility
9.88%
Youth, education and
human services
0.12%
Community development
and neighborhood
s7.46%
Downtown2.10%
Other0.48%
Capital outlay0.71%
Public safety and justice
59.15%

CITY OF DAYTON, OHIO
MANAGEMENT’S DISCUSSION AND ANALYSIS FOR THE YEAR ENDED DECEMBER 31, 2004 UNAUDITED
24
Capital Improvements The City’s capital improvements fund balance increased $11,155,729 due to an increase in revenues and a decrease in capital outlay expenditures.
2004 2003 Amount Amount
RevenuesTaxes 9,067,071$ 3,057,484$ 196.55 %Charges for services 352,486 412,051 (14.46) %Licenses and permits 66,579 105,751 (37.04) %Intergovenmental 8,108,424 6,445,829 25.79 %Special assessments 383,497 405,334 (5.39) %Investment income - 193,487 (100.00) %Other 560,484 226,343 147.63 %
Total 18,538,541$ 10,846,279$ 70.92 %
Percentage Change
2004 2003 Amount Amount
ExpendituresCapital outlay 17,055,356$ 21,646,434$ (21.21) %Other 365 - 100.00 %Interest and fiscal charges 85,388 176,480 (51.62) %
Total 17,141,109$ 21,822,914$ (21.45) %
Percentage Change
Budgeting Highlights - General Fund The City’s budgeting process is prescribed by the Ohio Revised Code (ORC). Essentially the budget is the City’s appropriations which are restricted by the amounts of anticipated revenues certified by the Budget Commission in accordance with the ORC. Therefore, the City’s plans or desires cannot be totally reflected in the original budget. If budgeted revenues are adjusted due to actual activity then the appropriations can be adjusted accordingly. Budgetary information is presented for the general fund. In the general fund, one of the significant changes was between the original and final budgeted amount in the area of revenues, which increased $5,365,000 from $161,654,200 to $167,019,200. Actual revenues of $166,070,839 were lower than final budgeted revenues by $948,361. The most significant change was between the final budgeted expenditures and actual expenditures. Actual expenditures came in $6,210,588 lower than the final budgeted amounts. Proprietary Funds The City’s proprietary funds provide the same type of information found in the government-wide financial statements for business-type activities, except in more detail. The only difference between the amounts reported as business-type activities and the amounts reported in the proprietary fund statements are interfund eliminations between proprietary funds. The only interfund activities reported in the government wide statements are those between business-type activities and governmental activities (reported as internal balances and transfers) whereas interfund amounts between various enterprise funds are reported in the proprietary fund statements.

CITY OF DAYTON, OHIO
MANAGEMENT’S DISCUSSION AND ANALYSIS FOR THE YEAR ENDED DECEMBER 31, 2004 UNAUDITED
25
Capital Assets and Debt Administration Capital Assets At the end of fiscal 2004, the City had $711,950,371 (net of accumulated depreciation) invested in land, buildings and improvements, improvements other than buildings, equipment, vehicles, infrastructure and construction in progress (CIP). Of this total, $286,424,283 was reported in governmental activities and $425,526,088 was reported in business-type activities. See Note 10 in the basic financial statements for additional capital asset disclosure. The following table shows fiscal 2004 balances compared to 2003:
Capital Assets at December 31 (Net of Depreciation)
Governmental Governmental Business-Type Business-Type
Activities Activities Activities Activities Total Total 2004 2003 2004 2003 2004 2003
Land 56,366,622$ 50,694,937$ 37,785,039$ 37,076,438$ 94,151,661$ 87,771,375$ Buildings and improvements 37,476,314 36,933,640 88,304,489 89,974,886 125,780,803 126,908,526 Improvements other than buildings 22,376,504 22,923,262 243,679,130 247,680,217 266,055,634 270,603,479 Equipment 9,797,365 10,458,724 3,756,216 4,114,991 13,553,581 14,573,715 Vehicles 8,136,640 6,857,016 12,659,963 12,308,753 20,796,603 19,165,769 Infrastructure 134,372,592 119,034,857 - - 134,372,592 119,034,857 Construction in progress 17,898,246 23,471,084 39,341,251 25,322,441 57,239,497 48,793,525
Total 286,424,283$ 270,373,520$ 425,526,088$ 416,477,726$ 711,950,371$ 686,851,246$
The following graphs show the breakdown of governmental capital assets by category for 2004 and 2003.
Capital Assets - Governmental Activities 2004
CIP6%
Land20%
Buildings & imp.13%
I.O.T.B.8%
Equipment3%
Vehicles3%
Infrastructure47%
Capital Assets - Governmental Activities 2003
CIP9%
Land19%
Buildings & imp.14%
I.O.T.B.8%
Equipment4%
Vehicles3%
Infrastructure43%
The City’s largest capital asset category is infrastructure which includes roads, bridges, culverts, sidewalks, curbs, annexed roadways, right-of-way, street lighting, and traffic signals. These items are immovable and of value only to the City, however, the annual cost of purchasing these items is quite significant. The net book value of the City’s infrastructure (cost less accumulated depreciation) represents approximately 47% of the City’s total governmental capital assets.

CITY OF DAYTON, OHIO
MANAGEMENT’S DISCUSSION AND ANALYSIS FOR THE FISCAL YEAR ENDED DECEMBER 31, 2004 UNAUDITED
26
The following graphs show the breakdown of business-type capital assets by category for 2004 and 2003.
Capital Assets - Business-Type Activities 2004Vehicles
3%
Land9%
CIP9%
Buildings & imp.21%
Equipment1%
I.O.T.B57%
Capital Assets - Business-Type Activities 2003
Vehicles3%
Land9%
CIP6%
Buildings & imp.22%
Equipment1%
I.O.T.B59%
The City’s largest business-type capital asset category is improvements other than buildings (I.O.T.B) which primarily includes runways for the airport, water lines, sewer lines and storm water catch basins. These items play a vital role in the income producing ability of the business-type activities. The net book value of the City’s I.O.T.B (cost less accumulated depreciation) represents approximately 57% of the City’s total business-type capital assets. Debt Administration The City had the following long-term obligations outstanding at December 31, 2004 and 2003:
Governmental GovernmentalActivities Activities
2004 2003
General obligation bonds 62,429,997$ 58,635,798$ Revenue bonds 11,385,000 11,790,000 Special assessment bonds 1,244,721 1,095,285
Total bonds 75,059,718 71,521,083
Capital lease obligations 3,730,742 332,660
Total long-term obligations 78,790,460$ 71,853,743$

CITY OF DAYTON, OHIO
MANAGEMENT’S DISCUSSION AND ANALYSIS FOR THE FISCAL YEAR ENDED DECEMBER 31, 2004 UNAUDITED
27
Business-type Business-typeActivities Activities
2004 2003
General obligation bonds 2,640,003$ 3,104,190$ Revenue bonds 81,455,000 89,345,000
Total bonds 84,095,003 92,449,190
OWDA loans 24,529,685 27,401,011 OPWC loans 800,000 850,000
Total loans 25,329,685 28,251,011
Capital lease obligations - 110,127
Total long-term obligations 109,424,688$ 120,810,328$ See Notes 11, 12 and 13 in the basic financial statements for additional disclosures and detail regarding the City’s debt activity. A comparison of the long-term obligations by category is depicted in the chart below.
GovernmentalBusiness-Type
-
25,000,000
50,000,000
75,000,000
100,000,000
125,000,000
Long-term obligations
Capital lease obligationsLoansBonds

CITY OF DAYTON, OHIO
MANAGEMENT’S DISCUSSION AND ANALYSIS FOR THE FISCAL YEAR ENDED DECEMBER 31, 2004 UNAUDITED
28
Dayton-Springfield MSAManufacturing's Share of Employment
(Not Seasonally Adjusted, In Thousands)
50
55
60
65
70
75
80
85
90
95
1998 1999 2000 2001 2002 2003 200414%
15%
16%
17%
18%
19%
20%
Manufacturing Employment Manufacturing's Share of Jobs
Dayton-Springfield MSA Employment(in thousands)
445
450
455
460
465
470
475
480
485
1998 1999 2000 2001 2002 2003 2004 2005 2006 2007 2008 2009-3.5%
-3.0%
-2.5%
-2.0%
-1.5%
-1.0%
-0.5%
0.0%
0.5%
1.0%
1.5%
Employment (left axis) Annual % Chg (right axis)
2005 to 2009Estimates by Global Insights
Economic Factors and the 2005 Budget The national economy has enjoyed three years of solid economic growth as evidenced by the $1.4 trillion increase in national income and 9.6% climb in real output. Yet, what is true of the whole is not necessarily true of its constituent parts. The Wall Street Journal noted this divide in its March 14, 2005 article entitled "Ohio Offers Clues on Cause of Low Growth". Statistics suggest that the Ohio economy is a major laggard with respect to job growth. In fact, by end of 2004, the national economy had all but erased the 2.7 million jobs lost during the economic downturn. The state of Ohio did not fare as well; total employment fell by 249,000 from June of 2000 until November of 2004. Since that time, the state has managed to restore only 11% of the jobs lost. For the Dayton region, only 15% of the jobs lost during the recession were added back.
In a study commissioned by the U.S. Conference of Mayors, the pre-eminent economic forecasting firm Global Insights projected that employment in the Dayton region would grow by 0.8% in 2005 and by 0.7% in the year after. Over the next 5 years, employment would grow at an average rate of just 0.3% annually and would not eclipse pre-recession levels until after 2009. Announcements, such as the one recently made by UPS that it will close its Dayton Hub idling 1,400 workers, provide names and faces to these abstract statistics.
Dayton's long heralded prominence in manufacturing is a strong contributing factor to its economic doldrums. With GM and its major parts manufacturer, Delphi Automotive, struggling with profitability, the future of the local manufacturing sector is of great concern. In fact, from 1998 to 2004, the Dayton region lost a total of 25,000 manufacturing jobs, representing a 27% decline in manufacturing employment. The percentage of workers employed in the manufacturing sector fell from 19.4% in 1998 to 15% in 2004. Even before the economic downturn, in fact for the last three decades, Dayton has seen dramatic declines in its traditional manufacturing base. Technology-driven productivity improvements along with competition underlie these changes. According to Cleveland State economist, Edward Hill, output per manufacturing employee more than doubled from 1983 to 2003; consequently, it would take half as many employees to produce the same level of output. And of course, there is the issue of off-shoring. With wages in Mexico and China at a fraction of the cost in the U.S., many manufacturing firms have moved their production facilities off-shore.

CITY OF DAYTON, OHIO
MANAGEMENT’S DISCUSSION AND ANALYSIS FOR THE FISCAL YEAR ENDED DECEMBER 31, 2004 UNAUDITED
29
But it is not just the fact that Dayton has a proportionately larger concentration in manufacturing. It is also the case that the type of goods manufactured in Ohio and in the Dayton region, specifically, belong to the same industry groups that are most sensitive to import pressure. Among these vulnerable groups is auto parts. At the same time that benefit costs have skyrocketed, many firms have improved their operating margins by substituting the foreign production of goods for those previously produced domestically. And although the falling dollar has helped to bolster U.S. exports abroad, the fact that the Chinese yuan is pegged to the dollar, means that there has been little effect on trade flows between the two countries. Though not directly under their control, the City Commission and administration are responding to the changing economy in many ways. To be sure, the protracted economic downturn has dealt a serious blow to the City of Dayton and its tax base. General Fund revenues in 2004 have fallen to levels not seen since 1999, despite the introduction of over $7 million in new and enhanced sources. Yet, the City Commission has remained resolute in dealing with these fiscal challenges by cutting tens of millions of dollars in expenditures while at the same time investing in the future of the City. Procuring abandoned and dilapidated factories and redeveloping them for appropriate re-use like what is being done at Tech Town is just one example. The Tech Town concept incorporates a high-tech business district with unique housing and a variety of leisure options. The district will serve as a setting where business, academia and government can work together strategically to build the region's economic infrastructure. The City's vision is not limited just to Tech Town. Dayton can be proud of progress in many areas, especially housing development, improved neighborhoods and downtown revitalization. The City with its sizable infrastructure including public facilities, parks, roads and bridges, is the urban core and central city of the region. The City is also the employment and entertainment hub assimilating some 80,000 to 100,000 daily commuters and entertainment goers. Dayton is home to about 17% of the region's population while hosting nearly 26% of the region's employment base. As we advance into the 21st century, the City is forging ahead with the same spirit that inspired the great Daytonians of the 20th century. Our economy is in transition and the path to the future is marked with both opportunities and threats. Recognizing these challenges, an 18-member committee of business, civic and union leaders along with City administration officials was convened and charged with developing a multi-year plan to strengthen the City's financial position. Rather than approaching the City's fiscal challenges in one year increments through the annual budget cycle, a Strategic Financial Plan is being crafted that will address the structural imbalance between revenue and expenditures. Additionally, the plan will incorporate funding priorities, which include increasing the efficiency of service delivery through technology as well as continued investment in capital infrastructure, economic and neighborhood development. City leadership is not sitting by idly; rather, together with its many partners it is proactively shaping a brighter tomorrow. Contacting the City’s Financial Management This financial report is designed to provide our citizen’s, taxpayers, and investors and creditors with a general overview of the City’s finances and to show the City’s accountability for the money it receives. If you have questions about this report or need additional financial information contact Cheryl Garrett, Finance Director, City of Dayton, 101 West Third Street, P.O. box 22, Dayton, OH 45401-0022, or visit our website at www.ci.dayton.oh.us.

THIS PAGE INTENTIONALLY LEFT BLANK
30

BASICFINANCIAL STATEMENTS
31

Governmental Business-type ComponentActivities Activities Total Unit
Assets:Equity in pooled cash and cash equivalents . . . . . . . . . . $ 84,482,687 $ 101,005,190 $ 185,487,877 $ 1,280,164 Cash and cash equivalents in segregated accounts. . . . . . . 26,046 - 26,046 - Investments . . . . . . . . . . . . . . . . . . . . . . . . . . 84,746 - 84,746 1,020,822 Receivables (net of allowances for uncollectibles):
Property and other local taxes. . . . . . . . . . . . . . . . 21,664,854 - 21,664,854 - Municipal income taxes . . . . . . . . . . . . . . . . . . 13,503,531 - 13,503,531 - Accounts . . . . . . . . . . . . . . . . . . . . . . . . . . 3,410,979 17,851,987 21,262,966 158,761 Contracts . . . . . . . . . . . . . . . . . . . . . . . . . . - - - 378,852 Special assessments. . . . . . . . . . . . . . . . . . . . . 2,059,557 902,192 2,961,749 - Accrued interest . . . . . . . . . . . . . . . . . . . . . . 694,809 781,572 1,476,381 1,952,419 Loans. . . . . . . . . . . . . . . . . . . . . . . . . . . . 8,400,000 - 8,400,000 22,159,585 Other . . . . . . . . . . . . . . . . . . . . . . . . . . . . - - - 76,428
Internal balances. . . . . . . . . . . . . . . . . . . . . . . . (870,970) 870,970 - - Due from other governments . . . . . . . . . . . . . . . . . 19,136,407 770,323 19,906,730 - Prepayments. . . . . . . . . . . . . . . . . . . . . . . . . . 763,933 126,517 890,450 88,828 Materials and supplies inventory. . . . . . . . . . . . . . . . - 1,220,652 1,220,652 - Inventory held for resale . . . . . . . . . . . . . . . . . . . . 771,639 - 771,639 - Other assets . . . . . . . . . . . . . . . . . . . . . . . . . . - - - 10,704 Deferred charges. . . . . . . . . . . . . . . . . . . . . . . . 193,064 2,761,596 2,954,660 - Advances to component unit. . . . . . . . . . . . . . . . . . 12,085,665 2,801,458 14,887,123 - Restricted assets: Equity in pooled cash and cash equivalents . . . . . . . . . . - 8,042,386 8,042,386 - Cash with fiscal and escrow agents . . . . . . . . . . . . . . 408,991 3,745,798 4,154,789 - Cash and cash equivalents in segregated accounts . . . . . . - - - 1,782,626 Equity investments. . . . . . . . . . . . . . . . . . . . . . . - - - 2,133,388 Deferred bond costs . . . . . . . . . . . . . . . . . . . . . . - - - 354,571 Judgements receivable . . . . . . . . . . . . . . . . . . . . . - 90,000 90,000 - Capital assets:
Land and construction in progress. . . . . . . . . . . . . . 74,264,868 77,126,290 151,391,158 - Depreciable capital assets, net . . . . . . . . . . . . . . . 212,159,415 348,399,798 560,559,213 26,872,545 Total capital assets. . . . . . . . . . . . . . . . . . . . . . 286,424,283 425,526,088 711,950,371 26,872,545
Total assets. . . . . . . . . . . . . . . . . . . . . . . . . . . 453,240,221 566,496,729 1,019,736,950 58,269,693
- - Continued
CITY OF DAYTON, OHIO
DECEMBER 31, 2004STATEMENT OF NET ASSETS
SEE ACCOMPANYING NOTES TO THE BASIC FINANCIAL STATEMENTS
Primary Government
32

Governmental Business-type ComponentActivities Activities Total Unit
Liabilities: Accounts payable. . . . . . . . . . . . . . . . . . . . . . 4,017,339 3,451,139 7,468,478 3,055,608 Contracts payable. . . . . . . . . . . . . . . . . . . . . . 1,690,952 4,182,403 5,873,355 - Accrued wages and benefits . . . . . . . . . . . . . . . . 4,002,755 1,418,343 5,421,098 - Retainage payable . . . . . . . . . . . . . . . . . . . . . 187,672 348,923 536,595 - Grants payable . . . . . . . . . . . . . . . . . . . . . . . - - - 415,410 Due to other governments . . . . . . . . . . . . . . . . . 3,545,157 660,687 4,205,844 - Deferred revenue. . . . . . . . . . . . . . . . . . . . . . 18,344,282 - 18,344,282 - Accrued interest payable. . . . . . . . . . . . . . . . . . 296,452 826,337 1,122,789 85,016 Accrued liabilities and other payables . . . . . . . . . . . - - - 761,282 Advances from primary government. . . . . . . . . . . . - - - 14,887,123 Notes payable . . . . . . . . . . . . . . . . . . . . . . . 52,688 9,350,000 9,402,688 - Payable from restricted assets: Utility deposits . . . . . . . . . . . . . . . . . . . . . . - 42,386 42,386 - Accrued interest payable . . . . . . . . . . . . . . . . . - 286,225 286,225 - Long-term liabilities:
Due within one year. . . . . . . . . . . . . . . . . . . 13,019,976 12,792,065 25,812,041 1,305,992 Due in more than one year . . . . . . . . . . . . . . . 87,551,514 96,944,699 184,496,213 21,079,722
Total liabilities . . . . . . . . . . . . . . . . . . . . . . 132,708,787 130,303,207 263,011,994 41,590,153 Net assets: Invested in capital assets, net of related debt . . . . . . . 207,581,135 309,060,125 516,641,260 6,848,059 Restricted for:
Capital projects. . . . . . . . . . . . . . . . . . . . . 24,951,149 - 24,951,149 - Debt service . . . . . . . . . . . . . . . . . . . . . . 19,104,132 - 19,104,132 - Housing and urban development. . . . . . . . . . . . 4,634,020 - 4,634,020 - Special projects . . . . . . . . . . . . . . . . . . . . . 7,769,565 - 7,769,565 - Bond proceeds restricted for construction . . . . . . . . . - - - 1,846,719 Other purposes. . . . . . . . . . . . . . . . . . . . . 6,983,806 - 6,983,806 -
Unrestricted. . . . . . . . . . . . . . . . . . . . . . . . 49,507,627 127,133,397 176,641,024 7,984,762
Total net assets . . . . . . . . . . . . . . . . . . . . . . $ 320,531,434 $ 436,193,522 $ 756,724,956 $ 16,679,540
SEE ACCOMPANYING NOTES TO THE BASIC FINANCIAL STATEMENTS
CITY OF DAYTON, OHIO
STATEMENT OF NET ASSETS (CONTINUED)DECEMBER 31, 2004
Primary Government
33

Operating Grants Capital GrantsCharges for and and
Expenses Services Contributions ContributionsPrimary Government: Governmental Activities:
Downtown. . . . . . . . . . . . . . . . . . . . . . . 5,031,993$ 504,472$ 737$ -$ Youth, education and human services. . . . . . . . . 2,208,479 29,987 1,806,955 - Community development and neighborhoods. . . . . 20,163,040 1,762,861 7,316,426 - Economic development . . . . . . . . . . . . . . . . 6,411,508 1,689,779 1,087,822 1,063,955 Leadership and quality of life . . . . . . . . . . . . . 45,891,870 6,769,017 7,289,249 8,491,921 Corporate responsibility. . . . . . . . . . . . . . . . 15,950,738 2,203,013 211,944 - Public safety and justice. . . . . . . . . . . . . . . . 92,954,582 15,049,321 1,076,856 - Other . . . . . . . . . . . . . . . . . . . . . . . . . 507,896 51,096 - - Interest and fiscal charges. . . . . . . . . . . . . . . 3,944,038 463,975 - 48,535
Total governmental activities . . . . . . . . . . . . . 193,064,144 28,523,521 18,789,989 9,604,411 Business-type Activities:
Dayton International Airport . . . . . . . . . . . . . 39,961,191 42,943,773 - 14,794,084 Water . . . . . . . . . . . . . . . . . . . . . . . . . 47,152,642 37,709,426 - - Sewer . . . . . . . . . . . . . . . . . . . . . . . . . 28,903,051 28,143,643 - - Other enterprise funds: Golf. . . . . . . . . . . . . . . . . . . . . . . . . 2,472,685 4,273,982 - - Storm Water. . . . . . . . . . . . . . . . . . . . . 3,983,545 2,785,709 - -
Total business-type activities . . . . . . . . . . . . . . 122,473,114 115,856,533 - 14,794,084
Total primary government . . . . . . . . . . . . . . . 315,537,258$ 144,380,054$ 18,789,989$ 24,398,495$
Component Unit: CityWide Development Corporation . . . . . . . . . 8,053,995$ 4,729,113$ -$ 113,671$
Change in net assets . . . . . . . . . . . . . . . . . . . . . . . . . . . . .
Net assets, January 1 (restated). . . . . . . . . . . . . . . . . . . . . .
Total general revenues . . . . . . . . . . . . . . . . . . . . . . . . . . . .
Gain on sale of capital assets. . . . . . . . . . . . . . . . . . . . . . . . . . .Special item:
Interest rate swap mark-to-market adjustment. . . . . . . . . . . . . . . . . .
CITY OF DAYTON, OHIO
Miscellaneous . . . . . . . . . . . . . . . . . . . . . . . . . . . . . . . .
FOR THE YEAR ENDED DECEMBER 31, 2004
Capital projects . . . . . . . . . . . . . . . . . . . . . . . . . . . . . .
General purposes. . . . . . . . . . . . . . . . . . . . . . . . . . . . . .
General Revenues:
Debt service . . . . . . . . . . . . . . . . . . . . . . . . . . . . . . . .
STATEMENT OF ACTIVITIES
Special purposes. . . . . . . . . . . . . . . . . . . . . . . . . . . . . .
Property taxes levied for:
Program Revenues
SEE ACCOMPANYING NOTES TO THE BASIC FINANCIAL STATEMENTS
Total general revenues and special items. . . . . . . . . . . . . . . . . . . . .
General purposes. . . . . . . . . . . . . . . . . . . . . . . . . . . . . .Income taxes levied for:
Grants and entitlements not restricted to specific programs . . . . . . . . .
Net assets, December 31 . . . . . . . . . . . . . . . . . . . . . . . . . .
Investment earnings . . . . . . . . . . . . . . . . . . . . . . . . . . . . .
34

Primary GovernmentGovernmental Business-type Component
Activities Activities Total Unit
(4,526,784)$ -$ (4,526,784)$ -$ (371,537) - (371,537) -
(11,083,753) - (11,083,753) - (2,569,952) - (2,569,952) -
(23,341,683) - (23,341,683) - (13,535,781) - (13,535,781) - (76,828,405) - (76,828,405) -
(456,800) - (456,800) - (3,431,528) - (3,431,528) -
(136,146,223) - (136,146,223) -
- 17,776,666 17,776,666 - - (9,443,216) (9,443,216) - - (759,408) (759,408) -
- 1,801,297 1,801,297 - - (1,197,836) (1,197,836) -
- 8,177,503 8,177,503 -
(136,146,223) 8,177,503 (127,968,720) -
- - - (3,211,211)
9,385,540 - 9,385,540 - 1,262,439 - 1,262,439 -
303,527 - 303,527 - 8,545,085 - 8,545,085 -
108,438,846 - 108,438,846 - 20,377,849 - 20,377,849 - 1,706,199 1,032,922 2,739,121 206,885
- - - 884 1,984,048 - 1,984,048 -
152,003,533 1,032,922 153,036,455 207,769
781,586 - 781,586 -
152,785,119 1,032,922 153,818,041 207,769
16,638,896 9,210,425 25,849,321 (3,003,442)
303,892,538 426,983,097 730,875,635 19,682,982
$ 320,531,434 $ 436,193,522 $ 756,724,956 $ 16,679,540
Net (Expense) Revenue and Changes in Net Assets
35

Other Total Capital Governmental Governmental
General Debt Service Improvement Funds FundsAssets:
Equity in pooled cash and cash equivalents . . . . . $ 27,207,589 $ 6,543,012 $ 13,328,450 $ 12,649,908 $ 59,728,959 Cash and cash equivalents in segregated accounts. . - - - 26,046 26,046 Investments . . . . . . . . . . . . . . . . . . . . . - - - 84,746 84,746 Receivables (net of allowance for uncollectibles):
Property and other local taxes. . . . . . . . . . . . 10,846,386 10,102,493 - 715,975 21,664,854 Municipal income taxes. . . . . . . . . . . . . . 13,503,531 - - - 13,503,531 Accounts . . . . . . . . . . . . . . . . . . . . . 3,176,918 - - 195,117 3,372,035 Special assessments. . . . . . . . . . . . . . . . - 1,747,569 - 311,988 2,059,557 Accrued interest . . . . . . . . . . . . . . . . . 642,841 - 42,652 9,316 694,809 Loans . . . . . . . . . . . . . . . . . . . . . . . - 8,400,000 - - 8,400,000 Interfund loans . . . . . . . . . . . . . . . . . . 1,183,320 - - - 1,183,320
Prepayments. . . . . . . . . . . . . . . . . . . . . . 759,288 - 267 963 760,518 Due from other funds . . . . . . . . . . . . . . . . 41,755 - - - 41,755 Due from other governments . . . . . . . . . . . . 8,382,599 486,374 5,013,688 5,253,746 19,136,407 Advances to component unit . . . . . . . . . . . . - - 6,631,709 5,453,956 12,085,665 Restricted assets: Cash and cash equivalents with fiscal agents . . . - 408,991 - - 408,991
Total assets . . . . . . . . . . . . . . . . . . . . . . $ 65,744,227 $ 27,688,439 $ 25,016,766 $ 24,701,761 $ 143,151,193
Liabilities:Accounts payable . . . . . . . . . . . . . . . . . . $ 2,601,890 $ 15,667 $ 128,961 $ 1,073,991 $ 3,820,509 Contracts payable . . . . . . . . . . . . . . . . . . 240,213 - 501,785 948,954 1,690,952 Accrued wages and benefits. . . . . . . . . . . . . 3,370,547 2,943 17,883 458,476 3,849,849 Compensated absences payable. . . . . . . . . . . 124,369 - - - 124,369 Retainage payable. . . . . . . . . . . . . . . . . . - - 150,430 37,242 187,672 Due to other funds . . . . . . . . . . . . . . . . . 423,634 - 312 130,187 554,133 Due to other governments. . . . . . . . . . . . . . 3,524,027 - - 21,130 3,545,157 Interfund payable . . . . . . . . . . . . . . . . . . - - - 1,183,320 1,183,320 Notes payable . . . . . . . . . . . . . . . . . . . . - - 52,688 - 52,688 Claims payable . . . . . . . . . . . . . . . . . . . . 104,849 - - - 104,849 Judgements payable. . . . . . . . . . . . . . . . . 3,811 - - - 3,811 Deferred revenue . . . . . . . . . . . . . . . . . . 18,943,280 12,336,436 39,857 2,541,746 33,861,319
Total liabilities . . . . . . . . . . . . . . . . . . . . 29,336,620 12,355,046 891,916 6,395,046 48,978,628
Fund Balances:Reserved for encumbrances. . . . . . . . . . . . . . 3,188,229 37,704 16,576,846 7,154,070 26,956,849 Reserved for prepayments . . . . . . . . . . . . . . 759,288 - 267 963 760,518 Reserved for claimants . . . . . . . . . . . . . . . . 503,676 - - - 503,676 Reserved for advances to component unit. . . . . . . - - 6,631,709 5,453,956 12,085,665 Reserved for debt service. . . . . . . . . . . . . . . - 6,895,689 - - 6,895,689 Reserved for contributions to permanent fund . . . . - - - 102,228 102,228 Reserved for loans . . . . . . . . . . . . . . . . . . - 8,400,000 - - 8,400,000 Unreserved, designated for, reported in:
General fund . . . . . . . . . . . . . . . . . . . 2,161,198 - - - 2,161,198 Special revenue funds. . . . . . . . . . . . . . . - - - 400,000 400,000 Unreserved, undesignated, reported in: General fund . . . . . . . . . . . . . . . . . . . 29,795,216 - - - 29,795,216 Special revenue funds . . . . . . . . . . . . . . - - - 4,402,528 4,402,528 Permanent fund . . . . . . . . . . . . . . . . . - - - 53,439 53,439 Capital projects funds . . . . . . . . . . . . . . - - 916,028 739,531 1,655,559
Total fund balances . . . . . . . . . . . . . . . . . 36,407,607 15,333,393 24,124,850 18,306,715 94,172,565
Total liabilities and fund balances . . . . . . . . . . $ 65,744,227 $ 27,688,439 $ 25,016,766 $ 24,701,761 $ 143,151,193
SEE ACCOMPANYING NOTES TO THE BASIC FINANCIAL STATEMENTS
CITY OF DAYTON, OHIO
BALANCE SHEETGOVERNMENTAL FUNDS
DECEMBER 31, 2004
36

Total governmental fund balances 94,172,565$
Amounts reported for governmental activities in the statement of net assets are different because:
Capital assets used in governmental activities (excluding internal service funds capital assets) are not financial resources and therefore are 285,089,920 not reported in the funds.
Other long-term assets are not available to pay for current period expenditures and therefore are deferred in the funds.
Property taxes 3,290,783$ Income tax 1,527,325 Special assessments 2,059,557 State shared taxes 5,421,592 Charges for services 1,479,434 Accrued interest 649,284 Intergovernmental revenues 1,089,062
Total 15,517,037
Unamortized premiums on bond issuance is not recognized in the funds. (236,604)
Unamortized bond issuance costs are not recognized in the funds. 193,064
Internal service funds are used by management to charge the costs of fleet management, fire fleet management, stores and reproduction, workers' compensation, and plumbing to individual funds. The assets and liabilities of the internal service funds are included in governmental activities in the statement of net assets. The net assets of the internal service funds, including internal balances of $(1,060,635), are: 14,936,363
Long-term liabilities, including bonds, accrued interest, and compensated absences, are not due and payable in the current period and therefore are not reported in the funds.
Accrued interest payable 296,452 Special assessment bonds 1,244,721 General obligation bonds 62,429,997 Revenue bonds 11,385,000 Compensated absences 10,249,457 Capital lease payable 3,535,284
Total (89,140,911)
Net assets of governmental activities 320,531,434$
DECEMBER 31, 2004
SEE ACCOMPANYING NOTES TO THE BASIC FINANCIAL STATEMENTS
CITY OF DAYTON, OHIO
RECONCILIATION OF TOTAL GOVERNMENTAL FUND BALANCES TONET ASSETS OF GOVERNMENTAL ACTIVITIES
37

Other Total Capital Governmental Governmental
General Debt Service Improvement Funds FundsRevenues:
Municipal income taxes. . . . . . . . . . . . . 107,737,232$ -$ -$ -$ 107,737,232$ Property and other taxes . . . . . . . . . . . . 9,664,733 324,391 9,067,071 609,449 19,665,644 State shared taxes. . . . . . . . . . . . . . . . 17,544,746 - - 4,978,757 22,523,503 Charges for services . . . . . . . . . . . . . . 18,261,799 - 352,486 1,681,590 20,295,875 Licenses and permits . . . . . . . . . . . . . . 1,750,643 - 66,579 - 1,817,222 Fines and forfeitures . . . . . . . . . . . . . . 1,535,094 - - 297,616 1,832,710 Intergovernmental . . . . . . . . . . . . . . . 1,579,154 974,855 8,108,424 14,671,019 25,333,452 Special assessments . . . . . . . . . . . . . . 339,721 246,528 383,497 64,669 1,034,415 Investment income . . . . . . . . . . . . . . . 2,286,681 - - 2,222 2,288,903 Increase in FMV of investments . . . . . . . . - - - 14,276 14,276 Other . . . . . . . . . . . . . . . . . . . . . . 1,831,690 150,000 560,484 2,210,919 4,753,093 Total revenues . . . . . . . . . . . . . . . . . 162,531,493 1,695,774 18,538,541 24,530,517 207,296,325
Expenditures: Current:
Downtown . . . . . . . . . . . . . . . . . . . 3,606,582 560,000 - 825 4,167,407 Youth, education and human services. . . . . . 214,881 - - 2,022,349 2,237,230 Community development and neighborhoods. . 11,248,295 - 312 9,063,068 20,311,675 Economic development . . . . . . . . . . . . . 2,739,633 - - 3,670,740 6,410,373 Leadership and quality of life . . . . . . . . . . 28,193,800 6,922 53 13,119,000 41,319,775 Corporate responsibility. . . . . . . . . . . . . 13,944,134 345,442 - 580,713 14,870,289 Public safety and justice . . . . . . . . . . . . 90,124,997 - - 2,548,275 92,673,272
Other . . . . . . . . . . . . . . . . . . . . . . . 366,142 123,982 - 16,766 506,890 Capital outlay. . . . . . . . . . . . . . . . . . . - - 17,055,356 6,291,109 23,346,465 Debt service:
Principal retirement . . . . . . . . . . . . . . 34,427 8,192,386 - 1,002,000 9,228,813 Interest and fiscal charges . . . . . . . . . . . 250 3,849,379 85,388 27,929 3,962,946 Bond issuance costs . . . . . . . . . . . . . . - 199,535 - - 199,535
Total expenditures . . . . . . . . . . . . . . . . 150,473,141 13,277,646 17,141,109 38,342,774 219,234,670
Excess (deficiency) of revenues over (under) expenditures . . . . . . . . . 12,058,352 (11,581,872) 1,397,432 (13,812,257) (11,938,345)
Other financing sources (uses):Sale of capital assets. . . . . . . . . . . . . . - 100,000 183,797 541,052 824,849 Bonds issued. . . . . . . . . . . . . . . . . . - 8,731,021 3,000,000 - 11,731,021 Premium on bonds sold. . . . . . . . . . . . . - 244,535 - - 244,535 Capital lease transactions. . . . . . . . . . . . - - - 4,500,000 4,500,000 Transfers in . . . . . . . . . . . . . . . . . . - - 6,574,500 8,675,026 15,249,526 Transfers out . . . . . . . . . . . . . . . . . (15,349,526) - - - (15,349,526)
Total other financing sources (uses) . . . . . . . (15,349,526) 9,075,556 9,758,297 13,716,078 17,200,405
Net change in fund balances . . . . . . . . . . . (3,291,174) (2,506,316) 11,155,729 (96,179) 5,262,060
Fund balances at beginning of year (restated) . 39,698,781 17,839,709 12,969,121 18,402,894 88,910,505 Fund balances at end of year . . . . . . . . . . 36,407,607$ 15,333,393$ 24,124,850$ 18,306,715$ 94,172,565$
SEE ACCOMPANYING NOTES TO THE BASIC FINANCIAL STATEMENTS
CITY OF DAYTON, OHIO
STATEMENT OF REVENUES, EXPENDITURES AND CHANGES IN FUND BALANCESGOVERNMENTAL FUNDS
FOR THE YEAR ENDED DECEMBER 31, 2004
38

Net change in fund balances - total governmental funds 5,262,060$
Amounts reported for governmental activities in the statement of activities are different because:
Government funds report capital outlays as expenditures. However, in the statement of activities, the cost of those assets are allocated over their estimated useful lives as depreciation expense. This is the amount by which capital outlays ($24,327,555) exceeded depreciation expense ($8,955,189) in the current period. 15,372,366
Governmental funds only report the disposal of capital assets to the extent proceeds are received from the sale. In the statement of activities, a gain or loss is reported for each disposal. (43,263)
Premiums on debt issuances are recongnized as revenues in the governmental funds, however, they are amortized over the life of the issuance on the statement of activities. (236,604)
Bond issuance costs are recognized as expenditures in the governmental funds, however, they are amortized over the life of the issuance on the statement of activities. 193,064
Revenues in the statement of activities that do not provide current financial resources are not reported as revenues in the funds. 1,625,129
Bond and capital lease proceeds provide current financial resources to governmental funds, but issuing debt increases long-term liabilities in the statement of net assets. (16,231,021)
Repayment of bond, note and capital lease principal is an expenditure in the governmental funds, but the repayment reduces long-term liabilities in the statement of net assets. 9,228,813
In the statement of activities, interest is accrued on outstanding bonds, whereas in governmental funds, an interest expenditure is reported when due. 35,957
Some expenses reported in the statement of activities, such as compensated absences, do not require the use of current financial resources and therefore are not reported as expenditures in governmental funds. (496,614)
Internal service funds used by management to charge the costs of fleet management, fire fleet management, stores and reproduction, worker's compensation, and plumbing to individual funds are not reported in the entity-wide statement of activities. Governmental fund expenditures and the related internal service funds revenues are eliminated. The net revenue (expense) of the internal service funds including internal balances of $(302,845), is allocated among the governmental activities. 1,929,009
Change in net assets of governmental activities 16,638,896$
SEE ACCOMPANYING NOTES TO THE BASIC FINANCIAL STATEMENTS
FOR THE YEAR ENDED DECEMBER 31, 2004
CITY OF DAYTON, OHIO
RECONCILIATION OF THE STATEMENT OF REVENUES, EXPENDITURES, AND CHANGESIN FUND BALANCES OF GOVERNMENTAL FUNDS TO THE STATEMENT OF ACTIVITIES
39

Variance withFinal Budget
PositiveOriginal Final Actual (Negative)
Revenues:Municipal income taxes . . . . . . . . . . . . . . . 108,211,000$ 109,481,600$ 108,794,693$ (686,907)$ Property and other local taxes . . . . . . . . . . . . 10,873,700 10,762,200 10,905,262 143,062 State shared taxes . . . . . . . . . . . . . . . . . . 15,344,900 17,483,100 17,558,581 75,481 Charges for services . . . . . . . . . . . . . . . . . 17,849,200 18,510,200 18,987,857 477,657 Licenses and permits. . . . . . . . . . . . . . . . . 1,589,100 2,000,100 1,750,643 (249,457) Fines and forfeitures. . . . . . . . . . . . . . . . . 1,615,000 1,617,400 1,558,903 (58,497) Special assessments . . . . . . . . . . . . . . . . . - 319,800 339,720 19,920 Investment income . . . . . . . . . . . . . . . . . 3,728,300 4,160,600 3,663,909 (496,691) Other . . . . . . . . . . . . . . . . . . . . . . . . 2,443,000 2,684,200 2,511,271 (172,929)
Total revenues. . . . . . . . . . . . . . . . . . . 161,654,200 167,019,200 166,070,839 (948,361)
Expenditures: Current:
Downtown . . . . . . . . . . . . . . . . . . . 3,657,490 3,647,879 3,503,840 144,039 Youth, education and human services. . . . . . 239,962 239,331 229,881 9,450 Community development and neighborhoods. 11,396,001 11,366,055 10,917,259 448,796 Economic development . . . . . . . . . . . . . 2,827,707 2,820,276 2,708,916 111,360 Leadership and quality of life . . . . . . . . . . 28,385,490 28,310,901 27,193,027 1,117,874 Corporate responsibility. . . . . . . . . . . . . 15,174,093 15,134,219 14,536,635 597,584 Public safety and justice . . . . . . . . . . . . 95,449,634 95,198,816 91,439,831 3,758,985
Other . . . . . . . . . . . . . . . . . . . . . . . 571,323 569,823 547,323 22,500 Total expenditures. . . . . . . . . . . . . . . . . . 157,701,700 157,287,300 151,076,712 6,210,588
Excess of revenues over expenditures. . . . . . . . . . . . . . . . . . . 3,952,500 9,731,900 14,994,127 5,262,227 Other financing uses:
Transfers in . . . . . . . . . . . . . . . . . . . . . 677,700 124,224 124,224 - Transfers out . . . . . . . . . . . . . . . . . . . . (10,683,400) (19,626,700) (15,349,527) 4,277,173
Total other financing uses . . . . . . . . . . . . (10,005,700) (19,502,476) (15,225,303) 4,277,173
Net change in fund balance. . . . . . . . . . . . . . (6,053,200) (9,770,576) (231,176) 9,539,400
Fund balance at beginning of year (restated). . . . 18,420,816 18,420,816 18,420,816 - Prior year encumbrances appropriated. . . . . . . 4,603,923 4,603,923 4,603,923 -
Fund balance at end of year. . . . . . . . . . . . . $ 16,971,539 $ 13,254,163 $ 22,793,563 $ 9,539,400
CITY OF DAYTON, OHIO
STATEMENT OF REVENUES, EXPENDITURES, AND CHANGES INFUND BALANCE - BUDGET AND ACTUAL (NON-GAAP BUDGETARY BASIS)
GENERAL FUNDFOR THE YEAR ENDED DECEMBER 31, 2004
Budgeted Amounts
40

THIS PAGE IS INTENTIONALLY LEFT BLANK
41
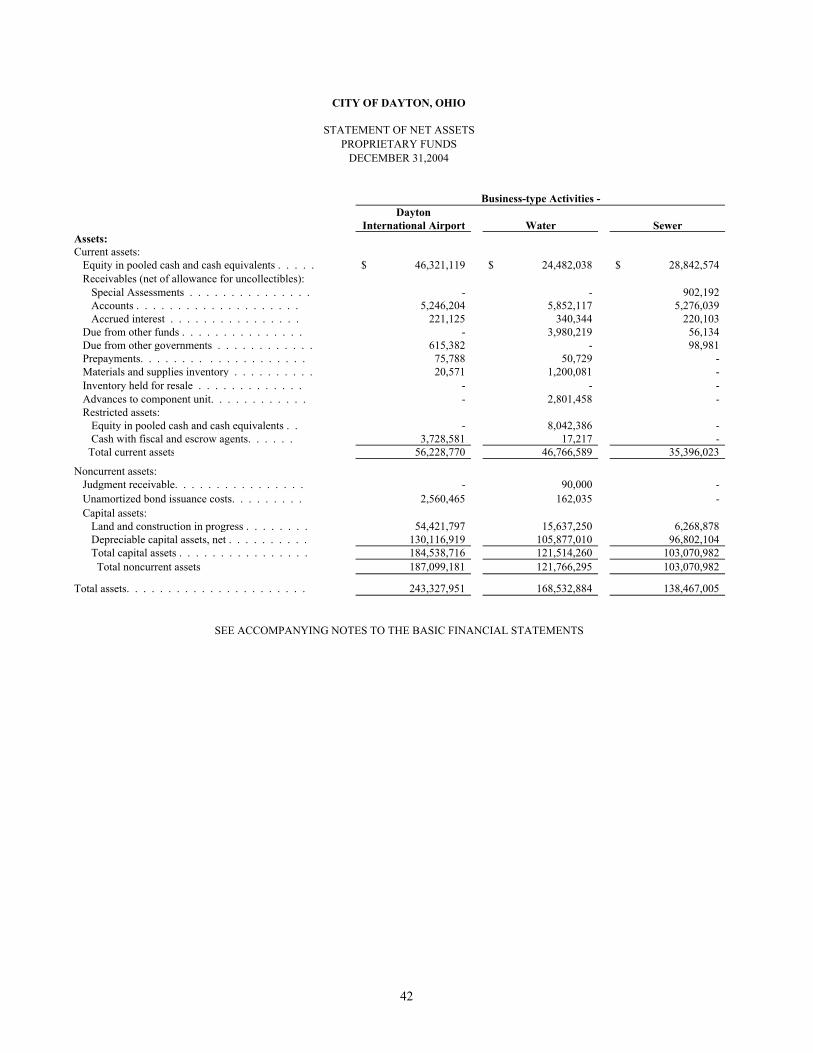
DaytonInternational Airport Water Sewer
Assets:Current assets:
Equity in pooled cash and cash equivalents . . . . . 46,321,119$ 24,482,038$ 28,842,574$ Receivables (net of allowance for uncollectibles):
Special Assessments . . . . . . . . . . . . . . . - - 902,192 Accounts . . . . . . . . . . . . . . . . . . . . 5,246,204 5,852,117 5,276,039 Accrued interest . . . . . . . . . . . . . . . . 221,125 340,344 220,103
Due from other funds . . . . . . . . . . . . . . . - 3,980,219 56,134 Due from other governments . . . . . . . . . . . . 615,382 - 98,981 Prepayments. . . . . . . . . . . . . . . . . . . . 75,788 50,729 - Materials and supplies inventory . . . . . . . . . . 20,571 1,200,081 - Inventory held for resale . . . . . . . . . . . . . - - - Advances to component unit. . . . . . . . . . . . - 2,801,458 - Restricted assets:
Equity in pooled cash and cash equivalents . . - 8,042,386 - Cash with fiscal and escrow agents. . . . . . 3,728,581 17,217 -
Total current assets 56,228,770 46,766,589 35,396,023
Noncurrent assets:Judgment receivable. . . . . . . . . . . . . . . . - 90,000 - Unamortized bond issuance costs. . . . . . . . . 2,560,465 162,035 - Capital assets:
Land and construction in progress . . . . . . . . 54,421,797 15,637,250 6,268,878 Depreciable capital assets, net . . . . . . . . . . 130,116,919 105,877,010 96,802,104 Total capital assets . . . . . . . . . . . . . . . . 184,538,716 121,514,260 103,070,982 Total noncurrent assets 187,099,181 121,766,295 103,070,982
Total assets. . . . . . . . . . . . . . . . . . . . . . 243,327,951 168,532,884 138,467,005
SEE ACCOMPANYING NOTES TO THE BASIC FINANCIAL STATEMENTS
CITY OF DAYTON, OHIO
Business-type Activities -
DECEMBER 31,2004PROPRIETARY FUNDS
STATEMENT OF NET ASSETS
42

GovernmentalActivities -
Other InternalEnterprise Total Service Funds
1,359,459$ 101,005,190$ 24,753,728$
- 902,192 - 1,477,627 17,851,987 38,944
- 781,572 - 14,906 4,051,259 704,280 55,960 770,323 -
- 126,517 3,415 - 1,220,652 - - - 771,639 - 2,801,458 -
- 8,042,386 - - 3,745,798 -
2,907,952 141,299,334 26,272,006
- 90,000 - 39,096 2,761,596 -
798,365 77,126,290 75,000 15,603,765 348,399,798 1,259,363 16,402,130 425,526,088 1,334,363 16,441,226 428,377,684 1,334,363
19,349,178 569,677,018 27,606,369 - - Continued
Enterprise Funds
43

DaytonInternational Airport Water Sewer
Liabilities:Current liabilities:
Accounts payable . . . . . . . . . . . . . . . . . 1,039,828 1,700,740 667,069 Contracts payable . . . . . . . . . . . . . . . . . 3,200,034 410,003 554,894 Accrued wages and benefits . . . . . . . . . . . . 516,878 612,822 209,656 Compensated absences - current. . . . . . . . 239,271 350,762 157,440 Retainage payable . . . . . . . . . . . . . . . . . 289,577 17,563 41,783 Accrued interest payable. . . . . . . . . . . . . . 92,055 - 726,098 Due to other funds . . . . . . . . . . . . . . . . . 81,694 96,974 3,384,043 Due to other governments . . . . . . . . . . . . . 517,074 138,890 4,230 Claims payable - current. . . . . . . . . . . . . . - - - General obligation notes payable. . . . . . . . . . 9,350,000 - - General obligation bonds payable - current. . . . . - - - OWPC loan payable - current. . . . . . . . . . . - - 50,000 OWDA loan payable - current. . . . . . . . . . . - - 2,962,995 Capital lease payable - current. . . . . . . . . . . - - - Payable from restricted assets:
Utility deposits . . . . . . . . . . . . . . . . . - 42,386 - Accrued interest payable . . . . . . . . . . . . 229,627 56,598 - Revenue bonds - current. . . . . . . . . . . . 3,005,000 5,620,000 - Total current liabilities. . . . . . . . . . . . . 18,561,038 9,046,738 8,758,208
Noncurrent liabilities: Compensated absences. . . . . . . . . . . . . . 538,339 789,187 354,228
Claims payable . . . . . . . . . . . . . . . . . . - - - General obligation bonds payable . . . . . . . . . 59,640,625 - - Revenue bonds payable (net of unamortized discounts and deferred amount on refunding). . . . . . . . - 10,870,650 - OPWC loan payable . . . . . . . . . . . . . . . - - 750,000 OWDA loan payable . . . . . . . . . . . . . . . - - 21,576,690 Capital lease obligation . . . . . . . . . . . . . . - - -
Total noncurrent liabilities. . . . . . . . . . . . . 60,178,964 11,659,837 22,680,918
Total liabilities . . . . . . . . . . . . . . . . . . . . 78,740,002 20,706,575 31,439,126
Net assets: Invested in capital assets, net of related debt . . . . 112,517,682 105,023,610 77,731,297 Unrestricted. . . . . . . . . . . . . . . . . . . . 52,070,267 42,802,699 29,296,582
Total net assets . . . . . . . . . . . . . . . . . . . 164,587,949$ 147,826,309$ 107,027,879$
SEE ACCOMPANYING NOTES TO THE BASIC FINANCIAL STATEMENTS
Net assets of business-type activities.
Business-type Activities
Adjustment to reflect the consolidation of the internal service funds activities related to enterprise funds.
CITY OF DAYTON, OHIO
STATEMENT OF NET ASSETSPROPRIETARY FUNDS (CONTINUED)
DECEMBER 31,2004
44

GovernmentalActivities -
Other InternalEnterprise Total Service Funds
43,502 3,451,139 196,830 17,472 4,182,403 - 78,987 1,418,343 152,907 58,947 806,421 112,689
- 348,923 - 8,184 826,337 -
678,213 4,240,924 2,237 493 660,687 -
- - 174,181 - 9,350,000 -
347,649 347,649 - - 50,000 - - 2,962,995 - - - 70,927
- 42,386 - - 286,225 - - 8,625,000 -
1,233,447 37,599,432 709,771
132,627 1,814,380 177,150 - - 10,597,919
2,292,354 61,932,979 -
- 10,870,650 - - 750,000 - - 21,576,690 - - - 124,531
2,424,981 96,944,699 10,899,600
3,658,428 134,544,131 11,609,371
13,762,127 309,034,716 1,138,905
1,928,623 126,098,171 14,858,093 15,690,750$ 435,132,887 15,996,998$
1,060,635
$ 436,193,522
Enterprise Funds
45

DaytonInternational Airport Water Sewer
Operating revenues:Charges for services . . . . . . . . . . . . . . . . . $ 38,438,018 $ 34,836,303 $ 28,143,643 Other. . . . . . . . . . . . . . . . . . . . . . . . . 4,505,755 2,873,123 -
Total operating revenues . . . . . . . . . . . . . . . . 42,943,773 37,709,426 28,143,643
Operating expenses:Personal services . . . . . . . . . . . . . . . . . . 10,917,123 15,725,799 5,821,206 Benefit payments . . . . . . . . . . . . . . . . . . 3,550,513 5,273,935 1,955,186 Contractual services. . . . . . . . . . . . . . . . . 8,510,166 7,894,063 8,104,255 Materials and supplies . . . . . . . . . . . . . . . 1,528,328 3,776,845 1,448,869 Utilities . . . . . . . . . . . . . . . . . . . . . . . 1,823,061 5,948,471 2,078,552 Cost of sales . . . . . . . . . . . . . . . . . . . . - - - Depreciation . . . . . . . . . . . . . . . . . . . . 7,283,775 5,585,217 6,956,746 Claims expense. . . . . . . . . . . . . . . . . . . - - - Other . . . . . . . . . . . . . . . . . . . . . . . . 2,808,091 2,096,381 866,395
Total operating expenses. . . . . . . . . . . . . . . . 36,421,057 46,300,711 27,231,209
Operating income (loss) . . . . . . . . . . . . . . . . 6,522,716 (8,591,285) 912,434
Nonoperating revenues (expenses):Interest revenue . . . . . . . . . . . . . . . . . . . 1,032,922 - - Interest expense and fiscal charges . . . . . . . . . (3,611,752) (985,409) (1,725,355)
Total nonoperating revenues (expenses) . . . . . . . . (2,578,830) (985,409) (1,725,355)
Income (loss) before capital contributions and transfers . . . . . . . . . . . . . . . . . . . . . . . 3,943,886 (9,576,694) (812,921)
Capital contributions . . . . . . . . . . . . . . . . 14,794,084 - - Transfers in. . . . . . . . . . . . . . . . . . . . . - - -
Changes in net assets . . . . . . . . . . . . . . . . . 18,737,970 (9,576,694) (812,921)
Net assets, January 1 (restated) . . . . . . . . . . . 145,849,979 157,403,003 107,840,800
Net assets, December 31 . . . . . . . . . . . . . . . $ 164,587,949 $ 147,826,309 $ 107,027,879
Business-type Activities -
FOR THE YEAR ENDED DECEMBER 31, 2004
SEE ACCOMPANYING NOTES TO THE BASIC FINANCIAL STATEMENTS
CITY OF DAYTON, OHIO
STATEMENT OF REVENUES, EXPENSES ANDCHANGES IN NET ASSETS
PROPRIETARY FUNDS
Adjustment to reflect the consolidation of the internal service funds activities related to enterprise funds.
Changes in net assets of business-type activities.
46

Governmental Activities -
Other InternalEnterprise Total Service Funds
$ 7,027,695 $ 108,445,659 $ 14,947,704 31,996 7,410,874 80,865
7,059,691 115,856,533 15,028,569
2,873,236 35,337,364 3,884,066 903,301 11,682,935 1,326,811 1,054,065 25,562,549 1,017,130 501,919 7,255,961 479,047 222,797 10,072,881 18,152 - - 3,189,483 585,297 20,411,035 234,422 - - 3,585,828 222,078 5,992,945 17,191
6,362,693 116,315,670 13,752,130
696,998 (459,137) 1,276,439
- 1,032,922 - (137,773) (6,460,289) (18,509)
(137,773) (5,427,367) (18,509)
559,225 (5,886,504) 1,257,930
- 14,794,084 873,924 - - 100,000
559,225 8,907,580 2,231,854
15,131,525 13,765,144
$ 15,690,750 $ 15,996,998
302,845
$ 9,210,425
Enterprise Funds
47

DaytonInternational Airport Water Sewer
Cash flows from operating activities:Cash received from customers . . . . . . . . . . . . . 39,350,827$ 35,277,855$ 27,344,352$ Cash received from other operating revenues . . . . . 4,872,796 2,860,895 37,354 Cash payments for personal services . . . . . . . . . (10,725,541) (15,487,310) (5,751,582) Cash payments for fringe benefits . . . . . . . . . . . (3,503,435) (5,217,233) (1,936,661) Cash payments for contract services. . . . . . . . . . (8,861,967) (4,529,713) (8,258,451) Cash payments for materials and supplies. . . . . . . (1,533,794) (7,479,650) (1,427,146) Cash payments for cost of goods sold. . . . . . . . . - - - Cash payments for utilities . . . . . . . . . . . . . . (1,765,939) (5,753,113) (2,237,286) Cash payments for claims . . . . . . . . . . . . . . . - - - Cash payments for other operating expenses . . . . . (2,473,081) (2,366,104) (906,520)
Net cash provided by (used in) operating activities. 15,359,866 (2,694,373) 6,864,060
Cash flows from noncapital financing activities:Cash received from advance to component unit . . . . - 472,934 - Cash payments from advance to component unit . . . . . . . . . . . . . . . . . . - (44,879) - Transfers in. . . . . . . . . . . . . . . . . . . . . . - - -
Net cash provided by (used in) noncapital financing activities . . . . . . . . . . . . . . . . - 428,055 -
Cash flows from capital and related financing activities:Acquisition of capital assets . . . . . . . . . . . . . (15,196,189) (7,194,839) (5,771,323) Capital contributions . . . . . . . . . . . . . . . . . 17,574,541 - - Proceeds from notes . . . . . . . . . . . . . . . . . 9,350,000 - - Principal paid on notes . . . . . . . . . . . . . . . . (4,850,000) - - Interest paid on notes. . . . . . . . . . . . . . . . . (97,000) - - Principal paid on bonds. . . . . . . . . . . . . . . . (2,485,000) (5,405,000) - Interst paid on bonds . . . . . . . . . . . . . . . . . (3,196,801) (893,310) - Proceeds from loans. . . . . . . . . . . . . . . . - - 453,006 Principal paid on loans . . . . . . . . . . . . . . . . - - (3,364,332) Interest paid on loans. . . . . . . . . . . . . . . . . - - (1,562,095) Principal paid on capital leases . . . . . . . . . . . . - - - Interest paid on capital leases. . . . . . . . . . . . . - - -
Net cash provided by (used in) capital and related financing activities . . . . . . . . . . 1,099,551 (13,493,149) (10,244,744)
Cash flows from investing activities: Interest received . . . . . . . . . . . . . . . . . . . 1,022,743 - -
Net cash provide by investing activities . . . . . . . 1,022,743 - -
Net increase (decrease) in cash and cash equivalents . . 17,482,160 (15,759,467) (3,380,684)
Cash and cash equivalents at beginning of year (Restated). . . . . . . . . . . . . . . . . . . 32,567,540 48,301,108 32,223,258
Cash and cash equivalents at end of year. . . . . . . $ 50,049,700 $ 32,541,641 $ 28,842,574
SEE ACCOMPANYING NOTES TO THE BASIC FINANCIAL STATEMENTS
STATEMENT OF CASH FLOWS
CITY OF DAYTON, OHIO
Business-type Activities -
FOR THE YEAR ENDED DECEMBER 31, 2004PROPRIETARY FUNDS
48

GovernmentalActivities -
Other InternalEnterprise Total Service Funds
6,301,021$ 108,274,055$ 14,893,845$ 18,745 7,789,790 18,314
(2,845,583) (34,810,016) (3,832,848) (901,536) (11,558,865) (1,312,183) (950,937) (22,601,068) (843,496) (559,157) (10,999,747) (386,876)
- - (3,153,724) (212,786) (9,969,124) (13,837)
- - (4,161,382) (222,591) (5,968,296) (17,589)
627,176 20,156,729 1,190,224
- 472,934 (319,229)
- (44,879) - - - 100,000
- 428,055 (219,229)
(79,943) (28,242,294) (82,158) - 17,574,541 - - 9,350,000 - - (4,850,000) - - (97,000) -
(464,199) (8,354,199) - (127,953) (4,218,064) -
- 453,006 - - (3,364,332) - - (1,562,095) -
(110,127) (110,127) (65,491) (7,337) (7,337) (18,509)
(789,559) (23,427,901) (166,158)
- 1,022,743 - - 1,022,743 -
(162,383) (1,820,374) 804,837
1,521,842 114,613,748 23,948,891
$ 1,359,459 $ 112,793,374 $ 24,753,728
- - continued
Enterprise Funds
49

DaytonInternational Airport Water Sewer
Reconciliation of operating income (loss) to net cash provided by (used in) operating activities:
Operating income (loss) . . . . . . . . . . . . . . . . . 6,522,716$ (8,591,285)$ 912,434$
Adjustments: Depreciation . . . . . . . . . . . . . . . . . . . . . 7,283,775 5,585,217 6,956,746
Changes in assets and liabilities: (Increase) decrease in accounts receivable . . . . . . 1,592,066 632,609 22,593 Increase in due from other funds. . . . . . . . . . . - (270,934) (56,134) Increase in prepaid assets. . . . . . . . . . . . . . (75,788) (50,729) - Increase in special assessments receivable. . . . . . - - (902,192) Increase in due from other governments. . . . . . . - - (98,981) Decrease in judgments receivable . . . . . . . . . . - 60,000 - Increase in materials and supplies inventory. . . . . (5,838) (161,399) - Decrease in inventory held for resale . . . . . . . . . - - - Increase (decrease) in accounts payable . . . . . . . (818,070) 570,581 184,026 Increase (decrease) in contracts payable . . . . . . . . 568,975 (294,652) (659,759) Increase (decrease) in retainage payable. . . . . . . . 32,626 (95,999) 24,585 Increase in accrued wages and benefits . . . . . . . 202,183 178,834 63,564 Increase (decrease) in due to other funds. . . . . . . . 45,172 (380,252) 511,987 Increase (decrease) in due to other governments . . . (24,428) (370) 397 Increase in utility deposits. . . . . . . . . . . . . . - 7,649 - Increase (decrease) in compensated absences payable . . . . . . . . . . . . . . . . . . 36,477 116,357 (95,206) Increase in claims payable . . . . . . . . . . . . . . - - -
Net cash provided by (used in) operating activities. . . $ 15,359,866 $ (2,694,373) $ 6,864,060
Non-cash transactions:
During 2004, the Dayton International Airport received $2,189,924 in capital grants, which was recognized as a receivable in 2003. A receivablein the amount of $3,090,446 has been recorded for capital grants in 2003.
SEE ACCOMPANYING NOTES TO THE BASIC FINANCIAL STATEMENTS
FOR THE YEAR ENDED DECEMBER 31, 2004PROPRIETARY FUNDS (CONTINUED)
At December 31, 2003, the Water, Sewer, Dayton International Airport and Storm Water (reported as an other enterprise fund) enterprise fundspurchased $476,588, $457,836, $1,139,193 and $6,715, respectively, in capital assets on account. At December 31, 2004, the Water, Sewer,Dayton International Airport and Storm Water (reported as an other enterprise fund) enterprise funds purchased $237,244, $362,019, $2,554,927and $15,434, respectively, in capital assets on account.
STATEMENT OF CASH FLOWS
CITY OF DAYTON, OHIO
Business-type Activities -
50

GovernmentalActivities -
Other InternalEnterprise Total Service Funds
696,998$ (459,137)$ 1,276,439$
585,297 20,411,035 234,422
(680,205) 1,567,063 (30,701) (14,906) (341,974) (85,709)
- (126,517) (3,415) - (902,192) -
(55,960) (154,941) - - 60,000 - - (167,237) - - - 35,759
(60,002) (123,465) (31,894) 3,493 (381,943) - 2,758 (36,030) -
13,298 457,879 54,573 119,577 296,484 (509)
14 (24,387) (2,045,099) - 7,649 -
16,814 74,442 11,273 - - 1,775,085
$ 627,176 $ 20,156,729 $ 1,190,224
Enterprise Funds
51

Agency
Assets:
Equity in pooled cash and cash equivalents . . . . . . $ 5,187,087 Cash and cash equivalents with fiscal agent . . . . . . 503,399 Investments with fiscal agent . . . . . . . . . . . . . 1,102,170 Due from other governments. . . . . . . . . . . . . 762,775
Total assets . . . . . . . . . . . . . . . . . . . . . . $ 7,555,431
Liabilities:Due to other governments . . . . . . . . . . . . . . . $ 1,767,441 Due to others. . . . . . . . . . . . . . . . . . . . . . 212,061 Withholdings and deposits . . . . . . . . . . . . . . . 5,575,929
Total liabilities . . . . . . . . . . . . . . . . . . . . $ 7,555,431
SEE ACCOMPANYING NOTES TO THE BASIC FINANCIAL STATEMENTS
CITY OF DAYTON, OHIO
STATEMENT OF FIDUCIARY NET ASSETSFIDUCIARY FUNDSDECEMBER 31, 2004
52

53
CITY OF DAYTON, OHIO
Index of Notes to the Basic Financial Statements For the Year Ended December 31, 2004
Note 1 - Description of the City .................................................................................................................... 55 Note 2 - Summary of Significant Accounting Policies
A. Reporting Entity .............................................................................................................................. 55 - 58 B. Basis of Presentation-Fund Accounting .......................................................................................... 58 - 59 C. Fund Accounting ............................................................................................................................. 59 - 60 D. Measurement Focus......................................................................................................................... 61 E. Basis of Accounting ........................................................................................................................ 61 - 62 F. Budgetary Process ........................................................................................................................... 63 - 64 G. Cash and Cash Equivalents ............................................................................................................. 64 - 65 H. Inventory of Supplies ...................................................................................................................... 65 I. Restricted Assets ............................................................................................................................. 65 J. Capital Assets.................................................................................................................................. 66 K. Interfund Balances........................................................................................................................... 66 L. Compensated Absences................................................................................................................... 66 - 67 M. Accrued Liabilities and Long-Term Obligations............................................................................. 67 N. Unamortized Issuance Costs/Bond Premium and Discount/Accounting Gain and Loss................. 67 - 68 O. Interfund Activity............................................................................................................................ 68 P. Fund Balance Reserves ................................................................................................................... 68 Q. Fund Designations........................................................................................................................... 68 R. Estimates ......................................................................................................................................... 69 S. Contributed Capital ......................................................................................................................... 69 T. Net Assets........................................................................................................................................ 69 U. Operating Revenues and Expenses.................................................................................................. 69 V. Extraordinary and Special Items ..................................................................................................... 69
Note 3 - Accountability and Compliance
A. Prior Period Adjustments ................................................................................................................ 70 - 71 B. Compliance ..................................................................................................................................... 71
Note 4 - Equity In Pooled Cash and Investments .......................................................................................... 71 - 74 Note 5 - Interfund Transactions
A. Due from/to other funds .................................................................................................................. 74 B. Interfund loans………..................................................................................................................... 75 C. Advances to component unit and advances from primary government........................................... 75 D. Interfund transfers ........................................................................................................................... 75
Note 6 - Property Taxes................................................................................................................................. 75 - 76 Note 7 - Income Tax...................................................................................................................................... 76 - 77 Note 8 - Receivables...................................................................................................................................... 77 Note 9 - Loans Receivable............................................................................................................................. 78

54
Note 10 - Capital Assets ................................................................................................................................ 78 - 83 Note 11 - Capital Leases................................................................................................................................ 84 Note 12 - Operating Lease............................................................................................................................. 85 Note 13 - Long-Term Obligations
A. Governmental activities................................................................................................................... 86 - 88 B. Business-type obligations................................................................................................................ 88 - 91
Note 14 - Notes Payable
A. Summary of governmental-activities notes payable transactions.................................................... 91 B. Summary of business-type activities notes payable transactions .................................................... 92
Note 15 - Segment Information - Nonmajor Enterprise Funds...................................................................... 92 Note 16 - Risk Management
A. Property and Liability...................................................................................................................... 92 B. Workers’ Compensation.................................................................................................................. 93
Note 17 - Other Employee Benefits
A. Compensated Absences................................................................................................................... 94 B. Insurance Benefits ........................................................................................................................... 94 C. Deferred Compensation Plans ......................................................................................................... 94
Note 18 - Defined Benefit Pension Plans
A. Ohio Public Employees Retirement System.................................................................................... 95 B. Ohio Police and Fire Pension Fund................................................................................................. 95
Note 19 - Postretirement Benefit Plans
A. Ohio Public Employees Retirement System.................................................................................... 96 - 97 B. Ohio Police and Fire Pension Fund................................................................................................. 97
Note 20 – Budgetary Basis of Accounting .................................................................................................... 97 - 98 Note 21 - Conduit Debt Obligations .............................................................................................................. 98 Note 22 - Discretely Presented Component Unit
A. Basis of Accounting ........................................................................................................................ 98 B. Deposits and Investments................................................................................................................ 99 C. Notes Payable Advance from Primary Government ....................................................................... 100 D. Bonds Payable ................................................................................................................................. 100 – 101 E. Loans Payable ................................................................................................................................. 101
Note 23- Contingencies
A. Litigation ......................................................................................................................................... 102 B. Grants .............................................................................................................................................. 102

CITY OF DAYTON, OHIO
NOTES TO THE BASIC FINANCIAL STATEMENTS FOR THE YEAR ENDED DECEMBER 31, 2004
55
NOTE 1 - DESCRIPTION OF THE CITY
The City of Dayton (the “City”) is located in Montgomery County in southwestern Ohio approximately seventy-six miles west of Columbus and fifty-four miles north of Cincinnati. The City charter was approved in 1913 and the City became the first large community in the United States to adopt the Commission-Manager Plan form of government. Subsequent amendments to the charter have been made. Legislative power is vested in a five-member commission, one of the members being the Mayor. The City Manager is the chief executive officer and the head of the administrative agencies of the City. The City Manager appoints all department heads, except the Secretary of the Civil Service Board and the Director of the Human Relations Council, who are appointed by the City Commission.
NOTE 2 - SUMMARY OF SIGNIFICANT ACCOUNTING POLICIES
The basic financial statements (BFS) of the City have been prepared in conformity with accounting principles generally accepted in the United States of America (GAAP) as applied to local governmental units. The Governmental Accounting Standards Board (GASB) is the accepted standard-setting body for establishing governmental accounting and financial principles. The City also applies Financial Accounting Standards Board (FASB) Statements and Interpretations issued on or before November 30, 1989, to its governmental and business-type activities and to its proprietary funds provided they do not conflict with or contradict GASB pronouncements. The City has the option to also apply FASB Statements and Interpretations issued after November 30, 1989 to its business-type activities and enterprise funds, subject to this same limitation. The City has elected not to apply these FASB Statements and Interpretations. The most significant of the City’s accounting policies are described below. A. Reporting Entity
A reporting entity is comprised of the primary government, component units and other organizations that are included to ensure that the financial statements of the City are not misleading. The primary government consists of all funds, departments and agencies that are not legally separate from the City. For the City, this includes providing water supply and treatment, sewer and storm water maintenance, wastewater treatment, airport services, fire and emergency medical services, police protection, a convention center, building inspection, neighborhood support, recreation and parks, golf, street and bridge maintenance, waste collection, and a municipal court.
Component units are legally separate organizations for which the City is financially accountable. The City is financially accountable for an organization if the City appoints a voting majority of the organization's governing board and (1) the City is able to significantly influence the programs or services performed or provided by the organization; or (2) the City is legally entitled to or can otherwise access the organization's resources; the City is legally obligated or has otherwise assumed the responsibility to finance the deficits of, or provide financial support to, the organization; or the City is obligated for the debt of the organization. Component units may also include organizations that are fiscally dependent on the City in that the City approves their budget, the issuance of their debt or the levying of their taxes for the organization.
Based on the foregoing criteria, the financial activities of the following potential component units have been reflected in the accompanying BFS as follows:

CITY OF DAYTON, OHIO
NOTES TO THE BASIC FINANCIAL STATEMENTS FOR THE YEAR ENDED DECEMBER 31, 2004
56
NOTE 2 - SUMMARY OF SIGNIFICANT ACCOUNTING POLICIES - (Continued)
DISCRETELY PRESENTED COMPONENT UNIT
The City has included one discretely presented component unit, the CityWide Development Corporation (CWDC), as part of this report. CWDC was established in 1972 as a private, non-profit development organization which supports the City in a number of ways - primarily as its development financing arm. CWDC's relationship with the City is established via its stated mission: fostering economic development through creating and retaining jobs for City residents, providing administrative support to assist in neighborhood development, increasing tax revenues, and improving the Dayton area economy. Because the City appoints all members of CWDC's board of trustees and is empowered to remove them at will, CWDC is a component unit of the City. CWDC issues separately audited financial statements with a December 31 year-end. Its most recently audited financial statements may be obtained from CityWide Development Corporation, 8 North Main Street, Dayton, Ohio 45402-1916. Further disclosures for the discretely presented component unit can be found in Note 22.
BLENDED COMPONENT UNIT
The City of Dayton Sister City Committee (DSCC) is a blended component unit shown as a special revenue fund of the City of Dayton. The DSCC was created as a not for profit organization under Ohio Revised Code Section 1702.01 in 1966. The DSCC is governed by twenty six committee members, four of which are City of Dayton employees. The Dayton City Commission appoints all board members and provides all financial support or has solicited contributions on behalf of the DSCC. The DSCC provides services solely for the City, including the promotion of youth and adult exchanges, development of business ties and exchanges of professional and cultural programs between the City of Dayton and five other cities around the world. Financial information can be obtained for the DSCC by contacting Marion Sweeney at P.O. Box 97, Dayton, Ohio, 45402-0097.
JOINTLY GOVERNED ORGANIZATIONS
Miami Valley Regional Planning Commission - The Miami Valley Regional Planning Commission (the Commission) is a jointly governed organization between Preble, Clark, Clinton, Darke, Greene, Miami, and Montgomery Counties, the City of Dayton, City of Riverside, City of New Carlisle, and the City of Huber Heights. The Commission prepares plans, including studies, maps, recommendations, and reports concerning the physical, environmental, social, economic, and governmental characteristics, functions, and services of the region. These reports show recommendations for systems of transportation, highways, parks and recreational facilities, water supply, sewage disposal, garbage disposal, civic centers, and other public improvements and land uses which affect the development of the region. The degree of control exercised by any participating government is limited to its representation on the Board. Members of the Board are as follows: the officers of the Commission (elected by member representatives), the immediate past Chair of the Commission, the Commission member representing the City of Dayton, the Commission member representing each of the respective member counties, the representatives selected by each county caucus, a nongovernmental member, and two at-large representatives. Payments to the Commission are made from the general fund. The City did not contribute to the operation of the Commission during 2004. Financial information can be obtained from Nora Lake, Executive Director, at 40 West Fourth Street, Dayton, Ohio 45402.

CITY OF DAYTON, OHIO
NOTES TO THE BASIC FINANCIAL STATEMENTS FOR THE YEAR ENDED DECEMBER 31, 2004
57
NOTE 2 - SUMMARY OF SIGNIFICANT ACCOUNTING POLICIES - (Continued) Miami Valley Fire/EMS Alliance - The Miami Valley Fire/EMS Alliance (the Alliance) is a jointly
governed organization between municipal corporations and townships in Montgomery, Greene and Warren Counties. The purpose of the Alliance is to foster cooperation among the political subdivisions by promoting programs and recommending matters which will result in more efficient methods of delivering fire and emergency medical services in the region. The Board of the Alliance is made up of a representative appointed by the City of Dayton, a representative appointed by the members who are provided Fire/EMS Services by volunteers, two representatives appointed by the members who are provided Fire/EMS Services by a combination of full time employees and volunteers, and a representative appointed by the members who are provided Fire/EMS Services by full time employees. Payments to the Alliance are made from the general fund. The City contributed $39,883 for the operation of the Alliance during 2004. Financial information can be obtained from Mike Hoverland, Director, at 444 W. Third Street, Suite 13-204, Dayton, Ohio 45402.
Economic Development/Government Equity Program - The Economic Development/Government Equity Program (ED/GE) was established pursuant to Ohio Revised Code Chapter 307 for the purpose of developing and promoting plans and programs designed to assure that County resources are efficiently used, economic growth is properly balanced, and that County economic development is coordinated with that of the State of Ohio and other local governments. Members include villages, township, and cities within Montgomery County, and Montgomery County itself. Cooperation and coordination between the members is intended to promote economic health and improve the economic opportunities of the people in Montgomery County by assisting in the establishment or expansion within the County of industrial, commercial or research facilities and by creating and preserving job and employment opportunities for the people of the County. The ED/GE Advisory Committee, made up of alternating member entities representatives, decides which proposed projects will be granted each year. Sales tax revenues, set aside by Montgomery County, are used to fund the projects. Members annually contribute to or receive benefits based on an elaborate zero-based formula designed to distribute growth in contributing communities to those communities experiencing less economic growth. Any member in default of paying its contributions will be liable for the amount of the contribution, any interest accrued, and penalties. During this time, the member will not be entitled to any allocations from ED/GE. Payments to ED/GE are made from the general fund.
The City did not contribute to the operation of ED/GE during 2004. Financial information can be obtained from Linda Gum, Administrative Assistant, at 451 West Third Street, Dayton, Ohio 45402.
Montgomery County Family and Children First Council - The City participates in the Montgomery County Family and Children First Council. The Council coordinates and integrates those services within Montgomery County which are available for families and children and establishes a comprehensive, coordinated, multi-disciplinary, interagency system for the delivery of such services in order to more effectively meet the needs of families and children. The Council is governed by a board of nineteen trustees, one of which is the Mayor of the City of Dayton. The City did not contribute to the operation of the Council during 2004. Financial information can be obtained from Sue Daily, Executive Director, at 451 West Third Street, P.O. Box 972, Dayton, Ohio 4522-3100.

CITY OF DAYTON, OHIO
NOTES TO THE BASIC FINANCIAL STATEMENTS FOR THE YEAR ENDED DECEMBER 31, 2004
58
NOTE 2 - SUMMARY OF SIGNIFICANT ACCOUNTING POLICIES - (Continued)
Hazardous Material Response Team - The City is a member of a Hazardous Material Response Team ("HAZ MAT") which is a jointly governed organization with other local governments. The organization was created to provide hazardous material response protection and mutual assistance in the event of a hazardous material incident.
The HAZ MAT Advisory Board oversees the operation of HAZ MAT and consists of representatives from sixteen organizations. The City's ability to affect operations is limited to its representation on the board.
The Board established hazardous materials incident response guidelines to provide for response procedures in the event of an incident. In the event of a hazardous material incident within any local government that is a member of this organization, the other members will respond to render assistance. The funding for the operation of the response team is through contributions from each entity. In addition, the persons or company responsible for any hazardous materials emergency is required by state law to reimburse the team any costs associated with clean up. There is no explicit and measurable equity interest in HAZ MAT. During 2004, the City contributed $16,618 to HAZ MAT. Financial information can be obtained from Edwin Kovar, Executive Director at 4200 Lake Center Drive, Trotwood, Ohio 45426.
Miami Valley Emergency Management Agency - The Miami Valley Emergency Management Agency (the Agency) is a jointly governed organization between various political subdivisions in Montgomery and Greene Counties. The purpose of the Agency is to help provide emergency management preparedness which includes training and incident mitigation. The fourteen member Board of the Agency is made up of a representative appointed by the City of Dayton.
The funding for the operation of the Agency is through contributions from each participating entity. Payments to the Agency are made from the general fund. The City contributed $26,589 for the operation of the Agency during 2004. Financial information can be obtained from Edwin Kovar, Executive Director at 4200 Lake Center Drive, Trotwood, Ohio 45426.
B. Basis of Presentation-Fund Accounting
The City’s basic financial statements consist of government-wide statements, including a statement of
net assets and a statement of activities, and fund financial statements which provide a more detailed level of financial information.
Government-wide Financial Statements - The Statement of Net Assets and the Statement of Activities display information about the City as a whole. These statements include the financial activities of the primary government, except for fiduciary funds. The activities of the internal service funds are eliminated to avoid “doubling up” revenues and expenses. The statements distinguish between those activities of the City that are governmental and those that are considered business-type activities.

CITY OF DAYTON, OHIO
NOTES TO THE BASIC FINANCIAL STATEMENTS FOR THE YEAR ENDED DECEMBER 31, 2004
59
NOTE 2 - SUMMARY OF SIGNIFICANT ACCOUNTING POLICIES - (Continued) The statement of net assets presents the financial condition of the governmental and business-type activities of the City at year-end. The statement of activities presents a comparison between direct expenses and program revenues for each program or function of the City’s governmental activities and for the business-type activities of the City. Direct expenses are those that are specifically associated with a service, program or department and therefore clearly identifiable to a particular function. Program revenues include charges paid by the recipient of the goods or services offered by the program, grants and contributions that are restricted to meeting the operational or capital requirements of a particular program and interest earned on grants that is required to be used to support a particular program. Revenues which are not classified as program revenues are presented as general revenues of the City, with certain limited exceptions. The comparison of direct expenses with program revenues identifies the extent to which each business segment or governmental function is self-financing or draws from the general revenues of the City.
Fund Financial Statements - During the year, the City segregates transactions related to certain City functions or activities in separate funds in order to aid financial management and to demonstrate legal compliance. Fund financial statements are designed to present financial information of the City at this more detailed level. The focus of governmental and enterprise fund financial statements is on major funds. Each major fund is presented in a separate column. Nonmajor funds are aggregated and presented in a single column. The internal service funds are presented in a single column on the face of the proprietary fund statements. Fiduciary funds are reported by type.
C. Fund Accounting
The City uses funds to maintain its financial records during the year. A fund is defined as a fiscal and accounting entity with a self balancing set of accounts. There are three categories of funds: governmental, proprietary and fiduciary.
Governmental Funds - Governmental funds are those through which most governmental functions typically are financed. Governmental fund reporting focuses on the sources, uses and balances of current financial resources. Expendable assets are assigned to the various governmental funds according to the purposes for which they may or must be used. Current liabilities are assigned to the fund from which they will be paid. The difference between governmental fund assets and liabilities is reported as fund balance. The following are the City's major governmental funds:
General Fund - The general fund accounts for all financial resources except those required to be accounted for in another fund.
Debt Service Fund - To account for various revenues collected for payment of general obligation
debt principal, interest and related costs.
Capital Improvements Fund - To account for resources used to purchase equipment and construct capital assets.

CITY OF DAYTON, OHIO
NOTES TO THE BASIC FINANCIAL STATEMENTS FOR THE YEAR ENDED DECEMBER 31, 2004
60
NOTE 2 - SUMMARY OF SIGNIFICANT ACCOUNTING POLICIES - (Continued)
Other governmental funds of the City are used to account for grants and other resources whose use is restricted to a particular purpose. These funds are nonmajor funds whose activity has been aggregated and presented in a single column in the BFS.
Proprietary Funds - Proprietary fund reporting focuses on changes in net assets, financial position and cash flows. Proprietary funds are classified as either enterprise or internal service.
Enterprise Funds - The enterprise funds may be used to account for any activity for which a fee is charged to external users for goods or services. The following are the City’s major enterprise funds:
Dayton International Airport - To account for the provision of air traffic, primarily commercial, including air freight. Revenues are derived from landing fees, concessionaire fees, and space rentals. The Dayton-Wright Brothers Airport is included in this fund.
Water - To account for the provision of water service and water pollution control activities of the City. The Department also provides water services to several areas outside the City. Revenue is generated by charges for services including those to other departments of the City. The water supply is maintained through the development of well fields, storage facilities, and pumping stations.
Sewer - To account for the provision of sanitary sewer service to the residential, commercial, and industrial consumers of the City and various communities within the Dayton Metropolitan area. The charges for services are based on the City’s needs for the cost of service and expenses of improvements to expand the capacity to meet the Environmental Protection Agency (EPA) standards.
Other enterprise funds of the City are used to account for the provision of storm sewers to the residents of the City and to account for the operations of the City’s six golf courses. These funds are nonmajor funds whose activity has been aggregated and presented in a single column in the BFS.
Internal Service Funds - The internal service funds account for the financing of services provided by one department or agency to other departments or agencies of the City on a cost-reimbursement basis. The City’s internal service funds include programs for fleet maintenance, fire fleet maintenance, plumbing services, workers’ compensation, and stores and reproduction services.
Fiduciary Funds - Fiduciary fund reporting focuses on net assets and changes in net assets. The fiduciary fund category is split into four classifications: pension trust funds, investment trust funds, private-purpose trust funds and agency funds. Trust funds are used to account for assets held by the City under a trust agreement for individuals, private organizations, or other governments and are therefore not available to support the City’s own programs. Agency funds are custodial in nature (assets equal liabilities) and do not involve measurement of results of operations. The City’s only fiduciary funds are agency funds which are used to account for items such as building permit surcharge, prisoner’s personal accounts, performance bonds, and as well as other situations where the City’s role is purely custodial, such as the receipt, temporary investment, and remittance of fiduciary resources to individuals, private organizations, and other governments.

CITY OF DAYTON, OHIO
NOTES TO THE BASIC FINANCIAL STATEMENTS FOR THE YEAR ENDED DECEMBER 31, 2004
61
NOTE 2 - SUMMARY OF SIGNIFICANT ACCOUNTING POLICIES - (Continued) D. Measurement Focus
Government-wide Financial Statements - The government-wide, proprietary, and fiduciary fund financial statements are prepared using the economic resources measurement focus. All assets and all liabilities associated with the operation of the City are included on the Statement of Net Assets.
Fund Financial Statements - All governmental funds are accounted for using a flow of current financial resources measurement focus. With this measurement focus, only current assets and current liabilities generally are included on the balance sheet. The statement of revenues, expenditures and changes in fund balances reports on the sources (i.e., revenues and other financing sources) and uses (i.e., expenditures and other financing uses) of current financial resources. This approach differs from the manner in which the governmental activities of the government-wide financial statements are prepared. Governmental fund financial statements therefore include reconciliations with brief explanations to better identify the relationship between the government-wide statements and the statements for governmental funds.
Like the government-wide statements, all proprietary funds are accounted for on a flow of economic resources measurement focus. All assets and all liabilities associated with the operation of these funds are included on the statement of net assets. The statement of changes in fund net assets presents increases (i.e., revenues) and decreases (i.e., expenses) in total net assets. The statement of cash flows provides information about how the City finances and meets the cash flow needs of its proprietary activities.
E. Basis of Accounting
Basis of accounting determines when transactions are recorded in the financial records and reported on the financial statements. The government-wide and proprietary fund financial statements are prepared using the accrual basis of accounting. The governmental funds use the modified accrual basis of accounting. Differences in the accrual and modified accrual basis of accounting arise in the recognition of revenue, the recording of deferred revenue and in the presentation of expenses versus expenditures.
Revenues - Exchange and Non-exchange Transactions - Revenue resulting from exchange transactions, in which each party gives and receives essentially equal value, is recorded on the accrual basis when the exchange takes place. On a modified accrual basis, revenue is recorded in the fiscal year in which the resources are measurable and become available. Available means that the resources will be collected within the current fiscal year or are expected to be collected soon enough thereafter to be used to pay liabilities of the current fiscal year. For the City, available means expected to be received within sixty days of year-end.

CITY OF DAYTON, OHIO
NOTES TO THE BASIC FINANCIAL STATEMENTS FOR THE YEAR ENDED DECEMBER 31, 2004
62
NOTE 2 - SUMMARY OF SIGNIFICANT ACCOUNTING POLICIES - (Continued)
Nonexchange transactions, in which the City receives value without directly giving equal value in return, include income taxes, property taxes, grants, entitlements and donations. On an accrual basis, revenue from income taxes is recognized in the period in which the income is earned (See Note 7). Revenue from property taxes is recognized in the year for which the taxes are levied (See Note 6). Revenue from grants, entitlements and donations is recognized in the year in which all eligibility requirements have been satisfied. Eligibility requirements include timing requirements, which specify the year when the resources are required to be used or the year when use is first permitted, matching requirements, in which the City must provide local resources to be used for a specified purpose, and expenditure requirements, in which the resources are provided to the City on a reimbursement basis. On a modified accrual basis, revenue from nonexchange transactions must also be available before it can be recognized.
Under the modified accrual basis, the following revenue sources are considered to be both measurable and available at year-end: income tax, state-levied locally shared taxes (including gasoline tax, local government funds and permissive tax), fines and forfeitures, interest, grants, fees and rentals.
Deferred Revenue - Deferred revenue arises when assets are recognized before revenue recognition criteria have been satisfied.
Property taxes for which there is an enforceable legal claim as of December 31, 2004, but which were levied to finance year 2005 operations, have been recorded as deferred revenue. Special assessments not received within the available period and grants and entitlements received before the eligibility requirements are met are also recorded as deferred revenue.
On governmental fund financial statements, receivables that will not be collected within the available period have also been reported as deferred revenue.
Expenses/Expenditures - On the accrual basis of accounting, expenses are recognized at the time they are incurred.
The measurement focus of governmental fund accounting is on decreases in net financial resources (expenditures) rather than expenses. Expenditures are generally recognized in the accounting period in which the related fund liability is incurred, if measurable. Allocations of cost, such as depreciation and amortization, are not recognized in governmental funds.

CITY OF DAYTON, OHIO
NOTES TO THE BASIC FINANCIAL STATEMENTS FOR THE YEAR ENDED DECEMBER 31, 2004
63
NOTE 2 - SUMMARY OF SIGNIFICANT ACCOUNTING POLICIES - (Continued)
F. Budgetary Process
The budgetary process is prescribed by provisions of the Ohio Revised Code and entails the preparation of budgetary documents within an established timetable. The major documents prepared are the tax budget, the certificate of estimated resources, and the appropriation ordinance, all of which are prepared on the budgetary basis of accounting. The certificate of estimated resources and the appropriations ordinance are subject to amendment throughout the year with the legal restriction that appropriations cannot exceed estimated resources, as certified. All funds, except agency funds, are legally required to be budgeted. Capital Projects funds and the HUD Programs special revenue fund, pursuant to the City's charter, are not required to be budgeted annually. These funds' appropriations, after their initial appropriations by Council at the time capital monies/grants are received (bond proceeds, etc.), remain intact until they are expended or modified by Council. Such monies are appropriated on a project level with specific identification of each project being budgeted.
In addition, the Dayton Sister Cities special revenue fund is not budgeted because it is not included in the entity for which the "appropriated budget" is adopted and does not maintain separate budgetary information. Budget basis financial statements for these funds are not, therefore, presented in this report because such statements would not be meaningful, nor are they required.
The City prepares its budget on a non-GAAP budgetary basis which is the modified accrual basis with exceptions. The legal level of budgetary control is at the department level. Budgetary modifications at this level may only be made by resolution of the City Commission.
Estimated Resources - The County Budget Commission determines if the budget substantiates a need to levy all or part of previously authorized taxes and reviews estimated revenue. The Budget Commission certifies its actions to the City by October 1. As part of this certification, the City receives the official certificate of estimated resources, which states the projected revenues of each fund. Prior to December 31, the City must revise its budget so that the total contemplated expenditures from any fund during the ensuing year will not exceed the amount available as stated in the certificate of estimated resources. The revised budget then serves as the basis for the annual appropriation ordinance. On or about January 1, the certificate of estimated resources is amended to include unencumbered fund balances at December 31 of the preceding year. The certificate may be further amended during the year if the fiscal officer determines, and the Budget Commission agrees, that an estimate needs to be either increased or decreased. The amounts reported on the budgetary statements reflect the amounts in the final amended official certificate of estimated resources issued during 2004.

CITY OF DAYTON, OHIO
NOTES TO THE BASIC FINANCIAL STATEMENTS FOR THE YEAR ENDED DECEMBER 31, 2004
64
NOTE 2 - SUMMARY OF SIGNIFICANT ACCOUNTING POLICIES - (Continued)
Appropriations - A temporary appropriation measure to control expenditures may be passed on or about January 1 of each year for the period from January 1 to March 31. The annual appropriation ordinance must be passed by April 1 of each year for the period January 1 to December 31. The appropriation ordinance fixes spending authority at the fund and department level. The appropriation ordinance may be amended during the year as new information becomes available, provided that total fund appropriations do not exceed current estimated resources, as certified. The allocation of appropriations between line items within a department may be modified with approval of the City Manager. All other modifications may only be made by ordinance of City Commission. During the year, several supplemental appropriation measures were passed, however none of them were significant. The budget figures which appear in the statements of budgetary comparisons represent the final appropriation amounts, including all amendments and modifications.
Encumbrances - As part of formal budgetary control, purchase orders, contracts and other commitments for the expenditure of monies are recorded as the equivalent of expenditures on the non-GAAP budgetary basis in order to reserve that portion of the applicable appropriation and to determine and maintain legal compliance. The Ohio Revised Code prohibits expenditures plus encumbrances from exceeding appropriations. On the GAAP basis, encumbrances outstanding at year-end are reported as reservations of fund balances for subsequent-year expenditures for governmental funds.
Lapsing of Appropriations - At the close of each year, the unencumbered balance of each appropriation reverts to the respective fund from which it was appropriated and becomes subject to future appropriations. The encumbered appropriation balance is carried forward to the succeeding calendar year.
G. Cash and Cash Equivalents
Cash balances of the City's funds, except cash and cash equivalents and investments held by fiscal agents and cash and cash equivalents and investments in segregated accounts, are pooled and invested in order to provide improved cash management. Each fund's interest in the pool is presented as “Equity in Pooled Cash and Cash Equivalents” and “Investments” on the Statement of Net Assets. The HUD nonmajor special revenue fund had expended amounts greater than its share of pooled cash and cash equivalents. This fund had a negative cash balance at year-end that was eliminated by a short-term loan from the general fund. This loan is classified as an “interfund receivable” and “interfund payable” on the fund financial statements.
During 2004, investments were limited to commercial paper, federal agency securities, U.S. Treasury Notes, City owned debt, U.S. Government money market mutual funds, Dayton Power and Light stock, non-negotiable certificates of deposit, and the State Treasury Asset Reserve of Ohio (STAR Ohio). Except for non-participating investment contracts, investments are stated at fair value which is based on quoted market prices. For U.S. Government money market mutual funds, fair value is determined by the fund's share price at December 31, 2004. Non-participating investment contracts, such as non-negotiable certificates of deposit, are reported at cost.
STAR Ohio is an investment pool managed by the State Treasurer's office which allows governments within the State to pool their funds for investment purposes. STAR Ohio is not registered with the SEC as an investment company, but does operate in a manner consistent with Rule 2a7 of the Investment Company Act of 1940. Investments in STAR Ohio are valued at STAR Ohio's share price which is the price the investment could be sold for on December 31, 2004.

CITY OF DAYTON, OHIO
NOTES TO THE BASIC FINANCIAL STATEMENTS FOR THE YEAR ENDED DECEMBER 31, 2004
65
NOTE 2 - SUMMARY OF SIGNIFICANT ACCOUNTING POLICIES - (Continued)
For purposes of the statement of cash flows and for presentation on the combined balance sheet, the City's cash management pool and investments with original maturities of three months or less are considered to be cash and cash equivalents. Investments not part of the cash management pool, with an initial maturity of more than three months, are reported as investments.
The City utilizes a financial institution to service bonded debt as principal and interest payments become due. The balance in these accounts along with reserves held for replacement and improvement for enterprise funds, money held by the municipal court and money in the executive savings plan are shown as "Cash and Cash Equivalents with Fiscal Agents" and "Investments with Fiscal Agents ".
Cash and cash equivalents that are held separately by CityWide Development Corporation, the discretely presented component unit, and the City of Dayton Sister Cities Committee, the blended component unit, are recorded on the balance sheet as "Cash and Cash Equivalents in Segregated Accounts".
Interest income is distributed to the funds according to City Ordinance and statutory requirements. Interest revenue earned during 2004 was $2,286,681 in the general fund, which includes $1,814,523 assigned from other City funds. The nonmajor governmental funds and enterprise funds also received interest in the amount of $2,222 and $1,032,922, respectively.
H. Inventory of Supplies
On government-wide financial statements, inventories are presented at the lower of cost or market on a first-in, first-out basis and are expensed when used.
On fund financial statements, inventories of governmental funds are stated at cost while inventories of proprietary funds are stated at the lower of cost or market. For all funds, cost is determined on a first-in, first-out basis. Inventory in governmental funds consists of expendable supplies held for consumption. The cost of inventory items is recorded as an expenditure in the governmental fund types when purchased. Inventories of the proprietary funds are expensed when used. The City had no material inventory balances to report on the governmental fund financial statements.
I. Restricted Assets
Restricted assets are those which are legally restricted in their use by bond indentures, or other legal instruments. Restricted assets in the enterprise funds include “Equity in Pooled Cash and Cash Equivalents” and “Cash with Fiscal and Escrow Agents”. “Equity in Pooled Cash and Cash Equivalents” represent utility deposits held by the City. “Cash with Fiscal and Escrow Agents” are the proceeds from revenue bond issues that are required by the bond indenture to be held by a financial services corporation. Restricted assets in the debt service fund include “Cash and Cash Equivalents with Fiscal Agents”. This represents the residual proceeds from baseball bonds issued during 2000 after the loan was made to Riverfront Area Redevelopment Enterprises, Inc., that are being held in U.S. Government money market mutual funds. This money is restricted for the interest payments on the new baseball revenue bonds.

CITY OF DAYTON, OHIO
NOTES TO THE BASIC FINANCIAL STATEMENTS FOR THE YEAR ENDED DECEMBER 31, 2004
66
NOTE 2 - SUMMARY OF SIGNIFICANT ACCOUNTING POLICIES - (Continued)
J. Capital Assets
General capital assets are those assets not specifically related to activities reported in the proprietary funds. These assets generally result from expenditures in the governmental funds. These assets are reported in the governmental activities column of the government-wide statement of net assets but are not reported in the governmental fund financial statements. Capital assets utilized by the proprietary funds are reported both in the business-type activities column of the government-wide statement of net assets and in the respective funds.
All capital assets are capitalized at cost (or estimated historical cost) and updated for additions and retirements during the year. Donated capital assets are recorded at their fair market values as of the date received. The City maintains a capitalization threshold of $5,000. The City’s infrastructure consists of bridges, curbs, lighting, sidewalks, and roads. Improvements are capitalized; the costs of normal maintenance and repairs that do not add to the value of the asset or materially extend an asset’s life are not. Interest incurred during the construction of capital assets is also capitalized.
All reported capital assets are depreciated except for land and construction in progress. Improvements are depreciated over the remaining useful lives of the related capital assets. Useful lives for infrastructure were estimated based on the City’s historical records of necessary improvements and replacement. Depreciation is computed using the straight-line method over the following useful lives:
Governmental Business-Type Activities Activities Description Estimated Lives Estimated Lives Improvements other than buildings 10 - 25 years 10 - 25 years Buildings and improvements 30 - 50 years 30 - 50 years Furniture, fixtures and equipment 3 - 15 years 3 - 15 years Vehicles 3 - 25 years 3 - 25 years Infrastructure 20 - 50 years 20 - 50 years
K. Interfund Balances
On fund financial statements, receivables and payables resulting from short-term interfund loans are classified as “interfund receivables/payables.” On fund financial statements, long-term interfund loans are classified as “advances to/from other funds” on the balance sheet and are equally offset by a fund balance reserve account which indicates that they do not constitute available expendable resources. These amounts are eliminated in the governmental and business-type activities columns of the Statement of Net Assets, except for any net residual amounts due between governmental and business-type activities, which are presented as internal balances. Advances made from the City to its discretely presented component unit are reported on both the government-wide and fund financial statements.
L. Compensated Absences
The City follows the provisions of Governmental Accounting Standards Board Statement No. 16 “Accounting for Compensated Absences”. Vacation and compensatory time benefits are accrued as a liability as the benefits are earned if the employees' rights to receive compensation are attributable to services already rendered and it is probable that the City will compensate the employees for the benefits through paid time off or some other means. The City records a liability for accumulated unused vacation time and compensatory time when earned for all employees with more than one year of service.

CITY OF DAYTON, OHIO
NOTES TO THE BASIC FINANCIAL STATEMENTS FOR THE YEAR ENDED DECEMBER 31, 2004
67
NOTE 2 - SUMMARY OF SIGNIFICANT ACCOUNTING POLICIES - (Continued) Sick leave benefits are accrued using the termination method. An accrual for earned sick leave is made to the extent that it is probable that benefits will result in termination payments. The liability is an estimate based on the City's past experience of making termination payments.
The total liability for vacation and sick leave payments has been calculated using pay rates in effect at the balance sheet date, and reduced to the maximum payment allowed by labor contract and/or statute, plus applicable additional salary related payments. City employees are granted vacation and sick leave in varying amounts. In the event of termination, an employee is reimbursed for accumulated vacation and sick leave at various rates.
The entire compensated absence liability is reported on the government-wide financial statements.
On governmental fund financial statements, compensated absences are recognized as liabilities and expenditures to the extent payments come due each period upon the occurrence of employee resignations and retirements. These amounts are recorded in the account “Compensated Absences Payable” in the fund from which the employees who have accumulated leave are paid. The noncurrent portion of the liability is not reported. For proprietary funds, the entire amount of compensated absences is reported as a fund liability.
M. Accrued Liabilities and Long-Term Obligations
All payables, accrued liabilities and long-term obligations payable from governmental funds are reported in the government-wide financial statements, and all payables, accrued liabilities and long-term obligations payable from proprietary funds are reported on the proprietary fund financial statements.
In general, governmental fund payables and accrued liabilities that, once incurred, are paid in a timely manner and in full from current financial resources, are reported as obligations of the funds. However, claims and judgments, compensated absences, and contractually required pension contributions that will be paid from governmental funds are reported as a liability in the fund financial statements only to the extent that they are due for payment during the current year. Bonds, capital leases and long-term loans are recognized as a liability on the fund financial statements when due.
N. Unamortized Issuance Costs/Bond Premium and Discount/Accounting Gain or Loss
On government-wide financial statements, issuance costs are deferred and amortized over the term of the bonds using the straight line method, which approximates the effective interest method. Issuance costs are recorded as deferred charges.
Bond premiums are deferred and accreted over the term of the bonds. Bond premiums are presented as an addition to the face amount of the bonds.
For advance refundings resulting in the defeasance of debt reported in the proprietary funds, the difference between the reacquisition price and the net carrying amount of the old debt is deferred and amortized as a component of interest expense. This accounting gain or loss is amortized over the remaining life of the old debt or the life of the new debt, whichever is shorter, and is presented as an addition to or reduction from the face amount of the new debt.

CITY OF DAYTON, OHIO
NOTES TO THE BASIC FINANCIAL STATEMENTS FOR THE YEAR ENDED DECEMBER 31, 2004
68
NOTE 2 - SUMMARY OF SIGNIFICANT ACCOUNTING POLICIES - (Continued) On the governmental fund financial statements, issuance costs and bond premiums are recognized in the current period.
O. Interfund Activity
Transfers between governmental and business-type activities on the government-wide statements are reported in the same manner as general revenues.
Exchange transactions between funds are reported as revenues in the seller funds and as expenditures/expenses in the purchaser funds. Flows of cash or goods from one fund to another without a requirement for repayment are reported as interfund transfers. Interfund transfers are reported as other financing sources/uses in governmental funds and after nonoperating revenues/expenses in proprietary funds. Repayments from funds responsible for particular expenditures/expenses to the funds that initially paid for them are not presented on the basic financial statements.
P. Fund Balance Reserves
Reserved fund balances indicate that portion of fund equity which is not available for current appropriation or use. The unreserved portions of fund equity reflected in the governmental funds are available for use within the specific purposes of the funds.
The City reports amounts representing encumbrances outstanding, prepayments, amounts due to claimants, advances to component unit, debt service, contributions to permanent fund, and loans receivable as reservations of fund balance in the governmental fund financial statements.
Q. Fund Designations
Fund balance designations may be established to indicate tentative planned expenditures of financial resources. The designations reflect the City’s intentions and are subject to change. Designations are reported as part of unreserved fund balance. The City Commission has designated the following amounts within the general fund:
Project Amount Designated
Unemployment 532,748$
Unclaimed money 486,450
Future payroll expenses 1,142,000
Subtotal General Fund 2,161,198
Roadway Maintenance Equipment 400,000
Subtotal Special Revenue Funds 400,000
Total 2,561,198$

CITY OF DAYTON, OHIO
NOTES TO THE BASIC FINANCIAL STATEMENTS FOR THE YEAR ENDED DECEMBER 31, 2004
69
NOTE 2 - SUMMARY OF SIGNIFICANT ACCOUNTING POLICIES - (Continued) R. Estimates
The preparation of the BFS in conformity with GAAP requires management to make estimates and assumptions that affect the amounts reported in the BFS and accompanying notes. Actual results may differ from those estimates.
S. Contributed Capital
Contributions of capital in proprietary fund financial statements arise from outside contributions of capital assets, tap-in fees to the extent they exceed the cost of the connection to the system, or from grants or outside contributions of resources restricted to capital acquisition and construction. Capital contributions are reported as revenue in the proprietary fund financial statements.
T. Net Assets
Net assets represent the difference between assets and liabilities. Net assets invested in capital assets, net of related debt consists of capital assets, net of accumulated depreciation, reduced by the outstanding balances of any borrowing used for the acquisition, construction or improvement of those assets. Net assets are reported as restricted when there are limitations imposed on their use either through the enabling legislation or through external restrictions imposed by creditors, grantors or laws or regulations of other governments.
The City applies restricted resources when an expense is incurred for purposes for which both restricted and unrestricted net assets are available.
U. Operating Revenues and Expenses
Operating revenues are those revenues that are generated directly from the primary activity of the proprietary funds. For the City, these revenues are charges for services for the airport, water, sewer, storm water and golf enterprise funds and charges for services to other departments for goods and services provided by the internal service funds for fleet management, fire fleet management, stores and reproduction services, a Workers’ Compensation program and plumbing shop services. Operating expenses are necessary costs incurred to provide the good or service that is the primary activity of the fund.
V. Extraordinary and Special Items
Extraordinary items are transactions or events that are both unusual in nature and infrequent in occurrence. Special items are transactions or events that are within the control of the City Administration and that are either unusual in nature or infrequent in occurrence. During fiscal year 2004, the City sold land. This transaction is classified as a special item.

CITY OF DAYTON, OHIO
NOTES TO THE BASIC FINANCIAL STATEMENTS FOR THE YEAR ENDED DECEMBER 31, 2004
70
NOTE 3 - ACCOUNTABILITY AND COMPLIANCE
A. Prior Period Adjustment
Budgetary Statement - General Fund - The beginning fund balance as reported on Statement of Revenues, Expenditures and Changes in Fund Balance - Budget and Actual (Non-GAAP Budgetary Basis) - General fund has been restated from $22,938,252 to $18,420,816 to properly reflect the balance of the fund at December 31, 2003.
Governmental Activities - Restatement of Fund Balance - and Net Assets - The fund balance and net assets of the general fund, capital improvements fund and other nonmajor governmental funds have been restated at December 31, 2004 to properly report revenue due from other governments and accounts receivable at December 31, 2004. A prior period adjustment will be made to properly state the fund balance of the general fund, capital improvements fund and other governmental funds at December 31, 2003
The adjustments had the following effect on fund balance of the governmental activities as previously reported:
Other TotalDebt Capital Nonmajor Governmental
General Service Improvement Governmental Funds Funds
Fund balance as previously reported 40,088,113$ 17,839,709$ 11,578,225$ 19,793,790$ 89,299,837$
Adjustment to properly report due from other governments - - 1,390,896 (1,390,896) -
Adjustment to properly state accounts receivable (389,332) - - - (389,332)
Restated fund balance as of January 1, 2004 39,698,781$ 17,839,709$ 12,969,121$ 18,402,894$ 88,910,505$
The adjustments had the following effect on net assets of the governmental activities as previously reported:
Governmental Activities
Net assets as previously reported 304,281,870$ Adjustment to properly state accounts receivable (389,332)
Restated net assets of January 1, 2004 303,892,538$
Business-Type Activities - Restatement of Net Assets - The net assets of the sewer, water, and nonmajor enterprise funds have been restated at December 31, 2003 to properly state accounts receivable. In previous years, revenue intended for the storm water nonmajor enterprise fund was improperly recorded in the sewer fund. A prior period adjustment is required to properly state the cash balances in these funds. A prior period adjustment will be made to properly state the net assets of the business-type at December 31, 2003.

CITY OF DAYTON, OHIO
NOTES TO THE BASIC FINANCIAL STATEMENTS FOR THE YEAR ENDED DECEMBER 31, 2004
71
NOTE 3 - ACCOUNTABILITY AND COMPLIANCE – (Continued) The adjustments had the following effect on net assets of the business-type activities as previously
reported:
Dayton Nonmajor Internal TotalInternational Enterprise Service Fund Enterprise
Airport Water Sewer Funds Allocation Fund
Net assets as previously reported 145,849,979$ 166,618,832$ 114,358,671$ 19,322,114$ 757,790$ 446,907,386$
Adjustment to revenue posting - - (1,203,565) 1,203,565 - -
Adjustment to properly state accounts receivable - (9,215,829) (5,314,306) (5,394,154) - (19,924,289)
Restated net assets as of January 1, 2004 145,849,979$ 157,403,003$ 107,840,800$ 15,131,525$ 757,790$ 426,983,097$
B. Compliance
Contrary to Ohio Revised Code Section 5705.10, the City had a negative cash balance in the HUD special revenue fund of $1,183,320. For GAAP purposes, these amounts have been reported as fund liabilities in the respective funds.
NOTE 4 - EQUITY IN POOLED CASH AND INVESTMENTS
The investment and deposit of City monies are governed by City Ordinance and the Ohio Revised Code. State statutes classify monies held by the City into three categories.
Active deposits are public deposits necessary to meet current demands on the treasury. Such monies must be maintained either as cash in the City Treasury, in commercial accounts payable or withdrawable on demand, including negotiable order of withdrawal (NOW) accounts, or in money market deposit accounts.
Inactive deposits are public deposits that the City Commission has identified as not required for use within the current two year period of designation of depositories. Inactive deposits must either be evidenced by certificates of deposit maturing not later than the end of the current period of designation of depositories, or by savings or deposit accounts including, but not limited to, passbook accounts.
Interim deposits are deposits of interim monies. Interim monies are those monies which are not needed for immediate use but which will be needed before the end of the current period of designation of depositories. Interim deposits must be evidenced by time certificates of deposit maturing not more than one year from the date of deposit or by savings or deposit accounts, including passbook accounts. Protection of City's deposits is provided by the Federal Deposit Insurance Corporation (FDIC), by eligible securities pledged by the financial institution as security for repayment, by surety company bonds deposited with the finance director by the financial institution, or by a single collateral pool established by the financial institution to secure the repayment of all public monies deposited with the institution.

CITY OF DAYTON, OHIO
NOTES TO THE BASIC FINANCIAL STATEMENTS FOR THE YEAR ENDED DECEMBER 31, 2004
72
NOTE 4 - EQUITY IN POOLED CASH AND INVESTMENTS - (Continued) According to City Ordinance, interim monies can be invested in the following obligations which mature within five years from the date the investments were completed:
1. U. S. Treasury bills, notes, and bonds; 2. U.S. Government agency and instrumentality coupon and discount securities; 3. Certificates of Deposit; 4. Repurchase agreements with institutions having a signed master repurchase agreement on file with the
Director of Finance;
5. Securities lending agreements with institutions having a signed securities lending agreement on file with the Director of Finance;
6. Bankers' Acceptances;
7. NOW accounts;
8. Money Market Mutual Funds (open ended investment companies) registered with the Securities and
Exchange Commission;
9. State of Ohio Treasurer's investment pool (STAR Ohio);
10. Securities of any of the states of the United States or any of their political sub-divisions rated "A" or better by Moody's or Standard and Poor’s;
11. Prime commercial paper; and
12. Corporate notes rated at least AA (not to exceed 15% of the portfolio).
The City may also invest in the following instruments within the indicated maturities:
1. Repurchase agreements that do not exceed ninety days;
2. Money Market Mutual Funds with an average portfolio maturity which does not exceed 120 days;
3. Investments matched to a specific cash flow requirement; and
4. City of Dayton notes or bonds up to twenty years maturity.
Investments may only be made through specified dealers and institutions. Payment for investments may be made only upon delivery of the securities representing the investments to the finance director or, if the securities are not represented by a certificate, upon receipt of confirmation of transfer from the custodian. Investments in stripped principal or interest obligations, reverse repurchase agreements and derivatives are prohibited. The issuance of taxable notes for the purpose of arbitrage, the use of leverage and short selling are also prohibited. An investment must mature within five years from the date of purchase unless matched to a specific obligation or debt of the City, and must be purchased with the expectation that it will be held to maturity.

CITY OF DAYTON, OHIO
NOTES TO THE BASIC FINANCIAL STATEMENTS FOR THE YEAR ENDED DECEMBER 31, 2004
73
NOTE 4 - EQUITY IN POOLED CASH AND INVESTMENTS - (Continued) The following information classifies deposits and investments by categories of risk as defined in GASB Statement 3 "Deposits with Financial Institutions, Investments and Reverse Repurchase Agreements".
Deposits: At year-end, the carrying amount of the City's deposits was $20,623,380 and the related bank balance was $23,960,919. Of the bank balance:
1. $426,046 was covered by federal depository insurance; and
2. $23,534,873 was uninsured and uncollateralized as defined by GASB even though it was covered by collateral held by third party trustees pursuant to Section 135.81, Ohio Revised Code. Although all state statutory requirements for the deposit of money had been followed, non-compliance with federal requirements could potentially subject the City to a successful claim by the FDIC.
Investments: Category 1 includes investments that are insured or registered or for which the securities are held by the City or its agent in the City's name. Category 2 includes uninsured and unregistered investments for which the securities are held by the counterparty's trust department or agent in the City's name. Category 3 includes uninsured and unregistered investments for which the securities are held by the counterparty, or by its trust department or agent but not in the City's name. STAR Ohio, an investment fund operated by the Ohio State Treasurer, and U.S. Government money market mutual fund investments are unclassified since they are not evidenced by securities that exist in physical or book entry form.
Fair Category 1 Category 3 Value
FHLMC notes 16,721,870$ 123,649$ 16,845,519$ FNMA notes 19,775,100 - 19,775,100 FHLB 8,859,420 124,414 8,983,834 U.S. Treasury notes 123,820,980 247,075 124,068,055 City owned debt 5,317,409 - 5,317,409 Dayton Power and Light stock 84,746 - 84,746 STAR Ohio 4,128,636 - 4,128,636 U.S. government money market mutual fund 4,460,810 - 4,460,810 Commercial paper - 301,011 301,011
Total 183,168,971$ 796,149$ 183,965,120$

CITY OF DAYTON, OHIO
NOTES TO THE BASIC FINANCIAL STATEMENTS FOR THE YEAR ENDED DECEMBER 31, 2004
74
NOTE 4 - EQUITY IN POOLED CASH AND INVESTMENTS - (Continued)
The classification of cash and cash equivalents, and investments on the combined financial statements is based on criteria set forth in GASB Statement No. 9. The reconciliation between classifications of cash and investments on the basic financial statements and the classifications per GASB Statement No. 3 is as follows:
Cash and CashEquivalents/Deposits Investments
GASB Statement No. 9 203,401,584$ 1,186,916$ Investments of the cash management pool: FHLMC notes (16,721,870) 16,721,870 FNMA notes (19,775,100) 19,775,100 FHLB (8,859,420) 8,859,420 U.S. treasury notes (123,820,980) 123,820,980 City owned debt (5,317,409) 5,317,409 STAR Ohio (4,128,636) 4,128,636 U.S. Government money market mutual fund (4,154,789) 4,154,789
GASB Statement No. 3 20,623,380$ 183,965,120$
NOTE 5 - INTERFUND TRANSACTIONS
A. Due from/to other funds consisted of the following at December 31, 2004, as reported on the fund statements:
Nonmajor Dayton
Capital Special International Nonmajor Internal General Improvements Revenue Airport Water Sewer Enterprise Service Total
General -$ -$ -$ 21,478$ -$ 20,277$ -$ -$ 41,755$ Internal Service 408,728 74 128,659 4,326 96,974 37,301 26,159 2,059 704,280 Water - 238 - 1,284 - 3,326,465 652,054 178 3,980,219 Sewer - - 1,528 54,606 - - - - 56,134 Nonmajor Enterprise 14,906 - - - - - - - 14,906
Total 423,634$ 312$ 130,187$ 81,694$ 96,974$ 3,384,043$ 678,213$ 2,237$ 4,797,294$
These balances resulted from the time lag between the dates that (1) interfund goods and services are
provided, (2) transactions are recorded in the accounting system, and (3) payments between funds are made.

CITY OF DAYTON, OHIO
NOTES TO THE BASIC FINANCIAL STATEMENTS FOR THE YEAR ENDED DECEMBER 31, 2004
75
NOTE 5 - INTERFUND TRANSACTIONS - (Continued)
B. Interfund balances, related to items other than charges for goods and services rendered, at December 31, 2004, consist of the following individual fund loan receivable and payable as reported on the fund statements:
NonmajorSpecial
Interfund Payable to Revenue
General 1,183,320$ The interfund loan payable in the nonmajor special revenue to the general fund is to cover negative cash balances at year-end.
C. Advances to component unit and advances from primary government consisted of the following at December 31, 2004, as reported on the fund statements:
Advance From
NonmajorCapital Special
Advance To Improvement Revenue Water Total
Component Unit 6,631,709$ 5,453,956$ 2,801,458$ 14,887,123$
D. Interfund transfers for the year ended December 31, 2004, consisted of the following, as reported on the fund statements:
Nonmajor InternalCapital Special Service
Transfer From Improvement Revenue Funds Total
General 6,574,500$ 8,675,026$ 100,000$ 15,349,526$
Total 6,574,500$ 8,675,026$ 100,000$ 15,349,526$ Transfers are used to (1) move revenues from the fund that statute or budget requires to collect them to the fund that statute or budget requires to expend them, (2) move receipts restricted to debt service from the funds collecting the receipts to the debt service fund as debt service payments become due, and (3) use unrestricted revenues collected in the general fund to finance various programs accounted for in other funds in accordance with budgetary authorizations.
NOTE 6 - PROPERTY TAXES
Property taxes include amounts levied against all real, public utility, and tangible personal property located in the City. Property tax revenue received during 2004 for real and public utility property taxes represents collections of 2003 taxes. Property tax payments received during 2004 for tangible personal property (other than public utility property) is for 2004 taxes.

CITY OF DAYTON, OHIO
NOTES TO THE BASIC FINANCIAL STATEMENTS FOR THE YEAR ENDED DECEMBER 31, 2004
76
NOTE 6 - PROPERTY TAXES – (Continued)
2004 real property taxes are levied after October 1, 2004, on the assessed value as of January 1, 2004, the lien date. Assessed values are established by State law at 35 percent of appraised market value. 2004 real property taxes are collected in and intended to finance 2004. Public utility tangible personal property currently is assessed at varying percentages of true value; public utility real property is assessed at 35 percent of true value. 2004 public utility property taxes became a lien December 31, 2003, are levied after October 1, 2004, and are collected in 2005 with real property taxes.
2004 tangible personal property taxes are levied after October 1, 2003, on the value as of December 31, 2002. Collections are made in 2004. Tangible personal property assessments are 25 percent of true value. The full tax rate for all City operations for the year ended December 31, 2004, was $10.00 per $ 1,000 of assessed value. The assessed values of real and tangible personal property upon which 2003 property tax receipts were based are as follows:
Amount Percent
Real property 1,618,667,120$ 79.20%Public utility real property 106,951,010 5.23%Tangible personal property 318,067,610 15.57%
Total assessed value 2,043,685,740$ 100.00% Real property taxes are payable annually or semi-annually. If paid annually, payment is due December 31; if paid semi-annually, the first payment is due December 31, with the remainder payable by June 20. Under certain circumstances, State statute permits later payment dates to be established.
Tangible personal property taxes paid by multi-county taxpayers are due September 20. Single county taxpayers may pay annually or semi-annually. If paid annually, payment is due April 30; if paid semi-annually, the first payment is due April 30, with the remainder payable at September 20.
The County Treasurer collects property taxes on behalf of all taxing districts in the county, including the City of Dayton. The County Auditor periodically remits to the City its portion of the taxes collected. Property taxes receivable represents real and tangible personal property taxes, public utility taxes and outstanding delinquencies which are measurable as of December 31, 2004. Although total property tax collections for the next fiscal year are measurable, amounts to be received during the available period are not subject to reasonable estimation at December 31, nor are they intended to finance 2004 operations. The receivable is therefore offset by a credit to deferred revenue.
NOTE 7 - INCOME TAX
On March 27, 1984, the City Commission levied a municipal income tax of 1.75 percent on substantially all income earned within the City. In addition, during 2000, the City renewed their additional .50 percent levy through December 31, 2006. The City income tax also applies to the net income of businesses located or doing business within the City. The residents of the City are required to pay income tax on income earned outside of the City; however, the City allows a credit for income taxes paid to another municipality up to 100 percent of the City's current tax rate.

CITY OF DAYTON, OHIO
NOTES TO THE BASIC FINANCIAL STATEMENTS FOR THE YEAR ENDED DECEMBER 31, 2004
77
NOTE 7 - INCOME TAX – (Continued)
Employers within the City are required to withhold income tax on employee compensation and remit the tax to the City of Dayton at least quarterly. Corporations and other individual taxpayers are required to pay their estimated tax quarterly and file a declaration annually. The City of Dayton administers the collection of income taxes and the assessment of interest and penalties. Income tax proceeds are to be used to pay the cost of administering the tax and are recorded in the general fund. Income tax revenue for 2004, as reported in the governmental fund financial statements on the modified accrual basis of accounting, was $107,737,232.
NOTE 8 - RECEIVABLES
Receivables at December 31, 2004, consisted of taxes, accounts (billings for user charged services), special assessments, accrued interest, loans, internal balances and intergovernmental receivables arising from grants, entitlements, and shared revenue. All intergovernmental receivables have been classified as “Due From Other Governments” on the basic financial statements. Receivables have been recorded to the extent that they are both measurable and available at December 31, 2004, as well as intended to finance fiscal 2004 operations.
A summary of the principal items of receivables reported on the Statement of Net Assets follows: Governmental Activities: Income taxes 13,503,531$ Real and other taxes 21,664,854 Accounts 3,410,979 Special assessments 2,059,557 Accrued interest 694,809 Loans 8,400,000 Due from other governments 19,136,407
Business-Type Activities: Accounts 17,851,987$ Special assessment 902,192 Accrued interest 781,572 Due from other governments 770,323 Internal balance 870,970
Receivables have been disaggregated on the face of the basic financial statements. Amounts reported as “Due from Other Governments” in the governmental activities include local government and local government revenue assistance from the State of Ohio, motor vehicle license and gasoline taxes, homestead and rollback, and estate taxes. The amounts reported as “Due from Other Governments” in the business-type activities include various state and federal grants whose eligibility requirements have been met by year-end. The only receivables not expected to be collected within the subsequent year are the special assessments and the loans. The special assessments are collected over the term of the assessment and the loans receivable which will be collected annually through 2020 (see Note 9).

CITY OF DAYTON, OHIO
NOTES TO THE BASIC FINANCIAL STATEMENTS FOR THE YEAR ENDED DECEMBER 31, 2004
78
NOTE 9 - LOANS RECEIVABLE
During 1999, the City issued taxable economic development revenue bonds payable from nontax revenues of the City, in the amount of $12,190,000 (see Note 13.A.) and loaned $11,200,000 of the proceeds to Riverfront Area Redevelopment Enterprises, Inc. (the “Stadium Owner”) to assist in financing the costs of constructing a baseball stadium. In consideration of the repayment of the loan, the Stadium Owner shall make loan payments in the amount of $560,000 on April 1 of each year for twenty years, commencing April 1, 2000. All loan payments received will be credited against the outstanding principal amount of the loan, there being no interest payable on the loan.
The obligations of the stadium owner to make a loan payment on any loan payment date shall be forgiven if neither the stadium owner nor the team owner has materially breached, violated, or failed to fully perform any provision contained in the ground lease, the stadium lease, or the plaza lease (see Note 12) and the team owner has committed to play all club home games at the stadium during the then current calendar year. At December 31, 2004, the amount owed to the City was $8,400,000.
NOTE 10 - CAPITAL ASSETS
Capital asset activity for the fiscal year ended December 31, 2004, was as follows:
Balance BalanceGovernmental Activities: 12/31/03 Additions Deductions 12/31/04
Capital assets, not being depreciated: Land 50,694,937$ 5,714,948$ (43,263)$ 56,366,622$ Construction in progress 23,471,084 7,205,343 (12,778,181) 17,898,246
Total capital assets, not being depreciated 74,166,021 12,920,291 (12,821,444) 74,264,868
Capital assets, being depreciated: Buildings and improvements 89,769,666 2,640,841 - 92,410,507 Improvements other than buildings 50,732,825 958,875 - 51,691,700 Equipment 20,020,639 445,371 - 20,466,010 Vehicles 40,248,484 2,369,941 (63,630) 42,554,795 Infrastructure 155,378,446 18,726,499 - 174,104,945
Total capital assets, being depreciated 356,150,060 25,141,527 (63,630) 381,227,957
Less: accumulated depreciation: Buildings and improvements (52,836,026) (2,098,167) - (54,934,193) Improvements other than buildings (27,809,563) (1,505,633) - (29,315,196) Equipment (9,561,915) (1,106,730) - (10,668,645) Vehicles (33,391,468) (1,090,317) 63,630 (34,418,155) Infrastructure (36,343,589) (3,388,764) - (39,732,353)
Total accumulated depreciation (159,942,561) (9,189,611) 63,630 (169,068,542)
Total capital assets, being depreciated net 196,207,499 15,951,916 - 212,159,415
Governmental activities capital assets, net 270,373,520$ 28,872,207$ (12,821,444)$ 286,424,283$

CITY OF DAYTON, OHIO
NOTES TO THE BASIC FINANCIAL STATEMENTS FOR THE YEAR ENDED DECEMBER 31, 2004
79
NOTE 10 - CAPITAL ASSETS - (Continued)
Balance BalanceBusiness-Type Activities: 12/31/03 Additions Deductions 12/31/04
Capital assets, not being depreciated: Land 37,076,438$ 708,601$ -$ 37,785,039$ Construction in progress 25,322,441 21,138,416 (7,119,606) 39,341,251
Total capital assets, not being depreciated 62,398,879 21,847,017 (7,119,606) 77,126,290
Capital assets, being depreciated: Buildings and improvements 146,498,109 1,398,065 - 147,896,174 Improvements other than buildings 483,267,841 11,374,762 - 494,642,603 Equipment 9,734,583 308,750 - 10,043,333 Vehicles 33,260,961 1,670,533 (352,040) 34,579,454
Total capital assets, being depreciated: 672,761,494 14,752,110 (352,040) 687,161,564
Less: accumulated depreciation: Buildings and improvements (56,523,223) (3,068,462) - (59,591,685) Improvements other than buildings (235,587,624) (15,375,849) - (250,963,473) Equipment (5,619,592) (667,525) - (6,287,117) Vehicles (20,952,208) (1,299,199) 331,916 (21,919,491)
Total accumulated depreciation (318,682,647) (20,411,035) 331,916 (338,761,766)
Total capital assets, being depreciated net 354,078,847 (5,658,925) (20,124) 348,399,798
Business-type activities capital assets, net 416,477,726$ 16,188,092$ (7,139,730)$ 425,526,088$ Depreciation expense was charged to functions of the primary government as follows: Governmental Activities: Downtown 890,812$ Youth, education and human services 2,075 Community development and neighborhoods 158,894 Economic development 76,375 Leadership and quality of life 5,054,917 Corporate responsibility 1,514,162 Public safety and justice 1,492,376
Total depreciation expense - governmental activities 9,189,611$

CITY OF DAYTON, OHIO
NOTES TO THE BASIC FINANCIAL STATEMENTS FOR THE YEAR ENDED DECEMBER 31, 2004
80
NOTE 10 - CAPITAL ASSETS - (Continued)
Construction-in-progress reported in the governmental funds is composed of the following:
Project Expended at Authorization 12/31/04 Committed
Facility Improvement 2,173,675$ 572,548$ 1,601,127$ CBD Signal Restorations 1,062,500 722,682 339,818 Germantown Street Resurfacing 3,728,603 684,465 3,044,138 Zion Church Stabilization 1,163,768 619,598 544,170 Public Facility Improvement 885,200 593,728 291,472 One Stop Shop 1,767,200 1,501,309 265,891 Recreation and Parks 660,600 278,547 382,053 Zion Gateway Park 1,330,783 904,911 425,872 Reibold Block Transportation 2,585,071 1,057,335 1,527,736 Convention Center Improvements 3,572,430 3,196,263 376,167 Signal Upgrade, Phase V 1,393,000 265,529 1,127,471 Recreation and Parks Improvements 1,628,453 923,638 704,815 Stuart Patterson Rec. 90,000 69,564 20,436 Brown Warren Shared Parking Lot 60,000 - 60,000 Development - Demolition 1,500,950 337,892 1,163,058 Washington Street Bridge 7,700,000 227,437 7,472,563 Findlay Street Bridge 4,400,000 252,049 4,147,951 GHR Foundry 2,752,363 1,803,182 949,181 Wright Dunbar Village Plan 411,965 298,343 113,622 Issue 2 Projects 432,176 - 432,176 TIP Project Funds 100,000 - 100,000 Riverside Dr. Reconstruction 410,502 244,232 166,270 McGee Blvd. 2,122,200 - 2,122,200 Fire Facility Improvements 183,635 - 183,635 Signal Upgrade, Phase 4 1,061,500 - 1,061,500 ODD Dayton Supply & Treatment 500,000 - 500,000 Underground Storage 402,533 24,820 377,713 Philadelphia Dr. Widening 2,001,844 - 2,001,844 Dayton Technology Campus 6,681,000 55,800 6,625,200 Permissive License Tax 1,340,902 767,357 573,545 N. Gettysburg Ave. Resurface 2,716,990 2,314,908 402,082 McCall Drive and Parking Lot 314,359 182,109 132,250 Valley Street Greenway - Phase II 356,500 - 356,500 Demolition Program - Land Clean-up 399,830 - 399,830 Real Estate Capital 158,433 - 158,433 Great Miami blvd. Renewal 51,888 - 51,888
Total 58,100,853$ 17,898,246$ 40,202,607$

CITY OF DAYTON, OHIO
NOTES TO THE BASIC FINANCIAL STATEMENTS FOR THE YEAR ENDED DECEMBER 31, 2004
81
NOTE 10 - CAPITAL ASSETS - (Continued)
Construction-in-progress reported in the enterprise funds is composed of the following:
Project Expended atDayton International Airport Authorization 12/31/04 Committed
ED Dev - GACZ Development 206,000$ 201,686$ 4,314$ Parking Garage Concept Design 7,450,718 5,097,928 2,352,790 Parking Lot Rehabilitation 30,000 19,972 10,028 Taxiway W Phase II 360,774 - 360,774 Terminal Apron Expansion 200,000 - 200,000 Aviation 9/11 Security Enhancement 3,636,000 419,704 3,216,296 Security Grant 3,448,541 1,658,592 1,789,949 EIS Phase I 2,958,903 560,935 2,397,968 Terminal Road/Parking Lot Improvement 7,308,467 3,442,267 3,866,200 Snow Removal Building 1,438,842 668,254 770,588 Parking lot expansion 4,269,000 873,243 3,395,757 Perimeter Rd. Phase I 1,569,038 1,236,223 332,815 Reservation Center Purchase 575,000 - 575,000 Air Traffic Control Tower 482,799 - 482,799 NE Deicing Airport Extension 581,375 - 581,375 DWBA Runway Rehab 68,718 56,631 12,087 DWBA Taxiway A/Ruinway 2/20 505,000 204,157 300,843 Air Traffic Control Tower 5,520,300 2,906,227 2,614,073 Terminal Road Access Rehab 5,876,112 462,030 5,414,082 Cargo Road Parking Lot 1,899,016 - 1,899,016 Terminal Gate Enhancements 11,931,829 8,942,720 2,989,109 D/A Airport Parking Structure 617,592 19,608 597,984 Architectural Work, misc. 186,500 162,905 23,595
Total 61,120,524$ 26,933,082$ 34,187,442$

CITY OF DAYTON, OHIO
NOTES TO THE BASIC FINANCIAL STATEMENTS FOR THE YEAR ENDED DECEMBER 31, 2004
82
NOTE 10 - CAPITAL ASSETS - (Continued)
Project Expended atWater Authorization 12/31/04 Committed
Ottawa Yard Complex I 2,500,000$ 1,283,778$ 1,216,222$ Trotwood Water Main 5,791,500 12,406 5,779,094 Warehouse Roof Replacement 88,986 33,728 55,258 Well Rehabilitation 1,000,000 752,977 247,023 Water Treatment Plant Improvement 2,570,439 108,689 2,461,750 Replacement of Equipment 3,923,884 471,924 3,451,960 Water Administration Building Security System 83,634 63,928 19,706 Mulberry Water Main Installation 1,354,400 532,694 821,706 Water Dist Mains/Clayton 1,369,170 1,222,840 146,330 Water Meter 217,280 80,348 136,932 Wellsfield Development 1,558,506 1,191,977 366,529 Ottawa SCADA Treatment System Imp. 500,000 100,931 399,069 Clayton Water Distribution 2,100,000 1,813,682 286,318 Ottawa Treatment Plant 674,499 331,198 343,301 Chlorine Feed System Modification 500,000 - 500,000 Arcadia Blvd. Water Main Improvement 600,000 - 600,000 Findlay St. Water Main Improvement 100,000 - 100,000 Storm Sewer Discharge - Route 4 Lagoon 75,000 - 75,000 Paving Improvements 175,000 - 175,000 Washwater Lagoon 848,602 - 848,602 Culvert and Bridge Replacements 250,000 - 250,000 SCADA Services 50,000 21,919 28,081 Water Storage Tanks Evaluation 1,090,854 18,770 1,072,084
Total 27,421,754$ 8,041,789$ 19,379,965$

CITY OF DAYTON, OHIO
NOTES TO THE BASIC FINANCIAL STATEMENTS FOR THE YEAR ENDED DECEMBER 31, 2004
83
NOTE 10 - CAPITAL ASSETS - (Continued)
Project Expended atSewer Authorization 12/31/04 Committed
AWT Improvement Phase III 979,200$ 632,981$ 346,219$ Philadelphia Sewer Replacement 950,000 898,228 51,772 MacGregor Pike Sewer Replacement 110,000 42,750 67,250 Cone Court Sewer Replacement 60,000 255 59,745 Sanitary Sewer Repair 3,251,375 1,205,710 2,045,665 Roof Replacement - WWTP 156,199 127,385 28,814 Sanitary Force Main Rehabilitation 2,000,000 432,321 1,567,679 Kings Highway Sanitary Sewer 33,000 - 33,000 Kiser Street Sanitary Sewer 80,000 67,713 12,287 Oak & Cross St. Sanitary Sewer 138,500 115,002 23,498 Dwight Ave. Sanitary Sewer 40,000 29,396 10,604 Kensington Drive Sanitary Sewer 65,000 53,070 11,930 AWT Facilities Improvement 10,450,000 - 10,450,000 SW Trunk Sanitary Sewer Improvement 4,418,497 - 4,418,497 WWTP Improvements 489,483 - 489,483 WINS Upgrade - Sanitary 495,838 - 495,838 Sanitary Master Plan 500,000 - 500,000 Web-based O&M Manual 500,000 - 500,000 Sanitary Flow Monitoring 850,000 381,820 468,180 Wagoner Ford Sewer Cleaning 500,000 - 500,000 Basement Flooding Abatement 500,000 - 500,000 Roof Replacement 594,000 111,700 482,300 Dewatering Pad Replacements 125,000 64,612 60,388
Total 27,286,092$ 4,162,943$ 23,123,149$
Project Expended atStorm Water Authorization 12/31/04 Committed
Storm Pump Station Improvement 150,000$ 123,494$ 26,506$ Centurion Street Sweeper 156,000 - 156,000 Storm Sewer Master Plan 170,306 - 170,306 Blanche St. Storm Sewer Replacement 324,152 79,943 244,209
Total 800,458$ 203,437$ 597,021$

CITY OF DAYTON, OHIO
NOTES TO THE BASIC FINANCIAL STATEMENTS FOR THE YEAR ENDED DECEMBER 31, 2004
84
NOTE 11 - CAPITAL LEASES - LESSEE DISCLOSURE
In the current year, the City entered into a capitalized lease for land. In a prior year, the City entered into capitalized leases for copiers, and a golf course mower. Also in a prior year, the City entered into a lease purchase agreement for the acquisition of 100 golf carts.
The leases meet the criteria of capital leases as defined by Statement of Financial Accounting Standard No. 13 “Accounting for Leases”, which defines a capital lease generally as one which transfers benefits and risks of ownership to the lessee. Fund fixed assets acquired by capital lease and the related liability and interest expense have been reported in the Golf enterprise fund (nonmajor enterprise fund) and Stores and Reproduction internal service fund. Principal payments in 2004 totaled $34,427 for the general fund, $1,002,000 for nonmajor governmental funds, $110,127 for the Golf enterprise fund and $65,491 for the Stores and Reproduction internal service fund.
The following is an analysis of assets leased under capital leases as of December 31, 2004:
Governmental
Activities Nonmajor Enterprise Internal Service
General Governmental Stores and Fund Funds Golf Fund Reproduction Fund
Equipment 112,090$ -$ 77,872$ 343,990$ Motorized vehicles - - 347,500 - Land - 4,500,000 - -
Total 112,090$ 4,500,000$ 425,372$ 343,990$ The following is a schedule of the future long-term minimum lease payments required under the capital leases and the present value of the minimum lease payments as of December 31, 2004:
Governmental
Activities Internal ServiceNonmajor
General Governmental Stores andYear Ending December 31 Fund Funds Reproduction Fund
2005 40,379$ 501,000$ 84,000$ 2006 - 501,000 84,000 2007 - 501,000 49,000 2008 - 501,000 - 2009 - 1,494,000 -
Total 40,379 3,498,000 217,000
Less: amount representing interest (3,095) - (21,542)
Present value of minimum lease payments 37,284$ 3,498,000$ 195,458$

CITY OF DAYTON, OHIO
NOTES TO THE BASIC FINANCIAL STATEMENTS FOR THE YEAR ENDED DECEMBER 31, 2004
85
NOTE 12 - OPERATING LEASE - LESSEE AND LESSOR DISCLOSURE
The City is the lessor of land and space (through Dayton International Airport enterprise fund) under noncancellable leases. Leases have varying terms from three to sixty five years. The future minimum lease payments as of December 31, 2004, are as follows:
Year Ending MinimumDecember 31 Lease Payments
2005 2,016,484$ 2006 1,960,990 2007 1,878,014 2008 1,795,038 2009 1,712,062
2010 - 2042 20,003,355
Totals 29,365,943$
The City is also the lessor of land and space to the Riverfront Area Redevelopment Enterprises, Inc. The ground lease is $9,000 per year and the plaza lease is $1,000 per year, both payable in annual installments before or on April 1 each year for the next 20 years. Both of these payments must be made each year for the $560,000 loan payment to be forgiven each year (see Note 9). The future minimum lease payments as of December 31, 2004, are as follows:
Year Ending MinimumDecember 31 Lease Payments
2005 10,000$ 2006 10,000 2007 10,000 2008 10,000 2009 10,000
2010 - 2014 50,000 2015 - 2019 50,000
Totals 150,000$

CITY OF DAYTON, OHIO
NOTES TO THE BASIC FINANCIAL STATEMENTS FOR THE YEAR ENDED DECEMBER 31, 2004
86
NOTE 13 - LONG-TERM OBLIGATIONS
A. The balance of the City’s governmental activities long-term obligations at December 31, 2003 has been restated to include claims and judgements of $9,050,194. The effect on the total governmental activities long-term obligations at January 1, 2004 was an increase of $9,060,194 from $82,097,984 to $91,158,178. The City’s governmental activities long-term obligations at year-end and a schedule of current year activity are as follows:
Original Restated Amounts
Issue Maturity Interest Issue Balance Balance Due inGovernmental Activities: Date Date Rate (%) Amount 12/31/03 Increase Decrease 12/31/04 One Year
General Obligation Bonds:
Western Avenue Improvement 06/01/86 12/01/06 7.625 9,000,000$ 1,350,000$ -$ (450,000)$ 900,000$ 450,000$
Wegerzyn Center Improvement 06/01/86 12/01/06 7.625 1,000,000 150,000 - (50,000) 100,000 50,000
Exhibition Center Improvement 06/01/86 12/01/06 7.625 6,200,000 930,000 - (310,000) 620,000 310,000
Road Improvements 06/01/89 12/01/09 7.000 5,200,000 1,560,000 - (260,000) 1,300,000 260,000
Human Rehabilitation Center 06/01/89 12/01/09 7.000 2,425,000 745,000 - (120,000) 625,000 125,000
Police District Facilities 06/01/89 12/01/09 7.000 1,815,000 555,000 - (90,000) 465,000 90,000
Capital Facilities 10/01/93 11/01/13 4.5 to 4.75 7,465,000 3,590,000 - (355,000) 3,235,000 355,000
Taxable Housing Improvements 10/01/93 11/01/13 5.35 to 6.5 3,035,000 1,535,000 - (150,000) 1,385,000 150,000
Capital Facilities 10/01/94 11/01/14 4.5 to 8.0 3,280,000 1,680,000 - (150,000) 1,530,000 150,000
Capital Facilities 05/01/98 12/01/08 4.6 to 5.0 15,630,000 11,695,000 - (815,000) 10,880,000 820,000
Capital Facilities 12/01/98 12/01/20 3.1 to 5.125 22,200,000 14,645,000 - (1,795,000) 12,850,000 1,795,000
Capital Facilities 02/01/01 12/01/14 3.75 to 4.65 24,911,861 20,200,798 - (3,020,801) 17,179,997 2,262,351
Capital Facilities 06/16/04 12/01/19 3.0 to 5.25 11,360,000 - 11,360,000 - 11,360,000 580,000
Total general obligation bonds 58,635,798 11,360,000 (7,565,801) 62,429,997 7,397,351
Revenue Bonds:
Baseball Revenue bonds 03/01/99 12/01/19 5.69 to 6.85 12,190,000 10,790,000 - (405,000) 10,385,000 430,000
Economic Development
Revenue Bonds 12/11/02 11/01/12 5.5 1,000,000 1,000,000 - - 1,000,000 -
Total revenue bonds 11,790,000 - (405,000) 11,385,000 430,000

CITY OF DAYTON, OHIO
NOTES TO THE BASIC FINANCIAL STATEMENTS FOR THE YEAR ENDED DECEMBER 31, 2004
87
NOTE 13 - LONG-TERM OBLIGATIONS - (Continued)
Original Restated AmountsIssue Maturity Interest Issue Balance Balance Due in
Date Date Rate (%) Amount 12/31/03 Increase Decrease 12/31/04 One Year
Special Assessment Bonds:
Sidewalk Construction 11/01/94 11/01/04 6.000 15,219 1,500$ -$ (1,500)$ -$ -$ Sidewalk Construction 11/01/95 11/01/05 6.000 30,459 6,000 - (3,000) 3,000 3,000 Sidewalk Construction 11/01/96 11/01/06 6.000 29,566 9,000 - (3,000) 6,000 3,000 Ornamental Lighting 11/01/97 11/01/07 6.000 71,270 28,400 - (7,100) 21,300 7,100 Sidewalk Construction 11/01/97 11/01/07 6.000 10,141 4,000 - (1,000) 3,000 1,000 Sidewalk Construction 11/01/98 11/01/08 6.000 9,098 4,500 - (900) 3,600 900 Sidewalk Construction 11/01/00 11/01/05 6.000 112,082 44,800 - (22,400) 22,400 22,400 Sidewalk Construction 11/01/00 11/01/10 6.000 127,575 89,600 - (12,800) 76,800 12,800 Sidewalk Construction 12/01/01 12/01/04 6.000 24,299 8,000 - (8,000) - - Sidewalk Construction 12/01/01 12/01/06 6.000 23,528 14,100 - (4,700) 9,400 4,700 Sidewalk Construction 12/01/01 12/01/11 6.000 11,089 8,800 - (1,100) 7,700 1,100 Sidewalk Construction 11/01/02 11/01/05 6.000 54,198 36,000 - (18,000) 18,000 18,000 Sidewalk Construction 11/01/02 11/01/07 6.000 174,863 140,000 - (35,000) 105,000 35,000 Sidewalk Construction 11/01/02 11/01/12 6.000 251,050 225,900 - (25,100) 200,800 25,100 Ornamental Lighting 11/01/02 11/01/12 6.000 88,276 79,200 - (8,800) 70,400 8,800 Sidewalk Construction 12/01/03 12/01/06 6.000 54,813 54,813 - (18,813) 36,000 18,000 Sidewalk Construction 12/01/03 12/01/08 6.000 172,725 172,725 - (32,725) 140,000 35,000 Sidewalk Construction 12/01/03 12/01/13 6.000 167,947 167,947 - (17,647) 150,300 16,700 Sidewalk Construction 12/01/04 12/01/07 6.000 26,559 - 26,559 - 26,559 8,959 Sidewalk Construction 12/01/04 12/01/09 6.000 112,047 - 112,047 - 112,047 22,447 Sidewalk Construction 12/01/04 12/01/14 6.000 232,415 - 232,415 - 232,415 23,615
Total special assessment bonds 1,095,285 371,021 (221,585) 1,244,721 267,621
Other long-term obligationsClaims and judgements 9,060,194 4,671,864 (2,851,298) 10,880,760 282,841 Compensated absences 10,244,241 3,826,530 (3,407,105) 10,663,666 4,032,952 Capital lease obligations 332,660 4,500,000 (1,101,918) 3,730,742 609,211
Total other long-term obligations 19,637,095 12,998,394 (7,360,321) 25,275,168 4,925,004
Total governmental activities 91,158,178$ 24,729,415$ (15,552,707)$ 100,334,886 13,019,976$
Add: unamortized bond premium 236,604
Total on statement of net assets 100,571,490$
General obligation bonds were used to construct street improvements and government construction projects. All general obligation bonds will be paid through the debt service fund from property tax revenues and other revenue sources of the City.
Special assessment bond issues represent assessments for sidewalk, curb and gutter reconstruction, and lighting. They are payable from tax assessments against the property owner whose benefits from the improvements exceed that of the general public. The special assessment bond issues are backed by the full faith and credit of the City. In the event that an assessed property owner fails to make payments, the City will be required to pay the related debt. These bonds will be paid from the debt service fund.
Compensated absences will be paid from the fund from which the employees' salaries are paid.

CITY OF DAYTON, OHIO
NOTES TO THE BASIC FINANCIAL STATEMENTS FOR THE YEAR ENDED DECEMBER 31, 2004
88
NOTE 13 - LONG-TERM OBLIGATIONS - (Continued) As of December 31, 2004, the City's overall legal debt margin (the ability to issue additional amounts of general obligation bonded debt) was $202,513,967 and unvoted legal debt margin was $100,329,680. The following is a schedule of future principal and interest payments to retire the long-term obligations outstanding at December 31, 2004 for the governmental activities:
General Obligation Bonds Revenue Bonds Special Assessment Bonds Year Principal Interest Total Principal Interest Total Principal Interest Total
2005 7,467,351$ 2,927,408$ 10,394,759$ 430,000$ 752,666$ 1,182,666$ 267,621$ 74,683$ 342,304$ 2006 5,234,874 2,584,656 7,819,530 455,000 726,092 1,181,092 223,600 58,626 282,226 2007 4,537,548 2,325,102 6,862,650 528,183 697,746 1,225,929 197,900 45,210 243,110 2008 4,643,890 2,120,943 6,764,833 601,367 663,725 1,265,092 146,000 33,336 179,336
2009 4,957,280 1,910,756 6,868,036 631,367 626,376 1,257,743 110,100 24,576 134,676 2010-2014 22,649,054 6,272,153 28,921,207 4,104,083 2,411,108 6,515,191 299,500 44,070 343,570 2015-2019 11,965,000 1,954,735 13,919,735 4,635,000 994,278 5,629,278 - - - 2020-2021 975,000 45,825 1,020,825 - - - - - -
Totals 62,429,997$ 20,141,578$ 82,571,575$ 11,385,000$ 6,871,991$ 18,256,991$ 1,244,721$ 280,501$ 1,525,222$
B. Changes during 2004 in the City's long-term business-type obligations were as follows:
Original Amounts
Issue Maturity Interest Issue Balance Balance Due inBusiness Type Activities: Date Date Rate (%) Amount 12/31/03 Increase Decrease 12/31/04 One Year
General Obligation Bonds:
Golf renovations 02/01/01 12/14/14 3.30 to 4.65 3,828,139$ 3,104,190$ -$ (464,187)$ 2,640,003$ 347,649$
Total general obligation bonds 3,104,190 - (464,187) 2,640,003 347,649
Revenue Bonds:
Dayton International Airport 10/01/95 12/15/15 3.85 to 5.5 35,510,000 21,675,000 - (1,335,000) 20,340,000 1,410,000
Refunding Waterworks 03/01/99 12/01/07 3.50 to 4.15 46,690,000 22,065,000 - (5,405,000) 16,660,000 5,620,000
Dayton International Airport 10/31/03 12/01/32 2.00 to 5.00 6,085,000 6,085,000 - (95,000) 5,990,000 120,000
Dayton International Airport 10/31/03 12/01/11 2.00 to 3.75 9,330,000 9,330,000 - (710,000) 8,620,000 1,030,000
Dayton International Airport 10/31/03 12/01/32 2.00 to 5.25 30,190,000 30,190,000 - (345,000) 29,845,000 445,000
Total revenue bonds 89,345,000 - (7,890,000) 81,455,000 8,625,000

CITY OF DAYTON, OHIO
NOTES TO THE BASIC FINANCIAL STATEMENTS FOR THE YEAR ENDED DECEMBER 31, 2004
89
NOTE 13 - LONG-TERM OBLIGATIONS - (Continued)
Original AmountsIssue Maturity Interest Issue Balance Balance Due in
Date Date Rate (%) Amount 12/31/03 Increase Decrease 12/31/04 One Year
Other long-term obligations
Ohio Water Development Authority Loan 12/20/88 07/01/23 3.80 to 8.3 73,198,476$ 27,401,011$ 453,006$ (3,314,332)$ 24,539,685$ 2,962,995$
Ohio Public Works
Commission Loan 07/01/97 01/01/20 0.00 1,000,000 850,000 - (50,000) 800,000 50,000
Compensated absences payable 2,426,568 1,159,262 (965,029) 2,620,801 806,421
Capital lease obligations 110,127 - (110,127) - -
Total other long-term obligations 30,787,706 1,612,268 (4,439,488) 27,960,486 3,819,416
Total business-type activities 123,236,896$ 1,612,268$ (12,793,675)$ 112,055,489 12,792,065$
Less: unamortized deferred charge on refunding (1,697,630)
Less: unamortized bond discount (621,095)
Total on statement of net assets 109,736,764$
Enterprise fund general obligation bonds were used for the Dayton International Airport improvements and golf renovations. The bonds will be paid from the respective enterprise fund.
Revenue bonds were issued for various projects at the Dayton International Airport and for water system improvements. The revenue bonds are pledged against the revenue generated by the specific enterprise fund, and will be paid from the respective enterprise fund.
On October 31, 2003, the City issued general obligation bonds (Series 2003 Bonds). A portion of the proceeds of the 2003 bonds will be issued to retire $8,000,000 in general obligation bond anticipation notes that the City issued to pay costs of Airport improvements and to prepay the City’s obligations for the lease-purchase agreement entered into to finance the terminal environment restoration project. Portions of the bonds will also be used to improve the Airport by the acquisition, construction, furnishing and equipping of parking, roadway, airfield and terminal improvements and providing all necessary and related improvements. A portion of the proceeds was used to advance refund the Series 1992 bonds (principal $8,235,000) and variable interest rates. The issuance proceeds were deposited into a special escrow trust fund, which consists of cash and direct or guaranteed non-callable government obligations. The principal of this escrow trust, when due, will be sufficient to pay on the redemption date the principal of, redemption premium and interest on the Series 1992 bonds. This refunded debt is considered defeased (in substance) and accordingly, has been removed from the statement of net assets. The reacquisition price exceeded the net carrying amount of the old debt by $76,720. This amount is being netted against new debt and amortized over the remaining life of the refunded debt, which is equal to the life of the new debt issued. The advance refunding was undertaken to reduce total debt service payments over the next thirty years by $295,676 and resulted in an economic gain of $284,481. The unamortized bond discount for the Series 2004 bonds was $364,244.

CITY OF DAYTON, OHIO
NOTES TO THE BASIC FINANCIAL STATEMENTS FOR THE YEAR ENDED DECEMBER 31, 2004
90
NOTE 13 - LONG-TERM OBLIGATIONS - (Continued) The 1995 revenue bonds in the Dayton International Airport enterprise fund are reported at carrying value. Face value of the bond was $33,960,000. The unamortized bond discount was $303,550 and the unamortized deferred charge on the 1995 refunding was $1,727,758. The deferred charge is being amortized as part of interest expense over the life of the new debt.
The revenue bonds in the Water enterprise fund are reported at carrying value. Face value of the bond was $32,260,000. The unamortized deferred charge on the 1999 refunding was $169,350. The deferred charge is being amortized as part of interest expense over the life of the new debt. The City of Dayton's Wastewater Treatment Plant capital improvement project is funded through the joint efforts of the United States Environmental Protection Agency (EPA) and the Ohio Water Development Authority (OWDA). Repayment amounts include capital expenses, administration fees, and accrued interest. The Ohio Water Development Authority Loan will be paid from the Sewer enterprise fund. At December 31, 2004, the City had outstanding borrowings of $24,539,685 through OWDA. The future annual debt service principal and interest requirements for OWDA loans include only those loans that are finalized and all monies related to the projects are disbursed. As of December 31, 2004, the future annual debt service principal and interest payments for two OWDA loans were unavailable because monies related to the projects are still being disbursed and the loans are not finalized.
During 1997, the City of Dayton was granted a $1,000,000 loan from the Ohio Public Works Commission. The purpose of the loan is to finance and reimburse the costs of replacing a wastewater treatment laboratory facility to meet Ohio Environmental Protection Agency and the Occupational Safety and Health Association requirements. The loan is being paid out of the Sewer fund over 20 years, with semi-annual payments of $25,000. There is no interest on this loan.
Compensated absences will be paid from the fund from which the employees' salaries are paid. Capital leases will be paid from the Dayton International Airport and Golf enterprise funds. The claims payable liability will be paid from the Workers' Compensation internal service fund.
The following is a schedule of future principal and interest payments to retire the long-term obligations outstanding at December 31, 2004 for the business-type activities:
General Obligation Bonds Revenue Bonds
Year Principal Interest Total Principal Interest Total
2005 347,649$ 110,790$ 458,439$ 8,625,000$ 3,762,825$ 12,387,825$ 2006 205,126 97,753 302,879 9,125,000 3,418,276 12,543,276 2007 212,452 89,855 302,307 8,580,000 3,052,514 11,632,514 2008 221,110 81,463 302,573 3,535,000 2,698,913 6,233,913 2009 277,720 72,509 350,229 3,670,000 2,559,000 6,229,000
2010-2014 1,375,946 174,312 1,550,258 17,640,000 10,287,471 27,927,471 2015-2019 - - - 7,780,000 6,888,089 14,668,089 2020-2024 - - - 6,940,000 5,234,365 12,174,365 2025-2029 - - - 8,960,000 3,221,358 12,181,358 2030-2032 - - - 6,600,000 713,276 7,313,276
Totals 2,640,003$ 626,682$ 3,266,685$ 81,455,000$ 41,836,087$ 123,291,087$

CITY OF DAYTON, OHIO
NOTES TO THE BASIC FINANCIAL STATEMENTS FOR THE YEAR ENDED DECEMBER 31, 2004
91
NOTE 13 - LONG-TERM OBLIGATIONS - (Continued)
OWDA Loans OPWC Loans Year Principal Interest Total Principal Interest Total
2005 2,962,995$ 872,378$ 3,835,373$ 50,000$ -$ 50,000$ 2006 2,806,233 634,727 3,440,960 50,000 - 50,000 2007 2,649,471 412,721 3,062,192 50,000 - 50,000 2008 2,649,471 206,361 2,855,832 50,000 - 50,000 2009 - - - 50,000 - 50,000
2010-2014 - - - 250,000 - 250,000 2015-2019 - - - 250,000 - 250,000
2020 - - - 50,000 - 50,000
Totals 11,068,170$ 2,126,187$ 13,194,357$ 800,000$ -$ 800,000$
NOTE 14 - NOTES PAYABLE
A. A summary of the governmental-activities notes payable transactions for the year ended December 31, 2004, follows:
Issue Maturity Interest Balance Balance
Governmental Activities: Date Date Rate (%) 12/31/03 Increase Decrease 12/31/04
General Obligation Notes:
Series 2003 12/17/03 06/17/04 2.00 8,250,000$ -$ (8,250,000)$ -$
Total G.O. Notes 8,250,000 - (8,250,000) -
Special Assessment Notes:
Sidewalk Construction 12/01/03 12/01/04 6.00 1,416 - (1,416) -
Grafton Hill Lighting 12/01/03 12/01/04 6.00 2,126 - (2,126) -
Central Business Lighting 12/01/03 12/01/04 6.00 44,588 - (44,588) -
Sidewalk Construction 12/01/04 12/01/05 6.00 - 242 - 242
Grafton Hill Lighting 12/01/04 12/01/05 6.00 - 2,699 - 2,699
Central Business Lighting 12/01/04 12/01/05 6.00 - 49,747 - 49,747
Total special assessment notes 48,130 52,688 (48,130) 52,688
Total governmental activities 8,298,130$ 52,688$ (8,298,130)$ 52,688$

CITY OF DAYTON, OHIO
NOTES TO THE BASIC FINANCIAL STATEMENTS FOR THE YEAR ENDED DECEMBER 31, 2004
92
NOTE 14 - NOTES PAYABLE - (Continued)
B. A summary of the business-type activities notes payable transactions for the year ended December 31, 2004, follows:
Issue Maturity Interest Balance BalanceBusiness-type Activities: Date Date Rate (%) 12/31/03 Increase Decrease 12/31/04
General Obligation Notes:
Airport Notes Series A 05/28/03 02/26/04 2.00 4,850,000$ -$ (4,850,000)$ -$
Airport Notes Series B 07/07/04 07/07/05 2.00 - 8,000,000 - 8,000,000
Airport Notes Series C 08/24/04 08/24/05 2.00 - 1,350,000 - 1,350,000
Total G.O. notes 4,850,000$ 9,350,000$ (4,850,000)$ 9,350,000$ The special assessment note represents an assessment for sidewalk improvements. It is payable from tax assessments against the property owner whose benefits from the improvements exceed that of the general public. The special assessment note is backed by the full faith and credit of the City. In the event that an assessed property owner fails to make payments, the City will be required to pay the related debt. This note will be repaid from the Capital Improvement capital projects fund.
NOTE 15 - SEGMENT INFORMATION - NONMAJOR ENTERPRISE FUNDS
The City's maintains two nonmajor enterprise funds to account for Storm Water and Golf activities. Neither of these activities is supported by revenue bonds or other revenue-backed debt instruments, therefore, segment information is not required. See the combining statements included as part of this CAFR for detailed fund activity of the nonmajor enterprise funds.
NOTE 16 - RISK MANAGEMENT
A. Property and Liability
The City is exposed to various risks of loss related to torts; theft of, damage to, and destruction of assets; errors and omissions; injuries to employees and natural disasters. In 2004, the City contracted with various insurance companies to provide the following coverages:
Type of Coverage Coverage
Primary and Excess Airport Liability $100,000,000 Per Occurrence 50,000,000 Property 618,755,962
General Liability (North West Railway) 5,000,000 Commercial Liability (Convention Center) 1,000,000
Errors and Omissions (Ambulance Attendants) 500,000 Garagekeepers/Operators Liability 3,000,000 Comprehensive/Catastrophic Fleet 20,000,000 Air Show Liability 95,000,000
Settled claims have not exceeded this commercial coverage in any of the past three years. There have been no significant reductions in insurance coverage from last year.

CITY OF DAYTON, OHIO
NOTES TO THE BASIC FINANCIAL STATEMENTS FOR THE YEAR ENDED DECEMBER 31, 2004
93
NOTE 16 - RISK MANAGEMENT - (Continued) B. Workers' Compensation
The City has elected to take advantage of the workers' compensation plan being offered by the State of Ohio. This plan, called retrospective rating, allows the City to pay a fraction of the premium it would pay as an experience-rated risk.
Retrospective rating constitutes a step closer to self-insurance. In the retrospective rating plan, the City agrees to assume a portion of the risk in return for a possible reduction in premiums. The greater the percentage of the risk the City assumes, the greater the potential reduction in the premium. If the City's loss experience is better than predicted by the experience-rating system, its premium obligation will be less than what it would have paid under experience rating. If its experience is worse than predicted, its premium obligation will be more than it would have been assessed under experience rating, limited to a maximum premium. The City has assumed the risk for individual claims up to a maximum of $300,000.
The City has agreed to pay all claims up to a maximum of 200% of what the City would have paid had the City remained an experience-rated risk. Claims exceeding these limits will be paid by the State. Each year, the City pays the State a "minimum premium" for retaining the risk of having to pay claims which exceeds the City's maximum claim limits. Ten years after each year the City elected the retrospective plan for workers' compensation, the City settles up for the reserve on any claims that are still open. The City has established a Workers' Compensation Internal Service Fund to account for and finance its uninsured risks of loss in this program.
The claims liability of $10,772,100 reported at December 31, 2004, as estimated by the third party administrator, is based on the requirements of Governmental Accounting Standards Board Statement No. 10 which requires that a liability for unpaid claims cost be reported if information prior to the issuance of the financial statements indicates that it is probable that a liability has been incurred at the date of the financial statements and the amount of the loss can be reasonably estimated. Of the $10,772,100 claims liability, $174,181 of the liability is due within one year and is reported as a current liability in the statement of net assets for the proprietary funds. The remaining portion is a noncurrent liability of $10,597,919. The estimate was not affected by non-incremental claim adjustment expenses and does not include other allocated or unallocated claim adjustment expenses.
Changes in the funds' claims liability amount in 2003 and 2004 were:
Balance at Current Year Claim Balance at
Year Beginning of Year Claims Payments End of Year
2004 8,997,015$ 5,936,467$ (4,161,382)$ 10,772,100$ 2003 9,556,179 2,228,985 (2,788,149) 8,997,015

CITY OF DAYTON, OHIO
NOTES TO THE BASIC FINANCIAL STATEMENTS FOR THE YEAR ENDED DECEMBER 31, 2004
94
NOTE 17 - OTHER EMPLOYEE BENEFITS
A. Compensated Absences
The criteria for determining vacation, compensatory time and sick leave components are derived from negotiated agreements and State laws. Vacation time is accrued at the rate of one day per month, plus one to nine additional days per year for all employees except police, who receive up to 12 additional days per year, depending upon the length of service. The maximum accrual which can be carried forward into January is thirty days. Accumulated unused vacation time is paid to employees upon termination or retirement. Compensatory time off in lieu of overtime pay is an option given to uniformed Police under union contract. It is given on the basis of time and one-half for actual hours worked. Police officers, sergeants, and lieutenants may accumulate up to 136 hours. Currently, overtime pay is paid as overtime hours worked by those uniformed employees who have already accumulated the maximum hours allowed.
All uniformed employees of the Fire Department also have the option to choose compensatory time in lieu of overtime pay, and they may accumulate up to one hundred twenty hours of compensatory time. Employees who have accumulated the maximum hours are paid overtime as overtime hours are worked.
Sick leave is accrued at the rate of one and one-fourth days per month. The maximum sick leave accrual which can be carried forward into January is 125 days. Accrued sick leave in excess of 125 days must be converted to vacation days in January at the rate of two sick leave days for one vacation day. Upon retirement, payment is made for one-half of the total sick leave accumulation, up to a maximum of 140 days.
B. Insurance Benefits
Medical insurance is provided to employees through Anthem Blue Cross/Blue Shield Health Maintenance insurance plans. Dental insurance is provided to employees through MetLife and Ohio AFSCME Care. Group Life and Accidental Death and Dismemberment insurance is provided to employees through Aetna Life Insurance. Life insurance coverage amounts range from $12,000 to $300,000 according to employee position.
C. Deferred Compensation Plans
City employees and elected officials participate in either the International City Managers Association (ICMA) Deferred Compensation Plan, or the Ohio Public Employees Deferred Compensation Plan. These plans are created in accordance with Internal Revenue Code Section 457. Participation is on a voluntary payroll deduction basis. The plans permit deferral of compensation until future years. According to the plans, the deferred compensation is not available until termination, retirement, death or an unforeseeable emergency.

CITY OF DAYTON, OHIO
NOTES TO THE BASIC FINANCIAL STATEMENTS FOR THE YEAR ENDED DECEMBER 31, 2004
95
NOTE 18 - DEFINED BENEFIT PENSION PLANS
A. Ohio Public Employees Retirement System
All City full-time employees, other than uniformed employees, participate in the Ohio Public Employees Retirement System (OPERS), a cost-sharing multiple-employer public employee retirement system created by the State of Ohio. OPERS provides basic retirement and disability benefits, annual cost of living adjustments, and death benefits to plan members and beneficiaries. Authority to establish and amend benefits is provided by state statute per Chapter 145 of the Ohio Revised Code. OPERS issues a stand-alone financial report which may be obtained by writing to the Ohio Public Employees Retirement System, 277 East Town Street, Columbus, Ohio 43215-4642 or by calling (614) 222-6705 or 1-800-222-PERS (7377).
The Ohio Revised Code provides statutory authority for employee and employer contributions. The employee contribution rate for 2004 was 8.5% for employees other than law enforcement and public safety. The law enforcement classification consisted of sheriffs, deputy sheriffs, and township police with an employee contribution rate of 10.1%. Public safety division members contribute at 9%. The employer contribution rate for employees other than law enforcement and public safety division was 13.55% of covered payroll and 9.55% was the portion used to fund pension obligations for 2003. The employer contribution rate for law enforcement and public safety divisions was 16.70% of covered payroll and 12.70% was the portion used to fund pension obligations for 2004. Required employer contributions are equal to 100% of the dollar amount billed to each employer and must be extracted from the employer’s records. The City’s contributions to OPERS to fund pensions for the years ended December 31, 2004, 2003, and 2002 were $7,916,399, $7,201,948, and $8,056,838, respectively; 100% has been contributed for 2004, 2003, and 2002.
B. Ohio Police and Fire Pension Fund
Full-time uniformed employees of the City participate in the Ohio Police and Fire Pension Fund (OP&F), a cost-sharing multiple employer defined benefit pension plan. The OP&F provides retirement and disability benefits, annual cost-of-living adjustments, and death benefits to plan members and beneficiaries. Benefit provisions are established by Ohio State Legislature and are codified in Chapter 742 of the Ohio Revised Code. The OP&F issues a publicly available financial report that includes financial statements and required supplementary information for the plan. That report may be obtained by writing to OP&F, 140 East Town Street, Columbus, Ohio 43215-5164.
Plan members are required to contribute 10.0% of their annual covered salary, while the City is required to contribute 19.50% and 24.0% for police officers and firefighters, respectively. The City’s contributions to OP&F for the years ended December 31, 2004, 2003, and 2002 were $8,864,735, $6,729,504, and $7,155,301, respectively; 78.09% has been contributed for 2004 and 100% for the years 2003 and 2002. $1,942,509, representing the unpaid contributions for 2004, is recorded as a liability within the respective funds.

CITY OF DAYTON, OHIO
NOTES TO THE BASIC FINANCIAL STATEMENTS FOR THE YEAR ENDED DECEMBER 31, 2004
96
NOTE 19 - POSTRETIREMENT BENEFIT PLANS A. Ohio Public Employees Retirement System
OPERS provides postretirement health care coverage to age and service retirants with 10 or more years of qualifying Ohio service credit. Health care coverage for disability recipients and primary survivor recipients is available. The health care coverage provided by the retirement system is considered an Other Postemployment Benefit (OPEB) as described in GASB Statement No. 12, “Disclosure of Information on Postemployment Benefits other than Pension Benefits by State and Local Government Employers”. A portion of each employer's contribution to OPERS is set aside for the funding of postretirement health care. The Ohio Revised Code provides statutory authority for employer contributions. The OPERS law enforcement program is separated into two divisions, law enforcement and public safety, with separate employee contribution rates and benefits. The 2004 employer contribution rate for local government employers was 13.55% of covered payroll and 4.00% was the portion that was used to fund health care. For both the public safety and law enforcement divisions the 2003 employer rate was 16.70% of covered payroll and 4.00% was the portion used to fund health care. The Ohio Revised Code provides the statutory authority requiring public employers to fund postretirement health care through their contributions to OPERS. The City’s contribution actually made to fund postemployment benefits was $3,315,769. OPEB are financed through employer contributions and investment earnings thereon. The contributions allocated to retiree health care, along with investment income on allocated assets and periodic adjustments in health care provisions are expected to be sufficient to sustain the program indefinitely. OPEB’s are advance funded on an actuarially determined basis.
As of December 31, 2003 (the latest information available), the actuarial value of the Retirement System’s net assets available for future OPEB payments were $10.5 billion. The actuarially accrued liability and the unfunded actuarial accrued liability, based on the actuarial cost method used, were $26.9 billion and $16.4 billion, respectively, at December 31, 2003 (the latest information available). The number of benefit recipients eligible for OPEB at December 31, 2003 (the latest information available) was 369,885.
In December 2001, the Board adopted the Health Care “Choices” Plan. The Choices Plan will be offered to all persons newly hired in an OPERS covered position after January 1, 2003, with no prior service credit accumulated toward health care coverage. Choices will incorporate a cafeteria approach, offering a broader range of health care options. The Plan uses a graded scale from ten to thirty years to calculate a monthly health care benefit. This is in contrast to the ten-year “cliff” eligibility standard for the present Plan. The benefit recipient will be free to select the option that best meets their needs. Recipients will fund health care costs in excess of their monthly health care benefit. The Plan will also offer a spending account feature, enabling the benefit recipient to apply their allowance toward specific medical expenses, much like a Medical Spending Account. On September 9, 2004 the OPERS Retirement Board adopted a Health Care Preservation Plan (HCPP) with an effective date of January 1, 2007. The HCPP restructures OPERS’ health care coverage to improve the financial solvency of the fund in response to skyrocketing health care costs.

CITY OF DAYTON, OHIO
NOTES TO THE BASIC FINANCIAL STATEMENTS FOR THE YEAR ENDED DECEMBER 31, 2004
97
NOTE 19 - POSTRETIREMENT BENEFIT PLANS - (Continued) Under the HCPP, retirees eligible for health care coverage will receive a graded monthly allocation based on their years of service at retirement. The Plan incorporates a cafeteria approach, offering a broad range of health care options that allow benefit recipients to use their monthly allocation to purchase health care coverage customized to meet their individual needs. If the monthly allocation exceeds the cost of the options selected, the excess is deposited into a Retiree Medical Account that can be used to fund future health care expenses.
B. Ohio Police and Fire Pension Fund
The OP&F provides postretirement health care coverage to any person who receives or is eligible to receive a monthly benefit check or is a spouse or eligible dependent child of such person. An eligible dependent child is any child under the age of 18 whether or not the child is attending school or under the age of 22 if attending school full-time or on a 2/3 basis. The health care coverage provided by the retirement system is considered an Other Postemployment Benefit (OPEB) as described in GASB Statement No. 12, “Disclosure of Information on Postemployment Benefits Other than Pension Benefits by State and Local Government Employers”. The Ohio Revised Code provides that health care cost paid from the funds of the OP&F shall be included in the employer’s contribution rate. The total police officer employer contribution rate is 19.5% of covered payroll and the total firefighter’s employer contribution rate is 24.0% of covered payroll. The Ohio Revised Code provides the authority allowing OP&F’s Board of Trustees to provide health care coverage to all eligible individuals. Health care funding and accounting is on a pay-as-you-go basis. A percentage of covered payroll, as defined by the Board, is used to pay retiree health care expenses. The Board defined allocation was 7.75% of covered payroll in 2003 and 2004. In addition, since July 1, 1992, most retirees have been required to contribute a portion of the cost of their health care coverage through a deduction from their monthly benefit payment.
The number of participants eligible to receive health care benefits as of December 31, 2003 (the latest information available), is 13,662 for police officers and 10,474 for firefighters. The amount of employer contributions used to pay postemployment benefits for police officers and firefighters were $2,847,296 and $2,168,982, respectively. OP&F’s total health care expense for the year ending December 31, 2003 (the latest information available), was $150.853 million, which was net of member contributions of $17.207 million.
NOTE 20 - BUDGETARY BASIS OF ACCOUNTING
While the City is reporting financial position, results of operations and changes in fund balance on the basis of generally accepted accounting principles (GAAP), the budgetary basis as provided by law is based upon accounting for certain transactions on a modified accrual basis with exceptions. The Statement of Revenues, Expenditures and Changes in Fund Balances - Budget and Actual (Non-GAAP Budgetary Basis) presented for the general fund is presented on the budgetary basis to provide a meaningful comparison of actual results with the budget. The adjustments necessary to convert the results of operations for the year ended December 31, 2004, on the GAAP basis to the budget basis are as follows:

CITY OF DAYTON, OHIO
NOTES TO THE BASIC FINANCIAL STATEMENTS FOR THE YEAR ENDED DECEMBER 31, 2004
98
NOTE 20 - BUDGETARY BASIS OF ACCOUNTING - (Continued)
Net Change in Fund Balance
General
Budget basis (231,176)$
Net adjustment for revenues (3,539,346)
Net adjustment for expenditures 603,571
Net adjustment for other sources/uses (124,223)
GAAP basis (3,291,174)$
NOTE 21 - CONDUIT DEBT OBLIGATIONS
The City has the following conduit debt obligations at December 31, 2004:
Original Amount Issue Amount Outstanding
Emery Revenue Refunding - 1998 46,000,000$ 46,000,000$ Emery Revenue Refunding - 1996 17,000,000 17,000,000 Emery Revenue Refunding - 1996 13,000,000 13,000,000 Emery Revenue Refunding - 1996 16,000,000 16,000,000 Emery Revenue Refunding - 1996 16,000,000 16,000,000 Ohio Special Facilities Revenue - 1999 7,015,000 6,515,000 Economic Development Revenue Bond - 2002 1,000,000 1,000,000
These bonds do not constitute a general obligation, debt or bonded indebtedness of the City. Neither is the
full faith and credit or taxing power of the City pledged to make repayment, and therefore they have been excluded entirely from the City's debt presentation. There has not been and is not any condition of default under the bond or the related financing documents.
NOTE 22 - DISCRETELY PRESENTED COMPONENT UNIT
A. Basis of Accounting
CityWide prepares its financial statements in accordance with Governmental Accounting Standards Board (GASB) Statement Number 29, “The Use of Not-for-Profit Accounting and Financial Accounting Principles by Governmental Entities”. CityWide elected to use the not-for-profit model, which includes the accounting and financial reporting principles contained in Statement of Position 78-10 as modified by all applicable Financial Accounting Standards Board pronouncements issued through November 30, 1989, and as modified by all GASB pronouncements issued after GASB Statement Number 1, “Authoritative Status of NCGA Pronouncements and AICPA Industry Audit Guide”.

CITY OF DAYTON, OHIO
NOTES TO THE BASIC FINANCIAL STATEMENTS FOR THE YEAR ENDED DECEMBER 31, 2004
99
NOTE 22 - DISCRETELY PRESENTED COMPONENT UNIT - (Continued)
B. Deposits and Investments
The following information classifies deposits and investments by categories of risk as defined in GASB Statement 3, “Deposits with Financial Institutions, Investments and Reverse Repurchase Agreements”.
Deposits:
The carrying amount of CityWide Development Corporation deposits was $2,773,154 and the related bank balance was $1,846,362. Of the bank balance $894,132 was covered by federal depository insurance, and $952,230 was uncollateralized and uninsured.
Investments:
Category 1 includes investments that are insured or registered or for which the securities are held by the City or its agent in the City's name. Category 2 includes uninsured and unregistered investments for which the securities are held by the counterparty's trust department or agent in the City's name. Category 3 includes uninsured and unregistered investments for which the securities are held by the counterparty, or by its trust department or agent but not in the City's name. Mutual funds and money markets are unclassified since they are not evidenced by securities that exist in physical or book entry form. The following is a schedule of CityWide's investments according to GASB 3 Categorization:
Category 1 Fair Value
Money markets -$ 304,620$ Commercial paper 1,020,822 1,020,822
Total Investments 1,020,822$ 1,325,442$ A reconciliation to the Statement of Net Assets follows:
Cash and equivalents 1,280,164$ Investments 1,020,822 Restricted cash 1,782,626
Total per statement of net assets 4,083,612$
Deposits 2,773,154 Investments 1,310,458
Total per GASB Statement No. 3 4,083,612$

CITY OF DAYTON, OHIO
NOTES TO THE BASIC FINANCIAL STATEMENTS FOR THE YEAR ENDED DECEMBER 31, 2004
100
NOTE 22 - DISCRETELY PRESENTED COMPONENT UNIT - (Continued)
C. Notes Payable Advance from Primary Government
Notes payable/advance from primary government at December 31, 2004, consisted of the following:
Note Payable to Amount
Noninterest-bearing Note for Landing Project City of Dayton 5,433,600$ Noninterest-bearing Note for Wellfield Project City of Dayton 2,801,457 Note for Renovation of Western Manor City of Dayton and the Dayton 86,700
Montgomery County Housing Authority
Note for redevelopment of Hawthorn School Building City of Dayton 704,116 Note for Webster Street Project City of Dayton 200,000 Note for renovation of Ice Avenue Units City of Dayton 100,000 Note for renovation of 119 North Main Street City of Dayton 136,250 Note for development of West 3rd Street City of Dayton 4,425,000 Other advance R&R TAC Building City of Dayton 1,000,000
Total advance from primary government 14,887,123
Note for redevelopment of Hawthorne School Building Development Corporation, Inc. McPherson Town Neighborhood 250,000 Note for Housing Loans Third-Party Insurance Company 526,410 Other Notes Payable Not disclosed 207,217
Total Notes Payable 983,627
Total Advance from primary government/notes payable 15,870,750$ The amounts payable to the City are shown on the Statement of Net Assets as "Advance from Primary Government".
D. Bonds Payable
In fiscal year 2003, CityWide issued $13,600,000 in Floating Rate Option notes. The proceeds of these bonds were used for the redevelopment of the Reynolds and Reynolds Technical Assistance Center. During 2003, the City also issued $1,000,000 in Economic Development Revenue bonds with an interest rate of 5 percent. During 1996, CityWide issued $2,560,000 County of Montgomery Ohio, Adjustable Rate Industrial Development Revenue Bonds, Series 1996. Also during 1996, CityWide issued $2,420,000 in Montgomery County Series, 1996A Industrial Development Revenue Bonds. The Series 1996A Indenture refunded a Trust Indenture dated as of December 1, 1988. Proceeds of the bonds were used to construct a building and an addition to an existing building to be rented to Advanced Assembly Automation, Inc.

CITY OF DAYTON, OHIO
NOTES TO THE BASIC FINANCIAL STATEMENTS FOR THE YEAR ENDED DECEMBER 31, 2004
101
NOTE 22 - DISCRETELY PRESENTED COMPONENT UNIT - (Continued)
Principal maturities due under these agreements are as follows:
Year EndingDecember 31 Amount
2005 630,000$ 2006 685,000 2007 763,183 2008 851,367 2009 896,367
Thereafter 13,834,083
Total 17,660,000$
E. Loans Payable
CityWide has a real estate loan with a financial institution, with stated interest of 8.75% and an effective rate of approximately 3% less through Montgomery County linked program. This agreement contains a subjective acceleration clause. The loan is collateralized by property and income from property. The balance of the loan at December 31, 2004 is $270,886. CityWide has a real estate loan with an individual with stated interest of 11.445% payable in monthly installments of $8,107. This loan is collateralized by property and matures on September 1, 2006. The balance of the loan at December 31, 2004 is $850,000. During 2004, CityWide borrowed $1,243,599 for a real estate loan with a financial institution. This loan has a variable interest rate equal to the prime rate and matures on May 1, 2006. This loan is collateralized by property. The debt service requirements to maturity are as follows:
Year EndingDecember 31 Amount
2005 144,214$ 2006 1,996,544 2007 25,783 2008 27,373 2009 29,061
Thereafter 141,510
Total 2,364,485$

CITY OF DAYTON, OHIO
NOTES TO THE BASIC FINANCIAL STATEMENTS FOR THE YEAR ENDED DECEMBER 31, 2004
102
NOTE 23 - CONTINGENCIES
A. Litigation
The City is party to legal proceedings. The City is of the opinion that ultimate disposition of claims will not have a material effect, if any, on the financial condition of the City.
B. Grants
For the period January 1, 2004, to December 31, 2004, the City received federal and state grants for specific purposes that are subject to review and audit by grantor agencies or their designee. Such audits could lead to a request for reimbursement to the grantor agency for expenditures disallowed under the terms of the grant. Based on prior experience, the City believes such disallowance, if any, would be immaterial.

COMBINING STATEMENTSAND INDIVIDUAL FUND SCHEDULES
103

THIS PAGE IS INTENTIONALLY LEFT BLANK
104

COMBINING STATEMENTS - NONMAJOR GOVERNMENTAL FUNDS
CITY OF DAYTON, OHIO
Law EnforcementTo account for the fines generated from the prosecution of those in possession of contraband and the proceeds gained fromthe sale of confiscated contraband. This money may be spent for any law enforcement activity.
To account for monies for all street and road repairs and general upkeep to ensure safe, smooth transportation for all users ofDayton roadways. Funds are provided by shared tax revenues and registration fees from the State of Ohio and MontgomeryCounty, respectively.
Street
The special revenue funds are used to account for the proceeds of specific revenue sources (other than major capitalprojects) that are legally restricted to expenditures for specific purposes. The following are the nonmajor special revenuefunds which the City of Dayton operates:
Nonmajor Special Revenue Funds
HUD Programs
Highway MaintenanceTo account for lighting the freeways through Dayton. Funds are provided by shared tax revenues and registration fees fromthe State of Ohio and Montgomery County, respectively.
Emergency Shelter Grant Program (EMRG) was established in 1987 to provide for the creation and operations ofemergency shelters for the homeless.
HOME Program was established in 1990 to expand the supply of decent and affordable housing for low incomefamilies.
Urban Development Action Grants (UDAG) are granted on a project basis. The City has used these funds forprojects such as the renovation of the Arcade and The Landing rental housing downtown.
The Community Development Block Grant Program (CDBG) was established in 1974 to assist in thedevelopment of viable urban communities, to conserve and renew older urban areas, to improve the livingenvironment of low and moderate income families, and to develop opportunities for economic growth.
To account for miscellaneous grant projects. These projects include food service for children at child care and recreationcenters, additional police patrol in high density traffic areas, juvenile court mediation services, and drug rehabilitationprograms. Funding sources include the United States Departments of Justice, Housing and Urban Development,Agriculture, Education, Interior and Transportation and the Ohio Departments of Education, Development, Highway Safety,and Natural Resources.
To account for various program funds administered by the Department of Housing and Urban Development. Such moniesare appropriated on a project level with specific identification of each project being budgeted. Budget basis financialstatements for these funds are not, therefore, presented in this report because such statements would not be meaningful. Thefirst three programs listed below are entitlement grants. Funds are granted annually using a statutory formula.
Miscellaneous Grants
105

The City reports only one permanent fund to account for the above activity. No combining schedules are required.
To account for grant revenues received from the County and used to develop and promote economic development.
Nonmajor Special Revenue Funds (Continued)
Economic Development/Government Equity Improvement
Capital projects funds are used to account for the financial resources to be used for the acquisition or construction of majorcapital facilities, other than those financed by the proprietary or nonexpendable trust funds. The following is a descriptionof all the City's nonmajor capital projects funds:
To account for probation fees and municipal court fees that are used for victim witness assistance and operation of theprobation department, also to account for monies restricted by City Ordinance to finance various special projects undertakenby the City.
Dayton Sister CitiesTo account for financial activity of the City of Dayton's blended component unit.
Other Special Revenue
Nonmajor Permanent Fund
Permanent funds are used to account for resources that are legally restricted to the extent that earnings, and not principal,may be used for purposes that support City programs. Included in the permanent fund is the Schantz Waldruhe Park Trustwhich accounts for interest earned on Dayton Power & Light stock that is used for the improvement, care and maintenanceof Waldruhe Park and the Forrest B. Lucas Foundation which accounts for interest earned on a contribution made by ForrestB. Lucas that is to be used for fire department training purposes.
CITY OF DAYTON, OHIO
The above capital projects funds appropriate monies on a project level with specific identification of each project beingbudgeted. Budget basis financial statements for these funds are not, therefore, presented in this report because suchstatements would not be meaningful.
Issue IITo account for Issue II funds received from the State of Ohio for each project awarded through this program and localmatching funds.
Nonmajor Capital Projects Funds
COMBINING STATEMENTS - NONMAJOR GOVERNMENTAL FUNDS
106

Variance withFinal Budget
Positive Original Final Actual (Negative)
Revenues:Municipal Income Taxes . . . . . . . . . . . . . . . 108,211,000$ 109,481,600$ 108,794,693$ (686,907)$ Property and Other Local Taxes . . . . . . . . . . . . 10,873,700 10,762,200 10,905,262 143,062 State Shared Taxes . . . . . . . . . . . . . . . . . . 15,344,900 17,483,100 17,558,581 75,481 Charges for Services . . . . . . . . . . . . . . . . . 17,849,200 18,510,200 18,987,857 477,657 Licenses and Permits. . . . . . . . . . . . . . . . . 1,589,100 2,000,100 1,750,643 (249,457) Fines and Forfeitures. . . . . . . . . . . . . . . . . 1,615,000 1,617,400 1,558,903 (58,497) Special Assessments . . . . . . . . . . . . . . . . . - 319,800 339,720 19,920 Investment Income . . . . . . . . . . . . . . . . . 3,728,300 4,160,600 3,663,909 (496,691) Other . . . . . . . . . . . . . . . . . . . . . . . . 2,443,000 2,684,200 2,511,271 (172,929)
Total Revenues. . . . . . . . . . . . . . . . . . . 161,654,200 167,019,200 166,070,839 (948,361)
Expenditures:General Operating:
Clerk of Commission . . . . . . . . . . . . . . . . . 1,081,200 1,034,200 929,143 105,057 Civil Service Board . . . . . . . . . . . . . . . . . . 1,108,700 1,018,700 889,574 129,126 Human Relations Council . . . . . . . . . . . . . . . 867,800 867,800 795,042 72,758 City Manager's Office . . . . . . . . . . . . . . . . . 831,800 905,300 829,035 76,265 Deparment of Public Affairs. . . . . . . . . . . . . . 732,900 782,400 698,079 84,321 Cable TV Operations . . . . . . . . . . . . . . . . . 369,900 386,900 377,884 9,016 Department of Planning & Community Development. . 2,389,200 2,305,500 2,249,555 55,945 Department of Building Services . . . . . . . . . . . 2,261,500 2,154,200 2,132,731 21,469 Clerk of Courts . . . . . . . . . . . . . . . . . . . . 3,192,400 3,251,400 3,225,825 25,575 Municipal Court. . . . . . . . . . . . . . . . . . . . 3,750,000 3,453,900 3,436,698 17,202 Office of Economic Development. . . . . . . . . . . 678,400 659,200 628,741 30,459 Department of Management and Budget . . . . . . . 935,600 875,600 793,013 82,587 Department of Water . . . . . . . . . . . . . . . . . 73,300 75,300 73,345 1,955 Department of Law . . . . . . . . . . . . . . . . . . 1,757,600 1,976,400 1,887,980 88,420 Department of Finance . . . . . . . . . . . . . . . . 3,734,300 3,556,400 3,390,307 166,093 Department of Human Resources . . . . . . . . . . . 1,074,400 1,077,800 1,024,841 52,959 Department of Information and Technology Services 7,693,100 7,824,200 7,546,097 278,103 Department of Police. . . . . . . . . . . . . . . . . 47,727,200 48,411,600 47,760,112 651,488 Department of Fire . . . . . . . . . . . . . . . . . . 35,744,300 35,384,100 34,979,437 404,663 Department of Public Works . . . . . . . . . . . . . 26,915,800 27,086,900 26,422,270 664,630 Department of Parks, Recreation and Culture. . . . . 5,664,600 6,019,500 5,788,050 231,450 Non-Deparmental . . . . . . . . . . . . . . . . . . 2,593,500 1,156,000 402,958 753,042 Convention Center Operating . . . . . . . . . . . . 3,694,200 3,604,200 3,524,806 79,394 Special Assessments . . . . . . . . . . . . . . . . . 330,000 319,800 301,528 18,272 Special Projects . . . . . . . . . . . . . . . . . . . 2,500,000 3,100,000 989,661 2,110,339 Total Expenditures. . . . . . . . . . . . . . . . . . 157,701,700 157,287,300 151,076,712 6,210,588
Excess (deficiency) of revenues over (under) expenditures. . . . . . . . . . . . . . . 3,952,500 9,731,900 14,994,127 5,262,227 Other financing sources (uses):
Transfers in . . . . . . . . . . . . . . . . 677,700 124,224 124,224 - Transfers out . . . . . . . . . . . . . . . (10,683,400) (19,626,700) (15,349,527) 4,277,173
Total other financing sources (uses) . . . . . . . (10,005,700) (19,502,476) (15,225,303) 4,277,173
Excess (deficiency) of revenues and other financing sources over (under) expenditures and other financing uses. . . . . . . . . . . . . . . . . . . . . (6,053,200) (9,770,576) (231,176) 9,539,400
Fund balance at beginning of year (restated). . . . 18,420,816 18,420,816 18,420,816 - Prior year encumbrances appropriated. . . . . . . 4,603,923 4,603,923 4,603,923 -
Fund balance at end of year. . . . . . . . . . . . . $ 16,971,539 $ 13,254,163 $ 22,793,563 $ 9,539,400
CITY OF DAYTON, OHIO
SCHEDULE OF REVENUES, EXPENDITURES, AND CHANGES INFUND BALANCE - BUDGET AND ACTUAL (NON-GAAP BUDGETARY BASIS)
GENERAL FUNDFOR THE YEAR ENDED DECEMBER 31, 2004
Budgeted Amounts
107

Nonmajor Nonmajor Nonmajor Total Nonmajor
Special Revenue Capital Projects Permanent GovernmentalFunds Funds Fund Funds
Assets: Equity in pooled cash and cash equivalents. . . . . . . . . . 11,825,500$ 753,487$ 70,921$ 12,649,908$ Cash and cash equivalents in segregated accounts . . . . . . 26,046 - - 26,046 Investments . . . . . . . . . . . . . . . . . . . . . . . . . . - - 84,746 84,746 Receivables (net of allowances of uncollectibles): Property and other local taxes . . . . . . . . . . . . . . . . 715,975 - - 715,975 Accounts. . . . . . . . . . . . . . . . . . . . . . . . . . . . 155,117 40,000 - 195,117 Special assessments . . . . . . . . . . . . . . . . . . . . . 311,988 - - 311,988 Accrued interest . . . . . . . . . . . . . . . . . . . . . . . 9,316 - - 9,316 Due from other governments . . . . . . . . . . . . . . . . . 4,740,246 513,500 - 5,253,746 Prepayments . . . . . . . . . . . . . . . . . . . . . . . . . 963 - - 963 Advances to component unit . . . . . . . . . . . . . . . . . 5,453,956 - - 5,453,956
Total assets . . . . . . . . . . . . . . . . . . . . . . . . . . 23,239,107$ 1,306,987$ 155,667$ 24,701,761$
Liabilities: Accounts payable . . . . . . . . . . . . . . . . . . . . . . 1,069,511$ 4,480$ -$ 1,073,991$ Contracts payable . . . . . . . . . . . . . . . . . . . . . . 698,598 250,356 - 948,954 Accrued wages and benefits . . . . . . . . . . . . . . . . . 458,476 - - 458,476 Retainage payable . . . . . . . . . . . . . . . . . . . . . . 35,564 1,678 - 37,242 Due to other funds. . . . . . . . . . . . . . . . . . . . . . 130,187 - - 130,187 Due to other governments . . . . . . . . . . . . . . . . . . 21,130 - - 21,130 Interfund payable . . . . . . . . . . . . . . . . . . . . . . 1,183,320 - - 1,183,320 Deferred revenue . . . . . . . . . . . . . . . . . . . . . . 2,541,746 - - 2,541,746
Total liabilities . . . . . . . . . . . . . . . . . . . . . . . . 6,138,532 256,514 - 6,395,046
Fund Balances: Reserved for encumbrances. . . . . . . . . . . . . . . . . 6,843,128 310,942 - 7,154,070 Reserved for prepayments . . . . . . . . . . . . . . . . . 963 - - 963 Reserved for advances to component unit. . . . . . . . . . 5,453,956 - - 5,453,956 Reserved for contributions to permanent fund . . . . . . . - - 102,228 102,228 Unreserved, designated, reported in:
Special revenue funds. . . . . . . . . . . . . . . . . . 400,000 - - 400,000 Undesignated, reported in: Special revenue funds . . . . . . . . . . . . . . . . . 4,402,528 - - 4,402,528 Permanent funds . . . . . . . . . . . . . . . . . . . - - 53,439 53,439 Capital projects funds . . . . . . . . . . . . . . . . . - 739,531 - 739,531
Total fund balances . . . . . . . . . . . . . . . . . . . . . 17,100,575 1,050,473 155,667 18,306,715
Total liabilities and fund balances . . . . . . . . . . . . . . 23,239,107$ 1,306,987$ 155,667$ 24,701,761$
CITY OF DAYTON, OHIO
COMBINING BALANCE SHEETNONMAJOR GOVERNMENTAL FUNDS
DECEMBER 31, 2004
108

Nonmajor Nonmajor Nonmajor Total Nonmajor
Special Revenue Capital Projects Permanent GovernmentalFunds Funds Fund Funds
Revenues:Property and other local taxes . . . . . . . . . 609,449$ -$ -$ 609,449$ State shared taxes. . . . . . . . . . . . . . . . 4,978,757 - - 4,978,757 Charges for services . . . . . . . . . . . . . . 1,591,590 90,000 - 1,681,590 Fines and forfeitures . . . . . . . . . . . . . . 297,616 - - 297,616 Intergovernmental . . . . . . . . . . . . . . . 13,558,529 1,112,490 - 14,671,019 Special assessments . . . . . . . . . . . . . . 64,669 - - 64,669 Investment income . . . . . . . . . . . . . . . 2,222 - - 2,222 Increase in FMV of investments . . . . . . . . - - 14,276 14,276 Other . . . . . . . . . . . . . . . . . . . . . . 2,177,236 31,325 2,358 2,210,919
Total revenues . . . . . . . . . . . . . 23,280,068 1,233,815 16,634 24,530,517
Expenditures: Current:
Downtown. . . . . . . . . . . . . . . . . . . 825 - - 825 Youth, education and human services. . . . . 2,022,349 - - 2,022,349 Community development and neighborhoods. 9,063,068 - - 9,063,068 Economic development . . . . . . . . . . . . 3,670,740 - - 3,670,740 Leadership and quality of life . . . . . . . . . 13,119,000 - - 13,119,000 Corporate responsibility. . . . . . . . . . . . 580,713 - - 580,713 Public safety and justice. . . . . . . . . . . . 2,548,275 - - 2,548,275
Other. . . . . . . . . . . . . . . . . . . . . . . 16,766 - - 16,766 Capital outlay . . . . . . . . . . . . . . . . . . 4,689,700 1,601,409 - 6,291,109 Debt service:
Principal retirement . . . . . . . . . . . . . . 1,002,000 - - 1,002,000 Interest and fiscal charges. . . . . . . . . . . - 27,929 - 27,929
Total expenditures. . . . . . . . . . . . . . . 36,713,436 1,629,338 - 38,342,774
Excess (deficiency) of revenues over (under) expenditures. . . . . . . . . (13,433,368) (395,523) 16,634 (13,812,257)
Other financing sources:Sale of capital assets. . . . . . . . . . . . . . 541,052 - - 541,052 Capital lease transactions. . . . . . . . . . . 4,500,000 - - 4,500,000 Transfers in . . . . . . . . . . . . . . . . . . 8,675,026 - - 8,675,026
Total other financing sources. . . . . . . . . . . 13,716,078 - - 13,716,078
Net change in fund balances . . . . . . . . . . 282,710 (395,523) 16,634 (96,179)
Fund balances at beginning of year (restated). 16,817,865 1,445,996 139,033 18,402,894
Fund balances at end of year. . . . . . . . . . 17,100,575$ 1,050,473$ 155,667$ 18,306,715$
CITY OF DAYTON, OHIO
COMBINING STATEMENT OF REVENUES, EXPENDITURES AND CHANGES IN FUND BALANCESNONMAJOR GOVERNMENTAL FUNDS
FOR THE YEAR ENDED DECEMBER 31, 2004
109

Highway HUD
Street Maintenance Programs
Assets: Equity in pooled cash and cash equivalents. . . . . . 1,934,022$ 349,574$ -$ Cash and cash equivalents in segregated accounts . . - - - Receivables (net of allowances of uncollectibles): Property and other local taxes . . . . . . . . . . . . 715,975 - - Accounts. . . . . . . . . . . . . . . . . . . . . . . 90,933 - - Special assessments, net. . . . . . . . . . . . . . . - - 311,988 Accrued interest . . . . . . . . . . . . . . . . . . . - - - Due from other governments . . . . . . . . . . . . . 2,172,859 173,391 828,765 Prepayments. . . . . . . . . . . . . . . . . . . . . . - - - Advances to component unit . . . . . . . . . . . . . - - 5,453,956
Total assets. . . . . . . . . . . . . . . . . . . . . . . 4,913,789$ 522,965$ 6,594,709$
Liabilities: Accounts payable. . . . . . . . . . . . . . . . . . . 395,883$ -$ 89,971$ Contracts payable. . . . . . . . . . . . . . . . . . . - - 188,633 Accrued wages and benefits . . . . . . . . . . . . . 256,727 - 182,961 Retainage payable . . . . . . . . . . . . . . . . . . - - - Due to other funds . . . . . . . . . . . . . . . . . . 121,107 - 3,816 Due to other governments . . . . . . . . . . . . . . - - - Interfund loan payable . . . . . . . . . . . . . . . . - - 1,183,320 Deferred revenue. . . . . . . . . . . . . . . . . . . 2,110,749 110,303 311,988
Total liabilities. . . . . . . . . . . . . . . . . . . . . 2,884,466 110,303 1,960,689
Fund Balances: Reserved for encumbrances . . . . . . . . . . . . 299,890 - 5,212,218 Reserved for prepayments . . . . . . . . . . . . . - - - Reserved for advances to component unit . . . . . - - 5,453,956 Unreserved:
Designated . . . . . . . . . . . . . . . . . . . 400,000 - - Undesignated (deficit) . . . . . . . . . . . . . 1,329,433 412,662 (6,032,154)
Total fund balances . . . . . . . . . . . . . . . . . . 2,029,323 412,662 4,634,020
Total liabilities and fund balances. . . . . . . . . . . 4,913,789$ 522,965$ 6,594,709$
DECEMBER 31, 2004
CITY OF DAYTON, OHIO
COMBINING BALANCE SHEETNONMAJOR SPECIAL REVENUE FUNDS
110

Law Miscellaneous Other Special Dayton SisterEnforcement Grants Revenue Cities Total
1,499,205$ 180,219$ 7,862,480$ -$ 11,825,500$ - - - 26,046 26,046
- - - - 715,975 - - 64,184 - 155,117 - - - - 311,988
9,316 - - - 9,316 39,504 1,525,727 - - 4,740,246
- - 963 - 963 - - - - 5,453,956
1,548,025$ 1,705,946$ 7,927,627$ 26,046$ 23,239,107$
88,849$ 432,030$ 62,778$ -$ 1,069,511$ 14,861 422,307 72,797 - 698,598 2,282 15,149 1,357 - 458,476
- 35,564 - - 35,564 5,150 114 - - 130,187
- - 21,130 - 21,130 - - - - 1,183,320
8,706 - - - 2,541,746
119,848 905,164 158,062 - 6,138,532
192,842 735,564 402,614 - 6,843,128 - - 963 - 963 - - - - 5,453,956
- - - - 400,000 1,235,335 65,218 7,365,988 26,046 4,402,528
1,428,177 800,782 7,769,565 26,046 17,100,575
1,548,025$ 1,705,946$ 7,927,627$ 26,046$ 23,239,107$
111

Highway HUD
Street Maintenance ProgramsRevenues:
Property and other local taxes . . . . . . . . . 609,449$ -$ -$ State shared taxes. . . . . . . . . . . . . . . . 4,605,414 373,343 - Charges for services . . . . . . . . . . . . . . 415,962 - - Fines and forfeitures . . . . . . . . . . . . . . - - - Intergovernmental . . . . . . . . . . . . . . . 68,032 - 10,766,135 Special assessments . . . . . . . . . . . . . . - - 64,669 Investment income . . . . . . . . . . . . . . . - - - Other . . . . . . . . . . . . . . . . . . . . . . 129,875 - 326,770
Total revenues . . . . . . . . . . . . . . . . . . 5,828,732 373,343 11,157,574
Expenditures:Current: Downtown. . . . . . . . . . . . . . . . . . . - - 825 Youth, education and human services. . . . . - - 2,022,349 Community development and neighborhoods. 150 - 7,834,126 Economic development . . . . . . . . . . . . - - 985,116 Leadership and quality of life . . . . . . . . . 9,637,318 366,667 1,367,960 Corporate responsibility. . . . . . . . . . . . - - 163,500 Public safety and justice. . . . . . . . . . . . - - - Other. . . . . . . . . . . . . . . . . . . . . . 16,766 - - Capital outlay. . . . . . . . . . . . . . . . . . 189,700 - - Debt service:
Principal retirement . . . . . . . . . . . . . - - -
Total expenditures . . . . . . . . . . . . . . . . 9,843,934 366,667 12,373,876
Excess (deficiency) of revenues over (under) expenditures. . . . . . . . . (4,015,202) 6,676 (1,216,302)
Other financing sources (uses):
Sale of capital assets. . . . . . . . . . . . . - - - Capital lease transactions. . . . . . . . . . . - - - Transfers in . . . . . . . . . . . . . . . . . . 4,400,000 - 568,796
Total other financing sources (uses) . . . . . . . 4,400,000 - 568,796
Net change in fund balances. . . . . . . . . . . 384,798 6,676 (647,506)
Fund balances at beginning of year (restated). 1,644,525 405,986 5,281,526
Fund balances at end of year. . . . . . . . . . 2,029,323$ 412,662$ 4,634,020$
CITY OF DAYTON, OHIO
COMBINING STATEMENT OF REVENUES, EXPENDITURES AND CHANGES IN FUND BALANCESNONMAJOR SPECIAL REVENUE FUNDS
FOR THE YEAR ENDED DECEMBER 31, 2004
112

Law Miscellaneous Other Special Dayton Sister Enforcement Grants Revenue City Total
-$ -$ -$ -$ 609,449$ - - - - 4,978,757
7,252 720,697 447,679 - 1,591,590 297,616 - - - 297,616 216,416 2,507,946 - - 13,558,529
- - - - 64,669 - - 2,165 57 2,222
6,929 1,070,107 641,575 1,980 2,177,236
528,213 4,298,750 1,091,419 2,037 23,280,068
- - - - 825 - - - - 2,022,349 - 1,184,857 43,935 - 9,063,068 - 405,607 2,262,035 17,982 3,670,740
2,139 1,499,325 245,591 - 13,119,000 - 128,655 288,558 - 580,713
846,737 1,680,892 20,646 - 2,548,275 - - - - 16,766 - - 4,500,000 - 4,689,700
- - 1,002,000 - 1,002,000
848,876 4,899,336 8,362,765 17,982 36,713,436
(320,663) (600,586) (7,271,346) (15,945) (13,433,368)
- - 541,052 - 541,052 - - 4,500,000 - 4,500,000
78,869 71,453 3,555,908 - 8,675,026
78,869 71,453 8,596,960 - 13,716,078
(241,794) (529,133) 1,325,614 (15,945) 282,710
1,669,971 1,329,915 6,443,951 41,991 16,817,865
1,428,177$ 800,782$ 7,769,565$ 26,046$ 17,100,575$
113

Variance withFinal Budget
PositiveOriginal Final Actual (Negative)
Revenues:Property and other local taxes . . . . . . . . . . . 703,655$ 672,548$ 677,481$ 4,933$ State shared taxes . . . . . . . . . . . . . . . . . 4,332,557 4,440,306 4,450,429 10,123 Charges for services . . . . . . . . . . . . . . . . 348,521 315,101 412,499 97,398 Other . . . . . . . . . . . . . . . . . . . . . . . 16,479 14,899 19,503 4,604
Total revenues . . . . . . . . . . . . . . . . . . . 5,401,212 5,442,854 5,559,912 117,058 Expenditures: Department of Public Works . . . . . . . . . . . . 9,187,600 9,704,600 9,570,123 134,477
Total expenditures . . . . . . . . . . . . . . . . . 9,187,600 9,704,600 9,570,123 134,477
Excess (deficiency) of revenues over (under) expenditures . . . . . . . . . . . (3,786,388) (4,261,746) (4,010,211) 251,535
Other financing sources: Transfers in . . . . . . . . . . . . . . . . . . . . . 3,350,000 4,511,684 4,511,684 - Total other financing sources . . . . . . . . . . . 3,350,000 4,511,684 4,511,684 -
Net change in fund balance . . . . . . . . . . . . . (436,388) 249,938 501,473 251,535
Fund balance at beginning of year (restated) . . . . 696,844 696,844 696,844 - Prior year encumbrances appropriated . . . . . . 486,002 486,002 486,002 -
Fund balance at end of year . . . . . . . . . . . . 746,458$ 1,432,784$ 1,684,319$ 251,535$
FOR THE YEAR ENDED DECEMBER 31, 2004
Budgeted Amounts
CITY OF DAYTON, OHIO
SCHEDULE OF REVENUES, EXPENDITURES, AND CHANGES INFUND BALANCE - BUDGET AND ACTUAL (NON-GAAP BUDGETARY BASIS)
STREET FUND
114

Variance withFinal Budget
PositiveOriginal Final Actual (Negative)
Revenues:State shared taxes . . . . . . . . . . . . . . . . . 351,288$ 360,025$ 360,776$ 751$
Total revenues . . . . . . . . . . . . . . . . . . . 351,288 360,025 360,776 751 Expenditures: Department of Public Works . . . . . . . . . . . 400,000 400,000 400,000 -
Total expenditures . . . . . . . . . . . . . . . . . 400,000 400,000 400,000 -
Net change in fund balance . . . . . . . . . . . . . (48,712) (39,975) (39,224) 751
Fund balance at beginning of year (restated) . . . . 355,465 355,465 355,465 -
Fund balance at end of year . . . . . . . . . . . . 306,753$ 315,490$ 316,241$ 751$
FOR THE YEAR ENDED DECEMBER 31, 2004
Budgeted Amounts
CITY OF DAYTON, OHIO
SCHEDULE OF REVENUES, EXPENDITURES, AND CHANGES INFUND BALANCE - BUDGET AND ACTUAL (NON-GAAP BUDGETARY BASIS)
HIGHWAY MAINTENANCE FUND
115

Variance withFinal Budget
PositiveOriginal Final Actual (Negative)
Revenues:Charges for services . . . . . . . . . . . . . . . . 7,263$ 13,514$ 7,252$ (6,262)$ Fines and forfeitures. . . . . . . . . . . . . . . . 298,090 554,625 297,616 (257,009) Intergovernmental . . . . . . . . . . . . . . . . . 192,302 357,796 191,997 (165,799) Investment income . . . . . . . . . . . . . . . . 25,851 48,098 25,810 (22,288) Other . . . . . . . . . . . . . . . . . . . . . . . 11,253 20,937 11,235 (9,702)
Total revenues . . . . . . . . . . . . . . . . . . . 534,759 994,970 533,910 (461,060) Expenditures: Department of Police. . . . . . . . . . . . . . . . 1,920,600 2,212,800 1,122,832 1,089,968
Total expenditures . . . . . . . . . . . . . . . . . 1,920,600 2,212,800 1,122,832 1,089,968
Excess (deficiency) of revenues over (under) expenditures . . . . . . . . . . . (1,385,841) (1,217,830) (588,921) 628,908
Other financing sources: Transfers in . . . . . . . . . . . . . . . . . . . . . 129,440 240,836 129,234 (111,602) Total other financing sources . . . . . . . . . . . 129,440 240,836 129,234 (111,602)
Net change in fund balance . . . . . . . . . . . . . (1,256,401) (976,994) (459,687) 517,306
Fund balance at beginning of year (restated) . . . . 1,343,043 1,343,043 1,343,043 - Prior year encumbrances appropriated . . . . . . 717,416 717,416 717,416 -
Fund balance at end of year . . . . . . . . . . . . 804,058$ 1,083,465$ 1,600,772$ 517,306$
FOR THE YEAR ENDED DECEMBER 31, 2004
Budgeted Amounts
CITY OF DAYTON, OHIO
SCHEDULE OF REVENUES, EXPENDITURES, AND CHANGES INFUND BALANCE - BUDGET AND ACTUAL (NON-GAAP BUDGETARY BASIS)
LAW ENFORCEMENT FUND
116

Variance withFinal Budget
PositiveOriginal Final Actual (Negative)
Revenues:Charges for services . . . . . . . . . . . . . . . . 1,625,879$ 2,397,505$ 720,697$ (1,676,808)$ Intergovernmental . . . . . . . . . . . . . . . . . 3,344,863 4,932,303 1,482,664 (3,449,639) Other . . . . . . . . . . . . . . . . . . . . . . . 1,967,161 2,900,757 871,976 (2,028,781)
Total revenues . . . . . . . . . . . . . . . . . . . 6,937,903 10,230,565 3,075,337 (7,155,228) Expenditures: Other Grants . . . . . . . . . . . . . . . . . . . . 4,820,055 8,019,237 5,549,349 2,469,888
Total expenditures . . . . . . . . . . . . . . . . . 4,820,055 8,019,237 5,549,349 2,469,888
Excess (deficiency) of revenues over (under) expenditures . . . . . . . . . . . 2,117,848 2,211,328 (2,474,012) (4,685,340)
Other financing sources (uses): Transfers in . . . . . . . . . . . . . . . . . . . . . 161,197 237,699 71,453 (166,246) Transfers out . . . . . . . . . . . . . . . . . . . . (60,445) (100,563) (69,590) 30,973 Total other financing sources (uses) . . . . . . . . 100,752 137,136 1,863 (135,273)
Net change in fund balance . . . . . . . . . . . . . 2,218,600 2,348,464 (2,472,149) (4,820,613)
Fund balance at beginning of year (restated) . . . . (960,633) (960,633) (960,633) - Prior year encumbrances appropriated . . . . . . 2,104,055 2,104,055 2,104,055 -
Fund balance at end of year . . . . . . . . . . . . 3,362,022$ 3,491,886$ (1,328,727)$ (4,820,613)$
FOR THE YEAR ENDED DECEMBER 31, 2004
Budgeted Amounts
CITY OF DAYTON, OHIO
SCHEDULE OF REVENUES, EXPENDITURES, AND CHANGES INFUND BALANCE - BUDGET AND ACTUAL (NON-GAAP BUDGETARY BASIS)
MISCELLANEOUS GRANTS FUND
117

Variance withFinal Budget
PositiveOriginal Final Actual (Negative)
Revenues:Charges for services . . . . . . . . . . . . . . . . 206,528$ 442,985$ 442,985$ -$ Licenses and permits. . . . . . . . . . . . . . . . 2,189 4,694 4,694 - Investment income . . . . . . . . . . . . . . . . 1,009 2,165 2,165 - Other . . . . . . . . . . . . . . . . . . . . . . . 645,830 1,385,253 1,385,253 -
Total revenues . . . . . . . . . . . . . . . . . . . 855,556 1,835,097 1,835,097 - Expenditures: Various Departments. . . . . . . . . . . . . . . . 4,067,200 6,172,900 4,186,278 1,986,622
Total expenditures . . . . . . . . . . . . . . . . . 4,067,200 6,172,900 4,186,278 1,986,622
Excess (deficiency) of revenues over (under) expenditures . . . . . . . . . . . (3,211,644) (4,337,803) (2,351,181) 1,986,622
Other financing sources: Transfers in . . . . . . . . . . . . . . . . . . . . . 1,686,444 3,617,286 3,617,286 - Total other financing sources . . . . . . . . . . . 1,686,444 3,617,286 3,617,286 -
Net change in fund balance . . . . . . . . . . . . . (1,525,200) (720,517) 1,266,105 1,986,622
Fund balance at beginning of year (restated) . . . 5,567,881 5,567,881 5,567,881 - Prior year encumbrances appropriated . . . . . . 1,097,823 1,097,823 1,097,823 -
Fund balance at end of year . . . . . . . . . . . . 5,140,504$ 5,945,187$ 7,931,809$ 1,986,622$
CITY OF DAYTON, OHIO
SCHEDULE OF REVENUES, EXPENDITURES, AND CHANGES INFUND BALANCE - BUDGET AND ACTUAL (NON-GAAP BUDGETARY BASIS)
OTHER SPECIAL REVENUE FUNDSFOR THE YEAR ENDED DECEMBER 31, 2004
Budgeted Amounts
118

Variance withFinal Budget
PositiveOriginal Final Actual (Negative)
Revenues:Property and other local taxes . . . . . . . . . . . 9,587,870$ 9,587,382$ 9,587,382$ -$ State shared taxes . . . . . . . . . . . . . . . . . 12,094 12,094 12,094 - Special assessments . . . . . . . . . . . . . . . . 246,541 246,529 246,529 - Other . . . . . . . . . . . . . . . . . . . . . . . 150,008 150,000 150,000 -
Total revenues . . . . . . . . . . . . . . . . . . . 9,996,513 9,996,005 9,996,005 - Expenditures: Department of Finance . . . . . . . . . . . . . . . 20,811,400 21,348,400 21,514,746 (166,346)
Total expenditures . . . . . . . . . . . . . . . . . 20,811,400 21,348,400 21,514,746 (166,346)
Excess (deficiency) of revenues over (under) expenditures . . . . . . . . . . . (10,814,887) (11,352,395) (11,518,741) (166,346)
Other financing sources: Sale of capital assets. . . . . . . . . . . . . . . . . 100,005 100,000 100,000 - Sale of bonds. . . . . . . . . . . . . . . . . . . . 8,411,473 8,411,045 8,411,045 - Total other financing sources. . . . . . . . . . . . . 8,511,478 8,511,045 8,511,045 -
Net change in fund balance . . . . . . . . . . . . . (2,303,409) (2,841,350) (3,007,696) (166,346)
Fund balance at beginning of year (restated). . . . 3,327,524 3,327,524 3,327,524 - Prior year encumbrances appropriated . . . . . . 30,120 30,120 30,120
Fund balance at end of year . . . . . . . . . . . . 1,054,235$ 516,294$ 349,948$ (166,346)$
CITY OF DAYTON, OHIO
SCHEDULE OF REVENUES, EXPENDITURES, AND CHANGES INFUND BALANCE - BUDGET AND ACTUAL (NON-GAAP BUDGETARY BASIS)
DEBT SERVICE FUNDFOR THE YEAR ENDED DECEMBER 31, 2004
Budgeted Amounts
119

EconomicDevelopment/Government
Equity Improvement Issue II Total
Assets: Equity in pooled cash and cash equivalents. . . . . . 455,813$ 297,674$ 753,487$ Receivables (net of allowances of uncollectibles): Accounts. . . . . . . . . . . . . . . . . . . . . . . 40,000 - 40,000 Due from other governments . . . . . . . . . . . . 513,500 - 513,500
Total assets. . . . . . . . . . . . . . . . . . . . . . . 1,009,313$ 297,674$ 1,306,987$
Liabilities: Accounts payable. . . . . . . . . . . . . . . . . . . 4,480$ -$ 4,480$ Contracts payable. . . . . . . . . . . . . . . . . . . 249,880 476 250,356 Retainage payable . . . . . . . . . . . . . . . . . . 1,678 - 1,678
Total liabilities. . . . . . . . . . . . . . . . . . . . . 256,038 476 256,514
Fund Balances: Reserved for encumbrances. . . . . . . . . . . . . 210,942 100,000 310,942 Unreserved, undesignated. . . . . . . . . . . . . . 542,333 197,198 739,531
Total fund balances . . . . . . . . . . . . . . . . . . 753,275 297,198 1,050,473
Total liabilities and fund balances. . . . . . . . . . . 1,009,313$ 297,674$ 1,306,987$
CITY OF DAYTON, OHIO
COMBINING BALANCE SHEETNONMAJOR CAPITAL PROJECTS FUNDS
DECEMBER 31, 2004
120

EconomicDevelopment/Government
Equity Improvement Issue II Total
Revenues:Charges for services . . . . . . . . . . . . . . 90,000$ -$ 90,000$ Intergovernmental . . . . . . . . . . . . . . . 1,063,955 48,535 1,112,490 Other . . . . . . . . . . . . . . . . . . . . . . 31,325 - 31,325
Total revenues . . . . . . . . . . . . . . . . . . 1,185,280 48,535 1,233,815
Expenditures:Current: Capital outlay . . . . . . . . . . . . . . . . . 1,366,815 234,594 1,601,409 Debt service:
Interest and fiscal charges . . . . . . . . . . - 27,929 27,929
Total expenditures . . . . . . . . . . . . . . . . 1,366,815 262,523 1,629,338
Net changes in fund balances. . . . . . . . . . . (181,535) (213,988) (395,523)
Fund balances at beginning of year (restated). 934,810 511,186 1,445,996
Fund balances at end of year. . . . . . . . . . 753,275$ 297,198$ 1,050,473$
CITY OF DAYTON, OHIO
COMBINING STATEMENT OF REVENUES, EXPENDITURES AND CHANGES IN FUND BALANCESNONMAJOR CAPITAL PROJECTS FUNDS
FOR THE YEAR ENDED DECEMBER 31, 2004
121

The enterprise funds account for operations that are financed and operated in a manner similar to private business enterprises wherethe intent is that costs (expenses, including depreciation) of providing services to the general public on a continuing basis berecovered primarily through user charges, or where it has been decided that a periodic determination of revenues earned, expensesincurred, and/or net income in appropriate for capital maintenance, public policy, management control, accountability or otherpurposes. The following are the nonmajor enterprise funds which the City of Dayton operates:
Storm Water
To account for the provision of storm sewers to the residents of the City of Dayton. Charges for services are used to maintain thestorm sewers throughout the City.
Golf
To account for the operations of the City's six golf courses. Revenue is generated by golf fees charged for the use of the facilities.The six golf courses provide needed green space inside the City with three providing scenic cover to the City's north well field.
COMBINING STATEMENTS - NONMAJOR ENTERPRISE FUNDS
Nonmajor Enterprise Funds
CITY OF DAYTON, OHIO
122

Storm Water Golf Total
Assets: Equity in pooled cash and cash equivalents. . . . . . 1,315,489$ 43,970$ 1,359,459$ Receivables (net of allowances of uncollectibles): Accounts. . . . . . . . . . . . . . . . . . . . . . . 1,477,627 - 1,477,627 Due from other funds. . . . . . . . . . . . . . . . . - 14,906 14,906 Due from other governments . . . . . . . . . . . . . 55,960 - 55,960 Unamortized bond issuance costs . . . . . . . . . . . - 39,096 39,096 Capital assets: Land and construction in progress . . . . . . . . . . 203,438 594,927 798,365 Depreciable capital assets, net . . . . . . . . . . . . 10,269,526 5,334,239 15,603,765 Total capital assets. . . . . . . . . . . . . . . . . . 10,472,964 5,929,166 16,402,130
Total assets. . . . . . . . . . . . . . . . . . . . . . . 13,322,040 6,027,138 19,349,178
Liabilities: Accounts payable. . . . . . . . . . . . . . . . . . . 22,981$ 20,521$ 43,502$ Contracts payable. . . . . . . . . . . . . . . . . . . 17,472 - 17,472 Accrued wages and benefits . . . . . . . . . . . . . 50,204 28,783 78,987 Compensated absences payable. . . . . . . . . . . . 91,546 100,028 191,574 Accrued interest payable . . . . . . . . . . . . . . . - 8,184 8,184 Due to other funds . . . . . . . . . . . . . . . . . . 675,696 2,517 678,213 Due to other governments . . . . . . . . . . . . . . - 493 493 General obligation bonds payable. . . . . . . . . . . - 2,640,003 2,640,003
Total liabilities. . . . . . . . . . . . . . . . . . . . . 857,899 2,800,529 3,658,428
Net assets: Invested in capital assets, net of related debt . . . . . 10,472,964 3,289,163 13,762,127 Unrestricted . . . . . . . . . . . . . . . . . . . . . 1,991,177 (62,554) 1,928,623
Total net assets . . . . . . . . . . . . . . . . . . . . 12,464,141$ 3,226,609$ 15,690,750$
CITY OF DAYTON, OHIO
COMBINING STATEMENT OF NET ASSETSNONMAJOR ENTERPRISE FUNDS
DECEMBER 31, 2004
123

Storm Water Golf Total
Operating revenues:Charges for services . . . . . . . . . . . . . . 4,271,408$ 2,756,287$ 7,027,695$ Other . . . . . . . . . . . . . . . . . . . . . . 2,574 29,422 31,996
Total operating revenues . . . . . . . . . . . . . 4,273,982 2,785,709 7,059,691
Operating expenses: Personal services . . . . . . . . . . . . . . . 1,694,653 1,178,583 2,873,236 Benefit payments . . . . . . . . . . . . . . . 569,291 334,010 903,301 Contract services . . . . . . . . . . . . . . . 970,041 84,024 1,054,065 Materials and supplies. . . . . . . . . . . . . 195,653 306,266 501,919 Utilities . . . . . . . . . . . . . . . . . . . . 53,840 168,957 222,797 Depreciation. . . . . . . . . . . . . . . . . . 357,826 227,471 585,297 Other. . . . . . . . . . . . . . . . . . . . . . 163,432 58,646 222,078
Total operating expenses . . . . . . . . . . . . . 4,004,736 2,357,957 6,362,693
Operating income (loss) . . . . . . . . . . . . . 269,246 427,752 696,998
Nonoperating expenses: Interest and fiscal charges . . . . . . . . . . . - (137,773) (137,773)
Total nonoperating expenses. . . . . . . . . . . . - (137,773) (137,773)
Change in net assets. . . . . . . . . . . . . . . . 269,246 289,979 559,225
Net assets, January 1 (restated) . . . . . . . . . 12,194,895 2,936,630 15,131,525
Net assets, December 31 . . . . . . . . . . . . . 12,464,141$ 3,226,609$ 15,690,750$
CITY OF DAYTON, OHIO
COMBINING STATEMENT OF REVENUES, EXPENSES AND CHANGES IN NET ASSETSNONMAJOR ENTERPRISE FUNDS
FOR THE YEAR ENDED DECEMBER 31, 2004
124

Storm Water Golf Total
Cash flows from operating activities:Cash received from customers . . . . . . . . . . . . . 3,544,734$ 2,756,287$ 6,301,021$ Cash received from other operating revenues . . . . . 2,574 16,171 18,745 Cash payments for personal services . . . . . . . . . (1,682,834) (1,162,749) (2,845,583) Cash payments for fringe benefits . . . . . . . . . . . (569,291) (332,245) (901,536) Cash payments for contract services. . . . . . . . . . (821,120) (129,817) (950,937) Cash payments for materials and supplies. . . . . . . (215,709) (343,448) (559,157) Cash payments for utilities. . . . . . . . . . . . . . . (57,620) (155,166) (212,786) Cash payments for other operating expenses . . . . . (163,243) (59,348) (222,591)
Net cash provided by operating activities. . . . . . . 37,491 589,685 627,176
Cash flows from capital and related financing activities:Acquisition of capital assets . . . . . . . . . . . . . (79,943) - (79,943) Principal paid on bonds . . . . . . . . . . . . . . . - (464,199) (464,199) Interest paid on bonds . . . . . . . . . . . . . . . . - (127,953) (127,953) Principal paid on capital leases . . . . . . . . . . . . - (110,127) (110,127) Interest paid on capital leases. . . . . . . . . . . . . - (7,337) (7,337)
Net cash used in capital and related financing activities . . . . . . . . . . (79,943) (709,616) (789,559)
Net decrease in cash and cash equivalents. . . . . . (42,452) (119,931) (162,383)
Cash and cash equivalents at beginning of year . . . 1,357,941 163,901 1,521,842 Cash and cash equivalents at end of year. . . . . . . $ 1,315,489 $ 43,970 $ 1,359,459
Reconciliation of operating income to net cash provided by operating activities:Operating income. . . . . . . . . . . . . . . . . . . . 269,246$ 427,752$ 696,998$ Adjustments to reconcile operating income to net cash provided by operating activities:
Depreciation . . . . . . . . . . . . . . . . . . . . . 357,826 227,471 585,297 Changes in assets and liabilities:
Decrease (increase) in accounts receivable. . . . . . (681,860) 1,655 (680,205) Increase in due from other funds . . . . . . . . . . . - (14,906) (14,906) Increase in due from other governments . . . . . . . . (55,960) - (55,960) Decrease in accounts payable . . . . . . . . . . . . . (30,429) (29,573) (60,002) Increase (decrease) in contracts payable . . . . . . . 13,160 (9,667) 3,493 Increase in retainage payable . . . . . . . . . . . . - 2,758 2,758 Increase in accrued wages and benefits. . . . . . . . 13,298 - 13,298 Increase (decrease) in due to other funds . . . . . . 150,237 (30,660) 119,577 Increase in due to other governments. . . . . . . . . - 14 14 Increase in compensated absences payable . . . . . . . . . . . . . . . . . . 1,973 14,841 16,814
Net cash provided by operating activities. . . . . . . . $ 37,491 $ 589,685 $ 627,176
CITY OF DAYTON, OHIO
COMBINING STATEMENT OF CASH FLOWSNONMAJOR ENTERPRISE FUNDS
FOR THE YEAR ENDED DECEMBER 31, 2004
125

Stores and Reproduction
Workers' Compensation
Plumbing ShopTo account for plumbing services to departments within the City.
Fleet ManagementTo account for the maintenance of City vehicles. Revenues are derived from direct charges to other departments for fuelusage and repairs. General maintenance is charged to the other funds on a pro-rated basis.
Stores is used in purchasing and storage of office materials and supplies for the entire organization. The other departmentsare charged the cost of the materials and supplies plus an average of fifteen percent markup to cover the overhead cost ofoperating this fund. Reproduction is used to account for the reproducing of written material, and the print, binding anddistribution of the City's various publications. All costs are recouped from charges to other departments within theorganization on a per-job basis.
Fire Fleet ManagementTo account for the maintenance of City fire vehicles and to charge for maintenance of fire vehicles from othermunicipalities. A majority of the maintenance will be provided to City fire vehicles. Revenues are derived from directcharges to the fire department within the general fund and from fees changed to other municipalities.
CITY OF DAYTON, OHIO
COMBINING STATEMENTS - INTERNAL SERVICE FUNDS
The internal service funds account for the financing of goods or services provided by one department or agency to otherdepartments of the City of Dayton on a cost-reimbursement basis. Accounting for these funds is designed to accumulate allof the costs incurred by the internal service funds in providing goods and services to other departments. However, chargesto the other departments are not intended to produce a significant profit in the long run, but to recover the total costs ofproviding goods or services.
To account for claims and administrative payments to cover risks due to job-related injuries to City employees. Revenuesare derived from pro-rated charges against personnel costs of each department to cover claim payments and costs ofadministering the fund.
126

Fleet Fire Fleet Stores and Workers' PlumbingManagement Management Reproduction Compensation Shop Total
Assets: Equity in pooled cash and cash equivalents. . . . . . 704,471$ 208,766$ 33,651$ 23,636,413$ 170,427$ 24,753,728$ Receivables (net of allowances of uncollectibles): Accounts. . . . . . . . . . . . . . . . . . . . . . . 6,761 32,183 - - - 38,944 Prepayments. . . . . . . . . . . . . . . . . . . . . . - 3,415 - - - 3,415 Due from other funds. . . . . . . . . . . . . . . . . 628,096 56,818 19,366 - - 704,280 Advances to component unit . . . . . . . . . . . . . 543,182 215,730 12,727 - - 771,639 Capital assets: Land - 75,000 - - - 75,000 Depreciable capital assets, net 239,903 778,951 176,011 - 64,498 1,259,363 Total capital assets. . . . . . . . . . . . . . . . . . 239,903 853,951 176,011 - 64,498 1,334,363
Total assets. . . . . . . . . . . . . . . . . . . . . . . 2,122,413 1,370,863 241,755 23,636,413 234,925 27,606,369
Liabilities: Accounts payable. . . . . . . . . . . . . . . . . . . 124,139$ 12,231$ 11,700$ 8,507$ 40,253$ 196,830$ Accrued wages and benefits . . . . . . . . . . . . . 99,458 9,904 7,409 25,014 11,122 152,907 Compensated absences payable . . . . . . . . . . . 195,626 - 12,712 38,460 43,041 289,839 Due to other funds . . . . . . . . . . . . . . . . . . - 255 - 88 1,894 2,237 Claims payable . . . . . . . . . . . . . . . . . . . . - - - 10,772,100 - 10,772,100 Capital lease obligation . . . . . . . . . . . . . . . . - - 195,458 - - 195,458
Total liabilities. . . . . . . . . . . . . . . . . . . . . 419,223 22,390 227,279 10,844,169 96,310 11,609,371
Net assets: Invested in capital assets, net of related debt . . . . . . 239,903 853,951 (19,447) - 64,498 1,138,905 Unrestricted . . . . . . . . . . . . . . . . . . . . . 1,463,287 494,522 33,923 12,792,244 74,117 14,858,093
Total net assets. . . . . . . . . . . . . . . . . . . 1,703,190$ 1,348,473$ 14,476$ 12,792,244$ 138,615$ 15,996,998$
CITY OF DAYTON, OHIO
COMBINING STATEMENT OF NET ASSETSINTERNAL SERVICE FUNDS
DECEMBER 31, 2004
127

Fleet Fire Fleet Stores and Workers' Plumbing Management Management Reproduction Compensation Shop Total
Operating revenues:Charges for services . . . . . . . . . . . . . . 7,527,505$ 872,657$ 368,100$ 5,562,553$ 616,889$ 14,947,704$ Other . . . . . . . . . . . . . . . . . . . . . . 24,027 56,818 - 20 - 80,865
Total operating revenues . . . . . . . . . . . . . 7,551,532 929,475 368,100 5,562,573 616,889 15,028,569
Operating expenses: Personal services . . . . . . . . . . . . . . . 2,545,458 346,997 135,838 463,016 392,757 3,884,066 Contract services . . . . . . . . . . . . . . . 418,049 91,066 - 492,866 15,149 1,017,130 Materials and supplies. . . . . . . . . . . . . 153,047 163,111 4,382 75,198 83,309 479,047 Utilities . . . . . . . . . . . . . . . . . . . . 1,496 11,022 - - 5,634 18,152 Benefit payment . . . . . . . . . . . . . . . . 877,433 119,506 52,408 164,325 113,139 1,326,811 Depreciation. . . . . . . . . . . . . . . . . . 64,872 19,973 143,363 - 6,214 234,422 Claims expense. . . . . . . . . . . . . . . . - - - 3,585,828 - 3,585,828 Administrative costs . . . . . . . . . . . . . . 3,052,022 51,026 86,435 - - 3,189,483 Other. . . . . . . . . . . . . . . . . . . . . . - 420 - 16,771 - 17,191
Total operating expenses . . . . . . . . . . . . . 7,112,377 803,121 422,426 4,798,004 616,202 13,752,130
Operating income (loss) . . . . . . . . . . . . . 439,155 126,354 (54,326) 764,569 687 1,276,439
Nonoperating expenses: Interest and fiscal charges . . . . . . . . . . . . . - - (18,509) - - (18,509)
Total nonoperating expenses. . . . . . . . . . . . . - - (18,509) - - (18,509)
Income (loss) before capital contributions and transfers . . . . . . . . . . . . 439,155 126,354 (72,835) 764,569 687 1,257,930
Capital contributions. . . . . . . . . . . . . . . - 873,924 - - - 873,924 Transfers in . . . . . . . . . . . . . . . . . . . - - 100,000 - - 100,000
Change in net assets . . . . . . . . . . . . . . . . 439,155 1,000,278 27,165 764,569 687 2,231,854
Net assets, January 1 . . . . . . . . . . . . . . . 1,264,035 348,195 (12,689) 12,027,675 137,928 13,765,144
Net assets, December 31 . . . . . . . . . . . . . 1,703,190$ 1,348,473$ 14,476$ 12,792,244$ 138,615$ 15,996,998$
FOR THE YEAR ENDED DECEMBER 31, 2004INTERNAL SERVICE FUNDS
COMBINING STATEMENT OF REVENUES, EXPENSES AND CHANGES IN NET ASSETS
CITY OF DAYTON, OHIO
128

Fleet Fire Fleet Stores and Workers' PlumbingManagement Management Reproduction Compensation Shop Total
Cash flows from operating activities:Cash received from quasi-external operating transactions with other funds . . . . . . . . . . . . . 7,503,923$ 847,689$ 362,791$ 5,562,553$ 616,889$ 14,893,845$ Cash received from other operating revenues . . . . . 18,294 - - 20 - 18,314 Cash payments for personal services . . . . . . . . . (2,511,119) (344,915) (133,086) (455,949) (387,779) (3,832,848) Cash payments for fringe benefits . . . . . . . . . . . (867,344) (118,874) (51,752) (162,021) (112,192) (1,312,183) Cash payments for contract services. . . . . . . . . . (522,190) (113,295) (6,323) (188,389) (13,299) (843,496) Cash payments for materials and supplies. . . . . . . (85,642) (164,319) (6,766) (80,390) (49,759) (386,876) Cash payments for cost of goods sold . . . . . . . . . (3,070,740) - (82,984) - - (3,153,724) Cash payments for utilities. . . . . . . . . . . . . . . (1,496) (12,341) - - - (13,837) Cash payments for claims . . . . . . . . . . . . . . . - - - (4,161,382) - (4,161,382) Cash payments for other operating expenses . . . . . - (165) - (17,424) - (17,589)
Net cash provided by operating activities. . . . . . 463,686 93,780 81,880 497,018 53,860 1,190,224
Cash flows from noncapital financing activities:Cash used in repayment of interfund loans . . . . . . (255,000) - (64,229) - - (319,229) Transfers in from other funds. . . . . . . . . . . . . - - 100,000 - - 100,000
Net cash provided by (used in) noncapital financing activities . . . . . . . . . . . . . . . . (255,000) - 35,771 - - (219,229)
Cash flows from capital and related financing activities:Acquisition of capital assets . . . . . . . . . . . . . (51,050) - - - (31,108) (82,158) Principal paid on capital leases . . . . . . . . . . . . - - (65,491) - - (65,491) Interest paid on capital leases. . . . . . . . . . . . . - - (18,509) - - (18,509)
Net cash used in capital and related financing activities . . . . . . . . . . . . (51,050) - (84,000) - (31,108) (166,158)
Net increase in cash and cash equivalents. . . . . . . . . 157,636 93,780 33,651 497,018 22,752 804,837
Cash and cash equivalents at beginning of year . . . 546,835 114,986 - 23,139,395 147,675 23,948,891 Cash and cash equivalents at end of year. . . . . . . $ 704,471 $ 208,766 $ 33,651 $ 23,636,413 $ 170,427 $ 24,753,728
Reconciliation of operating income (loss) to net cash provided by (used in) operating activities:Operating income (loss) . . . . . . . . . . . . . . . . . 439,155$ 126,354$ (54,326)$ 764,569$ 687$ 1,276,439$ Adjustments to reconcile operating income (loss) to net cash provided by operating activities:
Depreciation . . . . . . . . . . . . . . . . . . . . . 64,872 19,973 143,363 - 6,214 234,422 Changes in assets and liabilities:
Increase in accounts receivable. . . . . . . . . . . . (5,733) (24,968) - - - (30,701) Increase in due from other funds . . . . . . . . . . . (23,582) (56,818) (5,309) - - (85,709) Increase in prepaid assets . . . . . . . . . . . . . . . - (3,415) - - - (3,415) (Increase) decrease in inventory held for resale. . . . (18,718) 51,026 3,451 - - 35,759 Increase (decrease) in accounts payable . . . . . . . (35,551) (21,181) (8,707) (6,708) 40,253 (31,894) Increase in accrued wages and benefits . . . . . . . . 41,266 2,714 1,719 6,302 2,572 54,573 Increase (decrease) in due to other funds . . . . . . . (1,185) - - (105) 781 (509) Increase (decrease) in due to other governments . . - 95 - (2,045,194) - (2,045,099) Increase in compensated absences payable . . . . . 3,162 - 1,689 3,069 3,353 11,273 Increase in claims payable. . . . . . . . . . . . . . - - - 1,775,085 - 1,775,085
Net cash provided by operating activities. . . . . . . . $ 463,686 $ 93,780 $ 81,880 $ 497,018 $ 53,860 $ 1,190,224
CITY OF DAYTON, OHIO
COMBINING STATEMENT OF CASH FLOWSINTERNAL SERVICE FUNDS
FOR THE YEAR ENDED DECEMBER 31, 2004
129

Guaranty Building Permit SurchargePerformance Bond CompCareDeposit of Taxes/Courthouse Square Payroll WithholdingDependent Care Municipal CourtsFire Proceeds Executive SeveranceUrban Renewal Comp Dep
CITY OF DAYTON, OHIO
COMBINING STATEMENTS - FIDUCIARY FUNDS
Fiduciary funds are used to account for assets held by the City in a trustee capacity, or as an agent for individuals, privateorganizations, other governmental units, and/or funds. The following are the City's fiduciary fund types:
Agency funds are custodial in nature, and thus, do not recognize revenues or expenditures, only changes in assets andliabilities. These funds are used to record the collection and payment of employee payroll, withholdings, medical and lifeinsurance premiums, refundable deposits, PERS, Police and Fire Pension funds, taxes collected for other governments, andmunicipal court.
Agency Funds
130

Balance Balance12/31/03 Additions Deductions 12/31/04
GuarantyAssets: Equity in pooled cash and cash equivalents. . . . . . 49,649$ -$ -$ 49,649$ Total assets. . . . . . . . . . . . . . . . . . . . . . . 49,649$ -$ -$ 49,649$
Liabilities: Due to other governments . . . . . . . . . . . . . . 49,649$ -$ -$ 49,649$ Total liabilities. . . . . . . . . . . . . . . . . . . . . 49,649$ -$ -$ 49,649$
Performance BondAssets: Equity in pooled cash and cash equivalents. . . . . . 14,119$ -$ -$ 14,119$ Total assets. . . . . . . . . . . . . . . . . . . . . . . 14,119$ -$ -$ 14,119$
Liabilities: Withholdings and deposits. . . . . . . . . . . . . . 14,119$ -$ -$ 14,119$ Total liabilities. . . . . . . . . . . . . . . . . . . . . 14,119$ -$ -$ 14,119$
Deposit of Taxes/Courthouse SquareAssets: Equity in pooled cash and cash equivalents. . . . . . 137,869$ -$ -$ 137,869$ Taxes levied for other governments. . . . . . . . . . 555,623 762,775 555,623 762,775 Total assets. . . . . . . . . . . . . . . . . . . . . . . 693,492$ 762,775$ 555,623$ 900,644$
Liabilities: Due to other governments . . . . . . . . . . . . . . 693,492$ 762,775$ 555,623$ 900,644$ Total liabilities. . . . . . . . . . . . . . . . . . . . . 693,492$ 762,775$ 555,623$ 900,644$
Dependent CareAssets: Equity in pooled cash and cash equivalents. . . . . . 13,678$ -$ 1,064$ 12,614$ Total assets. . . . . . . . . . . . . . . . . . . . . . . 13,678$ -$ 1,064$ 12,614$
Liabilities: Due to other governments . . . . . . . . . . . . . . 13,678$ -$ 1,064$ 12,614$ Total liabilities. . . . . . . . . . . . . . . . . . . . . 13,678$ -$ 1,064$ 12,614$
- - Continued
DECEMBER 31, 2004
CITY OF DAYTON, OHIO
COMBINING STATEMENT OF CHANGES IN ASSETS AND LIABILITIESAGENCY FUNDS
131

Balance Balance12/31/03 Additions Deductions 12/31/04
Fire ProceedsAssets: Equity in pooled cash and cash equivalents. . . . . . 547,782$ 449,892$ 547,782$ 449,892$ Total assets. . . . . . . . . . . . . . . . . . . . . . . 547,782$ 449,892$ 547,782$ 449,892$
Liabilities: Due to other governments . . . . . . . . . . . . . . 547,782$ 449,892$ 547,782$ 449,892$ Total liabilities. . . . . . . . . . . . . . . . . . . . . 547,782$ 449,892$ 547,782$ 449,892$
Urban Renewal Comp DepAssets: Equity in pooled cash and cash equivalents. . . . . . 53,520$ -$ -$ 53,520$ Total assets. . . . . . . . . . . . . . . . . . . . . . . 53,520$ -$ -$ 53,520$
Liabilities: Withholdings and deposits. . . . . . . . . . . . . . 53,520$ -$ -$ 53,520$ Total liabilities. . . . . . . . . . . . . . . . . . . . . 53,520$ -$ -$ 53,520$
Building Permit SurchargeAssets: Equity in pooled cash and cash equivalents. . . . . . 7,701$ 5,784$ 7,701$ 5,784$ Total assets. . . . . . . . . . . . . . . . . . . . . . . 7,701$ 5,784$ 7,701$ 5,784$
Liabilities: Due to other governments . . . . . . . . . . . . . . 7,701$ 5,784$ 7,701$ 5,784$ Total liabilities. . . . . . . . . . . . . . . . . . . . . 7,701$ 5,784$ 7,701$ 5,784$
CompCareAssets: Equity in pooled cash and cash equivalents. . . . . . 57,520$ -$ -$ 57,520$ Total assets. . . . . . . . . . . . . . . . . . . . . . . 57,520$ -$ -$ 57,520$
Liabilities: Due to other governments . . . . . . . . . . . . . . 57,520$ -$ -$ 57,520$ Total liabilities. . . . . . . . . . . . . . . . . . . . . 57,520$ -$ -$ 57,520$
- - Continued
CITY OF DAYTON, OHIO
COMBINING STATEMENT OF CHANGES IN ASSETS AND LIABILITIESAGENCY FUNDS (CONTINUED)
DECEMBER 31, 2004
132

Balance Balance12/31/03 Additions Deductions 12/31/04
Payroll WithholdingAssets: Equity in pooled cash and cash equivalents. . . . . . 4,241,006$ 165,114$ -$ 4,406,120$ Total assets. . . . . . . . . . . . . . . . . . . . . . . 4,241,006$ 165,114$ -$ 4,406,120$
Liabilities: Withholdings and deposits. . . . . . . . . . . . . . 4,241,006$ 165,114$ -$ 4,406,120$ Total liabilities. . . . . . . . . . . . . . . . . . . . . 4,241,006$ 165,114$ -$ 4,406,120$
Municipal CourtsAssets: Cash and cash equivalents with fiscal agents . . . . . 801,448$ 232,464$ 530,513$ 503,399$ Total assets. . . . . . . . . . . . . . . . . . . . . . . 801,448$ 232,464$ 530,513$ 503,399$
Liabilities: Due to other governments . . . . . . . . . . . . . . 58,874$ 232,464$ -$ 291,338$ Due to primary government. . . . . . . . . . . . . . 263,954 - 263,954 - Due to others. . . . . . . . . . . . . . . . . . . . . 478,620 - 266,559 212,061 Total liabilities. . . . . . . . . . . . . . . . . . . . . 801,448$ 232,464$ 530,513$ 503,399$
Executive SeveranceAssets: Investments with fiscal agents . . . . . . . . . . . . 1,205,730$ -$ 103,560$ 1,102,170$ Total assets. . . . . . . . . . . . . . . . . . . . . . . 1,205,730$ -$ 103,560$ 1,102,170$
Liabilities: Withholdings and deposits. . . . . . . . . . . . . . 1,205,730$ -$ 103,560$ 1,102,170$ Total liabilities. . . . . . . . . . . . . . . . . . . . . 1,205,730$ -$ 103,560$ 1,102,170$
Total Agency FundsAssets: Equity in pooled cash and cash equivalents. . . . . . 5,122,844$ 620,790$ 556,547$ 5,187,087$ Cash and cash equivalents with fiscal agents . . . . . 801,448 232,464 530,513 503,399 Investments with fiscal agents . . . . . . . . . . . . 1,205,730 - 103,560 1,102,170 Taxes levied for other governments. . . . . . . . . . 555,623 762,775 555,623 762,775 Total assets. . . . . . . . . . . . . . . . . . . . . . . 7,685,645$ 1,616,029$ 1,746,243$ 7,555,431$
Liabilities: Due to other governments . . . . . . . . . . . . . . 1,428,696$ 1,450,915$ 1,112,170$ 1,767,441$ Due to primary government. . . . . . . . . . . . . . 263,954 - 263,954 - Due to others. . . . . . . . . . . . . . . . . . . . . 478,620 - 266,559 212,061 Withholdings and deposits. . . . . . . . . . . . . . 5,514,375 165,114 103,560 5,575,929 Total liabilities. . . . . . . . . . . . . . . . . . . . . 7,685,645$ 1,616,029$ 1,746,243$ 7,555,431$
CITY OF DAYTON, OHIO
COMBINING STATEMENT OF CHANGES IN ASSETS AND LIABILITIESAGENCY FUNDS (CONTINUED)
DECEMBER 31, 2004
133

THIS PAGE IS INTENTIONALLY LEFT BLANK
134

FISCAL CAPACITY OF THE CITY
THE FOLLOWING UNAUDITED STATISTICAL TABLESREFLECT SOCIAL AND ECONOMIC DATA FINANCIAL TRENDS AND
STATISTICAL SECTION
135

Youth, Community LeadershipEducation and Development and Economic and Quality
Year (1) Downtown Human Services Neighborhoods Development of Life
2004 4,167,407$ 2,237,230$ 20,311,675$ 6,410,373$ 41,319,775$
2003 3,747,343 2,531,763 20,353,743 6,996,268 37,705,241
2002 4,807,733 1,506,653 2,468,203 24,328,537 39,442,705
2001 5,021,369 1,436,191 2,331,172 23,658,978 37,964,500
2000 4,869,311 1,301,481 3,281,232 21,838,458 43,581,245
Policy Economic Neighborhood Land CommunityYear Development Development Development Use Security
1999 4,209,530$ 8,666,422$ 21,562,100$ 27,568,631$ 47,025,960$
1998 3,906,544 8,129,048 20,916,252 27,023,884 43,658,203
1997 3,517,339 6,234,581 22,007,949 24,691,637 41,438,538
1996 3,333,165 5,176,240 19,680,327 24,204,931 36,719,057
1995 3,035,584 5,016,975 17,697,932 23,086,873 33,746,207
(2) For 2002, the City of Dayton changed accounting procedures to GASB 34 and includes all governmental activities.
(1) For 2000, the City of Dayton Changed program classifications.
Source: Finance Department; City of Dayton, Ohio
CITY OF DAYTON, OHIO
GENERAL GOVERNMENT EXPENDITURES BY FUNCTIONLAST TEN YEARS (1 - 2)
136

Corporate Public Safety Capital DebtResponsibility and Justice Other Outlay Service Total
14,870,289$ 92,673,272$ 506,890$ 23,346,465$ 13,391,294$ 219,234,670$
16,035,551 90,354,455 918,216 29,742,434 10,780,926 219,165,940
15,813,881 100,912,458 1,747,482 22,165,044 10,516,008 223,708,704
22,350,461 101,900,533 373,382 2,700,494 10,857,264 208,594,344
20,761,269 96,185,438 - 802,361 8,673,494 201,294,289
Human Administrative Capital DebtDevelopment Transportation Services Outlay Service Total
17,112,029$ 11,833,639$ 47,817,478$ 137,543$ 9,545,571$ 195,478,903$
15,513,271 11,015,768 42,719,087 1,600,399 4,545,625 179,028,081
16,557,005 12,598,951 41,180,581 1,456,176 5,520,712 175,203,469
15,469,711 12,851,449 35,982,191 1,259,976 6,229,068 160,906,115
13,812,617 13,461,208 36,941,100 3,116,588 6,462,872 156,377,956
137

Special Charges forYear Taxes Intergovernmental Assessments Services
2004 149,926,379$ 25,333,452$ 1,034,415$ 20,295,875$
2003 147,286,520 28,609,999 1,033,045 22,262,759
2002 145,251,212 24,096,216 693,360 23,813,556
2001 146,833,625 15,969,587 217,330 23,256,851
2000 153,002,507 19,702,445 258,235 22,092,957
1999 147,004,491 20,024,791 380,316 24,247,038
1998 143,115,776 15,426,707 499,771 21,049,556
1997 142,195,336 13,332,977 388,842 18,391,334
1996 136,955,246 11,160,341 532,893 14,169,018
1995 131,722,164 10,136,704 425,856 15,086,577
(2) For 2002, the City of Dayton changed accounting procedures to GASB 34 and includes all governmental activities.
Source: Finance Department; City of Dayton, Ohio
CITY OF DAYTON, OHIO
GENERAL GOVERNMENTAL REVENUES BY SOURCELAST TEN YEARS (1 - 2)
(1) Includes General, Special Revenue and Debt Service Funds.
138

Licenses and Fines and InvestmentPermits Forfeitures Income Other Total
1,817,222$ 1,832,710$ 2,288,903$ 4,767,369$ 207,296,325$
2,120,143 2,083,662 3,623,500 5,756,600 212,776,228
1,980,844 2,249,333 3,332,301 8,319,580 209,736,402
1,928,291 2,454,517 6,568,991 8,085,266 205,314,458
1,995,969 1,754,313 9,463,035 3,973,520 212,242,981
1,620,192 1,211,084 5,831,860 3,572,839 203,892,611
1,651,854 1,486,577 7,403,205 2,203,395 192,836,841
1,537,560 1,081,276 6,663,012 2,195,147 185,785,484
1,341,104 3,141,376 6,035,638 2,000,914 175,336,530
1,101,256 906,991 4,541,703 1,689,196 165,610,447
139

Percent Percent Percentage of of Current Delinquent Total of Total Outstanding Outstanding
Current Tax Current Tax Collections Tax Tax Collections Delinquent Delinquent TaxesYear Levy Collections to Levy Collections Collections to Levy Taxes to Total Levy
2004 21,129,504$ 19,921,141$ 94.3% 1,441,368$ 21,362,509$ 101.1% 4,921,388$ 23.3%
2003 21,142,675 19,212,789 90.9% 1,265,481 20,478,270 96.9% 4,956,875 23.4%
2002 19,075,592 17,815,051 93.4% 1,327,331 19,142,382 100.4% 4,765,605 25.0%
2001 18,861,580 18,027,699 95.6% 1,121,799 19,149,498 101.5% 3,458,115 18.3%
2000 18,747,632 17,953,577 95.8% 1,028,171 18,981,748 100.1% 4,089,228 21.8%
1999 17,228,696 16,688,916 96.8% 889,833 17,578,749 100.2% 2,854,545 16.6%
1998 17,236,685 16,369,525 95.0% 887,443 17,256,968 100.1% 2,091,752 12.1%
1997 17,139,435 16,499,010 96.3% 820,972 17,319,982 101.1% 2,721,684 15.9%
1996 15,955,014 15,303,711 95.9% 882,680 16,186,391 101.5% 2,754,440 17.3%
1995 15,865,444 15,284,346 96.3% 700,632 15,984,978 100.8% 2,560,886 16.1%
on the cash basis for all years.
Source: County Auditor; Montgomery County, Ohio
CITY OF DAYTON, OHIO
PROPERTY TAX LEVIES AND COLLECTIONSLAST TEN YEARS (1)
(1) Includes the General, Special Revenue, Debt Service, Trust and Agency Funds. Presented
140

Percentage of Tangible Total (1) Assessed Value
Real Public Utility Personal Assessed Estimated To EstimatedYear Property Real Property Property Value Value True Value
2004 1,618,667,120$ 106,951,010$ 318,067,610$ 2,043,685,740$ 6,171,703,279$ 33.11%
2003 1,605,463,590 106,740,710 402,063,173 2,114,267,473 6,269,282,241 33.72%
2002 1,349,792,850 101,461,400 456,304,945 1,907,559,195 5,797,067,825 32.91%
2001 1,321,740,600 139,196,290 440,728,086 1,901,664,976 5,897,206,567 32.25%
2000 1,308,366,160 142,951,440 403,346,103 1,854,663,703 5,799,921,138 31.98%
1999 1,199,695,480 150,755,290 387,618,846 1,738,069,616 5,161,385,240 33.67%
1998 1,196,725,090 146,457,920 356,354,152 1,699,537,162 5,080,306,397 33.45%
1997 1,197,994,870 146,932,600 364,241,202 1,709,168,672 5,048,624,860 33.85%
1996 1,098,801,200 144,608,520 352,091,721 1,595,501,441 4,774,338,272 33.42%
1995 1,092,389,270 153,879,570 340,355,176 1,586,624,016 4,922,188,818 32.23%
Source: County Auditor; Montgomery County, Ohio
CITY OF DAYTON, OHIO
ASSESSED VALUE AND ESTIMATED TRUE VALUE OF TAXABLE PROPERTYLAST TEN YEARS (1)
(1) This is calculated by dividing the assessed value by the assessment percentage. The percentages for 2003 were thirty-five percent (35%) for all real property, eighty-eight (88%) for public utility tangible personal property and twenty five percent (25%) for tangible personal and interexhange telecom public utility.
141

Collection Debt Service Judgment Street Capital Debt ServiceYear Fund Trust Fund Maintenance Fund Improvement Fund Total Fund General Total
2004 1.17$ -$ 0.33$ -$ 1.50$ 3.50$ 5.00$ 8.50$
2003 0.15 - 1.35 1.70 3.20 3.50 5.00 8.50
2002 0.15 - 1.35 - 1.50 3.50 5.00 8.50
2001 0.15 - 1.35 - 1.50 3.50 5.00 8.50
2000 0.15 0.50 0.85 - 1.50 3.50 5.00 8.50
1999 0.15 0.50 0.85 - 1.50 3.50 5.00 8.50
1998 0.15 - 1.35 - 1.50 3.50 5.00 8.50
1997 0.15 0.50 0.85 - 1.50 3.50 5.00 8.50
1996 0.15 0.50 0.85 - 1.50 3.50 5.00 8.50
1995 0.15 0.50 0.85 - 1.50 3.50 5.00 8.50
By November 6, 1945 Charter AmendmentDirect 10 Mill Limitation (By Ohio Constitution)
rate for all purposes in excess of ten mills. As a result of the passage of a Charter amendment, the City hasbeen levying an additional 8.5 mills above the 1.5 mills. This additional millage has resulted in a totalproperty tax rate of ten mills for the City of Dayton, the maximum permitted by the City Charter.
Source: County Auditor; Montgomery County, Ohio
(1) The Ohio Constitution places a ten-mill limitation upon the combined property tax levied by the County, theSchool District, and the City. The City of Dayton has been permitted to levy only 1.5 mills of thatten-mill limitation. The Constitution permits the City to Levy additional millage beyond 1.5 mills upon approvalof the electorate. Our City Charter also has a ten-mill limitation which prohibits the City from levying a total tax
CITY OF DAYTON, OHIO
PROPERTY TAX RATES - DIRECT AND OVERLAPPING GOVERNMENTS(PER $1,000 OF ASSESSED VALUATION)
LAST TEN YEARS (1)
142

City ofDayton MontgomeryGrand Dayton City Montgomery CountyTotal School District County Public Library
10.00$ 70.85$ 18.24$ 0.26$
11.70 70.85 18.24 0.26
10.00 70.85 17.24 0.26
10.00 62.65 16.64 0.26
10.00 62.65 16.64 0.26
10.00 62.65 16.64 0.26
10.00 62.65 16.64 0.26
10.00 62.65 16.64 0.72
10.00 62.65 16.64 0.72
10.00 62.65 16.64 0.72
143

Percent of Percent ofCurrent Collections Delinquent Total Total Assessments
Current Current Assessments to Current Assessments Assessments Collected to Year Assessments Due (1) Collected (1) Assessments Collected (1) Collected Current Due (2)
2004 1,814,540$ 1,250,199$ 68.9% 158,459$ 1,408,658$ 77.6%
2003 1,720,310 1,198,753 69.7% 238,209 1,436,962 83.5%
2002 1,734,308 1,179,253 68.0% 185,355 1,364,608 78.7%
2001 1,481,584 1,159,041 78.2% 192,008 1,351,049 91.2%
2000 1,392,991 769,441 55.2% 158,810 928,251 66.6%
1999 1,346,031 736,056 54.7% 189,940 925,996 68.8%
1998 1,726,054 1,171,223 67.9% 137,995 1,309,218 75.9%
1997 1,777,543 450,731 25.4% 106,135 556,866 31.3%
1996 1,001,476 358,649 35.8% 190,900 549,549 54.9%
1995 1,005,686 369,126 36.7% 118,995 488,121 48.5%
Source: County Auditor; Montgomery County, Ohio
(2) Total collections exceed Current Assessments Due because of high collection of curb, gutter and sidewalk delinquent assessments.
Note: This table reflects only those special assessments collected through the County Auditor's Office.
CITY OF DAYTON, OHIO
SPECIAL ASSESSMENT BILLINGS AND COLLECTIONSLAST TEN YEARS
(1) Reported on a cash basis and includes collections of delinquent utility bills.
144

Ratio of Net Net GeneralNet General Assessed General Bonded Debt Bonded Debt
Year Bonded Debt (1) Value (2) Population (3) to Assessed Value Per Capita
2004 55,534,308$ 2,043,685,740$ 166,179 2.72% 334$
2003 49,762,889 2,114,267,473 166,179 2.35% 299
2002 50,608,401 1,907,559,195 166,179 2.65% 305
2001 54,101,466 1,901,664,976 166,179 2.84% 326
2000 33,448,972 1,854,663,703 166,179 1.80% 201
1999 27,526,130 1,738,069,616 167,475 1.58% 164
1998 43,224,643 1,699,537,162 172,947 2.54% 250
1997 9,463,362 1,709,168,672 172,947 0.55% 55
1996 14,767,060 1,595,501,441 178,540 0.93% 83
1995 19,402,055 1,586,624,016 182,005 1.22% 107
(4) In years 1996 - 1999 the City had no general obligation debt. All debt was repaid through enterprise operations.
(1) Net general bonded debt is defined as bonded debt supported by taxes less Debt Service Fund fund balance (which does not include reserve for encumbrances or loans receivable).
(2) Source: County Auditor; Montgomery County, Ohio
(3) Source: U.S. Census Bureau and Miami Valley Regional Planning Commission.
CITY OF DAYTON, OHIO
RATIO OF NET GENERAL OBLIGATION BONDED DEBTTO ASSESSED VALUE AND NET GENERAL OBLIGATION BONDED DEBT PER CAPITA
LAST TEN YEARS
145

COMPUTATION OF OVERALL LEGAL DEBT MARGIN
Assessed Value 2,043,685,740$
Overall Debt Limitation 10 1/2 Percent of Assessed Valuation 214,587,003$
Total Voted and Unvoted Debt Outstanding at December 31, 2004 193,897,094
Less: Exempt Debt Primary Government: Golf Renovation General Obligation Bonds 2,640,003 Airport General Obligation Bonds and Note 9,350,000 Waterworks Revenue Bonds (1) 5,235,650 Ohio Water Development Authority Loan 24,539,685 Ohio Public Works Commission Loan 800,000 Airport Revenue Bonds (1) 62,645,625 Special Assessment Bonds and Note 1,297,409 Capital Facilities and Various Purpose Income Tax Bonds 57,034,997 Economic Development Bonds 11,385,000
Debt Within 10 1/2 Percent Limitation 18,968,725 Less: Bond Retirement Fund Balance 6,895,689
Net Debt Subject to 10 1/2 Percent Limitation 12,073,036
Legal Debt Margin Within 10 1/2 Percent Limitation 202,513,967$
COMPUTATION OF UNVOTED LEGAL DEBT MARGIN
Assessed Value 2,043,685,740$
Unvoted Debt Limitation 5 1/2 Percent of Assessed Valuation 112,402,716$
Total Unvoted Debt Outstanding at December 31, 2003 193,897,094
Less: Exempt Debt Primary Government: Golf Renovation General Obligation Bonds 2,640,003 Airport General Obligation Bonds and Note 9,350,000 Waterworks Revenue Bonds (1) 5,235,650 Ohio Water Development Authority Loan 24,539,685 Ohio Public Works Commission Loan 800,000 Airport Revenue Bonds (1) 62,645,625 Special Assessment Bonds and Note 1,297,409 Capital Facilities and Various Purpose Income Tax Bonds 57,034,997 Economic Development Bonds 11,385,000
Debt Within 5 1/2 Percent Limitation 18,968,725 Less: Bond Retirement Fund Balance 6,895,689
Net Debt Subject to 5 1/2 Percent Limitation 12,073,036
Legal Debt Margin Within 5 1/2 Percent Limitation 100,329,680$
unamortized deferred charges of $2,149,375 and $169,350, respectively.
CITY OF DAYTON, OHIO
COMPUTATION OF LEGAL DEBT MARGINSDECEMBER 31, 2004
(1) Airport and Waterworks revenue bonds are shown on the balance Sheet net of a discount and
146

Assessed Net General Percentage Net Tax SupportedJurisdiction Value Bonded Debt Overlapping Overall Debt
Direct: City of Dayton 2,043,685,740$ 49,762,889$ 100.00% 49,762,889$
Overlapping Debt: Dayton City School District 2,101,252,966 230,102,845 98.64% 226,973,446 Montgomery County 9,982,969,719 32,892,639 20.80% 6,841,669
Total Overlapping Debt 233,815,115
Total Direct and Overlapping Debt 283,578,004$
Source: County Auditor; Montgomery County, Ohio
Note: The percentage of gross indebtedness of the City's overlapping political subdivisions was determined by dividing each overlapping subdivision's assessed valuation within the City by the subdivision's total assessed valuation.
CITY OF DAYTON, OHIO
COMPUTATION OF DIRECT AND OVERLAPPINGGENERAL OBLIGATION BONDED DEBT
DECEMBER 31, 2004
147

Interest Total Ratio of Debtand Fiscal General Service to General
Year Principal (2) Charges (2) Total Expenditures Expenditures
2004 9,228,813$ 3,962,946$ 13,191,759$ 219,044,970$ 6.02%
2003 7,350,552 3,430,374 10,780,926 219,165,940 4.92%
2002 6,198,173 4,317,835 10,516,008 223,708,704 4.70%
2001 6,524,068 4,333,196 10,857,264 208,594,344 5.20%
2000 4,465,000 2,917,114 7,382,114 201,192,360 3.70%
1999 5,295,000 3,139,008 8,434,008 195,478,903 4.30%
1998 2,200,000 2,057,228 4,257,228 179,028,081 2.40%
1997 2,657,475 1,840,797 4,498,272 175,203,469 2.60%
1996 4,147,664 2,081,404 6,229,068 160,906,115 3.90%
1995 4,120,582 2,342,289 6,462,871 156,377,956 4.10%
LAST TEN YEARS (1)
(1) Total General Expenditures include General, Special Revenue, and Debt Service Funds.
(2) Excludes general obligation debt reported in the enterprise funds.
Source: Finance Department; City of Dayton, Ohio
CITY OF DAYTON, OHIO
RATIO OF ANNUAL DEBT PRINCIPAL AND INTEREST EXPENDITURESFOR GENERAL OBLIGATION BONDED DEBT TO TOTAL
GENERAL GOVERNMENTAL EXPENDITURES
148

Net RevenueAvailable for
Year Debt Service (1) Principal Interest Total Coverage
2004 29,633,497$ 2,485,000$ 3,357,370$ 5,842,370$ 5.07
2003 17,489,400 1,275,000 1,206,507 2,481,507 7.05
2002 4,936,408 1,975,000 1,820,023 3,795,023 1.30
2001 5,879,030 1,890,000 1,910,247 3,800,247 1.55
2000 6,922,358 1,800,000 1,994,329 3,794,329 1.82
1999 9,114,117 1,725,000 2,073,164 3,798,164 2.40
1998 10,690,242 1,645,000 2,146,660 3,791,660 2.82
1997 9,775,151 1,580,000 2,215,570 3,795,570 2.58
1996 8,861,002 1,520,000 2,473,688 3,993,688 2.22
1995 4,915,697 1,075,000 3,199,898 4,274,898 1.15
(1) Net Revenue Available for Debt Service is computed by adding net income (loss) for the reporting period to depreciation, amortization, and interest expense.
Debt Service Requirements
CITY OF DAYTON, OHIO
REVENUE BOND COVERAGE DAYTON INTERNATIONAL AIRPORT
LAST TEN YEARS
149

Net RevenueAvailable for
Year Debt Service (1) Principal Interest Total Coverage
2004 (a) (b) (3,006,068)$ 5,405,000$ 893,310$ 6,298,310$ -0.48
2003 (a) 5,415,955 5,195,000 1,101,110 6,296,110 0.86
2002 (a) 7,099,652 5,000,000 1,301,110 6,301,110 1.13
2001 19,668,398 4,805,000 1,493,310 6,298,310 3.12
2000 18,333,123 4,625,000 1,678,310 6,303,310 2.91
1999 15,414,054 5,000,000 1,389,983 6,389,983 2.41
1998 13,764,616 750,000 3,436,222 4,186,222 3.29
1997 11,138,819 710,000 3,478,112 4,188,112 2.66
1996 11,221,602 670,000 3,516,302 4,186,302 2.68
1995 14,246,626 2,095,000 4,204,486 6,299,486 2.26
(1)
(a)
(b) The city has $8,000,000 in restricted cash to meet the Rate Covenant as described in Section 4.02 of the Trust Agreement.
Net Revenue Available for Debt Service is computed by adding net income (loss) for the
Debt Service Requirements
In accordance with the Trust Agreement, amounts on deposit in the Utility Reserve Fund may be transferred into the Revenue Fund orthe Bond Service Fund (as defined in the Trust Agreement) to be included as Net Revenue Available for Debt Service. Had sufficienttransfers been made by the fiscal year-end, the revenue bond coverage ratio would have met the required minimum of 1.25.
reporting period to depreciation, amortization, and interest expense.
CITY OF DAYTON, OHIO
REVENUE BOND COVERAGE WATER FUND
LAST TEN YEARS
150

Fiscal UnemploymentYear Population (1) Elementary Intermediate High Total Statistics (3) Age 2000 1990 1980
2004 166,179 11,315 3,172 5,342 19,829 7.1% Under 5 7.1% 8.5% 8.2%
2003 166,179 9,296 2,874 5,000 17,170 5.5% 5-14 14.1% 13.8% 14.3%
2002 166,179 11,969 3,345 5,474 20,788 5.6% 15-24 18.2% 16.8% 20.7%
2001 166,179 12,023 3,345 5,474 20,842 7.4% 25-34 14.1% 18.0% 16.1%
2000 166,179 11,995 3,568 5,516 21,079 6.0% 35-44 14.9% 13.0% 8.9%
1999 167,475 13,228 3,515 5,735 22,478 4.0% 45-54 12.1% 8.3% 9.5%
1998 172,947 16,305 3,386 6,595 26,286 6.6% 55-64 7.5% 8.5% 10.2%
1997 172,947 15,671 4,394 6,102 26,167 6.9% 65+ 12.0% 13.1% 12.1%
1996 178,540 16,052 4,328 6,599 26,979 7.6%
1995 182,005 15,913 4,246 6,832 26,991 7.2%
(1) Source: U.S. Bureau of Census and Miami Valley Regional Planning Commission.
(2) Source: Records of the Dayton Board of Education, Office of Public Information.
(3) Unemployment rate are an average of that year. Source: Ohio Bureau of Employment Services.
Public School Enrollment (2) for the Last Three Censuses:Age Distribution of Population
CITY OF DAYTON, OHIO
DEMOGRAPHIC STATISTICSLAST TEN YEARS
151

Estimated Building Estimated CountyAssessed Market Permits Value of Bank
Year Value Value Issued (2) Buildings (2) Deposits (3)
2004 1,618,667,120$ 4,624,763,200$ 1,020 174,560,405$ 1,756,510,000$
2003 1,605,463,590 4,587,038,829 1,407 133,241,900 249,614,000
2002 1,349,792,850 3,856,551,000 1,314 148,084,800 241,447,000
2001 1,321,740,600 3,776,401,714 1,206 129,052,146 208,298,000
2000 1,308,366,160 3,738,189,028 1,652 124,091,672 191,473,000
1999 1,199,695,480 3,427,701,371 1,564 80,143,557 2,994,378,000
1998 1,196,725,090 3,419,214,543 1,390 101,936,784 3,264,705,000
1997 1,197,994,870 3,422,842,486 1,634 82,811,189 3,530,314,000
1996 1,098,801,200 3,139,432,000 1,512 67,723,613 3,899,145,000
1995 1,092,389,270 3,121,112,200 1,571 91,960,478 3,995,114,000
Source:
Montgomery County, but in Cuyahoga County.
CITY OF DAYTON, OHIO
PROPERTY VALUE, CONSTRUCTION AND BANK DEPOSITSLAST TEN YEARS
Real Property (1)
(1) County Auditor; Montgomery County, Ohio
(2) City of Dayton Division of Business Services, Permit Section.
(3) Decrease for 2000 due to bank restructuring. Deposits at end of year are no longer held in
152

Tangible RealProperty Property Total Percentage of
Nature of Taxable Taxable Taxable Total AssessedTaxpayer Business Valuation Valuation (1) Valuation (1) Valuation
Dayton Power and Light Company Utilities -$ 51,220,550$ 51,220,550$ 2.49%
Delphi Automotive Systems Corporation Automotive 34,272,360 5,566,110 39,838,470 1.94%
NCR Computer Technology 11,770,080 16,897,860 28,667,940 1.39%
Ohio Bell Telephone Company Public Utility - 27,817,580 27,817,580 1.35%
Behr Dayton Thermal Automotive 15,505,500 5,041,610 20,547,110 1.00%
Arts Center Foundation Non-Profit - 16,082,190 16,082,190 0.78%
Dayton Heart Hospital Hospital 2,756,350 7,142,490 9,898,840 0.48%
Marriott International Hotel - 8,461,750 8,461,750 0.41%
Vectren Energy Delivery Utilities - 7,244,120 7,244,120 0.35%
Standard Register Computer/office equipment 5,173,490 1,921,100 7,094,590 0.35%
Total 69,477,780 147,395,360 216,873,140 10.55%
All Other Taxpayers 255,155,927 1,583,877,760 1,839,033,687 89.45%
Total Assessed Valuation 324,633,707$ 1,731,273,120$ 2,055,906,827$ 100.00%
(1) Includes Public Utility Real
(Continued)
Source: County Auditor; Montgomery County, Ohio
The following is a list of the ten largest ad valorem taxpayers (based on the taxable valuation of their property)subject to the City's taxing jurisdiction.
CITY OF DAYTON, OHIO
PRINCIPAL TAXPAYERSDECEMBER 31, 2004
153

Dayton Division of Taxation.
Nature ofName of Taxpayer Business
Miami Valley Hospital Hospital
NCR Technology
Delphi Automotive Systems Corp. Automotive
Montgomery County Government
City of Dayton Government
Dayton City School District Education
Good Samaritan Hosp Hospital
University of Dayton Education
Veterans Administration Hospital
Defense Finance Accounting Government
The listing of employers as shown is based on income tax withholding recorded by the City of
CITY OF DAYTON, OHIO
PRINCIPAL TAXPAYERSDECEMBER 31, 2004
(Continued)
154

February 12, 1805
August 12, 1913
Commission-Manager Plan
56.3
855
400 600
21,292
2,560
104,740 64,298 61.39%
59,612 51.85 791.0
13 376
5 439
1,400 9
22 3
19 Golf CoursesSwimming Pools (including wading)
CITY OF DAYTON, OHIO
MISCELLANEOUS STATISTICS DECEMBER 31, 2004
Recreation and Park Facilities:Number of AcresTotal FacilitiesTennis Courts
Number of Employees
Police Protection:Number of DistrictsNumber of Employees
Average Daily Consumption (million gallons)Miles of Water Mains
Fire Protection:Number of Stations
Number of Votes Cast in Last General ElectionPercentage of Registered Voters Voting in Last General Election
Municipal Water Department:Number of Accounts
Number of Street Lights
Employees as of December 31, 2004 (all positions)
Elections:Number of Registered Voters
Miles of Streets and Alleys Paved
Miles of Sewers:StormSanitary
Date of Incorporation
Date Present Charter Adopted
Form of Government
Area - Square Miles
155

THIS PAGE IS INTENTIONALLY LEFT BLANK
156