city of eastvale, california comprehensive …gfoa.net/cafr/coa2012/eastvaleca.pdf · city of...
TRANSCRIPT

CITY OF EASTVALE, CALIFORNIA
Comprehensive Annual Financial Report
Fiscal Year Ended June 30, 2012

City of Eastvale, California Comprehensive Annual Financial Report
For the Fiscal Year Ended
June 30, 2012
Prepared by: Department of Finance and Administration

This page left blank intentionally.
ANNUAL FINANCIAL REPORT Fiscal Year Ended June 30, 2011

City of Eastvale Comprehensive Annual Financial Report
June 30, 2012
Table of Contents Page
INTRODUCTORY SECTION Letter of Transmittal i List of Principal Officials v Organizational Chart vi FINANCIAL SECTION Independent Auditor’s Report 1 Management’s Discussion and Analysis 3 Basic Financial Statements Government-Wide Financial Statements: Statement of Net Assets 12 Statement of Activities 13 Fund Financial Statements: Balance Sheet – Governmental Funds 14 Reconciliation of the Balance Sheet of Governmental Funds to the Statement of Net Assets
15
Statement of Revenues, Expenditures and Changes in Fund Balances Governmental Funds
16
Reconciliation of the Statement of Revenues, Expenditures and Changes in Fund Balances of Governmental Funds to the Statement of Activities
17 Statement of Fiduciary Assets and Liabilities – Agency Fund 18 Notes to the Financial Statements 19 Required Supplementary Information Schedule of Revenues, Expenditures and Changes in Fund Balance Budget and Actual:
General Fund 37 Gas Tax Special Revenue Fund 38 Supplementary Information Nonmajor Governmental Funds: 39 Combining Balance Sheet 40 Combining Statement of Revenues, Expenditures and Changes in Fund Balances
42

City of Eastvale Comprehensive Annual Financial Report
June 30, 2012
Table of Contents FINANCIAL SECTION, Continued Schedule of Revenues, Expenditures and Changes in Fund Balances Budget and Actual
44
Measure A Special Revenue Fund 45 Supplemental Law Enforcement Services Special Revenue Fund 46 Law Enforcement Grants Special Revenue Fund 47 Development Impact Fees Special Revenue Fund 48 Fiduciary Fund – Agency Fund: 49 Statement of Changes in Fiduciary Assets and Liabilities 50 STATISTICAL SECTION Introduction to Statistical Section 51 Financial Trends: Net Assets by Component 52 Changes in Net Assets 53 Fund Balances of Governmental Funds 54 Changes in Fund Balances of Governmental Funds 55 Revenue Capacity: Assessed Value and Estimated Actual Value of Taxable Property 56 Direct and Overlapping Property Tax Rates 57 Principal Property Tax Payers 58 Property Tax Levies and Collections 59 Debt Capacity: Ratio of Outstanding Debt by Type 60 Ratio of General Bonded Debt 61 Direct and Overlapping Bonded Debt 62 Legal Debt Margin Information 63 Pledged Revenue Coverage 64 Demographic and Economic Statistics: Demographic and Economic Status 65 Employment by Industry 66 Operating Information: Full-time City Employees by Function 67 Operating Indicators by Function 68 Capital Asset Statistics by Function 69


v
CITY OF EASTVALE
LIST OF PRINCIPAL OFFICIALS
JUNE 30, 2012
CITY COUNCIL
JEFF DEGRANDPRE Mayor
KELLY HOWELL
Mayor Pro Tempore
RIC WELCH, Council Member ADAM RUSH, Council Member
IKE BOOTSMA, Council Member
CITY ADMINISTRATION
CAROL JACOBS City Manager
JOHN CAVANAUGH, City Attorney
TERRY SHEA, Finance Director
vi
PLANNING DIRECTOR
Principal Planner Assistant Planner
Landscape Architect
Public Information Officer Management Analyst
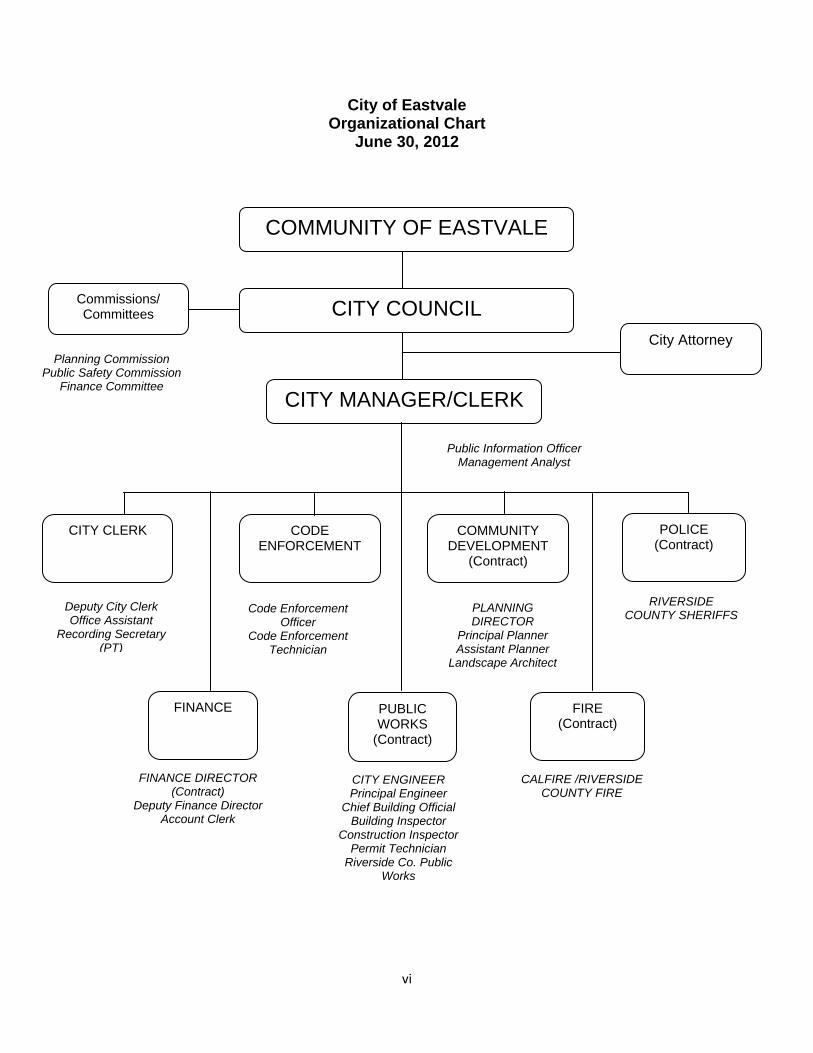
City of Eastvale Organizational Chart
June 30, 2012
COMMUNITY OF EASTVALE
CITY COUNCIL
CITY MANAGER/CLERK
Commissions/ Committees
FINANCE
CODE ENFORCEMENT
FIRE (Contract)
POLICE (Contract)
CITY CLERK
City Attorney Planning Commission
Public Safety Commission Finance Committee
Deputy City Clerk Office Assistant
Recording Secretary (PT)
CITY ENGINEER Principal Engineer
Chief Building Official Building Inspector
Construction Inspector Permit Technician
Riverside Co. Public Works
FINANCE DIRECTOR (Contract)
Deputy Finance Director Account Clerk
CALFIRE /RIVERSIDE COUNTY FIRE
RIVERSIDE COUNTY SHERIFFS
COMMUNITY DEVELOPMENT
(Contract)
Code Enforcement Officer
Code Enforcement Technician
PUBLIC WORKS
(Contract)


This page left blank intentionally.
ANNUAL FINANCIAL REPORT Fiscal Year Ended June 30, 2011
- 3 -
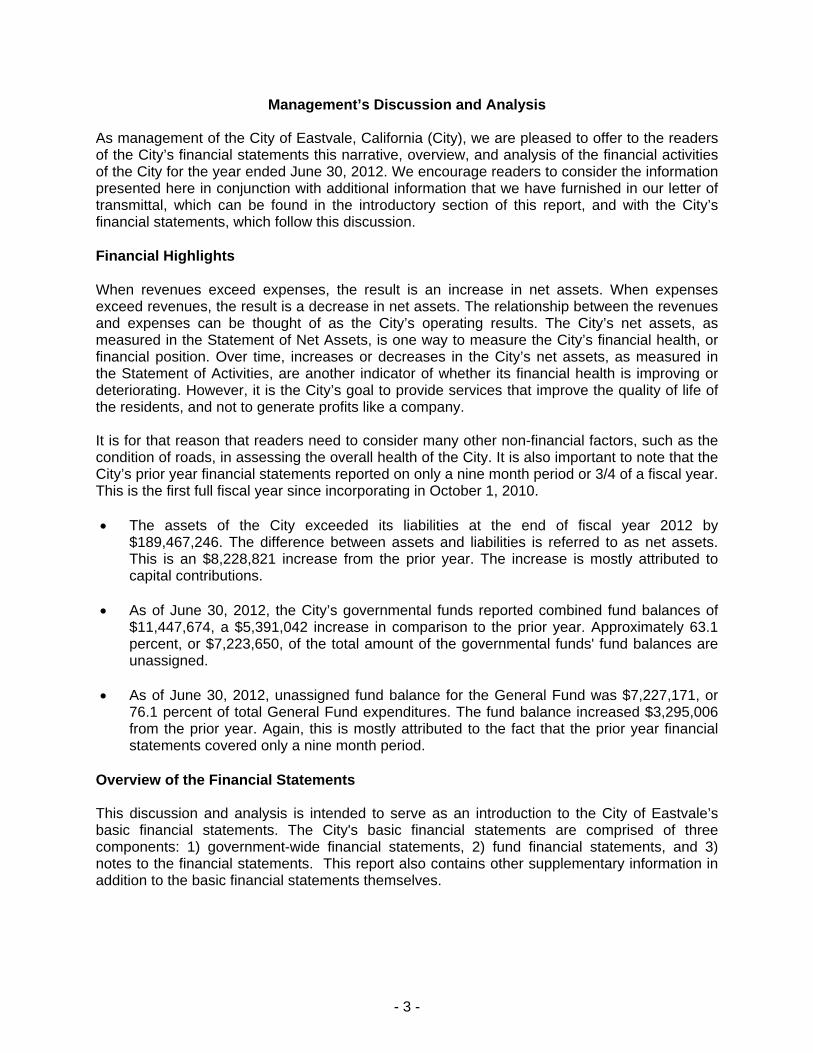
Management’s Discussion and Analysis As management of the City of Eastvale, California (City), we are pleased to offer to the readers of the City’s financial statements this narrative, overview, and analysis of the financial activities of the City for the year ended June 30, 2012. We encourage readers to consider the information presented here in conjunction with additional information that we have furnished in our letter of transmittal, which can be found in the introductory section of this report, and with the City’s financial statements, which follow this discussion. Financial Highlights When revenues exceed expenses, the result is an increase in net assets. When expenses exceed revenues, the result is a decrease in net assets. The relationship between the revenues and expenses can be thought of as the City’s operating results. The City’s net assets, as measured in the Statement of Net Assets, is one way to measure the City’s financial health, or financial position. Over time, increases or decreases in the City’s net assets, as measured in the Statement of Activities, are another indicator of whether its financial health is improving or deteriorating. However, it is the City’s goal to provide services that improve the quality of life of the residents, and not to generate profits like a company. It is for that reason that readers need to consider many other non-financial factors, such as the condition of roads, in assessing the overall health of the City. It is also important to note that the City’s prior year financial statements reported on only a nine month period or 3/4 of a fiscal year. This is the first full fiscal year since incorporating in October 1, 2010. The assets of the City exceeded its liabilities at the end of fiscal year 2012 by
$189,467,246. The difference between assets and liabilities is referred to as net assets. This is an $8,228,821 increase from the prior year. The increase is mostly attributed to capital contributions.
As of June 30, 2012, the City’s governmental funds reported combined fund balances of
$11,447,674, a $5,391,042 increase in comparison to the prior year. Approximately 63.1 percent, or $7,223,650, of the total amount of the governmental funds' fund balances are unassigned.
As of June 30, 2012, unassigned fund balance for the General Fund was $7,227,171, or
76.1 percent of total General Fund expenditures. The fund balance increased $3,295,006 from the prior year. Again, this is mostly attributed to the fact that the prior year financial statements covered only a nine month period.
Overview of the Financial Statements This discussion and analysis is intended to serve as an introduction to the City of Eastvale’s basic financial statements. The City's basic financial statements are comprised of three components: 1) government-wide financial statements, 2) fund financial statements, and 3) notes to the financial statements. This report also contains other supplementary information in addition to the basic financial statements themselves.

- 4 -
Government-wide financial statements: The government-wide financial statements are designed to provide readers with a broad overview of the City’s finances, in a manner that is similar to a private-sector business. Government-wide financial statements include a statement of net assets and a statement of activities. The statement of net assets presents information on all of the City’s assets and liabilities, with the difference between the two reported as net assets. Over time, increases or decreases may provide a useful indicator on whether the financial position of the City is improving or deteriorating. The statement of activities provides information showing how the City’s net assets changed during the most recent fiscal year. These changes are reported using the full accrual basis of accounting, that is, when the economic event occurs, rather than when cash is received or paid. Under this basis of accounting, revenues and expenses are reported in the statement for some items that will only result in future cash inflows or outflows such as vacation earned but not paid and uncollected taxes. Both of the government-wide financial statements distinguish functions of the City that are principally supported by taxes and intergovernmental revenues (government activities) from other functions that are intended to recover all or a significant portion of their costs through user fees and charges (business-type activities). The governmental activities of the City include general government, public safety, economic development, building and planning, animal control, and public works. The City does not have any business-type activities. The government-wide financial statements can be found in the Table of Contents under the heading Basic Financial Statements. Fund financial statements: A fund is a grouping of related accounts that is used to maintain control over resources that have been segregated for specific activities or objectives. The City, like other state and local governments, uses fund accounting to ensure and demonstrate compliance with finance-related legal requirements. The funds of the City can be divided into two categories: governmental funds and fiduciary funds. Governmental funds: Governmental funds are used to account for essentially the same functions reported as governmental activities in the government-wide financial statements. However, unlike government-wide financial statements, governmental fund financial statements focus on near-term inflows and outflows of spendable resources, as well as on balances of spendable resources available at the end of the fiscal year. Such information may be useful in evaluating the City’s near-term financing requirements. Because the focus of governmental funds is narrower than that of the government-wide financial statements, it is useful to compare the information presented for governmental funds with similar information presented for governmental activities in the government-wide financial statements. By doing so, readers may better understand the long-term impact of the City’s near-term financing decisions. Both the governmental fund balance sheet and the governmental fund statement of revenues, expenditures and changes in fund balances provide a reconciliation to facilitate this comparison between governmental funds and governmental activities.

- 5 -
The City maintains nine individual governmental funds for financial reporting purposes. Information is presented separately in the governmental fund balance sheet and in the governmental fund statement of revenues, expenditures and changes in fund balance for the General Fund, and Gas Tax Special Revenue Fund, which are considered to be major funds. Data from the remaining governmental funds are combined into a single, aggregated presentation. Individual fund data for each of these nonmajor governmental funds is provided in the form of combining statements elsewhere in this report. The City adopts an annual appropriated budget for its general fund, special revenue funds, debt service fund and capital projects fund. A budgetary comparison statement has been provided for the General Fund to demonstrate compliance with this budget. The governmental fund financial statements can be found in the Table of Contents under the heading Basic Financial Statements. Fiduciary funds: Fiduciary funds are used to account for resources held for the benefit of parties outside the City. Fiduciary funds are not included in the government-wide financial statements because the resources of those funds are not available to support the City’s own programs. The basic fiduciary fund financial statements can be found in the Table of Contents under the heading Basic Financial Statements. Notes to the basic financial statements: The notes to the basic financial statements provide additional information that is essential for a full understanding of the data provided in the government-wide and fund financial statements. The notes to the basic financial statements can be found in the Table of Contents under the heading Notes to the Financial Statements. Other supplementary information: In addition to the basic financial statements and accompanying notes, this report also presents certain required supplementary information (RSI), about the City’s General Fund and the Gas Tax Fund budgetary comparison. The combining statements referred to earlier in connection with nonmajor governmental funds are presented for all non-major Special Revenue Funds. The supplementary financial information also includes budgetary comparison schedules for the nonmajor governmental funds to demonstrate compliance with the annual budget as adopted and amended. The Required Supplementary Information can be found following the Notes to Financial Statements. The combining statements for nonmajor governmental funds and the budgetary comparison schedules for the nonmajor governmental funds can be found following the Required Supplementary Information.
- 6 -
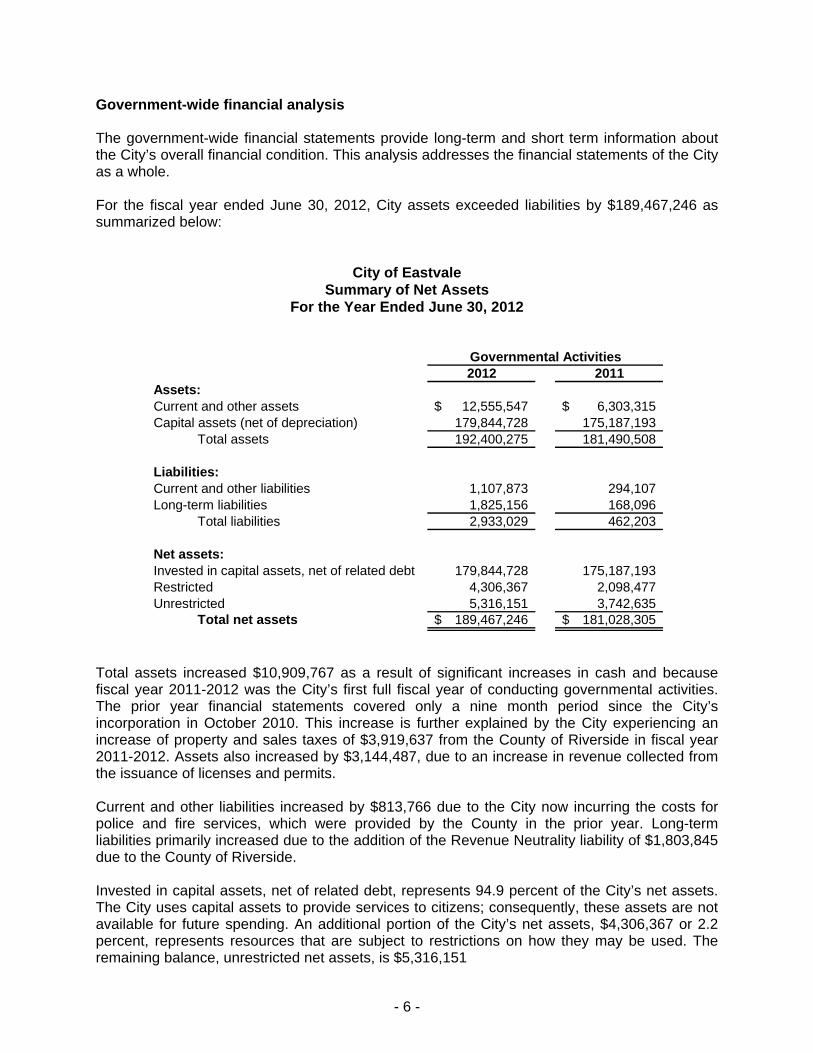
Government-wide financial analysis The government-wide financial statements provide long-term and short term information about the City’s overall financial condition. This analysis addresses the financial statements of the City as a whole. For the fiscal year ended June 30, 2012, City assets exceeded liabilities by $189,467,246 as summarized below:
City of Eastvale Summary of Net Assets
For the Year Ended June 30, 2012
2012 2011Assets:Current and other assets 12,555,547$ 6,303,315$ Capital assets (net of depreciation) 179,844,728 175,187,193
Total assets 192,400,275 181,490,508
Liabilities:Current and other liabilities 1,107,873 294,107 Long-term liabilities 1,825,156 168,096
Total liabilities 2,933,029 462,203
Net assets:Invested in capital assets, net of related debt 179,844,728 175,187,193 Restricted 4,306,367 2,098,477 Unrestricted 5,316,151 3,742,635
Total net assets 189,467,246$ 181,028,305$
Governmental Activities
Total assets increased $10,909,767 as a result of significant increases in cash and because fiscal year 2011-2012 was the City’s first full fiscal year of conducting governmental activities. The prior year financial statements covered only a nine month period since the City’s incorporation in October 2010. This increase is further explained by the City experiencing an increase of property and sales taxes of $3,919,637 from the County of Riverside in fiscal year 2011-2012. Assets also increased by $3,144,487, due to an increase in revenue collected from the issuance of licenses and permits. Current and other liabilities increased by $813,766 due to the City now incurring the costs for police and fire services, which were provided by the County in the prior year. Long-term liabilities primarily increased due to the addition of the Revenue Neutrality liability of $1,803,845 due to the County of Riverside. Invested in capital assets, net of related debt, represents 94.9 percent of the City’s net assets. The City uses capital assets to provide services to citizens; consequently, these assets are not available for future spending. An additional portion of the City’s net assets, $4,306,367 or 2.2 percent, represents resources that are subject to restrictions on how they may be used. The remaining balance, unrestricted net assets, is $5,316,151

- 7 -
Statement of Activities: The statement of activities shows how the City’s net assets changed during the fiscal year 2011-2012. Provided below is a summary of changes in net assets.
City of Eastvale Summary of Changes in Net Assets For the Year Ended June 30, 2012
2012 2011Revenues:Program Revenues:
Charges for services 2,468,363$ 915,095$ Operating grants and contributions 2,940,491 1,898,712 Capital grants and contributions 9,533,039 179,045,821
General revenues 10,208,769 9,480,866 Total revenues 25,150,662 191,340,494
Expenses:General government 1,390,673 902,794 Public safety 6,107,083 4,458,890 Public works 5,628,714 3,928,435 Community development 1,991,526 1,021,939 Revenue Neutrality 1,803,845 - Interest on long term debt - 131
Total expenses 16,921,841 10,312,189
Increase in net assets 8,228,821 181,028,305
Net assets beginning, as restated 181,238,425 - Net assets ending 189,467,246$ 181,028,305$
Governmental Activities
The City’s total revenues were $25,150,662, while the total cost of all programs and services was $16,921,841. Total revenues decreased $166,189,832 from the prior year. The change is mainly due to a decrease of $169,512,782 in capital grants and contributions. Although total revenues decreased overall, it is important to note that all other revenues, except for capital grants and contributions, increased by $3,322,950. The increase is attributable to this being the City’s first full fiscal year since incorporation and an increase in sales tax. Total expenses increased $6,609,652 over the prior year. The increase in expenses is due to fiscal year 2011-2012 being the first full year since incorporation. The prior year fiscal year covered only 9-months of operations whereas this fiscal year recorded expenses for a full fiscal year.

- 8 -
The charts below provide graphic representation of the City’s expenses compared to program revenues by function and its revenue by source. As noted earlier, it is important to take into consideration that the City’s prior year financial statements reported on only a 9 month period or 3/4 of a fiscal year. This is the first full fiscal year since incorporating in October 1, 2010.
‐
2,000,000
4,000,000
6,000,000
8,000,000
10,000,000
12,000,000
14,000,000
Expenses and Program Revenues ‐ Governmental Activities
Expenses Program revenues
Property taxes, levied for general
purpose18%
Franchise tax5%
Sales taxes16%
Motor vehicle in lieu tax
0%
Other taxes1%
Other0%
Charges for services10%
Operating grants and contributions
12%
Capital grants and contributions
38%
Revenues by source ‐ Governmental Activities

- 9 -
The governmental activities’ expense and program revenue chart is designed to reflect expenses associated with each City function and the revenues that are directly attributable to each function. It is important to note that general revenues such as property, sales and other taxes are not directly attributable to specific functions and are therefore used to support program activities citywide. Regarding the revenues by source chart, it shows that 18 percent of governmental activities revenues came from property tax. Financial Analysis of City’s Funds As noted earlier, the City uses fund accounting to ensure and demonstrate compliance with finance related legal requirements. Governmental Funds: The focus of the City’s governmental funds is to provide information on near-term inflows, outflows, and balances of spendable resources. Such information is useful in assessing the City’s financing requirements. In particular, unreserved fund balance may serve as a useful measure of the City’s net resources available for spending at the end of the fiscal year. As of June 30, 2012, the City’s governmental funds reported combined ending fund balances of $11,447,674. Of the $11,447,674, $7,223,650 or 63.1 percent constitutes unassigned fund balance. The remainder of fund balance is nonspendable or restricted to indicate that it is not available for new spending or constraints are placed on the use of resources, respectively. General Fund Financial and Budgetary Highlights The General Fund is the chief operating fund of the City. At June 30, 2012, unassigned fund balance was $7,227,171. As a measure of the General Fund’s financial condition, it may be useful to compare the unassigned fund balance to total expenditures. Unassigned fund balance represents 76.1 percent of General Fund expenditures. Overall, General Fund revenues for fiscal year ended June 30, 2012 totaled $12.7 million, compared to $10.4, million for the previous year. The major components are property taxes ($5 million), sales taxes ($4 million), and franchise taxes ($1.3 million). General Fund expenditures totaled $9.5 million for the fiscal year ended June 30, 2012, compared to $6.5 million for the previous year. Both revenues and expenditures were significantly higher than the previous year because fiscal year 2011-2012 was the first full fiscal year in the City’s existence. The differences between General Fund budget and actual are summarized below: General Fund actual revenues were above budget by $661,936.
Actual expenditures were $1,156,805 less than the budgeted amount of $10,650,785.

- 10 -
Capital Assets and Debt Administration Capital Assets: City investment in capital assets for its governmental type activities as of June 30, 2012, amounted to $179,844,728 (net of accumulated depreciation). During the year, $9,604,028 of capital assets were added for the governmental activities. Major capital assets events during the current fiscal year included the following: Purchase of software $156,200. Infrastructure assets donated by private sources to the City $9,429,497. Additional
information on the City’s capital assets can be found in note 5 to the basic financial statements and a summary is provided below.
City of Eastvale Summary of Capital Assets (net of depreciation)
2012 2011
Leashold improvements 28,380$ 23,093$ Machinery, equipment and vehicle 52,334 56,898 Software 145,043 - Infrastructure 179,618,971 175,107,202
Total 179,844,728$ 175,187,193$
Governmental Activities
Long-term debt: At the end of fiscal year 2012, the City‘s total long-term debt outstanding was $1,825,156. This amount was comprised of $1,803,845 in Revenue Neutrality and $21,311 in compensated absences. Outstanding long-term debt of the City is summarized below and additional information can be found in note 6 to the basic financial statements.
City of Eastvale Summary Outstanding Long-Term Debt
2012 2011
Revenue Neutrality 1,803,845$ -$ Compensated absences 21,311 5,400 Loan payable - County of Riverside - 210,120
Total long-term debt 1,825,156$ 215,520$
Governmental Activities

- 11 -
Economic Factors and Next Year’s Budget After the adoption of the City’s Fiscal Year 2011/12 Budget, the State of California on June 28, 2011 approved SB 89 which eliminated Vehicle License Fees, which was a subvention collected by the State and allocated to cities. The City of Eastvale lost approximately $3.4M for fiscal year 2011/12. The fiscal year 2012/13 City budget was prepared conservatively. Property tax estimates were projected with minimal growth from the previous fiscal year and there were no tax rate or fee increases as part of the preparation of and adoption of the 2012/13 Budget. The only revenue with significant budgeted increases was Sales Tax and the increase over the prior year budgeted amount was $1.3M. The General Fund budget for fiscal year 2012-13 anticipates using $516,990 of available reserves. Requests for Information This financial report is designed to provide a general overview of the City’s finances for all those with interest in the government’s finances. Questions concerning any of the information provided in this report, or requests for additional information should be addressed to the City Clerk, City of Eastvale, 12363 Limonite Ave. Suite 910, Eastvale, California 91752, or call (951) 361-0900.

This page left blank intentionally.
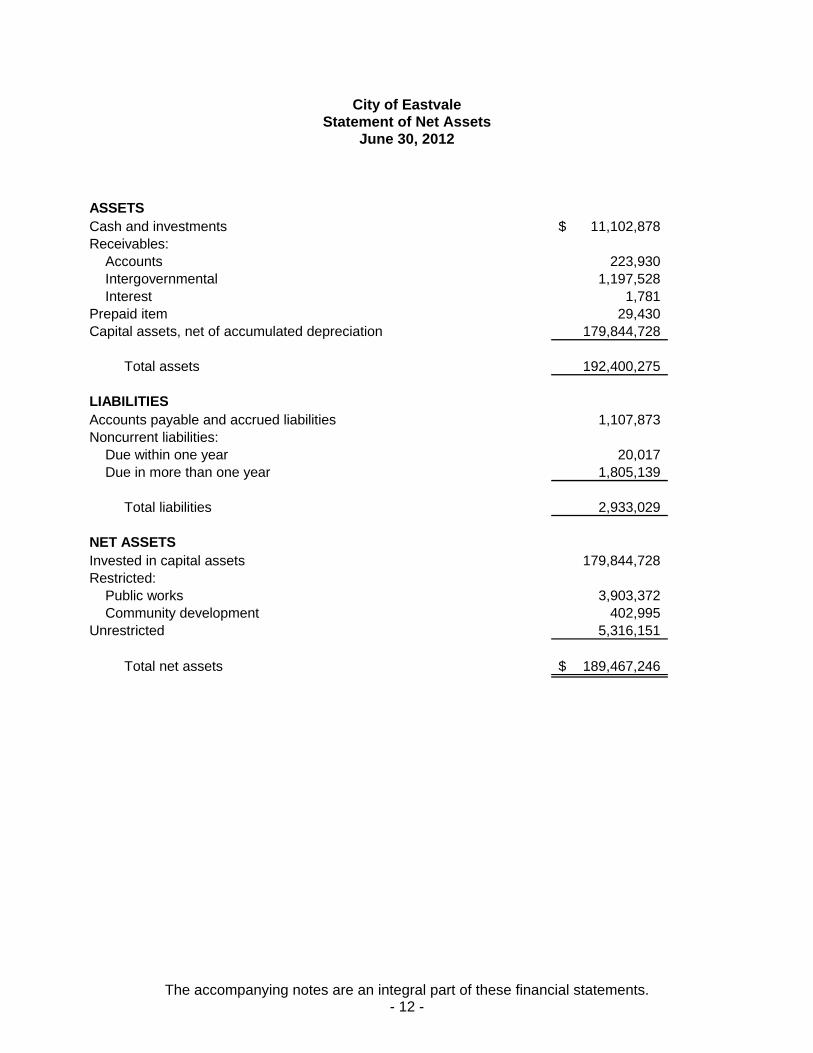
The accompanying notes are an integral part of these financial statements. - 12 -
City of Eastvale Statement of Net Assets
June 30, 2012
ASSETSCash and investments 11,102,878$ Receivables:
Accounts 223,930 Intergovernmental 1,197,528 Interest 1,781
Prepaid item 29,430 Capital assets, net of accumulated depreciation 179,844,728
Total assets 192,400,275
LIABILITIESAccounts payable and accrued liabilities 1,107,873 Noncurrent liabilities:
Due within one year 20,017 Due in more than one year 1,805,139
Total liabilities 2,933,029
NET ASSETSInvested in capital assets 179,844,728 Restricted:
Public works 3,903,372 Community development 402,995
Unrestricted 5,316,151
Total net assets 189,467,246$
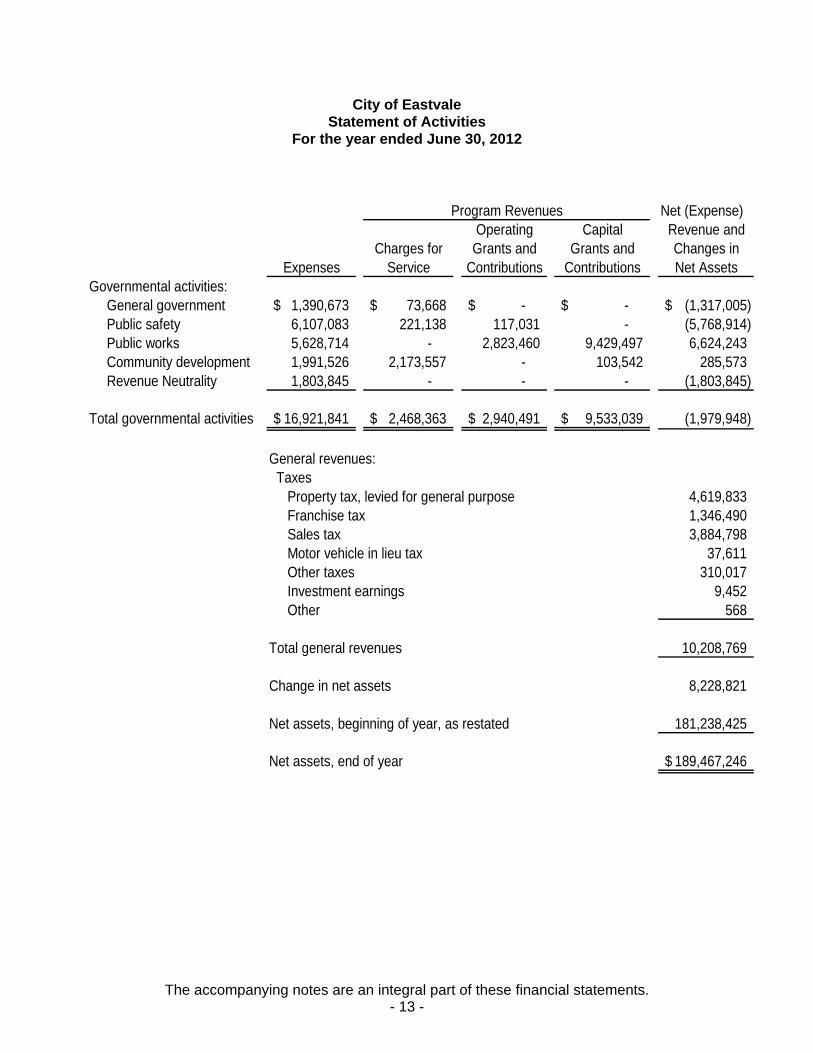
The accompanying notes are an integral part of these financial statements. - 13 -
City of Eastvale Statement of Activities
For the year ended June 30, 2012
Net (Expense)Operating Capital Revenue and
Charges for Grants and Grants and Changes inExpenses Service Contributions Contributions Net Assets
Governmental activities:General government 1,390,673$ 73,668$ -$ -$ (1,317,005)$ Public safety 6,107,083 221,138 117,031 - (5,768,914) Public works 5,628,714 - 2,823,460 9,429,497 6,624,243 Community development 1,991,526 2,173,557 - 103,542 285,573 Revenue Neutrality 1,803,845 - - - (1,803,845)
Total governmental activities 16,921,841$ 2,468,363$ 2,940,491$ 9,533,039$ (1,979,948)
General revenues: Taxes Property tax, levied for general purpose 4,619,833 Franchise tax 1,346,490 Sales tax 3,884,798 Motor vehicle in lieu tax 37,611 Other taxes 310,017 Investment earnings 9,452 Other 568
Total general revenues 10,208,769
Change in net assets 8,228,821
Net assets, beginning of year, as restated 181,238,425
Net assets, end of year 189,467,246$
Program Revenues

The accompanying notes are an integral part of these financial statements. - 14 -
City of Eastvale Balance Sheet
Governmental Funds June 30, 2012
Total Nonmajor Total
Governmental GovernmentalGeneral Gas Tax Funds Funds
ASSETSCash and investments 7,180,382$ 2,448,869$ 1,473,627$ 11,102,878$ Receivables:
Accounts 223,930 - - 223,930 Intergovernmental 818,401 210,234 168,893 1,197,528 Interest 1,781 - - 1,781
Prepaid items 29,430 - - 29,430 Due from other funds 39,393 - - 39,393
Total assets 8,293,317$ 2,659,103$ 1,642,520$ 12,594,940$
LIABILITIES AND FUND BALANCESLiabilities:
Accounts payable 1,036,716$ 62,284$ 8,873$ 1,107,873$ Due to other funds - - 39,393 39,393
Total liabilities 1,036,716 62,284 48,266 1,147,266
Fund Balances:Nonspendable 29,430 - - 29,430 Restricted - 2,596,819 1,597,775 4,194,594 Unassigned 7,227,171 - (3,521) 7,223,650
Total fund balances 7,256,601 2,596,819 1,594,254 11,447,674
Total liabilities and fund balances 8,293,317$ 2,659,103$ 1,642,520$ 12,594,940$
FundsRevenueSpecial

The accompanying notes are an integral part of these financial statements. - 15 -
City of Eastvale Reconciliation of the Balance Sheet of
Governmental Funds to the Statement of Net Assets June 30, 2012
Fund balances of governmental funds 11,447,674$
assets are different because:
resources and, therefore, are not reported in the funds. 179,844,728
the statement of net assets.
Revenue Neutrality (1,803,845) Compensated absences (21,311)
Net assets of governmental activities 189,467,246$
as fund liabilities. All liabilities, both current and long-term are reported in
Long-term liabilities applicable to the City governmental activities are not
Capital assets used in governmental activities are not financial
Amounts reported for governmental activities in the statement of net
due and payable in the current period and accordingly are not reported
The accompanying notes are an integral part of these financial statements. - 16 -
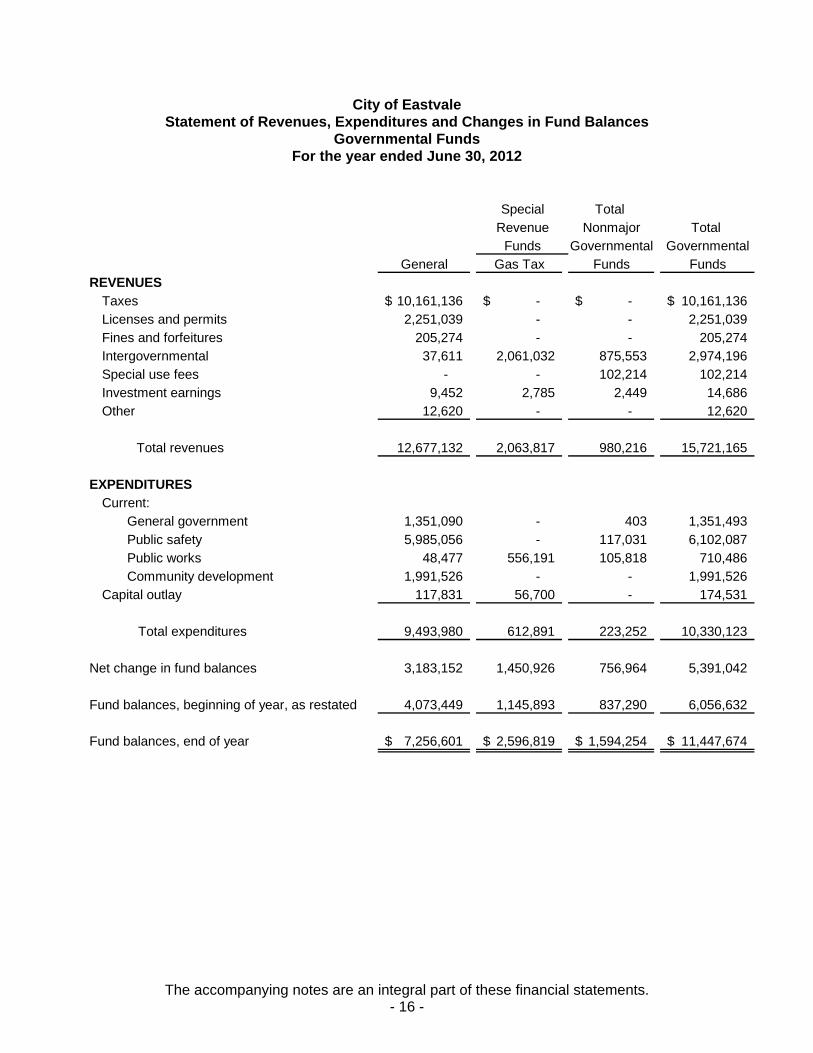
City of Eastvale Statement of Revenues, Expenditures and Changes in Fund Balances
Governmental Funds For the year ended June 30, 2012
Total Nonmajor Total
Governmental GovernmentalGeneral Gas Tax Funds Funds
REVENUESTaxes 10,161,136$ -$ -$ 10,161,136$ Licenses and permits 2,251,039 - - 2,251,039 Fines and forfeitures 205,274 - - 205,274 Intergovernmental 37,611 2,061,032 875,553 2,974,196 Special use fees - - 102,214 102,214 Investment earnings 9,452 2,785 2,449 14,686 Other 12,620 - - 12,620
Total revenues 12,677,132 2,063,817 980,216 15,721,165
EXPENDITURESCurrent:
General government 1,351,090 - 403 1,351,493 Public safety 5,985,056 - 117,031 6,102,087 Public works 48,477 556,191 105,818 710,486 Community development 1,991,526 - - 1,991,526
Capital outlay 117,831 56,700 - 174,531
Total expenditures 9,493,980 612,891 223,252 10,330,123
Net change in fund balances 3,183,152 1,450,926 756,964 5,391,042
Fund balances, beginning of year, as restated 4,073,449 1,145,893 837,290 6,056,632
Fund balances, end of year 7,256,601$ 2,596,819$ 1,594,254$ 11,447,674$
RevenueFunds
Special

The accompanying notes are an integral part of these financial statements. - 17 -
City of Eastvale Reconciliation of the Statement of Revenues,
Expenditures and Changes in Fund Balances of Governmental Funds to the Statement of Activities
For the year ended June 30, 2012
Net change in fund balances - total governmental funds 5,391,042$
different because:
resources. 9,429,497
capitalization threshold. This activity is reconciled as follows:
Cost of assets capitalized 174,531 Depreciation expense (4,946,493)
as expenditures in the governmental funds:
Increase in accrued compensated absences payable (15,911) Increase in Revenue Neutrality (1,803,845)
Change in net assets of governmental activities 8,228,821$
Some expenses reported in the statement of activities do not requirethe use of current financial resources and therefore are not reported
statement of activities, the cost of those assets are allocated over theirestimated useful lives and reported as depreciation expense or areallocated to the appropriate functional expense when the cost is below the
Governmental funds report capital outlays as expenditures. However, in the
Amounts reported for governmental activities in the statement of activities are
Donations of capital assets increase net assets in the statement of activities,but do not appear in the governmental funds because they are not financial
The accompanying notes are an integral part of these financial statements. - 18 -
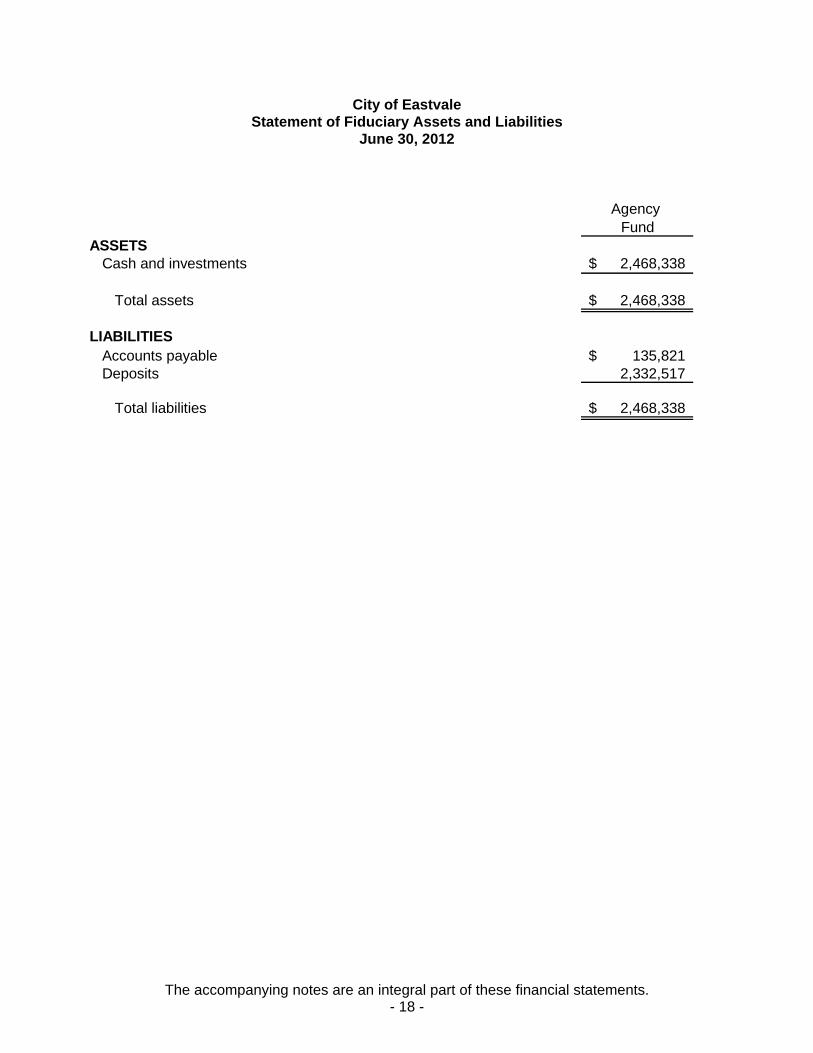
City of Eastvale Statement of Fiduciary Assets and Liabilities
June 30, 2012
Agency Fund
ASSETSCash and investments 2,468,338$
Total assets 2,468,338$
LIABILITIESAccounts payable 135,821$ Deposits 2,332,517
Total liabilities 2,468,338$
- 19 -
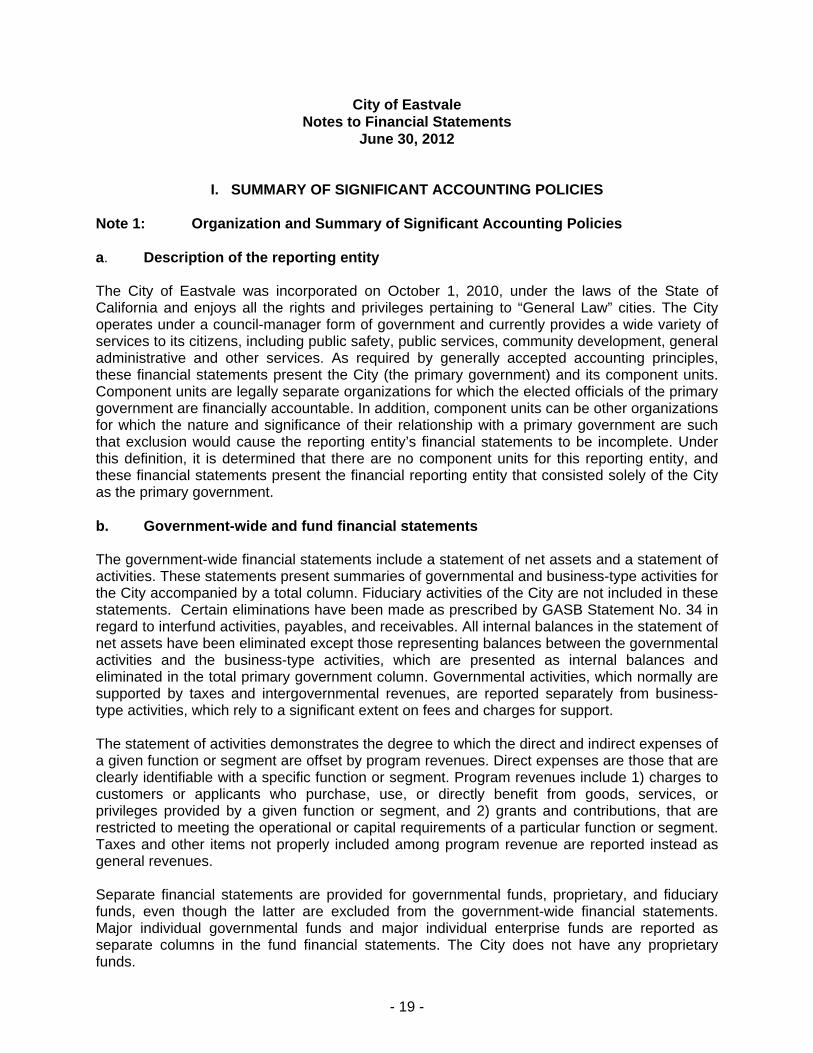
City of Eastvale Notes to Financial Statements
June 30, 2012
I. SUMMARY OF SIGNIFICANT ACCOUNTING POLICIES Note 1: Organization and Summary of Significant Accounting Policies a. Description of the reporting entity
The City of Eastvale was incorporated on October 1, 2010, under the laws of the State of California and enjoys all the rights and privileges pertaining to “General Law” cities. The City operates under a council-manager form of government and currently provides a wide variety of services to its citizens, including public safety, public services, community development, general administrative and other services. As required by generally accepted accounting principles, these financial statements present the City (the primary government) and its component units. Component units are legally separate organizations for which the elected officials of the primary government are financially accountable. In addition, component units can be other organizations for which the nature and significance of their relationship with a primary government are such that exclusion would cause the reporting entity’s financial statements to be incomplete. Under this definition, it is determined that there are no component units for this reporting entity, and these financial statements present the financial reporting entity that consisted solely of the City as the primary government. b. Government-wide and fund financial statements The government-wide financial statements include a statement of net assets and a statement of activities. These statements present summaries of governmental and business-type activities for the City accompanied by a total column. Fiduciary activities of the City are not included in these statements. Certain eliminations have been made as prescribed by GASB Statement No. 34 in regard to interfund activities, payables, and receivables. All internal balances in the statement of net assets have been eliminated except those representing balances between the governmental activities and the business-type activities, which are presented as internal balances and eliminated in the total primary government column. Governmental activities, which normally are supported by taxes and intergovernmental revenues, are reported separately from business-type activities, which rely to a significant extent on fees and charges for support. The statement of activities demonstrates the degree to which the direct and indirect expenses of a given function or segment are offset by program revenues. Direct expenses are those that are clearly identifiable with a specific function or segment. Program revenues include 1) charges to customers or applicants who purchase, use, or directly benefit from goods, services, or privileges provided by a given function or segment, and 2) grants and contributions, that are restricted to meeting the operational or capital requirements of a particular function or segment. Taxes and other items not properly included among program revenue are reported instead as general revenues. Separate financial statements are provided for governmental funds, proprietary, and fiduciary funds, even though the latter are excluded from the government-wide financial statements. Major individual governmental funds and major individual enterprise funds are reported as separate columns in the fund financial statements. The City does not have any proprietary funds.
- 20 -
City of Eastvale Notes to Financial Statements
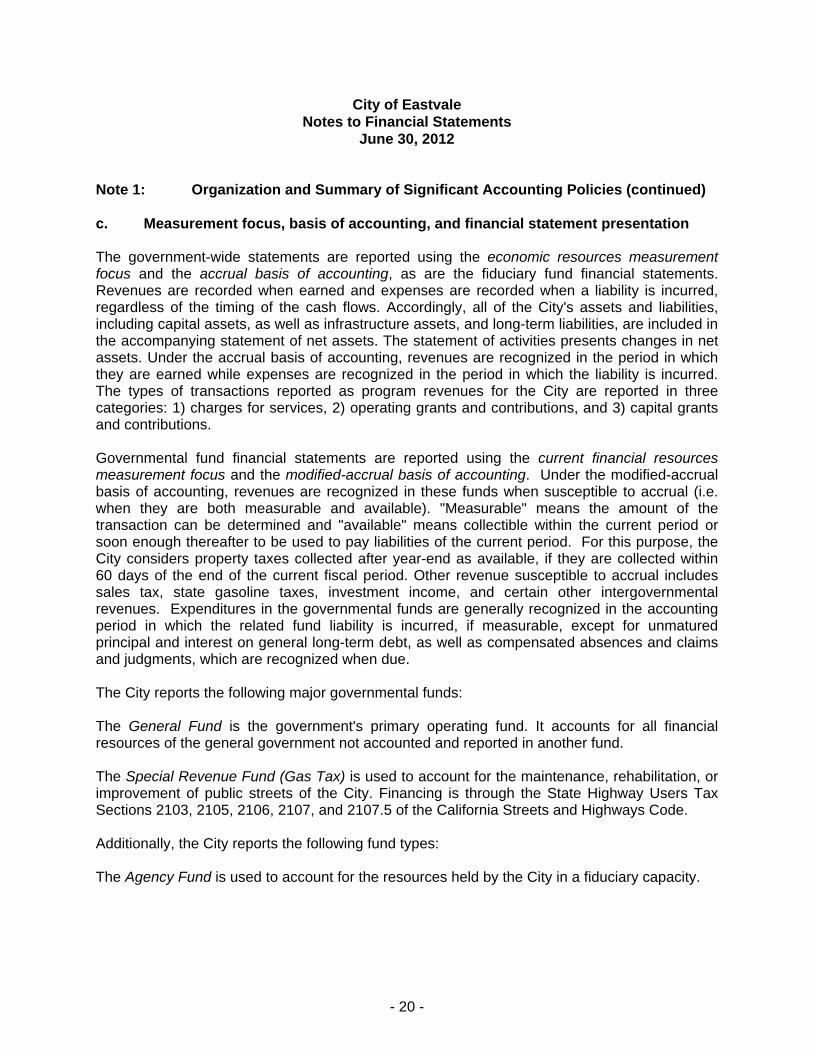
June 30, 2012
Note 1: Organization and Summary of Significant Accounting Policies (continued) c. Measurement focus, basis of accounting, and financial statement presentation The government-wide statements are reported using the economic resources measurement focus and the accrual basis of accounting, as are the fiduciary fund financial statements. Revenues are recorded when earned and expenses are recorded when a liability is incurred, regardless of the timing of the cash flows. Accordingly, all of the City's assets and liabilities, including capital assets, as well as infrastructure assets, and long-term liabilities, are included in the accompanying statement of net assets. The statement of activities presents changes in net assets. Under the accrual basis of accounting, revenues are recognized in the period in which they are earned while expenses are recognized in the period in which the liability is incurred. The types of transactions reported as program revenues for the City are reported in three categories: 1) charges for services, 2) operating grants and contributions, and 3) capital grants and contributions. Governmental fund financial statements are reported using the current financial resources measurement focus and the modified-accrual basis of accounting. Under the modified-accrual basis of accounting, revenues are recognized in these funds when susceptible to accrual (i.e. when they are both measurable and available). "Measurable" means the amount of the transaction can be determined and "available" means collectible within the current period or soon enough thereafter to be used to pay liabilities of the current period. For this purpose, the City considers property taxes collected after year-end as available, if they are collected within 60 days of the end of the current fiscal period. Other revenue susceptible to accrual includes sales tax, state gasoline taxes, investment income, and certain other intergovernmental revenues. Expenditures in the governmental funds are generally recognized in the accounting period in which the related fund liability is incurred, if measurable, except for unmatured principal and interest on general long-term debt, as well as compensated absences and claims and judgments, which are recognized when due. The City reports the following major governmental funds: The General Fund is the government's primary operating fund. It accounts for all financial resources of the general government not accounted and reported in another fund. The Special Revenue Fund (Gas Tax) is used to account for the maintenance, rehabilitation, or improvement of public streets of the City. Financing is through the State Highway Users Tax Sections 2103, 2105, 2106, 2107, and 2107.5 of the California Streets and Highways Code. Additionally, the City reports the following fund types: The Agency Fund is used to account for the resources held by the City in a fiduciary capacity.

- 21 -
City of Eastvale Notes to Financial Statements
June 30, 2012
Note 1: Organization and Summary of Significant Accounting Policies (continued) Private-sector standards of accounting and financial reporting issued prior to December 1, 1989, generally are followed in both the government-wide and proprietary fund financial statements to the extent that those standards do not conflict with or contradict guidance of the Governmental Accounting Standards Board. As a general rule, the effect of interfund activity has been eliminated from the government-wide financial statements. Amounts reported as program revenues include 1) charges to customers or applicants for goods, services, or privileges provided, 2) operating grants and contributions, and 3) capital grants and contributions, including special assessments. Internally dedicated resources are reported as general revenues rather than as program revenues. Likewise, general revenues include all taxes. When both restricted and unrestricted resources are available for use, it is the City’s policy to use the restricted resources first, and then unrestricted resources, as they are needed. Other Accounting Policies Deposits and investments The City’s cash and cash equivalents are considered to be cash on hand, demand deposits, and short-term investments with original maturities of three months or less from the date of acquisition. Investments are reported at fair value. The City’s policy is to hold investments until maturity or until market values equal or exceed cost. Receivables and payables Activity between funds that are representative of lending/borrowing arrangements outstanding at the end of the fiscal year are referred to as either "due to/from other funds" (i.e., the current portion of interfund loans) or "advances to/from other funds" (i.e., the non-current portion of interfund loans). All other outstanding balances between funds are reported as "due to/from other funds". Any residual balances outstanding are reported in the governmental-wide financial statements as “internal balances”.
- 22 -
City of Eastvale Notes to Financial Statements
June 30, 2012
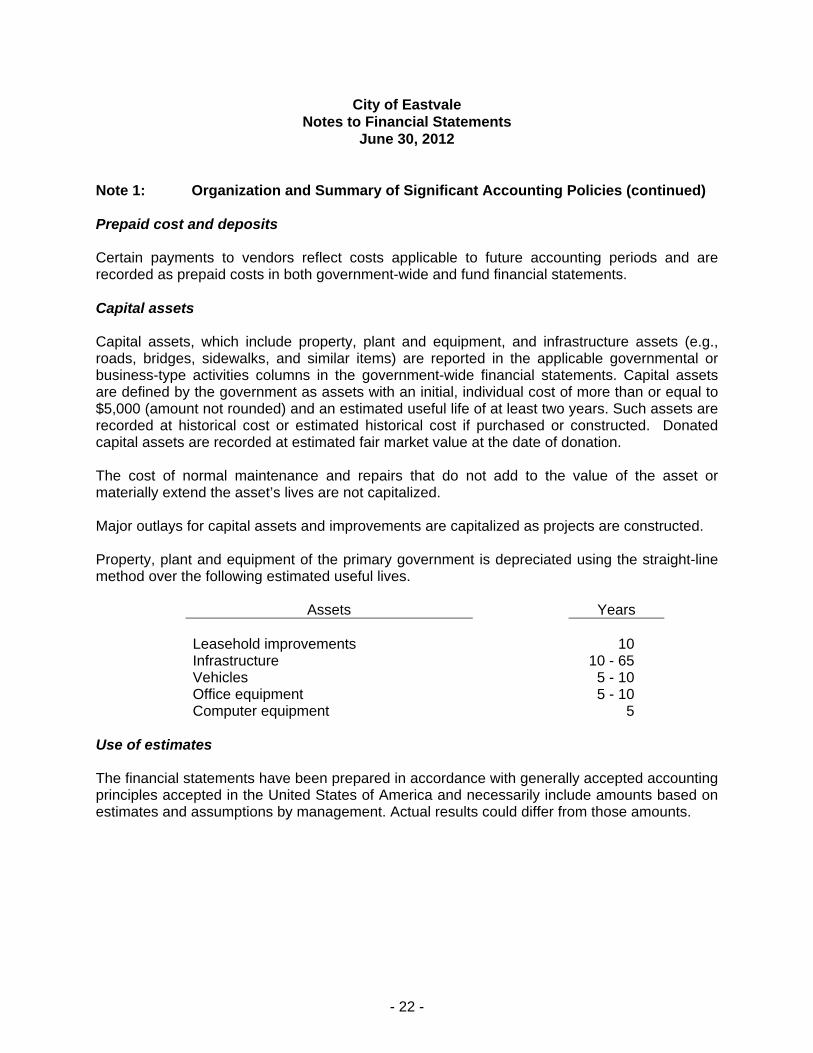
Note 1: Organization and Summary of Significant Accounting Policies (continued) Prepaid cost and deposits Certain payments to vendors reflect costs applicable to future accounting periods and are recorded as prepaid costs in both government-wide and fund financial statements. Capital assets Capital assets, which include property, plant and equipment, and infrastructure assets (e.g., roads, bridges, sidewalks, and similar items) are reported in the applicable governmental or business-type activities columns in the government-wide financial statements. Capital assets are defined by the government as assets with an initial, individual cost of more than or equal to $5,000 (amount not rounded) and an estimated useful life of at least two years. Such assets are recorded at historical cost or estimated historical cost if purchased or constructed. Donated capital assets are recorded at estimated fair market value at the date of donation. The cost of normal maintenance and repairs that do not add to the value of the asset or materially extend the asset’s lives are not capitalized. Major outlays for capital assets and improvements are capitalized as projects are constructed.
Property, plant and equipment of the primary government is depreciated using the straight-line method over the following estimated useful lives.
Assets Years Leasehold improvements 10 Infrastructure 10 - 65 Vehicles 5 - 10 Office equipment 5 - 10 Computer equipment 5
Use of estimates The financial statements have been prepared in accordance with generally accepted accounting principles accepted in the United States of America and necessarily include amounts based on estimates and assumptions by management. Actual results could differ from those amounts.

- 23 -
City of Eastvale Notes to Financial Statements
June 30, 2012
Note 1: Organization and Summary of Significant Accounting Policies (continued) Compensated absences The City provides to its employees a comprehensive annual leave program. Leave pay is payable at the time it is taken or upon termination. The total amount of liability for compensated absences is segregated between short-term and long-term with both portions reflected in the government-wide statements. The short-term portion is determined to be the amount due to employees for future absences which is attributable to services already rendered and which is expected to be paid during the next fiscal year. Long-term obligations In the government-wide financial statements, long-term debt and other long-term obligations are reported as liabilities in the applicable governmental activities, statement of net assets. Bond premiums and discounts, as well as issuance costs, are deferred and amortized over the life of the bonds using the straight-line method. Bonds payable are reported net of the applicable bond premium or discount. Bond issuance costs are reported as deferred charges and amortized over the term of the related debt. In the fund financial statements, governmental fund types recognize bond premiums and discounts, as well as bond issuance costs, during the current period. The face amount of debt issued is reported as other financing sources. Premiums received on debt issuances are reported as other financing sources while discounts on debt issuances are reported as other financing uses. Issuance costs, whether or not withheld from the actual debt proceeds received, are reported as expenditures. Property taxes The County of Riverside collects property taxes for the City. Tax liens attach annually as of 12:01 A.M. on the first day in January preceding the fiscal year for which the taxes are levied. The tax levy covers the fiscal period July 1st to June 30th. All secured personal property taxes and one-half of the taxes on real property are due November 1st, the second installment is due February 1st. All taxes are delinquent, if unpaid, on December 10th and April 10th respectively. Unsecured personal property taxes become due on the first of March each year and are delinquent, if unpaid, on August 31st.

- 24 -
City of Eastvale Notes to Financial Statements
June 30, 2012
Note 1: Organization and Summary of Significant Accounting Policies (continued) Unearned revenues In the government-wide financial statements and the fund financial statements, unearned revenues represent cash advances by various grantors that have not been spent; therefore no revenue has been recognized. Fund equity The City implemented GASB Statement No. 54, Fund Balance Reporting and Governmental Fund Type Definitions. This statement provides more clearly defined fund balance categories to make the nature and extent of the constraints placed on a government’s fund balance more transparent. The following classifications describe the relative strength of the spending constraints placed on the purposes for which resources can be used:
Nonspendable – amounts that are not in a spendable form (such as inventory) or are required to be maintained intact. Restricted – amounts constrained to specific purposes by their providers (such as grantors, bondholders and higher levels of government), through constitutional provisions or by enabling legislation. Committed – amounts constrained to specific purposes by a government itself, using the highest level of decision-making authority; to be reported as committed, amounts cannot be used for any other purpose unless the government takes the same highest level action to remove or change the constraint. Assigned – amounts a government intends to use for a specific purpose; intent can be expressed by the governing body or by an official or body to which the governing body delegates the authority. Unassigned – amounts that are for any purpose; positive amounts are reported only in a general fund.
The City Council may establish (and modify or rescind) fund balance commitments by passage of an ordinance or resolution.
When both restricted and unrestricted resources are available for use when an expenditure is incurred, it is the City’s policy to use restricted resources first, then unrestricted resources as they are needed. It is the City’s policy to consider committed amounts as being reduced first, followed by assigned amounts, and then unassigned amounts when expenditures are incurred for purposes for which amounts in any of those unrestricted fund balance classifications could be used.

- 25 -
City of Eastvale Notes to Financial Statements
June 30, 2012
II. STEWARDSHIP, COMPLIANCE AND ACCOUNTABILITY
Note 2: Budgetary Information The City prepares its budgets on the basis of estimated actual expenditures and, accordingly, the budget amounts included in the accompanying financial statements are presented on a basis consistent with generally accepted accounting principles.
Each year, the City Manager submits a proposed budget to the City Council during May. The City Council holds budget hearings during May and June. The final budget is adopted by the City Council in June. No budget expenditures can be disbursed without proper appropriations. Once the budget is adopted, no additional funds can be authorized without the City Council’s approval. The level of budgetary control (the level on which expenditures may not legally exceed appropriations) is at the individual fund level. The City Manager can authorize budget transfers between departments without additional appropriations.
Throughout the year, budgeted expenditures are reviewed and projections are made by the City Manager. Therefore, any necessary changes are submitted for approval to the City Council with a recorded action for any budget adjustments.
Formal budgetary integration is employed as a management control device during the year for all the Governmental Type Funds. Budgets for all the Governmental Type Funds are adopted on a basis consistent with generally accepted accounting principles. Budgeted amounts are as originally adopted and as further amended by the City Council. The following fund had expenditures in excess of appropriations:
Fund Budget Actual Variance Development Impact Fees $ -0- $ 38,790 $ (38,790)

- 26 -
City of Eastvale Notes to Financial Statements
June 30, 2012
III. DETAILED NOTES ON ALL FUNDS Note 3: Cash and Investments Cash and investments as of June 30, 2012, are classified in the accompanying financial statements as follows: Statement of Net Assets
Cash and investments 11,102,878$
Statement of Fiduciary Assets and LiabilitiesCash and investments 2,468,338
Total cash and investments 13,571,216$
Cash and investments as of June 30, 2012, consist of the following:
Cash on hand 800$ Deposits with financial institutions 9,052,404 Investments 4,518,012
13,571,216$
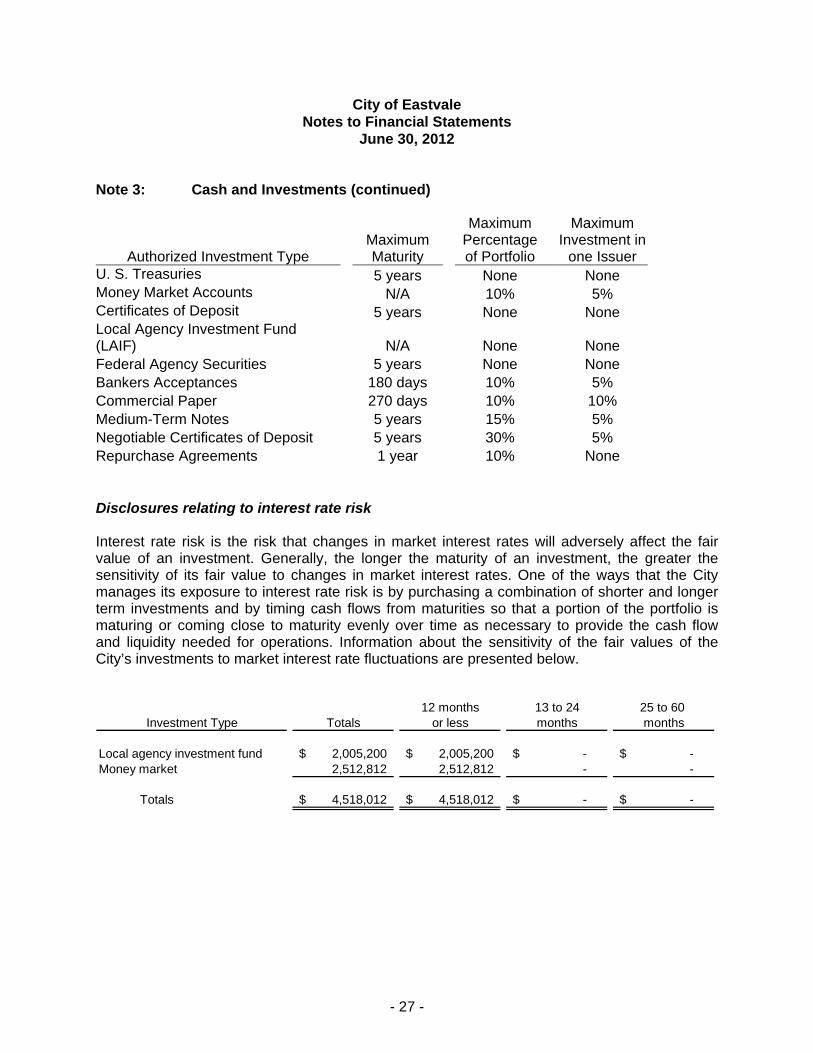
The City follows the practice of pooling cash and investments of all funds. Interest income earned on pooled cash and investments is allocated quarterly to the various funds based on cash balances. The City adopted GASB Statement No. 31, Accounting and Financial Reporting for Certain Investments and for External Investment Pools. GASB Statement No. 31 establishes fair value standards for investments in participating interest earning investment contracts, external investment pools, equity securities, option contracts, stock warrants and stock rights that have readily determinable fair values. Accordingly, the City reports its investments at fair value in the balance sheet. All investment income, including changes in the fair value of investments, is recognized as revenue in the operating statement. Authorized investments The table below identifies the investment types that are authorized for the City by the California Government Code (or the City’s investment policy, where more restrictive). The table also identifies certain provisions of the California Government Code (or the City’s investment policy, where more restrictive) that address interest rate risk, credit risk, and concentration of credit risk. This table does not address investments of debt proceeds held by bond trustees that are governed by the provisions of debt agreements of the City, rather than the general provisions of the California Government Code or the City’s investment policy.
- 27 -
City of Eastvale Notes to Financial Statements
June 30, 2012 Note 3: Cash and Investments (continued)
Authorized Investment Type Maximum Maturity
Maximum Percentage of Portfolio
Maximum Investment in
one Issuer U. S. Treasuries 5 years None None Money Market Accounts N/A 10% 5% Certificates of Deposit 5 years None None Local Agency Investment Fund (LAIF) N/A None None Federal Agency Securities 5 years None None Bankers Acceptances 180 days 10% 5% Commercial Paper 270 days 10% 10% Medium-Term Notes 5 years 15% 5% Negotiable Certificates of Deposit 5 years 30% 5% Repurchase Agreements 1 year 10% None Disclosures relating to interest rate risk Interest rate risk is the risk that changes in market interest rates will adversely affect the fair value of an investment. Generally, the longer the maturity of an investment, the greater the sensitivity of its fair value to changes in market interest rates. One of the ways that the City manages its exposure to interest rate risk is by purchasing a combination of shorter and longer term investments and by timing cash flows from maturities so that a portion of the portfolio is maturing or coming close to maturity evenly over time as necessary to provide the cash flow and liquidity needed for operations. Information about the sensitivity of the fair values of the City’s investments to market interest rate fluctuations are presented below.
12 months 13 to 24 25 to 60 Investment Type Totals or less months months
Local agency investment fund 2,005,200$ 2,005,200$ -$ -$ Money market 2,512,812 2,512,812 - -
Totals 4,518,012$ 4,518,012$ -$ -$

- 28 -
City of Eastvale Notes to Financial Statements
June 30, 2012 Note 3: Cash and Investments (continued) Disclosures relating to credit risk Generally, credit risk is the risk that an issuer of an investment will not fulfill its obligation to the holder of the investment. This is measured by the assignment of a rating by a nationally recognized statistical rating organization. Information about the minimum rating required by the California Government Code, the City’s investment policy, or debt agreements, and the actual rating as of year-end for each type of investment held by the City can be found below.
Minimum Ratings as ofInvestment Type Totals legal rating year end
Local agency investment fund 2,005,200$ N/A Not ratedMoney market 2,512,812 N/A Not rated
Totals 4,518,012$
Concentration of credit risk The investment policy of the City contains no limitations on the amount that can be invested in any one issuer beyond that stipulated by the California Government Code. As of June 30, 2012, no Investments in any one issuer (other than Mutual Funds and External Investment Pools) represented 5% or more of the City’s investments. Custodial credit risk Custodial credit risk for deposits is the risk that, in the event of the failure of a depository financial institution, a government will not be able to recover its deposits or will not be able to recover collateral securities that are in the possession of an outside party. The custodial credit risk for investments is the risk that, in the event of the failure of the counterparty (e.g., broker-dealer) to a transaction, a government will not be able to recover the value of its investment or collateral securities that are in the possession of another party. The California Government Code and the City’s investment policy do not contain legal or policy requirements that would limit the exposure to custodial credit risk for deposits or investments, other than the following provision for deposits: The California Government Code requires that a financial institution secure deposits made by state or local governmental units by pledging securities in an undivided collateral pool held by a depository regulated under state law (unless so waived by the governmental unit). The market value of the pledged securities in the collateral pool must equal at least 110% of the total amount deposited by the public agencies. California law also allows financial institutions to secure deposits by pledging first deed mortgage notes having a value of 150% of the secured public deposits. As of June 30, 2012, the City had deposits of $2,262,812 with financial institutions in excess of federal depository insurance limits that were held in collateralized accounts.

- 29 -
City of Eastvale Notes to Financial Statements
June 30, 2012 Note 3: Cash and Investments (continued) Investment in State Investment Pool The City is a voluntary participant in the Local Agency Investment Fund (LAIF) that is regulated by the California Government Code under the oversight of the Treasurer of the State of California. The fair value of the City’s investment in this pool is reported in the accompanying financial statements at amounts based upon the City’s pro-rata share of the fair value provided by LAIF for the entire LAIF portfolio (in relation to the amortized cost of that portfolio). The balance available for withdrawal is based on the accounting records maintained by LAIF, which are recorded on an amortized cost basis. LAIF is a governmental investment pool managed and directed by the California State Treasurer and is not registered with the Securities and Exchange Commission. An oversight committee comprised of California State officials and various participants provide oversight to the management of the fund. The daily operations and responsibilities of LAIF fall under the auspices of the State Treasurer’s office. The maximum investment in LAIF is $50,000,000. Note 4: Interfund Receivables and Payables
Due To Other FundsNonmajor
Governmental Funds Funds
Due From Other Funds:General Fund 39,393$
The due to General Fund from the Nonmajor Funds was a result of temporary deficit cash balances in those funds.

- 30 -
City of Eastvale Notes to Financial Statements
June 30, 2012 Note 5: Capital Assets Capital asset activity for the year ended June 30, 2012 was as follows:
Beginning EndingBalance Additions Deletions Balance
Governmental activities:Capital assets, being depreciated:
Leasehold improvements 25,659$ 11,576$ -$ 37,235$ Vehicles 24,982 - - 24,982 Machinery & equipment 37,238 6,755 - 43,993 Software - 156,200 - 156,200 Infrastructure 178,707,578 9,429,497 * - 188,137,075
Total capital assets, being depreciated 178,795,457 9,604,028 - 188,399,485
Less accumulated depreciation for:Leasehold improvements (2,566) (6,289) - (8,855) Vehicles (2,498) (4,996) - (7,494) Machinery & equipment (2,824) (6,323) - (9,147) Software - (11,157) - (11,157) Infrastructure (3,600,376) (4,917,728) - (8,518,104)
Total accumulated depreciation (3,608,264) (4,946,493) - (8,554,757)
Total capital assets, beingdepreciated, net 175,187,193 4,657,535 - 179,844,728
Governmental activities capital assets, net 175,187,193$ 4,657,535$ -$ 179,844,728$
* Infrastructure assets were contributed from private sources.
Depreciation expense was charged to functions of the primary government as follows:
Governmental activities:
General government 23,769$
Public safety 4,996
Public works 4,917,728
Total depreciation expense - governmental activities 4,946,493$

- 31 -
City of Eastvale Notes to Financial Statements
June 30, 2012 Note 6: Long-Term Liabilities Long-term liability activities for the year ended June 30, 2012 were as follows:
Beginning Ending Due Within Balance Additions Reductions Balance One Year
Governmental activities:
Loan payable - County of Riverside 210,120$ -$ 210,120$ -$ -$ Revenue Neutrality - County of Riverside - 1,803,845 - 1,803,845 - Compensated absences 5,400 28,255 12,344 21,311 20,017
Governmental activity long-term liabilities 215,520$ 1,832,100$ 222,464$ 1,825,156$ 20,017$
Governmental Activities: Loan Payable - County of Riverside As part of the Comprehensive Fiscal Analysis (CFA) prepared as part of the formation documents for the City, the County of Riverside (County) and other servicing agencies were to provide municipal level services during the transition year (October 1, 2010 through June 30, 2011). The County was to receive certain revenues on behalf of the City and apply them to the payment that would otherwise be necessary for providing those services. However, the County is allowed under the law to require the City to pay back the overall net cost of providing these services in the form of a loan. The loan has a 3 percent interest rate and does not have a set debt service schedule and shall be due within five (5) years of the agreement, but no later than June 30, 2016. The original loan amount and balance as of June 30, 2011 was $210,120, and the City paid the entire balance during fiscal year 2011-12. During the current fiscal year the County advised the City that its original calculations were in error and the City did not owe the County for the transition period and was refunding the amount the City paid.

- 32 -
City of Eastvale Notes to Financial Statements
June 30, 2012 Note 6: Long-Term Liabilities (continued) Revenue Neutrality Agreement – County of Riverside As part of the Incorporation process a Comprehensive Fiscal Analysis was prepared as to determine the fiscal feasibility and for revenue neutrality negotiations between the County of Riverside (County) and the City. It was determined that in the event of incorporation the revenue transferring to the City would be greater than net costs of services to be transferred, and would result in a negative fiscal impact to the County. To mitigate the negative fiscal impact the City and County entered into a Revenue Neutrality Agreement in which the City shall pay the County a portion of its tax revenues. The payments were developed utilizing the net county savings calculated under the revenue neutrality calculation for the base fiscal year 2007/2008, with a 3.5 percent annual inflation rate applied. The County’s annual net financial loss is the difference between the adjusted Net County Cost and the amount of actual revenues as received and reported by the City in its annual audit report. The annual tax revenue payment is the sum of the County’s base year net loss plus 40 percent of the net growth in the net loss over the base year. The amount owed for fiscal years 2010-11 and 2011-12 is $1,803,145. This amount plus the amount that will be owed for fiscal year 2012-13 are deferred until fiscal year 2013-14 and then will be due in ten annual payments with interest at 3 percent. There is no set debt service schedule at this time. In subsequent years an estimated amount is due within 60 days following the end of the City’s fiscal year and the final balance owed within 60 days following the completion of the City’s audited financial statements. The term of the agreement is for 30 years and extends to June 30, 2040 Note 7: Operating Lease The City leases a copier/scanner/printer/fax under a noncancelable operating lease. Rental costs for the lease were $3,681 for the fiscal year ended June 30, 2012. The future minimum lease payments as of June 30, 2012 are as follows:
Year Copier/Scanner/Printer/Fax
2013 $ 3,690 2014 3,690 2015 3,690 2016 1,231
12,301$

- 33 -
City of Eastvale Notes to Financial Statements
June 30, 2012 Note 7: Operating Lease (continued) On October 1, 2010, the City entered into a twenty two month operating lease agreement to rent its current office suite. The office lease provided for monthly rent of $2,150 in addition to common area maintenance costs for the first ten months and $2,215 thereafter. On July 1, 2011, the City Hall relocated and the lease was amended providing for monthly rent starting at $5,080 per month in addition to common area maintenance costs for the first seventeen months, $5,232 for months 18-28, and $5,385 for months 29-41. The City has the option to renew the lease upon termination at November 30, 2014. Rental costs including maintenance costs for the year ended June 30, 2012 were $60,960. Minimum future rental payments under the operating leases as of June 30, 2012 are as follows (amounts do not include common area maintenance costs):
Year Office Lease
2013 $ 62,377 2014 64,208 2015 26,924
153,509$
Note 8: Retirement Plan Plan Description During fiscal year 2011-2012, the City began contributing to the California Public Employees Retirements System (PERS), a cost sharing multiple-employer public employee defined benefit pension plan. PERS provides retirement and disability benefits, annual cost-of-living adjustments, and death benefits to plan members and beneficiaries. PERS acts as a common investment and administrative agent for participating public entities within the State of California. Benefit provisions and all other requirements are established by State statute and City ordinance. Copies of PERS’ annual financial report may be obtained from their executive office: 400 “P” Street, Sacramento, California 95814. Funding Policy Participants are required to contribute 7% of their annual covered salary. The City is required to contribute at an actuarially determined rate; the current rate is 9.126% of annual covered payroll. The contribution requirements of plan members and the City are established and may be amended by PERS.

- 34 -
City of Eastvale Notes to Financial Statements
June 30, 2012 Note 8: Retirement Plan (continued) Annual Pension Cost For 2012, the City’s annual pension cost of $12,958 for PERS was equal to the City’s required contributions. The required contribution was determined as part of the September 30, 2011 actuarial valuation using the entry age normal actuarial cost method.
Required Percentage Fiscal year Contribution Contributed
6/30/2010 N/A N/A6/30/2011 N/A N/A6/30/2012 $12,958 100%
THREE YEAR TREND INFORMATION FOR PERS
Note 9: Risk Management The City is a member of the Public Entity Risk Management Authority (PERMA), a joint powers insurance authority formed under Section 990 of the California Government Code for the purpose of jointly funding programs of insurance coverage for its members. PERMA is comprised of thirty-one participating member agencies: twenty-two cities, three transit agencies and six special districts. The City participates in the liability, property, auto physical damage, and crime insurance programs of PERMA. The liability program provides coverage up to $50 million per occurrence for personal injury, bodily injury, property damage and public officials' errors and omissions. The City has selected a $0 self-insured retention for this coverage and participates in risk sharing pools for losses up to $1 million, followed by PERMA's membership in the CSAC Excess Insurance Authority (EIA) for $49 million of excess liability coverage. The property insurance program is group purchased under a master property insurance policy with accumulated values from all participants effecting lower rates and broader coverage for members. The program covers real property, business personal property, inland marine coverage for special mobile equipment and business interruption. Commercial property coverage is written on a replacement cost basis and all risk, eliminating the traditional commercial "named peril" policy. The auto physical damage insurance program is also group purchased under a master insurance policy with accumulated values from all participants effecting lower rates for members. Auto physical damage coverage is written on an agreed amount basis. The crime insurance program provides public employee dishonesty, forgery or alteration, and computer fraud coverage under a master insurance policy. The City is insured with the State Compensation Insurance Fund for workers’ compensation claims. There is no deductible requirement for this coverage.

- 35 -
City of Eastvale Notes to Financial Statements
June 30, 2012 Note 10: Fund Equity The City has established certain fund balance designations to report the amounts in the following funds, which represent available spendable resources restricted, committed or assigned for a specific purpose:
Major Special Revenue Fund Non-Major
General Gas Tax GovernmentalFund Fund Funds Total
Fund Balances:Nonspendable:
Prepaid items 29,430$ -$ -$ 29,430$ Restricted for:
Public works - 2,596,819 1,194,780 3,791,599 Community development - - 402,995 402,995
Unassigned 7,227,171 - (3,521) 7,223,650
7,256,601$ 2,596,819$ 1,594,254$ 11,447,674$
The following fund has a deficit fund balance as of June 30, 2012:
Landscape Maintenance Fund $ (3,521) The deficit is as a result of start up costs which will be offset with future special assessment revenue. Note 11: Joint Ventures The Western Riverside County Regional Conservation Authority (Authority) was created in 2004 to protect 146 native species of plants and animals and preserving a half million acres of their habitat. Resolution 10-28, signed October 1, 2010, authorized the City Manager to pursue membership in the Riverside Conservation Authority, which would also fulfill one of the LAFCO’s conditions of incorporation for the City. Resolution 10-48, signed December 8, 2010, authorized the Mayor to sign the Joint Powers Agreement with the Riverside Conservation Authority and the agreement with the U.S. Fish and Wildlife Service and California Department of Fish and Game relating to the implementation of the Western Riverside County Multiple Species Habitat Conservation Plan. There will also be some additional (and unquantifiable) expenses associated with the City's interaction with the Authority. However, these additional expenses are expected to be relatively minor. There will be staff costs associated with locally implementing the program, which will be borne by the general fund for City projects and for the periodic reports to the Authority, and by landowners and developers through the City's full cost recovery program for private development applications. Copies of the Authority’s annual financial report may be obtained from the Western Riverside County Regional Conservation Authority Riverside Centre Building at 3403 10th Street, Suite 320, Riverside, CA 92501.

- 36 -
City of Eastvale Notes to Financial Statements
June 30, 2012 Note 12: Prior-Period Adjustment The government-wide net assets and the beginning fund balances for the General and Gas Tax Funds have been adjusted to correct the recognition of the loan payable from the County of Riverside (County) that was owed for transitional services. The County corrected the error and will reimburse the City’s payment.
Government-wide financial statements:
Net assets, beginning of year 181,028,305$
Prior period adjustment 210,120
Net assets, beginning of year, as restated 181,238,425$
Governmental Fund financial Statements:Special Revenue
FundGeneral Gas Tax
Fund balances, beginning of year 3,958,155$ 1,261,187$
Prior period adjustment 115,294 (115,294)
Fund balances, end of year 4,073,449$ 1,145,893$
Note 13: Subsequent Event On October 1, 2012, the City amended its lease with Eastvale Gateway III, LLC, to expand the premises of the leased property described in note 5. The amendment resulted in an additional $1,000 rent expense per month.

REQUIRED SUPPLEMENTARY INFORMATION

- 38 -
This page left blank intentionally.
ANNUAL FINANCIAL REPORT Fiscal Year Ended June 30, 2011

- 37 -
City of Eastvale Required Supplementary Information
Schedule of Revenues, Expenditures and Changes in Fund Balance - Budget and Actual
General Fund For the year ended June 30, 2012
Actual Variance with
Original Final Amounts Final BudgetREVENUES
Taxes 7,628,296$ 7,628,296$ 10,161,136$ 2,532,840$ Licenses and permits 779,098 779,098 2,251,039 1,471,941 Fines and forfeitures 125,000 125,000 205,274 80,274 Intergovernmental 3,442,802 3,442,802 37,611 (3,405,191) Investment earnings 40,000 40,000 9,452 (30,548) Other - - 12,620 12,620
Total revenues 12,015,196 12,015,196 12,677,132 661,936
EXPENDITURESCurrent:
General government 1,865,852 1,865,852 1,351,090 514,762 Public safety 6,775,500 6,775,500 5,985,056 790,444 Public works 146,500 146,500 48,477 98,023 Community development 1,555,640 1,555,640 1,991,526 (435,886)
Capital outlay 233,220 233,220 117,831 115,389 Debt service:
Principal 63,896 63,896 - 63,896 Interest 10,177 10,177 - 10,177
Total expenditures 10,650,785 10,650,785 9,493,980 1,156,805
Excess of revenues overexpenditures 1,364,411 1,364,411 3,183,152 1,818,741
OTHER FINANCING SOURCES Transfers in 81,793 81,793 - (81,793)
Total other financing sources 81,793 81,793 - (81,793)
Net change in fund balance 1,446,204 1,446,204 3,183,152 1,736,948
Fund balance, beginning of year, as restated 4,073,449 4,073,449 4,073,449 -
Fund balance, end of year 5,519,653$ 5,519,653$ 7,256,601$ 1,736,948$
Budgeted Amounts

- 38 -
City of Eastvale Required Supplementary Information
Schedule of Revenues, Expenditures and Changes in Fund Balance – Budget and Actual
Gas Tax Fund For the year ended June 30, 2012
Actual Variance withOriginal Final Amounts Final Budget
REVENUESIntergovernmental 1,885,670$ 1,885,670$ 2,061,032$ 175,362$ Investment earnings 34,410 34,410 2,785 (31,625)
Total revenues 1,920,080 1,920,080 2,063,817 143,737
EXPENDITURESCurrent:
Public works 2,254,000 2,254,000 556,191 1,697,809 Capital outlay - - 56,700 (56,700)
Total expenditures 2,254,000 2,254,000 612,891 1,641,109
Excess of revenues overexpenditures (333,920) (333,920) 1,450,926 1,784,846
OTHER FINANCING SOURCESTransfers out (81,793) (81,793) - 81,793
Total other financing sources (81,793) (81,793) - 81,793
Net change in fund balance (415,713) (415,713) 1,450,926 1,866,639
Fund balance, beginning of year,as restated 1,145,893 1,145,893 1,145,893 -
Fund balance, end of year 730,180$ 730,180$ 2,596,819$ 1,866,639$
Budgeted Amounts

SUPPLEMENTARY INFORMATION

This page left blank intentionally.
ANNUAL FINANCIAL REPORT Fiscal Year Ended June 30, 2011
- 39 -
NONMAJOR GOVERNMENTAL FUNDS
Special Revenue Funds Measure A - This fund is used to account for the construction, reconstruction, alteration, and maintenance of the streets and roads of the City. AQMD Trust Fund – This fund is used to account for the City’s portion of motor vehicle registration fees collected pursuant to AB2766 passed during the 1990 State legislative session. This fee was levied to fund programs to reduce air pollution from mobile sources such as cars, trucks, and buses. It also included funds allocated through a competitive process as a result of this legislation. Supplemental Law Enforcement Services Fund – This fund is used to account for the receipts and expenditures of funds resulting from the Citizen’s Option for Public Safety (COPS) program, a state funded program. Miscellaneous Grants Fund – This fund is used to account for the receipts and expenditures of miscellaneous grants not accounted for in a separate fund. Law Enforcement Grants Fund– This fund is used to account for grant funds used for frontline law enforcement services. Landscape Maintenance Fund – This fund is used to account for the costs of operation, maintenance, landscaping, and lighting district in 89-1 consolidated. Funding is provided by assessments specific to parcels in the district 89-1 consolidated. Development Impact Fees Fund – This fund is used to account for the receipt of fees for development related activities such as infrastructure and public facilities.
- 40 -
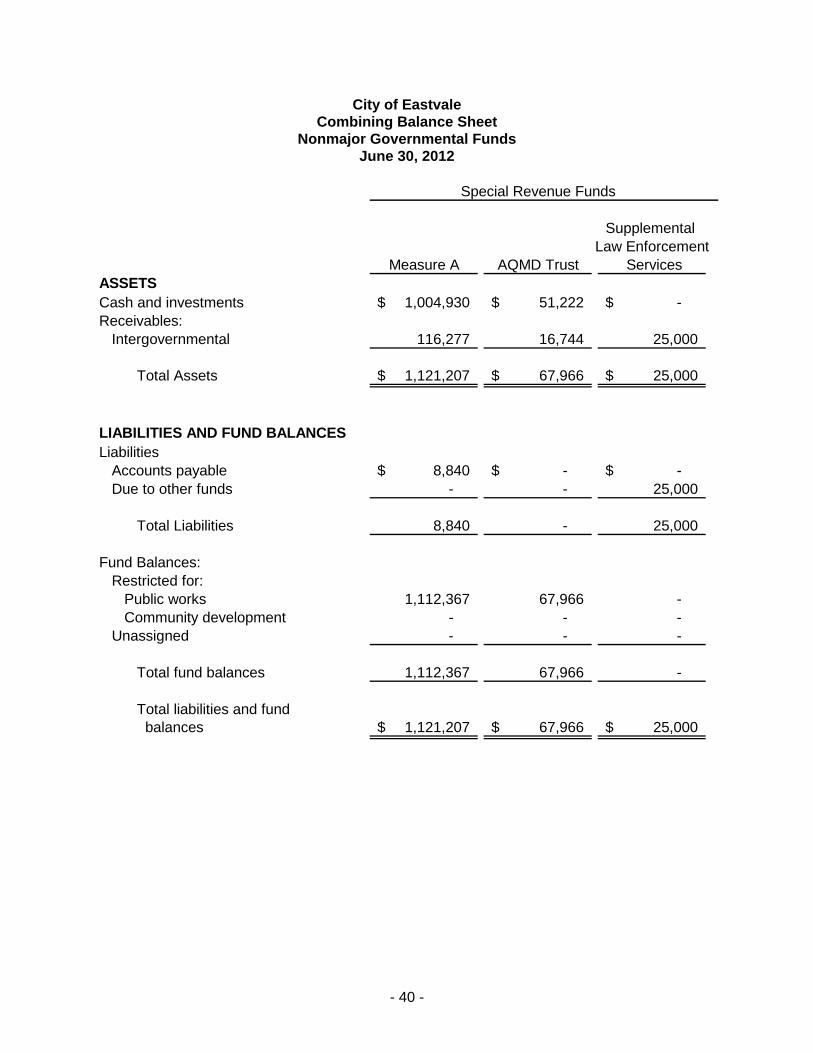
City of Eastvale Combining Balance Sheet
Nonmajor Governmental Funds June 30, 2012
Supplemental Law Enforcement
Measure A AQMD Trust ServicesASSETSCash and investments 1,004,930$ 51,222$ -$ Receivables:
Intergovernmental 116,277 16,744 25,000
Total Assets 1,121,207$ 67,966$ 25,000$
LIABILITIES AND FUND BALANCES Liabilities
Accounts payable 8,840$ -$ -$ Due to other funds - - 25,000
Total Liabilities 8,840 - 25,000
Fund Balances:Restricted for:
Public works 1,112,367 67,966 - Community development - - -
Unassigned - - -
Total fund balances 1,112,367 67,966 -
Total liabilities and fund balances 1,121,207$ 67,966$ 25,000$
Special Revenue Funds

- 41 -
TotalNonmajor
Miscellaneous Law Enforcement Landscape Development GovernmentalGrants Grants Maintenance Impact Fees Funds
14,480$ -$ -$ 402,995$ 1,473,627$
- 10,872 - - 168,893
14,480$ 10,872$ -$ 402,995$ 1,642,520$
33$ -$ -$ -$ 8,873$ - 10,872 3,521 - 39,393
33 10,872 3,521 - 48,266
14,447 - - - 1,194,780 - - - 402,995 402,995 - - (3,521) - (3,521)
14,447 - (3,521) 402,995 1,594,254
14,480$ 10,872$ -$ 402,995$ 1,642,520$
Special Revenue Funds
- 42 -
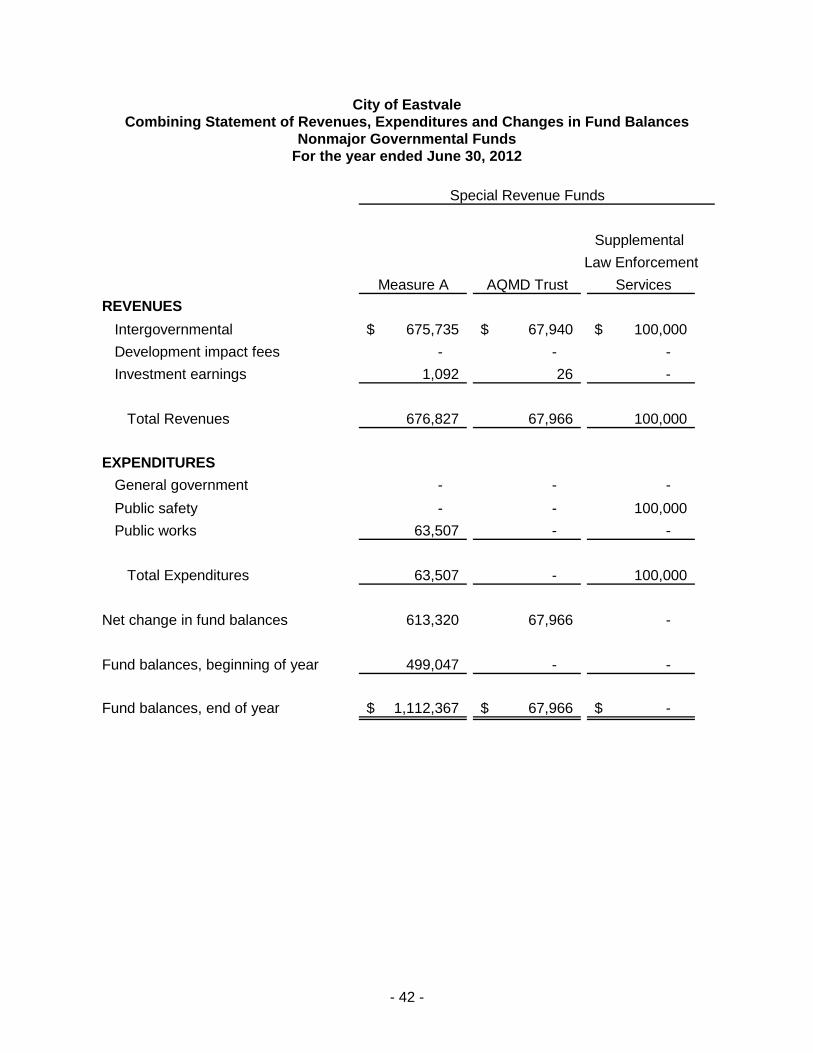
City of Eastvale Combining Statement of Revenues, Expenditures and Changes in Fund Balances
Nonmajor Governmental Funds For the year ended June 30, 2012
Supplemental
Law Enforcement
Measure A AQMD Trust Services
REVENUES
Intergovernmental 675,735$ 67,940$ 100,000$
Development impact fees - - -
Investment earnings 1,092 26 -
Total Revenues 676,827 67,966 100,000
EXPENDITURES
General government - - -
Public safety - - 100,000
Public works 63,507 - -
Total Expenditures 63,507 - 100,000
Net change in fund balances 613,320 67,966 -
Fund balances, beginning of year 499,047 - -
Fund balances, end of year 1,112,367$ 67,966$ -$
Special Revenue Funds

- 43 -
Total
Nonmajor
Miscellaneous Law Enforcement Landscape Development Governmental
Grants Grants Maintenance Impact Fees Funds
14,847$ 17,031$ -$ -$ 875,553$
- - - 102,214 102,214
3 - - 1,328 2,449
14,850 17,031 - 103,542 980,216
403 - - - 403
- 17,031 - - 117,031
- - 3,521 38,790 105,818
403 17,031 3,521 38,790 223,252
14,447 - (3,521) 64,752 756,964
- - - 338,243 837,290
14,447$ -$ (3,521)$ 402,995$ 1,594,254$
Special Revenue Funds

- 44 -
City of Eastvale Nonmajor Governmental Funds Comparison Schedules
For the year ended June 30, 2012
Budgetary comparison statements are presented as required supplementary information for the General Fund and all Major Special Revenue Funds as provided for by GASB Statement No. 34. The budgetary comparison schedules for the remaining funds are presented to aid in additional analysis and are not a required part of the basic financial statements. The City did not prepare budgets for AQMD Trust Fund, Miscellaneous Grants Fund, and the Landscape Maintenance Fund, so no budgetary comparisons are presented for these funds.

- 45 -
City of Eastvale Schedule of Revenues, Expenditures and Changes in Fund Balance -
Budget and Actual Measure A Fund
For the year ended June 30, 2012
Actual Variance withOriginal Final Amounts Final Budget
REVENUESIntergovernmental 579,000$ 579,000$ 675,735$ 96,735$ Investment earnings 12,915 12,915 1,092 (11,823)
Total revenues 591,915 591,915 676,827 84,912
EXPENDITURESCurrent:
Public works 940,000 940,000 63,507 876,493
Total expenditures 940,000 940,000 63,507 876,493
Excess of revenues overexpenditures (348,085) (348,085) 613,320 961,405
OTHER FINANCING USESTransfers out (81,793) (81,793) - 81,793
Total other financing sources (81,793) (81,793) - 81,793
Net change in fund balance (429,878) (429,878) 613,320 1,043,198
Fund balance, beginning of year 499,047 499,047 499,047 -
Fund balance, end of year 69,169$ 69,169$ 1,112,367$ 1,043,198$
Budgeted Amounts

- 46 -
City of Eastvale Schedule of Revenues, Expenditures and Changes in Fund Balance -
Budget and Actual Supplemental Law Enforcement Services Fund
For the year ended June 30, 2012
Actual Variance withOriginal Final Amounts Final Budget
REVENUESIntergovernmental -$ 100,000$ 100,000$ -$
Total revenues - 100,000 100,000 -
EXPENDITURESCurrent:
Public safety - 100,000 100,000 -
Total expenditures - 100,000 100,000 -
Net change in fund balance - - - -
Fund balance, beginning of year - - - -
Fund balance, end of year -$ -$ -$ -$
Budgeted Amounts

- 47 -
City of Eastvale Schedule of Revenues, Expenditures and Changes in Fund Balance -
Budget and Actual Law Enforcement Grants Fund
For the year ended June 30, 2012
Actual Variance withOriginal Final Amounts Final Budget
REVENUESIntergovernmental -$ 21,448$ 17,031$ (4,417)$
Total revenues - 21,448 17,031 (4,417)
EXPENDITURESCurrent:
Public safety - 21,448 17,031 4,417
Total expenditures - 21,448 17,031 4,417
Net change in fund balance - - - -
Fund balance, beginning of year - - - -
Fund balance, end of year -$ -$ -$ -$
Budgeted Amounts

- 48 -
City of Eastvale Schedule of Revenues, Expenditures and Changes in Fund Balance -
Budget and Actual Development Impact Fees Fund
For the year ended June 30, 2012
Actual Variance withOriginal Final Amounts Final Budget
REVENUESDevelopment impact fees -$ -$ 102,214$ 102,214$ Investment earnings 1,234 1,234 1,328 94
Total revenues 1,234 1,234 103,542 102,308
EXPENDITURESCurrent:
Community development - - 38,790 (38,790)
Total expenditures - - 38,790 (38,790)
Net change in fund balance 1,234 1,234 64,752 63,518
Fund balance, beginning of year 338,243 338,243 338,243 -
Fund balance, end of year 339,477$ 339,477$ 402,995$ 63,518$
Budgeted Amounts

- 49 -
AGENCY FUND Agency Fund - To account for developer deposits received for various planning projects.

- 50 -
City of Eastvale Statement of Changes in Fiduciary Assets and Liabilities
For the year ended June 30, 2012
Balance BalanceJune 30, 2011 Additions Deletions June 30, 2012
ASSETSCash and investments 1,074,736$ 6,546,175$ 5,152,573$ 2,468,338$
Total assets 1,074,736$ 6,546,175$ 5,152,573$ 2,468,338$
LIABILITIESAccounts payable -$ 135,821$ -$ 135,821$ Deposits 1,074,736 6,410,354 5,152,573 2,332,517
Total liabilities 1,074,736$ 6,546,175$ 5,152,573$ 2,468,338$
Agency Fund
Contents Page
52
56
60
65
67
STATISTICAL SECTION
This part of the City of Eastvale's comprehensive annual financial report presents detailedinformation as a context for understanding what the information in the financial statements, notedisclosures, and required supplementary information says about the City's overall financial health.
Operating Information - These schedules contain information about the city'soperations and resources to help the reader understand how the city's financialinformation relates to the services the city provides and the activities it performs.
Sources: Unless otherwise noted, the information in these schedules is derived from thecomprehensive annual financial reports for the relevant year. The City incorporated on October1, 2010 with a nine month fiscal year ending June 30, 2011 and does not have any historical databeyond that year.
Financial Trends - These schedules contain trend information to help the readerunderstand how the city's financial performance and position have changed overtime.
Demographic and Economic Information - These schedules offer demographicand economic indicators to help the reader understand the environment withinwhich the city's financial activities take place and to help make comparisons overtime and with other government agencies.
Revenue Capacity - These schedules contain information to help the readerassess the factors affecting the city's ability to generate its property and salestaxes.
Debt Capacity - These schedules present information to help the reader assessthe affordability of the city's current levels of outstanding debt and the city's abilityto issue additional debt in the future. The City maintains no outstanding debt anddoes not have any pledged revenues to report.
-51-

This page left blank intentionally.
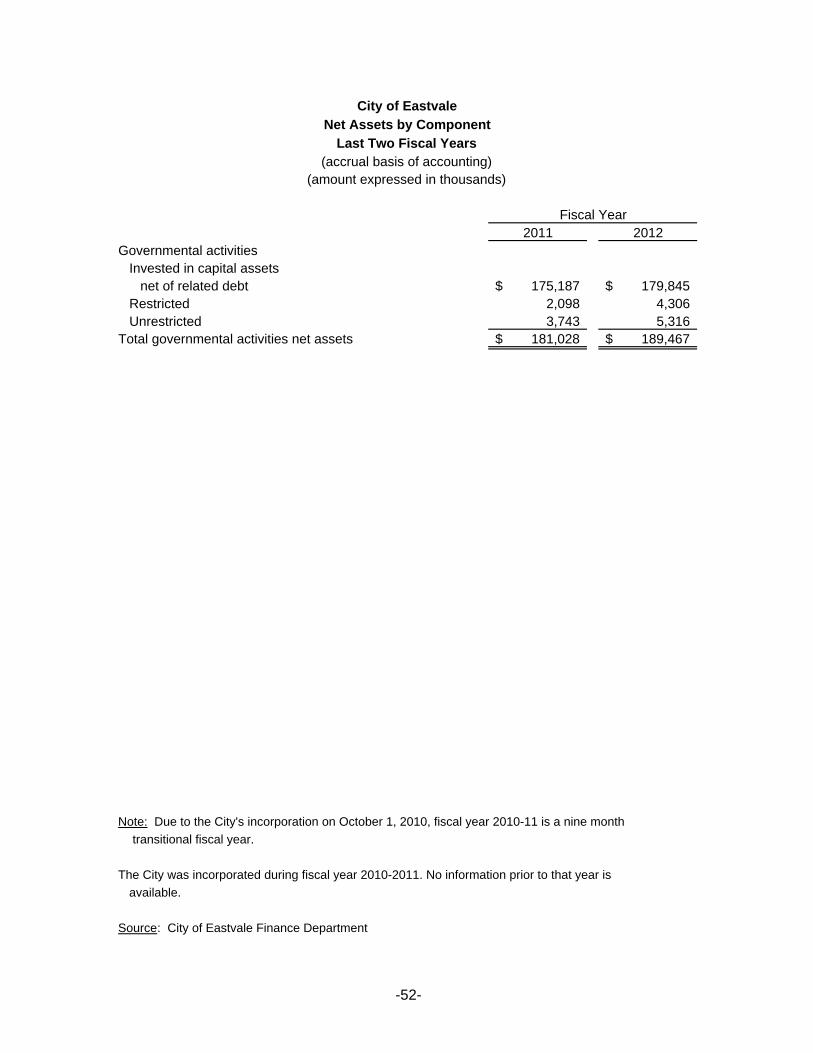
2011 2012Governmental activities
Invested in capital assets net of related debt 175,187$ 179,845$
Restricted 2,098 4,306 Unrestricted 3,743 5,316
Total governmental activities net assets 181,028$ 189,467$
Note: Due to the City's incorporation on October 1, 2010, fiscal year 2010-11 is a nine month
transitional fiscal year.
The City was incorporated during fiscal year 2010-2011. No information prior to that year is
available.
Source: City of Eastvale Finance Department
Fiscal Year
City of EastvaleNet Assets by Component
Last Two Fiscal Years(accrual basis of accounting)
(amount expressed in thousands)
-52-

2011 2012Expenses
Governmental activities:General government 903$ 1,391$ Public safety 4,459 6,107 Public works 3,928 5,629 Community development 1,022 1,991 Revenue Neutrality - 1,804
Total governmental activities expenses 10,312 16,922
Total primary government expenses 10,312$ 16,922$
Program Revenues
Governmental activities:Charges for services
General government - 74 Public safety 22 221 Community development 893 2,174
Operating contributions and grants 1,899 2,940 Capital contributions and grants 179,045 9,533
Total primary government program revenues 181,859 14,942
Total primary government program revenues 181,859$ 14,942$
Total primary government net expense 171,547$ (1,980)$
General Revenues and Other Changes in Net Assets
Governmental activities:Taxes
Property tax 3,871$ 4,620$ Franchise tax 594 1,346 Sales tax 1,487 3,885 Motor Vehicle in Lieu tax 3,235 38 Other taxes 290 310
Investment income 4 9 Other - 1
Total governmental activities 9,481 10,209
Total primary government 9,481$ 10,209$
Total Change in Net Assets 181,028$ 8,229$
Note: Due to the City's incorporation on October 1, 2010, fiscal year 2010-11 is a nine month
transitional fiscal year.
The City was incorporated during fiscal year 2010-2011. No information prior to that year is
available.
Source: City of Eastvale Finance Department
Fiscal Year
City of Eastvale
Changes in Net Assets
Last Two Fiscal Years(accrual basis of accounting)
(amounts expressed in thousands)
-53-
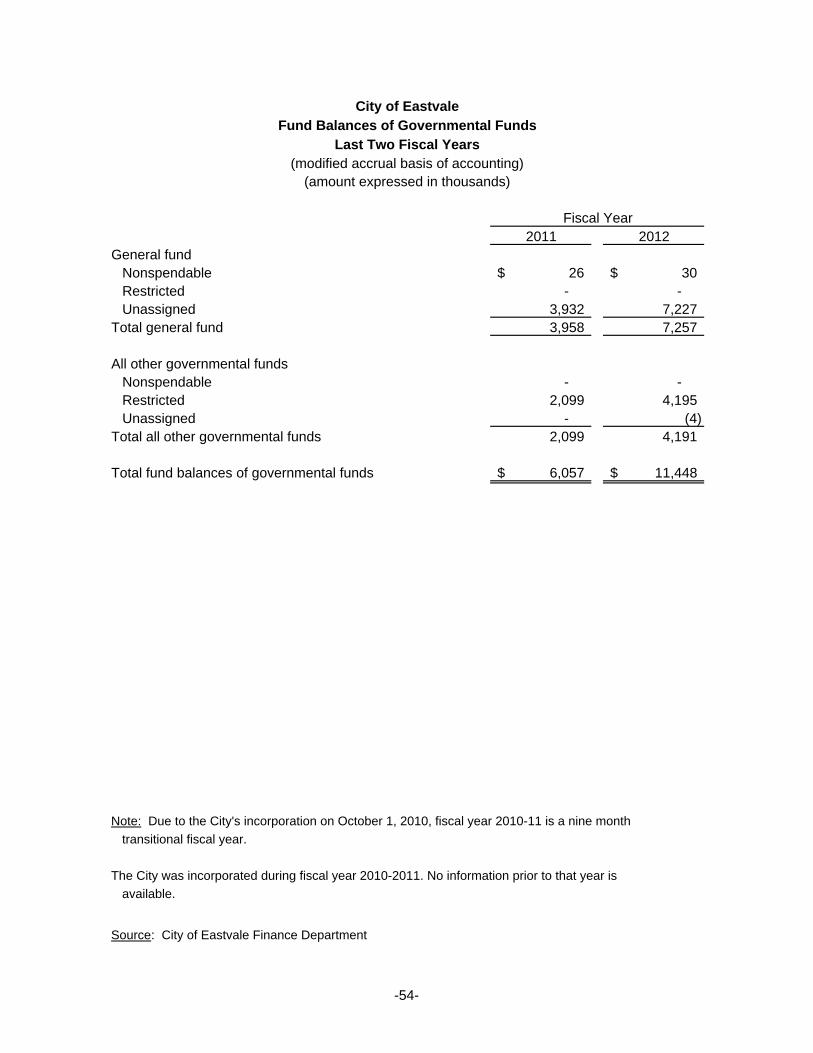
2011 2012General fund
Nonspendable 26$ 30$ Restricted - - Unassigned 3,932 7,227
Total general fund 3,958 7,257
All other governmental fundsNonspendable - - Restricted 2,099 4,195 Unassigned - (4)
Total all other governmental funds 2,099 4,191
Total fund balances of governmental funds 6,057$ 11,448$
Note: Due to the City's incorporation on October 1, 2010, fiscal year 2010-11 is a nine month
transitional fiscal year.
The City was incorporated during fiscal year 2010-2011. No information prior to that year is
available.
Source: City of Eastvale Finance Department
City of EastvaleFund Balances of Governmental Funds
Last Two Fiscal Years(modified accrual basis of accounting)
(amount expressed in thousands)
Fiscal Year
-54-
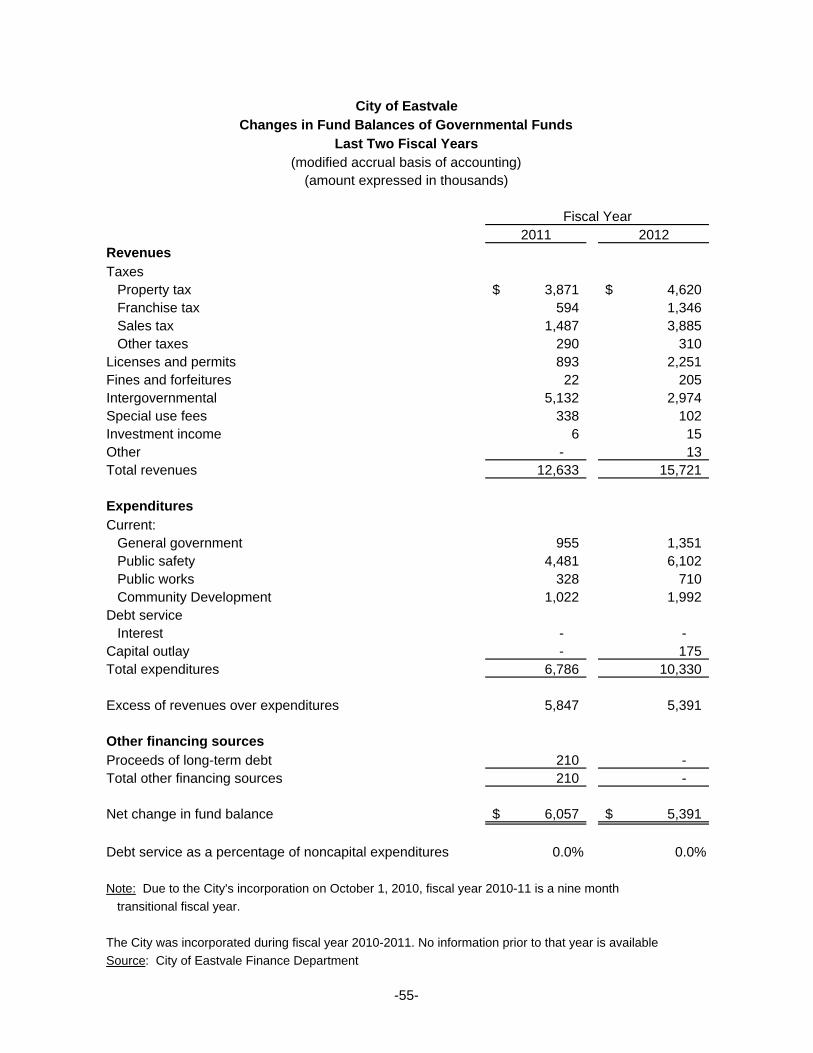
2011 2012RevenuesTaxes
Property tax 3,871$ 4,620$ Franchise tax 594 1,346 Sales tax 1,487 3,885 Other taxes 290 310
Licenses and permits 893 2,251 Fines and forfeitures 22 205 Intergovernmental 5,132 2,974 Special use fees 338 102 Investment income 6 15 Other - 13 Total revenues 12,633 15,721
ExpendituresCurrent:
General government 955 1,351 Public safety 4,481 6,102 Public works 328 710 Community Development 1,022 1,992
Debt serviceInterest - -
Capital outlay - 175 Total expenditures 6,786 10,330
Excess of revenues over expenditures 5,847 5,391
Other financing sources Proceeds of long-term debt 210 - Total other financing sources 210 -
Net change in fund balance 6,057$ 5,391$
Debt service as a percentage of noncapital expenditures 0.0% 0.0%
Note: Due to the City's incorporation on October 1, 2010, fiscal year 2010-11 is a nine month
transitional fiscal year.
The City was incorporated during fiscal year 2010-2011. No information prior to that year is available
Source: City of Eastvale Finance Department
Fiscal Year
City of EastvaleChanges in Fund Balances of Governmental Funds
Last Two Fiscal Years(modified accrual basis of accounting)
(amount expressed in thousands)
-55-

Fiscal
Year
Residential
Property
Commercial
Property
Industrial
Property Other
Total Assessed
Valuation
Less Tax
Exempt
Property
Total Taxable
Assessed Value
Direct
Tax Rate
(City)
2012 5,084,826$ 207,045$ 418,137$ 317,720$ 6,027,728$ (18,826)$ 6,008,902$ 0.0248
Source: County of Riverside, Auditor-Controller/HdL, Coren & Cone
Note: Fiscal Year 2011-12 is the first fiscal year since the incorporation of Eastvale on October 1, 2010. California Revenue and Taxation CodeSection 2905 states that taxes on unsecured property are to be taxed at tax rates fixed prior to the lien date (prior year). No unsecured value isincluded in the report above for the 2011-12 roll year as the County received taxes on the unsecured value in that year. Estimated Actual Valueamounts are not available.
City of EastvaleAssessed Value and Estimated Actual Value of Taxable Property
Last Fiscal Year(amounts expressed in thousands)
-56-

City Direct Rates
Fiscal
Year
Basic County,
City, and
School Levy
Community
College District Water District School District Total
2012 1.00000 0.01700 0.00370 0.11541 1.13611
The City was incorporated during fiscal year 2010-2011. No information prior to that year is
available.
Source: County of Riverside, Auditor-Controller/HdL, Coren & Cone
Note: Due to the City's incorporation on October 1, 2010, fiscal year 2010-11 is a nine month transitional fiscal year.
City of EastvaleDirect and Overlapping Property Tax Rates
Last Fiscal Year(rate per $100 of assessed value)
-57-

2012
Taxpayer
Taxable Assessed
Value
Percentage of
Total Taxable
Assessed
Value
AMB Institutional Alliance Fund 81,045,851$ 1.35%LBA Riv Company IV 71,860,000 1.20%Eastvale Gateway II 52,226,362 0.87%Homecoming III at Eastvale 52,048,559 0.87%SC Eastvale Development Company 49,594,287 0.83%Homecoming II at Eastvale 43,375,919 0.72%Prologis California I 41,282,996 0.69%Hamner Park Associates 33,769,695 0.56%J W Mitchell Company 31,541,228 0.52%WW Grainer Inc. 28,849,600 0.48%
Total 485,594,497$ 8.08%
Note: Due to the City's incorporation on October 1, 2010, fiscal year 2010-11 is a nine month transitional
fiscal year.
The City was incorporated during fiscal year 2010-2011. No information prior to that year is
available.
Source: HdL, Coren & Cone
City of EastvalePrincipal Property Tax Payers
June 30, 2012
-58-

Taxes Levied Total Collections to Date
Fiscal
Year
For the Fiscal
Year Amount
Percentage of
Levy
Collection in
Subsequent
Years Amount
Percentage of
Levy
2012 4,902,083$ 4,619,832$ 94.24% - 4,619,832$ 94.24%
The City was incorporated during fiscal year 2010-2011. No information prior to that year is
available.
Source: City of Eastvale Finance Department, Riverside County Auditor-Controller's Office.
City of EastvaleProperty Tax Levies and Collections
Last Fiscal Year
Note: Fiscal Year 2011-12 is the first full fiscal year since incorporation of Eastvaele on October 1, 2010. California Revenue and Taxation Code Section 2905 states that taxes on unsecured property are to be taxed at rates fixed prior to the lien date (prior year). The City had no collections in prior fiscal year of which taxes were collected in subsequent years.
Collected within the Fiscal Year of the Levy
-59-

Fiscal Year
General Obligation
Bonds
Lease Revenue Bonds
County Revenue
Neutrality (1)
Total Governmental
Activities
% of Actual Assessed Value of
Property (2)
Per Capita (3)
2012 -$ -$ 1,803,845$ 1,803,845$ 0.030% 32.44$
Notes: Details regarding the City's outstanding debt can be found in the notes to the financial statements.
(1) County Revenue Neutrality is not a bonded debt.
(2) Assessed value used because actual value of taxable property is not readily available in State of
California.
(3) See the Schedule of Demographics and Economic Statistics for population data.
The City was incorporated during fiscal year 2010-2011. No information prior to that year is
available.
Source: City of Eastvale Finance Department
City of Eastvale
Ratio of Outstanding Debt by Type
Last Fiscal Year
-60-

Fiscal Year
General Obligation
Bonds
Tax Allocation
Bonds
Certificates of
Participation
Total Governmental
Activities
Percent of
Assessed Value
Debt per
Capita
2012 - - - - 0.00% -
The City was incorporated during fiscal year 2010-2011. No information prior to that year is
available.
Source: City of Eastvale Finance Department
Note: Details regarding the City's outstanding debt can be found in the notes to the financial statements.
City of EastvaleRatio of General Bonded Debt
Last Fiscal Year
-61-

2011-12 Assessed Valuation 6,027,768,985$ Redevelopment Incremental Valuation 664,251,724
Adjusted Assessed Valuation 5,341,943,795$
Outstanding Amount Debt Percent Applicable to City
Overlapping Tax and Assessment Debt June 30, 2012 Applicable (1) June 30, 2012Metropolitan Water District 196,545,000$ 0.295% 579,808$ Riverside Community College District 230,858,371 9.225% 21,296,685 Corona-Norco Unified School District 274,072,570 23.201% 63,587,577 Jurupa Community Services District 51,252,972 7.037% 3,606,672
Corona-Norco Unified School District Community Facilities District (2) 14,560,000 100.000% 14,560,000
Jurupa Community Services District Community Facilities District (3) 284,035,000 100% - 20.531% 265,498,856
Total Overlapping Tax and Assessment Debt 369,129,598$ Direct and Overlapping General Fund DebtRiverside County General Fund Obligations 655,042,180 3.683% 24,125,203 Riverside County Pension Obligations 357,540,000 3.683% 13,168,198 Riverside County Board of Education Certificates of Participation 5,055,000 3.683% 186,176 Corona-Norco Unified School District General Fund Obligations 30,035,000 23.201% 6,968,420 Jurupa Unified School District Certificates of Participation 7,220,000 7.037% 508,071 City of Eastvale Certificates of Participation 0 100 0
Total Gross Direct and Overlapping General Fund Debt 44,956,068 Less: Riverside County supported obligations 456,541
Total Net Direct and Overlapping General Fund Debt 44,499,527$
Total Direct Debt $0Gross Combined Total Debt (4) 414,085,666$ Net Combined Total Debt 413,629,125$
Ratios to 2011-12 Assessed ValuationDirect Debt 0%Total Overlapping Tax and Assessment Debt 6.124%
Ratios to 2011-12 Adjusted Assessed ValuationGross Combined Total Debt (4) 7.752% 414,085,666$ Net Combined Total Debt 7.743% 413,629,125$
State School Building Aid Repayable as of 6/12/12: -$
Notes:
(1) Percentage of overlapping agency's assessed valuation located within the boundaries of the City.(2)It is estimated that CFDs 98-1, 02-1, 03-1, 03-2, 03-4, 04-1, 04-2 I.A.2, and 06-1 are entirely within the City's boundaries.
(3) CFDs 2, 3, 4, 5, 6, 7, 10, 11, 12, 14, 15, 16, 17, 18, 19, 21, 23, 24, 25, 29, 30, 32, 34, 35, 38 and 39
are entirely within the City's boundaries. It is estimated that 20.531% of CFD 1 is located within the City's boundaries.
(4) Excludes tax and revenue anticipation notes, enterprise revenue, mortgage revenue and tax allocation bonds and
non-bonded capital lease obligations.
Source: California Municipal Statistics, Inc.
City of EastvaleDirect and Overlapping Bonded Debt
June 30, 2012
-62-

Fiscal Year
Assessed Valuation
Legal Debt Limit (15% of
Assessed Value)
Amount of Debt
Applicable to Debt Limit
Legal Debt Margin
Total Debt Applicable to the Limit as a Percentage of the Debt
Limit
2012 6,027,728$ 904,159$ -$ 904,159$ 0.0%
Note: Section 43605 of the Government Code of the State of California limits the amount of general
bonded indebtedness for public improvements to 15% of the assessed valuation of all real and
personal property of the City. The City has no general obligation bonded debt.
The City was incorporated during fiscal year 2010-2011. No information prior to that year is
available.
Source: City of Eastvale Finance Department
City of EastvaleLegal Debt Margin Information
Last Fiscal Year(amount expressed in thousands)
-63-

Lease Revenue Bonds
Fiscal Year Revenue
Less Operating Expenses
Net Available Revenue Principal Interest Coverage
2012 The City has no direct outstanding bonded debt
Note: Details regarding the City's outstanding debt can be found in the notes to the financial statements.
The City was incorporated during fiscal year 2010-2011. No information prior to that year is
available.
Source: City of Eastvale Finance Department
City of Eastvale
Pledged Revenue Coverage
Last Fiscal Year
-64-

(1) (2) (3) (4)
Calendar Year Population
Personal Income In
Thousands
Per Capita Personal Income Median Age
Unemployment Rate
2012 55,602 1,514,209$ 27,233$ 30 (4)
Note: The City was incorporated during fiscal year 2010-2011. No information prior to that year is
available.
Sources: (1) Population - California Department of Finance
(2) Personal Income - California Franchise Tax Board, adjusted gross income for zip code 90201
(3) Median Age - U.S. Census Bureau State of California
(4) Unemployment Rate - Information not available
City of Eastvale
Demographic and Economic Status
Last Fiscal Year
-65-

2012
Industry Labor Force
Percent of
Total
Farm 13,700 2.44%Goods Producing 72,500 12.93%Trade, Transportation and Utilities 124,600 22.22%Information 9,700 1.73%Financial Activities 18,100 3.23%Professional and Business Services 54,700 9.76%Education and Health Services 62,900 11.22%Leisure and Hospitality 72,800 12.98%Other Services 19,100 3.41%Government 112,600 20.08%
Total 560,700 100.00%
The City was incorporated during fiscal year 2010-2011. No information prior to that year is
available.
Source: State of California Employment Development Department
Note: Information on the largest employers for the City of Eastvale is not available. Presented above is the annual average of Industry Employment & Labor Force for Riverside County as of December 2011.
City of EastvaleEmployment By Industry
Current Year
-66-

Fiscal YearGeneral
Government Public Safety Public WorksCommunity
Services Total
2011 4 42012 6 6
The City was incorporated during fiscal year 2010-2011. No information prior to that year is available.
Source: City of Eastvale Finance Department
Notes: The City of Eastvale contracts services for Public Works, Planning, Building & Safety, Police and Fire. Parks and Recreation is provided by the Jurupa Community Services District.
City of EastvaleFull-time City Employees
by FunctionLast Two Fiscal Years
-67-

2011 2012
FinanceBusiness license applications (1) 817
Building and SafetyConstruction valuation 71,690,823$ 133,358,335$ Building permits issued 968 1,509
Public SafetyTotal arrests 512 648 Calls for service 1311 22,154
Notes:(1) Fiscal year 2011-12 is the first fiscal year the City provided the business license program.
No business licenses were issued by the City during fiscal year 2010-11.
The City was incorporated during fiscal year 2010-2011. No information prior to that year is
available.
Source: City of Eastvale, Various Departments
City of EastvaleOperating Indicators
by FunctionLast Two Fiscal Years
Fiscal Year
-68-
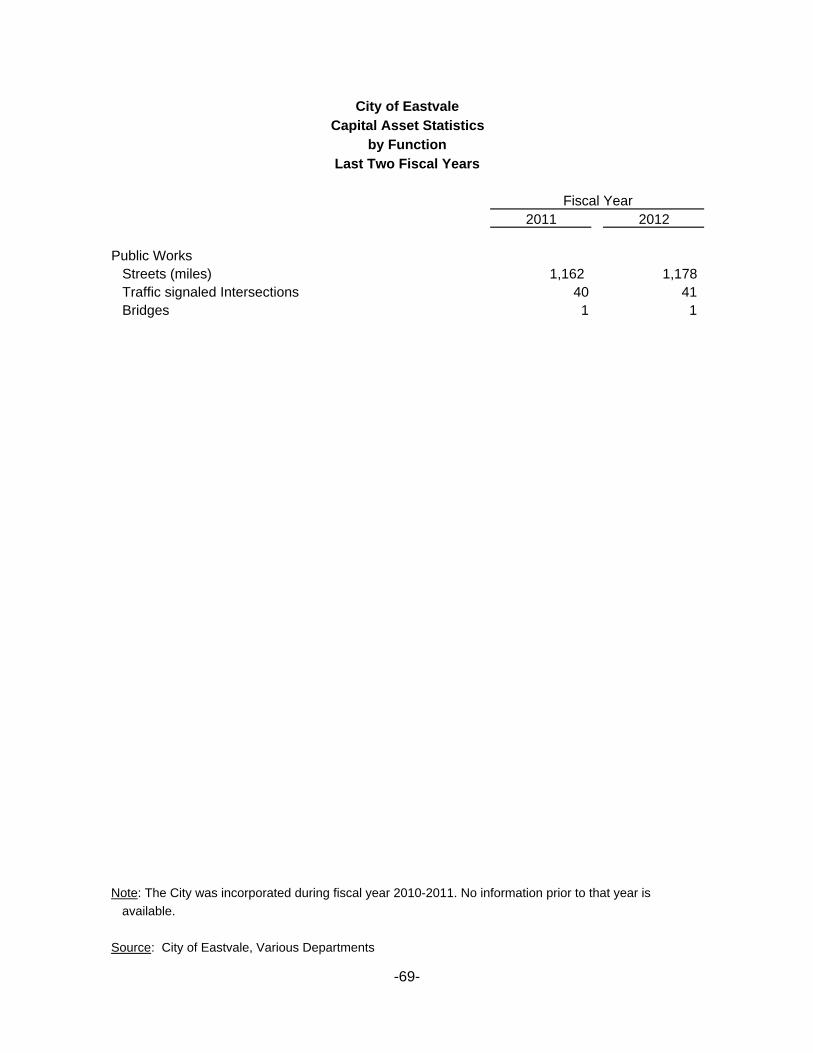
2011 2012
Public WorksStreets (miles) 1,162 1,178 Traffic signaled Intersections 40 41 Bridges 1 1
Note: The City was incorporated during fiscal year 2010-2011. No information prior to that year is
available.
Source: City of Eastvale, Various Departments
Fiscal Year
City of EastvaleCapital Asset Statistics
by FunctionLast Two Fiscal Years
-69-