city of escanaba escanaba presentation to... · – remove load factor adjustment for large power...
TRANSCRIPT

Power System Engineering, Inc. 1
© 2012 Power System Engineering, Inc.
Power System Engineering, Inc.
Joe Aliperto
Power System Engineering, Inc.Web Site: www.powersystem.org
E-Mail: [email protected]
Power System Engineering, Inc.
Cost of Service and Electric Rate Study
May 9, 2012
City of Escanaba
© 2012 Power System Engineering, Inc.
Power System Engineering, Inc.
About PSE
Power System Engineering, Inc. (PSE) has been dedicated to helping utilities succeed since 1974. We have worked with more than 200 utilities throughout the nation to help them improve efficiency, cut costs and provide a higher level of service to their customers.
• Engineering (system planning & design)
• Communications (SCADA, AMI/AMR)
• Economics (Load forecasting, resource plans)
• Finance (Rate & COS, Forecasting, Mergers & Acquisitions)
2

Power System Engineering, Inc. 2
© 2012 Power System Engineering, Inc.
Power System Engineering, Inc.
Agenda
• Explain study process and assumptions.
• Summarize study results.
• Rate design recommendations.
3
© 2012 Power System Engineering, Inc.
Power System Engineering, Inc.
Study Purpose
• Determine how individual rates are tracking with cost of service.
1. Power Supply
2. Transmission
3. Distribution
• Design, evaluate, and recommend rate design, guided by generally-accepted rate making principles.
4

Power System Engineering, Inc. 3
© 2012 Power System Engineering, Inc.
Power System Engineering, Inc.
Rate Recommendation Summary
5
• Implementing a rate decrease of $1,831,000 or 12.3%.– This figure assumes the power plant has been sold or MISO and the
City negotiated a Y-1 agreement. Either of these scenarios results in a $0 cost to the City related to plant operations.
• Opportunity to re-align rate levels and rate structures with COS as a guide and with an eye towards the future.
• The COS shows that not all rates are due the same decrease.• Range of decreases from 6.4% to 17.3%.• Rate Structure Changes
– Customer Charge– Remove declining block Energy Charges– Remove Load Factor Adjustment for Large Power demand billing– Consider power plant recovery rider to recoup power plant
maintenance costs at the determination of the Council at some point in the future
© 2012 Power System Engineering, Inc.
Power System Engineering, Inc.
Study Process
Task 1: Revenue Requirement • Identify total cost of service for
the City.
Task 2: Cost of Service• Identify class responsibility for
revenue requirement.• Provide unit cost info for use in
rate design.
Task 3: Rate Design• Recover adequate revenue• Balance other ratemaking objectives
Test YearTotal
Revenue Requirements
Class Cost of Service Study
ResidentialGeneralService
Large Power
Rates Rates Rates
6

Power System Engineering, Inc. 4
© 2012 Power System Engineering, Inc.
Power System Engineering, Inc.
Revenue Requirements
• The total revenue required to operate the Electric Utility, i.e. cost of providing service:
Operating Expenses
+Other Cash Needs
=Revenue Requirements
7
© 2012 Power System Engineering, Inc.
Power System Engineering, Inc.
Revenue Requirements Summary Cash Flow Basis
8
Revenue Requirements SummaryCash Flow Method
($)1. Operating Expenses 13,137,234
2. Cash Margin Requirementsa. Capital Outlay 400,000b. Payment to the General Fund 463,624c. Total Cash Needs 863,624d. Less: Non-Operating Income - Interest 225,000e. Less: Depreciation 300,000f. Net Cash Margins Required 338,624
3. Total Revenue Requirements 13,475,858
4. Revenue From Present Ratesa. Tariff Revenue 14,900,900b. Other Operating Revenue 406,200c. Total Revenue 15,307,100
5. Required Increase (Decrease) 1 (1,831,242)or -12.3%
1 Percent decrease is calculated based on the percent of Tariff Revenue.

Power System Engineering, Inc. 5
© 2012 Power System Engineering, Inc.
Power System Engineering, Inc.
Power Costs
• Current contract through NextEra
– Contracted at $0.05710/kWh purchased
– Low kW charge, calculated at $0.23/kW purchased
• Alternative potential future power cost scenario, based on a formula based power supply
– Lower kWh charge, $0.03188/kWh purchased
– Higher demand charge of $16.06/kW purchased
– Assumed no change in MISO monthly billings or transmission costs
– Alternative purchased power scenario would result in added costs of $896,000 per year
9
© 2012 Power System Engineering, Inc.
Power System Engineering, Inc.
Comparison of Power Costs
10
Line NextEra Alternative NextEra Alternative Power CostNo. Description Units Rates Rates Cost Cost Change1 ($) ($) ($)2 MISO Monthly Billings 180,000 180,000 - 34 Demand Charge5 Demand 301,100 kW $0.23 $16.06 /kW 68,600 4,835,666 4,767,066
67 Energy Charge8 Energy 153,500,000 kWh $0.05710 $0.03188 /kWh 8,764,850 4,893,580 (3,871,270)
910 Transmission11 ATC Transmission Charge 301,100 kW $4.04 $4.04 /kW 1,216,170 1,216,170 - 121314 Total Test Year 153,500,000 kWh $0.06664 $0.07248 /kWh 10,229,620 11,125,416 895,796
Comparison of Purchased Power Expense

Power System Engineering, Inc. 6
© 2012 Power System Engineering, Inc.
Power System Engineering, Inc.
Cost of Service Study Purpose
• To identify the cost of providing service as a function of:– Service provided.– Load characteristics.
• Guide for distributing or allocating revenue requirements; – Goal: equity betweenrate classes.
• Guide for designing individual rate schedules (e.g., service charge, energy charge, demand charge); – Goal: equity withineach rate class.
11
© 2012 Power System Engineering, Inc.
Power System Engineering, Inc.
12
AllocationResidential Small General Large General
ClassificationDirect Consumer Capacity Energy
FunctionalizationPower Supply Transmission Distribution
Revenue Requirements
Class Cost of Service Flow
• Cost causers should be cost payers.• Cost users should be cost payers.

Power System Engineering, Inc. 7
© 2012 Power System Engineering, Inc.
Power System Engineering, Inc.
Functionalization
• Costs are arranged into basic service functions of:– Power Supply or Generation– Transmission– Distribution
13
© 2012 Power System Engineering, Inc.
Power System Engineering, Inc.
Classification
• Costs are classified into categories that reflect how they are incurred and to facilitate allocation.
Power SupplyPower Supply TransmissionTransmission DistributionDistribution
DirectDirect
CapacityCapacityEnergyEnergy
CapacityCapacity
DirectDirectConsumerConsumerCapacityCapacity
14

Power System Engineering, Inc. 8
© 2012 Power System Engineering, Inc.
Power System Engineering, Inc.
Allocation
• Only a few costs are directly related to a specific class (e.g. security lights). These costs can be directly assigned to a specific class
• Most costs are “common” since they are related to providing service to all consumers
– These costs must be allocated
15
© 2012 Power System Engineering, Inc.
Power System Engineering, Inc.
Allocation Factors
• Allocation factors spread costs to classes based on a relationship to system use
DirectDirect ConsumerConsumer CapacityCapacity EnergyEnergy
�� Class Class specificspecific
�� weighted weighted # of # of
consumersconsumers
�� NonNon--Coinc. Coinc. Demand kWDemand kW
�� metered energy metered energy sales (kWh)sales (kWh)
�� Coinc. Coinc. Demand kWDemand kW
16

Power System Engineering, Inc. 9
© 2012 Power System Engineering, Inc.
Power System Engineering, Inc.
Allocation Example
• Wholesale purchased energy costs are allocated on the basis of energy sales to each rate class.
• Meters are allocated on a per customer basis.
17
© 2012 Power System Engineering, Inc.
Power System Engineering, Inc.
Class COS Summary
18
Class Cost of ServiceSummary -- Present Rates
Present Rate Revenue Increase/(Decrease)Rate Class Revenue 1
Requirements Amount Percent($) ($) ($)
Residential 4,197,281 3,992,692 (204,589) (5.0%)Commercial 3,915,208 3,254,906 (660,302) (17.3%)Large Power 6,339,923 5,406,021 (933,902) (15.1%)Water Heating 34,644 33,430 (1,214) (3.6%)Electric Heating 32,768 30,313 (2,455) (7.7%)Municipal 596,593 501,010 (95,583) (16.5%)Street Lighting 131,900 207,419 75,519 58.8%Dusk to Dawn Lighting 58,783 50,068 (8,715) (15.2%)
Total 15,307,100 13,475,858 (1,831,242)1 Includes an allocated share of Other Operating Revenue.
Power System Engineering, Inc. 10
© 2012 Power System Engineering, Inc.
Power System Engineering, Inc.
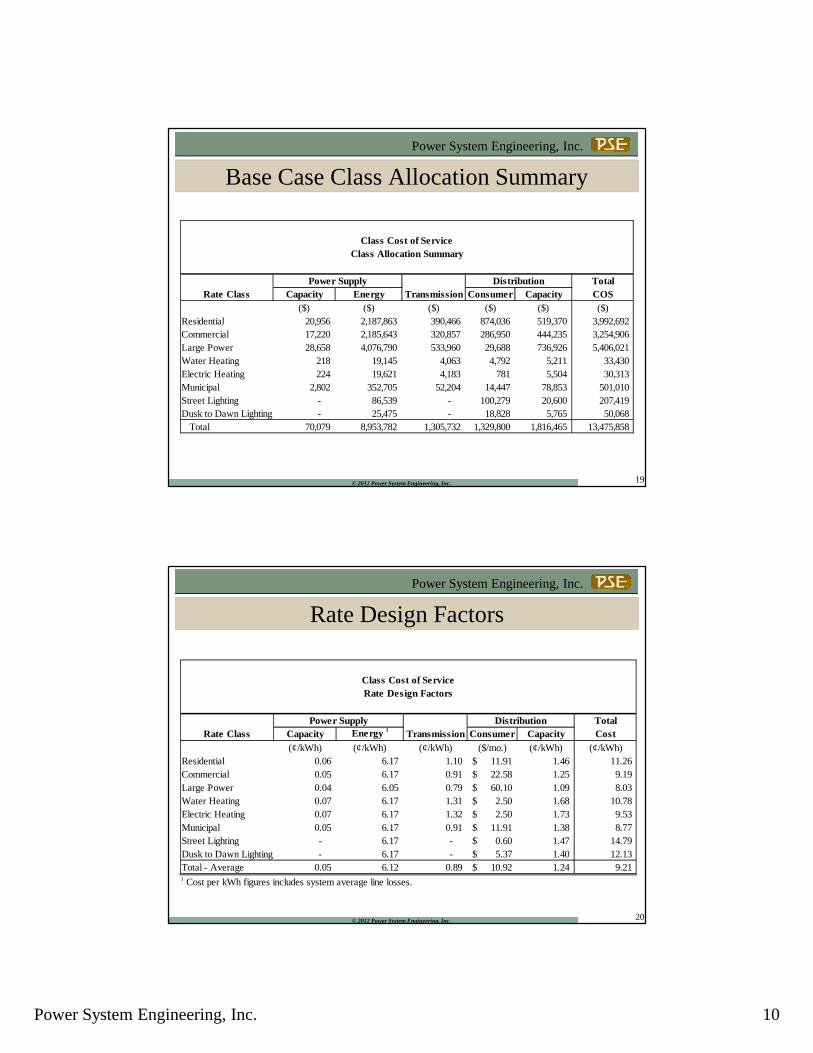
Base Case Class Allocation Summary
19
Class Cost of ServiceClass Allocation Summary
Power Supply Distribution TotalRate Class Capacity Energy Transmission Consumer Capacity COS
($) ($) ($) ($) ($) ($)Residential 20,956 2,187,863 390,466 874,036 519,370 3,992,692 Commercial 17,220 2,185,643 320,857 286,950 444,235 3,254,906 Large Power 28,658 4,076,790 533,960 29,688 736,926 5,406,021 Water Heating 218 19,145 4,063 4,792 5,211 33,430 Electric Heating 224 19,621 4,183 781 5,504 30,313 Municipal 2,802 352,705 52,204 14,447 78,853 501,010 Street Lighting - 86,539 - 100,279 20,600 207,419 Dusk to Dawn Lighting - 25,475 - 18,828 5,765 50,068
Total 70,079 8,953,782 1,305,732 1,329,800 1,816,465 13,475,858
© 2012 Power System Engineering, Inc.
Power System Engineering, Inc.
Rate Design Factors
20
Class Cost of ServiceRate Design Factors
Power Supply Distribution TotalRate Class Capacity Energy 1 Transmission Consumer Capacity Cost
(¢/kWh) (¢/kWh) (¢/kWh) ($/mo.) (¢/kWh) (¢/kWh)Residential 0.06 6.17 1.10 11.91$ 1.46 11.26 Commercial 0.05 6.17 0.91 22.58$ 1.25 9.19 Large Power 0.04 6.05 0.79 60.10$ 1.09 8.03 Water Heating 0.07 6.17 1.31 2.50$ 1.68 10.78 Electric Heating 0.07 6.17 1.32 2.50$ 1.73 9.53 Municipal 0.05 6.17 0.91 11.91$ 1.38 8.77 Street Lighting - 6.17 - 0.60$ 1.47 14.79 Dusk to Dawn Lighting - 6.17 - 5.37$ 1.40 12.13 Total - Average 0.05 6.12 0.89 10.92$ 1.24 9.21 1 Cost per kWh figures includes system average line losses.

Power System Engineering, Inc. 11
© 2012 Power System Engineering, Inc.
Power System Engineering, Inc.
21
Customer Related CostResidential
Line ConsumerNo. Description Related Cost1 Primary Line ($/cons./mo.)2 Depreciation3 Interest4 O&M5 A&G6 Subtotal -$ 78 Transformer9 Depreciation10 Interest10 O&M11 A&G11 Subtotal 0.75$ 12 Meter & Service1314 Depreciation14 Interest15 O&M15 A&G16 Subtotal 4.31$ 1620 Customer Accounting Expense 5.88$ 21 Taxes & Miscellaneous -$ 22 Margins 0.96$ 23 Subtotal24 Total 11.91$
© 2012 Power System Engineering, Inc.
Power System Engineering, Inc.
Cost Study Uses and Limitations
• Provides a reasonable guide for identifying average cost responsibility of customers within a class.
• Results cannot be used to identify the specific cost of providing service to an individual customer.
• Allocating costs is subject to numerous assumptions, philosophy, and methodologies.
22

Power System Engineering, Inc. 12
© 2012 Power System Engineering, Inc.
Power System Engineering, Inc.
TypicalRate Design Objectives
Rates
Fair & Equitable
Financially Adequate
Reflect Cost Causation
Avoid Abrupt
Changes
Customer Acceptance
Promote Efficient
Use
Comparison with
Neighbors
Easy to Explain & Administer
Continuity between Rates
© 2012 Power System Engineering, Inc.
Power System Engineering, Inc.
Rate Design Caveat
• Not all rate design objectives can be simultaneously achieved to their fullest extent.
• Must be balanced based on the philosophy and judgment of the City.
24

Power System Engineering, Inc. 13
© 2012 Power System Engineering, Inc.
Power System Engineering, Inc.
Rate Design ProcessStep 1: Determine rate class decreasesStep 1: Determine rate class decreases• Allocation of increase/(decrease) between rate classes• Cost of service vs. other objectives
Step 2: Design rates to distribute the determined decrease by Step 2: Design rates to distribute the determined decrease by classclass
• Focus on equity or recovery within the rate classes• Customer Charge, Demand Charge, Energy Charges
25
Range of % Decrease
Average = 12.3%
Minimum = 6.15% (1/2 of Average)
Maximum = 18.45% (1 ½ times Average)
© 2012 Power System Engineering, Inc.
Power System Engineering, Inc.
Facility Charge ConsiderationsHigh Low
Cost Causation X X
Revenue Stability (weather) X
Historical Practice X
Neighboring Utilities X X
Customer Acceptance X X
Environmental/Conservation X

Power System Engineering, Inc. 14
© 2012 Power System Engineering, Inc.
Power System Engineering, Inc.
Comparison of Revenue
27
(a) (b) (c) (d) (e) (f)Revenue Revenue
Line Present Proposed Increase/(Decrease)No. Rate Class Rates Rates Amount Percent
($) ($) ($) (%)1 Residential 4,085,899 3,822,805 (263,094) -6.4%2 Commercial 3,811,311 3,151,259 (660,052) -17.3%3 Large Power 6,171,682 5,325,790 (845,892) -13.7%4 Water Heating 33,725 31,521 (2,204) -6.5%5 Electric Heating 31,899 28,450 (3,449) -10.8%6 Municipal 580,762 506,395 (74,366) -12.8%7 Street Lighting 128,400 152,997 24,597 19.2%8 Dusk to Dawn Lighting 57,223 49,904 (7,319) -12.8%9 Total 14,900,900 13,069,122 (1,831,779) -12.3%
Comparison of RevenuePresent and Proposed Rates
© 2012 Power System Engineering, Inc.
Power System Engineering, Inc.
COS Summary Under Proposed Rates
28
Class Cost of ServiceSummary -- Proposed Rates
Proposed Rate Revenue Increase/(Decrease)Rate Class Revenue 1
Requirements Amount Percent($) ($) ($)
Residential 3,934,187 3,992,692 58,504 1.5%Commercial 3,255,156 3,254,906 (250) (0.0%)Large Power 5,494,031 5,406,021 (88,010) (1.6%)Water Heating 32,440 33,430 989 3.1%Electric Heating 29,319 30,313 994 3.4%Municipal 522,227 501,010 (21,217) (4.1%)Street Lighting 156,497 207,419 50,921 32.5%Dusk to Dawn Lighting 51,464 50,068 (1,396) (2.7%)
Total 13,475,322 13,475,858 5361 Includes an allocated share of Other Operating Revenue.

Power System Engineering, Inc. 15
© 2012 Power System Engineering, Inc.
Power System Engineering, Inc.
Rate Design Summary• Increase customer charge and move towards the COS
results and to recover more of the fixed costs to provide service
• Collapse energy blocks and have a flat kWh charge
• Split out Commercial customer charge between Single Phase and Three Phase customers due to increased costs to the City to serve the Three Phase customers
29
© 2012 Power System Engineering, Inc.
Power System Engineering, Inc.
Commercial Class - Single Phase and Three Phase Equipment
30
Single Phase Three Phase

Power System Engineering, Inc. 16
© 2012 Power System Engineering, Inc.
Power System Engineering, Inc.
31
Comparison of Present and Proposed RatesPotential Future
Present Proposed Power CostRates Rates COS COS
ResidentialCustomer Charge
In City @ $3.19 $7.98 $11.91 $11.91 /monthOut of City @ $4.01 $10.03 $11.91 $11.91 /month
Energy ChargeFirst 400 kWh @ $0.11264 $0.09114 $0.08800 $0.10160 /kWhOver 400 kWh @ $0.10151 $0.09114 $0.08800 $0.10160 /kWh
Power Plant Cost Adjustment @ $0.00000 $0.00000 $0.00000 $0.00000 /kWh
CommercialCustomer Charge - Single Phase
In City @ $3.19 $7.98 $22.58 $22.58 /monthOut of City @ $4.01 $10.03 $22.58 $22.58 /month
Customer Charge - Three PhaseIn City @ $3.19 $15.95 $22.58 $22.58 /monthOut of City @ $4.01 $20.05 $22.58 $22.58 /month
Energy ChargeFirst 500 kWh @ $0.13629 $0.08500 $0.08380 $0.09020 /kWhNext 1,500 kWh @ $0.10707 $0.08500 $0.08380 $0.09020 /kWhOver 2,000 kWh @ $0.10151 $0.08500 $0.08380 $0.09020 /kWh
Power Plant Cost Adjustment @ $0.00000 $0.00000 $0.00000 $0.00000 /kWh
© 2012 Power System Engineering, Inc.
Power System Engineering, Inc.
32
Bill Comparison - ResidentialPresent Proposed
Customer Charge Customer Charge In City $3.19 /month In City $7.98 /month Out of City $4.01 /month Out of City $10.03 /monthEnergy Charge Energy Charge First 400 kWh $0.11264 /kWh First 400 kWh $0.09114 /kWh Over 400 kWh $0.10151 /kWh Over 400 kWh $0.09114 /kWhPower Cost Adjustment $0.00000 /kWh Power Cost Adjustment $0.00000 /kWh
kWh/ Estimated Bill Difference Average RateMo. Present Proposed Amount Percent Present Proposed
(kWh/mo) ($) ($) ($) (%) (¢/kWh) (¢/kWh)- 3.19 7.98 4.79 150.00 N.A. N.A.250 31.35 30.76 (0.59) (1.88) 12.54 12.30 500 58.40 53.55 (4.85) (8.31) 11.68 10.71 750 83.77 76.33 (7.44) (8.89) 11.17 10.18
1,000 109.15 99.12 (10.04) (9.20) 10.92 9.91 1,250 134.53 121.90 (12.63) (9.39) 10.76 9.75 1,500 159.91 144.69 (15.22) (9.52) 10.66 9.65 1,750 185.28 167.47 (17.81) (9.61) 10.59 9.57 2,000 210.66 190.26 (20.41) (9.69) 10.53 9.51

Power System Engineering, Inc. 17
© 2012 Power System Engineering, Inc.
Power System Engineering, Inc.
33
Bill Comparison - Residential
-
2.00
4.00
6.00
8.00
10.00
12.00
14.00
250 500 750 1,000 1,250 1,500 1,750 2,000
(¢/
kW
h)
Average Rate
Present Rates
Proposed Rates
© 2012 Power System Engineering, Inc.
Power System Engineering, Inc.
34
Unbundled Rate Example - Residential
BillingRate Class Determinants Units Rate Revenue
Residential ($)Power Supply Charges Energy Charge 35,453,930 kWh $0.06230 2,208,780 Delivery Charges Customer Charge In City 5,861 cons. $7.98 560,898 Out of City 255 cons. $10.03 30,636 Delivery Energy Charge 35,453,930 kWh $0.02884 1,022,491
Total 3,822,805
Per Exhibit 6 3,822,805

Power System Engineering, Inc. 18
© 2012 Power System Engineering, Inc.
Power System Engineering, Inc.
35
Bill Comparison - CommercialPresent Proposed
Customer Charge Customer Charge - Single Phase In City $3.19 /month In City $7.98 /month Out of City $4.01 /month Out of City $10.03 /monthEnergy Charge Energy Charge First 500 kWh $0.13629 /kWh First 500 kWh $0.08500 /kWh Next 1,500 kWh $0.10707 /kWh Next 1,500 kWh $0.08500 /kWh Over 2,000 kWh $0.10151 /kWh Over 2,000 kWh $0.08500 /kWhPower Cost Adjustment $0.00000 /kWh Power Cost Adjustment $0.00000 /kWh
kWh/ Estimated Bill Difference Average RateMo. Present Proposed Amount Percent Present Proposed
(kWh/mo) ($) ($) ($) (%) (¢/kWh) (¢/kWh)- 3.19 7.98 4.79 150.00 N.A. N.A.500 71.34 50.48 (20.86) (29.24) 14.27 10.10
1,000 124.87 92.98 (31.90) (25.54) 12.49 9.30 1,500 178.41 135.48 (42.93) (24.06) 11.89 9.03 2,000 231.94 177.98 (53.97) (23.27) 11.60 8.90 3,000 333.45 262.98 (70.48) (21.14) 11.12 8.77 4,000 434.96 347.98 (86.99) (20.00) 10.87 8.70 5,000 536.47 432.98 (103.50) (19.29) 10.73 8.66 7,500 790.25 645.48 (144.77) (18.32) 10.54 8.61
© 2012 Power System Engineering, Inc.
Power System Engineering, Inc.
36
Bill Comparison - Commercial
-
2.00
4.00
6.00
8.00
10.00
12.00
14.00
16.00
500 1,000 1,500 2,000 3,000 4,000 5,000 7,500
(¢/
kW
h)
Average Rate
Present Rates
Proposed Rates

Power System Engineering, Inc. 19
© 2012 Power System Engineering, Inc.
Power System Engineering, Inc.
Large Power Rate Changes
• Implement a customer charge, currently there is no customer charge for the LP rate.
• Removal of the Load Factor Adjustment, change to a flat demand charge for kW.– The current Load Factor Adjustment has an effective demand
charge of $3.96/kW versus stated $10.71/kW.– Under the Cost of Service analysis, demand cost is $7.65/kW
while under the alternative potential future power supply scenario, the demand costs would be $19.34/kW.
– Recommend starting a transition towards a higher demand charge
• Collapse energy blocks to a flat energy charge versus declining block.
37
© 2012 Power System Engineering, Inc.
Power System Engineering, Inc.
38
Comparison of Present and Proposed RatesPotential Future
Present Proposed Power CostRates Rates COS COS
Large PowerCustomer Charge
In City @ N/A $60.10 $60.10 $60.10 /monthOut of City @ N/A $60.10 $60.10 $60.10 /month
Demand Charge @ $10.71 $8.54 $7.65 $19.34 /kWEnergy Charge
First 50,000 kWh @ $0.08621 $0.05710 $0.06050 $0.03370 /kWhNext 150,000 kWh @ $0.08219 $0.05710 $0.06050 $0.03370 /kWhOver 200,000 kWh @ $0.07817 $0.05710 $0.06050 $0.03370 /kWh
Power Plant Cost Adjustment @ $0.00000 $0.00000 $0.00000 $0.00000 /kWh
Water HeatingCustomer Charge
In City @ $1.63 $2.00 $2.50 $2.50 /monthOut of City @ $2.41 $2.96 $2.50 $2.50 /month
Energy Charge @ $0.09824 $0.08876 $0.09230 $0.11370 /kWhPower Plant Cost Adjustment @ $0.00000 $0.00000 $0.00000 $0.00000 /kWh
Electric Heating
Customer ChargeIn City @ $1.63 $2.00 $2.50 $2.50 /monthOut of City @ $2.41 $2.96 $2.50 $2.50 /month
Energy Charge @ $0.09824 $0.08876 $0.09290 $0.11450 /kWhPower Plant Cost Adjustment @ $0.00000 $0.00000 $0.00000 $0.00000 /kWh

Power System Engineering, Inc. 20
© 2012 Power System Engineering, Inc.
Power System Engineering, Inc.
39
Bill Comparison – Large Power (350kW)Present Proposed
Customer Charge Customer Charge In City $0.00 /month In City $60.10 /month Out of City $0.00 /month Out of City $60.10 /monthDemand Charge $10.71 /kW Demand Charge $8.54 /kWEnergy Charge Energy Charge First 50,000 kWh $0.08621 /kWh First 50,000 kWh $0.05710 /kWh Next 150,000 kWh $0.08219 /kWh Next 150,000 kWh $0.05710 /kWh Over 200,000 kWh $0.07817 /kWh Over 200,000 kWh $0.05710 /kWhPower Plant Cost Adjustment$0.00000 /kWh Power Plant Cost Adjustment$0.00000 /kWh
kWh/ Estimated Bill Difference Average RateLF Mo. Present Proposed Amount Percent Present Proposed
(kWh/mo) ($) ($) ($) (%) (¢/kWh) (¢/kWh)10% 25,200 8,057.64 4,488.02 (3,569.62) (44.30) 31.97 17.81 15% 37,800 7,182.17 5,207.48 (1,974.69) (27.49) 19.00 13.78 20% 50,400 7,285.95 5,926.94 (1,359.01) (18.65) 14.46 11.76 25% 63,000 7,733.03 6,646.40 (1,086.63) (14.05) 12.27 10.55 30% 75,600 8,376.28 7,365.86 (1,010.42) (12.06) 11.08 9.74 35% 88,200 9,131.63 8,085.32 (1,046.31) (11.46) 10.35 9.17 40% 100,800 9,957.04 8,804.78 (1,152.26) (11.57) 9.88 8.73 45% 113,400 10,829.16 9,524.24 (1,304.92) (12.05) 9.55 8.40 50% 126,000 11,733.97 10,243.70 (1,490.27) (12.70) 9.31 8.13 55% 138,600 12,662.56 10,963.16 (1,699.40) (13.42) 9.14 7.91 60% 151,200 13,608.99 11,682.62 (1,926.37) (14.16) 9.00 7.73 65% 163,800 14,569.13 12,402.08 (2,167.05) (14.87) 8.89 7.57 70% 176,400 15,540.05 13,121.54 (2,418.51) (15.56) 8.81 7.44 75% 189,000 16,519.60 13,841.00 (2,678.60) (16.21) 8.74 7.32 80% 201,600 17,499.72 14,560.46 (2,939.26) (16.80) 8.68 7.22 85% 214,200 18,441.38 15,279.92 (3,161.46) (17.14) 8.61 7.13 90% 226,800 19,387.86 15,999.38 (3,388.48) (17.48) 8.55 7.05 95% 239,400 20,338.39 16,718.84 (3,619.55) (17.80) 8.50 6.98
100% 252,000 21,292.35 17,438.30 (3,854.05) (18.10) 8.45 6.92
© 2012 Power System Engineering, Inc.
Power System Engineering, Inc.
40
Bill Comparison – Large Power
-
5.00
10.00
15.00
20.00
25.00
30.00
35.00
(¢/
kW
h)
Average Rate
Present Rates
Proposed Rates

Power System Engineering, Inc. 21
© 2012 Power System Engineering, Inc.
Power System Engineering, Inc.
41
Comparison of Present and Proposed Rates
Potential FuturePresent Proposed Power CostRates Rates COS COS
MunicipalCustomer Charge @ $3.21 $7.98 $11.91 $11.91 /monthEnergy Charge @ $0.10093 $0.08860 $0.08510 $0.09180 /kWhPower Plant Cost Adjustment @ $0.00000 $0.00000 $0.00000 $0.00000 /kWh
Street LightingEnergy Charge @ $0.09156 $0.10910 $0.14790 $0.12060 /kWhPower Plant Cost Adjustment @ $0.00000 $0.00000 $0.00000 $0.00000 /kWh
Dusk to Dawn LightingSmall @ $12.89 $11.24 $11.04 $8.99 /monthLarge @ $19.32 $16.85 $18.46 $13.73 /month
© 2012 Power System Engineering, Inc.
Power System Engineering, Inc.
Rate Recommendation Summary
42
• Implementing a rate decrease of $1,831,000 or 12.3%.– This figure assumes the power plant has been sold or MISO and the
City negotiated a Y-1 agreement. Either of these scenarios results in a $0 cost to the City related to plant operations.
• Opportunity to re-align rate levels and rate structures with COS as a guide and with an eye towards the future.
• The COS shows that not all rates are due the same decrease.• Range of decreases from 6.4% to 17.3%.• Rate Structure Changes
– Customer Charge– Remove declining block Energy Charges– Remove Load Factor Adjustment for Large Power demand billing– Consider power plant recovery rider to recoup power plant
maintenance costs at the determination of the Council at some point in the future

Power System Engineering, Inc. 22
© 2012 Power System Engineering, Inc.
Power System Engineering, Inc.
Community Comparisons - Residential
43
City/UtilityMeter
Charge 300 kWh/mo 800 kWh/mo
Marquette $5.50 First 1,000 kWh $0.07440 $31.72 $75.41Marquette BLP Over 1,000 kWh $0.07000
Manistique $3.40 All kWh $0.09311 $31.98 $79.62Cloverland REA
Menominee $9.00 All kWh $0.08487 $34.46 $76.90WPS
Escanaba $7.98 All kWh $0.09110 $35.32 $80.89Proposed Rates
Escanaba $3.19 First 400 kWh $0.11264 $36.98 $88.85City of Escanaba Over 400 kWh $0.10151
Sturgeon Bay $7.00 All kWh $0.10600 $38.80 $91.80WPPI
Gladstone $8.00 All kWh $0.12010 $44.03 $104.08WPPI
Iron Mountain $9.47 All kWh $0.13145 $48.91 $114.63WE Energies
Ishpeming $11.00 All kWh $0.18350 $66.05 $157.80UPPCO
Energy Charge
Residential Rate Residential Bill
© 2012 Power System Engineering, Inc.
Power System Engineering, Inc.
Community Comparisons - Commercial
44
City/UtilityMeter 40,000 kWh/mo
Charge 4,000 kWh/mo 85 kW
Marquette $13.80 First 3,500 kWh $0.08800 $403.76 $3,445.85Marquette BLP Over 3,500 kWh $0.06000
Manistique $7.40 All kWh $0.10611 $440.48 $4,338.20Cloverland REA
Menominee $22.00 All kWh $0.08925 $379.00 $3,603.80WPS
Escanaba 1 PH - $7.98 All kWh $0.08500 $347.98 $3,415.95Proposed Rates 3 PH - $15.95
Escanaba $3.19 First 500 kWh $0.13629 $434.96 $4,089.32City of Escanaba Next 1,500 kWh $0.10707
Over 2,000 kWh $0.10151
Sturgeon Bay $8.00 All kWh $0.10600 $432.00 $4,248.00WPPI
Gladstone $8.00 All kWh $0.12170 $494.80 $4,013.00WPPI
Iron Mountain $14.79 All kWh $0.13659 $561.15 $4,131.243 - $4,417.842WE Energies
Ishpeming $15.00 All kWh $0.18505 $755.20 $5,625.40UPPCO
Commercial Rate Commercial Bill
Energy Charge

Power System Engineering, Inc. 23
© 2012 Power System Engineering, Inc.
Power System Engineering, Inc.
Community Comparisons – Large Power
45
City/UtilityMeter Demand 60,000 kWh/mo 200,000 kWh/mo
Charge Charge 112 kW 463 kW
Marquette $0.00 $7.80 All kWh $0.06499 $5,025.40 $16,609.40Marquette BLP
Manistique $600.00 $4.90First 300kwh/kw $0.08511 $6,385.00 $20,078.30Cloverland REA Next 200kwh/kw $0.08111
Over 500kwh/kw $0.07911
Menominee $115.00 $8.72On-Peak (16hrs) $0.06197 $4240.441 - $4809.842 $14,648.361 - $16,546.362
WPS Off-Peak (8hrs) $0.03350
Escanaba $60.10 $8.54All kWh $0.05710 $4,442.58 $15,434.12Proposed Rates
Escanaba $0.00 $10.71 First 50,000 kwh $0.08621 $5,385.51 $17,936.64City of Escanaba Next 150,000 kwh $0.08219
Over 200,000 $0.07817
Sturgeon Bay $100.00 $9.00On-Peak (12hrs) $0.08600 $4,832.00 $17,167.003 - $21,467.002WPPI Off-Peak (12hrs) $0.04300
Gladstone $75.50 $8.50 All kWh $0.07590 $5,581.50 $19,191.00WPPI
Iron Mountain $83.84 $18.53 On-Peak (12hrs) $0.06898 $5,867.763 - $6,297.662 $21,024.843 - $22,457.842
WE Energies Off-Peak (12hrs) $0.05465
Ishpeming $250.00 $15.50 On-Peak (16hrs) $0.09630 $8,222.60 $24,440.501 - $26,686.502UPPCO Off-Peak (8hrs) $0.06261
Large Power Rate Large Power Bill
Energy Charge
© 2012 Power System Engineering, Inc.
Power System Engineering, Inc.
Questions?
46

Power System Engineering, Inc. 24
© 2012 Power System Engineering, Inc.
Power System Engineering, Inc.
Joe Aliperto
Rate and Financial Analyst
Economics, Rates, and Business Planning
Office: 763-783-5340
Mobile: 651-285-7676
Email: [email protected]
Website: www. powersystem.org
Thank You!Thank You!
47