city of fairburn georgia
TRANSCRIPT

CITY OF FAIRBURN GEORGIA
COMPREHENSIVE ANNUAL FINANCIAL REPORT
FISCAL YEAR ENDED SEPTEMBER 30, 2018

CITY OF FAIRBURN, GEORGIA COMPREHENSIVE ANNUAL FINANCIAL REPORT
FOR THE FISCAL YEAR ENDED SEPTEMBER 30, 2018
TABLE OF CONTENTS Page INTRODUCTORY SECTION (Unaudited)
Letter of Transmittal ....................................................................................................................................... i-vi GFOA Certificate of Achievement .................................................................................................................. vii City Officials .................................................................................................................................................... viii Organizational Chart ........................................................................................................................................ ix
FINANCIAL SECTION Independent Auditor's Report ....................................................................................................................... 1-3 Management’s Discussion and Analysis ................................................................................................... 4-15 Basic Financial Statements:
Government-wide Financial Statements: Statement of Net Position ..................................................................................................................... 16 Statement of Activities ........................................................................................................................... 17 Fund Financial Statements: Balance Sheet – Governmental Funds .................................................................................................. 18 Statement of Revenues, Expenditures, and Changes in Fund Balances – Governmental Funds ...................................................................................................... 19 Reconciliation of the Statement of Revenues, Expenditures, and Changes in Fund Balances of Governmental Funds to the Statement of Activities ........................................ 20 General Fund – Statement of Revenues, Expenditures, and Changes in Fund Balances – Budget and Actual ................................................................................................. 21 Statement of Net Position – Proprietary Funds .................................................................................... 22 Statement of Revenues, Expenses, and Changes in Fund Net Position – Proprietary Funds ............................................................................................................. 23 Statement of Cash Flows – Proprietary Funds .................................................................................... 24 Notes to Financial Statements .................................................................................................................. 25-57 Required Supplementary Information – Retirement Plan Schedule of Changes in the City’s Net Pension Liability and Related Ratios ........................................ 58 Schedule of City Contributions ................................................................................................................... 59 Combining and Individual Fund Statements and Schedules: Combining Balance Sheet – Nonmajor Governmental Funds ................................................................. 60 Combining Statement of Revenues, Expenditures, and Changes in Fund Balances – Nonmajor Governmental Funds ......................................................................................... 61 Schedule of Revenues, Expenditures, and Changes in Fund Balances – Budget and Actual – Confiscated Assets Fund ................................................................ 62 Schedule of Revenues, Expenditures, and Changes in Fund Balances – Budget and Actual – Grants Fund ...................................................................................... 63

CITY OF FAIRBURN, GEORGIA COMPREHENSIVE ANNUAL FINANCIAL REPORT
FOR THE FISCAL YEAR ENDED SEPTEMBER 30, 2018
TABLE OF CONTENTS Page
Combining and Individual Fund Statements and Schedules (Continued): Schedule of Revenues, Expenditures, and Changes in Fund Balances – Budget and Actual – TSPLOST Capital Projects Fund ......................................................... 64 Schedule of Revenues, Expenditures, and Changes in Fund Balances – Budget and Actual – General Obligation Bond Capital Projects Fund ............................... 65 Schedule of Projects Constructed with Transportation Special Purpose Local Option Sales Tax Proceeds…............................................................................................................66 STATISTICAL SECTION (Unaudited)
Net Position by Component ........................................................................................................................... 67 Changes in Net Position ..................................................................................................................... 68 and 69 Fund Balances of Governmental Funds ....................................................................................................... 70 Changes in Fund Balances of Governmental Funds ................................................................................... 71 Governmental Activities Tax Revenues by Source ...................................................................................... 72 Assessed Value and Estimated Actual Value – All Taxable Property......................................................... 73 Direct and Overlapping Property Tax Rates ................................................................................................. 74 Principal Property Tax Payers ........................................................................................................................ 75 Property Tax Levies and Collections ............................................................................................................. 76 Ratio of Outstanding Debt by Type ............................................................................................................... 77 Direct and Overlapping Governmental Activities Debt ................................................................................ 78 Legal Debt Margin ........................................................................................................................................... 79 Pledged Revenue Bond Coverage – Water & Sewer Fund & Electric Fund .............................................. 80 Pledged Revenue Bond Coverage – Educational Complex Fund .............................................................. 81 Demographic and Economic Statistics ......................................................................................................... 82 Principal Employers ........................................................................................................................................ 83 Full-Time Equivalent City Government Employees by Function/Program ................................................ 84 Operating Indicators by Function/Program .................................................................................................. 85 Capital Assets by Function/Program ............................................................................................................. 86

INTRODUCTORY SECTION (Unaudited)

August 9, 2019
The Honorable Elizabeth Carr-Hurst, Mayor Members of the Fairburn City Council and Citizens of the City of Fairburn
Dear Mayor, Council Members and Citizens:
The Comprehensive Annual Financial Report (CAFR) of the City of Fairburn, GA for the fiscal year ended September 30, 2018, is submitted herewith. Responsibility for both the accuracy of the data and the completeness and fairness of the presentation, including all disclosures, rests with the management of the City. To the best of our knowledge, the enclosed data are accurate in all material aspects and fairly present the financial position and results of operations of the City. All disclosures necessary to enable interested citizens to gain a reasonable understanding of the City’s financial affairs are included.
To provide a reasonable basis for making its representations, management has established a comprehensive framework of internal controls surrounding the accounting system. Internal accounting controls are designed to provide a reasonable, but not absolute, assurance regarding: (1) the safeguarding of assets against loss from unauthorized use or disposition; and (2) the reliability of financial records for preparing financial statements and maintaining accountability for assets. The concept of reasonable assurance recognizes that: (1) the cost of control should not exceed the benefits likely to be derived; and (2) the evaluation of costs and benefits requires estimates and judgments by management. All internal control evaluations occur within the above framework. We believe that the City’s internal accounting controls adequately safeguard assets and provide reasonable assurance of proper recording of financial transactions.
In compliance with state laws requiring an annual audit by independent certified public accountants, the financial statements for the fiscal year ended September 30, 2018, were audited by Mauldin & Jenkins, LLC, a firm of licensed certified public accountants. The goal of an independent audit is to provide reasonable assurance that the financial statements are free of material misstatements. The audit involved performing procedures to obtain audit evidence supporting the amounts and disclosures in the financial statements; assessing the accounting principles used and evaluating the risks of material misstatement whether due to fraud or error. Mauldin & Jenkins rendered an unmodified opinion and it is included in this report. Their audit was conducted in accordance with auditing standards generally accepted in the United States of America and with Government Auditing Standards issued by the Comptroller of the United States of America. An unmodified opinion indicates that the audit did not disclose any conditions that would cause the basic financial statements not to be fairly presented in all material aspects. The independent auditor’s report can be found at the beginning of the financial section.

ii
Generally accepted accounting principles require that management provide a narrative introduction, overview and analysis to accompany the basic financial statements in the form of Management’s Discussion and Analysis (MD&A). The letter of transmittal is designed to complement the MD&A and should be read in conjunction with it. The City of Fairburn’s MD&A can be found immediately following the independent auditor’s report.
Profile of the City of Fairburn
The territory on which the City of Fairburn was originally located was ceded to the State of Georgia by the Creek Indians in the treaty of Indian Springs in 1825. U.S. Government records show a settlement as early as 1830, but the City’s real growth began with the construction of the Atlanta and West Point Railroad in 1854. The City of Fairburn was incorporated on February 17, 1854 and adopted its City Charter on August 3, 1925 (Georgia Statutes 1925).
It is believed that Fairburn was named for a township in the County of York, England by William McBride, the City’s first postmaster, to honor his ancestral hometown. Fairburn was once the county seat for Campbell County, Georgia, from 1870 until the County was dissolved in 1931. A telephone system was installed in 1905 and the City received electric lights in 1911. Fairburn gained worldwide distinction in 1921 by erecting the first monument to World War I.
City Administration and Officials
The City of Fairburn operates as a Mayor/Council form of government with a City Administrator. The Mayor and six council members are part-time employees. The Mayor, who is currently acting as the City administrator, is also the City’s Chief Executive Officer. A full-time City Administrator is appointed by and serves at the pleasure of the Mayor and Council and is responsible for carrying out their policy directives and managing the day-to-day operations of the City. The Mayor and City Council are elected by the entire City and serve “at large” rather than representing various districts. Each year at the first regularly scheduled meeting in January, the Council elects a Mayor Pro Tem from among its members. Fairburn’s Mayor Pro Tem assumes all duties and powers of the Mayor during the Mayor’s absence or disability. The Mayor and Council Members serve four-year staggered terms. The Mayor presides at all meetings of the City Council; however, the Mayor can only cast tie-breaking votes. It is the responsibility of the Fairburn City Council to set policy for City operations, to set millage rates for property taxes, to approve a balanced budget for the City’s operations, to pass ordinances and to hear and act on requests for rezoning and annexation. The Code for the State of Georgia requires the City to adopt by local resolution an annual balanced budget. The annual budget serves as the foundation for the City’s financial planning and control. The budget is prepared by fund, function and department and is closely monitored throughout the year. All activities of the City including: the general fund, the special revenue funds, the debt

iii
service fund, the capital project funds and enterprise funds are included in the annual budget. The City’s legal level of control is at the department level. Administrative budgetary control; however, is maintained at the line item level. As conditions change, the budget process allows for transfers and amendments. Transfers of funds within a department may be authorized by the budget officer to meet unforeseen needs without Council action. Increases in departmental or fund appropriations (amendments) are approved by the Council.
City Services
The City of Fairburn provides a range of municipal government services to its residents including: police and fire protection; planning and engineering; code enforcement; street maintenance; municipal court; traffic control and park operations and maintenance. In addition, electric, water, sewer and storm water services are provided to residents of the City and are primarily financed by charges to the customers of the related service. Solid waste collection and disposal services are offered to the citizens through a contractual agreement.
Local Economy As a part of the Atlanta Metropolitan area, Fairburn is positioned for significant economic growth with easy access to markets in the Northeastern, Southern and Midwestern States by air, rail, or highway. The City of Fairburn is located ten miles south of Atlanta Hartsfield-Jackson International Airport, the world’s busiest airport. A mainline operated by CSX provides access to their growing Fairburn intermodal yard. The community is bisected by Interstate 85 and contains portions of three state highways. Downtown Fairburn is about a 25-minute drive from the intersection of I-75, I-85, and I-20 in downtown Atlanta near Georgia State Stadium and the State Capital. Fairburn works in partnership with a wide range of organizations to market the area to potential developers. The Economic & Community Development Group of the Electric Cities of Georgia is an important partner in marketing the City to developers and in helping to provide extensive support to existing utility customers. The Fulton County Development Authority and the State of Georgia’s Department of Economic Development also regularly present Fairburn to interested site locators. Fairburn is the long-time home to several large manufacturing facilities. Nestle-Purina’s Fairburn plant has laid claim to be the largest dry pet food manufacturing facility in the world. Owens-Corning and Porex celebrated their 40th and 50th anniversaries, respectively, during this decade. These businesses remain some of the region’s largest employers. We’re also home to many regional distribution facilities, including US Foods, Pittsburgh Paint & Glass, Toto, Duracell/Sonoco/DHL; Google; Electrolux, Pangborn, Mobis, Smuckers, S.C. Johnson, Clorox, and Aaron Rents. These large warehouses take advantage of Fairburn’s proximity to downtown Atlanta, the Atlanta Airport, and the CSX intermodal facilities, as well as its easy access to I-85. It is because of these amenities that Fairburn continues to attract large industrial warehouse users. And to ensure City residents and others in South Fulton have access to the employment opportunities these companies

iv
provide, the City’s strategic investment in the Fairburn Educational Campus aims to create a qualified workforce to meet the employment needs of its business sector. The Fairburn Educational Campus is home to two educational institutions; Brenau University South and Georgia Military College. The City has seen several signs that the local economy is growing and thriving. The collection of City revenues have increased by 64% over the last five years. In addition, the City continues to focus on plans for residential and economic growth. Retail sales are also steadily increasing as evidenced by the growth in the Local Option Sales Taxes; 19% over the last 4 years which is when the City of Fairburn’s allocation increased due to an increase in the City’s population (40% over the last 8 years). New home permits have increased 760% and commercial permits have increased 137.5% over the last 5 years. The City’s proximity to the Pinewood Atlanta Studio in adjoining Fayette County and Atlanta Metro Studies in Union City bodes well for future economic development. Fairburn’s State Road (SR) 74 interchange on Interstate 85 is the gateway to Pinewood from both downtown Atlanta and the Atlanta Airport, creating an opportunity for commercial and residential growth that caters to the Studio’s users and suppliers. Fairburn strives to capitalize on the ever-expanding film industry and associated careers by teaming with our local colleges to offer training in these fields. Fairburn continues to be the home of the Georgia Renaissance Festival, a re-creation of a 16th-Century European Country Faire. Located on 120 acres just minutes from downtown Fairburn, the festival attracts more than 250,000 visitors annually. As part of Fairburn’s marketing strategy, the City looks to partner with the Renaissance Festival to capture some of the tourism dollars this event generates. The City has been building upon its inherent strengths in areas such as location, transportation, infrastructure and partnerships. Overall, the City’s economic development, both residential and commercial/industrial, is on the upswing. The unemployment rate is declining (24%) and our population is steadily increasing indicating that the City has a solid base to its financial position. The increase in revenue in conjunction with the reduction in spending has enabled the City to remain consistent with the services offered to its citizens and has allowed the City to remain fiscally strong.
Long-Term Financial Planning The City’s transportation improvements will be funded with the 2016 Transportation Special Purpose Local Option Sales Tax (TSPLOST). On November 8, 2016, voters approved the TSPLOST. This seventy-five cents sales tax program can only be spent on transportation improvements; such as roads, bridges, sidewalks, bicycle paths and signal lights. The TSPLOST will be collected from April 1, 2017 to March 30, 2022 or until a maximum of $655 million is reached by Fulton County. The City anticipates collecting a minimum of $13,751,484 over the 5-year life of the program. The recommended unassigned general fund balance for the City of Fairburn is 17% of expenditures. The Mayor and Council approved a policy to maintain a general fund balance of 20-30%. Currently the City of Fairburn has 52% of expenditures in unassigned general fund

v
balance. The City of Fairburn is placing an emphasis on financial stability which includes increasing revenues, reducing expenditures and minimizing debt. The City has devoted attention to the redevelopment of various areas of the City. The City is also focused on developing the SR 74 corridor. Attracting more restaurants and businesses for both the downtown area and the SR 74 corridor are top priorities.
Relevant Financial Policies The City of Fairburn operates under a set of fiscal policies to ensure the City is financially sound. These policies cover five financial areas: 1) budget, 2) capital, 3) revenue, 4) fund balance and 5) debt. Below is a summary of those policies which are relevant to understanding the financial statements and the financial condition of the City.
1. The City of Fairburn will finance all current expenditures with current revenues. Fairburn will avoid balancing current expenditures through the obligation of future resources. The City will adopt a balanced annual operating budget each year.
2. Capital budgeting is essential and prevents excessive costs in any one budget year. Capital
purchases maintains the City’s infrastructure. The City continued a multi-year initiative to resurface roads, build sidewalks, upgrade/replace traffic control devices and other transportation related purposes. Capital transportation projects are currently funded by the 2016 TSPLOST.
3. The City of Fairburn has a stable and diversified revenue structure. Revenues that are unique to a particular year and are considered one-time are not used for ongoing expenditures.
4. Fairburn strives to maintain an unassigned General Fund balance of at least 20-30% of expenditures to offset economic downturn and to ensure sufficient resources for current liabilities. Unassigned fund balances will only be used for one-time expenditures and not recurring operating expenditures.
Major Initiatives The City is committed to promoting community development and improving the infrastructure. Among the City’s top priorities is the redevelopment of various areas within the City including the downtown area and the SR 74 corridor. To address some of the priorities of the City, the citizens of Fairburn approved a 2016 TSPLOST to fund various transportation projects over the course of five years. The FY18 projects included: 1) resurfacing 13 miles of roads, 2) reconstructing 2.5 miles of roads, 3) installing 7,795 linear feet of sidewalks, 4) installing roadway lighting, 5) installing medians 6) constructing .5 mile of new roads and 7) installation of handicap ramps. Other initiatives included the Gateway Project which was a joint venture with Union City to upgrade the pedestrian facilities at the intersection of SR 14/US 29 and SR 138. The project

vi
included enhancements such as a pedestrian plaza with decorative pavers, a seat wall, gateway signage and landscaping as well as a bus pull out lane. The design for the Park and Ride lot was completed and construction began. Future expansion will include bus pull outs and shelters. The project will relieve traffic on SR 74 during peak hours. Fairburn continues to improve and upgrade its public infrastructure projects including the Frankie Mae Arnold Stage and Courtyard in the downtown area. The City began constructing fishing/viewing docks at Duncan Park. There will be a total of 4 docks once they are complete. Security cameras were added to the Park as well as fencing around the basketball courts. City Hall and the police station were renovated. The City plans to change the software program for utilities and place them on the same software as the Finance Department. The migration will prevent the Finance Department from re-entering information from one system into another and increasing the risk for human error. It will also provide real-time information.
Awards And Acknowledgements The Government Finance Officers Association of the United States and Canada (GFOA) awarded a Certificate of Achievement for Excellence in Financial Reporting to the City of Fairburn for its Comprehensive Annual Financial Report (CAFR) for the fiscal year ended September 30, 2017. This was the thirtieth consecutive year and the thirty-third time that the City has achieved this prestigious award. In order to be awarded a Certificate of Achievement, the City must publish an easily readable and efficiently organized comprehensive annual financial report. This report must satisfy both generally accepted accounting principles and applicable legal requirements. The Certificate of Achievement is valid for one year. We believe that our current comprehensive annual financial report continues to meet the Certificate of Achievement Program’s requirements and we are submitting this report to GFOA to determine its eligibility for another certificate. The preparation of this report was accomplished with the dedicated efforts of the Finance Department staff and through the cooperation of all City departments. We appreciate the dedication and support of each staff member for the contributions made in the preparation of this report. We would also like to thank the Mayor and City Council for the support and guidance they have given us in planning and conducting the financial operations of the City in a responsible and progressive manner. Respectfully Submitted,
Angela Jackson Angela Jackson Finance Director

vii

viii
CITY OF FAIRBURN, GEORGIA CITY OFFICIALS
SEPTEMBER 30, 2018
CITY COUNCIL Elizabeth Carr-Hurst, Mayor
James Whitmore- Mayor Pro Tem Linda J. Davis
Alex Heath Pat Pallend
Hattie Portis-Jones Ulysses Smallwood
CITY ADMINISTRATOR
Vacant
CITY CLERK Keshia McCullough
HUMAN RESOURCE DIRECTOR
Linda Johnson
FINANCE DIRECTOR Vacant
CHIEF OF POLICE
Stoney Mathis
INTERIM FIRE CHIEF Cornelius Robinson
COMMUNITY DEVELOPMENT DIRECTOR
Lester Thompson
UTILITY DIRECTOR Tom Ridgway
BUILDING INSPECTOR
Harvey Stokes
CITY ATTORNEYS Turner Ross Germain, LLC

Mayor
City Administrator
Human Resources
City of Fairburn, GeorgiaORGANIZATIONAL CHART
Finance Department
Utilities Department Fire Department Police Department Community
Development/City
Engineer
Recreation Services Property & Building
Management
Senior Executive Asst
City Clerk
Court
Services
Planning &
Zoning
Code
Enforcement
Streets
City Attorney
Council
Permits
WaterElectric
Technology
Boards & Committees
CITY ELECTORATE
ix

FINANCIAL SECTION

INDEPENDENT AUDITOR'S REPORT To the Honorable Mayor and Members of the City Council City of Fairburn, Georgia Report on the Financial Statements
We have audited the accompanying financial statements of the governmental activities, the business-type activities, each major fund, and the aggregate remaining fund information of the City of Fairburn, Georgia (the “City”) as of and for the fiscal year ended September 30, 2018, and the related notes to the financial statements, which collectively comprise the City of Fairburn, Georgia’s basic financial statements as listed in the table of contents. Management’s Responsibility for the Financial Statements
Management is responsible for the preparation and fair presentation of these financial statements in accordance with accounting principles generally accepted in the United States of America; this includes the design, implementation, and maintenance of internal control relevant to the preparation and fair presentation of financial statements that are free from material misstatement, whether due to fraud or error.
Auditor’s Responsibility
Our responsibility is to express opinions on these financial statements based on our audit. We conducted our audit in accordance with auditing standards generally accepted in the United States of America and the standards applicable to financial audits contained in Government Auditing Standards, issued by the Comptroller General of the United States. Those standards require that we plan and perform the audit to obtain reasonable assurance about whether the financial statements are free from material misstatement.
An audit involves performing procedures to obtain audit evidence about the amounts and disclosures in the financial statements. The procedures selected depend on the auditor’s judgment, including the assessment of the risks of material misstatement of the financial statements, whether due to fraud or error. In making those risk assessments, the auditor considers internal control relevant to the entity’s preparation and fair presentation of the financial statements in order to design audit procedures that are appropriate in the circumstances, but not for the purpose of expressing an opinion on the effectiveness of the entity’s internal control. Accordingly, we express no such opinion. An audit also includes evaluating the appropriateness of accounting policies used and the reasonableness of significant accounting estimates made by management, as well as evaluating the overall presentation of the financial statements.
We believe that the audit evidence we have obtained is sufficient and appropriate to provide a basis for our audit opinions.
200 GALLERIA PARKWAY S.E., SUITE 1700 • ATLANTA, GA 30339-5946 • 770-955-8600 • 800-277-0080 • FAX 770-980-4489 • www.mjcpa.com Members of The American Institute of Certified Public Accountants

2
Opinions In our opinion, the financial statements referred to above present fairly, in all material respects, the respective financial position of the governmental activities, the business-type activities, each major fund, and the aggregate remaining fund information of the City of Fairburn, Georgia, as of September 30, 2018, and the respective changes in financial position and, where applicable, cash flows thereof and the budgetary comparison for the General Fund for the fiscal year then ended in accordance with accounting principles generally accepted in the United States of America. Other Matters Required Supplementary Information Accounting principles generally accepted in the United States of America require that the Management’s Discussion and Analysis, the Schedule of Changes in the City’s Net Pension Liability and Related Ratios, and the Schedule of City Contributions on pages 4 through 15 and pages 58 and 59, respectively) be presented to supplement the basic financial statements. Such information, although not a part of the basic financial statements, is required by the Governmental Accounting Standards Board who considers it to be an essential part of financial reporting for placing the basic financial statements in an appropriate operational, economic, or historical context. We have applied certain limited procedures to the required supplementary information in accordance with auditing standards generally accepted in the United States of America, which consisted of inquiries of management about the methods of preparing the information and comparing the information for consistency with management’s responses to our inquiries, the basic financial statements, and other knowledge we obtained during our audit of the basic financial statements. We do not express an opinion or provide any assurance on the information because the limited procedures do not provide us with sufficient evidence to express an opinion or provide any assurance. Other Information Our audit was conducted for the purpose of forming opinions on the financial statements that collectively comprise the City of Fairburn, Georgia’s basic financial statements. The combining and individual nonmajor fund financial statements and schedules, the schedule of projects constructed with transportation special purpose local option sales tax proceeds, and introductory and statistical sections, are presented for purposes of additional analysis and are not a required part of the basic financial statements.

3
The combining and individual nonmajor fund financial statements and schedules, and the schedule of projects constructed with transportation special purpose local option sales tax proceeds (collectively the “supplementary information”) are the responsibility of management and were derived from and relate directly to the underlying accounting and other records used to prepare the basic financial statements. Such information has been subjected to the auditing procedures applied in the audit of the basic financial statements and certain additional procedures, including comparing and reconciling such information directly to the underlying accounting and other records used to prepare the basic financial statements or to the basic financial statements themselves, and other additional procedures in accordance with auditing standards generally accepted in the United States of America. In our opinion, the supplementary information is fairly stated, in all material respects, in relation to the basic financial statements as a whole. The introductory and statistical sections have not been subjected to the auditing procedures applied in the audit of the basic financial statements and, accordingly, we do not express an opinion or provide any assurance on them. Other Reporting Required by Government Auditing Standards In accordance with Government Auditing Standards, we have also issued our report dated August 9, 2019 on our consideration of the City of Fairburn, Georgia’s internal control over financial reporting and on our tests of its compliance with certain provisions of laws, regulations, contracts, and grant agreements and other matters. The purpose of that report is solely to describe the scope of our testing of internal control over financial reporting and compliance and the results of that testing, and not to provide an opinion on effectiveness of the City of Fairburn, Georgia’s internal control over financial reporting or on compliance. That report is an integral part of an audit performed in accordance with Government Auditing Standards in considering the City of Fairburn, Georgia’s internal control over financial reporting and compliance.
Atlanta, Georgia August 9, 2019
City of Fairburn, Georgia Management’s Discussion and Analysis
September 30, 2018
4
As management of the City of Fairburn (the “City”), we offer readers of the City’s financial statements this narrative overview and analysis of the financial activities of the City for the fiscal year ended September 30, 2018. We encourage readers to consider the information presented here in conjunction with additional information that we have furnished in the financial statements and the notes to the financial statements. FINANCIAL HIGHLIGHTS Key financial highlights for fiscal year 2018 are as follows:
• The assets and deferred outflows of resources of the City of Fairburn exceeded its liabilities and deferred inflows of resources at the close of the fiscal year by $67,559,594 (net position). Of this amount, $42,699,868 is invested in capital assets, net of related debt; $3,487,216 is restricted; and $21,372,510 is unrestricted and may be used to meet the City's ongoing obligations to citizens and creditors.
• The City’s total net position increased by $7,231,193 as compared to an increase of $3,850,086 in the prior fiscal year.
• At the end of the current fiscal year, total fund balance for the General Fund was $7,619,669, an increase of $1,816,864 over the prior fiscal year.
• Transfers from Enterprise Funds for General Fund operations were $1,491,643 and $1,250,000 in fiscal 2018 and 2017, respectively.
OVERVIEW OF THE FINANCIAL STATEMENTS This Discussion and Analysis is intended to serve as an introduction to the City's basic financial statements. The City’s basic financial statements are comprised of three components: (1) government-wide financial statements, (2) fund financial statements, and (3) notes to those financial statements. This report also contains other supplementary information in addition to the basic financial statements themselves. Government-wide Financial Statements The government-wide financial statements are designed to provide readers with a broad overview of the City's finances, in a manner similar to a private-sector business. All governmental and business-type activities are consolidated to arrive at a total for the Primary Government. There are two government-wide statements, the statement of net position and the statement of activities, which are described below. The statement of net position presents information on all of the City’s assets, deferred outflows of resources, deferred inflows of resources, and liabilities, with the difference between these reported as net position. Over time, increases or decreases in net position may serve as a useful indicator of whether the financial position of the City is improving or deteriorating. It is important to note that this statement consolidates the governmental fund’s current financial resources (short-term) with capital assets and long-term liabilities. The statement of activities presents information showing how the government's net position changed during the most recent fiscal year. All changes in net position are reported as soon as the underlying event giving rise to the change occurs, regardless of the timing of related cash flows. Thus, revenues and expenses are reported in this statement for some items that will only result in cash flows in future fiscal periods (e.g., uncollected taxes and earned but unused vacation leave). The governmental activities of the City include general government, judicial, public safety, public works, culture and recreation, and planning and development.

City of Fairburn, Georgia Management’s Discussion and Analysis
September 30, 2018
5
The business-type activities of the City include electric, water and sewer, educational complex, stormwater, and sanitation. The City's government-wide financial statements are presented on pages 16 and 17. Reporting the City’s Most Significant Funds Unlike government-wide financial statements, the focus of fund financial statements is directed at specific activities of the City rather than the City as a whole. Except for the General Fund, a special revenue fund is established to satisfy managerial control over committed resources or to satisfy finance-related legal requirements established by external parties or governmental statutes or regulations. The City's fund financial statements are divided into two broad categories, namely, (1) governmental funds and (2) proprietary funds. Governmental Funds Governmental fund financial statements consist of a balance sheet and statement of revenues, expenditures, and change in fund balances and are prepared on an accounting basis that is significantly different from that used to prepare the government-wide financial statements. In general, these financial statements have a short-term emphasis and, for the most part, measure and account for cash and other assets that can easily be converted to cash. For example, amounts reported on the balance sheet include items such as cash and receivables collectible within a fiscal year, but do not include capital assets such as land and buildings. Fund liabilities include amounts that are to be paid within a fiscal year. The difference between a fund's total assets, deferred inflows of resources, and total liabilities is labeled as the fund balance, and generally indicates the amount that can be used to finance the next fiscal year's activities. Likewise, the statement of revenues, expenditures, and changes in fund balances for governmental funds reports only those revenues and expenditures that were collected in cash or paid with cash, respectively, during the current period or very shortly after the end of the fiscal year. For the most part, the balances and activities accounted for in governmental funds are also reported in the governmental activities columns of the government-wide financial statements. However, because different accounting basis are used to prepare fund financial statements, there are often significant differences between the totals presented in these financial statements. For this reason, there is an analysis at the bottom of the balance sheet that reconciles the total fund balances to the amount of net position presented in the governmental activities column on the statement of net position. Also, on page 20, there is a reconciliation of the statement of revenues, expenditures, and changes in fund balance of governmental funds to the statement of activities. The City presents in separate columns funds that are most significant to the City (major funds) and all other governmental funds are aggregated and reported in a single column (non-major funds). The City's governmental fund financial statements are presented on pages 18 and 19.

City of Fairburn, Georgia Management’s Discussion and Analysis
September 30, 2018
6
Proprietary Funds Proprietary fund financial statements consist of a statement of net position, the statement of revenues, expenses, and changes in fund net position and the statement of cash flows, which are prepared on the full accrual basis of accounting. For financial reporting purposes, proprietary funds are grouped into Enterprise Funds. The City uses Enterprise Funds to account for business-type activities that typically charge fees to customers for the use of specific goods or services. Balances and activities accounted for in the City's Enterprise Funds are also reported in the business-type activities columns of the government-wide financial statements and use the same basis of accounting as the government-wide statements. The City presents in separate columns Enterprise Funds that are most significant to the City (major enterprise funds) and all other Enterprise Funds are aggregated and reported in a single column. A statement of cash flows is presented at the fund financial statement level for proprietary funds. The City's proprietary fund financial statements are presented on pages 22 - 24. Overview of the City’s Financial Position and Operations The City's overall financial position and operations for the past two fiscal years are summarized as follows based on the information included in the government-wide financial statements (see pages 16 and 17):
City of Fairburn Summary of Net Position
Governmental Activities Business-type Activities TotalAssets: 2018 2017 2018 2017 2018 2017Current and other assets 13,866,285$ 10,517,405$ 20,876,373$ 18,541,874$ 34,742,658$ 29,059,279$ Capital assets, net 32,417,737 30,237,919 39,369,048 40,294,570 71,786,785 70,532,489 Total assets 46,284,022 40,755,324 60,245,421 58,836,444 106,529,443 99,591,768
Deferred outflows of resources 1,541,710 820,167 1,919,998 760,145 3,461,708 1,580,312
Liabilities:Other liabilities 3,893,612 2,353,051 4,160,435 3,974,639 8,054,047 6,327,690 Long-term liabilities 9,054,412 9,242,579 24,220,449 24,383,997 33,274,861 33,626,576 Total liabilities 12,948,024 11,595,630 28,380,884 28,358,636 41,328,908 39,954,266
Deferred inflows of resources 1,017,897 787,420 84,752 101,993 1,102,649 889,413
Net position:Net investment in capital assets 25,016,287 22,594,407 17,683,581 17,963,925 42,699,868 40,558,332 Restricted 2,367,845 2,495,233 1,119,371 69,371 3,487,216 2,564,604 Unrestricted 6,475,679 4,102,801 14,896,831 13,102,664 21,372,510 17,205,465 Total net position 33,859,811$ 29,192,441$ 33,699,783$ 31,135,960$ 67,559,594$ 60,328,401$

City of Fairburn, Georgia Management’s Discussion and Analysis
September 30, 2018
7
Financial Position The total net position of the City increased $7,231,193 or 12%, from $60,328,401 to $67,559,594 as noted in the following table.
City of Fairburn Summary of Changes in Net Position
Governmental Activities Business-type Activities Total2018 2017 2018 2017 2018 2017
Revenues: Program revenues Charges for services 2,936,355$ 2,967,781$ 18,412,160$ 17,451,224$ 21,348,515$ 20,419,005$ Capital grants and contributions 3,208,554 1,793,672 1,162,300 1,085,970 4,370,854 2,879,642
General revenues: Property taxes 5,179,553 4,564,177 - - 5,179,553 4,564,177 Sales taxes 4,063,620 3,862,730 - - 4,063,620 3,862,730 Franchise taxes 951,504 1,021,148 - - 951,504 1,021,148 Other taxes 1,874,092 1,766,255 - - 1,874,092 1,766,255 Miscellaneous 59,186 167,441 - 13,270 59,186 180,711 Gain on sale of capital assets - 15,530 - - - 15,530 Unrestricted investment earnings 27,150 23,298 14,796 25,536 41,946 48,834 Total revenues 18,300,014 16,182,032 19,589,256 18,576,000 37,889,270 34,758,032
Expenses: General government 3,354,065 3,419,943 - - 3,354,065 3,419,943 Judicial 432,718 374,430 - - 432,718 374,430 Public safety 6,637,237 6,304,295 - - 6,637,237 6,304,295 Public works 2,007,720 3,042,932 - - 2,007,720 3,042,932 Culture and recreation 874,273 848,402 - - 874,273 848,402 Planning and development 609,865 556,660 - - 609,865 556,660 Interest on long-term debt 478,766 442,138 - - 478,766 442,138 Electric - - 7,683,352 7,731,021 7,683,352 7,731,021 Water & sewer - - 5,954,189 5,725,971 5,954,189 5,725,971 Education complex - - 1,179,563 1,089,108 1,179,563 1,089,108 Stormwater - - 712,463 724,917 712,463 724,917 Sanitation - - 733,866 648,129 733,866 648,129 Total expenses 14,394,644 14,988,800 16,263,433 15,919,146 30,658,077 30,907,946
Increase in net position before transfers 3,905,370 1,193,232 3,325,823 2,656,854 7,231,193 3,850,086
Transfers 762,000 762,000 (762,000) (762,000) - -
Changes in net position 4,667,370 1,955,232 2,563,823 1,894,854 7,231,193 3,850,086
Net position, beginning of fiscal year 29,192,441 27,237,209 31,135,960 29,241,106 60,328,401 56,478,315
Net position, end of fiscal year 33,859,811$ 29,192,441$ 33,699,783$ 31,135,960$ 67,559,594$ 60,328,401$

City of Fairburn, Georgia Management’s Discussion and Analysis
September 30, 2018
8
Governmental Activities Net position for governmental activities increased $4,667,370 or 16%. Total governmental revenues increased $2,117,982 or 13.09%. Capital grants and contributions increased $1,414,882 or 78.88% reflecting a full year of TSPLOST revenues which began in April 2017. Property taxes increased $615,376 or 13.48% as assessed values for real property continue to rise in Fulton County. Sales taxes increased $200,890 or 5.20% along with general increases in retail activity. Expenses for governmental activities decreased $594,156 or 3.96%. General government, judicial, public safety, culture and recreation, and planning and development expenses all had modest increases or decreases based on dollar or percentage values. Public safety expenses increased $332,942 or 5.28% because of increases in fuel allocations and supplies. Public works expenses decreased $1,035,212 because of significant road resurfacing expenses incurred in fiscal 2017 which were not required in fiscal 2018. Business-Type Activities Net position for business type activities increased $2,563,823 or 8.23% from the prior fiscal year. The activities of each enterprise fund are discussed below. Electric Fund. Operating income for the Electric Fund increased $680,272 or 65.44% from $1,039,475 to $1,719,747. Operating revenues increased $628,489 or 7.17 % as the system adds new customers while operating expenses were consistent with the prior year. Transfers to meet General Fund obligations were $750,000 for 2018 and 2017, respectively.
Electric Fund, Summary of Changes in Net Position
2018 2017 $ Change % ChangeOPERATING REVENUESCharges for sales and services 9,249,253$ 8,770,496$ 478,757$ 5.46 % Miscellaneous revenue 149,732 - 149,732 100 Total Operating revenues 9,398,985 8,770,496 628,489 105 OPERATING EXPENSES Cost of sales and services 6,403,759 6,454,868 (51,109) (0.79) General operating expenses 931,362 925,151 6,211 0.67 Depreciation and amortization 344,117 351,002 (6,885) (1.96) Total operating expenses 7,679,238 7,731,021 (51,783) (0.67) Operating income 1,719,747 1,039,475 680,272 65.44 NON OPERATING REVENUES (EXPENSES) Interest income - 69 (69) (100.00) Interest expense (4,114) - (4,114) 100.00 Gain on sale assets - 13,270 (13,270) (100) Total Non operating revenues (expenses) (4,114) 13,339 (17,453) (130.84) Transfers in (out) (750,000) (750,000) - - Change in net position 965,633$ 302,814$ 662,819$ 218.89 %

City of Fairburn, Georgia Management’s Discussion and Analysis
September 30, 2018
9
Water and Sewer Fund. Operating income for the Water and Sewer fund was $2,591,724 for fiscal year 2018 compared to $2,545,640 in the prior fiscal year, an increase of $46,084 or 1.81%. Revenues and expenses increased $395,987 and $349,903, respectively, as the system added new customers. Transfers to meet General Fund obligations were $450,000 for 2018 and 2017, respectively. Transfers to meet General Fund obligations did not increase.
Water and Sewer, Summary of Changes in Net Position
2018 2017 $ Change % ChangeOPERATING REVENUESCharges for sales and services 6,976,807$ 6,580,820$ 395,987$ 6.02 %
OPERATING EXPENSES Cost of sales and services 2,616,326 2,352,687 263,639 11.21 General operating expenses 1,030,193 961,465 68,728 7.15 Depreciation and amortization 738,564 721,028 17,536 2.43 Total operating expenses 4,385,083 4,035,180 349,903 8.67 Operating income 2,591,724 2,545,640 46,084 1.81 NON OPERATING REVENUES (EXPENSE)
Interest income 13,652 23,931 (10,279) (42.95) Interest expense (1,569,106) (1,690,791) 121,685 (7.20) Total non-operating revenue (expenses) (1,555,454) (1,666,860) 111,406 (6.68) Capital contributions - tap fees 1,162,300 1,085,970 76,330 7.03 Transfers in (out) (450,000) (450,000) - - Change in net position 1,748,570$ 1,514,750$ 233,820$ 15.44 %
Educational Complex Fund. This fund had an operating loss of $77,838 compared to operating income of $22,585 in the prior fiscal year. Revenues decreased $52,389 or 10.51% as a result of reductions in monthly lease revenue from Brenau University. General operating expenses decreased by $59,316 or 61.58%. Amortization expenses increased $107,350 as a result of refinancing expenses related to bond refunding. Transfers from the General Fund were $488,000 in 2018 and 2017.

City of Fairburn, Georgia Management’s Discussion and Analysis
September 30, 2018
10
Educational Complex Fund, Summary of Changes in Net Position
2018 2017 $ Change % ChangeOPERATING REVENUESCharges for sales and services 445,298$ 498,543$ (53,245)$ (10.68) %Miscellaneous income 856 - 856 100.00 Total operating revenue 446,154 498,543 (52,389) (10.51)
OPERATING EXPENSES General operating expenses 37,010 96,326 (59,316) (61.58) Depreciation and amortization 486,982 379,632 107,350 28.28 Total operating expenses 523,992 475,958 48,034 10.09 Operating income (loss) (77,838) 22,585 (100,423) (444.64) NON OPERATING REVENUES (EXPENSE) Bond issuance costs (216,375) - (216,375) 100.00 Interest income 1,144 1,536 (392) (25.52) Interest expense (439,196) (613,150) 173,954 (28.37) Total non-operating revenue (expenses) (654,427) (611,614) (42,813) 7.00 Transfers in 729,643 488,000 241,643 49.52 Transfers out (241,643) - (241,643) 100.00 Change in net position (244,265)$ (101,029)$ (143,236)$ 141.78 %
Stormwater Fund. This Fund was created during fiscal year 2010 to properly segregate infrastructure utility charges in accordance with State statutes. Operating income was $77,554 in fiscal year 2018 as compared to $109,481 in the prior fiscal year. Charges for services decreased $44,381 or 5.32%. Cost of sales increased $32,259 or 8.65% as a result of increased allocation of operating expenses from other funds. General operating expenses decreased $45,357 as a result of recovery of bad debt expenses.
Stormwater Fund, Summary of Changes in Net Position
2018 2017 $ Change % ChangeOPERATING REVENUESCharges for sales and services 790,017$ 834,398$ (44,381)$ (5.32) %
OPERATING EXPENSES Cost of sales and services 405,259 373,000 32,259 8.65 General operating expenses 1,470 46,827 (45,357) (96.86) Depreciation and amortization 305,734 305,090 644 0.21 Total operating expenses 712,463 724,917 (12,454) (1.72) Operating income 77,554 109,481 (31,927) (29.16) Change in net position 77,554$ 109,481$ (31,927)$ (29.16) %
Sanitation Fund. Operating income decreased $52,507 or 44.18%. Revenues have increased $33,230 or 4.33% as the City has added new residents. General operating expenses increased $85,737 or 13.23% and is primarily related to increased refuse collection expenses. Transfers to the General Fund were $50,000 in both fiscal 2018 and 2017.

City of Fairburn, Georgia Management’s Discussion and Analysis
September 30, 2018
11
Sanitation Fund, Summary of Changes in Net Position
2018 2017 $ Change % ChangeOPERATING REVENUESCharges for sales and services 800,197$ 766,967$ 33,230$ 4.33 %
OPERATING EXPENSES General operating expenses 733,866 648,129 85,737 13.23 Operating income 66,331 118,838 (52,507) (44.18) Transfers in (out) (50,000) (50,000) - - Change in net position 16,331$ 68,838$ (52,507)$ (76.28) %
Financial Analysis of the City’s Funds As noted earlier, the City of Fairburn uses fund accounting to ensure and demonstrate compliance with finance-related legal requirements. Governmental Fund Balance The City's combined fund balances as of the end of the current fiscal year for governmental funds, presented on page 18, were $10,849,008 compared to $9,161,936 in the prior fiscal year.
City of Fairburn Summary of Governmental Fund Balances
2018 2017 $ ChangeGeneral Fund 7,619,669$ 5,802,805$ 1,816,864$ General Obligation Bond Capital Projects Fund 1,670,173 1,609,431 60,742 TSPLOST Fund 569,371 1,128,381 (559,010) Other Governmental Funds 989,795 621,319 368,476 Total Governmental Fund Balances 10,849,008$ 9,161,936$ 1,687,072$
Remainder of page intentionally left blank

City of Fairburn, Georgia Management’s Discussion and Analysis
September 30, 2018
12
City of Fairburn Summary Changes in Governmental Fund Balance
2018 2017 $ Change % ChangeRevenues Property taxes 5,162,122$ 4,714,252$ 447,870$ 9.50 % Sales taxes 4,063,620 3,862,730 200,890 5.20 Franchise taxes 951,504 1,021,148 (69,644) (6.82) Other taxes 1,874,092 1,766,255 107,837 6.11 Licenses and permits 1,261,777 1,638,444 (376,667) (22.99) Intergovernmental 3,206,502 1,793,672 1,412,830 78.77 Fines and forfeitures 701,117 515,187 185,930 36.09 Charges for services 837,886 677,868 160,018 23.61 Interest revenue 29,202 23,298 5,904 25.34 Other revenues 194,761 303,723 (108,962) (35.88)
Total revenues 18,282,583$ 16,316,577$ 1,966,006$ 12.05
Expenditures Current: General government 3,406,195$ 3,416,997$ (10,802)$ (0.32) Judicial 437,400 376,353 61,047 16.22 Public safety 6,538,231 6,207,250 330,981 5.33 Public works 1,989,357 2,814,324 (824,967) (29.31) Parks and recreation 552,164 531,522 20,642 3.88 Planning and development 619,309 523,412 95,897 18.32 Capital outlays 2,944,718 19,472 2,925,246 15,022.83 Debt service: Principal 821,473 653,535 167,938 25.70 Interest 214,044 451,808 (237,764) (52.63) Issuance costs 134,684 - 134,684 100.00 Total expenditures 17,657,575 14,994,673 2,662,902 17.76 Excess (deficiency) of revenues over (under) expenditures 625,008 1,321,904 (696,896) (52.72)
Other Financing Sources (Uses): Proceeds from refunding bonds 7,365,000 - 7,365,000 100.00 Payments to refund debt escrow agent (7,230,316) - (7,230,316) 100.00 Proceeds from sale of capital assets - 32,380 (32,380) (100.00) Capital leases 165,380 - 165,380 100.00 Transfers in 1,687,817 1,690,339 (2,522) (0.15) Transfers out (925,817) (928,339) 2,522 (0.27) Total other financing sources (uses) 1,062,064 794,380 267,684 33.70
Net change in fund balances 1,687,072$ 2,116,284$ (429,212)$ (20.28) %
Excess of revenues over expenditures prior to other financing sources (uses) in the Governmental Funds for the current fiscal year was $625,008 as compared to $1,321,904 in the prior fiscal year. The General Fund had an excess of $1,085,658; the General Obligation Bond Capital Projects Fund had a deficiency of ($73,942); the TSPLOST Fund had a deficiency of ($559,010); and non-major governmental funds had an excess of $172,302.

City of Fairburn, Georgia Management’s Discussion and Analysis
September 30, 2018
13
Total governmental revenues increased $1,966,006 or 12.05%. Property taxes increased $447,870 or 9.5% as assessed values of real property continue to increase. Sales taxes increased $200,890 or 5.20% along with general increases in retail activity. Intergovernmental revenues increased $1,412,830 or 78.77% reflecting a full year of TSPLOST revenues which began in April 2017. Fines and forfeitures increased $185,930 or 36.09% because of increased enforcement of traffic law and other ordinances. Licenses and permits decreased $376,667 or 22.99% as several significant construction projects which were permitted in the prior fiscal year. Charges for services increased $160,018 or 23.61% and is primarily related to disposal fee increases related to construction projects. Total governmental expenditures increased $2,662,902 or approximately 17.76%. Public works expenditures decreased $824,967 or 29.31% because of decreases in grant related public works projects. Public safety expenses increased $330,981 or 5.33% because of increases in fuel allocations and supply expenditures. Capital outlays increased $2,925,246 as the City began expending TSPLOST funds not available in prior fiscal year. Changes in debt service requirements are related to certain bond refunding. See Note 8 located on page 43. Other changes in expenditure categories did not have a significant impact on total expenditures. General Fund Budgetary Highlights The final amended budgets passed by the City Council anticipated revenues and transfers from the Enterprise Funds being sufficient to meet operations of the General Fund. Actual results were $2,816,369 better than budgeted. A comparison of the final budgets to actual results are located on page 21.
• General Fund revenues in total were $820,901 better than budgeted. Budgeted revenues are generally based on prior years activity and trends. Property taxes were $235,754 better than budgeted as assessed values continue to increase. Sales taxes were $263,620 better than budgeted as overall retail activity continues to improve along with new retail establishments in the City. License and permits were $464,698 worse than budgeted as the trend in large new developments did not materialize in the current year. Fines and forfeitures were $241,117 better than budgeted as increased enforcement of ordinances has yielded better revenues than prior years. Charges for services was $331,258 better than budgeted as revenues continue to increase in this category and the City took a very conservative approach in budgeting this category. The City experienced better than budgeted results in most other areas as the City remains very conservative in its budgeting
• The actual expenditures of $13,310,162 were $1,666,852 less than budgeted as management continues control measures implemented in prior years as well as very conservative budget estimates.

City of Fairburn, Georgia Management’s Discussion and Analysis
September 30, 2018
14
Capital Asset and Debt Administration
Capital Assets
The City has invested $71,786,785 in capital assets (net of accumulated depreciation). Capital assets held by the City at the end of the current and previous fiscal years are summarized as follows:
City of Fairburn, Summary of Captial Assets, net of Accumulated Depreciation
Governmental Activities Business-type Activities Total2018 2017 2018 2017 2018 2017
Land 5,337,956$ 5,337,956$ 3,924,899$ 3,924,899$ 9,262,855$ 9,262,855$ Construction in Progress 5,181,532 1,820,466 155,703 7,350 5,337,235 1,827,816 Buildings, grounds and improvements 7,206,065 7,635,012 18,195,980 18,840,638 25,402,045 26,475,650 Machinery and equipment 735,071 674,727 230,059 258,893 965,130 933,620 Infrastructure 12,609,674 13,228,289 14,034,731 14,737,464 26,644,405 27,965,753 Vehicles 1,347,439 1,541,469 2,827,676 2,525,326 4,175,115 4,066,795
32,417,737$ 30,237,919$ 39,369,048$ 40,294,570$ 71,786,785$ 70,532,489$
Net capital assets for governmental activities increased $2,179,818 and is primarily related to infrastructure projects funded by TSPLOST funds. Net capital assets for business-type activities decreased $925,522 as depreciation expenses exceeded asset purchases. The detailed capital assets schedule is reported in Note 6 of the footnotes to the financial statements. Long-term Debt At the end of the current fiscal year, the City had long-term debt related to business-type activities of $25,814,579 and $9,513,788 for governmental activities. Bonds, notes, and capital leases outstanding as of the fiscal year ended September 30, 2018 are fully secured by the full faith and credit of the City. Business-type activities debt is secured by electric, water and sewer, and educational complex revenues while governmental debt is secured by general revenues. The debt position of the City is summarized below and is more fully analyzed in Note 8 of the footnotes to the financial statements.

City of Fairburn, Georgia Management’s Discussion and Analysis
September 30, 2018
15
City of Fairburn Outstanding Long-Term Liabilities
2018 2017Governmental Activities
2011 General Obligation Bonds 1,855,000$ 8,385,000$ 2017 Refunding Bonds 7,265,000 - Net Pension Liability 281,416 1,164,327 Capital Leases 112,372 238,465
9,513,788$ 9,787,792$
Business-type ActivitiesSeries 2011 Education Campus Bonds 1,640,000$ 13,720,000$ Series 2013 Revenue Refunding Bonds 6,835,000 7,675,000 Series 2014 Utility Bonds 4,085,000 4,265,000 Series 2017 Educational Revenue Refunding Bonds 13,065,000 - Capital Leases 83,774 109,705 Net Pension Liability 105,805 149,840
25,814,579$ 25,919,545$
Economic Factors and Next Fiscal Year’s Budgets and Rates The City continues to enjoy the benefits of its location along I-85 and its proximity to the Atlanta Airport. Commercial and industrial development is also rebounding, especially large regional distribution centers along Oakley Industrial Boulevard and national retailers along the Highway 74 corridor to Tyrone and Peachtree City south of the Interstate 85 interchange. Service levels continue to improve and revenue estimates are conservatively made. Property taxes for general operations remained at 8.1 mills and debt service millage remained at 1.46 for the October 2018 billing Electric rate add-ons for the power cost adjustment (PCA) and the environmental compliance cost recovery fee (ECCR) have remained steady since early 2013. Water and sewer rates have not changed since late 2012. Contacting the City’s Financial Management This financial report is designed to provide a general overview of the City's finances for all those with an interest in the City's finances. Questions concerning any of the information provided in this report or requests for additional financial information should be addressed to the City’s Finance Department (770) 964-2244, City Hall, 56 Malone Street, Fairburn, Georgia 30213-1341.

16
Activities Activities TotalASSETS
Cash and cash equivalents $ 11,283,104 $ 9,429,473 $ 20,712,577 Restricted cash and cash equivalents 1,021,329 3,453,792 4,475,121 Investments 107,293 5,354,780 5,462,073 Investments with fiscal agent (restricted assets) - 69,372 69,372 Accounts receivable, net of allowances - 2,435,023 2,435,023 Taxes receivable, net of allowances 395,684 - 395,684 Intergovernmental receivables 574,922 9,975 584,897 Inventory 22,108 - 22,108 Other receivables 343,537 119,000 462,537 Prepaid items 100,433 4,958 105,391 Prepaid bond insurance (unamortized balance) 17,875 - 17,875 Capital assets: Non-depreciable 10,519,488 4,080,602 14,600,090 Depreciable, net of accumulated depreciation 21,898,249 35,288,446 57,186,695
Total assets 46,284,022 60,245,421 106,529,443
DEFERRED OUTFLOWS OF RESOURCES Deferred loss on refunding of debt 981,761 1,855,786 2,837,547 Pension related items 559,949 64,212 624,161
Total deferred outflows of resources 1,541,710 1,919,998 3,461,708
LIABILITIES Accounts payable 2,110,947 1,521,498 3,632,445 Retainage payable 155,619 - 155,619 Funds held in escrow (due to others) 462,751 - 462,751 Accrued liabilities 237,951 36,514 274,465 Accrued interest payable 85,708 100,914 186,622 Due to others 3,715 - 3,715 Unearned revenue 6,920 - 6,920 Customer deposits payable 1,100 746,132 747,232 Compensated absences due within one fiscal year 213,802 33,474 247,276 Compensated absences due in more than one fiscal year 151,535 15,308 166,843 Capital leases due within one fiscal year 55,099 26,903 82,002 Capital leases due in more than one fiscal year 57,273 56,871 114,144 Net pension liability due in more than one fiscal year 281,416 105,805 387,221 Bonds payable due within one fiscal year 560,000 1,695,000 2,255,000 Bonds payable due in more than one fiscal year 8,564,188 24,042,465 32,606,653
Total liabilities 12,948,024 28,380,884 41,328,908
DEFERRED INFLOWS OF RESOURCES Pension related items 1,017,897 84,752 1,102,649
Total deferred inflows of resources 1,017,897 84,752 1,102,649
NET POSITION Net investment in capital assets 25,016,287 17,683,581 42,699,868 Restricted for debt service 12,361 1,050,000 1,062,361 Restricted for capital construction 656,162 - 656,162 Restricted for transportation projects 569,371 - 569,371 Restricted for law enforcement activities 24,698 - 24,698 Restricted for corpus of perpetual care cemetery funds (nonspendable) 10,000 - 10,000 Restricted for cemetery operating capital 75,677 - 75,677 Restricted by third party as letter of credit - 69,372 69,372 Restricted for federal and state programs 878,450 - 878,450 Restricted for tourism 141,126 - 141,126 Unrestricted 6,475,679 14,896,830 21,372,509
Total net position $ 33,859,811 $ 33,699,783 $ 67,559,594
The accompanying notes are an integral part of these financial statements.
CITY OF FAIRBURN, GEORGIA
STATEMENT OF NET POSITIONSEPTEMBER 30, 2018
Governmental Business-type
Primary Government

17
CITY OF FAIRBURN, GEORGIASTATEMENT OF ACTIVITIES
FOR THE FISCAL YEAR ENDED SEPTEMBER 30, 2018
Program Revenues Primary GovernmentOperating Capital
Charges for Grants and Grants and Governmental Business-typeFunctions/Programs Expenses Services Contributions Contributions Activities Activities TotalPrimary government:Governmental activities:
General government $ 3,354,065 $ 1,261,777 $ - $ - $ (2,092,288) $ - $ (2,092,288) Judicial 432,718 701,117 - - 268,399 - 268,399 Public safety 6,637,237 - - 9,895 (6,627,342) - (6,627,342) Public works 2,007,720 837,886 - 3,097,197 1,927,363 - 1,927,363 Culture and recreation 874,273 135,575 - 101,462 (637,236) - (637,236) Planning and development 609,865 - - - (609,865) - (609,865) Interest and fiscal charges 478,766 - - - (478,766) - (478,766)
Total governmental activities 14,394,644 2,936,355 - 3,208,554 (8,249,735) - (8,249,735)
Business-type activities:Electric 7,683,352 9,398,985 - - - 1,715,633 1,715,633 Water and sewer 5,954,189 6,976,807 - 1,162,300 - 2,184,918 2,184,918 Educational complex 1,179,563 446,154 - - - (733,409) (733,409) Stormwater 712,463 790,017 - - - 77,554 77,554 Sanitation 733,866 800,197 - - - 66,331 66,331
Total business-type activities 16,263,433 18,412,160 - 1,162,300 - 3,311,027 3,311,027 Total primary government $ 30,658,077 $ 21,348,515 $ - $ 4,370,854 $ (8,249,735) $ 3,311,027 $ (4,938,708)
General revenues:Property taxes $ 5,179,553 $ - $ 5,179,553 Franchise taxes 951,504 - 951,504 Insurance premium taxes 867,515 - 867,515 Sales and use taxes 4,063,620 - 4,063,620 Motor vehicle taxes 331,566 - 331,566 Beer, wine, and liquor taxes 264,586 - 264,586 Hotel/Motel taxes 285,075 - 285,075 Other taxes 125,350 - 125,350 Unrestricted investment earnings 27,150 14,796 41,946 Miscellaneous 59,186 - 59,186
Transfers 762,000 (762,000) - Total general revenues and transfers 12,917,105 (747,204) 12,169,901
Change in net position 4,667,370 2,563,823 7,231,193 Net position, beginning of fiscal year 29,192,441 31,135,960 60,328,401 Net position, end of fiscal year $ 33,859,811 $ 33,699,783 $ 67,559,594
The accompanying notes are an integral part of these financial statements.
Changes in Net PositionNet (Expenses) Revenues and

18
CITY OF FAIRBURN, GEORGIA
BALANCE SHEET GOVERNMENTAL FUNDS
SEPTEMBER 30, 2018
General TotalObligation Bond Governmental Governmental
ASSETS Fund Capital Projects Fund Funds Funds
Cash and cash equivalents $ 6,668,610 $ 648,462 $ 3,312,937 $ 653,095 $ 11,283,104 Restricted cash and cash equivalents - 1,021,329 - - 1,021,329 Investments 21,323 - - 85,970 107,293 Taxes receivable, net of allowances 383,390 12,294 - - 395,684 Other receivables 343,537 - - - 343,537 Intergovernmental receivables - - 194,376 380,546 574,922 Due from other funds 1,223,988 - - - 1,223,988 Prepaid items 100,433 - - - 100,433 Inventory 22,108 - - - 22,108
Total assets $ 8,763,389 $ 1,682,085 $ 3,507,313 $ 1,119,611 $ 15,072,398
LIABILITIES, DEFERRED INFLOWS OFRESOURCES, AND FUND BALANCES
LIABILITIES Accounts payable $ 426,511 $ - $ 1,564,335 $ 120,101 $ 2,110,947 Retainage payable - - 149,619 6,000 155,619 Funds held in escrow 462,751 - - - 462,751 Accrued liabilities 216,237 - - - 216,237 Due to others - - - 3,715 3,715 Due to other funds - - 1,223,988 - 1,223,988 Unearned revenue 2,326 4,594 - - 6,920 Customer deposits 1,100 - - - 1,100 Other liabilities 21,714 - - - 21,714
Total liabilities 1,130,639 4,594 2,937,942 129,816 4,202,991
DEFERRED INFLOWS OF RESOURCES Unavailable revenue - property taxes 13,081 7,318 - - 20,399
Total deferred inflows of resources 13,081 7,318 - - 20,399
FUND BALANCES Fund balances: Nonspendable for: Prepaid items 100,433 - - - 100,433 Inventory 22,108 - - - 22,108 Corpus of perpetual care cemetery funds - - - 10,000 10,000 Restricted for: Capital construction - 1,657,812 - - 1,657,812 Federal and state programs - - - 878,450 878,450 Debt service - 12,361 - - 12,361 Law enforcement activities - - - 24,698 24,698 Cemetery operating capital - - - 75,677 75,677 Transportation projects - - 569,371 - 569,371 Tourism 141,126 - - - 141,126 Committed for: Tree bank 385,533 - - - 385,533 Assigned for: Planning and development - - - 970 970 Unassigned 6,970,469 - - - 6,970,469
Total fund balances 7,619,669 1,670,173 569,371 989,795 10,849,008
Total liabilities, deferred inflows of resources, and fund balances $ 8,763,389 $ 1,682,085 $ 3,507,313 $ 1,119,611
Amounts reported for governmental activities in the statement of net position are different because: Capital assets used in governmental activities are not current financial resources and, therefore, are not reported in the governmental funds. 32,417,737 Some receivables are not available to pay for current-period expenditures and, therefore, are deferred inflows of resources in the governmental funds. 20,399
The deferred outflows of resources, deferred inflows of resources, and the net pension liability related to the City's pension plan are not expected to be liquidated with expendable available current financial resources and, therefore, are not reported in the governmental funds. (739,364) Long-term liabilities, including bonds payable and related items, are not due and payable in the current period and, therefore, are not reported in the governmental funds. (8,687,969)
Net position of governmental activities $ 33,859,811
The accompanying notes are an integral part of these financial statements.
NonmajorGeneral TSPLOST
Fund

19
CITY OF FAIRBURN, GEORGIA
GOVERNMENTAL FUNDS
General TotalObligation Bond TSPLOST Governmental Governmental
Fund Capital Projects Fund Fund Funds Funds
Revenues Taxes $ 11,255,970 $ 795,368 $ - $ - $ 12,051,338 Licenses and permits 1,261,777 - - - 1,261,777 Intergovernmental 120,076 - 2,378,481 707,945 3,206,502 Fines and forfeitures 701,117 - - - 701,117 Charges for services 837,886 - - - 837,886 Interest income 24,233 2,618 2,052 299 29,202 Miscellaneous revenue 194,761 - - - 194,761 Total revenues 14,395,820 797,986 2,380,533 708,244 18,282,583
Expenditures Current: General government 3,406,195 - - - 3,406,195 Judicial 437,400 - - - 437,400 Public safety 6,468,797 - - 69,434 6,538,231 Public works 1,522,849 - - 466,508 1,989,357 Culture and recreation 552,164 - - - 552,164 Planning and development 619,309 - - - 619,309 Capital outlay - 5,175 2,939,543 - 2,944,718 Debt service: Principal retirements 291,473 530,000 - - 821,473 Interest and fiscal charges 11,975 202,069 - - 214,044 Issuance Cost 134,684 - - 134,684 Total expenditures 13,310,162 871,928 2,939,543 535,942 17,657,575
Excess (deficiency) of revenues over (under) expenditures 1,085,658 (73,942) (559,010) 172,302 625,008
Other financing sources (uses): Proceeds from refunding bonds - 7,365,000 - - 7,365,000 Payments to refunded debt escrow agent - (7,230,316) - - (7,230,316) Capital leases 165,380 - - - 165,380 Transfers in 1,491,643 - - 196,174 1,687,817 Transfers out (925,817) - - - (925,817) Total other financing sources 731,206 134,684 - 196,174 1,062,064
Net change in fund balances 1,816,864 60,742 (559,010) 368,476 1,687,072
Fund balances, beginning of fiscal year 5,802,805 1,609,431 1,128,381 621,319 9,161,936
Fund balances, end of fiscal year $ 7,619,669 $ 1,670,173 $ 569,371 $ 989,795 $ 10,849,008
The accompanying notes are an integral part of these financial statements.
General
FOR THE FISCAL YEAR ENDED SEPTEMBER 30, 2018
STATEMENT OF REVENUES, EXPENDITURES, AND CHANGES IN FUND BALANCES
Nonmajor

20
CITY OF FAIRBURN, GEORGIA
RECONCILIATION OF THE STATEMENT OF REVENUES, EXPENDITURES,
TO THE STATEMENT OF ACTIVITIES
Amounts reported for governmental activities in the statement of activities are different because:
Net change in fund balances - total governmental funds $ 1,687,072
Governmental funds report capital outlays as expenditures. However, in the statement of activities, the costof those assets is allocated over their estimated useful lives and reported as depreciation expense. This isthe amount by which capital outlay exceeded depreciation expense in the current period - see footnote 2 for detail of amount. 2,179,818
Revenues in the statement of activities that do not provide current financial resources are not reported asrevenues in the funds. 17,431
Issuance of long-term debt provides current financial resources to governmental funds, while the repaymentof the principal of long-term debt consumes the current financial resources of governmental funds. Neithertransaction has; however has any effect on net position. Also, governmental funds report the effect of bondinsurance costs, premiums, discounts, and similar items when the debt is first issued, whereas theseamounts are deferred and amortized in the statement of activities. The effect of these differences in thetreatment of long-term debt and related items is as follows: Principal payment on bonds payable 530,000 Principal payment on capital lease 291,473 Issuance of refunding bonds (7,365,000) Issuance of capital lease (165,380) Payments to refunded debt escrow agent 7,230,316 Amortization of deferred charges, prepaid bond insurance costs (204,174) Amortization of bond premium 2,285 319,520
Some expenses reported in the statement of activities do not require the use of current financial resourcesand, therefore, are not reported as expenditures in governmental funds. Change in accrued interest payable 62,092 Change in deferred inflows and outflows- pension related items and net pension liability 392,216 Change in compensated absences 9,221
Change in net position - governmental activities $ 4,667,370
The accompanying notes are an integral part of these financial statements.
AND CHANGES IN FUND BALANCES OF GOVERNMENTAL FUNDS
FOR THE FISCAL YEAR ENDED SEPTEMBER 30, 2018

21
CITY OF FAIRBURN, GEORGIA
GENERAL FUNDSTATEMENT OF REVENUES, EXPENDITURES,
AND CHANGES IN FUND BALANCES - BUDGET AND ACTUAL FOR THE FISCAL YEAR ENDED SEPTEMBER 30, 2018
Final Actual Final BudgetRevenues
Property taxes $ 4,131,000 $ 4,131,000 $ 4,366,754 $ 235,754 Sales taxes 3,800,000 3,800,000 4,063,620 263,620 Franchise taxes 1,094,000 1,094,000 951,504 (142,496) Insurance premium taxes 750,000 750,000 867,515 117,515 Beer, liquor, and wine taxes 210,000 210,000 264,586 54,586 Motor vehicle taxes 325,000 325,000 331,566 6,566 Hotel motel taxes 225,000 225,000 285,075 60,075 Other taxes 80,560 80,560 125,350 44,790 Licenses and permits 1,726,475 1,726,475 1,261,777 (464,698) Fines and forfeitures 460,000 460,000 701,117 241,117 Interest income 50,636 50,636 24,233 (26,403) Charges for services 506,628 506,628 837,886 331,258 Intergovernmental - - 120,076 120,076 Miscellaneous 215,620 215,620 194,761 (20,859)
Total revenues 13,574,919 13,574,919 14,395,820 820,901
ExpendituresCurrent:
General government: Mayor and council 597,497 597,497 447,710 149,787 Administration 542,523 542,523 336,346 206,177 City Administrator 1,924,308 1,924,308 1,745,951 178,357 Finance 322,902 322,902 480,304 (157,402) Technology 94,697 94,697 11,081 83,616 Property management 471,783 471,783 384,803 86,980 Total general government 3,953,710 3,953,710 3,406,195 547,515 Judicial: Municipal court 325,987 325,987 437,400 (111,413) Total judicial 325,987 325,987 437,400 (111,413) Public safety: Police 3,389,059 3,389,059 3,158,381 230,678 Fire 3,357,921 3,357,921 3,310,416 47,505 Total public safety 6,746,980 6,746,980 6,468,797 278,183 Public works: Public works administration 356,443 356,443 265,162 91,281 Highways and streets 1,569,550 1,569,550 1,096,380 473,170 Maintenance and shop 261,515 261,515 161,307 100,208 Total public works 2,187,508 2,187,508 1,522,849 664,659 Culture and recreation: Recreation 789,569 789,569 552,164 237,405 Total culture and recreation 789,569 789,569 552,164 237,405 Planning and development: Protective inspection and enforcement 524,319 524,319 379,273 145,046 Planning and zoning 254,598 254,598 240,036 14,562 Total planning and development 778,917 778,917 619,309 159,608
Debt service: Principal retirements 72,316 72,316 291,473 (219,157) Interest and fiscal charges 122,027 122,027 11,975 110,052 Total debt service 194,343 194,343 303,448 (109,105)
Total expenditures 14,977,014 14,977,014 13,310,162 1,666,852
Excess (deficiency) of revenues over (under) expenditures (1,402,095) (1,402,095) 1,085,658 2,487,753
Other financing sources (uses)Proceeds from sale of capital assets 30,000 30,000 - (30,000) Proceeds for capital lease - - 165,380 165,380 Transfers in 1,250,000 1,250,000 1,491,643 241,643 Transfers out (877,410) (877,410) (925,817) (48,407)
Total other financing sources 402,590 402,590 731,206 328,616
Net change in fund balances (999,505) (999,505) 1,816,864 2,816,369
Fund balance, beginning of fiscal year 5,802,805 5,802,805 5,802,805 -
Fund balance, end of fiscal year $ 4,803,300 $ 4,803,300 $ 7,619,669 $ 2,816,369
The accompanying notes are an integral part of these financial statements.
BudgetOriginal
Variance With

22
CITY OF FAIRBURN, GEORGIA
STATEMENT OF NET POSITIONPROPRIETARY FUNDSSEPTEMBER 30, 2018
Business-type Activities - Enterprise Funds Water and Educational Nonmajor
Electric Sewer Complex Stormwater SanitationASSETS Fund Fund Fund Fund Enterprise Fund Total
CURRENT ASSETSCash and cash equivalents $ 1,481,327 $ 5,547,949 $ 843,386 $ 940,561 $ 616,250 $ 9,429,473 Restricted cash and cash equivalents - 3,037,449 416,343 - - 3,453,792 Investments 5,354,780 - - - - 5,354,780 Investments with fiscal agent (restricted assets) 69,372 - - - - 69,372 Accounts receivable, net of allowances 1,245,083 971,058 - 111,340 107,542 2,435,023 Intergovernmental receivable - 9,975 - - - 9,975 Other receivable 117,000 - 2,000 - - 119,000 Prepaid items 250 4,708 - - - 4,958
Total current assets 8,267,812 9,571,139 1,261,729 1,051,901 723,792 20,876,373
CAPITAL ASSETSNon-depreciable 163,227 2,278,346 1,639,029 - - 4,080,602 Depreciable, net of accumulated depreciation 4,890,344 13,794,358 11,078,869 5,524,875 - 35,288,446
Total capital assets 5,053,571 16,072,704 12,717,898 5,524,875 - 39,369,048
Total noncurrent assets 5,053,571 16,072,704 12,717,898 5,524,875 - 39,369,048
Total assets 13,321,383 25,643,843 13,979,627 6,576,776 723,792 60,245,421
DEFERRED OUTFLOWS OF RESOURCESPension related items 39,950 24,262 - - - 64,212 Deferred loss on refunding of debt - 420,559 1,435,227 - - 1,855,786
Total deferred outflows of resources 39,950 444,821 1,435,227 - - 1,919,998
LIABILITIESCURRENT LIABILITIES
Accounts payable 634,323 772,621 4,700 - 109,854 1,521,498 Accrued liabilities 24,328 12,186 - - - 36,514 Accrued interest payable - - 100,914 - - 100,914 Customer deposits 507,420 219,042 9,585 - 10,085 746,132 Compensated absences payable 18,838 14,636 - - - 33,474 Capital lease payable 26,903 - - - - 26,903 Revenue bonds payable - 1,050,000 645,000 - - 1,695,000
Total current liabilities 1,211,812 2,068,485 760,199 - 119,939 4,160,435
NONCURRENT LIABILITIESCompensated absences payable 12,808 2,500 - - - 15,308 Net pension liability 68,809 36,996 - - - 105,805 Capital lease payable 56,871 - - - - 56,871 Revenue bonds payable - 10,008,695 14,033,770 - - 24,042,465
Total noncurrent liabilities 138,488 10,048,191 14,033,770 - - 24,220,449 Total liabilities 1,350,300 12,116,676 14,793,969 - 119,939 28,380,884
DEFERRED INFLOWS OF RESOURCESPension related items 50,819 33,933 - - - 84,752
Total deferred outflows of resources 50,819 33,933 - - - 84,752
NET POSITIONNet investment (deficit) in capital assets 4,969,797 7,421,955 (233,046) 5,524,875 - 17,683,581 Restricted for debt service - 1,050,000 - - - 1,050,000 Restricted by third party as letter of credit 69,372 - - - - 69,372 Unrestricted 6,921,045 5,466,100 853,931 1,051,901 603,853 14,896,830
Total net position $ 11,960,214 $ 13,938,055 $ 620,885 $ 6,576,776 $ 603,853 $ 33,699,783
The accompanying notes are an integral part of these financial statements.

23
CITY OF FAIRBURN, GEORGIA
STATEMENT OF REVENUES, EXPENSES, ANDCHANGES IN FUND NET POSITION
PROPRIETARY FUNDSFOR THE FISCAL YEAR ENDED SEPTEMBER 30, 2018
Business-type Activities - Enterprise Funds Water and Educational Nonmajor
Electric Sewer Complex Stormwater SanitationFund Fund Fund Fund Enterprise Fund Total
OPERATING REVENUES Charges for sales and services $ 9,249,253 $ 6,976,807 $ 445,298 $ 790,017 $ 800,197 $ 18,261,572 Miscellaneous income 149,732 - 856 - - 150,588
Total operating revenues 9,398,985 6,976,807 446,154 790,017 800,197 18,412,160
OPERATING EXPENSES Cost of sales and services 6,403,759 2,616,326 - 405,259 - 9,425,344 General operating expenses 931,362 1,030,193 37,010 1,470 733,866 2,733,901 Depreciation and amortization 344,117 738,564 486,982 305,734 - 1,875,397
Total operating expenses 7,679,238 4,385,083 523,992 712,463 733,866 14,034,642
Operating income (loss) 1,719,747 2,591,724 (77,838) 77,554 66,331 4,377,518
NON-OPERATING REVENUES (EXPENSES) Bond issuance costs - - (216,375) - - (216,375) Interest income - 13,652 1,144 - - 14,796 Interest expense (4,114) (1,569,106) (439,196) - - (2,012,416)
Total non-operating expenses (4,114) (1,555,454) (654,427) - - (2,213,995)
Income (loss) before contributions and transfers 1,715,633 1,036,270 (732,265) 77,554 66,331 2,163,523
Capital contributions - tap fees - 1,162,300 - - - 1,162,300 Transfers in - - 729,643 - - 729,643 Transfers out (750,000) (450,000) (241,643) - (50,000) (1,491,643)
(750,000) 712,300 488,000 - (50,000) 400,300
Change in net position 965,633 1,748,570 (244,265) 77,554 16,331 2,563,823
Net position, beginning of fiscal year 10,994,581 12,189,485 865,150 6,499,222 587,522 31,135,960
Net position, end of fiscal year $ 11,960,214 $ 13,938,055 $ 620,885 $ 6,576,776 $ 603,853 $ 33,699,783
The accompanying notes are an integral part of these financial statements.

24
CITY OF FAIRBURN, GEORGIA
STATEMENT OF CASH FLOWSPROPRIETARY FUNDS
FOR THE FISCAL YEAR ENDED SEPTEMBER 30, 2018
Water and Educational NonmajorElectric Sewer Complex Stormwater Sanitation
Fund Fund Fund Fund Enterprise Fund TotalsCASH FLOWS FROM OPERATING ACTIVITIES
Receipts from customers and users $ 9,293,458 $ 6,891,771 $ 446,154 $ 793,673 $ 797,635 $ 18,222,691 Payments to suppliers (6,650,587) (3,260,940) (37,322) (406,729) (677,396) (11,032,974) Payments to employees (645,174) (244,783) - - - (889,957)
Net cash provided by operating activities 1,997,697 3,386,048 408,832 386,944 120,239 6,299,760
CASH FLOWS FROM NON-CAPITAL FINANCING ACTIVITIES
Transfers out to other funds (750,000) (450,000) (241,643) - (50,000) (1,491,643) Transfers in from other funds - - 729,643 - - 729,643
Net cash provided by (used in) non-capital financing activities (750,000) (450,000) 488,000 - (50,000) (762,000)
CASH FLOWS FROM CAPITAL AND RELATED FINANCING ACTIVITIES
Purchase of capital assets (310,259) (393,948) - - - (704,207) Capital contributions - tap fees - 1,162,300 - - - 1,162,300 Bond issuance cost - - (216,375) - - (216,375) Proceeds from bond issuance - - 13,125,000 - - 13,125,000 Payment to refund debt escrow agent - - (12,914,940) - - (12,914,940) Principal payment on capital lease (25,931) - - - - (25,931) Principal payment on bonds - (1,020,000) (520,000) - - (1,540,000) Interest payments (4,114) (1,796,393) (487,628) - - (2,288,135)
Net cash used in capital and related financing activities (340,304) (2,048,041) (1,013,943) - - (3,402,288)
CASH FLOWS FROM INVESTING ACTIVITIES Interest on investments - 13,652 1,144 - - 14,796 Purchases of investments (315,336) - - - - (315,336) Net cash provided by (used in) investing activities (315,336) 13,652 1,144 - - (300,540)
Net increase (decrease) in cash and cash equivalents 592,057 901,659 (115,967) 386,944 70,239 1,834,932
Cash and cash equivalents, beginning of fiscal year 889,270 7,683,739 1,375,696 553,617 546,011 11,048,333
Cash and cash equivalents, end of fiscal year $ 1,481,327 $ 8,585,398 $ 1,259,729 $ 940,561 $ 616,250 $ 12,883,265
RECONCILIATION OF OPERATING INCOME (LOSS) TO NET CASH PROVIDED BY OPERATING ACTIVITIESOperating income (loss) $ 1,719,747 $ 2,591,724 $ (77,838) $ 77,554 $ 66,331 $ 4,377,518
Adjustments to reconcile operating income (loss)to net cash provided by operating activities:Depreciation and amortization 344,117 738,564 486,982 305,734 - 1,875,397 Change in assets and liabilities:
(Increase) decrease in:Accounts receivable (104,281) (79,020) - 3,656 (4,586) (184,231) Deferred outflows for pension items 26,093 15,622 - - - 41,715
Increase (decrease) in:Accounts payable 44,156 142,000 (312) - 56,470 242,314 Accrued liabilities and retainage payables 7,436 3,243 - - - 10,679 Deferred inflows for pension items (12,916) (4,325) - - - (17,241) Net pension liability (23,708) (20,327) - - - (44,035) Customer deposits (1,246) (6,016) - - 2,024 (5,238) Compensated absences payable (1,701) 4,583 - - - 2,882
Net cash provided by operating activities $ 1,997,697 $ 3,386,048 $ 408,832 $ 386,944 $ 120,239 $ 6,299,760
The accompanying notes are an integral part of these financial statements.

NOTES TO FINANCIAL STATEMENTS

25
CITY OF FAIRBURN, GEORGIA NOTES TO FINANCIAL STATEMENTS
SEPTEMBER 30, 2018
NOTE 1. SUMMARY OF SIGNIFICANT ACCOUNTING POLICIES
The financial statements of the City of Fairburn, Georgia (the “City”) have been prepared in conformity with accounting principles generally accepted in the United States of America (GAAP) as applied to governmental units. The Governmental Accounting Standards Board (GASB) is the accepted standard-setting body for establishing governmental accounting and financial reporting principles. The more significant of the City's accounting policies are described below.
A. Reporting Entity The City of Fairburn, Georgia was incorporated February 17, 1854 and adopted its City Charter on August 3, 1925 (Georgia Statutes 1925). The City operates under the Mayor and Council form of government and provides the following services as authorized by its charter: public safety (police and fire), street, sanitation, electric, water, and stormwater utilities, planning and zoning, and general administrative services. The financial statements of the City have been prepared in conformity with the accounting principles generally accepted in the United States of America as applied to governmental units. The Governmental Accounting Standards Board (GASB) is the accepted standard-setting body for establishing governmental accounting and financial reporting principles. The more significant accounting policies of the City are described below. As required by accounting principles generally accepted in the United States of America, the financial statements of the reporting entity include those of the City (the “primary government”) and its component unit. The component unit discussed below is included in the City's reporting entity because of the significance of its operational or financial relationship with the City. Blended component unit, although also legally separate entity, is in substance, part of the City’s operations, and data from this unit is combined with the data of the City. Based upon criteria set forth by Governmental Accounting Standards Board (GASB) 61 “The Financial Reporting Entity: Omnibus an Amendment of GASB Statements No. 14 and 34,” the accompanying financial statements present the City and its component unit, an entity for which the City is considered to be financially accountable. The Development Authority (or Downtown Development Authority) of the City was created for the purpose of revitalizing and redeveloping the central business district of the City, developing and promoting for the public good and general welfare, trade, commerce, industry, and employment opportunities, and to promote the general welfare within the City. The Development Authority is composed of seven (7) members created and appointed by the City Council and Mayor. The Development Authority is reported in the City’s financial statements as a blended component unit special revenue fund as it provides services exclusively to the City as a financing instrument. The blended component unit has a September 30th fiscal year-end. Financial information with regard to the Development Authority can be obtained directly from the City, City Hall, 56 Malone Street, Fairburn, Georgia 30213. Separate financial statements for the Development Authority are not prepared.

26
NOTES TO FINANCIAL STATEMENTS
NOTE 1. SUMMARY OF SIGNIFICANT ACCOUNTING POLICIES (CONTINUED)
B. Government-wide and Fund Financial Statements
The government-wide financial statements (i.e., the statement of net position and the statement of activities) report information on all of the activities of the primary government including its blended component unit. (For the most part, the effect of interfund activity has been removed from the government-wide financial statements). Government-wide financial statements do not provide information by fund, but distinguish between the City’s governmental activities and business-type activities. Governmental activities, which are normally supported by taxes and intergovernmental revenues, are reported separately from business-type activities, which rely to a significant extent on fees and charges for support. The statement of activities demonstrates the degree to which the direct expenses of a given function or segment are offset by program revenues. Direct expenses are those that are clearly identifiable with a specific function or segment. Program revenues include 1) charges to customers or applicants who purchase, use, or directly benefit from goods, services, or privileges provided by a given function or segment, and 2) grants and contributions that are restricted to meeting the operational or capital requirements of a particular function or segment. Taxes and other items not considered program revenues are reported instead as general revenues. Separate financial statements are provided for governmental funds and proprietary funds. Major individual governmental funds and major individual enterprise funds are reported as separate columns in the fund financial statements.
C. Measurement Focus, Basis of Accounting, and Basis of Presentation
The government-wide financial statements are reported using the economic resources measurement focus and the accrual basis of accounting, as are the proprietary fund financial statements. Revenues are recorded when earned and expenses are recorded when a liability is incurred, regardless of the timing of related cash flows. Property taxes are recognized as revenues in the fiscal year for which they are levied. Grants and similar items are recognized as revenue as soon as all eligibility requirements imposed by the provider have been met. Governmental fund financial statements are reported using the current financial resources measurement focus and the modified accrual basis of accounting. Revenues are recognized as soon as they are both measurable and available. Revenues are considered to be available when they are collectible within the current period or soon enough thereafter to pay liabilities of the current period. For this purpose, the City considers revenues to be available if they are collected within 60 days of the end of the current fiscal period for property taxes and 60 days for all other revenues. Expenditures are generally recorded when a liability is incurred, as under accrual accounting. However, debt service expenditures, as well as expenditures related to compensated absences, capital leases, and general obligation bonds are recorded only when payment is due.

27
NOTES TO FINANCIAL STATEMENTS
NOTE 1. SUMMARY OF SIGNIFICANT ACCOUNTING POLICIES (CONTINUED)
C. Measurement Focus, Basis of Accounting, and Basis of Presentation (Continued)
Property taxes, sales taxes, franchise taxes, licenses and permits, charges for services, and interest associated with the current fiscal period are all considered to be susceptible to accrual and so have been recognized as revenues of the current fiscal period, if the availability criteria are met. All other revenue items are considered to be measurable and available only when cash is received by the City. In accordance with GASB Statement No. 33, “Accounting and Financial Reporting for Non-exchange Transactions,” the corresponding assets (receivables) in non-exchange transactions are recognized in the period in which the underlying exchange occurs, when an enforceable legal claim has arisen, when all eligibility requirements have been met, or when resources are received, depending on the revenue source. In accordance with GASB Statement No. 34, major individual governmental funds and major individual enterprise funds are reported as separate columns in the fund financial statements. The City reports the following major governmental funds: The General Fund is the City’s primary operating fund. It accounts for all financial resources of the general government, except those required to be accounted for in another fund. The General Obligation Bond Capital Projects Fund accounts for the City’s general obligation bond proceeds to be used for the acquisition and construction of major capital facilities. The TSPLOST Fund accounts for the proceeds of the transportation special purpose local option sales tax for the various improvement projects as approved by voter referendum. Additionally, the City reports the following fund types within the nonmajor governmental funds: The special revenue funds account for revenue sources that are legally restricted or committed to expenditures for specific purposes. The capital projects fund accounts for financial resources to be used for the acquisition and construction of major capital projects. The permanent fund accounts for amounts received by the City which can only be used for a specific purpose. The principal of perpetual care cemetery funds are not available for expenditures based on legal or contractual requirements and must remain in trust and not be encroached upon. Only the income from such funds may be used for maintenance and upkeep of the Fairburn municipal cemetery.

28
NOTES TO FINANCIAL STATEMENTS
NOTE 1. SUMMARY OF SIGNIFICANT ACCOUNTING POLICIES (CONTINUED)
C. Measurement Focus, Basis of Accounting, and Basis of Presentation (Continued)
The City reports the following major enterprise (or proprietary) funds: The Electric Fund accounts for the activities of the City’s electric distribution operations. The Water and Sewer Fund accounts for the activities of the City’s water and sewer operations offered to its residents and businesses. The Educational Complex Fund accounts for the activities of the City’s educational complex operations offered to residents and businesses. The Stormwater Fund accounts for the activities of the City’s storm water operations. The City reports the following nonmajor proprietary fund: The Sanitation Fund accounts for the activities of the City’s sanitation operations. As a general rule, the effect of interfund activity has been eliminated from the government-wide financial statements. Exceptions to this general rule are payments-in-lieu of taxes and other charges between the City’s proprietary funds’ function and various other functions of the City. Elimination of these charges would distort the direct costs and program revenues reported for the various functions concerned. In accounting and reporting for its proprietary operations, the City applies all GASB pronouncements. Proprietary funds distinguish operating revenues and expenses from non-operating items. Operating revenues and expenses generally result from providing services and producing and delivering goods in connection with a proprietary fund’s principal ongoing operations. The principal operating revenues of the enterprise funds are charges for goods and services provided. Operating expenses of the enterprise funds include the cost of these goods and services, administrative expenses, and depreciation on capital assets. All revenues and expenses not meeting this definition are reported as non-operating revenues and expenses.

29
NOTES TO FINANCIAL STATEMENTS
NOTE 1. SUMMARY OF SIGNIFICANT ACCOUNTING POLICIES (CONTINUED)
D. Budgets and Budgetary Accounting
Annual appropriated budgets are adopted for all funds, except for the Cemetery Permanent Fund, which has its expenditures controlled by legal use restrictions imposed by a trust agreement. The budgets for the proprietary funds are for management control purposes and are not required to be reported. Budgets are prepared by the City Administrator prior to September 1 for the fiscal year to commence October 1. The City Administrator is authorized to transfer between line items within the budget without the City Council’s approval and expenditures may not exceed the legally adopted budget without the City Council’s approval. The level of control does not allow expenditures to legally exceed budgeted appropriations at the department level. Budgets are adopted on a modified accrual basis, which is consistent with generally accepted accounting principles for governmental funds. All appropriations lapse at fiscal year end. Encumbrance accounting - under which purchase orders, contracts, and other commitments for the expenditure of resources are recorded to reserve that portion of the applicable appropriation - is not employed by the City.
E. Cash and Cash Equivalents
Cash equivalents are defined as short-term, highly liquid investments that are both readily convertible to known amounts of cash and so near their maturity that they present insignificant risk of changes in value because of changes in interest rates. Generally, only investments with original maturities of three months or less meet this definition. For purposes of the statement of cash flows, all highly liquid investments with an original maturity of less than 90 days are considered to be cash equivalents. Investments are reported at fair value as determined by quoted market prices.
F. Deposits and Investments
The local government investment pool, “Georgia Fund 1,” created by OCGA 36-83-8, is a stable asset value investment pool, which follows Standard and Poor’s criteria for AAAf rated money market funds and is regulated by the Georgia Office of the State Treasurer. The pool is not registered with the SEC as an investment company. The pool’s primary objectives are safety of capital, investment income, liquidity and diversification while maintaining principle ($1 per share value). The asset value is calculated weekly to ensure stability. The pool distributes earnings (net of management fees) on a monthly basis and determines participants’ shares sold and redeemed based on $1 per share. The pool also adjusts the value of its investments to fair market value as of fiscal year-end and the City’s investment in the Georgia Fund 1 is reported at fair value. The City considers amounts held in Georgia Fund 1 as cash equivalents for financial statement presentation.

30
NOTES TO FINANCIAL STATEMENTS
NOTE 1. SUMMARY OF SIGNIFICANT ACCOUNTING POLICIES (CONTINUED)
F. Deposits and Investments (Continued)
The City’s nonparticipating interest-earning investment contracts (certificates of deposit) are recorded at cost. The City’s remaining investments are recorded at fair value. Increases or decreases in the fair value during the year are recognized as a component of interest income.
G. Property Taxes Receivable The tax digest for the calendar year is compiled by the Fulton County Tax Commissioner’s Office and is presented to the City by the first of August. The City bills and collects its own property taxes. The digest is reviewed by the City and tax bills are mailed by October 31st of each year and due on or before December 15th. The City may place liens for any and all debts after the due date. Ad valorem property tax revenue is recorded when it becomes available. Available means when due, or past due and receivable within the current period, expected to be collected soon enough thereafter to be used to pay liabilities of the current period. Such time thereafter shall not exceed 60 days. Delinquent property taxes for which the City has a property lien are shown as taxes receivable. Receivables are shown net of an allowance for uncollectible amounts when necessary.
H. Interfund Receivables and Payables Activity between funds that is representative of lending/borrowing arrangements outstanding at the end of the fiscal year are referred to as either “due to/from other funds” (i.e., the current portion of interfund loans) or “advances to/from other funds” (i.e., the non-current portion of interfund loans). All other outstanding balances between funds are reported as “due to/from other funds.” Any residual balances outstanding between the governmental activities and business-type activities are reported in the government-wide financial statements as “internal balances.” Advances between funds, as reported in the fund financial statements, are offset by a fund balance nonspendable account in applicable governmental funds to indicate that they are not available for appropriation and are not expendable available financial resources. The General Fund may report nonspendable fund balance related to interfund advances.
I. Inventory and Prepaid Items Inventory (if any) is valued at cost, using the first-in, first-out method. The cost of governmental fund type inventory is recorded as an expenditure when consumed rather than when purchased. Prepaid items are accounted for using the consumption method. Payments made to vendors for services that will benefit periods beyond September 30, 2018, are recorded as prepaid items in both government-wide and fund financial statements. Additionally, the government-wide financial statements report bond insurance costs as a prepaid item and it is amortized over the term of the related debt using the effective interest method.

31
NOTES TO FINANCIAL STATEMENTS
NOTE 1. SUMMARY OF SIGNIFICANT ACCOUNTING POLICIES (CONTINUED)
J. Restricted Assets
Certain proceeds of revenue bonds, as well as certain resources set aside for their repayment, are classified as restricted assets on the statement of net position because their use is limited by applicable bond covenants.
K. Grants from Other Governments
Federal and State governmental units represent an important source of supplementary funding used to finance housing, business development employment, construction programs, capital asset additions, and other activities beneficial to the community. This funding, primarily in the form of grants, is recorded in both governmental and proprietary funds. Grant contributions in the proprietary funds, which are for the purpose of construction activities, or land easement or capital asset acquisitions, are recorded as capital contributions within the statement of revenues and expenses. For all funds, a grant receivable is recorded when the City has met all eligibility requirements.
L. Capital Assets
Capital assets, which include property, plant, equipment, and infrastructure assets (e.g., roads, bridges, sidewalks, and similar items), are reported in the applicable governmental or business-type activities column in the government-wide financial statements. Capital assets are defined by the City as assets with an initial, individual cost of more than $5,000 and an estimated useful life in excess of two (2) years. Such assets are recorded at historical cost or estimated historical cost if purchased or constructed. Donated capital assets are recorded at estimated acquisition value at the date of donation. Infrastructure (e.g., roads, bridges, sidewalks, and similar items) prior to July 1, 2003 have not been reported. The cost of normal maintenance and repairs that do not add to the value of the asset or materially extend assets lives are not capitalized. Capital assets of the primary government are depreciated using the straight line method over the following estimated useful lives:
Assets YearsDistribution system 50Infrastructure 30Buildings and improvements 15-40Vehicles 10-20Machinery and equipment 3-10Computer equipment 3-5

32
NOTES TO FINANCIAL STATEMENTS
NOTE 1. SUMMARY OF SIGNIFICANT ACCOUNTING POLICIES (CONTINUED)
M. Compensated Absences
It is the City’s policy to permit employees to accumulate earned but unused vacation benefits. Vacation time is allowed to be carried over from the current calendar year up to a maximum of 240 hours without special approval from the City Administrator. All vacation pay is accrued when incurred in the government-wide and proprietary fund financial statements. A liability for these amounts is reported in the governmental funds only if they have matured, for example, as a result of employee resignations and retirements.
N. Unearned Revenue
Unearned revenue arise in both the governmental fund level and government-wide level when resources are received by the City before it has a legal claim to them. In subsequent periods, when the City has a legal claim to the resources, the liability for unearned revenue is removed from the balance sheet and revenue is recognized.
O. Long-Term Obligations
In the government-wide financial statements, and proprietary fund types in the fund financial statements, long-term debt and other long-term obligations are reported as liabilities in the applicable governmental activities, business-type activities, or proprietary fund type statement of net position. Bond premiums and discounts (if any) are deferred and amortized over the life of the bonds using the effective interest method. Bonds payable (if any) are reported net of the applicable bond premium or discount. Bond issuance costs (if any) are expensed when incurred. In the fund financial statements, governmental fund types recognize bond premiums, discounts, and bond issuance costs (if any), during the current period. The face amount of debt issued is reported as other financing sources. Premiums (if any) received on debt issuances are reported as other financing sources while discounts (if any) on debt issuances are reported as other financing uses. Issuance costs (if any), whether or not withheld from the actual debt proceeds received, are reported as debt service expenditures.

33
NOTES TO FINANCIAL STATEMENTS
NOTE 1. SUMMARY OF SIGNIFICANT ACCOUNTING POLICIES (CONTINUED)
P. Fund Equity and Net Position
Fund equity at the governmental fund financial reporting level is classified as “fund balance.” Fund equity for all other reporting is classified as “net position.” Fund Balance – Generally, fund balance represents the difference between the assets, deferred outflows of resources, deferred inflows of resources, and liabilities under the current financial resources management focus of accounting. In the fund financial statements, governmental funds report fund balance classifications that comprise a hierarchy based primarily on the extent to which the City is bound to honor constraints on the specific purpose for which amounts in those funds can be spent. Fund balances are classified as follows:
Nonspendable – Fund balances are reported as nonspendable when amounts cannot be spent because they are either (a) not in spendable form (i.e., items that are not expected to be converted to cash) or (b) legally or contractually required to be maintained intact.
Restricted – Fund balances are reported as restricted when there are limitations imposed on their use either through enabling legislation adopted by the City or through external restrictions imposed by creditors, grantors, laws or regulations of other governments.
Committed – Fund balances are reported as committed when they can be used only for specific purposes pursuant to constraints imposed by a formal vote and passage of an ordinance of the City Council. Only the City Council may modify or rescind the commitment by passage of a subsequent ordinance.
Assigned – Fund balances are reported as assigned when amounts are constrained by the City’s intent to be used for specific purposes, but are neither restricted nor committed. The City Council established a policy through a unanimous vote and passage of a resolution which expressly delegated to the City Administrator the authority to assign funds for particular purposes.
Unassigned – Fund balances are reported as unassigned as the residual amount when the balances do not meet any of the above criterion. The City reports positive unassigned fund balance only in the General Fund. The Mayor and City Council approved a policy through a resolution to build and maintain an unassigned fund balance in the General Fund equal to between twenty and thirty percent (20-30%) of operating budget, or an amount equal to 3 to 4 months’ operating expenditures. If at the end of any fiscal year, the fund balance falls below the targeted range, City staff will present a plan to the City Council for aligning the fund balance with the intent and purposes of this approved policy. Only deficits in fund balances may be reported as unassigned fund balance in other governmental funds.

34
NOTES TO FINANCIAL STATEMENTS
NOTE 1. SUMMARY OF SIGNIFICANT ACCOUNTING POLICIES (CONTINUED)
P. Fund Equity and Net Position (Continued) Flow Assumptions – When both restricted and unrestricted amounts of fund balance are available for use for expenditures incurred, it is the City’s policy to use restricted amounts first and then unrestricted amounts as they are needed. For unrestricted amounts of fund balance, it is the City’s policy to use fund balance in the following order: (1) Committed, (2) Assigned, and (3) Unassigned.
Net Position – Net position represents the difference between assets, deferred outflows of resources, liabilities, and deferred inflows of resources in reporting which utilizes the economic resources measurement focus. Net investment in capital assets consists of capital assets, net of accumulated depreciation, reduced by the outstanding balances of any borrowing used (i.e., the amount that the City has spent) for the acquisition, construction or improvement of those assets. Net position is reported as restricted using the same definition as used for restricted fund balance as described in the previous section. All other net position is reported as unrestricted. The City applies restricted resources first when an expense is incurred for purposes for which both restricted and unrestricted net position is available. Restrictions on the government-wide statement of net position represent amounts segregated to meet debt covenants and State laws.
Q. Management Estimates
The preparation of financial statements in conformity with accounting principles generally accepted in the United States of America requires management to make estimates and assumptions that affect the reported amount of assets, deferred outflows of resources, deferred inflows of resources, and liabilities and disclosure of contingent assets and liabilities at the date of the financial statements and the reported amount of revenues and expenditures/expenses during the period. Actual results could differ from those estimates.
R. Interfund Transactions
Interfund services provided and used in the fund financial statements are accounted for as revenue, expenditures, or expenses. Transactions that constitute reimbursements to a fund for expenditures/expenses initially made from it that are properly applicable to another fund, are recorded as expenditures/expenses in the reimbursing fund and as a reduction of expenditures/expenses in the fund that is reimbursed.

35
NOTES TO FINANCIAL STATEMENTS
NOTE 1. SUMMARY OF SIGNIFICANT ACCOUNTING POLICIES (CONTINUED) S. Deferred Outflows/Inflows of Resources
In addition to assets, the statement of financial position will sometimes report a separate section for deferred outflows of resources. This separate financial statement element, deferred outflows of resources, represents a consumption of net position that applies to a future period(s) and so will not be recognized as an outflow of resources (expense) until then. One of the items that qualifies for reporting in this category is the deferred loss on refunding reported in the government-wide statement of net position and the proprietary funds statement of net position. A deferred loss on refunding results from the difference in the carrying value of refunded debt and its reacquisition price. This amount is deferred and amortized over the shorter of the life of the refunding or refunded debt.
In addition to liabilities, the statement of net position will sometimes report a separate section for deferred inflows of resources. This separate financial statement element, deferred inflows of resources, represents an acquisition of net position that applies to future period(s) and so will not be recognized as an inflow of resources (revenue) until that time. The City has one item that qualifies for reporting in this category. Unavailable revenue, is reported only in the governmental funds balance sheet. The governmental funds report unavailable revenues from property taxes and these amounts are deferred and will be recognized as an inflow of resources in the period in which the amounts become available.
The City also has deferred outflows and inflows of resources related to the recording of changes in
its net pension liability. Certain changes in the net pension liability are recognized as pension expense over time instead of all being recognized in the year of occurrence. Experience gains or losses result from periodic studies by the City’s actuary which adjust the net pension liability for actual experience for certain trend information that was previously assumed, for example, the assumed dates of retirement of Plan members. These experience gains or losses are recorded as deferred outflows of resources or deferred inflows of resources and are amortized into pension expense over the expected remaining service lives of Plan members. Changes in actuarial assumptions which adjust the net pension liability are also recorded as deferred outflows of resources or deferred inflows of resources and are amortized into pension expense over the expected remaining service lives of Plan members. The difference between projected investment return on pension investments and actual return on those investments is also deferred and amortized against pension expense over a five year period. Additionally, any contributions made by the City to the pension plan before fiscal year end but subsequent to the measurement date of the City’s net pension liability are reported as deferred outflows of resources. These items are reported in the government-wide financial statements and also in the fund level statements for the City’s proprietary funds.
T. Pensions
For purposes of measuring the net pension liability, deferred outflows of resources and deferred inflows of resources related to pensions, and pension expense, information about the fiduciary net position of the City of Fairburn Retirement Plan (the “Plan”) and additions to/deductions from the Plan’s fiduciary net position have been determined on the same basis as they are reported by the Plan. For this purpose, benefit payments (including refunds of employee contributions) are recognized when due and payable in accordance with the benefit terms. Investments are reported at fair value.

36
NOTES TO FINANCIAL STATEMENTS
NOTE 2. RECONCILIATION OF GOVERNMENT-WIDE FINANCIAL STATEMENTS AND FUND FINANCIAL STATEMENTS
A. Explanation of Certain Differences Between the Governmental Fund Balance Sheet and the Government-wide Statement of Net Position
The governmental fund balance sheet includes a reconciliation between fund balance – total governmental funds and net position – governmental activities as reported in the government-wide statement of net position. One element of that reconciliation explains that “long-term liabilities are not due and payable in the current period and therefore are not reported in the funds.” The details of this $8,687,969 difference are as follows:
Bonds payable $ (9,120,000) Capital leases payable (112,372) Compensated absences (365,337) Accrued interest payable (85,708) Unamortized premium on bonds (4,188) Deferred loss on refunding 981,761 Prepaid bond insurance cost 17,875
$ (8,687,969) Net adjustment to reduce fund balance - total governmental funds to arrive at net position -
B. Explanation of Certain Differences between the Governmental Fund Statement of
Revenues, Expenditures, and Changes in Fund Balances and the Government-wide Statement of Activities
The governmental fund statement of revenues, expenditures, and changes in fund balances includes a reconciliation between net changes in fund balances – total governmental funds and changes in net position of governmental activities as reported in the government-wide statement of activities. One element of that reconciliation explains that “Governmental funds report capital outlays as expenditures. However, in the statement of activities the cost of those assets is allocated over their estimated useful lives and reported as depreciation expense. This is the amount by which capital outlay exceeded depreciation in the current period”. The details of this $2,179,818 difference are as follows:
Capital outlay $ 3,639,474 Depreciation expense (1,459,656) Net adjustment to increase net changes in fund balances - total
governmental funds to arrive at changes in net position ofgovernmental activities $ 2,179,818

37
NOTES TO FINANCIAL STATEMENTS
NOTE 3. LEGAL COMPLIANCE - BUDGETS
A. Budgets and Budgetary Accounting Prior to September 1 of each fiscal year, all departments of the City submit requests for appropriations to the City Administrator so that a budget may be prepared. The budget is prepared by fund, function and activity, and includes information of the prior fiscal year, current fiscal year estimates, and requested appropriations for the next fiscal year. Before September 30, the proposed budget is presented to the City Council for review. City Council holds public hearings and may add to, subtract from or change appropriations. The budget is then approved by an affirmative vote of a majority of the City’s council. B. Excess Expenditures Over Appropriations Expenditures may not legally exceed budgeted appropriations at the department level (e.g. administration). For the fiscal year ended September 30, 2018, the following item and fund, had excesses of actual expenditures over appropriations:
General Fund - Finance 157,402$ General Fund - Debt Service Principal Payments 219,157 General Fund - Transfers Out 48,407 General Fund - Judicial 111,413 Confiscated Assets Fund- Public Safety 58,889 General Obligation Bond Fund - Capital Outlay 5,175 General Obligation Bond Fund - Principal Payments 312,506 General Obligation Bond Fund - Issuance Cost 134,684 Grants Fund - Public Safety 9,895 TSPLOST Fund - Capital Outlay 2,767,207
NOTE 4. DEPOSITS AND INVESTMENTS
As of September 30, 2018, the City had the following investments:
Investment Maturities/Weighted Average Maturity Fair Value
Certificates of deposit August 24, 2019 - June 17, 2022 $ 176,664 Municipal Competitive Trust - intermediate 1.91 485,521 Municipal Competitive Trust - intermediate extended maturity 5.81 4,869,260 Georgia Fund 1 16 days 10,137
Total $ 5,541,582

38
NOTES TO FINANCIAL STATEMENTS
NOTE 4. DEPOSITS AND INVESTMENTS (CONTINUED)
Below is a reconciliation of cash and cash equivalents and investments to the Statement of Net Position.
As reported in the Statement of Net PositionPrimary governmentCash and cash equivalents $ 20,712,577 Restricted cash and cash equivalents 4,475,121 Investments 5,462,073 Investments with fiscal agent (restricted assets) 69,372
$ 30,719,143
Cash deposited with financial institutions $ 25,177,561 Certificates of deposit 176,664 Cash deposited with Georgia Fund 1 10,137 Municipal Competitive Trust - intermediate 485,521 Municipal Competitive Trust - intermediate extended maturity 4,869,260
$ 30,719,143
Interest rate risk. The City has no formal investment policy that limits investment maturities as a means of managing its exposure to fair value losses arising from increasing interest rates. Credit risk. State statutes authorize the City to invest in obligations of the State of Georgia or other States; obligations issued by the U.S. government; obligations fully insured or guaranteed by the U.S. government or by a government agency of the United States; obligations of any corporation of the U.S. government; prime bankers’ acceptances; the local government investment pool established by State law; repurchase agreements; and obligations of other political subdivisions of the State of Georgia. As of September 30, 2018, the City’s investments in the Municipal Competitive Trust were rated between AA+ - AAA.
Custodial credit risk – deposits. Custodial credit risk for deposits is the risk that, in the event of the failure of a depository financial institution, a government will not be able to recover deposits or will not be able to recover collateral securities that are in the possession of an outside party. State statues, and City policy, require all deposits and investments (other than Federal or State government instruments) to be collateralized at 110% by depository insurance, obligations of the U.S. government, or bonds of public authorities, counties, or municipalities. As of September 30, 2018, the City had no bank balances that were exposed to custodial credit risk. Fair Value Measurements. The City categorizes its fair value measurements within the fair value hierarchy established by generally accepted accounting principles. The hierarchy is based on the valuation inputs used to measure the fair value of the asset. Level 1 inputs are quoted prices in active markets for identical assets; Level 2 inputs are significant other observable inputs; and Level 3 inputs are significant unobservable inputs.
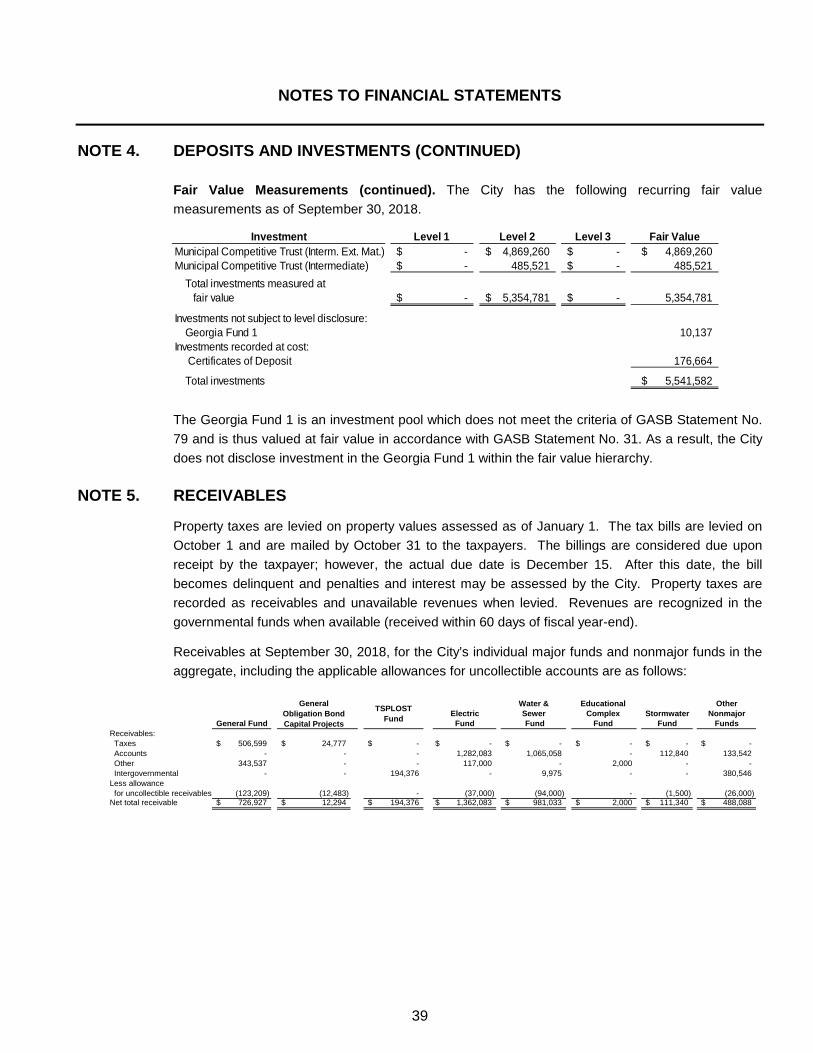
39
NOTES TO FINANCIAL STATEMENTS
NOTE 4. DEPOSITS AND INVESTMENTS (CONTINUED) Fair Value Measurements (continued). The City has the following recurring fair value
measurements as of September 30, 2018.
The Georgia Fund 1 is an investment pool which does not meet the criteria of GASB Statement No. 79 and is thus valued at fair value in accordance with GASB Statement No. 31. As a result, the City does not disclose investment in the Georgia Fund 1 within the fair value hierarchy.
NOTE 5. RECEIVABLES Property taxes are levied on property values assessed as of January 1. The tax bills are levied on October 1 and are mailed by October 31 to the taxpayers. The billings are considered due upon receipt by the taxpayer; however, the actual due date is December 15. After this date, the bill becomes delinquent and penalties and interest may be assessed by the City. Property taxes are recorded as receivables and unavailable revenues when levied. Revenues are recognized in the governmental funds when available (received within 60 days of fiscal year-end). Receivables at September 30, 2018, for the City’s individual major funds and nonmajor funds in the aggregate, including the applicable allowances for uncollectible accounts are as follows:
Receivables: Taxes $ 506,599 $ 24,777 $ - $ - $ - $ - $ - $ - Accounts - - - 1,282,083 1,065,058 - 112,840 133,542 Other 343,537 - - 117,000 - 2,000 - - Intergovernmental - - 194,376 - 9,975 - - 380,546 Less allowance for uncollectible receivables (123,209) (12,483) - (37,000) (94,000) - (1,500) (26,000) Net total receivable $ 726,927 $ 12,294 $ 194,376 $ 1,362,083 $ 981,033 $ 2,000 $ 111,340 $ 488,088
Water & OtherElectric Sewer NonmajorTSPLOST
FundGeneral Fund Fund Fund Fund Funds
Educational Complex
Fund
General Obligation Bond Capital Projects
Stormwater
Investment Level 1 Level 2 Level 3 Fair ValueMunicipal Competitive Trust (Interm. Ext. Mat.) -$ 4,869,260$ -$ 4,869,260$ Municipal Competitive Trust (Intermediate) -$ 485,521 -$ 485,521 Total investments measured at fair value -$ 5,354,781$ -$ 5,354,781
Investments not subject to level disclosure: Georgia Fund 1 10,137 Investments recorded at cost: Certificates of Deposit 176,664
Total investments 5,541,582$

40
NOTES TO FINANCIAL STATEMENTS
NOTE 6. CAPITAL ASSETS
Primary Government Capital asset activity for the fiscal year ended September 30, 2018, is as follows:
Beginning EndingBalance Increases Decreases Transfers Balance
Governmental activities:
Capital assets, not being depreciated:
Land $ 5,337,956 $ - $ - $ - $ 5,337,956 Construction in process 1,820,466 3,361,066 - - 5,181,532
Total 7,158,422 3,361,066 - - 10,519,488
Capital assets,being depreciated:
Buildings andimprovements 10,711,881 15,523 - - 10,727,404
Infrastructure 24,923,569 6,660 - - 24,930,229 Machinery and equipment 1,588,976 175,275 - - 1,764,251 Vehicles 4,698,633 80,950 - - 4,779,583
Total 41,923,059 278,408 - - 42,201,467
Less accumulateddepreciation for:
Buildings andimprovements (3,076,869) (444,470) - - (3,521,339)
Infrastructure (11,695,280) (625,275) - - (12,320,555) Machinery and equipment (914,249) (114,931) - - (1,029,180) Vehicles (3,157,164) (274,980) - - (3,432,144)
Total (18,843,562) (1,459,656) - - (20,303,218)
Total capital assets, beingdepreciated, net 23,079,497 (1,181,248) - - 21,898,249
Governmental activitiescapital assets, net $ 30,237,919 $ 2,179,818 $ - $ - $ 32,417,737

41
NOTES TO FINANCIAL STATEMENTS
NOTE 6. CAPITAL ASSETS (CONTINUED)
Beginning EndingBalance Increases Decreases Transfers Balance
Business-type activities:
Capital assets, not being depreciated:
Land $ 3,924,899 $ - $ - $ - $ 3,924,899 Construction in process 7,350 148,353 - - 155,703
Total 3,932,249 148,353 - - 4,080,602
Capital assets,being depreciated:
Distribution system 17,393,226 161,905 - - 17,555,131 Infrastructure 13,208,344 - - - 13,208,344 Building and improvements 25,626,576 - - - 25,626,576 Machinery and equipment 1,230,234 - - - 1,230,234 Vehicles 3,330,416 393,949 - - 3,724,365
Total 60,788,796 555,854 - - 61,344,650
Less accumulateddepreciation for:
Distribution system (8,459,472) (563,895) - - (9,023,367) Infrastructure (7,404,634) (300,743) - - (7,705,377) Building and improvements (6,785,938) (644,658) - - (7,430,596) Machinery and equipment (971,341) (28,834) - - (1,000,175) Vehicles (805,090) (91,599) - - (896,689)
Total (24,426,475) (1,629,729) - - (26,056,204)
Total capital assets, beingdepreciated, net 36,362,321 (1,073,875) - - 35,288,446
Business-type activitiescapital assets, net $ 40,294,570 $ (925,522) $ - $ - $ 39,369,048

42
NOTES TO FINANCIAL STATEMENTS
NOTE 6. CAPITAL ASSETS (CONTINUED)
Depreciation expense was charged to functions/programs of the primary government as follows:
Governmental activities:General government $ 32,134 Public safety 316,518 Public works 734,795 Culture and recreation 337,463 Planning and development 38,746
Total depreciation expense - governmental activities $ 1,459,656
Business-type activities:Water and sewer $ 630,045 Electric 344,117 Education complex 349,833 Stormwater 305,734
Total depreciation expense - business-type activities $ 1,629,729
NOTE 7. OPERATING LEASES
The City is the lessor of space at the Educational Complex. The majority of the lease agreements have terms extending beyond the end of the next fiscal year. For the fiscal year ended September 30, 2018, the City received $445,298 in lease revenue derived from current lease agreements with third parties. Lease revenues from these tenants in future fiscal years are as follows:
Fiscal Year Ending September 30, Total Revenues
2019 24,000$ 2020 24,000 2021 24,000 2022 24,000 Total Future Lease Revenues 96,000$

43
NOTES TO FINANCIAL STATEMENTS
NOTE 8. LONG-TERM DEBT
Primary Government Long-term liability and obligation activity for the fiscal year ended September 30, 2018, was as follows:
Beginning Ending Due WithinBalance Additions Reductions Balance One Fiscal Year
Governmental activities:Series 2011 General Obligation Bonds $ 8,385,000 $ - $ (6,530,000) $ 1,855,000 $ 440,000 Unamortized bond premium 20,496 - (16,308) 4,188 - Series 2017 Refunding Bonds - 7,365,000 (100,000) 7,265,000 120,000 Capital leases 238,465 165,380 (291,473) 112,372 55,099 Net pension liability 1,164,327 1,571,123 (2,454,034) 281,416 - Compensated absences 374,558 220,433 (229,654) 365,337 213,802 Governmental activities
Long-term liabilities and obligations $ 10,182,846 $ 9,321,936 $ (9,621,469) $ 9,883,313 $ 828,901
Beginning Ending Due WithinBalance Additions Reductions Balance One Fiscal Year
Business-type activities:Series 2014 Revenue Bonds $ 4,265,000 $ - $ (180,000) $ 4,085,000 $ 185,000 Series 2013 Revenue Refunding Bonds 7,675,000 - (840,000) 6,835,000 865,000 Series 2011 Educational Complex Revenue Bonds 13,720,000 - (12,080,000) 1,640,000 510,000 Plus unamortized bond premium 151,993 - (13,298) 138,695 - Less unamortized original discount (193,347) - 167,117 (26,230) - Series 2017 Educational Complex Revenue Refunding Bonds - 13,125,000 (60,000) 13,065,000 135,000 Capital lease 109,705 - (25,931) 83,774 26,903
25,728,351 13,125,000 (13,032,112) 25,821,239 1,721,903
Net pension liability 149,840 85,125 (129,160) 105,805 - Compensated absences 45,900 33,221 (30,339) 48,782 33,474 Business-type activities Long-term liabilities and obligations $ 25,924,091 $ 13,243,346 $ (13,191,611) $ 25,975,826 $ 1,755,377
For governmental funds, compensated absences and the net pension liability are liquidated by the General Fund and capital leases are liquidated by the General Fund. For business-type activities, compensated absences and the net pension liability are liquidated by the Water and Sewer Fund and the Electric Fund while capital leases are liquidated by the Electric Fund. General Obligation Bonds – Governmental activities. On March 9, 2011, the City of Fairburn issued $10,415,000 in General Obligation Bonds, Series 2011 with interest rates ranging from 3% to 5.75%. The purpose of which is to pay the cost of (a) acquiring, constructing and furnishing a fire station, certain City recreation facilities and downtown renewal projects, (b) constructing and installing certain road rebuilding projects, and (c) other projects of the City as may be determined in accordance with O.C.G.A. 36-824.2 (collectively, the “Projects”). Interest on the Bonds is payable semiannually on June 1 and December 1 of each fiscal year, commencing on June 1, 2011. These bonds mature on December 1, 2031.

44
NOTES TO FINANCIAL STATEMENTS
NOTE 8. LONG-TERM DEBT (CONTINUED)
General Obligation Bonds – Governmental activities (continued) The series 2011 General Obligation bonds were partially refunded with the Series 2017 General Obligation Bonds discussed below. On October 6, 2017, the City issued $7,365,000 of Series 2017 General Obligation Refunding Bonds to refund all but $1,855,000 of the Series 2011 General Obligation Bonds outstanding. The bonds were issued at an interest rate of 2.5% with annual maturities through fiscal year 2032. The net proceeds from the Series 2017 Bonds were deposited in an irrevocable trust with an escrow agent to provide all future debt service payments on the refunded bonds. The result of this transaction is a decrease in future debt service payments of $648,970 and a present value savings, or economic gain, of $556,430. The refunded bonds are considered defeased and thus the assets in the trust fund along with the $6,100,000 in outstanding refunded bonds at September 30, 2018 are not reported in the City’s financial statements. The remaining series 2011 general obligation bonds currently outstanding mature as follows:
Fiscal Year Ending September 30,2019 $ 440,000 $ 67,250 $ 507,250 2020 455,000 49,900 504,900 2021 470,000 30,813 500,813 2022 490,000 10,413 500,413 Total $ 1,855,000 $ 158,376 $ 2,013,376
InterestPrincipal Total
The series 2017 general obligation refunding bonds currently outstanding mature as follows:
Fiscal Year Ending September 30,2019 $ 120,000 $ 180,125 $ 300,125 2020 125,000 177,063 302,063 2021 125,000 173,938 298,938 2022 130,000 170,750 300,750 2023 640,000 161,125 801,125 2024-2028 3,320,000 560,000 3,880,000 2029-2032 2,805,000 141,313 2,946,313 Total $ 7,265,000 $ 1,564,314 $ 8,829,314
InterestPrincipal Total
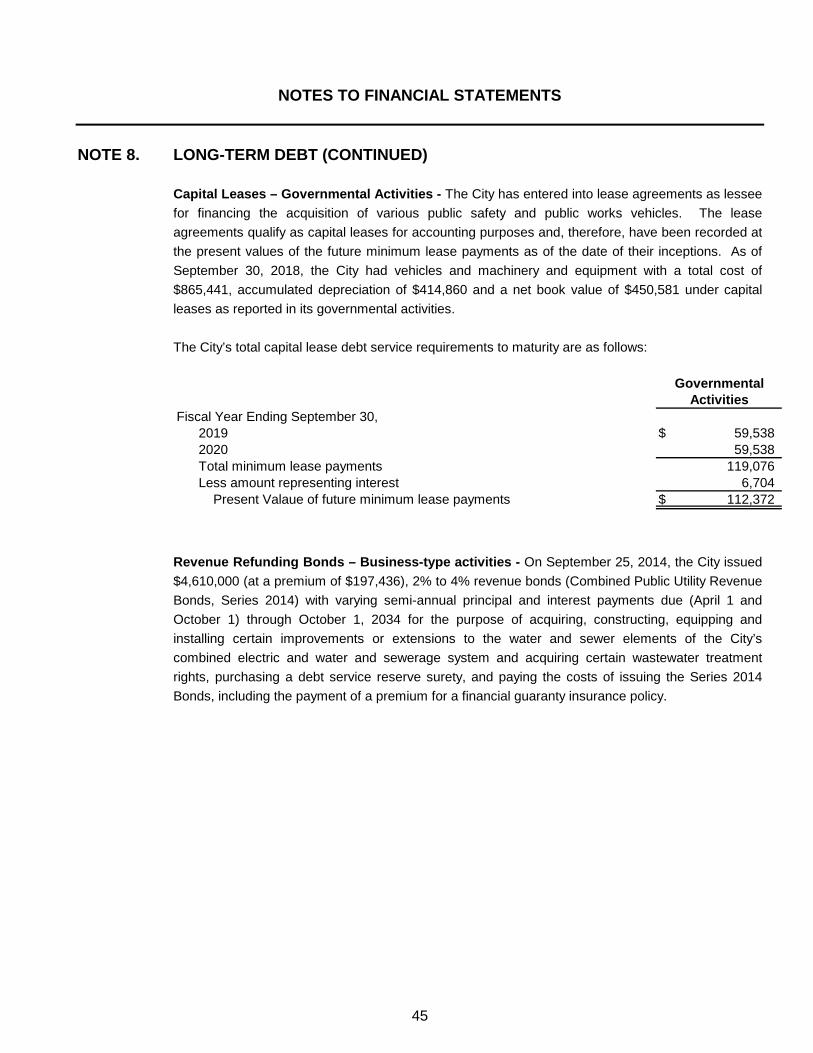
45
NOTES TO FINANCIAL STATEMENTS
NOTE 8. LONG-TERM DEBT (CONTINUED)
Capital Leases – Governmental Activities - The City has entered into lease agreements as lessee for financing the acquisition of various public safety and public works vehicles. The lease agreements qualify as capital leases for accounting purposes and, therefore, have been recorded at the present values of the future minimum lease payments as of the date of their inceptions. As of September 30, 2018, the City had vehicles and machinery and equipment with a total cost of $865,441, accumulated depreciation of $414,860 and a net book value of $450,581 under capital leases as reported in its governmental activities. The City’s total capital lease debt service requirements to maturity are as follows:
Fiscal Year Ending September 30,2019 $ 59,538 2020 59,538 Total minimum lease payments 119,076 Less amount representing interest 6,704 Present Valaue of future minimum lease payments $ 112,372
ActivitiesGovernmental
Revenue Refunding Bonds – Business-type activities - On September 25, 2014, the City issued $4,610,000 (at a premium of $197,436), 2% to 4% revenue bonds (Combined Public Utility Revenue Bonds, Series 2014) with varying semi-annual principal and interest payments due (April 1 and October 1) through October 1, 2034 for the purpose of acquiring, constructing, equipping and installing certain improvements or extensions to the water and sewer elements of the City’s combined electric and water and sewerage system and acquiring certain wastewater treatment rights, purchasing a debt service reserve surety, and paying the costs of issuing the Series 2014 Bonds, including the payment of a premium for a financial guaranty insurance policy.

46
NOTES TO FINANCIAL STATEMENTS
NOTE 8. LONG-TERM DEBT (CONTINUED)
On September 26, 2013, the City issued $9,310,000, 1.209% to 4.854% revenue bonds (Taxable Refunding Revenue Bonds, Series 2013) with varying semi-annual principal and interest payments due (April 1 and October 1) through October 1, 2024. The net proceeds from these bonds along with $1,095,570 of City funds were used to refund the outstanding balance of the Series 2006 Revenue Refunding Bonds. The refunding portion of this transaction resulted in a debt service savings of $257,312 and the negative net present value cash-flow savings was determined to be $838,258 during fiscal year 2013. On September 20, 2011, the Downtown Development Authority, as a blended component unit of the City of Fairburn, issued $15,280,000 of Series 2011 Educational Complex Revenue Bonds bearing interest rates ranging from 2% to 4.75% payable July 1 and January 1 beginning 2012 with the bonds maturing on July 1, 2033. The 2011 bonds were issued for the purpose of refunding the Series 2008 Educational Bonds and financing the additional acquisition, construction, and installation of the education campus with parking and related facility. The refunding portion of this transaction resulted in a negative debt service savings of $1,986,680 and the negative net present value cash-flow savings was determined to be $839,726 during fiscal year 2011. The Series 2011 Educational Complex Revenue Bonds were partially refunded with the Series 2017 Education Bonds discussed below. On October 6, 2017, the City issued $13,125,000 of Series 2017 Educational Complex Refunding Bonds to refund all but $2,100,000 of the Series 2011 Education Complex Bonds outstanding. The bonds were issued at an interest rate of 2.66% with annual maturities through fiscal year 2033. The net proceeds from the Series 2017 Educational Complex Refunding Bonds were deposited in an irrevocable trust with an escrow agent to provide all future debt service payments on the refunded bonds. The result of this transaction is a decrease in future debt service payments of $780,305 and a present value savings, or economic gain, of $643,630. The refunded bonds are considered defeased and thus the assets in the trust fund along with the $11,620,000 in outstanding refunded bonds at September 30, 2018 are not reported in the City’s financial statements. The Downtown Development Authority is responsible for promoting industrial and commercial development within the City of Fairburn. However, the City of Fairburn does provide financial support each year and has contractually obligated itself to use its taxing powers to guarantee the repayment of principal and interest on the Series 2011 Educational Complex revenue bonds issued by the Downtown Development Authority.

47
NOTES TO FINANCIAL STATEMENTS
NOTE 8. LONG-TERM DEBT (CONTINUED)
Revenue bonds (Series 2011, 2013, 2014, and 2017) currently outstanding mature as follows:
Fiscal Year Ending September 30,2019 $ 1,695,000 $ 823,663 $ 2,518,663 2020 1,770,000 771,263 2,541,263 2021 1,850,000 711,189 2,561,189 2022 1,940,000 644,330 2,584,330 2023 2,030,000 564,839 2,594,839 2024-2028 8,135,000 1,840,591 9,975,591 2029-2033 7,575,000 777,288 8,352,288 2034-2035 630,000 25,400 655,400 Total $ 25,625,000 $ 6,158,563 $ 31,783,563
Plus unamortized bond premium 138,695 Less unamortized bond discount (26,230)
$ 25,737,465
InterestPrincipal Total
Capital Leases – Business-type activities - The City has entered into lease agreements as lessee for financing the acquisition of electrical equipment. The lease agreements qualify as capital leases for accounting purposes and, therefore, have been recorded at the present values of the future minimum lease payments as of the date of their inceptions. As of September 30, 2018, the City had equipment with a total cost of $139,750, accumulated depreciation of $20,963 and net book value of $118,787 under capital leases as reported in its business-type activities. The City’s total capital lease debt service requirements to maturity are as follows:
Fiscal Year Ending September 30,2019 $ 30,045 2020 30,045 2021 30,045 Total minimum lease payments 90,135 Less amount representing interest 6,361 Present Valaue of future minimum lease payments $ 83,774
ActivitiesBusiness-type

48
NOTES TO FINANCIAL STATEMENTS
NOTE 9. INTERFUND RECEIVABLES, PAYABLES, AND TRANSFERS
The composition of interfund balances as of September 30, 2018 is as follows:
Due to/from other funds:
All interfund balances resulted from the time lag between the dates that (1) interfund goods and services are provided or reimbursable expenditures occur, (2) transactions are recorded in the accounting system, and (3) payments between funds are made. The interfund balance owed to the General Fund by the TSPLOST Fund is for allowable TSLOST expenditures.
Interfund transfers:
Transfers In Transfers Out
General Fund Water & Sewer Fund $ 450,000General Fund Electric Fund 750,000General Fund Nonmajor enterprise fund 50,000General Fund Educational Complex Fund 241,643Educational Complex Fund General Fund 729,643Nonmajor governmental Funds General Fund 196,174
Total $ 2,417,460
Amount
Transfers are used to (1) move revenues from the fund that statute or budget requires collecting them to the fund that statute or budget requires to expend them, (2) use unrestricted revenues collected in the General Fund to finance various programs accounted for in other funds in accordance with budgetary authorizations, and (3) to move unrestricted service revenues to the General Fund to supplant property taxes.
NOTE 10. PENSION PLAN
Plan Description. The City, as authorized by the City Council, has established a defined benefit pension plan (The City of Fairburn Retirement Plan) covering all full-time employees. The City Council in its role as the Plan Sponsor, has the sole authority to amend the provisions, including specific benefit provisions and contribution requirements of the Plan as provided by the Plan document. Effective January 1, 2015, the Plan was amended to provide for immediate participation for employees. The City’s pension plan is affiliated with the Georgia Municipal Employee Benefit System (GMEBS), an agent multiple-employer pension plan administered by the Georgia Municipal Association (GMA). Contributions made by the City are commingled with contributions made by other members of GMEBS for investment purposes. Active plan members (employees of the City) are not required to make contributions to the Plan. The City does not own any securities on its own. Investment income from the securities is allocated on a pro rata basis.
Receivable Fund Payable Fund
General Fund TSPLOST Fund $ 1,223,988
Amount

49
NOTES TO FINANCIAL STATEMENTS
NOTE 10. PENSION PLAN (CONTINUED) Plan Description (continued). The Plan provides retirement, disability, and death benefits to plan participants and beneficiaries. The Georgia Municipal Association issues a publicly available financial report that includes financial statements and required supplementary information for GMEBS. That report may be obtained by writing to Georgia Municipal Association, Risk Management and Employee Benefit Services, 201 Pryor Street, NW, Atlanta, Georgia 30303 or by calling (404) 688-0472 or on the internet at www.gmanet.com. Plan Membership. At January 1, 2018, the date of the most recent actuarial valuation, there were 284 participants consisting of the following:
Retirees and beneficiaries currently receiving benefits 61 Terminated vested participants not yet receiving benefits 80 Active employees - vested 136 Active employees - nonvested 7
Total 284
Contributions. The Plan is subject to minimum funding standards of the Georgia Public Retirement Systems Standards law. The Board of Trustees of GMEBS has adopted a recommended actuarial funding policy for the Plan which meets state minimum requirements and will accumulate sufficient funds to provide the benefits under the Plan. The funding policy for the Plan, as adopted by the City Council, is to contribute an amount equal to or greater than the actuarially recommended contribution rate. This rate is based on the estimated amount necessary to finance the costs of benefits earned by Plan members during the year, with an additional amount to finance any unfunded accrued liability. The City is required to contribute the difference between the actuarially determined rate and the contribution rate of Plan members, as determined by the City Council. At this time, Plan members are not required to make contributions to the Plan. For the fiscal year ended September 30, 2018, the City's contribution rate was 9.07% of annual payroll. City contributions to the Plan were $504,950 for the fiscal year ended September 30, 2018.
Net Pension Liability of the City. The City’s net pension liability was measured as of September 30, 2017. The total pension liability used to calculate the net pension liability was determined by an actuarial valuation as January 1, 2017 with update procedures performed by the actuary to roll forward to the total pension liability measured as of September 30, 2017. Actuarial Assumptions. The total pension liability in the January 1, 2017 actuarial valuation was determined using the following actuarial assumptions, applied to all periods included in the measurement:
- Inflation 2.75% - Salary increases 3.25% - 8.25%, including inflation
- Investment rate of return 7.50%, net of pension plan investment expense, including inflation

50
NOTES TO FINANCIAL STATEMENTS
NOTE 10. PENSION PLAN (CONTINUED)
Mortality rates for the January 1, 2017 valuation were based on the RP-2000 Combined Healthy Mortality Table with sex-distinct rates, set forward two years for males and one year for females. The actuarial assumptions used in the January 1, 2017 valuation were based on the results of an actuarial experience study for the period January 1, 2010–June 30, 2014. Cost of living adjustments were assumed to be 2.75% although the Plan allowance for annual cost of living adjustment is variable, as established by the City Council, in an amount not to exceed 4%.
The long-term expected rate of return on pension plan investments was determined using a building-block method in which best-estimate ranges of expected future real rates of return (expected returns, net of pension plan investment expense and inflation) are developed for each major asset class. These ranges are combined to produce the long-term expected rate of return by weighting the expected future real rates of return by the target asset allocation percentage and by adding expected inflation. Best estimates of arithmetic real rates of return for each major asset class included in the pension plan's target asset allocation as of September 30, 2017 are summarized in the following table:
Long-termTarget expected real
Asset class allocation rate of return*
Domestic equity 45% 6.71%International equity 20% 7.71Real estate 10% 5.21Global fixed income 5% 3.36Domestic fixed income 20% 2.11Cash —%
Total 100%
* Rates shown are net of the 2.75% assumed rate of inflation
Discount Rate. The discount rate used to measure the total pension liability was 7.50%. The projection of cash flows used to determine the discount rate assumed that plan member contributions will be made at the current contribution rate and that City contributions will be made at rates equal to the difference between actuarially determined contribution rates and the member rate. Based on those assumptions, the pension plan's fiduciary net position was projected to be available to make all projected future benefit payments of current plan members. Therefore, the long-term expected rate of return on pension plan investments was applied to all of the projected benefit payments to determine the total pension liability.

51
NOTES TO FINANCIAL STATEMENTS
NOTE 10. PENSION PLAN (CONTINUED) Changes in the Net Pension Liability of the City. The changes in the components of the net pension liability of the City for the fiscal year ended September 30, 2018, were as follows:
Total Pension Plan Fiduciary Net PensionLiability Net Position Liability
(a) (b) (a) - (b)Balances at 9/30/17 $ 13,243,092 $ 11,928,925 $ 1,314,167 Changes for the fiscal year:Service cost 459,081 - 459,081 Interest 1,005,868 - 1,005,868
Differences between expected and actual experience 158,946 - 158,946
Changes in actuarial assumptions (286,177) - (286,177)Contributions—employer - 501,693 (501,693)Net investment income - 1,795,324 (1,795,324)Benefit payments, including refunds of employee contributions (528,299) (528,299) -
Administrative expense - (32,353) 32,353 Net changes 809,419 1,736,365 (926,946)Balances at 9/30/18 $ 14,052,511 $ 13,665,290 $ 387,221
The required schedule of changes in the City’s net pension liability and related ratios immediately following the notes to the financial statements presents multiyear trend information about whether the value of plan assets is increasing or decreasing over time relative to the total pension liability.
Sensitivity of the Net Pension Liability to Changes in the Discount Rate. The following presents the net pension liability of the City, calculated using the discount rate of 7.50 percent, as well as what the City's net pension liability would be if it were calculated using a discount rate that is 1-percentage-point lower (6.50 percent) or 1-percentage-point higher (8.50 percent) than the current rate:
Current1% Decrease Discount Rate 1% Increase
(6.50%) (7.50%) (8.50%)
City's net pension liability $ 2,457,840 $ 387,221 $ (1,297,962)
Changes in the Net Pension Liability of the City. Actuarial valuations involve estimates of the value of reported amounts and assumptions about the probability of events far into the future, and actuarially determined amounts are subject to continual revision as results are compared to past expectations and new estimates are made about the future. Actuarial calculations reflect a long-term perspective. Calculations are based on the substantive plan in effect as of September 30, 2017 and the current sharing pattern of costs between employer and employee.

52
NOTES TO FINANCIAL STATEMENTS
NOTE 10. PENSION PLAN (CONTINUED) Pension Expense, Deferred Outflows of Resources, and Deferred Inflows of Resources Related to Pensions. For the fiscal year ended September 30, 2018, the City recognized pension expense of $93,173. At September 30, 2018, the City reported deferred outflows of resources and deferred inflows of resources related to pensions from the following sources:
Differences between expected and actual experience $ 119,211 $ 182,325
Changes in assumptions - 214,632
Net difference between projected and actual earnings on pension plan investments - 705,692
City contributions subsequent to the measurement date 504,950 -
Total $ 624,161 $ 1,102,649
DeferredOutflows ofResources
DeferredInflows ofResources
City contributions subsequent to the measurement date of $504,950 are reported as deferred outflows of resources and will be recognized as a reduction of the net pension liability in the fiscal year ending September 30, 2019. Other amounts reported as deferred outflows of resources and deferred inflows of resources related to pensions will be recognized in pension expense as follows:
Fiscal year ending September 30:
2019 $ (310,935) 2020 (217,797) 2021 (280,083) 2022 (174,623) Thereafter -
Total $ (983,438)
53
NOTES TO FINANCIAL STATEMENTS
NOTE 11. DEFERRED COMPENSATION PLAN
The City of Fairburn, Georgia offers its employees an Internal Revenue Code Section 457 Plan (the “Plan”) which is a deferred compensation plan that qualifies as a defined contribution pension plan. The Plan is administered by a third party administrator, ICMA. The City has no fiduciary relationship with the trust. Accordingly, the Plan assets are not reported in the City’s financial statements. Plan provisions and contribution requirements are established and may be amended by the City’s Mayor and Council. At September 30, 2018, there were 37 Plan members in the respective plans. Employees are not required to contribute to the Plan. Employees may contribute a portion of their gross salary, not to exceed the IRS guidelines, into the Plan. Effective October 1, 2012, the City no longer matches employee contributions. The Plan allows employees to increase, decrease, stop, and restart deferrals as often as they wish without penalties or fees. Total employee contributions for the fiscal year ended September 30, 2018 were $78,906.
NOTE 12. JOINT VENTURE
Under Georgia law, the City, in conjunction with other cities and counties in the Atlanta, Georgia area, is a member of the Atlanta Regional Commission (ARC). Dues to the ARC are assessed at the County level and are, accordingly, paid on the City’s behalf by Fulton County. Membership in the ARC is required by the Official Code of Georgia Annotated (OCGA) Section 50-8-34 which provides for the organizational structure of the ARC in Georgia. The ARC Board membership includes the chief elected official of each county and various municipalities of the area. OCGA 50-8-39.1 provides that the member governments are liable for any debts or obligations of the ARC. Separate financial statements may be obtained from ARC, 40 Courtland Street, NE, Atlanta, Georgia 30303.
NOTE 13. RELATED ORGANIZATIONS
The City’s governing body is responsible for appointing a majority of the board members of the City of Fairburn Housing Authority. However, the City has no further accountability for this organization.
NOTE 14. RISK MANAGEMENT
The City is exposed to various risks of losses related to torts; theft of, damage to, and destruction of assets; errors and omissions; injuries to employees; and natural disasters. The City has joined together with other municipalities in the State as part of the Georgia Interlocal Risk Management Agency Property and Liability Insurance Fund and the Georgia Municipal Association Group Self-Insurance Workers' Compensation Fund, public entity risk pools currently operating as common risk management and insurance programs for member local governments.

54
NOTES TO FINANCIAL STATEMENTS
NOTE 14. RISK MANAGEMENT (CONTINUED)
As part of these risk pools, the City is obligated to pay all contributions and assessments as prescribed by the pools, to cooperate with the pool’s agents and attorneys, to follow loss reduction procedures established by the funds, and to report as promptly as possible, and in accordance with any coverage descriptions issued, all incidents which could result in the funds being required to pay any claim of loss. The City is also to allow the pool’s agents and attorneys to represent the City in investigation, settlement discussions and all levels of litigation arising out of any claim made against the City within the scope of loss protection furnished by the funds.
The funds are to defend and protect the members of the funds against liability or loss as prescribed in the member government contract and in accordance with the workers' compensation law of Georgia. The funds are to pay all cost taxed against members in any legal proceeding defended by the members, all interest accruing after entry of judgment, and all expenses incurred for investigation, negotiation or defense. Settled claims have not exceeded the coverage in the past three fiscal years. The City carries commercial insurance for other risks of losses. For insured programs, there have been no significant reductions in insurance coverage. Settlement amounts have not exceeded insurance coverage in the past three fiscal years.
NOTE 15. COMMITMENTS AND CONTINGENCIES
Litigation:
The City is a defendant in certain legal actions in the nature of claims for alleged damages to persons and property and other similar types of actions rising in the course of City operations. Liability, if any, which might result from these proceedings, would not, in the opinion of management and legal counsel, have a material adverse effect on the financial position of the City.
Contractual Commitments:
For the fiscal year ended September 30, 2018, the City had active construction contracts related to various construction projects. At fiscal year end, the City’s commitments with contractors totaled approximately $3,125,026.

55
NOTES TO FINANCIAL STATEMENTS
NOTE 15. COMMITMENTS AND CONTINGENCIES (CONTINUED)
Grant Contingencies:
The City has received Federal and State grants for specific purposes that are subject to review and audit by the grantor agencies. Such audits could lead to the disallowance of certain expenditures previously reimbursed by those agencies. Based upon prior experience, management of the City believes such disallowances, if any, will not be significant.
Agreements with the Municipal Electric Authority of Georgia: The Municipal Electric Authority of Georgia (MEAG) is a public corporation and an instrumentality of the State of Georgia created to supply electricity to local government electric distribution systems. As provided by State law, MEAG establishes rates and charges so as to produce revenues sufficient to cover its costs, including debt service, but it may not operate any of its projects for profit, unless any such profits insure to the benefit of the public. The City of Fairburn is a participant in the Municipal Electric Authority of Georgia (MEAG Power) and has a contractual agreement to purchase a portion of its power requirements from Southeastern Power Administration (SEPA). All power requirements that are in excess of that provided by SEPA are purchased from MEAG Power at prices intended to cover the operating costs of the system and to retire any debt service incurred by MEAG on the City’s behalf. In the event that revenues are insufficient to cover all costs and retire the outstanding debt, each participating City has guaranteed a portion of the unpaid debt based on their individual entitlement shares of the output and services of generating units acquired or constructed by MEAG. In addition, in the event of discontinued service to a participant in default, the City would be obligated to purchase additional power subject to contractual limitations. Payments to MEAG are made monthly based on KWH usage. The total payments under these contracts amounted to $6,187,108 during fiscal year ended September 30, 2018. At September 30, 2018, the outstanding debt of MEAG was approximately $6.003 billion. The City's guarantee varies by individual projects undertaken by MEAG and totals approximately $58.9 million at September 30, 2018. During fiscal year 2009, MEAG and MEAG’s bond holders authorized the usage of Municipal Competitive Trust (“MCT”) funds. The original intended use of the MCT funds were to reduce MEAG’s costs and thus charge individual participants, such as the City of Fairburn, less in power on a monthly basis. The MCT funds were only to be used in response to remedy potential deregulation in the State of Georgia. Since deregulation has not occurred in the State of Georgia, MEAG and MEAG’s bond holders authorized the usage of the MCT funds as if deregulation had actually occurred. As a result, the City will receive a credit reduction in its monthly purchased power invoice; effectively reducing the City’s cost. The projected benefits of this reduction over the next year as of September 30, 2018 is $108,374.

56
NOTES TO FINANCIAL STATEMENTS
NOTE 16. HOTEL/MOTEL LODGING TAX The City established a 3% tax under O.C.G.A. 48-13-51(a)(1) on gross hotel occupancy revenues for the purpose of promoting tourism, conventions, and trade shows. Local governments imposing a tax under this code section are required to expend in each fiscal year at least the same percentage of hotel/motel tax revenues they expended in the previous fiscal year for the promotion of tourism, conventions, and trade shows. The City has not set a precedent resulting in a restriction of the City’s hotel/motel tax funds. Therefore, none of the revenue collected by the City under this authorization is restricted. For the fiscal year ended September 30, 2018, the City collected $285,075 in hotel/motel revenues which are recorded in the City’s General Fund.
NOTE 17. JOINTLY GOVERNED ORGANIZATION
On March 13, 2001, the City of Fairburn, the City of Union City, and the City of Palmetto created by joint resolutions pursuant to the authority of the General Assembly of the State of Georgia, the South Fulton Municipal Regional Water and Sewer Authority (the “Water and Sewer Authority”). The Water and Sewer Authority was created to provide alternative water and sewer resources for the Cities of Fairburn, Union City, and Palmetto. The Water and Sewer Authority is governed by a board of seven (7) directors, three of whom are the chief elected official of each member city, three (3) of whom are appointed one (1) each by each of the member cities, and one (1) director being appointed by members of the local delegation of the Georgia General Assembly who represent all, or any part of, a member city. The Water and Sewer Authority issues revenue bonds to finance the construction of reservoir. Once completed, the member Cities will purchase water from the Water and Sewer Authority. The City does not provide financial support to the Water and Sewer Authority, but has contractually obligated itself to use its full taxing power to guarantee the repayment of approximately 34.72% of the principal and interest on the Water and Sewer Authority’s Series 2007 Variable Rate Revenue Bonds if the Water and Sewer Authority’s resources can not cover the debt service. During the fiscal year ended September 30, 2018, the City agreed to pay the Water and Sewer Authority $1,140,744 (reported as interest expense) for the City’s proportionate share of the principal and interest on the Water and Sewer Authority’s bonds from revenues of the City’s Water and Sewer Fund.
On July 1, 2014, the Authority entered into an agreement to refinance the Series 2007 Variable Rate Revenue Bonds Authority with the Series 2014 bonds. The net results of the refinancing resulted in an economic loss of $3,953,000 and a deferred outflow of resources on the refunding of $4,087,845.

57
NOTES TO FINANCIAL STATEMENTS
NOTE 17. JOINTLY GOVERNED ORGANIZATION (CONTINUED)
As of December 31, 2017 (from the most recent available audited financial statements), the Water and Sewer Authority’s debt service requirements on the Series 2014 Variable Rate Revenue Bonds were as follows using the current variable interest rate of 3.670%:
Fiscal Year Ending December 31,2018 $ 1,270,000 $ 1,350,425 2,620,425 2019 1,335,000 1,311,350 2,646,350 2020 1,400,000 1,263,325 2,663,325 2021 1,490,000 1,205,525 2,695,525 2022 1,575,000 1,144,226 2,719,226 2023-2027 9,495,000 4,493,748 13,988,748 2028-2032 12,605,000 2,046,712 14,651,712 2033-2035 2,955,000 59,100 3,014,100 Total $ 32,125,000 $ 12,874,411 $ 44,999,411
InterestPrincipal Total
Separate financial statements for the Water and Sewer Authority can be obtained at the following address: South Fulton Municipal Regional Water and Sewer Authority, P.O. Box 855, Fairburn, Georgia 30213.
NOTE 18. TAX ABATEMENTS For the year ended September 30, 2018, City property tax revenues were reduced by $370,050 under agreements entered into by Fulton County. Under the agreements, taxes on both real property and personal property are reduced based on investments made by the corporation to whom the incentives were offered as long as the corporation meets certain investment targets.

REQUIRED SUPPLEMENTARY INFORMATION

58
CITY OF FAIRBURN, GEORGIA Required Supplementary Information – Retirement Plan
SCHEDULE OF CHANGES IN THE CITY'S NET PENSION LIABILITY
AND RELATED RATIOS
Total pension liabilityService cost $ 459,081 $ 430,351 $ 358,809 $ 426,065 Interest on total pension liability 1,005,868 961,894 894,973 880,377 Other Changes (286,177) - 174,676 (352,216) Differences between expected and actual experience 158,946 (316,723) (95,851) (331,710) Benefit payments, including refunds of employee contributions (528,299) (487,933) (450,275) (418,094)
Net change in total pension liability 809,419 587,589 882,332 204,422
Total pension liability - beginning 13,243,092 12,655,503 11,773,171 11,568,749
Total pension liability - ending (a) $ 14,052,511 $ 13,243,092 $ 12,655,503 $ 11,773,171
Plan fiduciary net positionContributions - employer $ 501,693 $ 455,271 $ 504,853 $ 519,993 Net investment income 1,795,324 1,201,570 117,480 1,082,171 Benefit payments, including refunds of employee contributions (528,299) (487,933) (450,275) (418,094) Administrative expenses (32,353) (17,223) (20,547) (15,930)
Net change in plan fiduciary net position 1,736,365 1,151,685 151,511 1,168,140
Plan fiduciary net position - beginning 11,928,925 10,777,240 10,625,729 9,457,589
Plan fiduciary net position - ending (b) $ 13,665,290 $ 11,928,925 $ 10,777,240 $ 10,625,729
City's net pension liability - ending (a) - (b) $ 387,221 $ 1,314,167 $ 1,878,263 $ 1,147,442
Plan fiduciary net position as a percentage of the total pension liability 97.2% 90.1% 85.2% 90.3%
Covered payroll $ 5,794,145 $ 5,434,761 $ 5,264,479 $ 4,444,802
City's net pension liability as a percentage of - covered payroll 6.7% 24.2% 35.7% 25.8%
Notes to the ScheduleThe schedule will present 10 years of information once it is accumulated.
2016 201520172018

59
CITY OF FAIRBURN, GEORGIA Required Supplementary Information – Retirement Plan
SCHEDULE OF CITY CONTRIBUTIONS
Actuarially determined contribution $ 504,950 $ 501,693 $ 455,271 $ 504,853
Contributions in relation to the actuarially determined contribution 504,950 501,693 455,271 504,853
Contribution deficiency (excess) $ - $ - $ - $ -
Covered payroll $ 5,421,039 $ 5,794,145 $ 5,434,761 $ 5,264,479
Contributions as a percentage of Covered-employee payroll 9.31% 8.66% 8.38% 9.59%
Actuarially determined contribution $ 519,993
Contributions in relation to the actuarially determined contribution 519,993
Contribution deficiency (excess) $ -
Covered payroll $ 4,444,802
Contributions as a percentage of Covered payroll 11.70%
Notes to the Schedule:(1) Actuarial Assumptions:Valuation Date January 1, 2017Cost MethodActuarial Asset Valuation Method
Assumed Rate of Return On Investments 7.50%Projected Salary IncreasesCost-of-living Adjustment 2.75%Amortization MethodRemaining Amortization Period
2015
(2) The schedule will present 10 years of information once it is accumulated.
20162017
Projected Unit Credit
None remaining
2018
Sum of actuarial value at beginning of year and the cash flow during the year plus the assumed investment return, adjusted by 10% of the amounts that the value exceeds or is less than the market value at the end of the year. The actuarial value is adjusted, if necessary, to be within 20% of market value.
Closed level dollar for unfunded liability
2.75% plus service based merit increases
2014

COMBINING AND INDIVIDUAL FUND STATEMENTS
AND SCHEDULES

CITY OF FAIRBURN, GEORGIA
NONMAJOR GOVERNMENTAL FUNDS
SPECIAL REVENUE FUNDS
Special Revenue Funds are used to account and report the proceeds of specific revenue sources that are restricted or committed to expenditures for specified purposes other than debt services and capital projects. Confiscated Assets Fund – To account for the City’s share of excess funds received from confiscated capital and
equipment. These monies must be used for police related expenditures and are restricted by Federal law. Grants Fund – This fund accounts for activities carried out by the City under the terms of various intergovernmental
grants. Included in this fund is the Livable Centers Initiative (“LCI”) grant which provides funds to be used for the enhancement of existing centers and corridors consistent with regional development policies, and also provides transportation infrastructure funding for projects identified in the LCI plans. Also included in this fund is a Local Maintenance & Improvement Grant (“LMIG”) which provides improvements to the City’s roadway network. These grant funds are restricted by the various grantor agencies.
Development Authority Fund – To provide services exclusively to the City as a financing instrument for developing
and promoting for the public good and general welfare, trade, commerce, industry, and employment opportunities, and to promote the general welfare within the City.
CAPITAL PROJECT FUND
Capital Improvement Fund – To account for the capital expenditures made by the City on long-term projects.
PERMANENT FUND Cemetery Fund – To account for monies received by the City which can only be used for a specific purpose. The
principal of perpetual care cemetery funds are not available for expenditures based on legal or contractual requirements and must remain in trust and not be encroached upon (reported as nonspendable). Only the income from such funds may be used for maintenance and upkeep of the Fairburn municipal cemetery.

60
Capital Project Fund Total
NonmajorDevelopment Governmental
ASSETS Authority Fund Funds
Cash and cash equivalents $ 58,326 $ 588,092 $ - $ 6,000 $ 677 $ 653,095 Investments - - 970 - 85,000 85,970 Intergovernmental receivable - 380,546 - - - 380,546
Total assets $ 58,326 $ 968,638 $ 970 $ 6,000 $ 85,677 $ 1,119,611
LIABILITIES AND FUND BALANCES
LIABILITIESDue to others $ 3,715 $ - $ - $ - $ - $ 3,715 Accounts payable 29,913 90,188 - - - 120,101 Retainage payable - - - 6,000 - 6,000
Total liabilities 33,628 90,188 - 6,000 - 129,816
FUND BALANCES Nonspendable for:
Corpus of perpetual care cemetery funds - - - - 10,000 10,000 Restricted for:
Federal and state programs - 878,450 - - - 878,450 Law enforcement activities 24,698 - - - - 24,698 Cemetery operating capital - - - - 75,677 75,677
Assigned for: Planning and development - - 970 - - 970
Total fund balances 24,698 878,450 970 - 85,677 989,795
Total liabilities and fund balances $ 58,326 $ 968,638 $ 970 $ 6,000 $ 85,677 $ 1,119,611
ConfiscatedAssetsFund Fund
Special Revenue Funds
Cemetery
CITY OF FAIRBURN, GEORGIA
COMBINING BALANCE SHEETNONMAJOR GOVERNMENTAL FUNDS
SEPTEMBER 30, 2018
GrantsFund
CapitalImprovement
Fund
Permanent Fund

61
TotalNonmajor
Development Governmental Authority Fund Funds
REVENUESIntergovernmental $ - $ 707,945 $ - $ - $ - $ 707,945 Interest 129 - - - 170 299
Total revenues 129 707,945 - - 170 708,244
EXPENDITURESCurrent
Public safety 59,539 9,895 - - - 69,434 Public works - 466,508 - - - 466,508
Total expenditures 59,539 476,403 - - - 535,942
Excess (deficiency) of revenues over (under) expenditures (59,410) 231,542 - - 170 172,302
Other financing sources: Transfers in - 196,174 - - - 196,174 Total other financing sources - 196,174 - - - 196,174
Net change in fund balances (59,410) 427,716 - - 170 368,476
FUND BALANCES, beginning of fiscal year 84,108 450,734 970 - 85,507 621,319
FUND BALANCES, end of fiscal year $ 24,698 $ 878,450 $ 970 $ - $ 85,677 $ 989,795
Capital
CITY OF FAIRBURN, GEORGIA
COMBINING STATEMENT OF REVENUES, EXPENDITURES, ANDCHANGES IN FUND BALANCES
NONMAJOR GOVERNMENTAL FUNDS
Special Revenue Funds
FOR THE FISCAL YEAR ENDED SEPTEMBER 30, 2018
Permanent FundProject FundCapital
Fund FundCemetery
Confiscated
FundGrantsAssets Improvement
Fund

62
CITY OF FAIRBURN, GEORGIACONFISCATED ASSETS FUND
AND CHANGES IN FUND BALANCES - BUDGET AND ACTUAL
Variance WithOriginal Final Actual Final Budget
REVENUESFines and forfeitures $ 5,000 $ 5,000 $ - $ (5,000) Interest 300 300 129 (171)
Total revenues 5,300 5,300 129 (5,171)
EXPENDITURESPublic safety 650 650 59,539 (58,889)
Net change in fund balances 4,650 4,650 (59,410) (64,060)
FUND BALANCES, beginning of fiscal year 84,108 84,108 84,108 -
FUND BALANCES, end of fiscal year $ 88,758 $ 88,758 $ 24,698 $ (64,060)
SCHEDULE OF REVENUES, EXPENDITURES,
FOR THE FISCAL YEAR ENDED SEPTEMBER 30, 2018
Budget

63
Variance WithOriginal Final Actual Final Budget
REVENUESIntergovernmental $ 1,150,034 $ 1,150,034 $ 707,945 $ (442,089)
Total revenues 1,150,034 1,150,034 707,945 (442,089)
EXPENDITURESPublic safety - - 9,895 (9,895) Public works 1,979,490 1,979,490 466,508 1,512,982
Total expenditures 1,979,490 1,979,490 476,403 1,503,087
Excess (deficiency) of revenues over (under) expenditures (829,456) (829,456) 231,542 1,060,998
Other financing sources: Transfers in 389,410 389,410 196,174 (193,236) Total other financing sources 389,410 389,410 196,174 (193,236)
Net change in fund balances (440,046) (440,046) 427,716 867,762
FUND BALANCES, beginning of fiscal year 450,734 450,734 450,734 -
FUND BALANCES, end of fiscal year $ 10,688 $ 10,688 $ 878,450 $ 867,762
SCHEDULE OF REVENUES, EXPENDITURES,
Budget
AND CHANGES IN FUND BALANCES - BUDGET AND ACTUAL
GRANTS FUND
FOR THE FISCAL YEAR ENDED SEPTEMBER 30, 2018
CITY OF FAIRBURN, GEORGIA

64
Variance WithOriginal Final Actual Final Budget
REVENUESIntergovernmental $ 172,336 $ 172,336 $ 2,378,481 $ 2,206,145 Interest - - 2,052 2,052
Total revenues 172,336 172,336 2,380,533 2,208,197
EXPENDITURESCapital outlay 172,336 172,336 2,939,543 (2,767,207)
Total expenditures 172,336 172,336 2,939,543 (2,767,207)
Net change in fund balances - - (559,010) (559,010)
FUND BALANCES, beginning of fiscal year 1,128,381 1,128,381 1,128,381 -
FUND BALANCES, end of fiscal year $ 1,128,381 $ 1,128,381 $ 569,371 $ (559,010)
CITY OF FAIRBURN, GEORGIATSPLOST FUND
SCHEDULE OF REVENUES, EXPENDITURES,AND CHANGES IN FUND BALANCES - BUDGET AND ACTUAL
FOR THE FISCAL YEAR ENDED SEPTEMBER 30, 2018
Budget
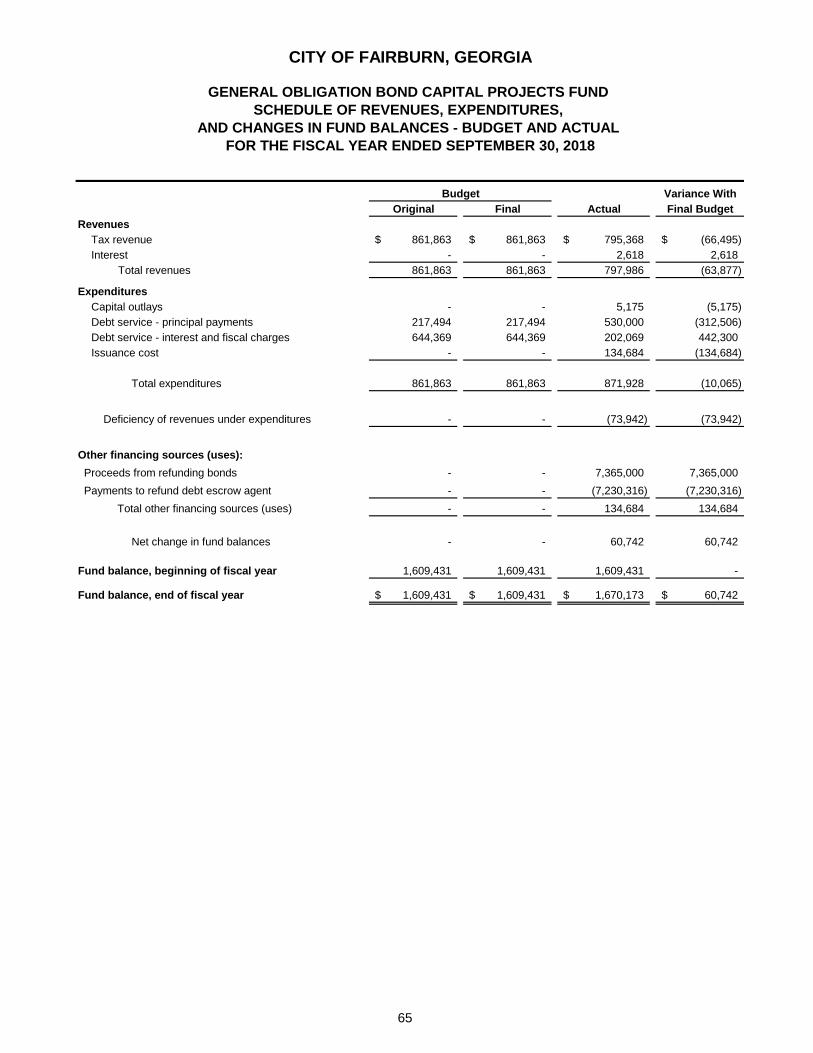
65
CITY OF FAIRBURN, GEORGIA
AND CHANGES IN FUND BALANCES - BUDGET AND ACTUAL FOR THE FISCAL YEAR ENDED SEPTEMBER 30, 2018
Final Actual Final BudgetRevenues
Tax revenue $ 861,863 $ 861,863 $ 795,368 $ (66,495) Interest - - 2,618 2,618
Total revenues 861,863 861,863 797,986 (63,877)
ExpendituresCapital outlays - - 5,175 (5,175) Debt service - principal payments 217,494 217,494 530,000 (312,506) Debt service - interest and fiscal charges 644,369 644,369 202,069 442,300 Issuance cost - - 134,684 (134,684)
Total expenditures 861,863 861,863 871,928 (10,065)
Deficiency of revenues under expenditures - - (73,942) (73,942)
Other financing sources (uses): Proceeds from refunding bonds - - 7,365,000 7,365,000 Payments to refund debt escrow agent - - (7,230,316) (7,230,316) Total other financing sources (uses) - - 134,684 134,684
Net change in fund balances - - 60,742 60,742
Fund balance, beginning of fiscal year 1,609,431 1,609,431 1,609,431 -
Fund balance, end of fiscal year $ 1,609,431 $ 1,609,431 $ 1,670,173 $ 60,742
GENERAL OBLIGATION BOND CAPITAL PROJECTS FUND SCHEDULE OF REVENUES, EXPENDITURES,
Budget Variance WithOriginal

66
CITY OF FAIRBURN, GEORGIASCHEDULE OF PROJECTS CONSTRUCTED WITH
SPECIAL PURPOSE LOCAL OPTION SALES TAX PROCEEDSSERIES 2016
FOR THE FISCAL YEAR ENDING SEPTEMBER 30, 2018
Expenditures
Project Description Priority Project# Original
Estimated Cost Prior Fiscal
YearsCurrent Fiscal
Year Total
Estimated Percentage
of Completion
Road Resurfacing Phase I Tier 1 1 7,737,167$ -$ 2,495,201$ 2,495,201$ 32.25%Pedestrian / Bicycle Improvements Phase I Tier 1 2 136,891 - - - 0.00%Road Projects (Howell Avenue Extension, Rivertown Connector, Park Road Extension, Oakley Industrial Boulevard Full Depth Reclamation Tier 1 3 3,295,836 - 413,532 413,532 12.55%Quick Response Projects Tier 1 4 233,775 - 29,008 29,008 12.41%Project Management / Construction Management Tier 1 5 285,092 - 1,802 1,802 0.63%Road Resurfacing Phase II Tier 2 6 552,987 - - - 0.00%Quiet Zone Railroad Crossings Tier 2 7 750,000 - - - 0.00%Pedestrian / Bicycle Improvements Phase II Tier 2 8 353,171 - - - 0.00%Oakley Industrial Boulevard Extension Design Tier 2 9 315,000 - - - 0.00%Quick Response Projects Tier 2 10 41,254 - - - 0.00%Project Management / Construction Management Tier 2 11 50,310 - - - 0.00%Congestion Relief Tier 3 12 450,000 - - - 0.00%Operation and Safety Improvements Tier 3 13 541,902 - - - 0.00%Pedestrian / Bicycle Improvements Phase III Tier 3 14 184,316 - - - 0.00%Road Projects (Dodd Street Roundabout) Tier 3 15 802,717 - - - 0.00%Quick Response Projects Tier 3 16 41,417 - - - 0.00%Project Management / Construction Management Tier 3 17 50,509 - - - 0.00%
Totals 15,822,344$ -$ 2,939,543$ 2,939,543$ 57.84%

STATISTICAL SECTION
This part of the City of Fairburn’s comprehensive annual financial report (CAFR) presents detailed information as a context for understanding what the information in the financial statements, note disclosures, and required supplementary information says about the City’s overall financial health.
Page
Financial Trends ..................................................................................................................................................... 67
These schedules contain trend information to help the reader understand how the City’s financial performance and well-being have changed over time.
Revenue Capacity .................................................................................................................................................. 72
These schedules contain information to help the reader assess the City’s most
significant local revenue source, property tax.
Debt Capacity ......................................................................................................................................................... 77
These schedules present information to help the reader assess the affordability of the City’s current levels of outstanding debt and the City’s ability to issue additional debt in the future. Demographic and Economic Information ............................................................................................................ 82
These schedules offer demographic and economic indicators to help the reader understand the environment within which the City’s financial activities take place. Operating Information ........................................................................................................................................... 84
These schedules contain service and infrastructure data to help the reader understand how the information in the City’s financial report relates to the services the City provides and the activities it performs.
Sources: Unless otherwise noted, the information in these schedules is derived from the comprehensive annual financial report for the relevant fiscal year.

67
2018 2017 2016 2015 2014 2013 2012 2011 2010 2009
Governmental activitiesNet investment in capital assets $ 25,016,287 $ 22,594,407 $ 22,115,350 $ 17,754,866 $ 14,409,108 $ 14,079,774 $ 13,762,645 $ 13,449,772 $ 14,043,159 $ 20,438,499 Restricted 2,367,845 2,495,233 1,718,140 4,597,718 3,730,051 1,719,514 1,346,852 639,394 613,627 80,003 Unrestricted (deficit) 6,475,679 4,102,801 3,403,719 2,085,985 1,321,770 985,380 632,874 415,456 (169,035) (209,590)
Total governmental activities net position $ 33,859,811 $ 29,192,441 $ 27,237,209 $ 24,438,569 $ 19,460,929 $ 16,784,668 $ 15,742,371 $ 14,504,622 $ 14,487,751 $ 20,308,912
Business-type activitiesNet investment in capital assets $ 17,683,581 $ 17,963,925 $ 18,084,503 $ 17,474,092 $ 14,547,120 $ 16,801,838 $ 17,194,519 $ 17,330,455 $ 18,041,508 $ 9,311,194 Restricted 1,119,371 69,371 514,098 1,763,687 3,178,531 471,521 607,292 1,344,040 65,200 480,215 Unrestricted 14,896,831 13,102,664 10,642,505 6,866,052 6,864,370 7,001,733 5,984,465 5,334,811 5,096,658 7,472,476
Total business-type activities net position $ 33,699,783 $ 31,135,960 $ 29,241,106 $ 26,103,831 $ 24,590,021 $ 24,275,092 $ 23,786,276 $ 24,009,306 $ 23,203,366 $ 17,263,885
Primary governmentNet investment in capital assets $ 42,699,868 $ 40,558,332 $ 40,199,853 $ 35,228,958 $ 28,956,228 $ 30,881,612 $ 30,957,164 $ 30,780,227 $ 32,084,667 $ 29,749,693 Restricted 3,487,216 2,564,604 2,232,238 6,361,405 6,908,582 2,191,035 1,954,144 1,983,434 678,827 560,218 Unrestricted 21,372,510 17,205,465 14,046,224 8,952,037 8,186,140 7,987,113 6,617,339 5,750,267 4,927,623 7,262,886
Total primary government net position $ 67,559,594 $ 60,328,401 $ 56,478,315 $ 50,542,400 $ 44,050,950 $ 41,059,760 $ 39,528,647 $ 38,513,928 $ 37,691,117 $ 37,572,797
Source: Comprehensive Annual Financial Report for the respective fiscal year from the City's finance department.
(accrual basis of accounting)
CITY OF FAIRBURN, GEORGIA
NET POSITION BY COMPONENTLAST TEN FISCAL YEARS

68
2018 2017 2016 2015 2014 2013 2012 2011 2010 2009ExpensesGovernmental activities:
General government $ 3,354,065 $ 3,419,943 $ 2,930,921 $ 2,394,281 $ 2,296,568 $ 2,104,230 $ 1,823,964 $ 1,763,115 $ 2,022,054 $ 1,917,381 Judicial 432,718 374,430 343,417 406,912 415,245 479,159 333,136 235,544 262,792 279,684 Public safety 6,637,237 6,304,295 6,600,498 6,322,171 6,110,784 6,057,633 5,851,586 6,127,643 6,758,087 6,622,873 Public works 2,007,720 3,042,932 2,981,768 2,540,254 2,243,308 1,757,055 1,857,152 1,726,760 1,747,445 2,175,196 Planning and development 609,865 556,660 565,895 455,175 464,196 366,955 367,715 327,158 433,145 584,404 Culture and recreation 874,273 848,402 488,046 512,178 371,838 298,124 252,863 228,225 270,198 80,226 Other - - - - - - - - - 59,925 Interest on long-term debt 478,766 442,138 470,423 458,373 493,266 499,027 508,703 299,264 25,411 37,401
Total governmental activities expenses 14,394,644 14,988,800 14,380,968 13,089,344 12,395,205 11,562,183 10,995,119 10,707,709 11,519,132 11,757,090
Business-type activities:Electric 7,683,352 7,731,021 7,320,222 7,141,969 6,888,429 6,420,188 6,383,795 5,381,210 6,080,267 5,988,466 Water and Sewer 5,954,189 5,725,971 5,720,744 5,321,360 5,641,267 5,022,941 4,797,117 4,576,383 4,371,584 3,879,022 Educational Complex 1,179,563 1,089,108 1,093,164 1,146,332 1,014,781 999,890 1,237,275 593,658 685,977 666,067 Stormwater 712,463 724,917 723,063 724,079 673,145 597,486 613,722 571,291 549,079 (1) - Sanitation 733,866 648,129 617,473 635,480 675,849 580,521 561,649 559,011 580,516 618,527
Total business-type activities expenses 16,263,433 15,919,146 15,474,666 14,969,220 14,893,471 13,621,026 13,593,558 11,681,553 12,267,423 11,152,082 Total primary government expenses $ 30,658,077 $ 30,907,946 $ 29,855,634 $ 28,058,564 $ 27,288,676 $ 25,183,209 $ 24,588,677 $ 22,389,262 $ 23,786,555 $ 22,909,172 Program RevenuesGovernmental activities:
Charges for services $ 2,936,355 $ 2,967,781 $ 3,066,529 $ 2,714,155 $ 2,132,445 $ 1,854,075 $ 1,539,479 $ 1,129,351 $ 1,481,525 $ 1,604,707 Operating grants and contributions - - - 19,076 69,451 42,793 15,270 - 19,265 424,049 Capital grants and contributions 3,208,554 (3) 1,793,672 1,621,498 3,221,515 1,401,684 558,236 1,318,074 280,000 - -
Total governmental activities program revenues 6,144,909 4,761,453 4,688,027 5,954,746 3,603,580 2,455,104 2,872,823 1,409,351 1,500,790 2,028,756 Business-type activities:
Charges for services 18,412,160 17,451,224 17,794,173 16,865,395 16,631,066 15,485,677 15,298,333 14,241,961 13,751,183 12,559,295 Capital grants and contributions 1,162,300 1,085,970 1,553,000 548,090 300,000 - - - 121,040 -
Total business-type activities program revenues 19,574,460 18,537,194 19,347,173 17,413,485 16,931,066 15,485,677 15,298,333 14,241,961 13,872,223 12,559,295 Total primary government program revenues $ 25,719,369 $ 23,298,647 $ 24,035,200 $ 23,368,231 $ 20,534,646 $ 17,940,781 $ 18,171,156 $ 15,651,312 $ 15,373,013 $ 14,588,051
CITY OF FAIRBURN, GEORGIA
CHANGES IN NET POSITIONLAST TEN FISCAL YEARS
(accrual basis of accounting)

69
2018 2017 2016 2015 2014 2013 2012 2011 2010 2009Net (expense)/revenueGovernmental activities $ (8,249,735) $ (10,227,347) $ (9,692,941) $ (7,134,598) $ (8,791,625) $ (9,107,079) $ (8,122,296) $ (9,298,358) $ (10,018,342) $ (9,728,334) Business-type activities 3,311,027 2,618,048 3,872,507 2,235,670 2,037,595 1,864,651 1,704,775 2,560,408 1,604,800 1,407,213 Total primary government net (expense) revenue $ (4,938,708) $ (7,609,299) $ (5,820,434) $ (4,898,928) $ (6,754,030) $ (7,242,428) $ (6,417,521) $ (6,737,950) $ (8,413,542) $ (8,321,121)
General Revenues and Other Changesin Net Position
Governmental activities:Property taxes $ 5,179,553 $ 4,564,177 $ 4,746,634 $ 4,647,950 $ 4,755,788 $ 4,798,827 $ 4,567,666 $ 4,060,431 $ 2,853,789 $ 2,831,173 Sales and use taxes 4,063,620 3,862,730 3,819,892 3,762,572 3,415,848 (2) 1,416,172 1,414,814 1,315,932 1,324,124 1,287,811 Other taxes 2,825,596 2,787,403 2,686,024 2,764,043 2,633,485 2,367,550 2,260,687 1,791,316 1,741,655 1,951,473 Miscellaneous revenue 59,186 167,441 402,696 83,601 53,704 113,268 87,798 287,908 139,915 65,260 Unrestricted investment earnings 27,150 23,298 51,911 51,157 55,044 62,924 69,897 94,642 34,694 49,027 Gain on disposal of capital assets - 15,530 22,424 52,915 416,474 - - - - - Transfers 762,000 762,000 762,000 750,000 1,543,985 1,390,635 1,191,000 1,765,000 3,689,629 4,598,580
Total governmental activities 12,917,105 12,182,579 12,491,581 12,112,238 12,874,328 10,149,376 9,591,862 9,315,229 9,783,806 10,783,324 Business-type activities:
Unrestricted investment earnings 14,796 25,536 26,768 28,140 6,044 11,100 34,490 9,838 27,686 87,501 Gain on Sale of Assets - 13,270 - - - 3,700 - 694 264,841 - Transfers (762,000) (762,000) (762,000) (750,000) (1,543,985) (1,390,635) (1,191,000) (1,765,000) (3,689,629) (4,598,580)
Total business-type activities (747,204) (723,194) (735,232) (721,860) (1,537,941) (1,375,835) (1,156,510) (1,754,468) (3,397,102) (4,511,079) Total primary government $ 12,169,901 $ 11,459,385 $ 11,756,349 $ 11,390,378 $ 11,336,387 $ 8,773,541 $ 8,435,352 $ 7,560,761 $ 6,386,704 $ 6,272,245
Change in Net PositionGovernmental activities $ 4,667,370 $ 1,955,232 $ 2,798,640 $ 4,977,640 $ 4,082,703 $ 1,042,297 $ 1,469,566 $ 16,871 $ (234,536) $ 1,054,990 Business-type activities 2,563,823 1,894,854 3,137,275 1,513,810 499,654 488,816 548,265 805,940 (1,792,302) (3,103,866) Total primary government $ 7,231,193 $ 3,850,086 $ 5,935,915 $ 6,491,450 $ 4,582,357 $ 1,531,113 $ 2,017,831 $ 822,811 $ (2,026,838) $ (2,048,876)
Source: Comprehensive Annual Financial Report for the respective fiscal year from the City's finance department.Notes: (1) During 2010, the City has created the Stormwater Enterprise Fund which was previously recorded in the Water & Sewer Fund.(2) Sales taxes increased as a result of increased allocations from Fulton County based on population increases.(3) Capital grants and contributions increased due to the TSPLOST beginning in April 2017
(accrual basis of accounting)
CHANGES IN NET POSITIONLAST TEN FISCAL YEARS
CITY OF FAIRBURN, GEORGIA

70
2018 2017 2016 2015 2014 2013 2012 2011 2010 2009
General FundReserved $ - $ - $ - $ - $ - $ - $ - $ - $ 19,610 $ 86,290 Unreserved - - - - - - - - 72,001 (406,291) Nonspendable 122,541 99,203 186,813 246,026 149,285 164,419 134,922 134,338 - - Committed 385,533 382,976 280,994 - - - - - - - Restricted 141,126 141,566 146,315 149,740 - - - - - - Unassigned 6,970,469 5,179,060 4,035,786 3,029,593 3,646,266 1,184,518 879,151 412,283 - - Total General Fund $ 7,619,669 $ 5,802,805 $ 4,649,908 $ 3,425,359 $ 3,795,551 $ 1,348,937 $ 1,014,073 $ 546,621 $ 91,611 $ (320,001)
All other governmental fundsReserved, Cemetery Fund $ - $ - $ - $ - $ - $ - $ - $ - $ 75,762 $ 8,003 Unreserved, reported in:
Special revenue funds - - - - - - - - 538,818 39,161 Nonspendable 10,000 10,000 10,000 10,000 10,000 10,000 10,000 10,000 - - Restricted 3,218,369 3,348,161 1,994,448 5,531,677 4,616,280 6,464,093 8,113,648 10,390,989 - - Assigned 970 970 409,860 1,112 967 967 965 962 - - Unassigned (deficit) - - (18,564) - - (3,214) - - - -
Total all other governmental funds $ 3,229,339 $ 3,359,131 $ 2,395,744 $ 5,542,789 $ 4,627,247 $ 6,471,846 $ 8,124,613 $ 10,401,951 $ 614,580 $ 47,164
Note: For 2011, the City implemented GASB Statement No. 54, Fund Balance Reporting and Governmental Fund Type Definitions. This new standard changed the overall definitions and classifications of governmental fund balances. For 2014, the balances have been restated as a result of the change in reporting entity to move the activity of the Hotel/Motel Tax Fund into the General Fund.
Source: Comprehensive Annual Financial Report for the respective fiscal year from the City's finance department.
CITY OF FAIRBURN, GEORGIA
FUND BALANCES OF GOVERNMENTAL FUNDSLAST TEN FISCAL YEARS
(modified accrual basis of accounting)

71
2018 2017 2016 2015 2014 2013 2012 2011 2010 2009Revenues
Taxes $ 12,051,338 $ 11,364,385 $ 11,245,655 $ 11,188,620 $ 10,878,900 (1) $ 8,514,927 $ 8,276,648 $ 7,241,198 $ 6,023,874 $ 6,098,692 Licenses and permits 1,261,777 1,638,444 1,737,024 1,405,815 816,122 726,342 624,518 542,189 480,241 542,957 Intergovernmental 3,206,502 (2) 1,793,672 1,406,484 3,221,516 1,400,884 198,686 1,166,174 - 19,265 424,049 Fines and forfeitures 701,117 515,187 501,886 686,571 741,656 752,705 506,094 223,780 398,212 350,884 Charges for services 837,886 677,868 721,191 573,258 549,581 371,152 395,307 360,802 600,492 710,866 Interest income 29,202 23,298 51,911 51,157 55,044 62,924 69,897 94,642 34,694 49,027 Miscellaneous 194,761 303,723 584,279 151,187 149,041 519,487 116,628 287,854 142,495 -
Total revenues 18,282,583 16,316,577 16,248,430 17,278,124 14,591,228 11,146,223 11,155,266 8,750,465 7,699,273 8,176,475
ExpendituresGeneral government 3,406,195 3,416,997 2,878,496 2,410,195 2,261,908 2,050,041 1,790,985 1,724,112 1,993,378 3,166,567 Judicial 437,400 376,353 342,331 411,394 415,172 472,604 332,565 235,544 262,792 279,684 Public safety 6,538,231 6,207,250 6,181,773 6,143,312 6,022,743 5,834,889 5,757,817 5,993,068 6,578,133 7,066,933 Public works 1,989,357 2,814,324 2,782,641 2,363,652 1,915,233 1,503,387 2,645,111 1,358,955 1,269,111 1,505,312 Planning and development 552,164 523,412 527,173 486,107 461,352 365,540 368,225 327,158 433,145 584,404 Culture and recreation 619,309 531,522 586,329 351,519 299,003 225,307 192,905 165,690 209,493 79,287 Other - - - - - - - - - 59,925 Capital outlay 2,944,718 19,472 4,490,740 4,605,059 3,903,395 2,513,359 2,794,532 219,133 - - Debt service
Principal 821,473 653,535 715,814 619,425 622,796 651,801 130,540 160,690 223,196 296,729 Interest 214,044 451,808 472,155 473,437 490,547 505,602 511,360 134,223 25,411 37,401 Bond issuance costs 134,684 - - - - - - 409,485 - -
Total expenditures 17,657,575 14,994,673 18,977,452 17,864,100 16,392,149 14,122,530 14,524,040 10,728,058 10,994,659 13,076,242
Excess (deficiency) of revenues over (under) expenditures 625,008 1,321,904 (2,729,022) (585,976) (1,800,921) (2,976,307) (3,368,774) (1,977,593) (3,295,386) (4,899,767)
Other financing sources (uses)Bonds issued 7,365,000 - - - - - - 10,415,000 - 510,000 Payments to refund debt escrow agent (7,230,316) - - - - - - - - - Original bond premium - - - - - - - 36,234 - - Capital leases 165,380 - - 328,421 371,613 228,424 367,888 - 123,000 - Proceeds from sale of capital assets - 32,380 44,526 52,915 487,338 39,345 - 3,740 - - Transfers in 1,687,817 1,690,339 1,929,410 3,987,018 3,216,141 1,617,260 1,350,000 3,232,866 3,743,142 4,713,867 Transfers out (925,817) (928,339) (1,167,410) (3,237,018) (1,672,156) (226,625) (159,000) (1,467,866) (53,513) (115,287)
Total other financing sources (uses) 1,062,064 794,380 806,526 1,131,336 2,402,936 1,658,404 1,558,888 12,219,974 3,812,629 5,108,580
Net change in fund balances $ 1,687,072 $ 2,116,284 $ (1,922,496) $ 545,360 $ 602,015 $ (1,317,903) $ (1,809,886) $ 10,242,381 $ 517,243 $ 208,813
Debt service as a percentageof noncapital expenditures 7.39% 7.76% 8.68% 8.53% 9.22% 9.97% 5.47% 2.35% 2.35% 3.12%
Source: Comprehensive Annual Financial Report for the respective fiscal year from the City's finance department. Notes: (1) Sales taxes increased as a result of increased allocations from Fulton County based on population increases. (2) Intergovernmental revenues increased as a result of the TSPLOST program starting in April 2017
CITY OF FAIRBURN, GEORGIA
CHANGES IN FUND BALANCES OF GOVERNMENTAL FUNDSLAST TEN FISCAL YEARS
(modified accrual basis of accounting)

72
CITY OF FAIRBURN, GEORGIA
GOVERNMENTAL ACTIVITIES TAX REVENUES BY SOURCELAST TEN FISCAL YEARS
(accrual basis of accounting)
Insurance Beer, WineFiscal Sales Motor Vehicle Franchise Premium and Liquor Hotel MotelYear Tax Tax Tax Tax Tax Tax
2009 2,831,173$ 1,287,811$ 168,930$ 1,053,234$ 305,810$ 259,878$ 115,287$ 113,594$ 6,135,717$ 2010 2,853,789 1,324,124 180,995 903,161 302,941 240,762 86,369 27,427 5,919,568 2011 4,060,431 1,315,932 221,656 888,278 294,137 234,805 118,499 33,941 7,167,679 2012 4,567,666 1,414,814 271,463 997,510 607,409 225,028 123,964 35,313 8,243,167 2013 4,798,827 1,416,172 310,474 954,200 645,170 215,282 190,252 52,172 8,582,549 2014 4,755,788 3,415,848 (1) 458,803 1,015,129 668,012 218,456 178,468 94,617 10,805,121 2015 4,647,950 3,762,572 449,619 1,088,695 702,662 232,352 207,009 83,706 11,174,565 2016 4,766,434 3,819,892 307,241 1,047,515 750,679 244,803 241,576 94,210 11,272,350 2017 4,564,177 3,862,730 326,482 1,021,148 813,131 249,041 220,251 157,350 11,214,310 2018 5,179,553 4,063,620 331,566 951,504 867,515 264,586 285,075 125,350 12,068,769
Source: Comprehensive Annual Financial Report for the respective fiscal year from the City's finance department.Note: (1) Sales taxes increased as a result of increased allocations from Fulton County based on population increases.
Tax Taxes TotalProperty Other

73
CITY OF FAIRBURN, GEORGIA
ASSESSED VALUE AND ESTIMATED ACTUAL VALUE ALL TAXABLE PROPERTY
LAST TEN YEARS (accrual basis of accounting)
Ratio of Total Percent IncreaseReal Property Personal Property Public Utility Total Property Assessed to in Estimated
Tax Digest Assessed Estimated Assessed Estimated Assessed Estimated Assessed Estimated Total Direct Total Estimated Actual ValueYear Value True Value Value True Value Value True Value Value True Value Tax Rate Actual Value Over Prior Year2008 469,416,680$ 1,181,614,400$ 203,254,900$ 508,137,250$ 9,888,331$ 24,720,828$ 682,559,911$ 1,714,472,478$ 5.00 40% 16.92%2009 410,862,770 1,048,830,675 186,820,120 467,050,300 13,732,050 34,330,125 611,414,940 (1) 1,550,211,100 5.00 40% -9.58%2010 386,726,700 966,816,750 189,290,310 473,225,775 13,732,050 34,330,125 589,749,060 (1) 1,474,372,650 7.50 40% -4.89%2011 372,887,190 932,217,975 209,712,150 524,280,375 11,866,310 29,665,775 594,465,650 1,486,164,125 9.93 (2) 40% 0.80%2012 373,027,370 932,568,425 216,286,170 540,715,425 11,866,310 29,665,775 601,179,850 1,502,949,625 9.98 (3) 40% 1.13%2013 346,405,540 866,013,850 248,934,510 622,336,275 13,301,506 33,253,765 608,641,556 1,521,603,890 9.70 (4) 40% 1.01%2014 342,544,370 856,360,925 326,561,200 816,403,000 14,072,114 35,180,285 683,177,684 1,707,944,210 9.82 40% 12.25%2015 367,717,060 919,292,650 339,414,250 848,535,625 14,501,454 36,253,635 721,632,764 1,804,081,910 9.73 40% 5.63%2016 399,791,020 999,477,550 324,570,010 811,425,025 14,734,532 36,836,330 739,095,562 1,847,738,905 9.56 40% 2.42%2017 458,002,930 1,145,007,325 425,312,310 1,063,280,775 14,679,795 36,699,488 897,995,035 2,244,987,588 9.56 40% 21.50%
Source: City of Fairburn Finance DepartmentNotes: (1) Assessed values have dropped from 2009 to 2010 due to the decline in the value of residential real properties. (2) Includes Property taxes for general operations at 8.1 mills and additional property tax to cover the debt payments related to the 2011 general obligation bonds at 1.83 mills. (3) Includes Property taxes for general operations at 8.1 mills and additional property tax to cover the debt payments related to the 2011 general obligation bonds at 1.88 mills. (4) Includes Property taxes for general operations at 8.1 mills and additional property tax to cover the debt payments related to the 2011 general obligation bonds at 1.60 mills.

74
CITY OF FAIRBURN, GEORGIA
DIRECT AND OVERLAPPING PROPERTY TAX RATES LAST TEN TAX DIGEST YEARS
(Rate per $1,000 of assessed value)
Direct Rates Overlapping Rates TotalCity of Fairburn Direct and
Tax Operating Debt Fulton County OverlappingDigest Year Millage Service Total State of Georgia County School System Millage Rate
2008 5.00 - 5.00 0.25 10.28 17.50 33.032009 5.00 - 5.00 0.25 10.28 17.50 33.032010 7.50 - 7.50 0.25 10.28 18.50 36.532011 8.10 1.83 9.93 0.25 10.55 18.50 39.232012 8.10 1.88 9.98 0.20 10.55 18.50 39.232013 8.10 1.60 9.70 0.15 10.48 18.50 38.832014 8.10 1.72 9.82 0.10 12.05 18.50 40.472015 8.10 1.63 9.73 0.05 10.75 18.50 39.032016 8.10 1.46 9.56 0.05 10.75 18.50 38.862017 8.10 1.46 9.56 0.05 10.75 18.50 38.86
Source: City of Fairburn Finance Department

75
CITY OF FAIRBURN, GEORGIA
PRINCIPAL PROPERTY TAX PAYERS CURRENT AND NINE FISCAL YEARS AGO
2017 2008
Percentage PercentageTaxable of Taxable Taxable of Taxable
Assessed Assessed Assessed AssessedTaxpayer Value Rank Value Value Rank Value
Google $ 115,819,401 1 12.90% $ - - Helicopter Support Inc 63,987,514 2 7.13%Development Authority of Fulton County 51,041,816 3 5.68% 11,716,560 4 1.89%Ralston/Nestle Purina Petcare Company 42,403,045 4 4.72% 14,643,000 2 2.37%Toto USA, Inc. 20,679,366 5 2.30%Electrolux Home Products, Inc. 18,293,238 6 2.04%Navistar, Inc 16,288,146 7 1.81%U.S. Foods, Inc 15,864,465 8 1.77% 7,523,820 7 1.22%Owens Corning 14,443,189 9 1.61% 11,407,876 5 1.84%Smucker Sales and Distribution 14,355,196 10 1.60%Excel Logistics - - 12,851,730 3 2.08%MD Hodges Enterprises - - 27,680,640 1 4.47%BellSouth - - 9,251,724 6 1.49%USF Propco II - - 7,280,030 8 1.18%Porex - - 7,181,710 9 1.16%AJT Acquisitions - - 7,048,000 10 1.14%Southcreek VI Atlanta LLC - - Eagles Landing - - All Others 524,819,659 58.44% 502,520,086 81.17%
Totals $ 897,995,035 100.00% $ 619,105,176 100.00%
Source: City of Fairburn Finance DepartmentNote: The 2017 tax digest was billed during fiscal year September 30, 2018. The 2017 column related taxes are based on the 2017 tax digest that were billed during fiscal year ended September 30, 2018. The 2008 column related taxes are based on the 2008 tax digest that were billed during fiscal year ended September 30, 2009.

76
CITY OF FAIRBURN, GEORGIA
PROPERTY TAX LEVIES AND COLLECTIONSLAST TEN FISCAL YEARS
Ratio ofCollections Percentage Collection Accumulated
Total of Current of Levy of Prior Accumulated Uncollected Local OptionTax Digest Tax Years Taxes Collected Years Taxes Total Uncollected Taxes to Current Millage Sales Tax
Year Levy During Year During Year During Year Collections Taxes by Digest Year Year's Levy Rates Collected2008 2,266,532$ 2,202,345$ 96.06% 59,007$ 2,261,352$ 5,180$ 0.23% 5.00 1,449,755$ 2009 2,966,005 2,814,985 97.17% 145,479 2,960,464 5,541 0.19% 5.00 1,287,811 2010 4,074,329 3,933,168 94.91% 134,360 4,067,528 6,801 0.17% 7.50 1,315,932 2011 4,491,344 4,406,360 96.54% 77,318 4,483,678 7,666 0.17% 9.93 1,414,814 2012 4,616,738 4,492,199 96.54% 111,721 4,603,921 12,817 0.28% 9.98 1,416,172 2013 4,762,586 4,187,985 87.94% 562,362 4,750,347 12,239 0.26% 9.70 3,415,848 (1)2014 4,569,262 4,520,945 98.94% 34,032 4,554,978 14,284 0.31% 9.82 3,762,572 2015 4,579,384 4,554,466 99.46% 12,169 4,566,635 12,749 0.28% 9.73 3,819,892 2016 4,668,151 4,650,813 99.63% 592 4,651,405 16,746 0.36% 9.56 3,862,729 2017 5,133,569 5,056,723 98.50% 0 5,056,723 76,846 1.50% 9.56 3,819,892
Source: City of Fairburn Finance DepartmentNotes: (1) Sales taxes increased as a result of increased allocations from Fulton County based on population increases.

77
RATIO OF OUTSTANDING DEBT BY TYPELAST TEN FISCAL YEARS
Governmental Activities Business-type Activities
Net BondedDebt to
Fund Balance Net Amount Actual Value Net Position Net Total PercentFiscal General Obligation Restricted to of General Capital of Taxable Water & Educational Restricted to Notes Capital Primary of PersonalYear Bonds Debt Service Bonded debt Leases Property Per Capita Sewer Complex Debt Service Payable Leases Government Income Per Capita2009 -$ -$ -$ 566,916$ - 50 12,135,000$ 9,236,166$ -$ 60,442$ 173,899$ 22,172,423$ 9.34% 1,9562010 - - - 466,270 - 41 11,500,000 8,702,250 - 39,538 71,199 20,779,257 8.09% 1,8332011 10,450,629 - 10,450,629 306,030 0.71% 905 10,755,000 14,974,732 1,344,040 17,361 6,212 35,165,924 12.85% 3,0472012 10,447,972 583,860 9,864,112 543,378 0.66% 782 10,035,000 14,990,032 607,292 - - 34,825,230 11.73% 2,6062013 10,050,347 533,489 9,516,858 515,001 0.63% 733 9,310,000 15,009,635 471,521 - - 33,879,973 11.58% 2,4692014 9,647,786 590,223 9,057,563 663,818 0.60% 705 14,117,463 14,674,263 675,752 - - 37,837,355 13.71% 2,7632015 9,240,289 738,226 8,502,063 777,814 0.50% 675 14,101,806 14,318,621 800,832 - - 36,899,472 13.37% 2,6942016 8,827,858 718,136 8,109,722 472,000 0.45% 632 13,106,714 13,937,775 514,098 - - 35,112,113 12.56% 2,5142017 8,405,496 215,777 8,189,719 238,465 0.44% 593 12,091,993 13,526,653 69,371 - 109,705 34,087,164 11.73% 2,4042018 9,124,188 12,361 9,111,827 112,372 0.41% 593 11,058,695 14,678,770 1,119,371 - 83,774 33,926,067 10.64% 2,136
Source: City of Fairburn Finance Department
CITY OF FAIRBURN, GEORGIA

78
Net General Percentage AmountObligation Bonded Applicable to Applicable to
Governmental Unit Debt Outstanding City of Fairburn (1) City of Fairburn
Fulton County Board of Commissioners, GeorgiaCertificates of Participation $ 37,715,000 1.464% $ 552,065 Library General Obligation Bonds 250,294,000 1.464% 3,663,753 Economic Recovery Zone Bonds 64,274,000 1.464% 940,830
Fulton County Board of EducationGeneral Obligation Bonds 42,520,000 1.464% 622,399
394,803,000 5,779,046
City of Fairburn, Georgia2011 General Obligation Bonds 9,124,188 100.00% 9,124,188 Capital Leases 112,372 100.00% 112,372 Total Direct Debt 9,236,560 9,236,560
Total direct and overlapping debt $ 404,039,560 $ 15,015,606
(1) The percentage of overlapping debt applicable is estimated using taxable assessed property values. Applicable percentages were estimatedby determining the portion of the County's taxable assessed value that is within the City's boundaries and dividing it by the County's total taxableassessed value.
Source: Assessed value data used to estimate applicable percentages provided by the various Tax Assessors and the Georgia Department ofRevenue Property Tax Division.
Note: Overlapping governments are those that coincide, at least in part, with the geographic boundaries of the City. This schedule estimates theportion of the outstanding debt of those overlapping governments that is borne by the residents and businesses of the City of Fairburn, Georgia.This process recognizes that, when considering the government's ability to issue and repay long-term debt, the entire debt burden borne by theresidents and businesses should be taken into account. However, this does not imply that every taxpayer is a resident, and therefore responsiblefor repaying the debt, of each overlapping government.
CITY OF FAIRBURN, GEORGIA
DIRECT AND OVERLAPPING GOVERNMENTAL ACTIVITIES DEBTSEPTEMBER 30, 2018

79
CITY OF FAIRBURN, GEORGIA
LEGAL DEBT MARGINLAST TEN FISCAL YEARS
LegalFiscal Assessed Debt Amount DebtYear Value Percent Limit Applicable (1) Margin2009 682,559,911$ 10% 68,255,991$ -$ 68,255,991$ 2010 611,414,940 10% 61,141,494 - 61,141,494 2011 589,749,060 10% 58,974,906 10,450,629 48,524,277 2012 594,465,650 10% 59,446,565 10,447,972 48,998,593 2013 601,179,850 10% 60,117,985 10,050,347 50,067,638 2014 608,641,556 10% 60,864,156 9,647,786 51,216,370 2015 683,177,684 10% 68,317,768 9,240,289 59,077,479 2016 721,632,764 10% 72,163,276 8,827,858 63,335,418 2017 739,095,562 10% 73,909,556 8,405,496 65,504,060 2018 897,995,035 10% 89,799,504 9,124,188 80,675,316
Source: City of Fairburn Finance DepartmentNote: (1) The City of Fairburn had no general obligation bonds outstanding during fiscal years 2009 - 2010.

80
CITY OF FAIRBURN, GEORGIA
PLEDGED REVENUE BOND COVERAGE - WATER & SEWER FUND & ELECTRIC FUNDCOMBINED UTILITY REVENUE BONDS (Series 2000; Series 2006; Series 2013; Series 2014)
LAST TEN FISCAL YEARS
Net RevenueDirect Available
Fiscal Operating Operating for Debt Debt Service RequirementsYear Revenue Expenses (2) Service Principal Interest (1) Total Coverage2009 11,616,283$ 8,051,886$ 3,564,397$ 550,000$ 508,934$ 1,058,934$ 3.372010 12,170,305 8,163,511 4,006,794 635,000 471,615 1,106,615 3.622011 12,580,304 8,884,652 3,695,652 745,000 441,062 1,186,062 3.122012 13,532,137 8,980,824 4,551,313 720,000 412,084 1,132,084 4.022013 13,621,290 10,600,700 3,020,590 725,000 374,385 1,099,385 2.752014 14,669,539 9,982,534 4,687,005 - 334,901 334,901 14.002015 14,635,792 9,822,190 4,813,602 - 489,612 489,612 9.832016 15,453,582 10,333,956 5,119,626 980,000 473,808 1,453,808 3.522017 15,351,316 10,694,171 4,657,145 1,000,000 454,575 1,454,575 3.202018 16,375,792 10,981,640 5,394,152 1,050,000 416,109 1,466,109 3.68
Source: City of Fairburn Finance DepartmentNotes: Operating revenue and direct operating expenses includes both Water & Sewer and Electric Operations (1) Interest expense does not include interest payments to the South Fulton Municipal Regional Water and Sewer Authority - Joint Governed Organization.
(2) Direct operating expenses includes cost of sales and services and general operating expenses and excludes depreciation and amortization expenses.

81
CITY OF FAIRBURN, GEORGIA
PLEDGED REVENUE BOND COVERAGE - EDUCATIONAL COMPLEX FUND EDUCATIONAL COMPLEX REVENUE BONDS - SERIES 2017, 2011 AND 2008
LAST TEN FISCAL YEARS
Net RevenueDirect Available
Fiscal Operating Operating for Debt Debt Service RequirementsYear Revenue Expenses (1) Service Principal Interest Total Coverage2009 255,948$ 291,419$ (35,471)$ 514,038$ 368,558$ 882,596$ (0.04) 2010 435,173 79,324 355,849 533,916 345,274 879,190 0.40 2011 493,319 55,095 438,224 863,920 329,176 1,193,096 0.37 2012 497,474 278,580 218,894 - (2) 642,098 642,098 0.34 2013 503,377 86,976 416,401 - (2) 639,975 639,975 0.65 2014 516,649 103,815 412,834 355,000 638,200 993,200 0.42 2015 537,314 134,427 402,887 375,000 632,875 1,007,875 0.40 2016 537,010 90,732 446,278 400,000 623,125 1,023,125 0.44 2017 498,543 96,326 402,217 430,000 603,475 1,033,475 0.39 2018 446,154 37,010 409,144 645,000 938,002 1,583,002 0.26
Source: City of Fairburn Finance Department
(1) Direct operating expenses excludes depreciation and amortization expenses. Notes: The Series 2008 Series Revenue Bonds were refunded during fiscal year 2011. The Series 2011 Bonds were refunded in 2017.
(2) The first principal payment on the Series 2011 Revenue Bonds is due in fiscal year 2014.

82
CITY OF FAIRBURN, GEORGIA
DEMOGRAPHIC AND ECONOMIC STATISTICS LAST TEN FISCAL YEARS
MedianEducationLevel in
Per Years ofFiscal Personal Capita Median Formal School UnemploymentYear Population Income (1) Income (1) Age (1) Schooling (1) Enrollment (3) Rate (2)2009 11,335 237,490,920$ 20,952$ 36.1 12 - 10.01 2010 11,335 256,873,770 22,662 32.1 12 4,971 10.30 2011 11,542 273,660,820 23,710 32.7 12 5,042 9.30 2012 13,363 296,939,223 22,221 32.0 12 4,982 9.40 2013 13,720 292,579,000 21,325 32.0 12 4,897 9.50 2014 13,693 275,941,336 20,152 32.0 12 4,908 7.90 2015 13,696 276,001,792 20,152 32.0 12 4,822 7.40 2016 13,967 279,549,505 20,015 32.0 12 5,270 5.50 2017 14,182 290,504,088 20,484 32.0 12 5,390 4.20 2018 15,882 318,735,858 20,069 32.0 12 5,354 3.20
Notes:(1) Source: U.S. Census. (2) Source: Georgia Department of Labor. (3) Includes: Creekside High School; Bear Creek Middle School; Campbell Elementary School; Evelyn C. West Elementary School and Landmark Christian School. Information prior to Fiscal Year 2010 is not readily available.
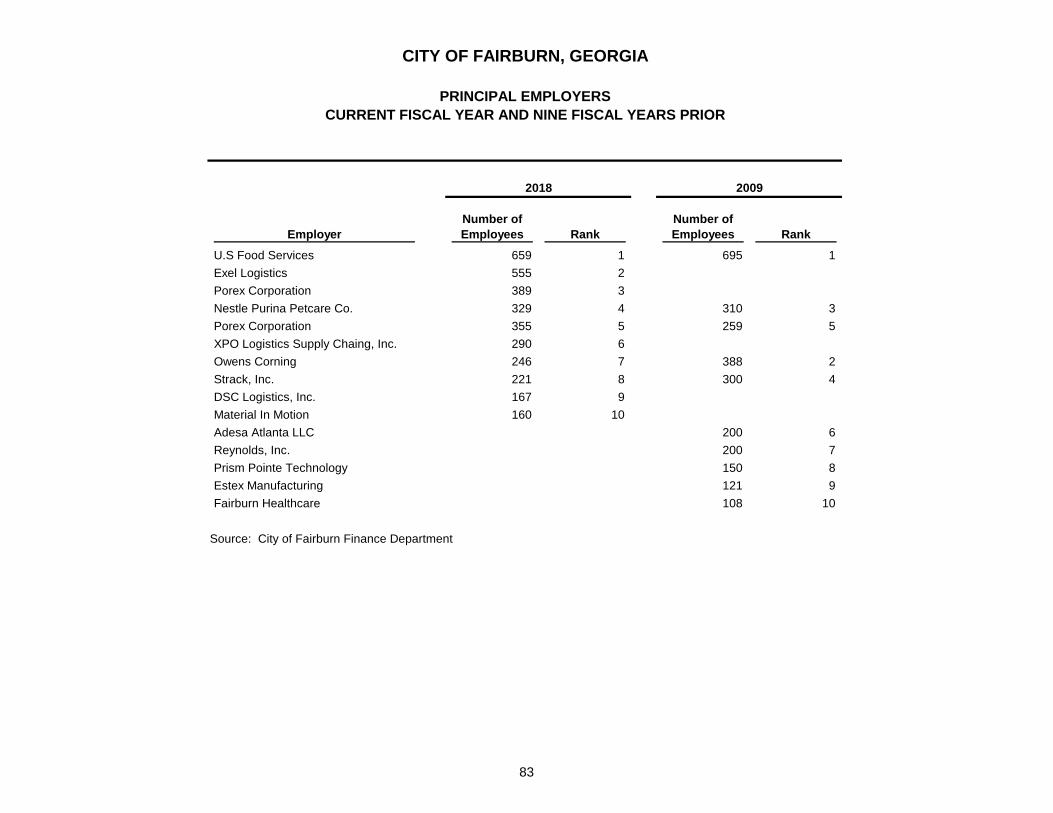
83
CITY OF FAIRBURN, GEORGIA
PRINCIPAL EMPLOYERSCURRENT FISCAL YEAR AND NINE FISCAL YEARS PRIOR
2018 2009
Number of Number ofEmployer Employees Rank Employees Rank
U.S Food Services 659 1 695 1 Exel Logistics 555 2 Porex Corporation 389 3 Nestle Purina Petcare Co. 329 4 310 3 Porex Corporation 355 5 259 5 XPO Logistics Supply Chaing, Inc. 290 6 Owens Corning 246 7 388 2 Strack, Inc. 221 8 300 4 DSC Logistics, Inc. 167 9 Material In Motion 160 10 Adesa Atlanta LLC 200 6 Reynolds, Inc. 200 7 Prism Pointe Technology 150 8 Estex Manufacturing 121 9 Fairburn Healthcare 108 10
Source: City of Fairburn Finance Department

84
CITY OF FAIRBURN, GEORGIA
FULL TIME EQUIVALENT CITY GOVERNMENT EMPLOYEES BY FUNCTION/PROGRAM LAST TEN FISCAL YEARS
Function 2009 2010 2011 2012 2013 2014 2015 2016 2017 2018Administrative 35 26 26 23 27 27 29 30 30 29
Police 31 33 36 45 37 37 43 39 39 39
Fire 47 44 43 44 44 44 45 42 40 40
Streets, Parks, and Recreation 13 15 13 14 13 12 17 18 18 18
E-911 (1) 10 8 2 - - - - - - -
Electric 9 8 9 8 10 9 10 9 9 9
Water and Sewer 5 4 6 6 6 8 8 8 9 9
150 138 135 140 137 137 152 146 145 144
Source: City of Fairburn Finance DepartmentNotes:(1) Note that the City outsourced its E911 operations in fiscal year 2012; therefore, there are no employees beginning in fiscal year 2012.

85
CITY OF FAIRBURN, GEORGIA
OPERATING INDICATORS BY FUNCTION/PROGRAMLAST TEN FISCAL YEARS
Function 2009 2010 2011 2012 2013 2014 2015 2016 2017 2018Police Physical Arrests 614 514 605 1,485 967 1,268 633 549 729 775 Traffic Violations 1,136 1,725 2,081 2,428 5,455 4,640 3,982 3,252 5,638 5,681
Fire Number of Calls Answered 1,786 1,655 1,855 2,020 2,078 2,168 2,414 2,879 2,955 3,031 Inspections 420 258 573 496 673 723 990 886 518 401
Highways and Streets Streets Resurfaced (miles) 0.45 0.44 1.00 - 2.12 4.50 1.94 - 1.81 13.00 Potholes Repaired 48 79 66 88 99 90 100 120 115 25
Sanitation Refuse Collected (tons/day) 5,806 4,310 3,567 6,030 3,599 3,661 3,661 4,015 3,916 3,770 Recyclables Collected (tons/day) 243 145 119 598 622 637 650 730 667 661
Water Water Mains (miles) 91.5 91.6 91.6 91.9 92.2 93.1 70.9 71.1 71.1 71.1 Fire Hydrants 900 900 900 903 903 903 826 824 824 824 Water Main Breaks 6 8 20 15 10 6 6 8 6 6 Average Daily Consumption 791 835 778 811 817 845 807 886 212 1,061 (thousands of gallons)
Wastewater and Sewer Stormwater system (miles) 37.25 37.25 37.98 38.21 38.45 38.45 36.76 36.76 36.76 36.76 Sanitary system (miles) 69.00 69.00 69.00 69.00 69.00 69.00 62.00 61.62 61.62 61.62
Public Safety Fire Stations 2 2 2 2 2 2 2 2 2 2 Police Stations 1 1 1 1 1 1 1 1 1 1 Police Patrol Units 40 40 41 45 33 62 50 47 49 49
Highways and Streets Miles Paved 96.5 96.5 96.5 96.8 96.8 96.8 96.8 96.8 96.8 96.8 Miles Unpaved 2.6 3.0 3.0 3.0 3.0 3.0 3.0 3.0 3.0 3.0 Street Lights 695 695 695 702 709 712 712 712 712 712 Caution Lights 2 1 1 1 1 1 1 2 2 2
Electric Lines (miles) 79 79 79 79 79 79 81 81 81 81 Plant Capacity (KVA) 12,400 12,400 12,400 12,400 12,400 12,400 12,400 12,400 12,470 12,470
Source: City of Fairburn Finance DepartmentNotes:n/a - Information is not readily available.

86
CITY OF FAIRBURN, GEORGIA
CAPITAL ASSETS BY FUNCTION/PROGRAM LAST TEN FISCAL YEARS
Function 2009 2010 2011 2012 2013 2014 2015 2016 2017 2018
Water Water Mains (miles) 91.5 91.6 91.6 91.9 91.9 91.9 70.9* 71.1 71.1 71.1 Fire Hydrants 900 900 900 903 903 903 826** 824 824 824 Water Main Breaks 6 8 20 15 15 6 6 8 6 6
Wastewater and Sewer Stormwater system (miles) 37.25 37.25 37.98 38.21 38.21 38.21 36.76 36.76 36.76 36.76 Sanitary system (miles) 69 69 69 69 69 69 62 61.62 61.62 61.62
Public Safety Fire Stations 2 2 2 2 2 2 2 2 2 2 Police Stations 1 1 1 1 1 1 1 1 1 1 Police Patrol Units 40 40 41 45 33 62 50 47 49 49
Highways and Streets Miles Paved 96.5 96.5 96.5 96.5 96.5 96.8 96.8 96.8 96.8 96.8 Miles Unpaved 2.6 3 3 3 3 3 3 3 3 3 Street Lights 695 695 695 702 712 712 712 712 712 712 Caution Lights 2 1 1 1 1 1 1 2 2 2
Electric Lines (miles) 79 79 79 79 79 79 81 81 81 81 Number of substations 2 2 2 2 2 2 2 2 2 2 Number of service connections 2,966 2,928 2,865 2,902 2,955 3,183 3,153 3,187 3,470 3,470
Culture and recreationParks acreage 2 2 2 142 144 144 144 144 146 146Parks 1 1 1 1 2 2 2 2 3 3Community centers 1 1 1 1 1 1 1 1 1 1
Source: City of Fairburn Finance Departmentn/a - Information not available.* Previous reports included City of Atlanta and private lines** 826 hydrants in G.I.S. inventory