city of fenton, michigan
TRANSCRIPT

Prepared by: Treasurer’s Department
Jon Satkowiak Jr City Treasurer
City of Fenton, Michigan
Comprehensive Annual Financial Report For the Fiscal Year Ended June 30, 2020

Table of Contents
Section Page
1 Introductory Section Letters of Transmittal 1 – 1 GFOA Certificate of Achievement 1 – 9 List of City Officials 1 – 10 Organizational Chart 1 – 11 Financial Section
2 Independent Auditors’ Report 2 – 1
3 Management’s Discussion and Analysis 3 – 1
4 Basic Financial Statements Government-wide Financial Statements Statement of Net Position 4 – 1 Statement of Activities 4 – 3 Fund Financial Statements Governmental Funds Balance Sheet 4 – 4 Reconciliation of the Governmental Funds Balance Sheet to the Statement
of Net Position
4 – 5 Statement of Revenues, Expenditures and Changes in Fund Balances 4 – 6 Reconciliation of the Statement of Revenues, Expenditures and Changes
in Fund Balances of Governmental Funds to the Statement of Activities
4 – 7 Proprietary Funds Statement of Net Position 4 – 8 Statement of Revenues, Expenses and Changes in Net Position 4 – 10 Statement of Cash Flows 4 – 12 Fiduciary Funds Statement of Fiduciary Net Position
Statement of Changes in Fiduciary Net Position 4 – 14 4 – 15

Table of Contents
Section Page
4 Component Unit Financial Statements Combining Statement of Net Position – Component Units 4 – 16 Combining Statement of Activities – Component Units 4 – 17 Notes to the Financial Statements 4 – 18
5 Required Supplementary Information Budgetary Comparison Schedules General Fund
Major Street Fund 5 – 1 5 – 2
Municipal Employees Retirement System Schedule of Changes in Net Pension Liability and Related Ratios Schedule of Employer Contributions City of Fenton Retiree Health Care Plan Schedule of Changes in Total OPEB Liability and Related Ratios Schedule of Employer Contributions Note to Required Supplementary Information
5 – 3 5 – 4
5 – 5 5 – 6
5 – 7
6 Other Supplementary Information Nonmajor Governmental Funds Combining Balance Sheet 6 – 1 Combining Statement of Revenue, Expenditures and Changes in Fund Balances 6 – 4 Schedules of Revenues, Expenditures, and Changes in Fund Balance - Budget and Actual 6 – 7 Internal Service Funds Combining Statement of Net Position 6 – 24 Combining Statement of Revenues, Expenses, and Changes in Net Position 6 – 25 Combining Statement of Cash Flows 6 – 26 Fiduciary Funds Combining Statement of Fiduciary Net Position 6 – 28 Statement of Changes in Fiduciary Net Position 6 – 29

Section
Table of Contents
Page
6 Downtown Development Authority Combining Balance Sheet Reconciliation of the Combining Balance Sheet to the Statement of Net Position
6 – 30 6 – 31
Combining Statement of Revenues, Expenditures, and Changes in Fund Balances 6 – 32 Reconciliation of the Combining Statement of Revenues, Expenditures, and Changes
in Fund Balances of the Governmental Funds to the Statement of Activities
6 – 33 Local Development Finance Authority Combining Balance Sheet 6 – 34 Reconciliation of the Combining Balance Sheet to the Statement of Net Position
Combining Statement of Revenues, Expenditures, and Changes in Fund Balances 6 – 35 6 – 36
Reconciliation of the Combining Statement of Revenues, Expenditures, and Changes in Fund Balances of the Governmental Funds to the Statement of Activities
Brownfield Redevelopment Authority Balance Sheet Statement of Revenues, Expenditures, and Changes in Fund Balances
6 – 37
6 – 38 6 – 39
7 Statistical Section (Unaudited) Multi-Year and Other Financial and Demographic Information Statistical Section 7 – 1 Financial Trend Information Net Position By Component 7 – 2 Changes in Governmental Net Position 7 – 3 Changes in Business -Type Net Position 7 – 4 Fund Balances - Governmental Funds 7 – 5 Changes in Fund Balances - Governmental Funds 7 – 6

Table of Contents
Section
7
Revenue Capacity Information
Taxable Value and Actual Value of Taxable Property Direct and Overlapping Property Tax Rates Principal Property Tax Payers Property Tax Levies and Collections
Debt Capacity Information
Page
7 – 7 7 – 8 7 – 9
7 – 10
Ratios of Outstanding Debt 7 – 11 Ratios of General Bonded Debt Outstanding 7 – 12 Direct and Overlapping Governmental Activities Debt 7 – 13 Legal Debt Margin 7 – 14 Pledged-Revenue Coverage 7 – 15 Demographic and Economic Information Demographic and Economic Statistics 7 – 16 Principal Employment Industries 7 – 17 Operating Information Full-Time Equivalent Government Employees 7 – 18 Operating Indicators 7 – 19 Capital Asset Statistics 7 – 20

1 - 1
December 16, 2020
Honorable Mayor Osborn and Fenton City Council: In accordance with State statute and provisions of the City Charter, it is my pleasure to submit to you and the citizens of Fenton, the comprehensive annual financial report of the City of Fenton for the fiscal year ending June 30, 2020 (FY 2020). Responsibility for the accuracy of the data presented and the completeness and fairness of the presentation, including all disclosures, rests with the City. The administration believes, and has made its best efforts to insure, that the data, as presented, is accurate in all material aspects; that it is presented in a manner designed to fairly set forth the financial position and results of operations of the City as measured by the financial activity of its various funds; and that all disclosures necessary to enable the reader to gain the maximum understanding of the City’s financial status have been included.
In developing and monitoring the City’s accounting system, significant consideration is given to the adequacy of our systems of fiscal checks and balances. Our Internal accounting controls are regularly reviewed, not just by our auditors in the preparations of our annual audit, but also by the City Treasurer and the City administration throughout the year as we examine current and propose future practices and procedures. Based upon these regular reviews, I believe the internal accounting controls currently in place adequately safeguard assets and provide reasonable assurance of the proper recording of the City’s financial transactions.
This report has been formulated following the guidelines recommended by the Government Finance Officers Association (GFOA) of the United States and Canada. The GFOA annually awards certificates of Achievement to those governments whose financial reports are judged to meet the high standards of public financial reporting and generally accepted accounting principles. We can point with some pride that for thirty‐two consecutive years, beginning with Fiscal Year 1988, we have been the recipients of the GFOA’s Certificate of Achievement. Congratulations to the City Treasurer and his team for this accomplishment.
Public Act 2 of 1968 of the State of Michigan, as amended, requires that the financial statements of the City of Fenton be audited by a certified public accounting firm. This requirement has been met by retaining the services of Yeo & Yeo, P.C. as our independent auditors. The opinion letter of our auditors is included in the financial section of their report.
Fiscal Year 2020 began as a typical year with hopes and expectations of another busy and productive year. However, in January 2020 news began circulating about a novel virus in China and was beginning to spread into the United States and other Countries. The COVID‐19 Coronavirus became more contagious, potentially deadly and spread across the globe, quickly developing into a pandemic. In March 2020, the spread of the virus created a medical emergency causing governments to issue executive orders to shut down businesses and issue stay at home orders/advisories.
1 - 2
In addition to a global health crisis, we were quickly sliding into a recession. The recession impacted many businesses and industries. Locally, restaurants were forced into providing take‐out service only. Retail establishments were restricted to curbside sales. As summer came the restrictions were eased and the city worked with local restaurants to create more outdoor dining. In response to the pandemic the city has worked hard to create a safe work environment for visitors to public buildings and city employees. We also began purchasing additional Personal Protective Equipment (PPE). These issues caused unforeseen expenditures for the city’s General Fund.
The City of Fenton has ended the fiscal year in a stable financial condition. However, in the FY 2020 budget the city had a slight deficit of $141,005. This was due, in part, to unexpected expenditures because of the COVID‐19 Coronavirus pandemic. The city did receive some reimbursement from the State of Michigan through the CARES Act funds. The reimbursement of $168,410 (50% of our requested reimbursement) was received after the end of the fiscal year. The reimbursement funds will be included in the revenue for FY 2021. In addition, an $81,331 adjustment was made in the General Fund due to a change in the accounting method of our Fire Cost Recovery revenue. In the 2020 fiscal year we contracted with Universal Credit Service to collect our Cost Recovery Revenue. The uncollected revenue is no longer recorded as a receivable, we not only include the funds as revenue when it is received. An accounting adjustment was made to our deferred revenue to account for this change and that resulted in an $81,331 reduction to the fund balance.
Although the fiscal year ended in a deficit, this did not make a significant change to the city’s overall fund balance. The city has a General Fund Balance of about 77% of annual expenditures.
The Sewer Fund shows a net decrease in cash of $221,182. Much of this was offset by a SAW Grant reimbursement in the about of $192,614 that was requested in July 2020 and received from the State the next month. These expenses were recorded in FY 2020, but GAAP require the reimbursement to be recorded when the reimbursement was requested in FY 2021. In FY 2020, the Sewer Fund purchased a sewer vactor truck at a cost of $437,583. Overall, the fund ended the fiscal year in good shape.
During the fiscal year the City of Fenton Downtown Development Authority (DDA) continued to be very active. The ReJuv Ave. building on Mill Street was completed. ReJuv Ave. began construction of a two‐story building on Mill Street during fiscal year 2019. The 111 Leroy Place project is currently under construction. This is a four‐story building with the first‐floor restaurant and retail. The second floor is planned for office with the third and fourth floor having a total of fourteen apartments. A construction/development company from Macomb County purchased the old Kmart building in FY 2019 and continued the renovation in FY 2020 for several new tenants that include Old Navy, Oshkosh‐Carter’s, TJ Maxx, Skechers, and Five Below (these store are now open). Several other commercial properties made improvements as well as residential construction that continued. The real estate values and home ownership have continued to improve in the city. New home construction has continued to improve. The number of new home being build continued to increase in FY 2020. Reported total construction value exceeded $18.5 million.
The 2010 decennial census count showed a population gain of 11% in the previous 10 years. The current population of the City of Fenton is 11,746. The City of Fenton’s population growth is an unusual trend in the State of Michigan. Population growth continued during the recession and projections by Genesee County indicate that growth in the City of Fenton will continue through at least 2035. With all of the businesses in the city, the daytime population is estimated at 50,000. There is a high level of interest for developing in Fenton, as reflected by interest from business and residential developers. The city’s location near several major metropolitan markets and our relatively new position as the commercial hub for southern Genesee, northern Livingston, and western Oakland counties, quality education systems, abundant natural resources, downtown development, commercial redevelopment and the overall quality of life improvements will continue to make Fenton an attractive community.
1 - 3
We have continued to implement some cost reductions to address the economic challenges we face. Wherever possible the City has made use of grants, or low interest funds to help meet the needs of the community. Examples of grants benefiting the City include road improvements and homeland security grants.
It should be noted that the preparation of this comprehensive annual financial report could not have been accomplished without the efforts of our City Treasurer, Jon Satkowiak. His continued efforts to upgrade the City’s accounting, financial reporting and information management systems have contributed significantly to the quality of the information being reported to the City Council and the citizens of Fenton
In closing, let me express my hope that you will find this document to be a useful tool in evaluating the City’s financial health. Helping you and the public obtain a thorough understanding of the City’s financial condition is important to us all. Should you have any questions, comments, concerns, or suggestions regarding this document or the information it contains, Jon and I are available to respond.
My staff and I look forward to reviewing this information with you.
Respectfully submitted,
Lynn Markland City Manager

1 - 4
December 16, 2020
To the Citizens of the City of Fenton:
The comprehensive annual financial report of the City of Fenton for the fiscal year ended June 30, 2020 is hereby submitted. Responsibility for both the accuracy of the data presented and the completeness and fairness of the presentation, including all disclosures, rests with the City. The administration believes that the data, as presented, is accurate in all material aspects; that it is presented in a manner designed to fairly set forth the financial position and results of operations of the City as measured by the financial activity of its various funds; and that all disclosures necessary to enable the reader to gain the maximum understanding of the City’s financial status have been included. Generally accepted accounting principles (GAAP) require that management provide a narrative introduction, overview, and analysis to accompany the basic financial statements in the form of Management’s Discussion and Analysis (MD&A). This letter of transmittal is designed to complement the MD&A and should be read in conjunction with it. The City of Fenton’s MD&A can be found immediately following the report of the independent auditor. THE REPORTING ENTITY AND SERVICES PROVIDED The City of Fenton has defined its financial reporting entity in accordance with the pronouncements of the Governmental Accounting Standards Board (GASB). The City includes all the funds, boards, commissions, and authorities that are controlled by or dependent upon the Mayor and City Council. Based upon these criteria, the Downtown Development Authority, Local Development Finance Authority and Brownfield Redevelopment Authority have been included in this report. The City provides various municipal services to its citizens. Among these are fire and police protection, garbage collection, parks maintenance and activities, street construction and maintenance, planning and zoning, and general administrative services. The City operates its own water system and sanitary sewer system.
Member Michigan Municipal League
1 - 5
GOVERNMENTAL STRUCTURE AND LOCAL ECONOMY
The City operates under the Council‐Manager form of government. The City Council is comprised of the Mayor and six members. The members are elected on a staggered four‐year term basis. The Mayor is elected every two years. The City Manager and City Attorney are appointed by and serve at the pleasure of the Council. Fenton is located conveniently near the many terrific amenities of the Mid‐Michigan area. The Genesee County city borders both Livingston and Oakland Counties, and its proximity to US‐23 makes Fenton just a short drive from the major metropolitan areas of Ann Arbor, Lansing, Flint, Detroit, and more. The City is a stable community with many assets – quality residential neighborhoods, good schools, beautiful view of the Shiawassee River, and historic downtown and residential neighborhoods, a solid industrial base and convenient freeway access. Periodic events and festivals, such as the 4th of July Freedom Festival, Concerts in the Park, Back to the Bricks, Applefest, and Jinglefest contribute to Fenton’s “small town” sense of community. Many choices of housing are available in Fenton, whether it is single‐family homes in beautiful neighborhoods, apartment communities in convenient locations, or condominiums tucked away in lovely wooded areas. For those whose careers take them outside of the city, they do not have far to travel since all major metropolitan areas such as Ann Arbor, Lansing, Flint, and the Detroit Area are located within an hour’s drive. New construction of homes are occurring in unfinished subdivisions left from the 2007 recession. The City’s Industrial Park has almost no vacant buildings and there is interest in the vacant properties. The Local Development Finance Authority (LDFA) raised the visibility of the Industrial Park by rebranding the name to the City of Fenton Business and Technology Park. The LDFA has installed new signage and landscaping in the park. The signs accentuate the entrance to the park and increases visibility from US‐23 expressway. The City is the heart of a beautiful recreation area. There are 58 lakes within a 10‐mile radius of the City, which are used for fishing, boating, swimming, and other water sports. The City is fortunate to have an abundance of park facilities scattered throughout the city ranging in size from 40 acres to less than 1 acre. The spatial distribution of parks within the City is such that the majority of residents are located within a 10‐minute walk from a park or school facility. Silver Lake Park in Fenton is 35.4 acres, features a municipal beach and picnic areas. Lake Fenton, with more than 11 miles of shoreline, is the largest lake in the area, encompassing 845 acres and with a maximum depth of 92 feet. The area around the City provides facilities for downhill and cross‐county skiing, snowmobiling and ice fishing. The Michigan Nature Association has a sanctuary located in the city limits. Visitors can walk down 4.5 miles of marked trails while gazing at hundreds of colorful wildflowers, indulging in bird watching and seeing plentiful deer. The sanctuary is 155 acres of land. The Michigan Nature Association is a non‐profit statewide land conservation organization with a network of more than 170 nature sanctuaries across Michigan. The Shiawassee River Heritage Trail is a major accomplishment of the Headwaters Trails, a non‐profit group whose mission is to facilitate and promote the cooperation of local governments in Southeast Michigan to create new recreational opportunities including a creation of a network of trails for the area residents and visitors. The trail starts in Holly and goes to Byron, passing through Fenton. The Shiawassee River is now open for canoers and kayakers.

1 - 6
Fenton Area Public Schools is one of the finest school districts in the state, with three public elementary schools, a new middle school building which was built in 2000, and a high school. Fenton Area Public Schools is the first public school district in Michigan to offer the International Baccalaureate Programme district wide. A small portion of the City is in the Lake Fenton Community School District which has built a new state‐of‐the‐art high school. In addition, the City is the home to a private parochial school for parents who choose a religion‐based education for their children. The 2010 U.S. Census was 11,746, a population increase of 11% or 1,164 persons from 2000. Standard and Poors reviewed the City of Fenton credit rating in 2020. The credit rating remained at AA‐. The Financial Management Assessment (FMA) score is “good”. MAJOR INITIATIVES For the Year As part of the ongoing community strategic planning, with emphasis on entertainment, recreational activities, downtown walkability and an improved or new Library, the City has continued to meet these goals. The City’s Sewer Department purchased a new Sewer Vactor Truck to help assess the condition of our Sewer System and make the critical repairs necessary. The North and Torrey Road project was completed and brought the City’s first Round‐a‐Bout. The project also included resurfacing of a portion of North Road. The Fenton Streetscape project began in April of 2015 and was completed in FYE 16. The project is a reconstruction of the downtown district’s roads, sidewalks, and aesthetics. This project made the downtown a more walkable destination, which was the goal of City Council and the Downtown Development Authority (DDA). This project is drawing more people to the downtown area. The City’s Water Fund underwent a successful Bond Refunding which will result in roughly a $17,000 dollar per year savings. The City leased several outdoor sculptures from Midwest Sculpture Initiative and placed them in several community areas. Midwest Sculpture Initiative’s mission is to provide outdoor sculpture exhibitions throughout the Midwest, promote cooperation among art and civic organizations, in the Downtown District. The City has purchased four of the sculptures to be permanently displayed in the Downtown. The DDA has formed partnerships with the Southern Lakes Parks and Recreation Authority and Fenton Chamber of Commerce. Financial sponsorship has been provided for the Farmer’s Market, Summer Concerts, and Taste in Fenton. The Back to the Bricks Tune Up party brought upwards of 10,000 people to downtown Fenton in one evening. The DDA continued contracting with New Moon Visions marketing firm. New Moon Vision’s general marketing plan covers monthly fees and services for the FentonBeCloser.com website; Fenton Focus online magazine which promotes individual merchant stories and events; the ongoing social media management for Facebook.com/FentonMichigan and Twitter.comDowntownFenton, posting merchant promotions and community events. New Moon Vision creates ads for print and handles media buys for signature events.

1 - 7
The DDA continued the façade improvement program, financially and professionally assisting businesses in improving the external portion to their buildings. A sign way finding project is being implemented to assist newcomers in finding their way around Fenton. For the Future For the ongoing protection of the City, the City Council has set a policy to maintain the combination of the General Fund and Budget Stabilization Fund Balances at 20% of net General Fund operating revenues and have met these requirements. Council will strive to continue meeting this goal in the future. The City prepares a five‐year financial plan annually for the General Fund. The council uses this plan to make positive improvements to the structural financial issues. The Shiawassee Street resurfacing should be completed by the end of the fiscal year. The project also encompassed replacing of the Lead Service lines from our Water System. The Cornerstone Building, 4 story and 48,000 square foot, by Corlin Builders was completed in FYE 15 in the downtown. Now Corlin Builders are planning a second building in downtown. The proposed building features four stories with a total of 40,400 square feet. The first floor will feature five retail spaces and the second floor will be offices. The third and fourth floors will feature condominiums. The city will provide the land and demolish the existing strip mall for this development. This projected is slated to be completed by the end of the fiscal year. The City is preparing to purchase a new Fire Truck and replace the roof on City Hall, Police Station, and Library. BUDGETING AND INTERNAL CONTROLS In developing and evaluating the City’s accounting system, consideration has been given to the adequacy of internal accounting controls. Internal accounting controls are designed to provide reasonable, but not absolute, assurance regarding: (1) the safeguarding of assets against loss from unauthorized use or disposition; and (2) the reliability of financial records for preparing financial statements and maintain accountability for assets. The concept of reasonable assurance recognizes that: (1) the cost of a control should not exceed the benefits likely to be derived; and (2) the evaluation of costs and benefits requires estimates and judgements by management. Budgeting Controls. After thorough evaluation of all proposals, the City Council adopts an Annual Budget for the General Fund, Special Revenue Funds, and Debt Service Funds. The budget is legally enacted on a departmental (activity) basis. An online inquiry system is available to department heads in which they could review budget to actual figure on a daily basis. Quarterly budget reports are provided to council for their review. OTHER INFORMATION Independent Audit The City Charter and State laws require an annual audit of the financial records and transactions of the City by a firm of independent licensed Certified Public Accountants. This requirement has been complied with and the City’s financial statements have received an “unmodified opinion” from Yeo & Yeo, P.C. Certified

1 - 8
Public Accountants. An unmodified opinion is the best opinion that an organization can receive on its financial statements. It indicates that the auditor’s examination has disclosed no conditions that cause them to believe the financial statements are not fairly stated in all material respects. Awards The Government Finance Officers Association of the United States and Canada (GFOA) awarded a Certificate of Achievement for Excellence in Financial Reporting to the City of Fenton for its comprehensive annual financial report for the fiscal year ended Jun 30, 2019. The Certificate of Achievement is a prestigious national award recognizing conformance with the highest standards for preparation of state and local government financial reports. In order to be awarded a Certificate of Achievement, a government unit must publish an easily readable and efficiently organized comprehensive annual financial report, whose contents conform to program standards. The CAFR must satisfy both generally accepted accounting principles and applicable legal requirements. A Certificate of Achievement is valid for a period of one year only. The City of Fenton has received a Certificate of Achievement for the last thirty‐one consecutive years. We believe our current report continues to conform to the Certificate of Achievement program requirements, and we are submitting it to the GFOA. Acknowledgments The continuing efforts of department heads and office staff make possible the preparation of this comprehensive annual financial report. Commitment to fiscal integrity and financial leadership by the City Council is appreciated. The CPA firm of Yeo & Yeo, P.C. also made substantial contributions in the preparation of this documents. Respectfully, Jon Satkowiak Jr. City Treasurer

1 - 9
1 - 10
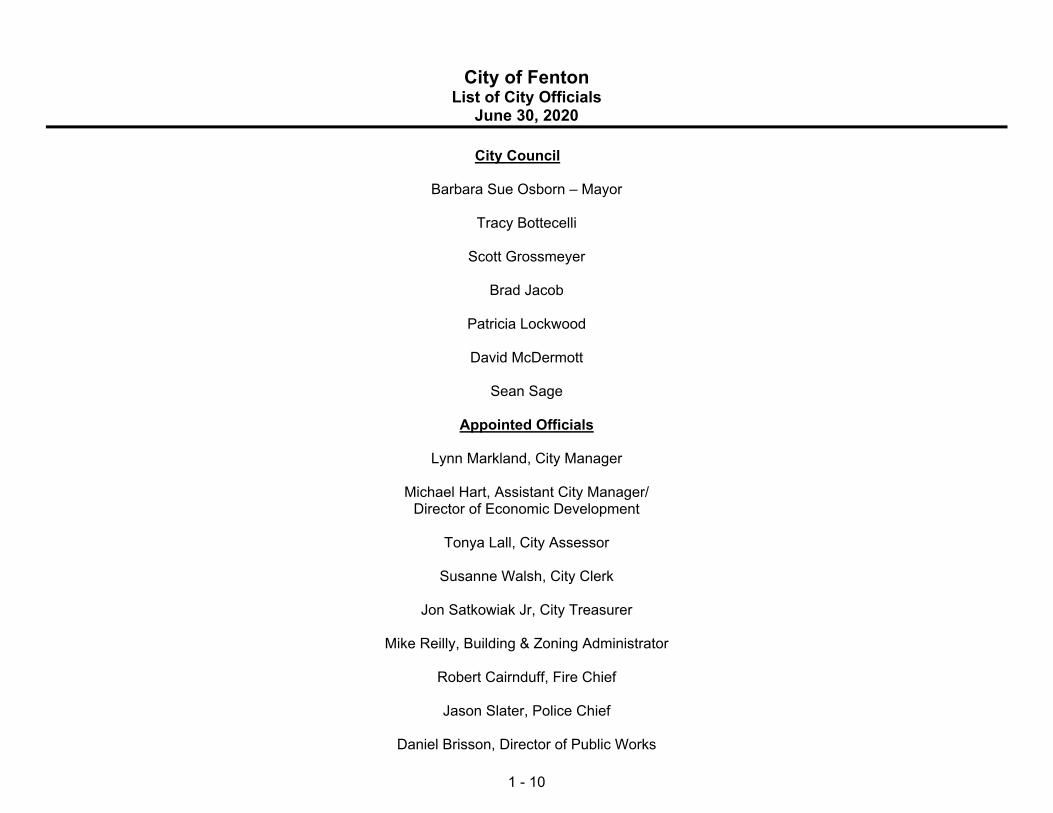
City of Fenton List of City Officials
June 30, 2020
City Council
Barbara Sue Osborn – Mayor
Tracy Bottecelli
Scott Grossmeyer
Brad Jacob
Patricia Lockwood
David McDermott
Sean Sage
Appointed Officials
Lynn Markland, City Manager
Michael Hart, Assistant City Manager/ Director of Economic Development
Tonya Lall, City Assessor
Susanne Walsh, City Clerk
Jon Satkowiak Jr, City Treasurer
Mike Reilly, Building & Zoning Administrator
Robert Cairnduff, Fire Chief
Jason Slater, Police Chief
Daniel Brisson, Director of Public Works

City of Fenton, Michigan Organizational Chart
Citizens of the City of Fenton
Mayor and
City Council
1 - 11
Support Staff
Planning Commission Library Board Local Development Finance Authority Compensation Commission Building Authority Cemetery Board Museum Board Board of Review Zoning Board of Appeals Beautification Commission Downtown Development Authority Parks and Recreation Board City Manager City Attorney
Police Fire City Building and City City Public Works Assistant Chief Chief Clerk Zoning Treasurer Assessor Director City Manager
Administrator

2 - 1
Independent Auditors’ Report
To the Honorable Mayor and Members of the City Council City of Fenton, Michigan
Report on the Financial Statements
We have audited the accompanying financial statements of the governmental activities, the business-type activities, the aggregate discretely presented component units, each major fund, and the aggregate remaining fund information of the City of Fenton, Michigan (the City), as of and for the year ended June 30, 2020, and the related notes to the financial statements, which collectively comprise the City’s basic financial statements as listed in the table of contents.
Management’s Responsibility for the Financial Statements
Management is responsible for the preparation and fair presentation of these financial statements in accordance with accounting principles generally accepted in the United States of America; this includes the design, implementation, and maintenance of internal control relevant to the preparation and fair presentation of financial statements that are free from material misstatement, whether due to fraud or error.
Auditor’s Responsibility
Our responsibility is to express opinions on these financial statements based on our audit. We conducted our audit in accordance with auditing standards generally accepted in the United States of America. Those standards require that we plan and perform the audit to obtain reasonable assurance about whether the financial statements are free from material misstatement.
An audit involves performing procedures to obtain audit evidence about the amounts and disclosures in the financial statements. The procedures selected depend on the auditor’s judgment, including the assessment of the risks of material misstatement of the financial statements, whether due to fraud or error. In making those risk assessments, the auditor considers internal control relevant to the entity’s preparation and fair presentation of the financial statements in order to design audit procedures that are appropriate in the circumstances, but not for the purpose of expressing an opinion on the effectiveness of the entity’s internal control. Accordingly, we express no such opinion. An audit also includes evaluating the appropriateness of accounting policies used and the reasonableness of significant accounting estimates made by management, as well as evaluating the overall presentation of the financial statements.

2 - 2
We believe that the audit evidence we have obtained is sufficient and appropriate to provide a basis for our audit opinions.
Opinions
In our opinion, the financial statements referred to above present fairly, in all material respects, the respective financial position of the governmental activities, the business-type activities, the aggregate discretely presented component units, each major fund, and the aggregate remaining fund information of the City of Fenton, Michigan, as of June 30, 2020, and the respective changes in financial position, and, where applicable, cash flows thereof for the year then ended in accordance with accounting principles generally accepted in the United States of America.
Adoption of New Accounting Standard
As described in Note 1 to the financial statements, during the year ended June 30, 2020, the City adopted GASB Statement No. 84 Fiduciary Activities. Our opinions are not modified with respect to this matter.
Required Supplementary Information
Accounting principles generally accepted in the United States of America require that the management’s discussion and analysis, budgetary comparison schedules, and pension and other postemployment benefit schedules, as identified in the table of contents, be presented to supplement the basic financial statements. Such information, although not a part of the basic financial statements, is required by the Governmental Accounting Standards Board, who considers it to be an essential part of financial reporting for placing the basic financial statements in an appropriate operational, economic, or historical context. We have applied certain limited procedures to the required supplementary information in accordance with auditing standards generally accepted in the United States of America, which consisted of inquiries of management about the methods of preparing the information and comparing the information for consistency with management’s responses to our inquiries, the basic financial statements, and other knowledge we obtained during our audit of the basic financial statements. We do not express an opinion or provide any assurance on the information, because the limited procedures do not provide us with sufficient evidence to express an opinion or provide any assurance.
Other Supplementary Information
Our audit was conducted for the purpose of forming opinions on the financial statements that collectively comprise the City’s basic financial statements. The introductory section, combining nonmajor fund financial statements, budgetary comparisons, component unit fund statements, and statistical section, as identified in the table of contents, are presented for purposes of additional analysis and are not a required part of the basic financial statements.
The other supplementary information, as identified in the table of contents, is the responsibility of management and was derived from and relates directly to the underlying accounting and other records used to prepare the basic financial statements. The other supplementary information has been subjected to the auditing procedures applied in the audit of the basic financial statements and certain additional procedures, including comparing and reconciling such information directly to the underlying accounting and other records used to prepare the basic financial statements or to the basic financial statements themselves, and other additional procedures in accordance with auditing standards generally accepted in the United States of America. In our opinion, the other supplementary information, as identified in the table of contents, is fairly stated, in all material respects, in relation to the basic financial statements as a whole.

2 - 3
The introductory and statistical section, which are the responsibility of management, have not been subjected to the auditing procedures applied in the audit of the basic financial statements, and accordingly, we do not express an opinion or provide any assurance on them.
Auburn Hills, MI December 16, 2020

City of Fenton Management’s Discussion and Analysis
June 30, 2020
3 - 1
Using this Annual Report This annual report consists of a series of narratives and financial statements. This narrative should be considered in conjunction with the additional information presented in the letter of transmittal found on pages 1 - 1 through 1 - 7 and is intended to serve as an introduction to the City of Fenton’s basic financial statements. The basic financial statements consist of three components: (1) government-wide financial statements, (2) fund financial statements, and (3) notes to the financial statements. This report also contains other supplementary information in addition to the basic financial statements. Government-wide Financial Statements are designed to provide readers with a broad overview of the City of Fenton’s finances, in a manner similar to a private sector business. The statement of net position presents information on all of the City’s assets, deferred inflows/outflows of resources, and liabilities, with the difference reported as net position. Over time, the increases or decreases in net position may serve as a useful indicator of whether the financial position of the City of Fenton is improving or deteriorating. The statement of activities presents information showing how the City’s net position changed during the most recent fiscal year. All changes in net position are reported as soon as the underlying event occurs, regardless of the timing of the related cash flows. As a result, revenues and expenses are reported in this statement for some items that only result in cash flows in future fiscal periods. Both of the government-wide financial statements distinguish functions of the City that are principally supported by taxes and intergovernmental revenues (governmental activities) from functions that are intended to recover costs from user fees and charges for services (business-type activities). The governmental activities include general government, public works, parks and recreation, community service, and cemetery. The business-type activities include the water and sewer operation of the City. The government-wide financial statements include not only the City of Fenton (known as the primary government), but also the legally separate Downtown Development Authority and Local Development Authority for which the City is financially accountable. Financial information for these component units is reported separately from the financial information presented for the City. Fund Financial Statements (which report the City’s operation in more detail than the government-wide financial statements) follow the above-mentioned statements and illustrate how the services provided by the City were financed in the short term, as well as what remains for future spending. A fund is a group of related accounts that is used to maintain control over resources that have been segregated for specific activities and to demonstrate compliance with finance-related legal requirements. All of the funds of the City can be divided into three categories: governmental funds, proprietary funds, and fiduciary funds. Governmental funds are used to account for essentially the same functions reported as governmental activities in the government-wide financial statements. However, governmental fund financial statements focus on the near-term inflows and outflows of spendable resources, as well as on balances of spendable resources at the end of the fiscal year. Such information may be useful in evaluating a government’s near-term financing requirements. Because the focus of governmental funds is narrower, it is useful to compare this information with similar information presented for governmental activities in the government-wide financial statements. This comparison may allow the readers to better understand the long-term impact of the City’s short-term financing decisions. Both the balance sheet and the statement of revenues, expenditures, and changes in fund balances for the governmental funds provide a reconciliation to facilitate this comparison between governmental funds and governmental activities.

City of Fenton Management’s Discussion and Analysis
June 30, 2020
3 - 2
The City of Fenton maintains 20 individual governmental funds. Information is presented separately in the governmental fund balance sheet and statement of revenues, expenditures, and changes in fund balances for the General Fund and Major Street Fund which are considered to be major funds. Data for the other 18 governmental funds are combined into a single, aggregated presentation. Individual fund data for each of these nonmajor governmental funds is provided in the form of combining statements elsewhere in this report. The City of Fenton adopts an annual appropriated budget for all of its governmental funds. Budgetary comparison statements have been provided for all the governmental funds to demonstrate budgetary compliance. Proprietary funds provide the same type of information as the government-wide financial statements, only in more detail. The City maintains two different types of proprietary funds. Enterprise Funds are used to report the same functions presented in the business-type activities in the government-wide financial statements. The City of Fenton uses Enterprise Funds to account for its water and sewer operations. These funds are considered major funds of the City. Internal Service Funds are an accounting device used to accumulate and allocate cost internally among various functions. The City of Fenton uses an Internal Service Fund to account for its equipment usage and also to accumulate resources for employee sick pay. Because this program predominantly benefits governmental rather than business-type functions, it has been consolidated within the governmental activities in the government-wide financial statements. Fiduciary funds are used to account for resources held for the benefit of parties outside the government. Fiduciary funds are not reflected in the government-wide financial statements because the resources of those funds are not available to support the City’s programs. The accounting used for fiduciary funds is much like that used for proprietary funds. Notes to the Financial Statements provide additional information that is essential to a full understanding of the data provided in the government-wide and fund financial statements. Required Supplementary Information concerning the City’s budgetary comparison statements for the General and major Special Revenue funds as well as budget footnotes. This required supplementary information is in addition to the basic financial statements and accompanying notes. Other Financial and Supplementary Information, such as the combining statements and certain budget comparison statements referred to earlier, as well as various financial schedules and the statistical information, are presented immediately following the required supplementary information. Table I summarizes the major features of the City’s financial statements, including the portion of the City government they cover and the types of information they contain. The remainder of this overview section of management’s discussion and analysis explains the structure and contents of each of the statements.

City of Fenton Management’s Discussion and Analysis
June 30, 2020
3 - 3
Table 1 Major Features of the City of Fenton, Michigan’s Government-wide and Fund Financial Statements
Fund Statements
Type of Statements
Government-wide Governmental Funds
Proprietary Funds
Fiduciary Funds
Scope Entire City government (except fiduciary funds) and the City’s component units
The activities of the City that are not proprietary or fiduciary, such as police, fire, and major/local streets
Activities the City operates similar to private business: the water and sewer system
Instances in which the City is the trustee or agent for someone else’s resources.
Required financial statements
Statement of net position
Statement of activities
Balance Sheet Statement of revenues,
expenditures and changes in fund balances
Statement of net position
Statement of revenues, expenses and changes in fund net assets
Statement of cash flows
Statement of Fiduciary Net Position
Statement of Changes in Fiduciary Net Position
Accounting basis and measurement focus
Accrual accounting and economic resources focus
Modified accrual accounting and current financial resources focus
Accrual accounting and economic resources focus
Accrual accounting and no measurement focus
Type of asset/liability information
All assets and liabilities, both financial and capital, short-term and long-term
Only assets expected to be used up and liabilities that come due during the year or soon thereafter, no capital assets included
All assets and liabilities, both financial and capital, and short-term and long-term
All assets and liabilities, both short-term and long-term, the City’s funds do not currently contain capital assets, although they can
Type of inflow/outflow information
All revenues and expenses during the year, regardless of when cash is received or paid
Revenues for which cash is received during or soon after the end of the year, expenditures when goods or services have been received and payment is due during the year or soon thereafter
All revenues and expenses during year, regardless of when cash is received or paid
All additions and deductions during year, regardless of when cash is received or paid

City of Fenton Management’s Discussion and Analysis
June 30, 2020
3 - 4
The City of Fenton as a Whole The following table shows, in a condensed format, the net position as of the current date and compared to the prior year (in millions of dollars):
The City’s combined net position decreased 3.4 percent from a year ago, decreasing from $46.8 million to $45.2 million. A review of the governmental activities, separate from the business-type activities, shows the net position decreased from $18.2 million to $17.0 million during fiscal year 2020. Unrestricted net position for the governmental activities, which is the portion of net position that is available to finance day-to-day operations and future growth, was $(3.0) million at June 30, 2020. The business-type activities experienced a decrease in net position of approximately $0.4 million or 1.4 percent.
2019 2020 2019 2020 2019 2020
Current & other assets 10.2$ 9.4$ 6.4$ 6.0$ 16.6$ 15.4$ Capital assets 20.0 20.0 30.8 30.0 50.8 50.0
Total assets 30.2 29.4 37.2 36.0 67.4 65.4
Deferred outflows of resources 1.7 2.3 0.4 0.5 2.1 2.8
Long-term liabilities 12.1 12.8 7.5 6.9 19.6 19.7 Other liabilities 1.4 1.5 1.4 1.3 2.8 2.8
Total liabilities 13.5 14.3 8.9 8.2 22.4 22.5
Deferred inflows of resources 0.2 0.4 0.1 0.1 0.0 0.5
Net position:Net investment in
capital assets 19.1 19.5 24.8 24.8 43.9 44.3 Restricted 0.0 0.5 - 0.5 - 1 Unrestricted (0.9) (3.0) 3.8 2.9 2.9 (0.1)
Total net position 18.2$ 17.0$ 28.6$ 28.2$ 46.8$ 45.2$
GovernmentalActivities
Business-typeActivities Total
City of Fenton Management’s Discussion and Analysis
June 30, 2020
3 - 5
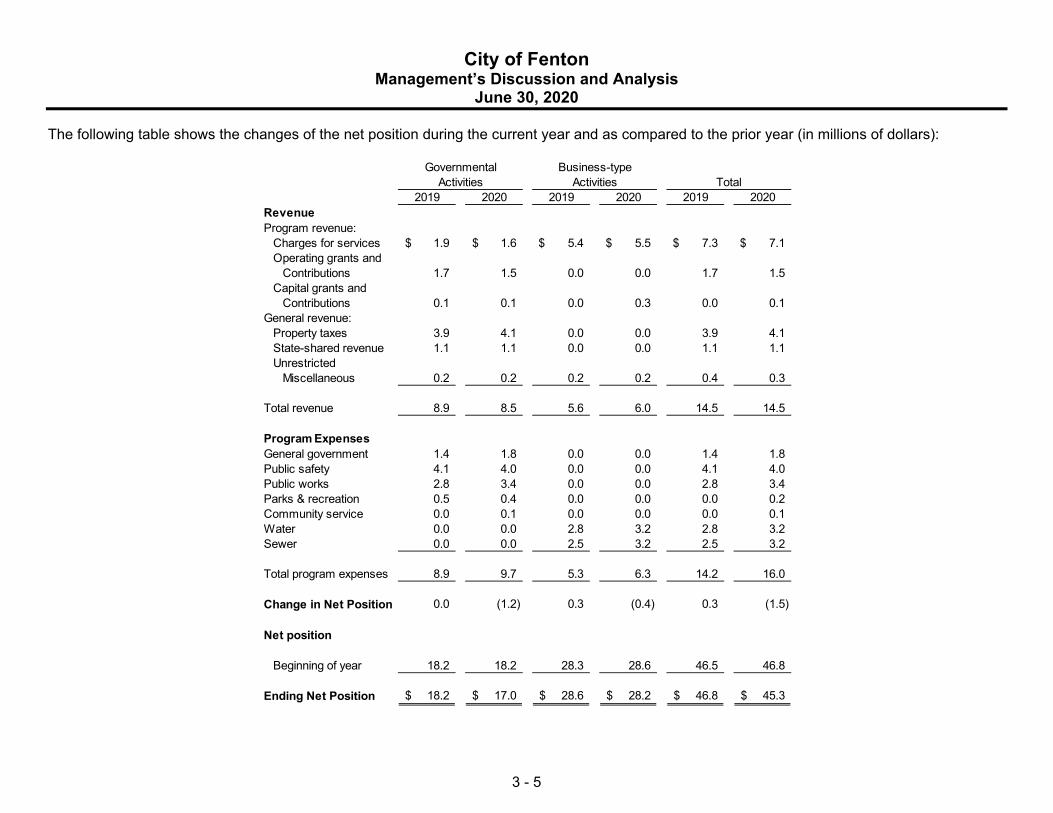
The following table shows the changes of the net position during the current year and as compared to the prior year (in millions of dollars):
2019 2020 2019 2020 2019 2020RevenueProgram revenue:
Charges for services 1.9$ 1.6$ 5.4$ 5.5$ 7.3$ 7.1$ Operating grants and
Contributions 1.7 1.5 0.0 0.0 1.7 1.5 Capital grants and
Contributions 0.1 0.1 0.0 0.3 0.0 0.1General revenue:
Property taxes 3.9 4.1 0.0 0.0 3.9 4.1 State-shared revenue 1.1 1.1 0.0 0.0 1.1 1.1 Unrestricted
Miscellaneous 0.2 0.2 0.2 0.2 0.4 0.3
Total revenue 8.9 8.5 5.6 6.0 14.5 14.5
Program ExpensesGeneral government 1.4 1.8 0.0 0.0 1.4 1.8 Public safety 4.1 4.0 0.0 0.0 4.1 4.0 Public works 2.8 3.4 0.0 0.0 2.8 3.4 Parks & recreation 0.5 0.4 0.0 0.0 0.0 0.2Community service 0.0 0.1 0.0 0.0 0.0 0.1 Water 0.0 0.0 2.8 3.2 2.8 3.2 Sewer 0.0 0.0 2.5 3.2 2.5 3.2
Total program expenses 8.9 9.7 5.3 6.3 14.2 16.0
Change in Net Position 0.0 (1.2) 0.3 (0.4) 0.3 (1.5)
Net position
Beginning of year 18.2 18.2 28.3 28.6 46.5 46.8
Ending Net Position 18.2$ 17.0$ 28.6$ 28.2$ 46.8$ 45.3$
Governmental Business-typeActivities Activities Total

City of Fenton Management’s Discussion and Analysis
June 30, 2020
3 - 6
Governmental Activities The City’s total governmental revenues decreased slightly by about $400,000. Expenses increased by approximately $0.8 million, or 8.8 percent, from last fiscal year. Public Works expenses were the largest portion increasing by roughly $600,000. Business-type Activities The City’s business-type activities are recorded in the Water and Sewer Funds. The City provides water from wells located in the City. A new water treatment plant built in 2004 processes the water for all residents. The expenses for the Water Fund increased approximately $400,000 from FY 2019. The City is a participant in a county-wide sanitary sewer construction program under Act 342 Michigan Compiled Laws. The City contracts with Genesee County Water and Waste Services for the operation of the plant. The City has pledged the full faith and credit of the City for the payment of the City’s share of principal and interest payments. The assets and liabilities relating to those contracts have been recorded in the Sewer Fund. The City of Fenton, Fenton Township, and City of Linden share a plant located in Fenton Township. The City’s proportionate share of the operating costs of the plant is covered by our sewer rates. The expenses for the Sewer Fund increased approximately $0.7 million from FY 2019. During FY 2020, $578,682 in operating loss was incurred in the Sewer Fund and $66,558 in operating income was incurred in the Water Fund. The City’s Funds Our analysis of the City’s major funds begins on page 4 - 4, following the government-wide financial statements. The fund financial statements provide detailed information about the most significant funds, not the City as a whole. The City Council creates funds to help manage money for specific purposes as well as show accountability for certain activities, such as State of Michigan Act 51 major and local road revenue sharing. The City’s major governmental funds for 2020 were the General Fund and Major Street Fund. The General Fund pays for most of the City’s governmental services. The most significant of these are police and fire services, which incurred expenditures of $3.2 million in 2020. The general operating millage levied by the City supports these two services. FY 2020 revenues decreased in the General Fund by $197,131, mainly due to the decreases in charges for services as well as intergovernmental offset by an increase in taxable values. The General expenditures, excluding transfers out, increased by $153,791. A majority of the increase was due to increase in wages. Fund Balance in the General Fund decreased by $141,005. Over the course of the year, City administration and City Council monitor and amend the budget to take into account unanticipated events that occur during the year. At year end, actual General Fund revenues were under budget by $165,769. Expenditures were $133,846 under budget. Various departments contributed to the positive budget variance.
City of Fenton Management’s Discussion and Analysis
June 30, 2020
3 - 7
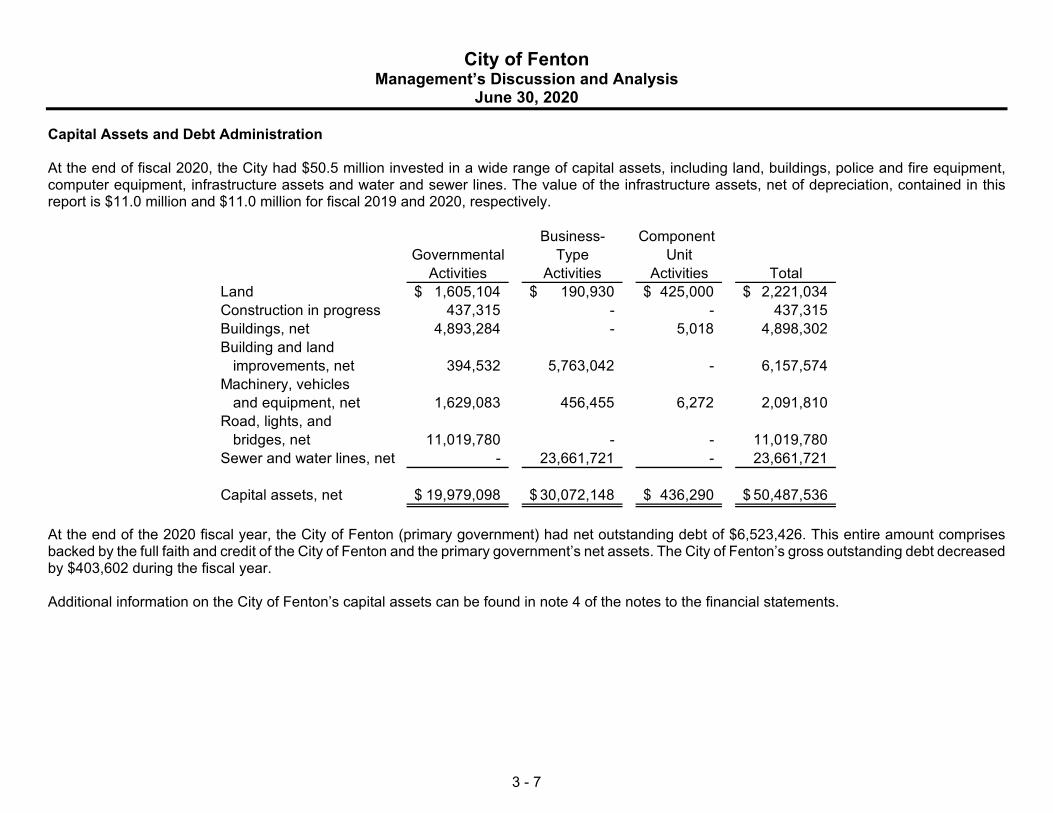
Capital Assets and Debt Administration At the end of fiscal 2020, the City had $50.5 million invested in a wide range of capital assets, including land, buildings, police and fire equipment, computer equipment, infrastructure assets and water and sewer lines. The value of the infrastructure assets, net of depreciation, contained in this report is $11.0 million and $11.0 million for fiscal 2019 and 2020, respectively.
Business- ComponentGovernmental Type Unit
Activities Activities Activities TotalLand 1,605,104$ 190,930$ 425,000$ 2,221,034$ Construction in progress 437,315 - - 437,315 Buildings, net 4,893,284 - 5,018 4,898,302 Building and land
improvements, net 394,532 5,763,042 - 6,157,574 Machinery, vehicles
and equipment, net 1,629,083 456,455 6,272 2,091,810 Road, lights, and
bridges, net 11,019,780 - - 11,019,780 Sewer and water lines, net - 23,661,721 - 23,661,721
Capital assets, net 19,979,098$ 30,072,148$ 436,290$ 50,487,536$
At the end of the 2020 fiscal year, the City of Fenton (primary government) had net outstanding debt of $6,523,426. This entire amount comprises backed by the full faith and credit of the City of Fenton and the primary government’s net assets. The City of Fenton’s gross outstanding debt decreased by $403,602 during the fiscal year. Additional information on the City of Fenton’s capital assets can be found in note 4 of the notes to the financial statements.

City of Fenton Management’s Discussion and Analysis
June 30, 2020
3 - 8
Standard and poor’s reviewed the City of Fenton credit rating during a prior year. The rating was determined to be AA-. The Financial Management Assessment (FMA) score is “good”. The ratio of net general bonded debt to assessed valuation and the amount of net bonded debt per capita are as follows:
2019 2020
Net direct bonded debt 390,000$ 335,000$ Ratio of debt to assessed valuation 0.0010 0.0008 Debt per capita 33$ 29$
Additional information on the City of Fenton’s long term debt can be found in note 5 of the notes to the financial statements. Economic Factors and Next Year’s Budgets and Rates The City levied an operating millage of 11 mills from 1989 to 2001. The City charter’s operating millage is 13 mills. During these years the Headlee Amendment authorized millage was higher than 11 mills but the City Council chose not to levy the full authorized millage. In the past fourteen years the Headlee Amendment has rolled the City’s operating millage below 11 mills. In 2019 the City levied 10.18 mills and 2020, 10.0003 mills were levied. In March 1994, Proposal A was enacted, which limits the growth on existing property to the rate of inflation. The inflation rate allowed for fiscal 2019 under Proposal A was 2.1 percent. Property taxes make up 61 percent of our General Fund budget revenue and Proposal A and the Headlee Amendment limit the growth of this revenue. Fortunately the City is still experiencing new commercial development. Most of this tax revenue growth is captured by the DDA but the DDA has completed many projects which benefit the City as a whole plus shared a portion of their revenue with the General Fund this fiscal year. Residential growth in the City is picking up. The General Fund budget for 2021 is structured so that revenues and expenditures balance down to a net zero gain/loss. The City makes an effort to operate with relative low personnel costs and an efficient labor force. Medical insurance costs continue to increase every year. The City prepares a Five Year Financial Plan for the General Fund, foreseeing the possible financial condition for more than just one year. Contacting the City’s Management This financial report is intended to provide our citizens, taxpayers, customers, and investors with a general overview of the City’s finances and to show the City’s accountability for the resources if receives. If you have any questions about this report or need additional information, we invite you to contact the administration offices at City Hall.
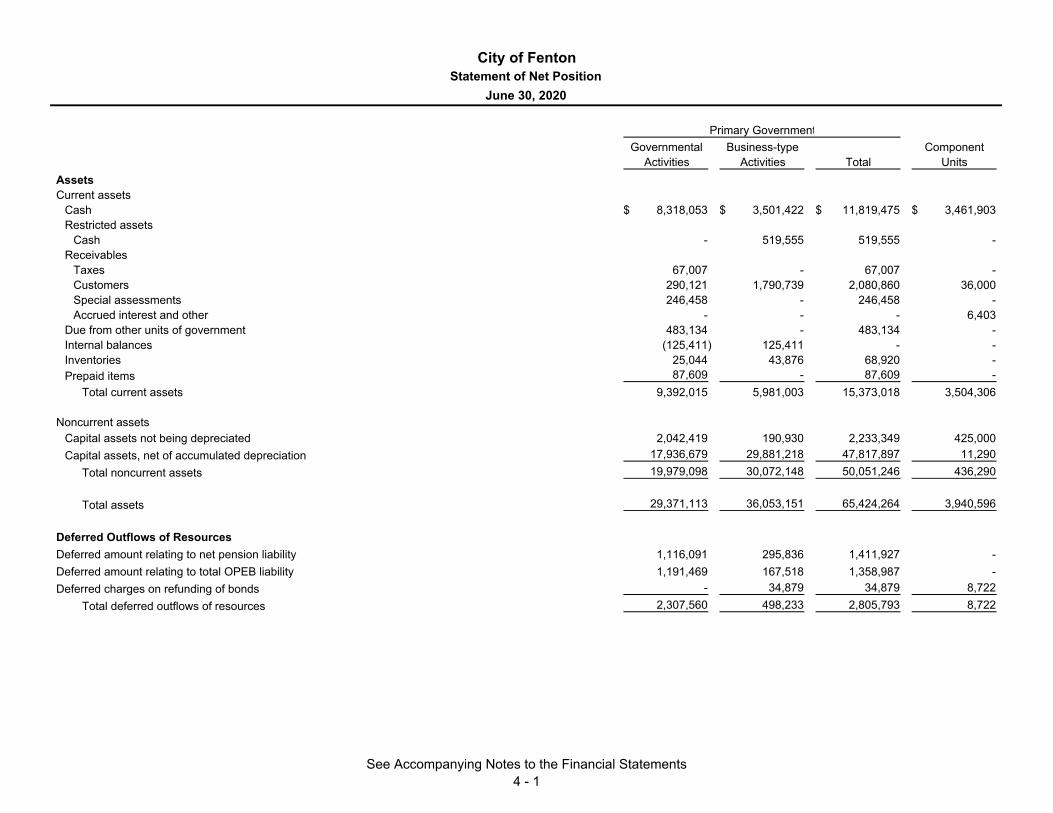
Governmental Business-type ComponentActivities Activities Total Units
AssetsCurrent assets
Cash 8,318,053$ 3,501,422$ 11,819,475$ 3,461,903$ Restricted assets
Cash - 519,555 519,555 - Receivables
Taxes 67,007 - 67,007 - Customers 290,121 1,790,739 2,080,860 36,000 Special assessments 246,458 - 246,458 - Accrued interest and other - - - 6,403
Due from other units of government 483,134 - 483,134 - Internal balances (125,411) 125,411 - - Inventories 25,044 43,876 68,920 - Prepaid items 87,609 - 87,609 -
Total current assets 9,392,015 5,981,003 15,373,018 3,504,306
Noncurrent assetsCapital assets not being depreciated 2,042,419 190,930 2,233,349 425,000 Capital assets, net of accumulated depreciation 17,936,679 29,881,218 47,817,897 11,290
Total noncurrent assets 19,979,098 30,072,148 50,051,246 436,290
Total assets 29,371,113 36,053,151 65,424,264 3,940,596
Deferred Outflows of ResourcesDeferred amount relating to net pension liability 1,116,091 295,836 1,411,927 - Deferred amount relating to total OPEB liability 1,191,469 167,518 1,358,987 - Deferred charges on refunding of bonds - 34,879 34,879 8,722
Total deferred outflows of resources 2,307,560 498,233 2,805,793 8,722
City of FentonStatement of Net Position
June 30, 2020
Primary Government
See Accompanying Notes to the Financial Statements4 - 1

Governmental Business-type ComponentActivities Activities Total Units
City of FentonStatement of Net Position
June 30, 2020
Primary Government
LiabilitiesCurrent liabilities
Accounts payable 429,863$ 442,893$ 872,756$ 19,380$ Accrued and other liabilities 174,586 74,453 249,039 38,588 Due to other units of government 42,467 - 42,467 776 Due to individuals and agencies 3,220 - 3,220 - Deposits payable 566,376 - 566,376 - Unearned revenue 16,310 - 16,310 - Current portion of long-term debt 96,804 798,365 895,169 691,000 Current portion of compensated absences 124,896 15,012 139,908 -
Total current liabilities 1,454,522 1,330,723 2,785,245 749,744
Noncurrent liabilitiesNoncurrent portion of long-term debt 412,209 4,516,509 4,928,718 3,618,243 Noncurrent portion of compensated absences 499,584 60,047 559,631 - Net pension liability 5,069,348 1,475,754 6,545,102 - Total OPEB liability 6,813,880 859,179 7,673,059 -
Total noncurrent liabilities 12,795,021 6,911,489 19,706,510 3,618,243
Total liabilities 14,249,543 8,242,212 22,491,755 4,367,987
Deferred Inflows of ResourcesDeferred amount relating to net pension liability 123,134 58,267 181,401 - Deferred amount relating to total OPEB liability 282,537 41,701 324,238 -
Total deferred inflows of resources 405,671 99,968 505,639 -
Net PositionNet investment in capital assets 19,470,085 24,792,153 44,262,238 436,290 Restricted for
Highways and streets 365,598 - 365,598 - Public safety 10,548 - 10,548 - Bond reserve - 519,555 519,555 - Debt service 148,428 - 148,428 -
Unrestricted (2,971,200) 2,897,496 (73,704) (854,959)
Total net position 17,023,459$ 28,209,204$ 45,232,663$ (418,669)$
See Accompanying Notes to the Financial Statements4 - 2

Operating CapitalCharges for Grants and Grants and Governmental Business-type Component
Functions/Programs Expenses Services Contributions Contributions Activities Activities Total Units
Primary governmentGovernmental activities
General government 1,813,863$ 208,120$ 37,177$ -$ (1,568,566)$ -$ (1,568,566)$ -$ Public safety 3,997,176 816,384 23,988 50,000 (3,106,804) - (3,106,804) - Public works 3,430,739 531,576 1,408,598 - (1,490,565) - (1,490,565) - Community and economic development 45,349 - - 2,702 (42,647) - (42,647) - Recreation and culture 384,197 39,397 1,125 - (343,675) - (343,675) -
Interest and fiscal charges on long-term debt 15,608 - - - (15,608) - (15,608) -
Total governmental activities 9,686,932 1,595,477 1,470,888 52,702 (6,567,865) - (6,567,865) -
Business-type activities Sewer 3,180,274 2,559,769 - 316,443 - (304,062) (304,062) - Water 3,158,884 2,928,889 14,081 - - (215,914) (215,914) -
Total business-type activities 6,339,158 5,488,658 14,081 316,443 - (519,976) (519,976) -
Total primary government 16,026,090$ 7,084,135$ 1,484,969$ 369,145$ (6,567,865) (519,976) (7,087,841) -
Component unitsDowntown Development Authority 725,334$ -$ -$ -$ - - - (725,334) Local Development Finance Authority 101,044 - - - - - - (101,044)
Total component unit activities 826,378$ -$ -$ -$ - - - (826,378)
General revenues Property taxes - unrestricted 4,113,868 - 4,113,868 2,072,678 State-shared revenue - unrestricted 1,078,056 - 1,078,056 - Unrestricted investment earnings 74,681 94,888 169,569 28,457 Miscellaneous 116,498 62,674 179,172 -
5,383,103 157,562 5,540,665 2,101,135
Change in net position (1,184,762) (362,414) (1,547,176) 1,274,757 Net position - beginning of year 18,208,221 28,571,618 46,779,839 (1,693,426)
Net position - end of year 17,023,459$ 28,209,204$ 45,232,663$ (418,669)$
Total general revenues
Program Revenues Changes in Net PositionPrimary Government
City of FentonStatement of Activities
For the Year Ended June 30, 2020
Net (Expense) Revenue and
See Accompanying Notes to the Financial Statements4 - 3

NonmajorMajor Governmental
General Street Funds TotalAssetsCash 5,052,620$ 145,376$ 2,332,484$ 7,530,480$ Receivables
Taxes 67,007 - - 67,007 Customers 60,011 - 230,110 290,121 Special assessments 47,781 - 198,677 246,458
Due from other units of government 305,254 130,715 47,165 483,134 Due from other funds 40,574 - 200 40,774 Inventories 25,044 - - 25,044 Prepaid items 87,609 - - 87,609
Total assets 5,685,900$ 276,091$ 2,808,636$ 8,770,627$
LiabilitiesAccounts payable 238,654$ 30,867$ 146,501$ 416,022$ Accrued and other liabilities 130,978 10,073 27,160 168,211 Due to other funds - - 149,753 149,753 Due to other units of government 42,467 - - 42,467 Due to individuals and agencies 3,220 - - 3,220 Deposits payable 566,376 - - 566,376 Unearned revenue - - 16,310 16,310
Total liabilities 981,695 40,940 339,724 1,362,359
Deferred Inflows of ResourcesUnavailable revenue 72,615 - 198,677 271,292
Fund BalancesNon-spendable 112,653 - - 112,653 Restricted - 235,151 295,678 530,829 Committed - - 1,974,557 1,974,557 Unassigned 4,518,937 - - 4,518,937
Total fund balances 4,631,590 235,151 2,270,235 7,136,976
Total liabilities, deferred inflows of resources, and fund balances 5,685,900$ 276,091$ 2,808,636$ 8,770,627$
City of FentonGovernmental Funds
Balance SheetJune 30, 2020
See Accompanying Notes to the Financial Statements4 - 4
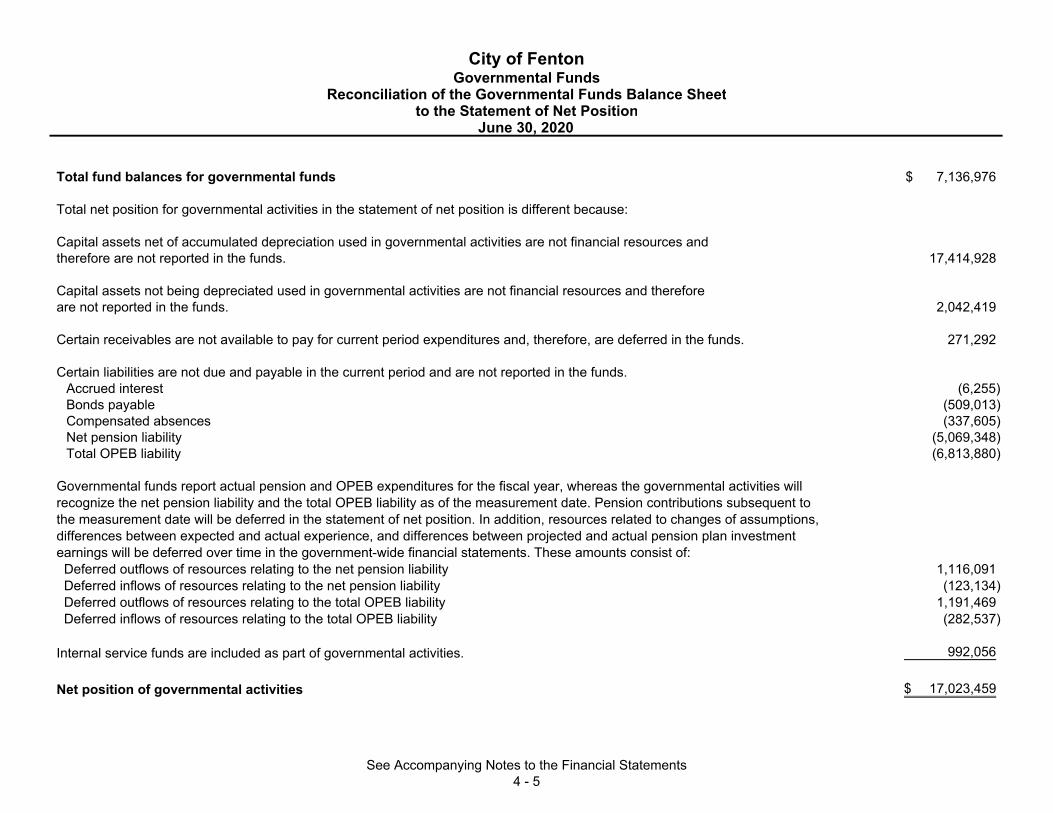
Total fund balances for governmental funds 7,136,976$
Total net position for governmental activities in the statement of net position is different because:
Capital assets net of accumulated depreciation used in governmental activities are not financial resources and therefore are not reported in the funds. 17,414,928
Capital assets not being depreciated used in governmental activities are not financial resources and therefore are not reported in the funds. 2,042,419
Certain receivables are not available to pay for current period expenditures and, therefore, are deferred in the funds. 271,292
Certain liabilities are not due and payable in the current period and are not reported in the funds. Accrued interest (6,255) Bonds payable (509,013) Compensated absences (337,605) Net pension liability (5,069,348) Total OPEB liability (6,813,880)
Governmental funds report actual pension and OPEB expenditures for the fiscal year, whereas the governmental activities willrecognize the net pension liability and the total OPEB liability as of the measurement date. Pension contributions subsequent tothe measurement date will be deferred in the statement of net position. In addition, resources related to changes of assumptions,differences between expected and actual experience, and differences between projected and actual pension plan investmentearnings will be deferred over time in the government-wide financial statements. These amounts consist of: Deferred outflows of resources relating to the net pension liability 1,116,091 Deferred inflows of resources relating to the net pension liability (123,134) Deferred outflows of resources relating to the total OPEB liability 1,191,469 Deferred inflows of resources relating to the total OPEB liability (282,537)
Internal service funds are included as part of governmental activities. 992,056
Net position of governmental activities 17,023,459$
City of Fenton
Reconciliation of the Governmental Funds Balance Sheetto the Statement of Net Position
June 30, 2020
Governmental Funds
See Accompanying Notes to the Financial Statements4 - 5
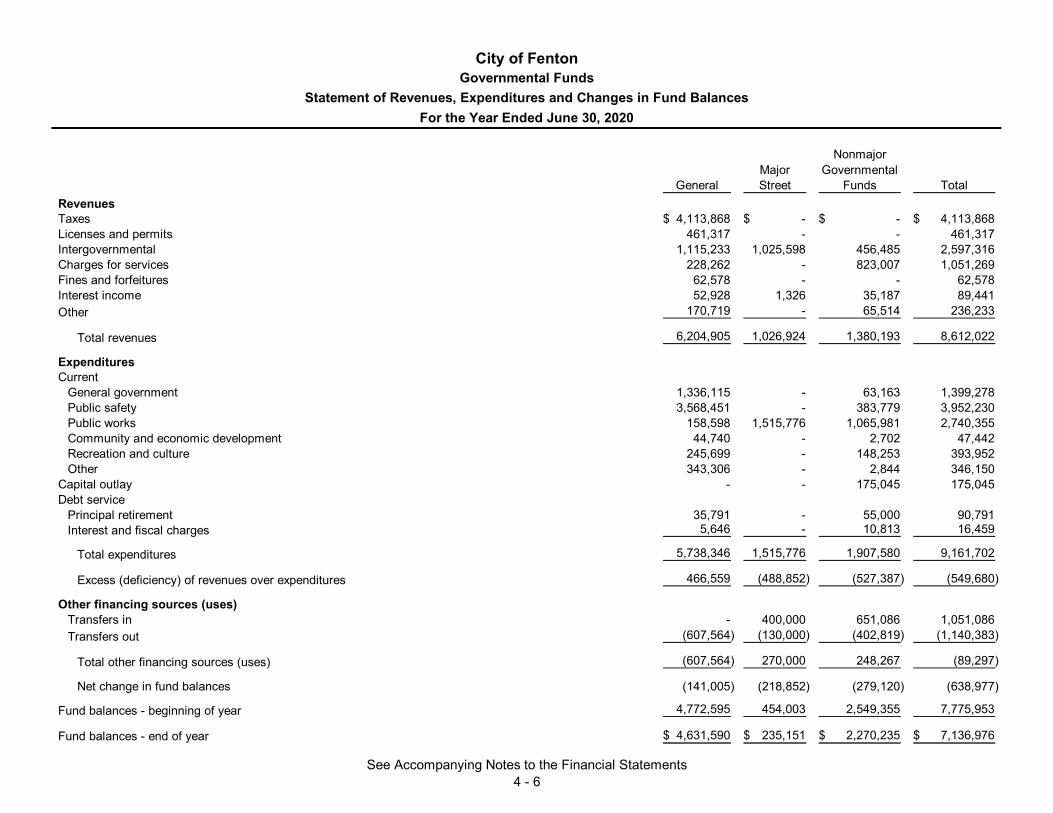
NonmajorMajor Governmental
General Street Funds TotalRevenuesTaxes 4,113,868$ -$ -$ 4,113,868$ Licenses and permits 461,317 - - 461,317 Intergovernmental 1,115,233 1,025,598 456,485 2,597,316 Charges for services 228,262 - 823,007 1,051,269 Fines and forfeitures 62,578 - - 62,578 Interest income 52,928 1,326 35,187 89,441 Other 170,719 - 65,514 236,233
Total revenues 6,204,905 1,026,924 1,380,193 8,612,022
ExpendituresCurrent
General government 1,336,115 - 63,163 1,399,278 Public safety 3,568,451 - 383,779 3,952,230 Public works 158,598 1,515,776 1,065,981 2,740,355 Community and economic development 44,740 - 2,702 47,442 Recreation and culture 245,699 - 148,253 393,952 Other 343,306 - 2,844 346,150
Capital outlay - - 175,045 175,045 Debt service
Principal retirement 35,791 - 55,000 90,791 Interest and fiscal charges 5,646 - 10,813 16,459
Total expenditures 5,738,346 1,515,776 1,907,580 9,161,702
Excess (deficiency) of revenues over expenditures 466,559 (488,852) (527,387) (549,680)
Other financing sources (uses)Transfers in - 400,000 651,086 1,051,086 Transfers out (607,564) (130,000) (402,819) (1,140,383)
Total other financing sources (uses) (607,564) 270,000 248,267 (89,297)
Net change in fund balances (141,005) (218,852) (279,120) (638,977)
Fund balances - beginning of year 4,772,595 454,003 2,549,355 7,775,953
Fund balances - end of year 4,631,590$ 235,151$ 2,270,235$ 7,136,976$
City of FentonGovernmental Funds
Statement of Revenues, Expenditures and Changes in Fund BalancesFor the Year Ended June 30, 2020
See Accompanying Notes to the Financial Statements4 - 6
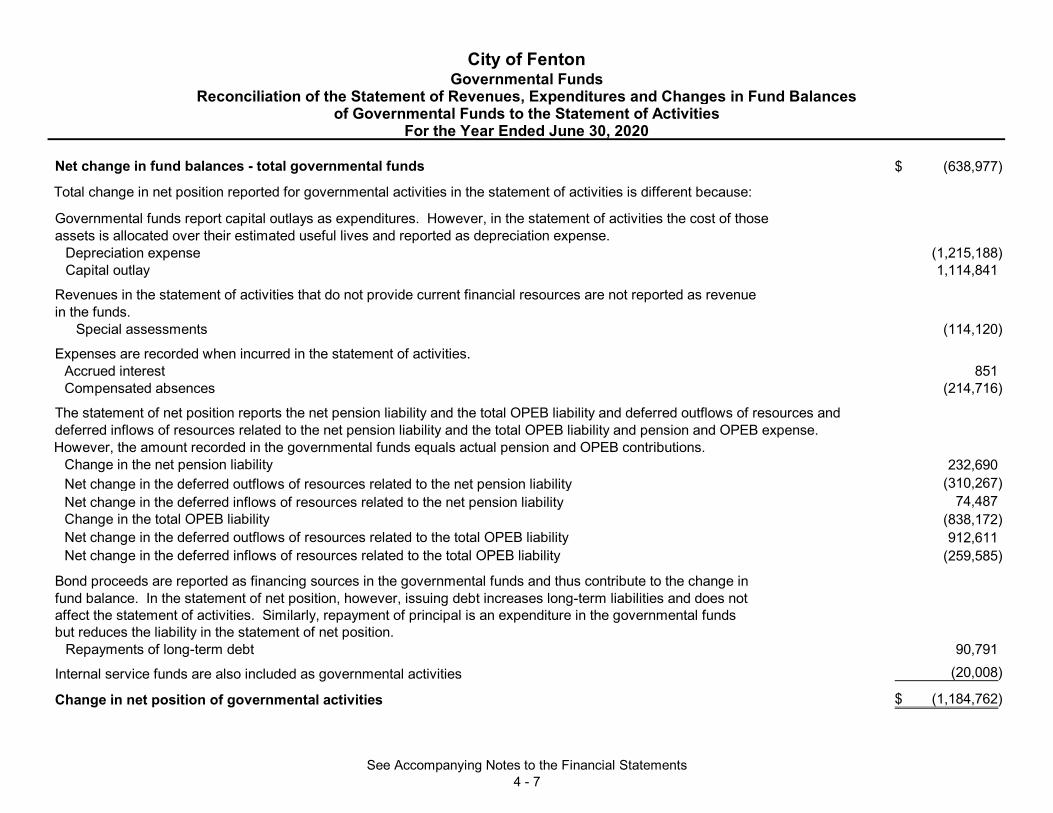
Net change in fund balances - total governmental funds (638,977)$
Governmental funds report capital outlays as expenditures. However, in the statement of activities the cost of those assets is allocated over their estimated useful lives and reported as depreciation expense.
Depreciation expense (1,215,188) Capital outlay 1,114,841
Revenues in the statement of activities that do not provide current financial resources are not reported as revenuein the funds.
Special assessments (114,120)
Expenses are recorded when incurred in the statement of activities. Accrued interest 851 Compensated absences (214,716)
The statement of net position reports the net pension liability and the total OPEB liability and deferred outflows of resources and deferred inflows of resources related to the net pension liability and the total OPEB liability and pension and OPEB expense.
However, the amount recorded in the governmental funds equals actual pension and OPEB contributions. Change in the net pension liability 232,690 Net change in the deferred outflows of resources related to the net pension liability (310,267) Net change in the deferred inflows of resources related to the net pension liability 74,487 Change in the total OPEB liability (838,172) Net change in the deferred outflows of resources related to the total OPEB liability 912,611 Net change in the deferred inflows of resources related to the total OPEB liability (259,585)
Bond proceeds are reported as financing sources in the governmental funds and thus contribute to the change infund balance. In the statement of net position, however, issuing debt increases long-term liabilities and does notaffect the statement of activities. Similarly, repayment of principal is an expenditure in the governmental funds but reduces the liability in the statement of net position.
Repayments of long-term debt 90,791
Internal service funds are also included as governmental activities (20,008)
Change in net position of governmental activities (1,184,762)$
Total change in net position reported for governmental activities in the statement of activities is different because:
For the Year Ended June 30, 2020
City of FentonGovernmental Funds
Reconciliation of the Statement of Revenues, Expenditures and Changes in Fund Balancesof Governmental Funds to the Statement of Activities
See Accompanying Notes to the Financial Statements4 - 7

InternalSewer Water Total Service Funds
AssetsCurrent assets
Cash 2,602,514$ 898,908$ 3,501,422$ 787,573$ Cash - restricted - 519,555 519,555 - Receivables 837,309 953,430 1,790,739 - Due from other funds 108,373 17,088 125,461 656 Inventories - 43,876 43,876 -
Total current assets 3,548,196 2,432,857 5,981,053 788,229
Noncurrent assetsCapital assets, net of accumulated depreciation 16,890,949 12,990,269 29,881,218 521,751 Capital assets not being depreciated 157,803 33,127 190,930 -
Total noncurrent assets 17,048,752 13,023,396 30,072,148 521,751
Total assets 20,596,948 15,456,253 36,053,201 1,309,980
Deferred Outflows of ResourcesDeferred amount relating to the net pension liability 56,722 239,114 295,836 - Deferred amount relating to the total OPEB liability 13,590 153,928 167,518 - Deferred amount relating to bond refunding - 34,879 34,879 -
Total deferred outflows of resources 70,312 427,921 498,233 -
Enterprise Funds
City of FentonProprietary Funds
Statement of Net PositionJune 30, 2020
See Accompanying Notes to the Financial Statements4 - 8
InternalSewer Water Total Service Funds
Enterprise Funds
City of FentonProprietary Funds
Statement of Net PositionJune 30, 2020
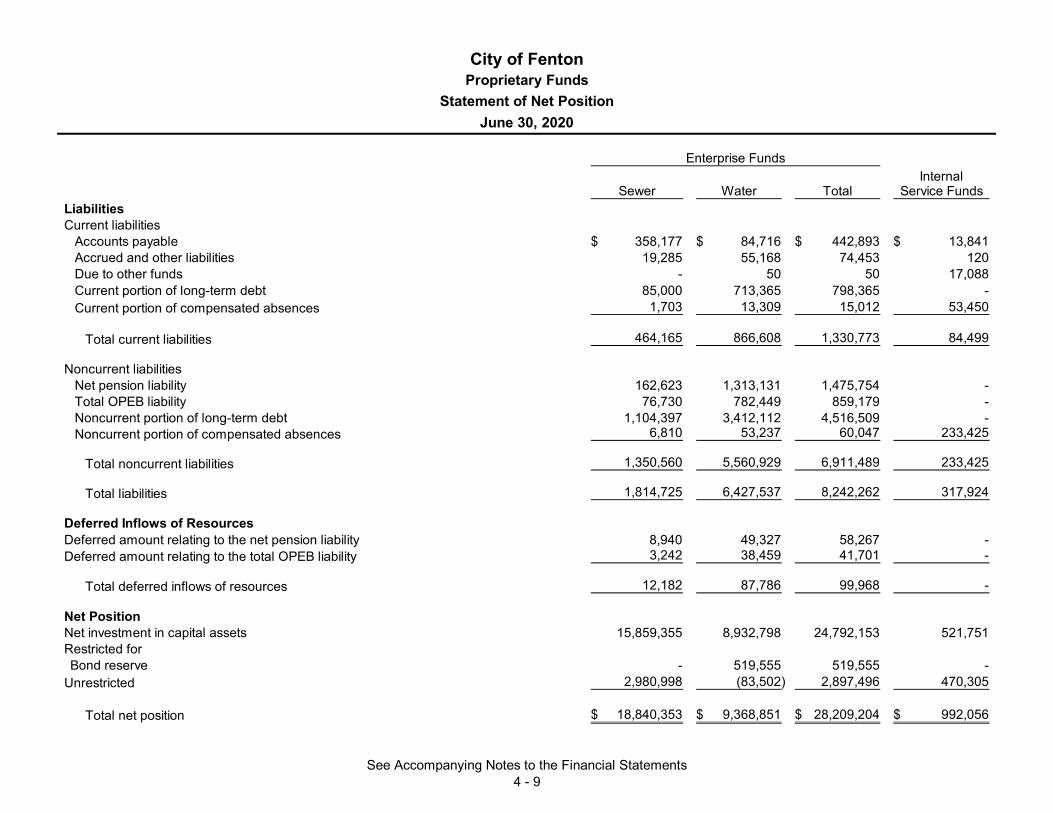
LiabilitiesCurrent liabilities
Accounts payable 358,177$ 84,716$ 442,893$ 13,841$ Accrued and other liabilities 19,285 55,168 74,453 120 Due to other funds - 50 50 17,088 Current portion of long-term debt 85,000 713,365 798,365 - Current portion of compensated absences 1,703 13,309 15,012 53,450
Total current liabilities 464,165 866,608 1,330,773 84,499
Noncurrent liabilitiesNet pension liability 162,623 1,313,131 1,475,754 - Total OPEB liability 76,730 782,449 859,179 - Noncurrent portion of long-term debt 1,104,397 3,412,112 4,516,509 - Noncurrent portion of compensated absences 6,810 53,237 60,047 233,425
Total noncurrent liabilities 1,350,560 5,560,929 6,911,489 233,425
Total liabilities 1,814,725 6,427,537 8,242,262 317,924
Deferred Inflows of ResourcesDeferred amount relating to the net pension liability 8,940 49,327 58,267 - Deferred amount relating to the total OPEB liability 3,242 38,459 41,701 -
Total deferred inflows of resources 12,182 87,786 99,968 -
Net PositionNet investment in capital assets 15,859,355 8,932,798 24,792,153 521,751 Restricted for Bond reserve - 519,555 519,555 -
Unrestricted 2,980,998 (83,502) 2,897,496 470,305
Total net position 18,840,353$ 9,368,851$ 28,209,204$ 992,056$
See Accompanying Notes to the Financial Statements4 - 9

InternalSewer Water Total Service Funds
Operating revenueCustomer fees 2,379,369$ 2,781,064$ 5,160,433$ -$ Billings to other funds - - - 543,551 Connection fees 180,400 147,825 328,225 - Other revenue 28,287 34,387 62,674 33,020
Total operating revenue 2,588,056 2,963,276 5,551,332 576,571
Operating expensesPersonnel services 1,036,763 1,372,133 2,408,896 46,093 Supplies 32,943 606,752 639,695 128,892 Professional services 1,326,438 9,383 1,335,821 - Utilities 13,401 137,749 151,150 38,730 Repairs and maintenance 448 59,561 60,009 113,418 Other expenses 174,808 138,210 313,018 226,935 Depreciation 581,937 572,931 1,154,868 150,180
Total operating expenses 3,166,738 2,896,719 6,063,457 704,248
Operating income (loss) (578,682) 66,557 (512,125) (127,677)
Enterprise Funds
City of FentonProprietary Funds
Statement of Revenues, Expenses and Changes in Net PositionFor the Year Ended June 30, 2020
See Accompanying Notes to the Financial Statements4 - 10

InternalSewer Water Total Service Funds
Enterprise Funds
City of FentonProprietary Funds
Statement of Revenues, Expenses and Changes in Net PositionFor the Year Ended June 30, 2020
Nonoperating revenue (expenses)State grants 316,443$ 14,081$ 330,524$ -$ Interest income 20,162 74,726 94,888 4,268 Gain on sale of assets - 17,088 17,088 14,104 Interest expense (30,624) (196,567) (227,191) -
Total nonoperating revenues (expenses) 305,981 (90,672) 215,309 18,372
Loss before other financing sources (uses) (272,701) (24,115) (296,816) (109,305)
Other financing sources (uses)Bond issuance costs - (65,598) (65,598) - Transfers in - - - 89,297
Total other financing sources (uses) - (65,598) (65,598) 89,297
Change in net position (272,701) (89,713) (362,414) (20,008)
Net position - beginning of year 19,113,054 9,458,564 28,571,618 1,012,064
Net position - end of year 18,840,353$ 9,368,851$ 28,209,204$ 992,056$
See Accompanying Notes to the Financial Statements4 - 11

GovernmentalActivitiesInternal
Sewer Water Total Service FundsCash flows from operating activitiesReceipts from customers 2,606,822$ 3,015,099$ 5,621,921$ -$ Receipts from interfund users - - - 669,057 Payments to other funds (102) (17,768) (17,870) - Payments to suppliers (1,583,593) (1,088,806) (2,672,399) (436,106) Payments to employees (1,027,707) (1,340,525) (2,368,232) (167,534)
Net cash provided (used) by operating activities (4,580) 568,000 563,420 65,417
Cash flows from capital and related financing activitiesProceeds from sale of bonds and notes - 2,370,477 2,370,477 - Capital grant 316,443 14,081 330,524 - Purchases/construction of capital assets (437,583) - (437,583) (260,500) Principal and interest paid on long-term debt (115,624) (3,197,165) (3,312,789) - Proceeds from sale of capital assets - 17,088 17,088 18,589
Net cash used by capital and related financing activities (236,764) (795,519) (1,032,283) (241,911)
Cash flows from investing activitiesInterest received 20,162 74,726 94,888 4,268
Net change in cash (221,182) (152,793) (373,975) (82,929)
Cash - beginning of year 2,823,696 1,571,256 4,394,952 870,502
Cash - end of year 2,602,514$ 1,418,463$ 4,020,977$ 787,573$
Reconciliation to the statement of net positionCash 2,602,514$ 898,908$ 3,501,422$ 787,573$ Cash - restricted - 519,555 519,555 -
Cash - end of year 2,602,514$ 1,418,463$ 4,020,977$ 787,573$
Enterprise Funds
City of FentonProprietary Funds
Statement of Cash FlowsFor the Year Ended June 30, 2020
See Accompanying Notes to the Financial Statements4 - 12

GovernmentalActivitiesInternal
Sewer Water Total Service Funds
Enterprise Funds
City of FentonProprietary Funds
Statement of Cash FlowsFor the Year Ended June 30, 2020
Reconciliation of operating income (loss) to net cash provided (used) by operating activities
Operating income (loss) (578,682)$ 66,557$ (512,125)$ (127,677)$ Adjustments to reconcile operating income (loss) to net cash
provided by operating activities Depreciation expense 581,937 572,931 1,154,868 150,180
Changes in assets and liabilities Receivables 18,766 51,823 70,589 - Due from other funds - (17,088) (17,088) 607 Prepaid items 1,448 24,915 26,363 - Deferred outflows of resources (6,547) (97,161) (103,708) - Accounts payable (36,981) (154,814) (191,795) (49,062) Accrued and other liabilities (22) (7,252) (7,274) (510) Due to other funds (102) (680) (782) 17,088 Deferred inflows of resources 2,037 20,538 22,575 - Net pension liability (2,958) (47,694) (50,652) - Total OPEB liability 9,634 115,610 125,244 - Compensated absences 6,890 40,315 47,205 74,791
Net cash provided (used) by operating activities (4,580)$ 568,000$ 563,420$ 65,417$
See Accompanying Notes to the Financial Statements4 - 13
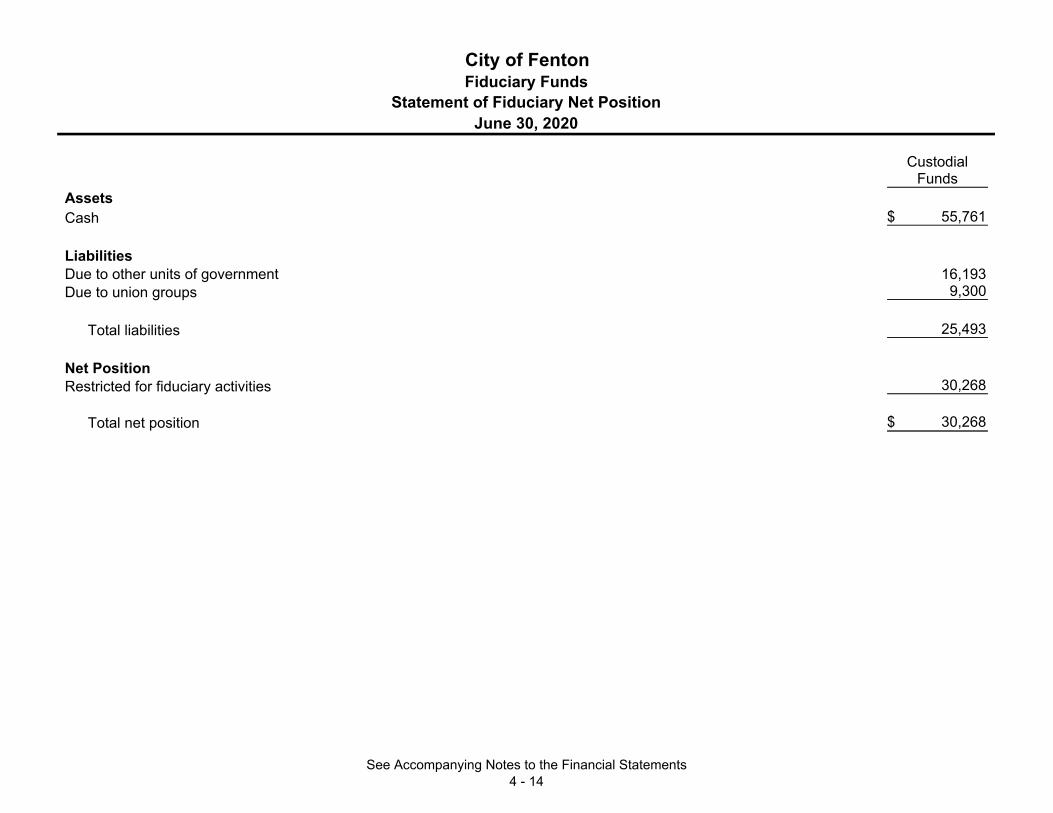
CustodialFunds
AssetsCash 55,761$
LiabilitiesDue to other units of government 16,193 Due to union groups 9,300
Total liabilities 25,493
Net PositionRestricted for fiduciary activities 30,268
Total net position 30,268$
City of FentonFiduciary Funds
Statement of Fiduciary Net PositionJune 30, 2020
See Accompanying Notes to the Financial Statements4 - 14

CustodialFunds
AdditionsProperty tax collections for other governments 20,178,232$ Miscellaneous 10,101
Total additions 20,188,333
DeductionsPayments of property tax to other governments 20,178,232
Change in net position 10,101
Net position - beginning of year 20,167
Net position - end of year 30,268$
City of FentonFiduciary Funds
Statement of Changes in Fiduciary Net PositionJune 30, 2020
See Accompanying Notes to the Financial Statements4 - 15

LocalDowntown Development Brownfield
Development Finance RedevelopmentAuthority Authority Authority Total
AssetsCurrent assets
Cash 1,796,756$ 1,489,343$ 175,804$ 3,461,903$ Receivables Customers 36,000 - - 36,000 Accrued interest and other 6,295 108 - 6,403
Total current assets 1,839,051 1,489,451 175,804 3,504,306
Noncurrent assetsCapital assets not being depreciated 425,000 - - 425,000 Capital assets, net of accumulated depreciation 5,018 6,272 - 11,290
Total noncurrent assets 430,018 6,272 - 436,290
Total assets 2,269,069 1,495,723 175,804 3,940,596
Deferred Outflows of ResourcesDeferred charges on refunding of bonds 8,722 - - 8,722
LiabilitiesCurrent liabilities
Accounts payable 15,303 4,077 - 19,380 Accrued and other liabilities 37,981 607 - 38,588 Due to other units of government 622 154 - 776 Debt due within one year 691,000 - - 691,000
Total current liabilities 744,906 4,838 - 749,744
Noncurrent liabilitiesDebt due in more than one year 3,618,243 - - 3,618,243
Total liabilities 4,363,149 4,838 - 4,367,987
Net PositionNet investment in capital assets 430,018 6,272 - 436,290 Unrestricted (2,515,376) 1,484,613 175,804 (854,959)
Total net position (2,085,358)$ 1,490,885$ 175,804$ (418,669)$
City of Fenton
Combining Statement of Net PositionJune 30, 2020
Component Units
See Accompanying Notes to the Financial Statements4 - 16

LocalDowntown Development Brownfield
Development Finance RedevelopmentExpenses Authority Authority Authority Total
Downtown Development AuthorityCommunity and economic development 725,334$ (725,334)$ -$ -$ (725,334)$
Local Development Finance AuthorityCommunity and economic development 101,044 - (101,044) - (101,044)
Total component units 826,378$ (725,334) (101,044) - (826,378)
General revenuesProperty taxes - unrestricted 1,772,812 138,146 161,720 2,072,678 Unrestricted investment earnings 18,281 10,176 - 28,457
1,791,093 148,322 161,720 2,101,135
Change in net position 1,065,759 47,278 161,720 1,274,757 Net position - beginning of year (3,151,117) 1,443,607 14,084 (1,693,426)
Net position - end of year (2,085,358)$ 1,490,885$ 175,804$ (418,669)$
Total general revenues
City of Fenton
Statement of ActivitiesFor the Year Ended June 30, 2020
Functions/Programs
Component Units
See Accompanying Notes to the Financial Statements4 - 17

City of Fenton Notes to the Financial Statements
June 30, 2020
4 - 18
Note 1 - Summary of Significant Accounting Policies
The City of Fenton, Michigan (the City), has a population of approximately 12,000. The City is located in the southeast corner of Genesee County, bordering Livingston County to the south and Oakland County to the east. The City of Fenton, Michigan, was incorporated on January 24, 1964, under the provisions of Act 279, P.A. 1909 as amended. The City operates a council-manager form of government and provides the following services as authorized by its charter: public safety (police, fire, and inspections), highways and streets, sanitation, parks and recreation, public improvements, planning and zoning, and general administrative services. The financial statements of the City have been prepared in accordance with accounting principles generally accepted in the United States of America (GAAP) as applied to city governments. The Governmental Accounting Standards Board (GASB) is the accepted standard-setting body for establishing governmental accounting and financial reporting principles. The City’s more significant accounting policies are described below. Reporting entity As required by accounting principles generally accepted in the United States of America, these financial statements present the financial activities of the City (primary government) and its component units, entities for which the government is considered to be financially accountable. Blended component units, although legally separate entities are, in substance, part of the government’s operations and so data from these units are combined with data of the primary government. Discretely presented component units, on the other hand, are reported in a separate column in the financial statements to emphasize that they are legally separate from the primary government. All component units are included in the City’s audited financial statements and are not audited separately.
Blended Component Unit The City of Fenton’s Building Authority is governed by a board appointed by the City of Fenton’s governing body. Although it is legally separate from the City, the Building Authority is reported as if it were part of the primary government because its sole purpose is to finance and construct the City of Fenton’s public buildings. The Building Authority had no activity in 2020. Discretely Presented Component Units The component unit column in the government-wide financial statements include the financial data of the City’s three discretely presented component units. These units are reported in a separate column to emphasize that they are legally separate from the City. Separate financial statements are not issued. Downtown Development Authority - A majority of the members of the governing board of the Downtown Development Authority are appointed by the City Council. The budgets and expenditures of the Downtown Development Authority must be approved by the City Council. The City also has the ability to significantly influence operations of the Downtown Development Authority. Local Development Finance Authority - A majority of the members of the governing board of the Local Development Finance Authority are appointed by the City Council. The budgets and expenditures are approved by the City. The City also has the ability to significantly influence operations of the Local Development Finance Authority. Brownfield Redevelopment Authority - A majority of the members of the governing board of the Brownfield Redevelopment Authority are appointed by the City Council. The budgets and expenditures are approved by the City. The City also has the ability to significantly influence operations of the Brownfield Redevelopment Authority.

City of Fenton Notes to the Financial Statements
June 30, 2020
4 - 19
Basis of Presentation Government-wide and fund financial statements The statement of net position and the statement of activities (the government-wide financial statements) present information for the primary government and its component units as a whole. All nonfiduciary activities of the primary government are included (i.e., fiduciary fund activities are not included in the government-wide financial statements). For the most part, interfund activity has been eliminated in the preparation of these statements, but interfund services provided and used are not eliminated in the process of consolidation. Governmental activities, which normally are supported by taxes and intergovernmental revenues, are reported separately from business-type activities, which rely to a significant extent on fees and charges for support. The statement of activities presents the direct functional expenses of the primary government and its component units and the program revenues that support them. Direct expenses are specifically associated with a service, program, or department and are therefore clearly identifiable to a particular function. Program revenues are associated with specific functions and include charges to recipients of goods or services and grants and contributions that are restricted to meeting the operational or capital requirements of that function. Revenues that are not required to be presented as program revenues are general revenues. This includes all taxes, interest, and unrestricted State revenue sharing payments and other general revenues and shows how governmental functions are either self-financing or supported by general revenues. Fund Financial Statements The fund financial statements present the City’s individual major funds and aggregated nonmajor funds. Separate financial statements are provided for governmental funds, proprietary funds, and fiduciary funds, even though the latter are excluded from the government-wide financial statements. Major individual governmental funds and the major
individual enterprise funds are reported as separate columns in the fund financial statements. The City reports the following major governmental funds:
The General Fund is the government’s primary operating fund. It accounts for all financial resources of the general government, except those required to be accounted for in another fund. The Major Street Fund is used to account for proceeds from gas and weight taxes levied by the State and distributed to local governmental units. State law requires that these taxes be used for street maintenance and construction.
The City reports the following major proprietary funds:
The Sewer Fund is used to account for the operations required to providing sewer services to the general public, the costs (expenses, including depreciation) are financed or recovered primarily through user charges. The Water Fund is used to account for the operations required to providing water services to the general public, the costs (expenses, including depreciation) are financed or recovered primarily through user charges.
Additionally, the City reports internal service funds to account for equipment acquisition, usage, and maintenance and also financing of employee sick pay provided to other departments on a cost reimbursement basis. The City also reports custodial funds to account for collection and payment to the County, school districts, and other funds for property taxes collected on their behalf and amounts withheld from employees’ payroll related to union dues and other payments.
City of Fenton Notes to the Financial Statements
June 30, 2020
4 - 20
Measurement Focus The government-wide and proprietary fund financial statements are presented using the economic resources measurement focus, similar to that used by business enterprises or not-for-profit organizations. Because another measurement focus is used in the governmental fund financial statements, reconciliations to the government-wide financial statements are provided that explain the differences in detail. All governmental funds are presented using the current financial resources measurement focus. With this measurement focus, only current assets, deferred outflows of resources, current liabilities, and deferred inflows of resources generally are included on the balance sheet. Operating statements of these funds present increases (i.e., revenues and other financing sources) and decreases (i.e., expenditures and other financing uses) in fund balance. There is no measurement focus for the fiduciary agency funds since assets equal liabilities. Basis of Accounting Basis of accounting refers to when revenues and expenditures are recognized in the accounts and reported in the financial statements. Basis of accounting relates to the timing of the measurement made, regardless of the measurement focus applied. All governmental funds are accounted for using the modified accrual basis of accounting. Under this method, revenues are recognized when they become susceptible to accrual (when they become both “measurable” and “available to finance expenditures of the current period”). The length of time used for “available” for purposes of revenue recognition in the governmental fund financial statements is sixty (60) days. Revenues that are considered measurable but not available are recorded as a receivable and unavailable revenue. Significant revenues susceptible to accrual are special assessments and certain intergovernmental revenues. Expenditures are generally recognized under the modified accrual basis of accounting when the related fund
liability is incurred, except for interest on long-term debt which is recorded when due. Government-wide, proprietary, and agency fund financial statements are presented using the accrual basis of accounting. Their revenues (as applicable) are recognized when they are earned, and their expenses (as applicable) are recognized when they are incurred. Proprietary funds distinguish operating revenues and expenses from nonoperating items. Operating revenues and expenses generally result from providing services and producing and delivering goods in connection with a proprietary fund’s principal ongoing operations. The principal operating revenues of the proprietary funds are charges to customers for sales and services. Operating expenses for proprietary funds include the costs of sales and services, administrative expenses, and other costs of running the activity. All revenues and expenses not meeting this definition are reported as nonoperating revenues and expenses. When both restricted and unrestricted resources are available for use, it is the City’s policy to use restricted resources first, then unrestricted resources as they are needed. Budgets and Budgetary Accounting Budgets shown in the financial statements were prepared on the same modified accrual basis used to reflect actual results. The City employs the following procedures in establishing the budgetary data reflected in the financial statements:
a. Prior to the third Monday in April, the City Manager submits to the City Council a proposed operating budget for the fiscal year commencing the following July 1. The operating budget includes proposed expenditures and the means of financing them for the General and Special Revenue Funds. Informational summaries of projected revenues and expenditures are provided for all other City funds, as well as estimated total costs and proposed methods of financing all capital construction projects.

City of Fenton Notes to the Financial Statements
June 30, 2020
4 - 21
b. Public hearings are conducted to obtain taxpayer comments.
c. On or before the third Monday in May, by resolution, the budget is legally enacted on a departmental (activity) basis for the General Fund and on a total expenditure level for the Special Revenue Funds for the ensuing fiscal year in accordance with 1978 Public Act 621 of the State of Michigan. d. The City Manager, or his designee, is authorized to transfer budgeted amounts within activity appropriation accounts. However, any revisions that alter the total expenditures of any department must be approved by the City Council. e. Formal budgetary integration is employed as a management control device during the year for all budgetary funds. Also, all budgets are adopted on a basis consistent with generally accepted accounting principles. f. Budget appropriations lapse at year end. g. The original budget was amended and supplemental appropriations approved during the year, in accordance with the City charter and applicable State laws. The budget to actual expenditures in the financial statements represents the final budgeted expenditures as amended by the City. h. Encumbrance accounting, under which purchase orders, contracts, and other commitments for the expenditure of monies are recorded in order to reserve that portion of the applicable appropriation, is employed as an extension of formal budgetary integration in the governmental funds. There were no encumbrances at year end.
Cash Cash consists of checking and savings accounts and cash on hand.
Restricted cash in the business-type activities consist of certain amounts held in the City’s Water Fund which are maintained in separate bank accounts and their use is limited by applicable bond covenants. The “bond redemption” account is used to report resources set aside to make up potential future deficiencies. Receivables Receivables consist of amounts due from governmental units for various financial assistance programs, and accounts receivable related to charges for services, property taxes, and special assessments. Property Tax The City of Fenton bills and collects its own property taxes and taxes for other governmental units. The City’s property tax revenue recognition policy and related tax calendar disclosures are highlighted in the following paragraph. Property taxes are levied by the City of Fenton on July 1 and December 1 and are payable without penalty through September 15 and February 28, respectively. The July 1 levy is composed of the County’s levy, the State Education Tax assessment, school tax and the City’s millage and assessments. The December 1 levy was composed of school taxes and special county millages as well as any unpaid July 1 City levies. All real property taxes not paid to the City by March 1 are turned over to the Genesee County Treasurer for collection. Amounts assessed on any interest in real or personal property become a lien on July 1. The Genesee County Treasurer remits pay-off payments to all taxing districts on any delinquent real property taxes. Delinquent personal property taxes are retained by the City for subsequent collection. Collections and remittances of all taxes are accounted for in the Tax Collection Agency Fund. City property tax revenues are recognized as revenues in the fiscal year levied. The City is permitted by charter to levy taxes up to 13.0 mills ($13 per $1,000 of assessed valuation) for general governmental services. For the year ended June 30, 2020, the City levied 10.1847 mills per $1,000 of taxable valuation for general governmental services. The total

City of Fenton Notes to the Financial Statements
June 30, 2020
4 - 22
taxable value for the 2019 levy for property within the City was approximately $439,075,000. Inventories Inventories are valued at cost for governmental funds and the lower of cost or market in the proprietary funds, using the first-in/first-out (FIFO) method. Inventories in the governmental funds and the proprietary funds consist of sign inventories and other expendable supplies held for consumption and water supplies, respectively. The cost is recorded as an expenditure/expense at the time individual inventory items are consumed. Prepaid Items Prepaid expenditures in the governmental funds, such as insurance premiums, which are expected to be written off within the next fiscal year, are included in net current assets. Reported prepaid expenditures are equally offset by nonspendable fund balance which indicates they do not constitute “available spendable resources” even though they are a component of fund balance. The consumption method is used to account for prepaid expenditures. Capital Assets Capital assets, which include land, construction in progress, buildings, building and land improvements, machinery, vehicles, and equipment, infrastructure assets (e.g., roads, lights, and bridges), and sewer and water lines and are reported in the applicable governmental or business-type activities and component units columns in the government-wide financial statements. Capital assets are defined by the government as assets with an initial, individual cost of more than $5,000 (amount not rounded) and an estimated useful life in excess of two (2) years. Such assets are recorded at historical cost or estimated historical cost if purchased or constructed. Donated capital assets are recorded at acquisition value on the date of donation. The costs of normal maintenance and repairs that do not add to the value of the asset or materially extend asset lives are not capitalized.
Depreciation is computed using the straight-line method over the following useful lives:
Buildings 20 to 40 yearsBuilding improvements 5 to 20 yearsMachinery, vehicles, and equipment 3 to 10 yearsRoads, lights, and bridges 10 to 20 yearsSewer and water lines 40 to 100 years
Compensated Absences Accumulated unpaid sick pay – Substantially all City employees are paid for unused sick days upon termination of employment. Accumulated vested unpaid sick pay at June 30, 2020, is recorded in the financial statements of the City as follows: Governmental fund types - As a current year expenditure. The City records an operating transfer from the General Fund to the Sick Pay Internal Service Fund for any unpaid sick pay owing to employees at year end. The entire liability is funded in the year in which it has been incurred. Proprietary fund type – Accrued as a liability and expensed as incurred. Accumulated unpaid vacation pay – All employees may carry over from year to year a maximum of one-half of the unused vacation days earned in the current year. Upon involuntary termination of employment, no payment will be made to an employee for any unused accumulated vacation days. However, upon voluntary termination with notice, an employee may receive payment for any unused accumulated vacation days. At June 30, 2020, the unused vacation days are recorded in the government-wide financial statements of the City. Long-Term Obligations Long-term debt and other long-term obligations are recognized as a liability in the government-wide financial statements and proprietary fund types when incurred. The portion of those liabilities expected to be paid within the next year is a current liability with the remaining amounts shown as long-term.
City of Fenton Notes to the Financial Statements
June 30, 2020
4 - 23
Long-term debt is recognized as a liability of a governmental fund when due or when resources have been accumulated for payment early in the following year. For other long-term obligations, only that portion expected to be financed from expendable available financial resources is reported as a fund liability of a governmental fund. Unearned Revenue Governmental funds defer revenue recognition in connection with resources that have been received but not yet earned. Government-wide financial statements also report unearned revenue for amounts received but not yet earned. Deferred Outflows/Inflows of Resources In addition to assets, the statement of net position and balance sheet will sometimes report a separate section for deferred outflows of resources. This separate financial statement element, deferred outflows of resources, represents a consumption of net position/fund balance that applies to a future period and will not be recognized as an outflow of resources (expense/expenditure) until then. In the current year, the deferred outflows of resources related to the City’s net pension liability and the total OPEB liability and are related to changes in actuarial assumptions and experience differences, and contributions made subsequent to the measurement date. This amount will be amortized over the next four years and included in pension and OPEB expense. Changes in assumptions and experience differences relating to the net pension liability are deferred and amortized over the expected remaining services lives of the employees and retirees in the plan. The deferred outflows of resources also relate to deferred amounts on bond refundings. These amounts are deferred and recognized as an outflow of resources in the period to which they apply. In addition to liabilities, the statement of net position and balance sheet will sometimes report a separate section for deferred inflows of resources. This separate financial statement element, deferred inflows of resources, represents an acquisition of net position/fund balance that applies to a future period and will not be recognized as an inflow of resources (revenue) until that time. In the current year, the deferred
inflows of resources are related to differences in assumption and experience and between projected and actual pension plan investment earnings, differences in assumptions related to the total OPEB liability, as well as unavailable revenue in connection with receivables for revenue that is not considered available to liquidate liabilities of the current period. This amount will be amortized over the next four years and included in pension and OPEB expense. Changes in assumptions and experience differences relating to the net pension liability and the total OPEB liability are deferred and amortized over the expected remaining services lives of the employees and retirees in the plan. Interfund Transactions During the course of normal operations, the City has numerous transactions between funds, including expenditures and transfers of resources to provide services, construct assets, and service debt. The accompanying financial statements generally reflect such transactions as transfers. Transfers between governmental or proprietary funds are netted as part of the reconciliation to the government-wide financial statements. The (Equipment) Internal Service Fund records charges for services provided to various City departments and funds as operating revenue. All City funds record these payments as operating expenditures/expenses. Restricted Net Position The funding source or some other outside source which precludes their use for unrestricted purposes. Use of Estimates In preparing financial statements in conformity with accounting principles generally accepted in the United States of America, management is required to make estimates and assumptions that affect the reported amounts of assets and liabilities, the disclosure of contingent assets and liabilities at the date of the financial statements, and the reported amounts of revenues and expenditures during the reporting period. Actual results could differ from those estimates.

City of Fenton Notes to the Financial Statements
June 30, 2020
4 - 24
Adoption of New Accounting Standards Statement No. 84, Fiduciary Activities improves the guidance regarding the identification of fiduciary activities for accounting and financial reporting purposes and how those activities should be reported. The focus of the criteria includes the following: (1) is the government controlling the assets of the fiduciary activity and (2) the beneficiaries with whom a fiduciary relationship exists. The four fiduciary funds that should be reported, if applicable: (1) pension (and other employee benefit) trust funds, (2) investment trust funds, (3) private-purpose trust funds, and (4) custodial funds. Custodial funds generally will report fiduciary activities that are not held in a trust or similar arrangement that meets specific criteria.
Statement No. 95, Postponement of the Effective Dates of Certain Authoritative Guidance provides temporary relief to governments and other stakeholders in light of the COVID-19 pandemic and provides postponement of effective dates for certain GASB Statements. This statement was effective upon issuance in May of 2020. Upcoming Accounting and Reporting Changes In addition, the Governmental Accounting Standards Board has released the following Statements. Statement No. 87, Leases increases the usefulness of the financial statements by requiring recognition of certain lease assets and liabilities for leases that previously were classified as operating leases and recognized as inflows of resources or outflows of resources based on the payment provisions of the contract. It establishes a single model for lease accounting based on the foundational principle that leases are financings of the right to use an underlying asset. A lessee will be required to recognize a lease liability and an intangible right-to-use a lease asset, and a lessor will be required to recognize a lease receivable and a deferred inflow of resources, thereby enhancing the relevance and consistency of information about leasing activities. The requirements of this Statement are effective for the fiscal year ending June 30, 2022.
The City is evaluating the impact that the above GASB Statement will have on its financial reporting.
Note 2 - Cash
In accordance with Michigan Compiled Laws, the City is authorized to invest in the following investment vehicles:
a. Bonds, securities, and other obligations of the United States or an agency or instrumentality of the United States.
b. Certificates of deposit, savings accounts, deposit accounts, or depository receipts of a State or nationally chartered bank or a State or Federally chartered savings and loan association, savings bank, or credit union whose deposits are insured by an agency of the United Sates government and which maintains a principal office or branch office located in this State under the laws of this State or the United States, but only if the bank, savings and loan association, savings bank or credit union is eligible to be a depository of surplus funds belonging to the State under Section 6 of 1855 PA 105, MCL 21.146.
c. Commercial paper rated at the time of purchase within the three (3) highest classifications established by not less than two (2) standard rating services and which matures not more than 270 days after the date of purchase.
d. The United States government or federal agency obligations repurchase agreements.
e. Bankers’ acceptances of United States banks.
f. Mutual funds composed of investment vehicles which are legal
for direct investment by local units of government in Michigan.

City of Fenton Notes to the Financial Statements
June 30, 2020
4 - 25
Deposits As of June 30, 2020, the carrying amounts for each type of bank account are as follows:
Primary Government
Fiduciary Funds
Component Units Total
Bank deposits 10,838,136$ 55,761$ 3,461,903$ 14,355,800$
Certificates of deposit 1,500,724 - - 1,500,724
Petty cash 170 - - 170
12,339,030$ 55,761$ 3,461,903$ 15,856,694$
Credit Risk State law limits investments in certain types of investments to a prime or better rating issued by nationally recognized statistical rating organizations (NRSRO’s). The City has not adopted a policy that indicates how the City will minimize credit risk if, or when, the City has investments that are subject to this type of risk. As of June 30, 2020, the City did not have any investments that would be subject to rating. Interest Rate Risk The City has not adopted a policy that indicates how it will minimize interest rate risk, which is the risk that the market value of securities in the portfolio will fall due to changes in market interest rates, by limiting the weighted average maturity of its investment portfolio to less than a given period of time if/when the City has investments that are subject to this type of risk. Concentration of Credit Risk The City has not adopted a policy that indicates how it will minimize concentration of credit risk, which is the risk of loss attributed to the magnitude of an investment in a single issuer, by diversifying the investment portfolio so that the impact of potential losses from any one type of security or issuer will be minimized if/when the City has investments that are subject to this type of risk.
The City has not adopted a policy that indicates how the City will minimize custodial credit risk, which is the risk of loss due to the failure of the security issuer or backer. The City’s cash and investments are exposed to the custodial credit risk. Deposits of the City are at federally insured banks located in the State of Michigan with all accounts maintained in the name of the City. As of June 30, 2020, the City accounts were insured by the FDIC for $1,250,000 and the amount of $14,901,714 was uninsured and uncollateralized. The City believes that due to the dollar amounts of cash deposits and the limits of FDIC insurance, it is impractical to insure all deposits. As a result, the City evaluates each financial institution it deposits funds with and assesses the level of risk of each institution; only those institutions with an acceptable estimated risk level are used as depositories. The following summarizes the categorization of these amounts as of June 30, 2020:
Cash and Cash
Equivalents
Restricted Cash and Cash
Equivalents Total
Governmental activities 8,318,053$ -$ 8,318,053$ Business-type activities 3,501,422 519,555 4,020,977
Total 11,819,475 519,555 12,339,030
Fiduciary funds 55,761 - 55,761
Component units 3,461,903 - 3,461,903
Total 15,337,139$ 519,555$ 15,856,694$

City of Fenton Notes to the Financial Statements
June 30, 2020
4 - 26
Note 3 - Interfund Receivables, Payable, and Transfers
The amount of interfund receivables and payables at June 30, 2020, are as follows:
Receivable Fund Payable Fund Amount
General Fund Nonmajor Funds 40,574$ Sewer Fund Nonmajor Funds 108,373 Water Fund Internal Service Funds 17,088 Nonmajor Funds Nonmajor Funds 200 Internal Service Funds Nonmajor Funds 606 Internal Service Funds Sewer Fund 50
166,891$
Amounts appearing as interfund payables and receivables arise from two (2) types of transactions. One type of transaction is where a fund will pay for a good or service that at least a portion of the benefit belongs to another fund. The second type of transaction is where one fund provides a good or service to another fund. Balances at the end of the year are for transfers that have not cleared as of the balance sheet date. Permanent reallocation of resources between funds of the reporting entity is classified as interfund transfers. For the purpose of the statement of activities, interfund transfers have been eliminated.
Funds Transferred From Funds Transferred To Amount
General Fund Nonmajor Funds 518,267$ General Fund Internal Services Funds 89,297 Nonmajor Funds Nonmajor Funds 2,819 Nonmajor Funds Major Street Fund 400,000 Major Street Fund Nonmajor Funds 130,000
1,140,383$
The transfers from the General Fund to the nonmajor governmental funds were to fund current year operations. The transfer from the General Fund to Internal Services Fund was to fund the Sick Pay accrual. The nonmajor governmental funds transfer to nonmajor governmental funds was for a transfer of funds to perpetual care from the cemetery. Transfers between the nonmajor governmental funds and the Major Street Fund were to fund capital projects. There was also an $800,000 transfer between component units to fund capital projects.

City of Fenton Notes to the Financial Statements
June 30, 2020
4 - 27
Note 4 - Capital Assets
Capital assets activity of the primary government for the current year is as follows: Primary Government
Beginning EndingBalance Increases Decreases Balance
Governmental activitiesCapital assets not being depreciated
Land 1,605,104$ -$ -$ 1,605,104$ Construction-in-progress 570,195 981,809 1,114,689 437,315
Total capital assets not being depreciated 2,175,299 981,809 1,114,689 2,042,419
Capital assets being depreciatedLand improvements 660,678 326,325 - 987,003 Infrastructure 16,058,911 788,364 - 16,847,275 Buildings, additions and improvements 8,409,094 - - 8,409,094 Machinery and equipment 5,748,380 393,532 44,874 6,097,038
Total capital assets being depreciated 30,877,063 1,508,221 44,874 32,340,410
Less accumulated depreciation forLand improvements 554,399 38,072 - 592,471 Infrastructure 5,015,423 812,072 - 5,827,495 Buildings, additions and improvements 3,318,086 197,724 - 3,515,810 Machinery and equipment 4,190,844 317,500 40,389 4,467,955
Total accumulated depreciation 13,078,752 1,365,368 40,389 14,403,731
Net capital assets being depreciated 17,798,311 142,853 4,485 17,936,679
Governmental activities capital assets, net 19,973,610$ 1,124,662$ 1,119,174$ 19,979,098$
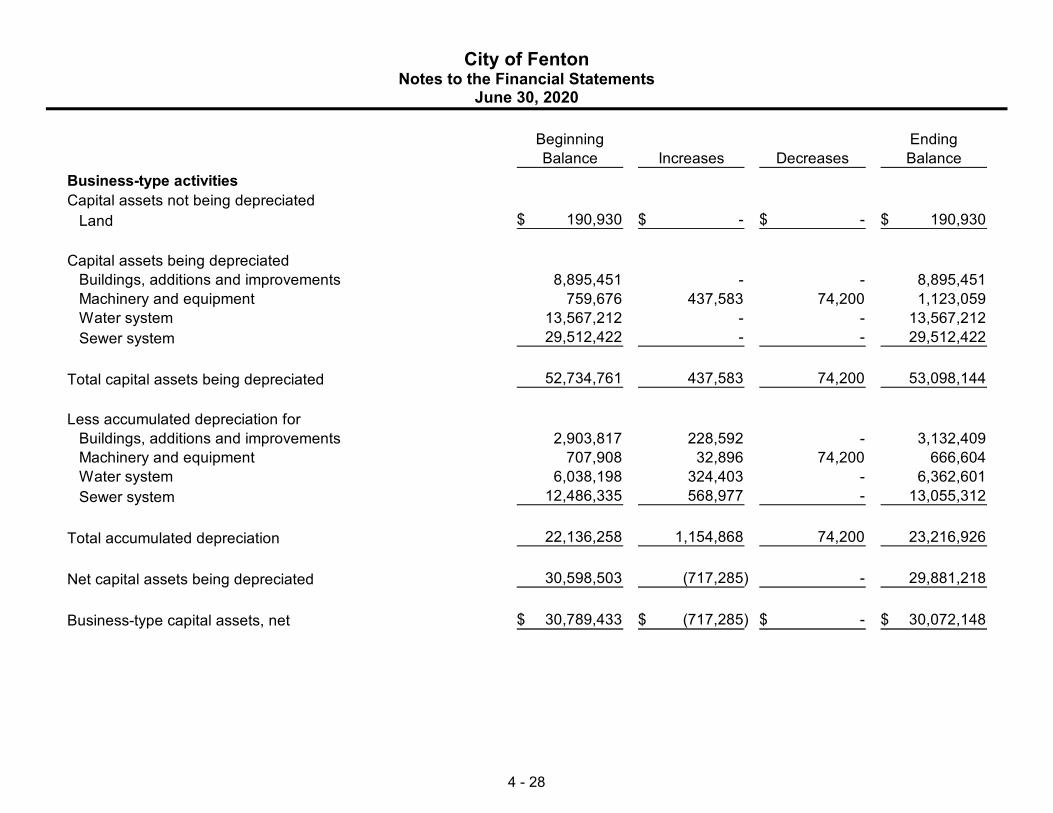
City of Fenton Notes to the Financial Statements
June 30, 2020
4 - 28
Beginning EndingBalance Increases Decreases Balance
Business-type activitiesCapital assets not being depreciated
Land 190,930$ -$ -$ 190,930$
Capital assets being depreciatedBuildings, additions and improvements 8,895,451 - - 8,895,451 Machinery and equipment 759,676 437,583 74,200 1,123,059 Water system 13,567,212 - - 13,567,212 Sewer system 29,512,422 - - 29,512,422
Total capital assets being depreciated 52,734,761 437,583 74,200 53,098,144
Less accumulated depreciation forBuildings, additions and improvements 2,903,817 228,592 - 3,132,409 Machinery and equipment 707,908 32,896 74,200 666,604 Water system 6,038,198 324,403 - 6,362,601 Sewer system 12,486,335 568,977 - 13,055,312
Total accumulated depreciation 22,136,258 1,154,868 74,200 23,216,926
Net capital assets being depreciated 30,598,503 (717,285) - 29,881,218
Business-type capital assets, net 30,789,433$ (717,285)$ -$ 30,072,148$
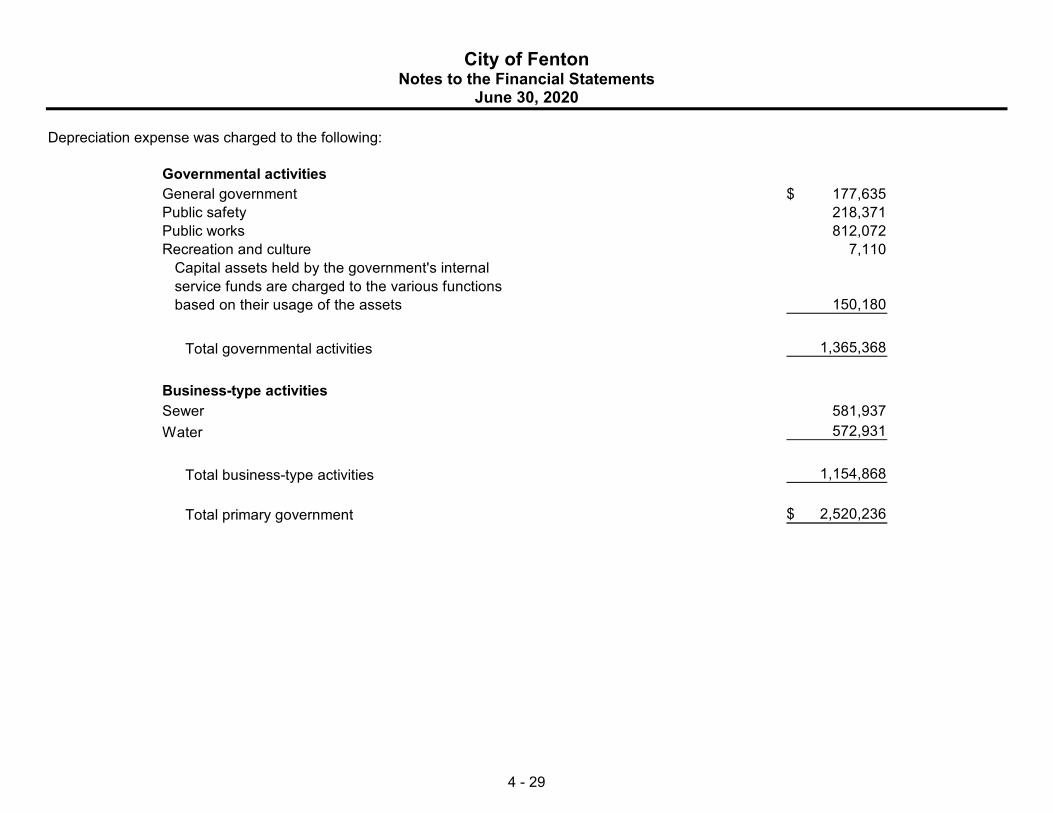
City of Fenton Notes to the Financial Statements
June 30, 2020
4 - 29
Depreciation expense was charged to the following:
Governmental activitiesGeneral government 177,635$ Public safety 218,371 Public works 812,072 Recreation and culture 7,110 Capital assets held by the government's internal service funds are charged to the various functions based on their usage of the assets 150,180
Total governmental activities 1,365,368
Business-type activitiesSewer 581,937 Water 572,931
Total business-type activities 1,154,868
Total primary government 2,520,236$
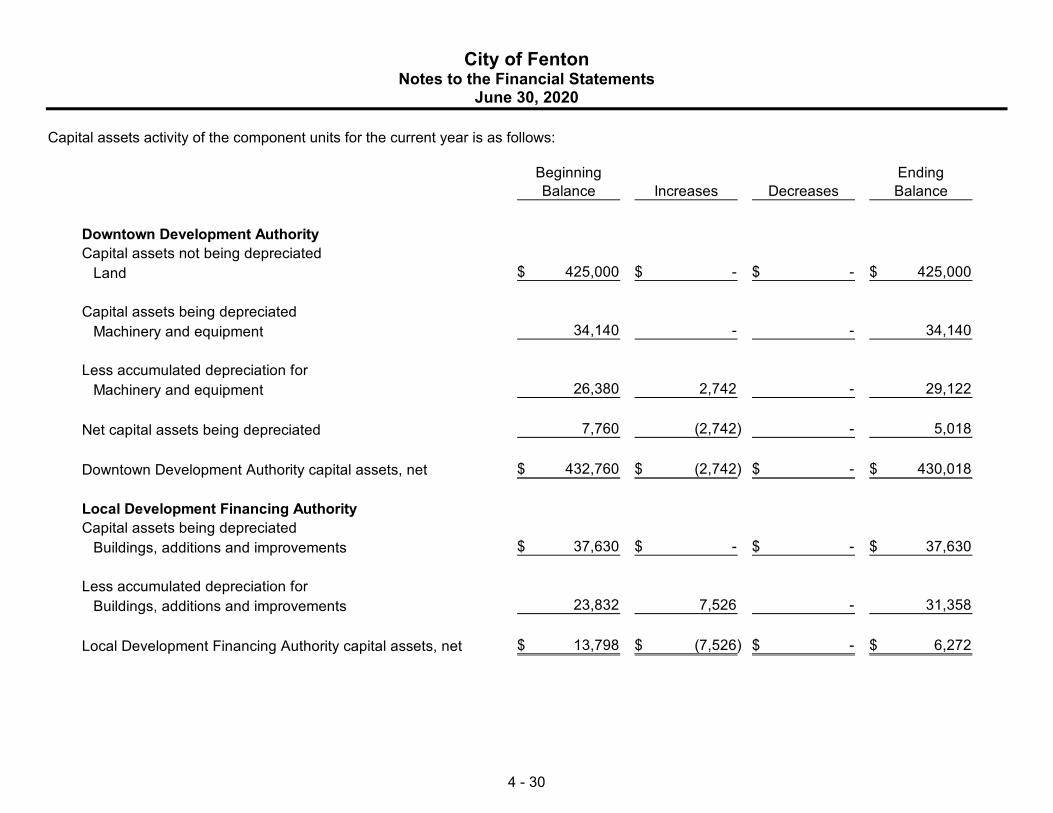
City of Fenton Notes to the Financial Statements
June 30, 2020
4 - 30
Capital assets activity of the component units for the current year is as follows:
Beginning EndingBalance Increases Decreases Balance
Downtown Development AuthorityCapital assets not being depreciated
Land 425,000$ -$ -$ 425,000$
Capital assets being depreciatedMachinery and equipment 34,140 - - 34,140
Less accumulated depreciation forMachinery and equipment 26,380 2,742 - 29,122
Net capital assets being depreciated 7,760 (2,742) - 5,018
Downtown Development Authority capital assets, net 432,760$ (2,742)$ -$ 430,018$
Local Development Financing AuthorityCapital assets being depreciated
Buildings, additions and improvements 37,630$ -$ -$ 37,630$
Less accumulated depreciation forBuildings, additions and improvements 23,832 7,526 - 31,358
Local Development Financing Authority capital assets, net 13,798$ (7,526)$ -$ 6,272$

City of Fenton Notes to the Financial Statements
June 30, 2020
4 - 31
Note 5 - Long-Term Debt
The following is a summary of changes in long-term debt (including current portion) of the City for the year ended June 30, 2020:
Primary Government Interest PrincipalAmount of Maturity Rate Maturity Beginning Ending Due Within
Issue Date Ranges Ranges Balance Additions Reductions Balance One YearGovernmental activitiesBonds and notes payable
General obligation bond2015 LTGO Special Assessment Bonds 555,000$ 4/1/2026 1.80% - 3.55% $55,000 - $60,000 390,000$ -$ 55,000$ 335,000$ 60,000$
Notes from direct borrowingInstallment purchase agreement
Fire and Police Equipment 261,612 8/31/2024 2.810% $20,428 - $40,018 209,804 - 35,791 174,013 36,804 Compensated absences 122,889 335,144 120,428 337,605 67,521 Internal service fund obligations Compensated absences 212,084 121,441 46,650 286,875 57,375
Total governmental activities 934,777 456,585 257,869 1,133,493 221,700
Business-type activitiesBonds and notes payable
Revenue bonds2002 Michigan Municipal Bond Authority 9,600,000 4/1/2023 2.500% $570,000 - $600,000 2,315,000 - 560,000 1,755,000 570,000 2009 Michigan Municipal Bond Authority 1,419,839 4/1/2030 2.500% $55,000 - $72,031 667,031 - 55,000 612,031 55,000 2014 Michigan Finance Authority 935,000 10/1/2035 2.500% $30,000 - $42,366 607,366 - 30,000 577,366 30,000
Capital improvement bonds2010 Capital Improvement Bonds 2,690,000 4/1/2035 N/A N/A 2,375,000 - 2,375,000 - - 2020 Capital Improvement Refunding Bonds 2,320,000 4/1/2035 2.000% $135,000 - $175,000 - 2,320,000 - 2,320,000 140,000
Less deferred amountsFor issuance premiums - 50,477 - 50,477 3,365
Total 5,964,397 2,370,477 3,020,000 5,314,874 798,365
Compensated absences 27,854 109,344 62,139 75,059 15,012
Total business-type activities 5,992,251 2,479,821 3,082,139 5,389,933 813,377
Total primary government 6,927,028$ 2,936,406$ 3,340,008$ 6,523,426$ 1,035,077$

City of Fenton Notes to the Financial Statements
June 30, 2020
4 - 32
Interest PrincipalAmount of Maturity Rate Maturity Beginning Ending Due Within
Component unit Issue Date Ranges Ranges Balance Additions Reductions Balance One Year
Downtown Development AuthorityGeneral obligation bonds 2011 GOLT Development Refunding Bonds 3,985,000$ 4/1/2021 3.000% $435,000 - $460,000 905,000$ -$ 445,000$ 460,000$ 460,000$ 2014 GOLT Development Bonds 3,650,000 10/1/2031 2.000% - 4.000% $140,000 - $330,000 3,110,000 - 145,000 2,965,000 150,000 2016 GOLT Development Bonds 1,000,000 10/1/2031 2.000% - 2.600% $55,000 - $80,000 840,000 - 55,000 785,000 55,000
Direct borrowing Installment purchase agreement 2012 DDA Dispatch Loan 260,000 4/1/2022 2.700% $26,000 78,000 - 26,000 52,000 26,000
Capitalized bond premium 51,505 - 4,262 47,243 -
Total component unit 4,984,505$ -$ 675,262$ 4,309,243$ 691,000$

City of Fenton Notes to the Financial Statements
June 30, 2020
4 - 33
Compensated Absences In accordance with the City’s personnel policies, individual employees have vested rights upon termination of employment to receive payment for unused sick pay and vacation under formulas and conditions specified in their respective personnel policies and/or contracts. The dollar amount of these vested rights, including related payroll taxes, amounted to $624,480 for governmental activities and $75,059 for business-type activities at June 30, 2020. The governmental activities liability has historically been paid out of the General Fund. Water and Sewer Obligations The City of Fenton was a participant in the county-wide sanitary sewer construction program under Act 342 Michigan Compiled Laws. This program was financed by general obligation bonds issued by Genesee County. The City of Fenton has contracts with Genesee County Water and Waste Services for the cost of the construction of the sewer system within its boundaries. The City of Fenton has pledged the full faith and credit of the City to the prompt payment of the City’s share of the principal and interest payments on these contracts as they become due. From information received from Genesee County, the assets relating to those contracts have been recorded in the Sewer Fund of the City to reflect the actual construction cost of the above mentioned systems. The contract principal portion owed by the City of Fenton has been recorded in the Sewer Fund. The Water Revolving Fund Bonds are supported by the revenues of the Water System. Future Revenues Pledged for Debt Payments The City has pledged substantially all revenue of the water fund, net of operating expenses, to repay the above water revenue bonds. Proceeds from the bonds provided financing for the construction of the Water Treatment Plant. The bonds are payable solely from the net revenues of the water system. The remaining principal and interest to be paid on the bonds is $1,843,502. During the current year, net revenues of the system were $833,673 compared to the annual debt requirements of $613,876.
Advance Refunding - Prior On July 12, 2011, the City defeased a portion of the 2001 General Obligation Limited Tax Development Bonds (DDA), which were due and payable through April 1, 2021. This was accomplished by establishing an irrevocable trust with an escrow agent composed of cash and U.S. Government Securities sufficient to meet the applicable principal and interest payments. The City issued the 2011 General Obligation Limited Tax Refunding Bonds in the amount of $3,985,000. Accordingly, the trust account assets and liabilities for the defeased bonds are not included in the City’s financial statements. At June 30, 2020 bonds due and payable through April 1, 2021, for the 2001 General Obligation Limited Tax Development Bonds in the amount of $465,000 are considered defeased. Debt Refunding On May 28, 2020, the City defeased the remaining 2010 Capital Improvement Bonds, which were due and payable through April 1, 2035. This was accomplished by establishing an irrevocable trust with an escrow agent composed of cash and U.S. Government Securities sufficient to meet the applicable principal and interest payments. The City issued the 2020 Capital Improvement Refunding Bonds in the amount of $2,320,000. Accordingly, the trust account assets and liabilities for the defeased bonds are not included in the City’s financial statements. At June 30, 2020 bonds due and payable through April 1, 2035, for the 2010 Capital Improvement Bonds in the amount of $2,270,000 are considered defeased. As a result of the refunding, the City decreased its total debt service requirements by $806,769, which resulted in an economic gain (difference between the present value of the debt service payments on the old and new debt) of $225,085.
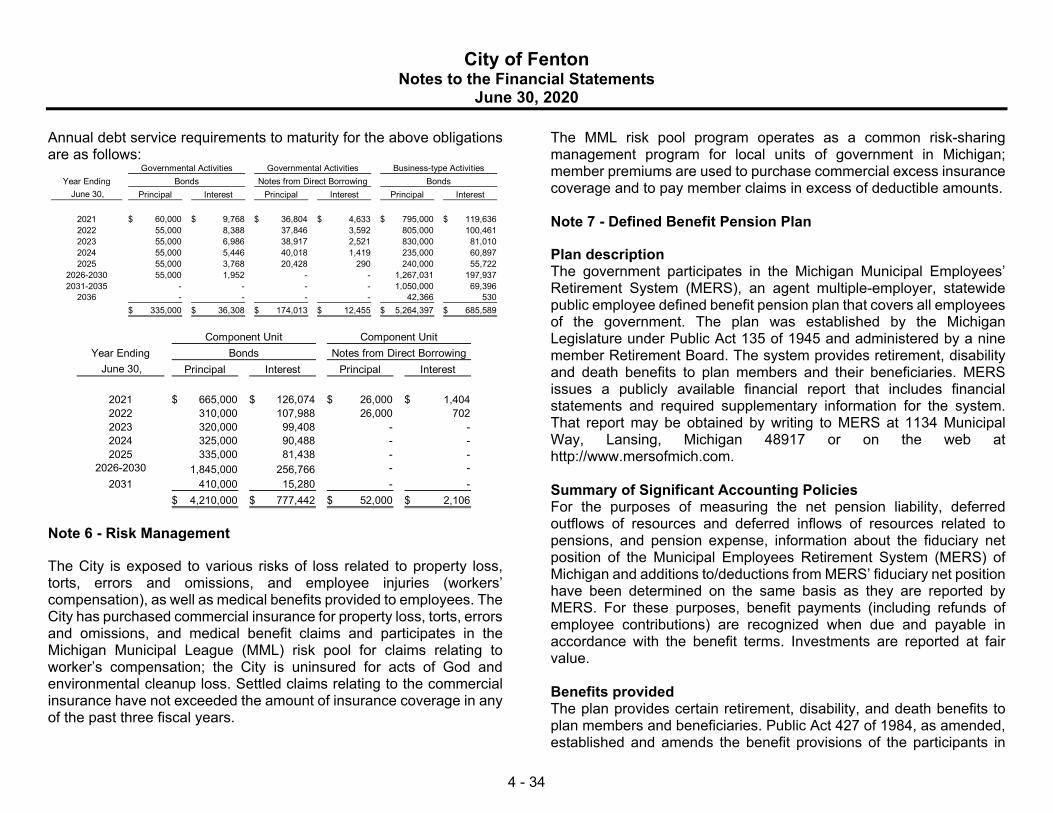
City of Fenton Notes to the Financial Statements
June 30, 2020
4 - 34
Annual debt service requirements to maturity for the above obligations are as follows:
Year Ending June 30, Principal Interest Principal Interest Principal Interest
2021 60,000$ 9,768$ 36,804$ 4,633$ 795,000$ 119,636$ 2022 55,000 8,388 37,846 3,592 805,000 100,461 2023 55,000 6,986 38,917 2,521 830,000 81,010 2024 55,000 5,446 40,018 1,419 235,000 60,897 2025 55,000 3,768 20,428 290 240,000 55,722
2026-2030 55,000 1,952 - - 1,267,031 197,937 2031-2035 - - - - 1,050,000 69,396
2036 - - - - 42,366 530 335,000$ 36,308$ 174,013$ 12,455$ 5,264,397$ 685,589$
Bonds BondsNotes from Direct BorrowingGovernmental ActivitiesGovernmental Activities Business-type Activities
Year Ending June 30, Principal Interest Principal Interest
2021 665,000$ 126,074$ 26,000$ 1,404$ 2022 310,000 107,988 26,000 702 2023 320,000 99,408 - - 2024 325,000 90,488 - - 2025 335,000 81,438 - -
2026-2030 1,845,000 256,766 - - 2031 410,000 15,280 - -
4,210,000$ 777,442$ 52,000$ 2,106$
BondsComponent UnitComponent Unit
Notes from Direct Borrowing
Note 6 - Risk Management
The City is exposed to various risks of loss related to property loss, torts, errors and omissions, and employee injuries (workers’ compensation), as well as medical benefits provided to employees. The City has purchased commercial insurance for property loss, torts, errors and omissions, and medical benefit claims and participates in the Michigan Municipal League (MML) risk pool for claims relating to worker’s compensation; the City is uninsured for acts of God and environmental cleanup loss. Settled claims relating to the commercial insurance have not exceeded the amount of insurance coverage in any of the past three fiscal years.
The MML risk pool program operates as a common risk-sharing management program for local units of government in Michigan; member premiums are used to purchase commercial excess insurance coverage and to pay member claims in excess of deductible amounts. Note 7 - Defined Benefit Pension Plan
Plan description The government participates in the Michigan Municipal Employees’ Retirement System (MERS), an agent multiple-employer, statewide public employee defined benefit pension plan that covers all employees of the government. The plan was established by the Michigan Legislature under Public Act 135 of 1945 and administered by a nine member Retirement Board. The system provides retirement, disability and death benefits to plan members and their beneficiaries. MERS issues a publicly available financial report that includes financial statements and required supplementary information for the system. That report may be obtained by writing to MERS at 1134 Municipal Way, Lansing, Michigan 48917 or on the web at http://www.mersofmich.com. Summary of Significant Accounting Policies For the purposes of measuring the net pension liability, deferred outflows of resources and deferred inflows of resources related to pensions, and pension expense, information about the fiduciary net position of the Municipal Employees Retirement System (MERS) of Michigan and additions to/deductions from MERS’ fiduciary net position have been determined on the same basis as they are reported by MERS. For these purposes, benefit payments (including refunds of employee contributions) are recognized when due and payable in accordance with the benefit terms. Investments are reported at fair value. Benefits provided The plan provides certain retirement, disability, and death benefits to plan members and beneficiaries. Public Act 427 of 1984, as amended, established and amends the benefit provisions of the participants in

City of Fenton Notes to the Financial Statements
June 30, 2020
4 - 35
MERS. The MERS plan covers full-time employees at the City including general employees, police union, and Department of Public Services employees. Retirement benefits for employees are calculated as 2.0 percent of the employee’s five-year final average compensation times the employee’s years of service with a maximum of 80 percent of final average compensation. Normal retirement age is 60 with a reduced benefit at age 50 with 25 years of service or age 55 with 15 years of service. Deferred retirement benefits vest after 6 years of credited service, but are not paid until the date retirement would have occurred had the member remained an employee. Employees are eligible for non-duty disability benefits after 6-10 years of service and for duty-related disability benefits upon hire. Disability retirement benefits are determined in the same manner as retirement benefits but are payable immediately and if duty-related without an actuarial reduction for retirement before age 60 is not applied. An employee who leaves service may withdraw his or her contributions, plus any accumulated interest. Benefit terms, within the parameters established by MERS, are generally established and amended by authority of the City Council, generally after negotiations of these terms with the affected unions. Police employee benefit terms may be subject to binding arbitration in certain circumstances.
At the December 31, 2019 valuation date, the following employees were covered by the benefit terms:
Inactive employees or beneficiaries currently receiving benefits 47 Inactive employees entitled to, but not yet receiving benefits 16 Active employees 48
111
Contributions Article 9, Section 24 of the State of Michigan constitution requires that financial benefits arising on account of employee service rendered in each year be funded during that year. Accordingly, MERS retains an independent actuary to determine the annual contribution. The employer is required to contribute amounts at least equal to the actuarially determined rate, as established by the MERS retirement board. The actuarially determined rate is the estimated amount necessary to finance the costs of benefits earned by plan members during the year, with an additional amount to finance any unfunded accrued liability. The employer may establish contribution rates to be paid by its covered employees. Employer contributions range from 8.54% to 25.80% based on annual payroll for open divisions. Net pension liability The employer’s net pension liability was measured as of December 31, 2019, and the total pension liability used to calculate the net pension liability was determined by an annual actuarial valuation as of that date. Actuarial assumptions The total pension liability in the December 31, 2019 annual actuarial valuation was determined using the following actuarial assumptions, applied to all periods included in the measurement include: 1) Inflation 2.5%; 2) Salary increases 3.75% in the long-term; 3) Investment rate of return of 7.75%, net of investment expense, including inflation.

City of Fenton Notes to the Financial Statements
June 30, 2020
4 - 36
Although no specific price inflation assumptions are needed for the valuation, the 3.75% long-term wage inflation assumption would be consistent with a price inflation of 2.5%. Mortality rates used were based on the RP-2014 Mortality Tables of a 50% male and 50% female blend. For disabled retirees, the regular mortality table is used with a 10-year set forward in ages to reflect the higher expected mortality rates of disabled members. The actuarial assumptions used in valuation were based on the results of the most recent actuarial experience study. The long-term expected rate of return on pension plan investments was determined using a model method in which the best-estimate ranges of expected future real rates of return (expected returns, net of investment and administrative expenses and inflation) are developed for each major asset class. These ranges are combined to produce the long term expected rate of return by weighting the expected future real rates of return by the target asset allocation percentage and by adding expected inflation. The target allocation and best estimates or arithmetic real rates of return for each major asset class are summarized in the following table:
Target allocation Long-term Long-termTarget gross rate expected gross Inflation expected real
Asset class allocation of return rate of return assumption rate of returnGlobal equity 60.00% 8.65% 5.19% 2.50% 3.70%Global fixed income 20.00% 3.76% 0.75% 2.50% 0.30%Private Investments 20.00% 9.06% 1.81% 2.50% 1.30%
Discount rate – The discount rate used to measure the total pension liability is 8.0%. The projection of cash flows used to determine the discount rate assumes that employer and employee contributions will be made at the rates agreed upon for employees and the actuarially determined rates for employers. Based on these assumptions, the pension plans fiduciary net position was projected to be available to pay all projected future benefit payments of current active and inactive employees. Therefore, the long-term expected rate of return on pension
plan investments was applied to all periods of projected benefit payments to determine the total pension liability.
Changes in Net Pension Liability
Total Pension Liability Service cost 272,243$ Interest on the total pension liability 1,392,121 Experience differences 122,634 Changes in actuarial assumptions 641,840 Other changes (9,119) Benefit payments and refunds (1,045,582)
Net change in total pension liability 1,374,137 Total pension liability - beginning 17,788,188
Total pension liability - ending (a) 19,162,325$
Plan Fiduciary Net Position Pension plan net investment income (loss) 1,504,441$ Employer contributions 1,194,047 Employee contributions 30,505 Benefit payments and refunds (1,045,582) Pension plan administrative expense (25,932)
Net change in plan fiduciary net position 1,657,479 Plan fiduciary net position - beginning 10,959,744
Plan fiduciary net position - ending (b) 12,617,223$
Net pension liability (a-b) 6,545,102$
Plan fiduciary net position as a percentage of total pension liability 65.84%
Covered employee payroll 3,205,054$ Net pension liability as a percentage of covered employee payroll 204.21%

City of Fenton Notes to the Financial Statements
June 30, 2020
4 - 37
Sensitivity of the net pension liability to changes in the discount rate – The following presents the net pension liability of the employer, calculated using the discount rate of 8.0%, as well as what the employer’s net pension liability would be using a discount rate that is 1% point lower (7%) or 1% higher (9%) than the current rate.
Current1% decrease discount rate 1% increase
Net pension liability 8,915,674$ 6,545,102$ 4,566,036$
Pension expense and deferred outflows of resources and deferred inflows of resources related to pensions – For the year ended June 30, 2020 the employer recognized pension expense of $1,230,824. The employer reported deferred outflows and inflows of resources related to pensions from the following sources:
Deferred Deferredoutflows of inflows of Total to resources resources amortize
Differences in experience 243,074$ (181,401)$ 61,673$ Differences in assumptions 513,472 - 513,472 Net difference between projected and
actual earning on plan investments 45,075 - 45,075 Contributions subsequent to the measurement date* 610,306 - -
Total 1,411,927$ (181,401)$ 620,220$
*The amount reported as deferred outflows of resources resulting from contributions subsequent to the measurement date will be recognized as a reduction in the net pension liability for the year ending 2021.
Amounts reported as deferred outflows and inflows of resources related to pensions will be recognized in pension expense as follows:
Year ended,2021 97,541$ 2022 148,971 2023 345,122 2024 28,586
620,220$
The net pension liability is generally liquidated by the General Fund, Emergency 911 Fund, Capital Projects Fund – DDA, Capital Projects Fund – LDFA, Sewer Fund, and Water Fund. Note 8 - Other Postemployment Benefits Plan description – The City provides postemployment health care benefits (a single employer defined benefit plan) in accordance with a Council resolution to covered employees who retire on or after age 55 with at least 10 years of service and Police Local 214 employees who retire on or after age 50 with at least 10 years of service. The City pays 100% of the health insurance premiums for these retirees. Employees covered by benefit terms – At December 31, 2019 (most recent actuarial valuation date), the plan membership consisted of the following:
Inactive employees or beneficiaries currently receiving benefits 35 Active employees 49
84
Contributions – City Council has the authority to establish and amend the benefit terms and contribution requirements of the City and plan members or to abolish the plan at any time. Recognition of the total OPEB liability by the City should not be interpreted that a vested benefit is owed to any plan participant. Benefits are authorized during the

City of Fenton Notes to the Financial Statements
June 30, 2020
4 - 38
annual budgetary process, funding for which may or may not continue into the future. The City is on the pay-as-you-go method and contributed $400,867 for the year ended June 30, 2020. Plan members are not required to contribute to the plan. Total OPEB liability – The total OPEB liability was measured as of June 30, 2020. The total OPEB liability was determined by an actuarial valuation as of December 31, 2019 and rolled forward to June 30, 2020. Actuarial assumptions – The following actuarial assumptions were used, applied to all periods included in the measurement. Actuarial cost method Entry-Age NormalAmortization method Level percent of payroll, closedRemaining amortization period 19 years, closedAsset valuation method There are no assets.Price inflation 2.50%Wage inflation 3.75%Salary increases 3.75 to 14.75%Investment rate of return 4.00%, net of OPEB plan investment expenseRetirement age Experience-based table of rates that are specific
to the type of eligibility conditionMortality A version of the RP-2014 mortality tableHealthcare inflation rate Initial trend of 9.00% gradually decreasing to an
ultimate trend rate of 3.75% in year 10Excise tax No load was applied in connection with the "Cadillac" taxAging factors Based on the 2013 SOA Study "Health Care Costs - From Birth to Death"
Mortality rates were based on a version of the RP-2014 mortality table, as appropriate. The actuarial assumptions used in the June 30, 2020 measurement were based on valuation assumptions used in the December 31, 2019 actuarial valuation. Discount rate – The discount rate used to measure the total OPEB liability was 2.45% (based on the daily rate closest to but not later than the measurement date of the Fidelity “20-Year Municipal GO AA Index”).
Changes in Total OPEB Liability
Total OPEB Liability Service cost 185,710$ Interest on the total OPEB liability 206,645 Experience differences (366,715) Changes in actuarial assumptions 1,338,643 Benefit payments and refunds (400,867)
Net change in total OPEB liability 963,416 Total OPEB liability - beginning 6,709,643
Total OPEB liability - ending 7,673,059$
Plan fiduciary net position as a percentage of total OPEB liability - %
Covered payroll 3,782,214$ Total OPEB liability as a percentage of covered payroll 202.87%
Regarding the sensitivity of the total OPEB liability to changes in the single discount rate, the following presents the total OPEB liability of the City, calculated using a single discount rate of 2.45%, as well as what the City’s total OPEB liability would be if it were calculated using a single discount rate that is one percent lower or one percent higher:
Current Single Discount1% Decrease Rate Assumption 1% Increase
1.45% 2.45% 3.45%8,653,950$ 7,673,059$ 6,854,990$

City of Fenton Notes to the Financial Statements
June 30, 2020
4 - 39
Regarding the sensitivity of the net OPEB liability to changes in the healthcare cost trend rates, the following presents the net OPEB liability of the City, calculated using the assumed trend rates as well as what the City’s net OPEB liability would be if were calculated using a trend rate that is one percent lower or one percent higher:
Current Healthcare Care Cost1% Decrease Trend Rate Assumption 1% Increase
7,086,408$ 7,673,059$ 8,372,734$
OPEB expense and deferred outflows of resources and deferred inflows of resources related to OPEB – For the year ended June 30, 2020 the employer recognized OPEB expense of $613,679. The employer reported deferred outflows and inflows of resources related to OPEB from the following sources:
Deferred Deferredoutflows of inflows of Total to resources resources amortize
Differences in experience 28,888$ (305,132)$ (276,244)$ Differences in assumptions 1,330,099 (19,106) 1,310,993
Total 1,358,987$ (324,238)$ 1,034,749$
Amounts reported as deferred outflows and inflows of resources related to OPEB will be recognized in OPEB expense as follows:
Year ended,2021 221,324$ 2022 221,324 2023 221,955 2024 214,308 2025 155,838
1,034,749$
The total OPEB liability is generally liquidated by the General Fund, Sewer Fund, and Water Fund
Note 9 - Building and Zoning Financial Information The State Construction Code Act, Michigan Public Act 245 of 1999, and rules promulgated by the Department of Treasury regarding that Act, require that a local unit’s fees collected from construction code permits be accounted for in a method which shows that all of these fees were used for expenditures related to the operation of the enforcing agency. The rules indicated that if the revenues exceeded the expenditures, the fees collected must be kept in a separate fund with all the revenues and expenditures accounted for in that fund. These rules allowed for monitoring these funds in a separate activity center within the General Fund if the expenditures would normally exceed revenues. The City chose the latter because historically the expenditures have exceeded revenues. The activity related to construction code activity for the year ended June 30, 2020 is as follows:
RevenuesBuilding permits 125,823$ Zoning permits 10,531
Total Revenues 136,354
ExpendituresSalaries and fringes 279,362 Supplies and other 21,344 Professional services 82,296
Total expenditures 383,002
Excess of revenues (under) expenditures (246,648)
Prior cumulative excess of revenues (under) expenditures (2,219,500)
Cumulative excess of revenues (under) expenditures (2,466,148)$

City of Fenton Notes to the Financial Statements
June 30, 2020
4 - 40
Note 10 - Contingent Liabilities
At times, the City may be a defendant in various lawsuits. Although the outcome of these lawsuits is not presently determinable, in the opinion of the City and its attorney, the resolution of these matters will not have a material adverse effect on the financial condition of the City. Note 11 - Details of Fund Balance Classifications
GASB Statement No. 54, Fund Balance Reporting and Governmental Fund Type Definitions, established fund balance classifications that comprise a hierarchy based primarily on the extent to which a government is bound to observe constraints imposed upon the use of the resources reported in the governmental funds. The following are the five (5) classifications of fund balance under this standard:
Nonspendable - assets that are not available in a spendable form such as inventory, prepaid expenditures, and long-term receivables not expected to be converted to cash in the near term. It also includes funds that are legally or contractually required to be maintained intact such as the corpus of a permanent fund or foundation. Restricted - amounts that are required by external parties to be used for a specific purpose. Constraints are externally imposed by creditors, grantors, contributors or laws, regulation or enabling legislation. Committed - amounts constrained on use imposed by formal action of the government’s highest level of decision making authority (i.e., Board, Council, etc.). Assigned - amounts intended to be used for specific purposes. This is determined by the governing body, the budget or finance committee or a delegated municipality official.
Unassigned - all other resources; the remaining fund balance after non-spendable, restrictions, commitments, and assignments. This class only occurs in the General Fund, except for cases of negative fund balances. Negative fund balances are always reported as unassigned, no matter which fund the deficit occurs in.
Fund Balance Classification Policies and Procedures For committed fund balance, the City of Fenton highest level of decision-making authority is the City Council. Formal action that is required to be taken to establish, modify, or rescind a fund balance commitment is through a resolution of the City Council. For assigned fund balance, the City Council has not approved a policy indicating who is authorized to assign amounts to a specific purpose. As a result, this authority is retained by the City Council. The City of Fenton has not adopted a policy that defines the order of usage for fund balance amounts classified as restricted, committed, assigned, or unassigned. In the absence of such a policy, resources with the highest level of restriction will be used first.
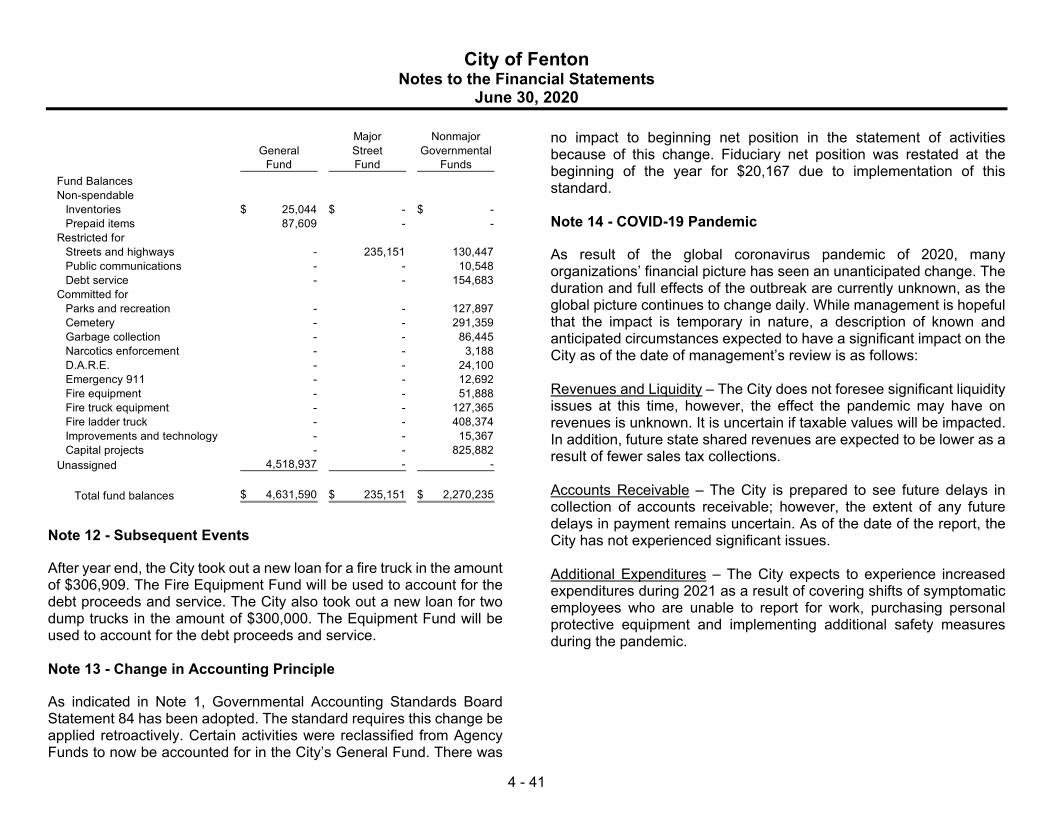
City of Fenton Notes to the Financial Statements
June 30, 2020
4 - 41
Major NonmajorGeneral Street Governmental
Fund Fund FundsFund BalancesNon-spendable
Inventories 25,044$ -$ -$ Prepaid items 87,609 - -
Restricted forStreets and highways - 235,151 130,447 Public communications - - 10,548 Debt service - - 154,683
Committed forParks and recreation - - 127,897 Cemetery - - 291,359 Garbage collection - - 86,445 Narcotics enforcement - - 3,188 D.A.R.E. - - 24,100 Emergency 911 - - 12,692 Fire equipment - - 51,888 Fire truck equipment - - 127,365 Fire ladder truck - - 408,374 Improvements and technology - - 15,367 Capital projects - - 825,882
Unassigned 4,518,937 - -
Total fund balances 4,631,590$ 235,151$ 2,270,235$
Note 12 - Subsequent Events
After year end, the City took out a new loan for a fire truck in the amount of $306,909. The Fire Equipment Fund will be used to account for the debt proceeds and service. The City also took out a new loan for two dump trucks in the amount of $300,000. The Equipment Fund will be used to account for the debt proceeds and service. Note 13 - Change in Accounting Principle
As indicated in Note 1, Governmental Accounting Standards Board Statement 84 has been adopted. The standard requires this change be applied retroactively. Certain activities were reclassified from Agency Funds to now be accounted for in the City’s General Fund. There was
no impact to beginning net position in the statement of activities because of this change. Fiduciary net position was restated at the beginning of the year for $20,167 due to implementation of this standard. Note 14 - COVID-19 Pandemic
As result of the global coronavirus pandemic of 2020, many organizations’ financial picture has seen an unanticipated change. The duration and full effects of the outbreak are currently unknown, as the global picture continues to change daily. While management is hopeful that the impact is temporary in nature, a description of known and anticipated circumstances expected to have a significant impact on the City as of the date of management’s review is as follows: Revenues and Liquidity – The City does not foresee significant liquidity issues at this time, however, the effect the pandemic may have on revenues is unknown. It is uncertain if taxable values will be impacted. In addition, future state shared revenues are expected to be lower as a result of fewer sales tax collections. Accounts Receivable – The City is prepared to see future delays in collection of accounts receivable; however, the extent of any future delays in payment remains uncertain. As of the date of the report, the City has not experienced significant issues. Additional Expenditures – The City expects to experience increased expenditures during 2021 as a result of covering shifts of symptomatic employees who are unable to report for work, purchasing personal protective equipment and implementing additional safety measures during the pandemic.

City of FentonGeneral Fund
Fund Description
The General Fund is used to account for all financial transactions not properly accounted for in another fund. The transactions relating to the generalgovernmental activities of the City, which are financed by property tax levies, by distribution of State and Federal revenues, and by revenue from variousactivities and services, are recorded in this fund. The majority of current operating expenditures of the City, other than proprietary fund activities, arefinanced through revenue received by the General Fund.

ActualOver (Under)
FinalOriginal Final Actual Budget
RevenuesTaxes 4,127,898$ 4,091,555$ 4,113,868$ 22,313$ Licenses and permits 479,300 449,600 461,317 11,717 Intergovernmental 1,158,559 1,155,550 1,115,233 (40,317) Charges for services 345,000 358,000 228,262 (129,738) Fines and forfeitures 60,000 60,000 62,578 2,578 Interest income 40,000 40,000 52,928 12,928 Other revenue 220,755 215,969 170,719 (45,250)
Total revenues 6,431,512 6,370,674 6,204,905 (165,769)
ExpendituresLegislative and executive 188,550 199,250 173,684 (25,566) General services 1,409,103 1,430,897 1,584,462 153,565 Police 2,583,334 2,573,434 2,486,442 (86,992) Fire 737,620 734,464 698,962 (35,502) Protective inspections 440,600 437,550 422,418 (15,132) Public service 373,900 267,767 158,598 (109,169) Community service 129,100 228,830 213,780 (15,050)
Total expenditures 5,862,207 5,872,192 5,738,346 (133,846)
Excess of revenues over expenditures 569,305 498,482 466,559 (31,923)
Other financing sources (uses)Transfers out (452,750) (543,267) (607,564) (64,297)
Net change in fund balance 116,555 (44,785) (141,005) (96,220)
Fund balance - beginning of year 4,772,595 4,772,595 4,772,595 -
Fund balance - end of year 4,889,150$ 4,727,810$ 4,631,590$ (96,220)$
Budgeted Amounts
City of FentonRequired Supplementary Information
Budgetary Comparison ScheduleGeneral Fund
For the Year Ended June 30, 2020
5 - 1
City of FentonMajor Street FundFund Description
The Major Street Fund is used to account for proceeds from gas and weight taxes levied by the State and distributed to local governmental units. Statelaw requires that these taxes be used for street maintenance and construction.

ActualOver (Under)
FinalOriginal Final Actual Budget
RevenuesFederal grants 860,354$ -$ -$ -$ Intergovernmental 1,041,520 1,062,533 1,025,598 (36,935) Interest income 500 500 1,326 826
Total revenues 1,902,374 1,063,033 1,026,924 (36,109)
ExpendituresCurrent
Public works 2,108,804 1,468,669 1,515,776 47,107
Deficiency of revenues under expenditures (206,430) (405,636) (488,852) (83,216)
Other financing (uses)Transfers in 200,000 400,000 400,000 - Transfers out (130,000) (130,000) (130,000) -
Total other financing sources 70,000 270,000 270,000 -
Net change in fund balance (136,430) (135,636) (218,852) (83,216)
Fund balance - beginning of year 454,003 454,003 454,003 -
Fund balance - end of year 317,573$ 318,367$ 235,151$ (83,216)$
Budgeted Amounts
City of FentonRequired Supplementary Information
Budgetary Comparison ScheduleMajor Street Fund
For the Year Ended June 30, 2020
5 - 2

Measurement date December 31, 2019 2018 2017 2016 2015 2014
Total Pension Liability Service cost 272,243$ 265,288$ 272,740$ 272,063$ 253,276$ 251,037$ Interest on the total pension liability 1,392,121 1,327,974 1,314,169 1,260,231 1,143,433 747,006 Experience differences 122,634 220,496 (453,504) 63,341 - - Changes in actuarial assumptions 641,840 - - - - - Other changes (9,119) - - - 939,704 386,453 Benefit payments and refunds (1,045,582) (985,194) (929,103) (914,331) (857,340) (805,830)
Net change in total pension liability 1,374,137 828,564 204,302 681,304 1,479,073 578,666 Total pension liability - beginning 17,788,188 16,959,624 16,755,322 16,074,018 14,594,945 14,016,279
Total pension liability - ending (a) 19,162,325$ 17,788,188$ 16,959,624$ 16,755,322$ 16,074,018$ 14,594,945$
Plan Fiduciary Net Position Pension plan net investment income (loss) 1,504,441$ (453,265)$ 1,330,013$ 1,057,397$ (146,630)$ 603,787$ Employer contributions 1,194,047 1,082,740 814,116 550,985 510,110 471,992 Employee contributions 30,505 27,653 27,255 23,809 22,633 22,830 Benefit payments and refunds (1,045,582) (985,194) (929,103) (914,331) (857,340) (805,830) Pension plan administrative expense (25,932) (22,134) (21,038) (20,877) (22,691) (22,123)
Net change in plan fiduciary net position 1,657,479 (350,200) 1,221,243 696,983 (493,918) 270,656 Plan fiduciary net position - beginning 10,959,744 11,309,944 10,088,701 9,391,718 9,885,636 9,614,980
Plan fiduciary net position - ending (b) 12,617,223$ 10,959,744$ 11,309,944$ 10,088,701$ 9,391,718$ 9,885,636$
Net pension liability (a-b) 6,545,102$ 6,828,444$ 5,649,680$ 6,666,621$ 6,682,300$ 4,709,309$
Plan fiduciary net position as a percentage of total pension liability 65.84% 61.61% 66.69% 60.21% 58.43% 67.73% Covered payroll 3,205,054$ 2,990,576$ 2,982,123$ 1,671,019$ 1,234,638$ 1,226,942$ Net pension liability as a percentage of covered payroll 204.21% 228.33% 189.45% 398.96% 541.24% 383.82%
Data will be added as information is available until 10 years of such data is available.
City of FentonRequired Supplementary Information
Schedule of Changes in Net Pension Liability and Related RatiosJune 30, 2020
GASB Statement No. 68 was implemented for the fiscal year ended June 30, 2015 and does not require retroactive implementation.
Municipal Employees Retirement System of Michigan
5 - 3

ActualFiscal Actuarially Contribution ContributionYear Determined Actual Deficiency Covered as a % of
Ended Contribution Contribution (Excess) Payroll Covered Payroll
6/30/2015 505,822$ 505,822$ -$ 1,133,303$ 44.63% 6/30/2016 519,813 519,813 - 1,464,006 35.51% 6/30/2017 572,230 572,230 - 1,728,486 33.11% 6/30/2018 626,636 1,015,974 (389,338) 2,273,368 44.69% 6/30/2019 700,944 1,137,889 (436,945) 2,622,560 43.39% 6/30/2020 932,712 1,221,619 (288,907) 3,037,446 40.22%
Methods and assumptions used to determine contribution rates:Actuarial cost method Individual entry-ageAmortization method Level-dollar closedRemaining amortization period 10-22 yearsAsset valuation method 5-year smoothed value of assetsInflation 2.50%Salary increases 3.75%Investment rate of return 7.75%Retirement age 60Mortality RP-2014 Healthy Annuitant Mortality Tables - 50% male and 50% female blend
RP-2014 Employee Mortality Tables - 50% male and 50% female blendRP-2014 Juvenile Mortality Tables - 50% male and 50% female blendRP-2014 Disabled Retiree Mortality Tables - 50% male and 50% female blend
GASB Statement No. 68 was implemented for the fiscal year ended June 30, 2015 and does not require retroactive implementation.Data will be added as information is available until 10 years of such data is available.
June 30, 2020
City of FentonRequired Supplementary Information
Municipal Employees Retirement System of MichiganSchedule of Employer Contributions
5 - 4
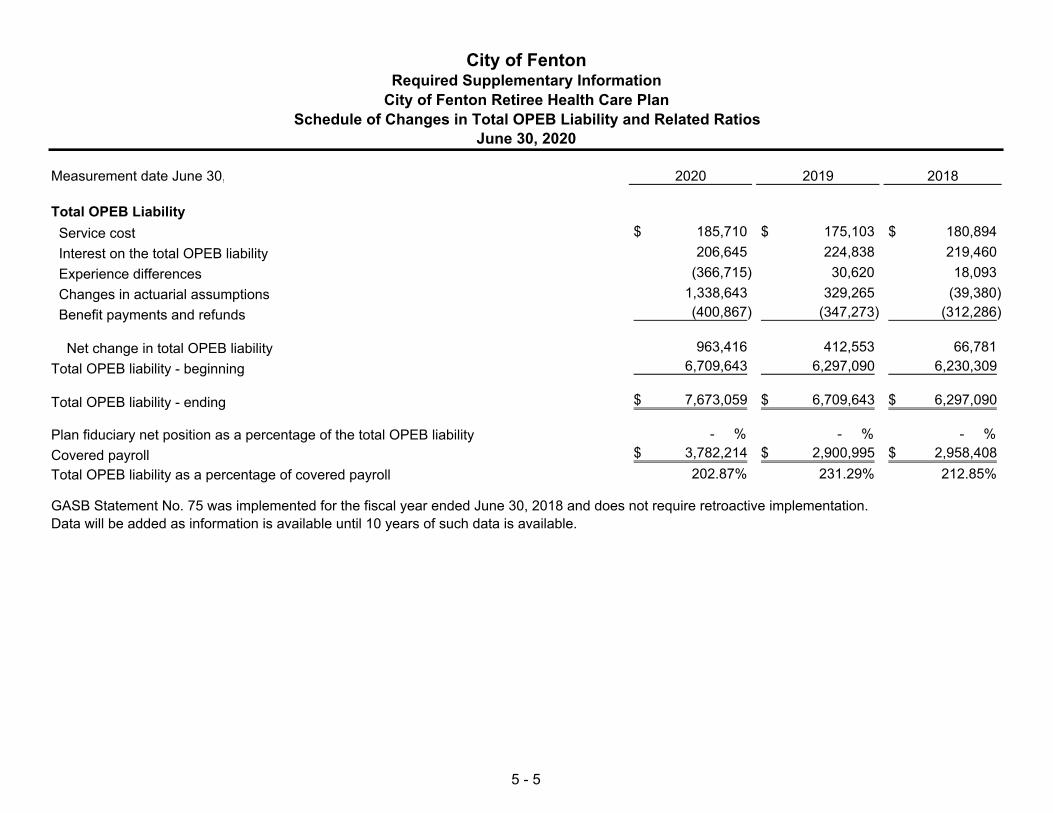
Measurement date June 30, 2020 2019 2018
Total OPEB Liability Service cost 185,710$ 175,103$ 180,894$ Interest on the total OPEB liability 206,645 224,838 219,460 Experience differences (366,715) 30,620 18,093 Changes in actuarial assumptions 1,338,643 329,265 (39,380) Benefit payments and refunds (400,867) (347,273) (312,286)
Net change in total OPEB liability 963,416 412,553 66,781 Total OPEB liability - beginning 6,709,643 6,297,090 6,230,309
Total OPEB liability - ending 7,673,059$ 6,709,643$ 6,297,090$
Plan fiduciary net position as a percentage of the total OPEB liability - % - % - % Covered payroll 3,782,214$ 2,900,995$ 2,958,408$ Total OPEB liability as a percentage of covered payroll 202.87% 231.29% 212.85%
Data will be added as information is available until 10 years of such data is available.
City of Fenton Retiree Health Care Plan
City of FentonRequired Supplementary Information
Schedule of Changes in Total OPEB Liability and Related RatiosJune 30, 2020
GASB Statement No. 75 was implemented for the fiscal year ended June 30, 2018 and does not require retroactive implementation.
5 - 5

ActualFiscal Actuarially Contribution ContributionYear Determined Actual Deficiency Covered as a % of
Ended Contribution Contribution (Excess) Payroll Covered Payroll
6/30/2018 N/A 312,286$ N/A 2,958,408$ 10.56% 6/30/2019 489,023 347,273 141,750 2,900,995 11.97% 6/30/2020 507,361 400,867 106,494 3,782,214 10.60%
Methods and assumptions used to determine contribution rates:Actuarial cost method Entry-age normalAmortization method Level percent of payrollRemaining amortization period 19 years, closedAsset valuation method There are no assetsInflation 2.50%Wage inflation 3.75%Salary increases 3.75% to 14.75%Discount rate 3.13%Investment rate of return 4.00%, net of OPEB plan investment expenseRetirement age Experience-based table of rates that are specific to the type of elgibility conditionMortality A version of the RP-2014 mortality tableHealth care trend rates Initial trend of 9.00% gradually decreasing to an ultimate trend rate of 3.75% in year 10Excise tax No load was applied in connection with the "Cadillac" taxAging factors Based on the 2013 SOA Study "Health Care Costs - From Birth to Death"
Data will be added as information is available until 10 years of such data is available.
City of FentonRequired Supplementary Information
City of Fenton Retiree Health Care PlanSchedule of Employer Contributions
June 30, 2020
GASB Statement No. 75 was implemented for the fiscal year ended June 30, 2018 and does not require retroactive implementation.
5 - 6

Note 1: Excess of expenditures over appropriations
AmountsAppropriated Expended Variance
General FundGeneral services 1,430,897$ 1,584,462$ 153,565$ Transfers out 543,267 607,564 64,297
Major Street Fund 1,598,669 1,645,776 47,107
Local Street Fund 521,173 552,941 31,768
Parks and Recreation Fund 122,171 148,253 26,082
Cemetery Fund 50,150 65,982 15,832
Garbage Collection Fund 509,550 513,040 3,490
Emergency 911 Fund 339,750 357,995 18,245
Public Communications Fund 27,550 27,844 294
The City’s budgeted expenditures for the General Fund have been shown at the function level. The approved budgets of the City have beenadopted at the function level for the General Fund and at the total fund level for other funds.
Michigan Public Act 621 of 1978, Sections 18 and 19, as amended, provides that a local governmental unit not incur expenditures in excessof the amounts appropriated.
During the year ended June 30, 2020, the City incurred expenditures in excess of the amounts appropriated as follows:
For the Year Ended June 30, 2020
City of FentonNote to Required Supplementary Information
5 - 7

Special Revenue Funds
Capital Projects Funds
Debt Service Funds
Public Communications - To account for the activity related to public communications.
Cemetery Fund - To account for the operation of the City’s cemetery which is financed primarily through charges for services.
City of FentonNonmajor Governmental Funds
Fund Descriptions
Local Street Fund - To account for the City’s share of proceeds from gas and weight taxes levied by the State and distributed to local governmental units. State lawrequires that these taxes be used for street maintenance and construction.
Narcotics Enforcement Fund - To account for confiscated funds which are used by the Police Department to enhance local narcotics enforcement.
Parks and Recreation Fund - To account for the activity related to the operation of the City’s parks and recreation programs which are partially funded through usercharges and donations.
Garbage Collection Fund - To account for quarterly customer charges and charges for bags and tags which are to be used to pay contracted services for garbagecollection.
D.A.R.E. Fund - To account for the activity of the Drug Abuse Resistance Education (D.A.R.E.) Program. The City Police Department has set up the program to providedrug education to local elementary school students.
Emergency 911 Fund - To account for the monthly telephone surcharges assessed for emergency services that are received from Genesee County which are used tocover the costs related to the operation of the City’s 911 system.
CDBG Fund - To account for the operation of the City’s community and economic development which relies on Community Development Block Grant funding to coverexpenses.
Eagles on Water SA Debt Service - To account for financial resources to be used for the acquisition or construction of Eagles on Water capital projects.
Fire Equipment Fund - To account for revenues earmarked for the purchase of fire equipment.
Fire Ladder Truck Fund - To account for revenues earmarked for the purchase of a fire ladder truck.
Capital Improvement Projects (C.I.P.) Fund - To account for contributions from the General Fund equaling 1.5 mills of the City’s total tax levy. These funds are primarilyused for Major and Local Street Fund capital improvement projects and storm drain construction.
Working Capital Fund - To account for financial resources to be used for the acquisition or construction of major capital projects.
Eagles on Water SA Capital - To account for financial resources to be used for the acquisition or construction of Eagles on Water capital projects.
Police Equipment Fund - To account for revenues earmarked for the purchase of police equipment.
Technology and Improvement Fund - To account for capital improvement projects for technology and improvements for the City.
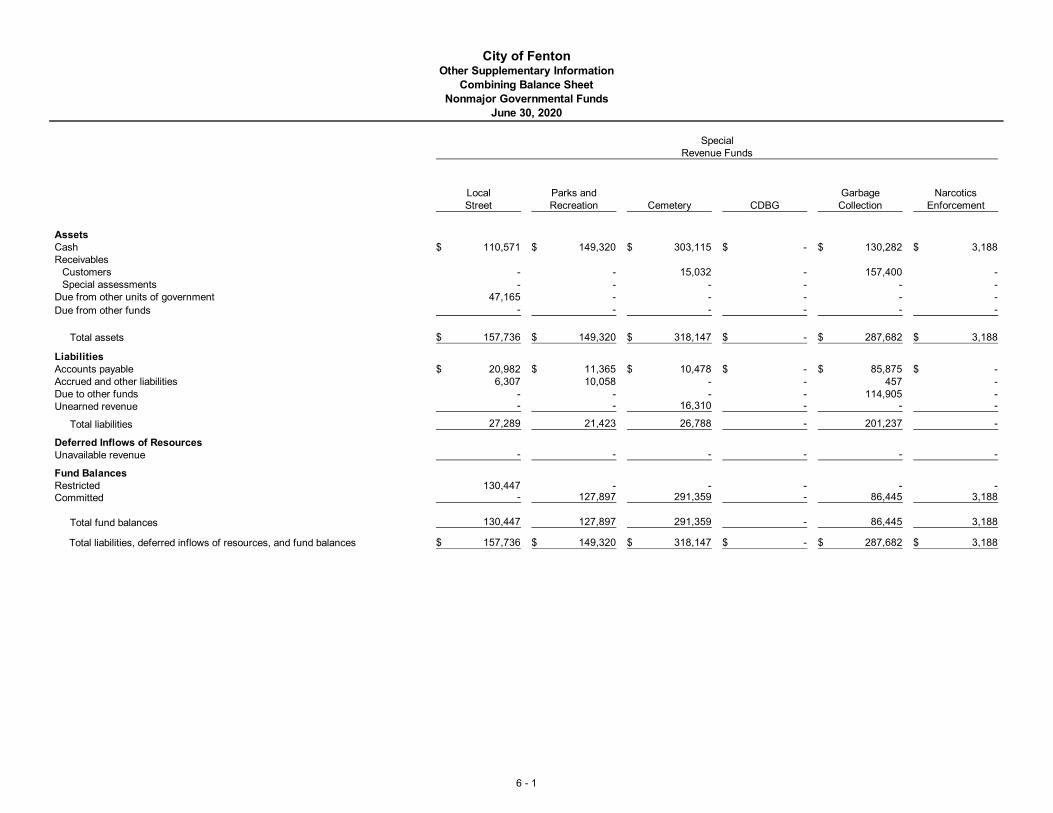
City of FentonOther Supplementary Information
Combining Balance SheetNonmajor Governmental Funds
June 30, 2020
Local Parks and Garbage NarcoticsStreet Recreation Cemetery CDBG Collection Enforcement
AssetsCash 110,571$ 149,320$ 303,115$ -$ 130,282$ 3,188$ Receivables
Customers - - 15,032 - 157,400 - Special assessments - - - - - -
Due from other units of government 47,165 - - - - - Due from other funds - - - - - -
Total assets 157,736$ 149,320$ 318,147$ -$ 287,682$ 3,188$
LiabilitiesAccounts payable 20,982$ 11,365$ 10,478$ -$ 85,875$ -$ Accrued and other liabilities 6,307 10,058 - - 457 - Due to other funds - - - - 114,905 - Unearned revenue - - 16,310 - - -
Total liabilities 27,289 21,423 26,788 - 201,237 -
Deferred Inflows of ResourcesUnavailable revenue - - - - - -
Fund BalancesRestricted 130,447 - - - - - Committed - 127,897 291,359 - 86,445 3,188
Total fund balances 130,447 127,897 291,359 - 86,445 3,188
Total liabilities, deferred inflows of resources, and fund balances 157,736$ 149,320$ 318,147$ -$ 287,682$ 3,188$
Revenue FundsSpecial
6 - 1

City of FentonOther Supplementary Information
Combining Balance SheetNonmajor Governmental Funds
June 30, 2020
AssetsCashReceivables
CustomersSpecial assessments
Due from other units of governmentDue from other funds
Total assets
LiabilitiesAccounts payableAccrued and other liabilitiesDue to other fundsUnearned revenue
Total liabilities
Deferred Inflows of ResourcesUnavailable revenue
Fund BalancesRestrictedCommitted
Total fund balances
Total liabilities, deferred inflows of resources, and fund balances
Emergency Public Fire Police Fire LadderD.A.R.E. 911 Communications Equipment Equipment Truck
24,100$ -$ 12,631$ 62,606$ 127,365$ 408,374$
- 57,678 - - - - - - - - - - - - - - - - - - - - - -
24,100$ 57,678$ 12,631$ 62,606$ 127,365$ 408,374$
-$ -$ 2,083$ 10,718$ -$ -$ - 10,338 - - - - - 34,648 - - - - - - - - - -
- 44,986 2,083 10,718 - -
- - - - - -
- - 10,548 - - - 24,100 12,692 - 51,888 127,365 408,374
24,100 12,692 10,548 51,888 127,365 408,374
24,100$ 57,678$ 12,631$ 62,606$ 127,365$ 408,374$
Revenue FundsSpecial
Projects FundsCapital
6 - 2
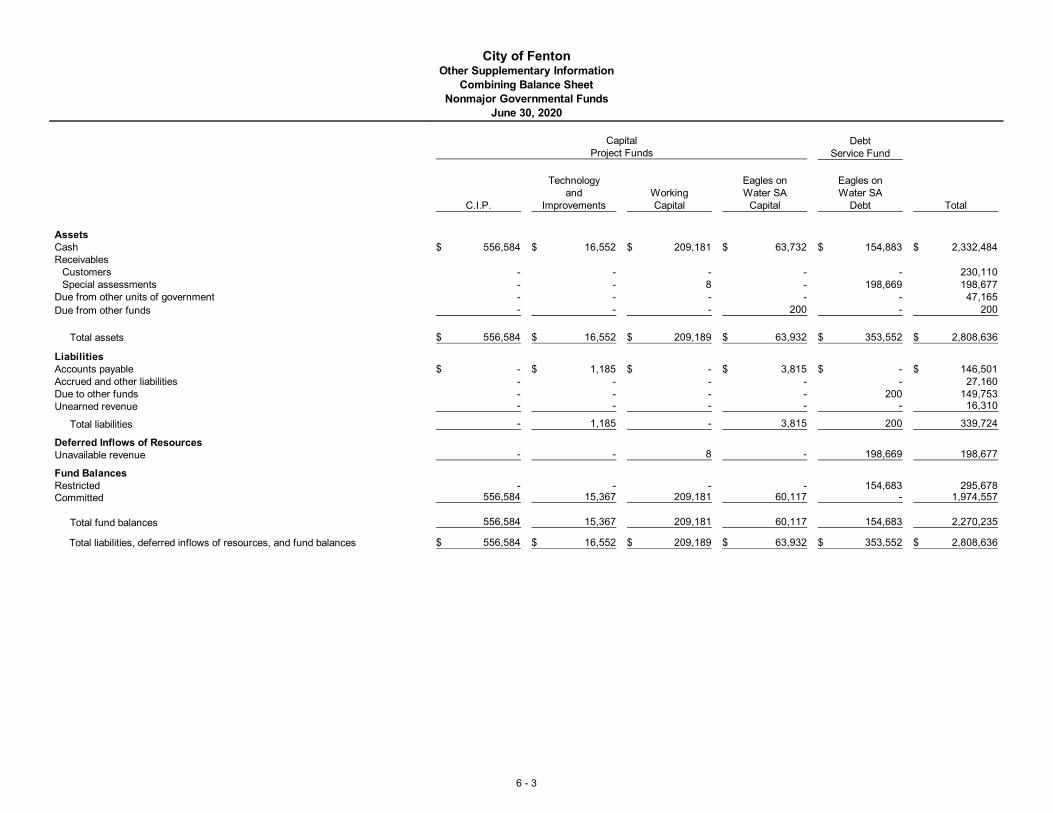
City of FentonOther Supplementary Information
Combining Balance SheetNonmajor Governmental Funds
June 30, 2020
AssetsCashReceivables
CustomersSpecial assessments
Due from other units of governmentDue from other funds
Total assets
LiabilitiesAccounts payableAccrued and other liabilitiesDue to other fundsUnearned revenue
Total liabilities
Deferred Inflows of ResourcesUnavailable revenue
Fund BalancesRestrictedCommitted
Total fund balances
Total liabilities, deferred inflows of resources, and fund balances
DebtService Fund
Technology Eagles on Eagles onand Working Water SA Water SA
C.I.P. Improvements Capital Capital Debt Total
556,584$ 16,552$ 209,181$ 63,732$ 154,883$ 2,332,484$
- - - - - 230,110 - - 8 - 198,669 198,677 - - - - - 47,165 - - - 200 - 200
556,584$ 16,552$ 209,189$ 63,932$ 353,552$ 2,808,636$
-$ 1,185$ -$ 3,815$ -$ 146,501$ - - - - - 27,160 - - - - 200 149,753 - - - - - 16,310
- 1,185 - 3,815 200 339,724
- - 8 - 198,669 198,677
- - - - 154,683 295,678 556,584 15,367 209,181 60,117 - 1,974,557
556,584 15,367 209,181 60,117 154,683 2,270,235
556,584$ 16,552$ 209,189$ 63,932$ 353,552$ 2,808,636$
CapitalProject Funds
6 - 3

City of FentonOther Supplementary Information
Combining Statement of Revenues, Expenditures and Changes in Fund BalancesNonmajor Governmental Funds
For the Year Ended June 30, 2020
Local Parks and Garbage NarcoticsStreet Recreation Cemetery CDBG Collection Enforcement
RevenuesIntergovernmental 383,000$ -$ -$ 2,702$ -$ -$ Charges for services - 33,897 32,099 - 535,368 - Interest income 1,016 6,832 2,690 - - - Other revenue - 1,125 - - - -
Total revenues 384,016 41,854 34,789 2,702 535,368 -
ExpendituresCurrent
General government - - 63,163 - - - Public safety - - - - - - Public works 552,941 - - - 513,040 - Community and economic development - - - 2,702 - - Recreation and culture - 148,253 - - - - Other functions - - - - - -
Capital outlay - - - - - - Debt service
Principal retirement - - - - - - Interest and fiscal charges - - - - - -
Total expenditures 552,941 148,253 63,163 2,702 513,040 -
Excess (deficiency) of revenues over (under) expenditures (168,925) (106,399) (28,374) - 22,328 -
Other financing sources (uses)Transfers in 130,000 100,000 38,819 - - - Transfers out - - (2,819) - - -
Total other financing sources (uses) 130,000 100,000 36,000 - - -
Net change in fund balances (38,925) (6,399) 7,626 - 22,328 -
Fund balances - beginning of year 169,372 134,296 283,733 - 64,117 3,188
Fund balances - end of year 130,447$ 127,897$ 291,359$ -$ 86,445$ 3,188$
Revenue FundsSpecial
6 - 4

City of FentonOther Supplementary Information
Combining Statement of Revenues, Expenditures and Changes in Fund BalancesNonmajor Governmental Funds
For the Year Ended June 30, 2020
RevenuesIntergovernmentalCharges for servicesInterest incomeOther revenue
Total revenues
ExpendituresCurrent
General governmentPublic safetyPublic worksCommunity and economic developmentRecreation and cultureOther functions
Capital outlayDebt service
Principal retirementInterest and fiscal charges
Total expenditures
Excess (deficiency) of revenues over (under) expenditures
Other financing sources (uses)Transfers inTransfers out
Total other financing sources (uses)
Net change in fund balances
Fund balances - beginning of year
Fund balances - end of year
Emergency Public Fire Police Fire LadderD.A.R.E. 911 Communications Equipment Equipment Truck
-$ -$ 20,783$ -$ -$ 50,000$ - 221,643 - - - -
215 206 113 559 1,137 3,645 - - - - - -
215 221,849 20,896 559 1,137 53,645
- - - - - - 784 357,995 25,000 - - -
- - - - - - - - - - - - - - - - - - - - 2,844 - - - - - - 70,264 - -
- - - - - - - - - - - -
784 357,995 27,844 70,264 - -
(569) (136,146) (6,948) (69,705) 1,137 53,645
- 130,500 6,767 100,000 25,000 - - - - - - -
- 130,500 6,767 100,000 25,000 -
(569) (5,646) (181) 30,295 26,137 53,645
24,669 18,338 10,729 21,593 101,228 354,729
24,100$ 12,692$ 10,548$ 51,888$ 127,365$ 408,374$
Revenue FundsSpeical
Projects FundsCapital
6 - 5
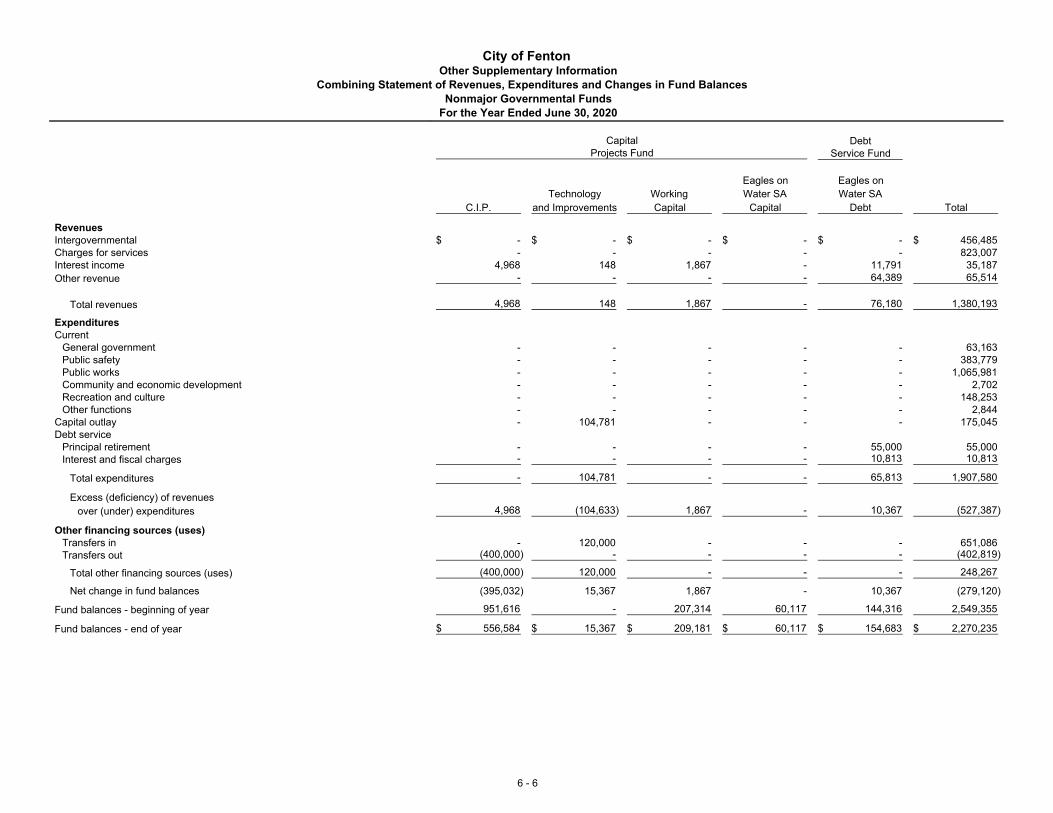
City of FentonOther Supplementary Information
Combining Statement of Revenues, Expenditures and Changes in Fund BalancesNonmajor Governmental Funds
For the Year Ended June 30, 2020
RevenuesIntergovernmentalCharges for servicesInterest incomeOther revenue
Total revenues
ExpendituresCurrent
General governmentPublic safetyPublic worksCommunity and economic developmentRecreation and cultureOther functions
Capital outlayDebt service
Principal retirementInterest and fiscal charges
Total expenditures
Excess (deficiency) of revenues over (under) expenditures
Other financing sources (uses)Transfers inTransfers out
Total other financing sources (uses)
Net change in fund balances
Fund balances - beginning of year
Fund balances - end of year
DebtService Fund
Eagles on Eagles onTechnology Working Water SA Water SA
C.I.P. and Improvements Capital Capital Debt Total
-$ -$ -$ -$ -$ 456,485$ - - - - - 823,007
4,968 148 1,867 - 11,791 35,187 - - - - 64,389 65,514
4,968 148 1,867 - 76,180 1,380,193
- - - - - 63,163 - - - - - 383,779 - - - - - 1,065,981 - - - - - 2,702 - - - - - 148,253 - - - - - 2,844 - 104,781 - - - 175,045
- - - - 55,000 55,000 - - - - 10,813 10,813
- 104,781 - - 65,813 1,907,580
4,968 (104,633) 1,867 - 10,367 (527,387)
- 120,000 - - - 651,086 (400,000) - - - - (402,819)
(400,000) 120,000 - - - 248,267
(395,032) 15,367 1,867 - 10,367 (279,120)
951,616 - 207,314 60,117 144,316 2,549,355
556,584$ 15,367$ 209,181$ 60,117$ 154,683$ 2,270,235$
Projects FundCapital
6 - 6

Local Street Fund ActualOver (Under)
FinalOriginal Final Actual Budget
RevenuesIntergovernmental 394,350$ 394,350$ 383,000$ (11,350)$ Interest income - - 1,016 1,016
Total revenues 394,350 394,350 384,016 (10,334)
ExpendituresCurrent
Public works 514,575 521,173 552,941 31,768
Deficiency of revenues under expenditures (120,225) (126,823) (168,925) (42,102)
Other financing sourcesTransfers in 130,000 130,000 130,000 -
Net change in fund balance 9,775 3,177 (38,925) (42,102)
Fund balance - beginning of year 169,372 169,372 169,372 -
Fund balance - end of year 179,147$ 172,549$ 130,447$ (42,102)$
Budgeted Amounts
City of FentonOther Supplementary Information
Schedule of Revenues, Expenditures, and Changes in Fund Balance - Budget and ActualNonmajor Special Revenue FundsFor the Year Ended June 30, 2020
6 - 7

Parks and Recreation Fund ActualOver (Under)
FinalOriginal Final Actual Budget
RevenuesCharges for services 30,000$ 30,000$ 33,897$ 3,897$ Interest income 6,000 6,000 6,832 832 Other revenue 1,000 2,000 1,125 (875)
Total revenues 37,000 38,000 41,854 3,854
ExpendituresCurrent
Recreation and culture 204,150 122,171 148,253 26,082
Deficiency of revenues under expenditures (167,150) (84,171) (106,399) (22,228)
Other financing sourcesTransfers in 150,000 100,000 100,000 -
Net change in fund balance (17,150) 15,829 (6,399) (22,228)
Fund balance - beginning of year 134,296 134,296 134,296 -
Fund balance - end of year 117,146$ 150,125$ 127,897$ (22,228)$
Budgeted Amounts
City of FentonOther Supplementary Information
Schedule of Revenues, Expenditures, and Changes in Fund Balance - Budget and ActualNonmajor Special Revenue FundsFor the Year Ended June 30, 2020
6 - 8

Cemetery Fund ActualOver (Under)
FinalOriginal Final Actual Budget
RevenuesCharges for services 25,500$ 26,000$ 32,099$ 6,099$ Interest income - - 2,690 2,690
Total revenues 25,500 26,000 34,789 8,789
ExpendituresCurrent
General government 70,250 50,150 63,163 13,013
Deficiency of revenues under expenditures (44,750) (24,150) (28,374) (4,224)
Other financing sources (uses)Transfers in 36,000 36,000 38,819 2,819 Transfers out (3,500) - (2,819) (2,819)
Total other financing sources 32,500 36,000 36,000 -
Net change in fund balance (12,250) 11,850 7,626 (4,224)
Fund balance - beginning of year 283,733 283,733 283,733 -
Fund balance - end of year 271,483$ 295,583$ 291,359$ (4,224)$
Budgeted Amounts
City of FentonOther Supplementary Information
Schedule of Revenues, Expenditures, and Changes in Fund Balance - Budget and ActualNonmajor Special Revenue FundsFor the Year Ended June 30, 2020
6 - 9

CDBG Fund ActualOver (Under)
FinalOriginal Final Actual Budget
RevenuesIntergovernmental 55,329$ 6,275$ 2,702$ (3,573)$
ExpendituresCurrent
Community and economic development 55,329 6,275 2,702 (3,573)
Net change in fund balance - - - -
Fund balance - beginning of year - - - -
Fund balance - end of year -$ -$ -$ -$
Budgeted Amounts
City of FentonOther Supplementary Information
Schedule of Revenues, Expenditures, and Changes in Fund Balance - Budget and ActualNonmajor Special Revenue FundsFor the Year Ended June 30, 2020
6 - 10

Garbage Collection Fund ActualOver (Under)
FinalOriginal Final Actual Budget
RevenuesCharges for services 514,000$ 531,870$ 535,368$ 3,498$
ExpendituresCurrent
Public works 509,000 509,550 513,040 3,490
Net change in fund balance 5,000 22,320 22,328 8
Fund balance - beginning of year 64,117 64,117 64,117 -
Fund balance - end of year 69,117$ 86,437$ 86,445$ 8$
Budgeted Amounts
City of FentonOther Supplementary Information
Schedule of Revenues, Expenditures, and Changes in Fund Balance - Budget and ActualNonmajor Special Revenue FundsFor the Year Ended June 30, 2020
6 - 11

Narcotics Enforcement Fund ActualOver (Under)
FinalOriginal Final Actual Budget
ExpendituresCurrent
Public safety 600 -$ -$ -$
Net change in fund balance (600) - - -
Fund balance - beginning of year 3,188 3,188 3,188 -
Fund balance - end of year 2,588$ 3,188$ 3,188$ -$
Budgeted Amounts
City of FentonOther Supplementary Information
Schedule of Revenues, Expenditures, and Changes in Fund Balance - Budget and ActualNonmajor Special Revenue FundsFor the Year Ended June 30, 2020
6 - 12

D.A.R.E. Fund ActualOver (Under)
FinalOriginal Final Actual Budget
RevenuesInterest income -$ -$ 215$ 215$
ExpendituresCurrent
Public safety 10,600 1,000 784 (216)
Net change in fund balance (10,600) (1,000) (569) 431
Fund balance - beginning of year 24,669 24,669 24,669 -
Fund balance - end of year 14,069$ 23,669$ 24,100$ 431$
Budgeted Amounts
City of FentonOther Supplementary Information
Schedule of Revenues, Expenditures, and Changes in Fund Balance - Budget and ActualNonmajor Special Revenue FundsFor the Year Ended June 30, 2020
6 - 13

Emergency 911 Fund ActualOver (Under)
FinalOriginal Final Actual Budget
RevenuesCharges for services 227,500$ 221,800$ 221,643$ (157)$ Interest income - - 206 206
Total revenues 227,500 221,800 221,849 49
ExpendituresCurrent
Public safety 339,750 339,750 357,995 18,245
Deficiency of revenues under expenditures (112,250) (117,950) (136,146) (18,196)
Other financing sourcesTransfers in 112,250 130,500 130,500 -
Net change in fund balance - 12,550 (5,646) (18,196)
Fund balance - beginning of year 18,338 18,338 18,338 -
Fund balance - end of year 18,338$ 30,888$ 12,692$ (18,196)$
Budgeted Amounts
City of FentonOther Supplementary Information
Schedule of Revenues, Expenditures, and Changes in Fund Balance - Budget and ActualNonmajor Special Revenue FundsFor the Year Ended June 30, 2020
6 - 14

Public Communications Fund ActualOver (Under)
FinalOriginal Final Actual Budget
RevenuesIntergovernmental 23,500$ 20,783$ 20,783$ -$ Interest income - - 113 113
Total revenues 23,500 20,783 20,896 113
ExpendituresCurrent
Public safety 25,000 25,000 25,000 - Other functions 3,500 2,550 2,844 294
Total expenditures 28,500 27,550 27,844 294
Deficiency of revenues under expenditures (5,000) (6,767) (6,948) (181)
Other financing sourcesTransfers in 4,500 6,767 6,767 -
Net change in fund balance (500) - (181) (181)
Fund balance - beginning of year 10,729 10,729 10,729 -
Fund balance - end of year 10,229$ 10,729$ 10,548$ (181)$
Budgeted Amounts
City of FentonOther Supplementary Information
Schedule of Revenues, Expenditures, and Changes in Fund Balance - Budget and ActualNonmajor Special Revenue FundsFor the Year Ended June 30, 2020
6 - 15

Fire Equipment Fund ActualOver (Under)
FinalOriginal Final Actual Budget
RevenuesInterest income -$ -$ 559$ 559$
ExpendituresCapital outlay 306,909 306,909 70,264 (236,645)
Deficiency of revenues under expenditures (306,909) (306,909) (69,705) 237,204
Other financing sources (uses)Transfers in 100,000 100,000 100,000 - Bond/note proceeds 306,909 306,909 - (306,909)
Total other financing sources (uses) 406,909 406,909 100,000 (306,909)
Net change in fund balance 100,000 100,000 30,295 (69,705)
Fund balance - beginning of year 21,593 21,593 21,593 -
Fund balance - end of year 121,593$ 121,593$ 51,888$ (69,705)$
Budgeted Amounts
City of FentonOther Supplementary Information
Schedule of Revenues, Expenditures, and Changes in Fund Balance - Budget and ActualNonmajor Capital Projects FundsFor the Year Ended June 30, 2020
6 - 16

Police Equipment Fund ActualOver (Under)
FinalOriginal Final Actual Budget
RevenuesInterest income -$ -$ 1,137$ 1,137$
Other financing sourcesTransfers in 25,000 25,000 25,000 -
Net change in fund balance 25,000 25,000 26,137 1,137
Fund balance - beginning of year 101,228 101,228 101,228 -
Fund balance - end of year 126,228$ 126,228$ 127,365$ 1,137$
Budgeted Amounts
City of FentonOther Supplementary Information
Schedule of Revenues, Expenditures, and Changes in Fund Balance - Budget and ActualNonmajor Capital Projects FundsFor the Year Ended June 30, 2020
6 - 17

Fire Ladder Truck Fund ActualOver (Under)
FinalOriginal Final Actual Budget
RevenuesState-shared revenue 50,000$ 50,000$ 50,000$ -$ Interest income - - 3,645 3,645
Net change in fund balance 50,000 50,000 53,645 3,645
Fund balance - beginning of year 354,729 354,729 354,729 -
Fund balance - end of year 404,729$ 404,729$ 408,374$ 3,645$
Budgeted Amounts
City of FentonOther Supplementary Information
Schedule of Revenues, Expenditures, and Changes in Fund Balance - Budget and ActualNonmajor Capital Projects FundsFor the Year Ended June 30, 2020
6 - 18

C.I.P. Fund ActualOver (Under)
FinalOriginal Final Actual Budget
RevenuesInterest income -$ -$ 4,968$ 4,968$
Other financing usesTransfers out (200,000) (400,000) (400,000) -
Net change in fund balance (200,000) (400,000) (395,032) 4,968
Fund balance - beginning of year 951,616 951,616 951,616 -
Fund balance - end of year 751,616$ 551,616$ 556,584$ 4,968$
Budgeted Amounts
City of FentonOther Supplementary Information
Schedule of Revenues, Expenditures, and Changes in Fund Balance - Budget and ActualNonmajor Capital Projects FundsFor the Year Ended June 30, 2020
6 - 19

Technology and Improvements ActualOver (Under)
FinalOriginal Final Actual Budget
RevenuesInterest income -$ -$ 148$ 148$
ExpendituresCapital outlay - 110,000 104,781 (5,219)
Deficiency of revenues under expenditures - (110,000) (104,633) 5,367
Other financing sourcesTransfers in - 120,000 120,000 -
Net change in fund balance - 10,000 15,367 5,367
Fund balance - beginning of year - - - -
Fund balance - end of year -$ 10,000$ 15,367$ 5,367$
Budgeted Amounts
City of FentonOther Supplementary Information
Schedule of Revenues, Expenditures, and Changes in Fund Balance - Budget and ActualNonmajor Capital Projects FundsFor the Year Ended June 30, 2020
6 - 20

Working Capital Fund ActualOver (Under)
FinalOriginal Final Actual Budget
RevenuesInterest income -$ -$ 1,867$ 1,867$ Other revenue 3,075 3,075 - (3,075)
Total revenues 3,075 3,075 1,867 (1,208)
ExpendituresCommunity and economic development 3,510 2,830 - (2,830)
Excess (deficiency) of revenues over (under) expenditures (435) 245 1,867 1,622
Other financing sourcesTransfers out (100,000) (50,000) - 50,000
Net change in fund balance (100,435) (49,755) 1,867 51,622
Fund balance - beginning of year 207,314 207,314 207,314 -
Fund balance - end of year 106,879$ 157,559$ 209,181$ 51,622$
Budgeted Amounts
City of FentonOther Supplementary Information
Schedule of Revenues, Expenditures, and Changes in Fund Balance - Budget and ActualNonmajor Capital Projects FundsFor the Year Ended June 30, 2020
6 - 21

Eagles on Water SA Capital Fund ActualOver (Under)
FinalOriginal Final Actual Budget
Revenues -$ -$ -$ -$
Expenditures - - - -
Net change in fund balance - - - -
Fund balance - beginning of year 60,117 60,117 60,117 -
Fund balance - end of year 60,117$ 60,117$ 60,117$ -$
Budgeted Amounts
City of FentonOther Supplementary Information
Schedule of Revenues, Expenditures, and Changes in Fund Balance - Budget and ActualNonmajor Debt Service Funds
For the Year Ended June 30, 2020
6 - 22
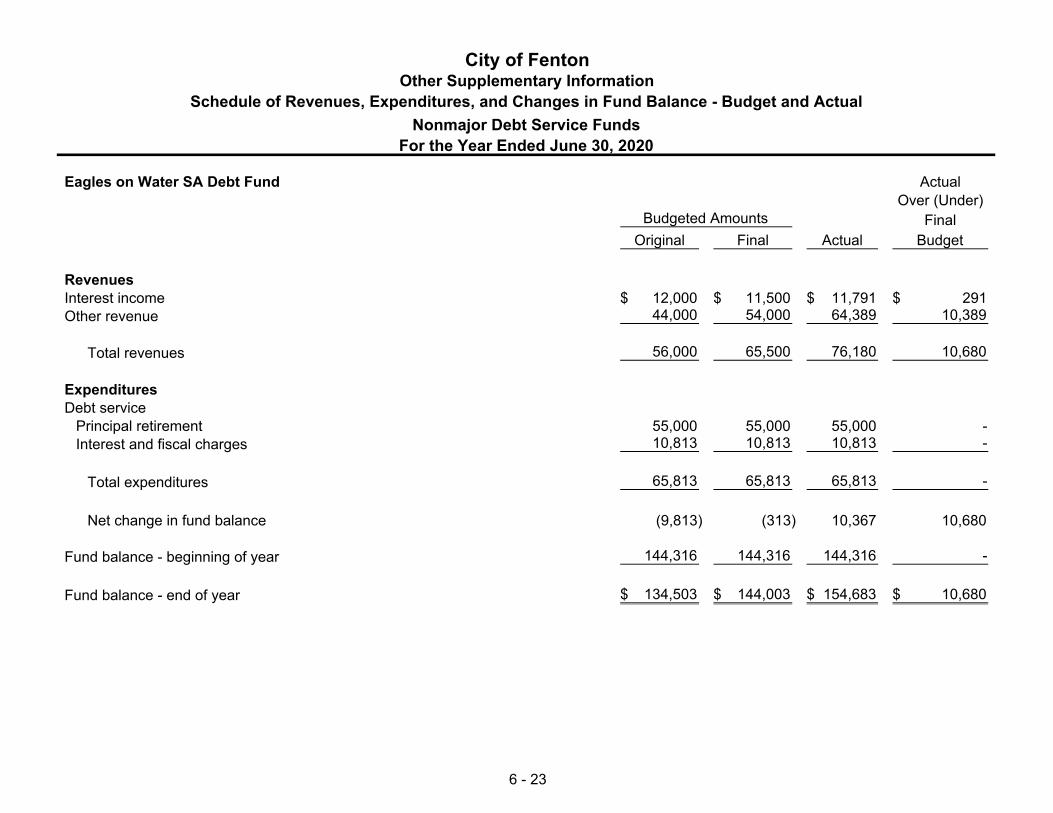
Eagles on Water SA Debt Fund ActualOver (Under)
FinalOriginal Final Actual Budget
RevenuesInterest income 12,000$ 11,500$ 11,791$ 291$ Other revenue 44,000 54,000 64,389 10,389
Total revenues 56,000 65,500 76,180 10,680
ExpendituresDebt service
Principal retirement 55,000 55,000 55,000 - Interest and fiscal charges 10,813 10,813 10,813 -
Total expenditures 65,813 65,813 65,813 -
Net change in fund balance (9,813) (313) 10,367 10,680
Fund balance - beginning of year 144,316 144,316 144,316 -
Fund balance - end of year 134,503$ 144,003$ 154,683$ 10,680$
Budgeted Amounts
City of FentonOther Supplementary Information
Schedule of Revenues, Expenditures, and Changes in Fund Balance - Budget and ActualNonmajor Debt Service Funds
For the Year Ended June 30, 2020
6 - 23

City of FentonInternal Service Funds
Fund Descriptions
Equipment Fund - To account for the costs of operating and maintaining certain automotive and street maintenance equipment used by various Citydepartments. Such costs are billed to the other departments based on rental rates established by the State of Michigan Department of Highways andTransportation. Actual costs include depreciation on the machinery and equipment used to provide the service. The majority of the machinery and equipmentmaintained in this fund was purchased by other City departments. Replacement of the assets will be financed by Equipment Fund resources and continuedcontributions from other funds.
Sick Pay Fund - To account for the financing of accumulated sick pay earned by City employees. City funds contribute resources equal to the amounts earnedby the employees during the current period.

Equipment Sick Pay TotalAssetsCurrent assets
Cash 478,227$ 309,346$ 787,573$ Due from other funds 656 - 656
Total current assets 478,883 309,346 788,229
Noncurrent assetsCapital assets, net of accumulated depreciation 521,751 - 521,751
Total assets 1,000,634 309,346 1,309,980
LiabilitiesCurrent liabilities
Accounts payable 13,841 - 13,841 Accrued and other liabilities 120 - 120 Due to other funds 17,088 - 17,088 Current portion of compensated absences - 53,450 53,450
Total current liabilities 31,049 53,450 84,499
Noncurrent liabilitiesNoncurrent portion of compensated absences - 233,425 233,425
Total liabilities 31,049 286,875 317,924
Net PositionNet investment in capital assets 521,751 - 521,751 Unrestricted 447,834 22,471 470,305
Total net position 969,585$ 22,471$ 992,056$
City of FentonInternal Service Funds
Combining Statement of Net PositionJune 30, 2020
6 - 24

Equipment Sick Pay TotalOperating revenueBillings to other funds 543,551$ -$ 543,551$ Other revenue 876 32,144 33,020
Total operating revenue 544,427 32,144 576,571
Operating expensesPersonnel services 46,093 - 46,093 Supplies 128,892 - 128,892 Utilities 38,730 - 38,730 Repairs and maintenance 113,418 - 113,418 Other expenses 105,494 121,441 226,935 Depreciation 150,180 - 150,180
Total operating expenses 582,807 121,441 704,248
Operating loss (38,380) (89,297) (127,677)
Nonoperating revenueGain on sale of assets 14,104 - 14,104
Loss before transfers (20,008) (89,297) (109,305)
Transfers in - 89,297 89,297
Change in net position (20,008) - (20,008)
Net position - beginning of year 989,593 22,471 1,012,064
Net position - end of year 969,585$ 22,471$ 992,056$
City of FentonInternal Service Funds
Combining Statement of Revenues, Expenses and Changes in Net PositionFor the Year Ended June 30, 2020
6 - 25

Equipment Sick Pay TotalCash flows from operating activitiesReceipts from interfund users 562,122$ 106,935$ 669,057$ Payments to suppliers (436,106) - (436,106) Payments to employees (46,093) (121,441) (167,534)
Net cash provided (used) by operating activities 79,923 (14,506) 65,417
Cash flows from noncapital financing activitiesTransfer from other funds - 89,297 89,297
Cash flows from capital and related financing activitiesPurchases/construction of capital assets (260,500) - (260,500) Proceeds from sale of capital assets 18,589 - 18,589
Net cash used by capital and related financing activities (241,911) - (241,911)
Cash flows from investing activitiesInterest received 4,268 - 4,268
Net change in cash (157,720) 74,791 (82,929)
Cash - beginning of year 635,947 234,555 870,502
Cash - end of year 478,227$ 309,346$ 787,573$
City of FentonInternal Service Funds
Combining Statement of Cash FlowsFor the Year Ended June 30, 2020
6 - 26

Equipment Sick Pay Total
City of FentonInternal Service Funds
Combining Statement of Cash FlowsFor the Year Ended June 30, 2020
Reconciliation of operating income (loss) to net cashprovided by operating activities
Operating income (loss) (38,380)$ (89,297)$ (127,677)$ Adjustments to reconcile operating income (loss) to net cash
provided by operating activitiesDepreciation 150,180 - 150,180
Changes in assets and liabilitiesDue from other funds 607 - 607 Accounts payable (49,062) - (49,062) Accrued and other liabilities (510) - (510) Due to other funds 17,088 - 17,088 Compensated absences - 74,791 74,791
Net cash provided (used) by operating activities 79,923$ (14,506)$ 65,417$
6 - 27
Community Center - To account for amounts held for the benefit of the Fenton Community Center.
City of FentonFiduciary Funds
Fund Descriptions
Tax Collection Fund - To account for the collection and payment to the county and school districts for property taxes collected by the City on their behalf.
Employees Union Fund - To account for amounts withheld from City employee payroll related to union dues and related payments.

FentonTax Employees Community
Collection Union Center TotalAssetsCash 16,193$ 9,300$ 30,268$ 55,761$
LiabilitiesDue to other units of government 16,193 - - 16,193 Due to union groups - 9,300 - 9,300
Total liabilities 16,193 9,300 - 25,493
Net PositionRestricted for fiduciary activities - - 30,268 30,268
Total net position -$ -$ 30,268$ 30,268$
City of FentonFiduciary Funds
Combining Statement of Fiduciary Net PositionJune 30, 2020
Custodial Funds
6 - 28
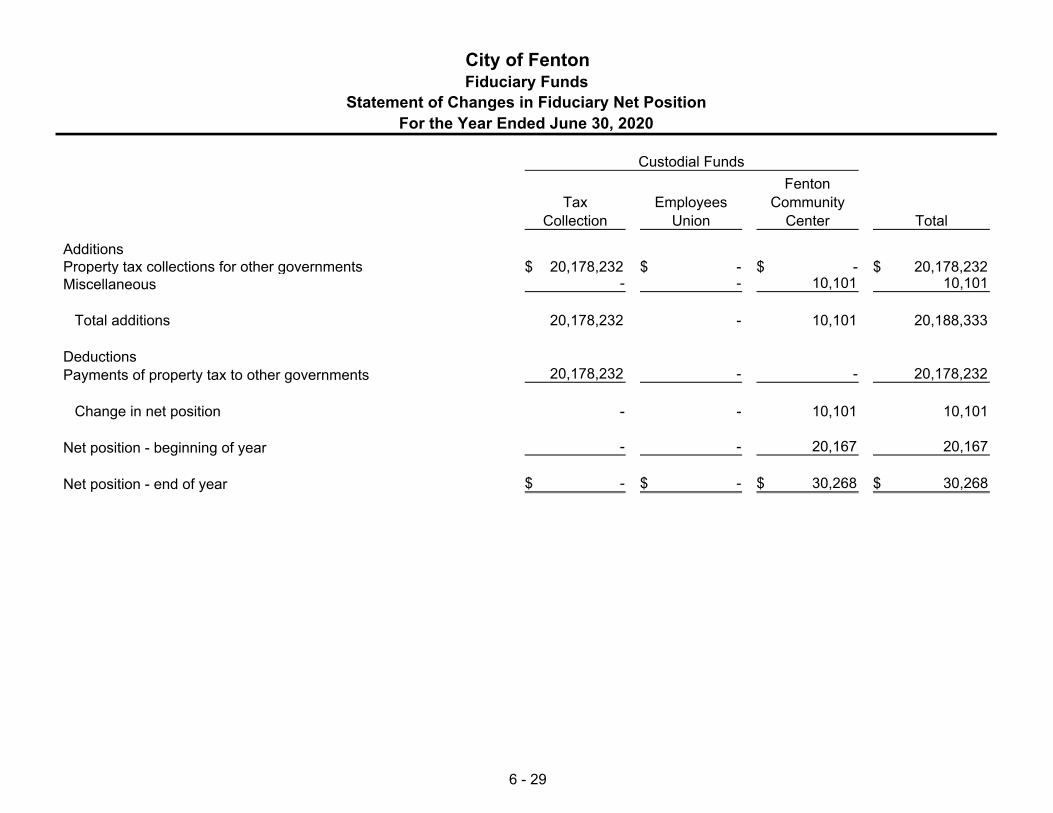
FentonTax Employees Community
Collection Union Center Total
AdditionsProperty tax collections for other governments 20,178,232$ -$ -$ 20,178,232$ Miscellaneous - - 10,101 10,101
Total additions 20,178,232 - 10,101 20,188,333
DeductionsPayments of property tax to other governments 20,178,232 - - 20,178,232
Change in net position - - 10,101 10,101
Net position - beginning of year - - 20,167 20,167
Net position - end of year -$ -$ 30,268$ 30,268$
Custodial Funds
City of FentonFiduciary Funds
Statement of Changes in Fiduciary Net PositionFor the Year Ended June 30, 2020
6 - 29

Special Capital 2013 BondRevenue Projects Construction
Fund Fund Fund Total
AssetsCash 1,484,074$ 252,573$ 60,109$ 1,796,756$ Receivables
Customers - - 36,000 36,000 Accrued interest and other - 6,295 - 6,295
Total assets 1,484,074$ 258,868$ 96,109$ 1,839,051$
LiabilitiesAccounts payable -$ 13,803$ 1,500$ 15,303$ Accrued and other liabilities - 6,289 - 6,289 Due to other units of government - 622 - 622
Total liabilities - 20,714 1,500 22,214
Deferred Inflows of ResourcesUnavailable revenue - - 36,000 36,000
Fund BalancesAssigned 1,484,074 238,154 58,609 1,780,837
Total liabilities, deferred inflows of resources, and fund balances 1,484,074$ 258,868$ 96,109$ 1,839,051$
City of Fenton
Combining Balance Sheet - Downtown Development AuthorityJune 30, 2020
Component Unit Funds
6 - 30

Total fund balances - component unit 1,780,837$
Total net position for component unit in the statement of net position is different because:
Capital assets used in component unit activities are not financial resources and therefore are not reported in the funds. The cost of capital assets 459,140 Accumulated depreciation (29,122)
Certain receivables are not available to pay for current period expenditures and, therefore are deferred in the funds. 36,000
Certain liabilities are not due and payable in the current period and are not reported in the funds. Accrued interest (31,692)
Long-term liabilities applicable to component unit activities are not due and payable in the current period and, accordingly,are not reported as fund liabilities. Long-term liabilities at year-end consist of: Bonds payable and related items (4,309,243) Unamortized deferred amounts on debt issuance 8,722
Net position of component unit activities (2,085,358)$
City of FentonComponent Unit Funds
Reconciliation of the Combining Balance Sheet to the Statement of Net Position - Downtown Development Authority
June 30, 2020
6 - 31
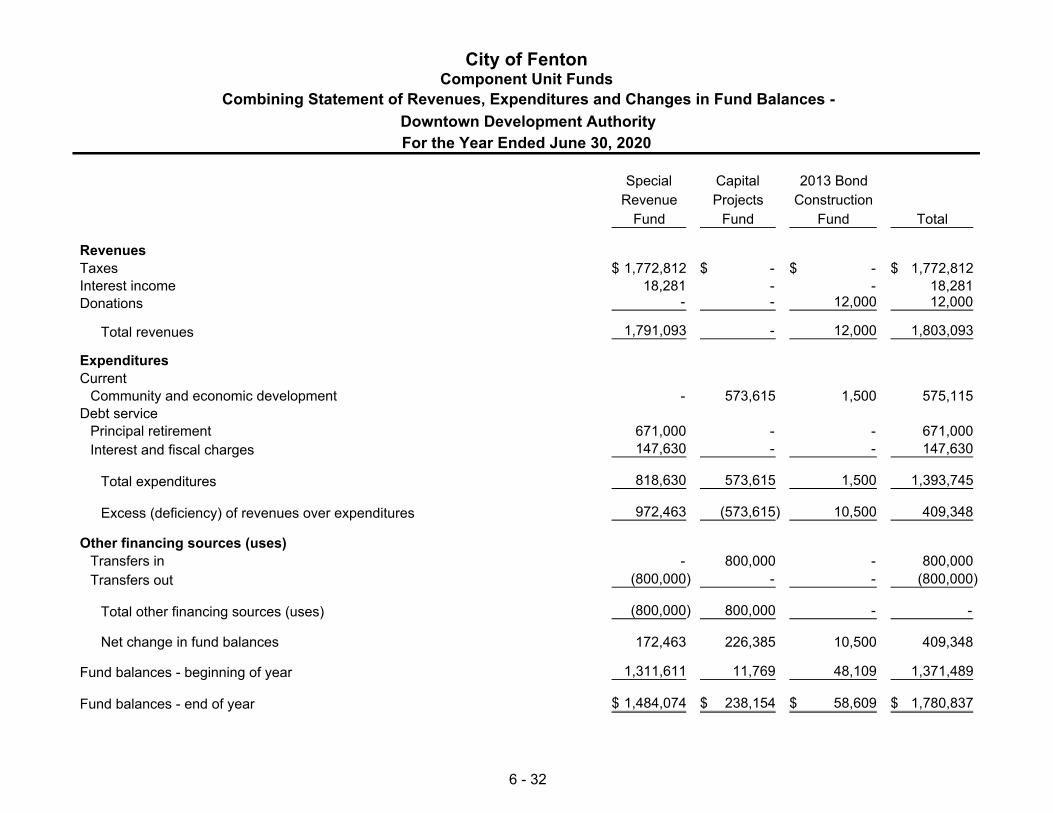
Special Capital 2013 BondRevenue Projects Construction
Fund Fund Fund Total
RevenuesTaxes 1,772,812$ -$ -$ 1,772,812$ Interest income 18,281 - - 18,281 Donations - - 12,000 12,000
Total revenues 1,791,093 - 12,000 1,803,093
ExpendituresCurrent
Community and economic development - 573,615 1,500 575,115 Debt service
Principal retirement 671,000 - - 671,000 Interest and fiscal charges 147,630 - - 147,630
Total expenditures 818,630 573,615 1,500 1,393,745
Excess (deficiency) of revenues over expenditures 972,463 (573,615) 10,500 409,348
Other financing sources (uses)Transfers in - 800,000 - 800,000 Transfers out (800,000) - - (800,000)
Total other financing sources (uses) (800,000) 800,000 - -
Net change in fund balances 172,463 226,385 10,500 409,348
Fund balances - beginning of year 1,311,611 11,769 48,109 1,371,489
Fund balances - end of year 1,484,074$ 238,154$ 58,609$ 1,780,837$
City of FentonComponent Unit Funds
Combining Statement of Revenues, Expenditures and Changes in Fund Balances -
For the Year Ended June 30, 2020 Downtown Development Authority
6 - 32

Net change in fund balances - component unit 409,348$
Total change in net position reported for component unit activities in the statement of activities is different because:
Component unit funds report capital outlays as expenditures. However, in the statement of activities the cost of those assets is allocated over their estimated useful lives and reported as depreciation expense.
Depreciation expense (2,742)
Revenues in the statement of activities that do not provide current financial resources are not reported as revenue in the funds.
Change in deferred inflows of resources (12,000)
Expenses are recorded when incurred in the statement of activities Accrued interest 4,612
Bond proceeds are reported as financing sources in the component unit funds and thus contribute to the change infund balance. In the statement of net position, however, issuing debt increases long-term liabilities and does notaffect the statement of activities. Similarly, repayment of principal is an expenditure in the component unit funds but reduces the liability in the statement of net position.
Repayments of long-term debt 671,000 Amortization of deferred charge and premium (4,459)
Change in net position of component units 1,065,759$
City of FentonComponent Unit Funds
Reconciliation of the Combining Statement of Revenues, Expenditures, and Changes in Fund Balances of the Governmental Funds to the Statement of Activities - Downtown Development Authority
For the Year Ended June 30, 2020
6 - 33

Special CapitalRevenue Projects
Fund Fund Total
AssetsCash 1,345,776$ 143,567$ 1,489,343$ Accrued interest and other 108 - 108
Total assets 1,345,884$ 143,567$ 1,489,451$
LiabilitiesAccounts payable -$ 4,077$ 4,077$ Accrued and other liabilities - 607 607 Due to other units of government - 154 154
Total liabilities - 4,838 4,838
Fund BalancesCommitted 1,345,884 138,729 1,484,613
Total liabilities and fund balances 1,345,884$ 143,567$ 1,489,451$
City of Fenton
Combining Balance Sheet - Local Development Finance AuthorityJune 30, 2020
Component Unit Funds
6 - 34

Total fund balances - component unit 1,484,613$
Total net position for component unit activities in the statement of net position is different because:
Capital assets used in component unit activities are not financial resources and therefore are not reported in the funds. The cost of capital assets is 37,630 Accumulated depreciation is (31,358)
Net position of component unit activities 1,490,885$
City of FentonComponent Unit Funds
Reconciliation of the Combining Balance Sheet to the Statement of Net Position - Local Development Finance Authority
June 30, 2020
6 - 35

Special CapitalRevenue Projects
Fund Fund Total
RevenuesTaxes 138,146$ -$ 138,146$ Interest income 10,176 - 10,176
Total revenues 148,322 - 148,322
ExpendituresCurrent
Community and economic development - 93,518 93,518
Net change in fund balances 148,322 (93,518) 54,804
Fund balances - beginning of year 1,197,562 232,247 1,429,809
Fund balances - end of year 1,345,884$ 138,729$ 1,484,613$
City of Fenton
Combining Statement of Revenues, Expenditures and Changes in Fund Balances -
For the Year Ended June 30, 2020 Local Development Finance Authority
Component Unit Funds
6 - 36

Net change in fund balances - component unit 54,804$
Total change in net position reported for component unit activities in the statement of activities is different because:
Component unit funds report capital outlays as expenditures. However, in the statement of activities the cost of those assets is allocated over their estimated useful lives and reported as depreciation expense.
Depreciation expense (7,526)
Change in net position of component units 47,278$
City of FentonComponent Unit Funds
Reconciliation of the Combining Statement of Revenues, Expenditures, and Changes in Fund Balances of the Governmental Funds to the Statement of Activities - Local Development Finance Authority
For the Year Ended June 30, 2020
6 - 37

SpecialRevenue
Fund
AssetsCash and cash equivalents 175,804$
Fund Balance Committed 175,804$
City of FentonComponent Unit Funds
Balance Sheet - Brownfield Redevelopment AuthorityJune 30, 2020
Note: Reconciliation of the governmental fund balance sheet to the statement of net position for this component unit is not required as the fund balance was equal to net position as of June 30, 2020.
6 - 38

SpecialRevenue
Fund
RevenuesTaxes 161,720$
Fund balance - beginning of year 14,084
Fund balance - end of year 175,804$
Note: Reconciliation of the component unit fund statement of revenue, expenditures and changes in fund balances to the statement of activities for this component unit is not required as the net change in fund balance was equal to the change in net position as of June 30, 2020.
City of Fenton Component Unit Funds
Statement of Revenues, Expenditures and Changes in Fund Balances - Brownfield Redevelopment Authority
For the Year Ended June 30, 2020
6 - 39
Contents Page
Financial Trend Information: Net Position by Component 7 - 2 Changes in Governmental Net Position 7 - 3 Changes in Business-Type Net Position 7 - 4 Fund Balances, Governmental Funds 7 - 5 Changes in Fund Balances, Governmental Funds 7 - 6
Revenue Capacity Information: Taxable Value and Actual Value of Taxable Property 7 - 7 Direct and Overlapping Property Tax Rates 7 - 8 Principal Property Tax Payers 7 - 9 Property Tax Levies and Collections 7 - 10
Debt Capacity Information: Ratios of Outstanding Debt 7 - 11 Ratios of General Bonded Debt Outstanding 7 - 12 Direct and Overlapping Governmental Activities Debt 7 - 13 Legal Debt Margin 7 - 14 Pledged-Revenue Coverage 7 - 15
Demographic and Economic Information: Demographic and Economic Statistics 7 - 16 Principal Employment Industries 7 - 17
Operating Information: Full-time Equivalent Government Employees 7 - 18 Operating Indicators 7 - 19 Capital Asset statistics 7 - 20
City of FentonStatistical Section
This part of the City's comprehensive financial report presents detailed information as a context for understanding what the information in the financialstatements, note disclosures, and required supplementary information says about the government's overall financial health.
7 - 1

2011 2012 2013 2014 2015 2016 2017 2018 2019 2020 Governmental activities
Net investment in capital assets 15,323,859$ 14,984,354$ 15,226,130$ 14,595,457$ 17,991,239$ 19,539,308$ 19,284,057$ 19,643,720$ 19,373,806$ 19,470,085$ Restricted 141,844 306,634 342,981 325,746 466,969 646,525 22,058 12,697 147,939 524,574 Unrestricted 4,224,040 4,536,097 4,270,293 4,563,196 967,655 272,032 1,461,620 (1,470,045) (1,313,524) (2,971,200)
Total governmental activities net position $ 19,689,743 $ 19,827,085 $ 19,839,404 $ 19,484,399 $ 19,425,863 $ 20,457,865 $ 20,767,735 $ 18,186,372 $ 18,208,221 $ 17,023,459
Business-type activitiesNet investment in capital assets 21,994,491$ 22,430,452$ 22,299,268$ 22,864,031$ 22,870,359$ 23,677,936$ 23,923,985$ 24,544,260$ 24,825,036$ 24,792,153$ Restricted 897,379 899,207 902,777 903,659 718,141 497,023 497,524 498,022 511,144 519,555 Unrestricted 2,363,388 3,061,763 4,151,403 4,400,159 2,794,630 2,560,862 2,954,143 3,250,373 3,235,438 2,897,496
Total business-type activities net position $ 25,255,258 $ 26,391,422 $ 27,353,448 $ 28,167,849 $ 26,383,130 $ 26,735,821 $ 27,375,652 $ 28,292,655 $ 28,571,618 $ 28,209,204
Primary government in totalNet investment in capital assets $ 37,414,806 $ 37,513,398 $ 37,459,488 $ 40,861,598 $ 43,217,244 $ 43,217,244 $ 43,208,042 $ 44,187,980 $ 44,198,842 $ 44,262,238 Restricted 1,205,841 1,245,758 1,229,405 1,185,110 1,143,548 1,143,548 519,582 510,719 659,083 1,044,129 Unrestricted 7,597,860 8,421,696 8,963,355 3,762,285 2,832,894 2,832,894 4,415,763 1,780,328 1,921,914 (73,704)
Total primary government net position 46,218,507$ 47,180,852$ 47,652,248$ 45,808,993$ 47,193,686$ 47,193,686$ 48,143,387$ 46,479,027$ 46,779,839$ 45,232,663$
City of FentonNet Position by Component (Unaudited)
2011 - 2020
7 - 2

2011 2012 2013 2014 2015 2016 2017 2018 2019 2020 Expenses
General government 1,177,043$ 1,113,243$ 1,187,672$ 1,158,881$ 901,765$ 1,522,667$ 1,553,731$ 1,149,980$ 1,441,018$ 1,813,863$ Public safety 3,354,743 3,193,232 3,537,017 3,862,440 3,435,808 3,806,701 3,816,834 3,543,104 4,140,400 3,997,176 Public works 1,637,839 1,714,085 1,617,226 1,941,813 1,674,754 2,662,804 2,530,687 2,694,296 2,802,480 3,430,739 Community and economic development 118,270 81,215 148,585 146,317 80,389 136,692 48,530 58,557 39,533 45,349 Recreation and culture 250,303 247,276 233,723 235,592 197,997 242,489 333,480 192,464 480,990 384,197 Interest on long-term debt 18,035 14,838 10,728 5,384 2,685 42,771 18,463 18,109 17,617 15,608
Total governmental activities expenses 6,556,233$ 6,363,889$ 6,734,951$ 7,350,427$ 6,293,398$ 8,414,124$ 8,301,725$ 7,656,510$ 8,922,038$ 9,686,932$
Program revenuesCharges for services
General government 189,867$ 202,365$ 208,100$ 255,473$ 276,839$ 283,420$ 401,846$ 374,911$ 365,351$ 208,120$ Public safety 581,059 660,348 657,777 791,750 640,201 593,827 688,795 724,721 851,108 816,384 Public works 500,429 514,795 482,083 504,184 515,954 564,705 444,023 641,271 657,832 531,576 Recreation and culture 41,434 48,239 36,439 35,040 33,609 48,837 39,641 44,124 37,275 39,397
Total charges for services 1,312,789 1,425,747 1,384,399 1,586,447 1,466,603 1,490,789 1,574,305 1,785,027 1,911,566 1,595,477
Operating grants and contributions 812,924 848,615 853,534 994,172 1,027,860 915,938 1,097,117 1,412,528 1,745,084 1,470,888 Capital grants and contributions 37,659 53,961 369,868 96,490 2,300,171 2,291,884 57,875 78,873 53,287 52,702
Total program revenue 2,163,372 2,328,323 2,607,801 2,677,109 4,794,634 4,698,611 2,729,297 3,276,428 3,709,937 3,119,067
Net (expense) revenue (4,392,861)$ (4,035,566)$ (4,127,150)$ (4,673,318)$ (1,498,764)$ (3,715,513)$ (5,572,428)$ (4,380,082)$ (5,212,101)$ (6,567,865)$
General revenuesProperty taxes - unrestricted 3,802,193$ 3,363,316$ 3,262,058$ 3,322,738$ 3,424,206$ 3,534,843$ 3,708,882$ 3,778,621$ 3,917,821$ 4,113,868$ State-shared revenues - unrestricted 793,649 878,056 891,798 926,059 934,921 928,933 1,000,935 1,036,963 1,083,898 1,078,056 Investment earnings - unrestricted 22,824 11,975 8,650 5,537 865 21,275 7,310 23,632 67,559 74,681 Gain from sale of land - - - - - - 1,023,390 212,726 - - Miscellaneous 30,281 29,561 39,777 24,711 79,943 161,161 141,781 32,422 164,672 116,498
Total general revenues 4,648,947 4,282,908 4,202,283 4,279,045 4,439,935 4,646,212 5,882,298 5,084,364 5,233,950 5,383,103
Change in net position 256,086 247,342 75,133 (394,273) 2,941,171 930,699 309,870 704,282 21,849 (1,184,762)
Restated net position, beginning of the year 19,433,657 19,579,743 19,752,271 19,878,672 16,484,692 19,527,166 20,457,865 17,482,090 18,186,372 18,208,221
Net position, end of the year 19,689,743$ 19,827,085$ 19,827,404$ 19,484,399$ 19,425,863$ 20,457,865$ 20,767,735$ 18,186,372$ 18,208,221$ 17,023,459$
City of FentonChanges in Governmental Net Position (Unaudited)
2011 - 2020
7 - 3

2011 2012 2013 2014 2015 2016 2017 2018 2019 2020 Expenses
Water 2,697,917$ 2,295,676$ 2,550,571$ 2,520,564$ 2,798,558$ 2,814,340$ 2,818,907$ 2,854,236$ 2,779,415$ 3,158,884$ Sewer 2,265,302 2,082,283 2,120,388 2,350,065 2,443,606 2,362,559 2,416,564 2,392,440 2,530,069 3,180,274
Total expenses 4,963,219$ 4,377,959$ 4,670,959$ 4,870,629$ 5,242,164$ 5,176,899$ 5,235,471$ 5,246,676$ 5,309,484$ 6,339,158$
Program revenuesCharges for services Water 2,779,345$ 2,817,673$ 2,902,028$ 2,789,912$ 2,682,329$ 2,699,712$ 2,829,006$ 2,962,146$ 2,853,820$ 2,928,889$ Sewer 2,465,111 2,506,911 2,530,529 2,701,837 2,775,942 2,632,951 2,868,472 2,859,433 2,534,790 2,559,769
Total charges for services 5,244,456 5,324,584 5,432,557 5,491,749 5,458,271 5,332,663 5,697,478 5,821,579 5,388,610 5,488,658
Operating grants and contributions Water - - - - - 8,377 4,566 - 2,928,889 14,081
Capital grants and contributions Water - - - 1,155 - - - - - - Sewer - - - - - - - 100,000 - 316,443
Total capital grants and contributions - - - 1,155 - - - 100,000 - 316,443
Total program revenue 5,244,456 5,324,584 5,432,557 5,492,904 5,458,271 5,341,040 5,702,044 5,921,579 8,317,499 5,819,182
Net (expense) revenue 281,237$ 946,625$ 761,598$ 622,275$ 216,107$ 164,141$ 466,573$ 674,903$ 3,008,015$ (519,976)$
General revenuesInvestment earnings 16,270$ 80,003$ 81,470$ 69,254$ 68,472$ 69,103$ 69,502$ 73,393$ 92,421$ 94,888$ Miscellaneous 99,360 109,536 118,958 122,872 106,024 119,447 103,756 88,283 107,416 62,674
Total general revenues 115,630 189,539 200,428 192,126 174,496 188,550 173,258 161,676 199,837 157,562
Change in net position 396,867$ 1,136,164$ 962,026$ 814,401$ 390,603$ 352,691$ 639,831$ 836,579$ 3,207,852$ (362,414)$
City of FentonChanges in Business-Type Net Position (Unaudited)
2011 - 2020
7 - 4

2011 2012 2013 2014 2015 2016 2017 2018 2019 2020 General Fund
Nonspendable 34,333$ 259,318$ 114,866$ 128,536$ 205,844$ 225,256$ 113,258$ 245,912$ 133,975$ 112,653$ Unassigned 2,020,003 1,824,928 1,997,467 2,072,217 2,063,205 2,271,469 3,627,539 4,065,648 4,638,620 4,518,937
Total General Fund 2,054,336$ 2,084,246$ 2,112,333$ 2,200,753$ 2,269,049$ 2,496,725$ 3,740,797$ 4,311,560$ 4,772,595$ 4,631,590$
All other governmental fundsNonspendable 124,116$ 109,426$ 34,844$ 6,115$ 180,406$ -$ 5,200$ -$ 1,745$ -$ Restricted 141,844 306,634 342,981 325,746 466,969 646,525 586,715 479,710 778,420 530,829 Committed 1,681,517 2,234,661 2,453,146 2,814,515 2,225,843 2,249,902 2,374,910 2,428,679 2,223,193 1,974,557
Total all other governmental fund 1,947,477$ 2,650,721$ 2,830,971$ 3,146,376$ 2,873,218$ 2,896,427$ 2,966,825$ 2,908,389$ 3,003,358$ 2,505,386$
City of FentonFund Balances - Governmental Funds (Unaudited)
2011 - 2020
7 - 5

2011 2012 2013 2014 2015 2016 2017 2018 2019 2020 Revenues
Taxes 3,911,729$ 3,385,278$ 3,348,895$ 3,322,738$ 3,424,206$ 3,580,480$ 3,708,882$ 3,778,621$ 3,917,821$ 4,113,868$ Licenses and permits 218,991 241,133 261,742 385,792 361,176 315,977 341,797 532,383 523,336 461,317 Intergovernmental 1,642,926 1,763,701 1,770,023 1,958,266 2,119,347 2,086,654 2,151,470 2,523,257 2,876,495 2,597,316 Charges for services 949,460 1,017,853 956,694 1,024,081 952,684 1,000,674 1,111,853 1,120,541 1,259,607 1,051,269 Fines and forfeitures 62,174 63,386 69,385 86,273 56,117 59,182 66,954 63,172 58,811 62,578 Interest and rents 90,649 78,983 75,167 71,163 65,576 87,428 88,505 106,417 91,579 89,441 Proceeds from sale of land - - - - - - 1,023,390 212,726 - - Other 45,928 82,860 138,420 107,841 115,488 163,121 213,991 119,600 272,574 236,233
Total revenues 6,921,857 6,633,194 6,620,326 6,956,154 7,094,594 7,293,516 8,706,842 8,456,717 9,000,223 8,612,022
ExpendituresCurrent
General government 976,708 897,923 931,392 978,534 1,036,510 1,191,988 1,409,092 1,313,739 1,150,655 1,245,170 Public safety 2,903,285 2,751,813 2,887,330 3,210,569 3,104,603 3,118,232 3,268,382 3,454,965 3,716,776 3,516,958 Public works 1,617,583 1,492,077 1,866,562 1,727,676 2,364,363 1,830,656 1,881,552 1,428,300 2,026,322 2,438,551 Community and economic development 107,135 76,674 121,515 120,753 112,344 119,269 48,776 66,613 37,718 42,217 Recreation and culture 217,033 215,869 193,117 197,247 238,822 209,242 328,020 210,858 452,128 350,565 Other 305,755 216,098 312,066 239,149 285,125 306,052 269,311 291,392 333,554 346,150
Capital outlay - 30,956 - - 38,088 692,752 52,172 1,351,681 641,219 1,114,841 Debt service
Principal 89,372 92,371 95,710 110,023 113,579 71,087 97,055 72,002 89,806 90,791 Interest and fiscal charges 19,258 16,259 12,920 9,693 6,137 11,712 16,480 16,452 18,433 16,459
Total Expenditures 6,236,129 5,790,040 6,420,612 6,593,644 7,299,571 7,550,990 7,370,840 8,206,002 8,466,611 9,161,702
Excess (deficiency) of revenues over expenditures 685,728 843,154 199,714 362,510 (204,977) (257,474) 1,336,002 250,715 533,612 (549,680)
Other Financing Sources (Uses)Debt issuance - - 8,623 41,315 - 543,900 - - - - Note proceeds - - - - - - - 261,612 - - Transfers in 1,203,172 1,281,541 1,397,520 835,500 1,455,729 687,313 579,925 749,042 537,457 1,051,086 Transfers out (1,203,172) (1,281,541) (1,397,520) (835,500) (1,455,614) (722,854) (601,457) (749,042) (515,065) (1,140,383)
Total other financing sources (uses) - - 8,623 41,315 115 508,359 (21,532) 261,612 22,392 (89,297)
Net change in fund balances 685,728 843,154 208,337 403,825 (204,862) 250,885 1,314,470 512,327 556,004 (638,977)
Fund Balances - Beginning of year 3,316,085 3,891,813 4,734,967 4,943,304 5,347,129 5,142,267 5,393,152 6,707,622 7,219,949 7,775,953
Fund Balances - End of year 4,001,813$ 4,734,967$ 4,943,304$ 5,347,129$ 5,142,267$ 5,393,152$ 6,707,622$ 7,219,949$ 7,775,953$ 7,136,976$
Debt service as a percentage of noncapital expenditures 1.87% 1.98% 2.00% 1.86% 3.58% 1.80% 1.73% 1.32% 1.42% 1.58%
City of FentonChanges in Fund Balances - Governmental Funds (Unaudited)
2011 - 2020
7 - 6

FiscalYear Ended Personal Tax Rate Estimated Taxable Value
Tax Year June 30, Residential Commercial Industrial Property Total Value (mills) Actual Value % of Actual
2010 2011 198,412,078$ 149,934,673$ 25,558,171$ 33,822,344$ 407,727,266$ 10.62 919,502,852$ 44.34%2011 2012 169,690,591 143,874,004 22,724,472 30,994,650 367,283,717 10.62 821,974,414 44.68%2012 2013 167,761,995 140,539,194 20,001,157 28,211,700 356,514,046 10.62 728,190,650 48.96%2013 2014 168,560,791 133,698,994 18,859,238 29,956,905 351,075,928 10.62 771,926,770 48.96%2014 2015 172,420,345 130,599,352 17,873,885 28,776,200 349,669,782 10.62 783,071,802 44.65%2015 2016 178,498,394 131,322,778 18,012,406 30,833,100 358,666,678 10.62 851,507,232 42.12%2016 2017 185,386,955 145,428,380 18,227,991 28,181,518 377,224,844 10.43 936,157,572 40.30%2017 2018 208,487,400 156,240,983 19,092,836 24,487,400 408,308,619 10.36 1,074,987,500 37.98%2018 2019 208,990,537 156,406,850 19,804,736 24,911,700 410,113,823 10.30 1,077,182,300 38.07%2019 2020 225,117,417 163,414,955 21,486,298 27,362,700 437,381,370 10.18 1,185,461,800 36.90%
Note: Under Michigan law, the revenue base is referred to as "Taxable Value". This amount represents Assessed value (50% of true cash value), limited for each property by the lower of 5% or inflation. Taxes levied in a particular "tax year" become revenue of the subsequent fiscal year.
Taxable Value by Property Type
City of Fenton Taxable Value and Actual Value of Taxable Property (Unaudited)
2011 - 2020
7 - 7
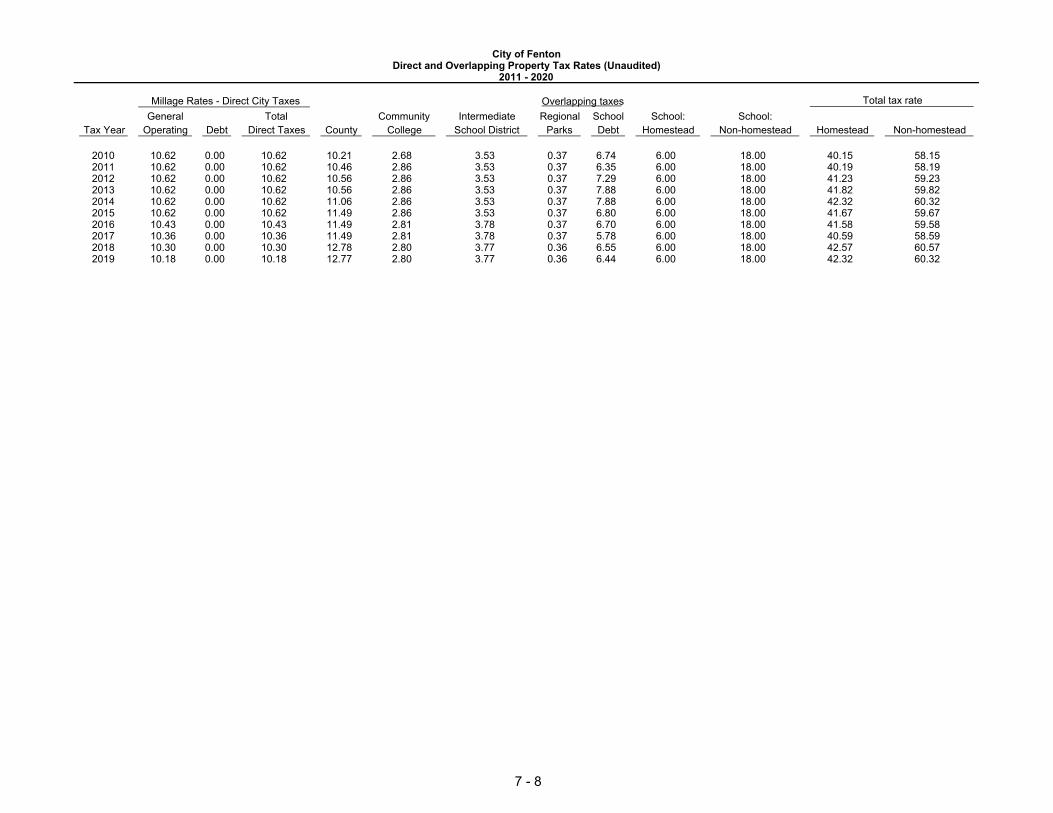
General Total Community Intermediate Regional School School: School:Tax Year Operating Debt Direct Taxes County College School District Parks Debt Homestead Non-homestead Homestead Non-homestead
2010 10.62 0.00 10.62 10.21 2.68 3.53 0.37 6.74 6.00 18.00 40.15 58.152011 10.62 0.00 10.62 10.46 2.86 3.53 0.37 6.35 6.00 18.00 40.19 58.192012 10.62 0.00 10.62 10.56 2.86 3.53 0.37 7.29 6.00 18.00 41.23 59.232013 10.62 0.00 10.62 10.56 2.86 3.53 0.37 7.88 6.00 18.00 41.82 59.822014 10.62 0.00 10.62 11.06 2.86 3.53 0.37 7.88 6.00 18.00 42.32 60.322015 10.62 0.00 10.62 11.49 2.86 3.53 0.37 6.80 6.00 18.00 41.67 59.672016 10.43 0.00 10.43 11.49 2.81 3.78 0.37 6.70 6.00 18.00 41.58 59.582017 10.36 0.00 10.36 11.49 2.81 3.78 0.37 5.78 6.00 18.00 40.59 58.592018 10.30 0.00 10.30 12.78 2.80 3.77 0.36 6.55 6.00 18.00 42.57 60.572019 10.18 0.00 10.18 12.77 2.80 3.77 0.36 6.44 6.00 18.00 42.32 60.32
Total tax rateMillage Rates - Direct City Taxes Overlapping taxes
City of FentonDirect and Overlapping Property Tax Rates (Unaudited)
2011 - 2020
7 - 8
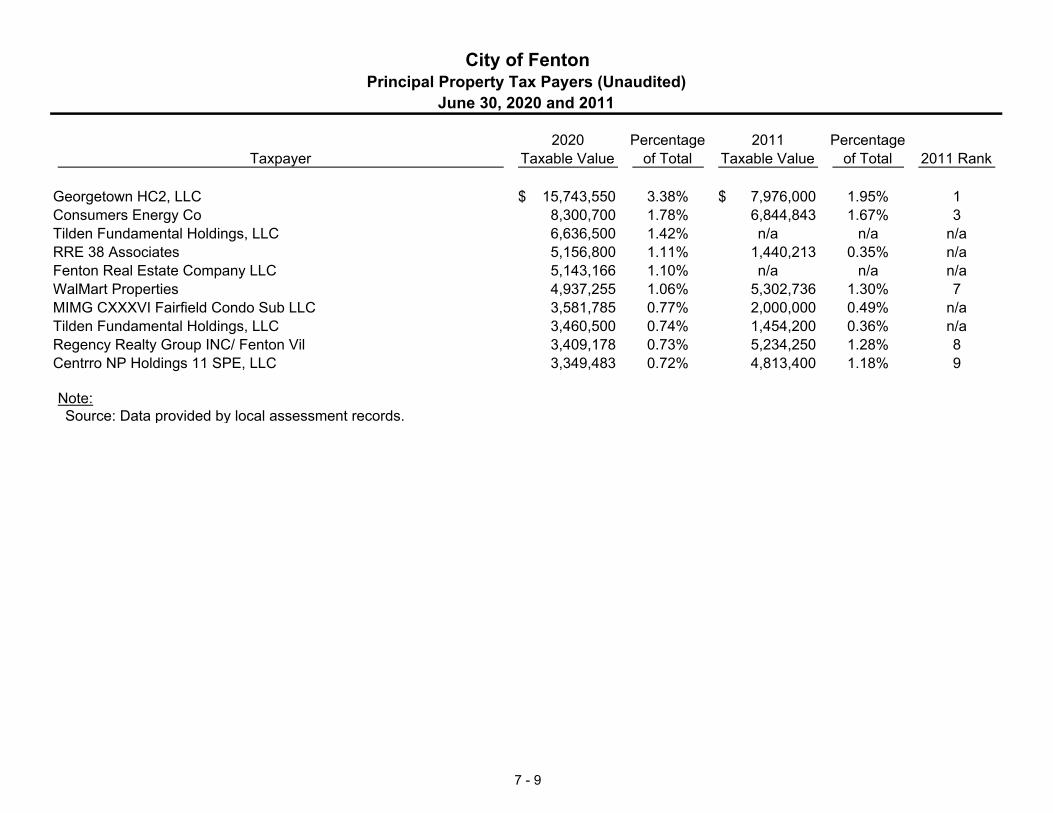
2020 Percentage 2011 PercentageTaxpayer Taxable Value of Total Taxable Value of Total 2011 Rank
Georgetown HC2, LLC 15,743,550$ 3.38% 7,976,000$ 1.95% 1Consumers Energy Co 8,300,700 1.78% 6,844,843 1.67% 3Tilden Fundamental Holdings, LLC 6,636,500 1.42% n/a n/a n/aRRE 38 Associates 5,156,800 1.11% 1,440,213 0.35% n/aFenton Real Estate Company LLC 5,143,166 1.10% n/a n/a n/aWalMart Properties 4,937,255 1.06% 5,302,736 1.30% 7MIMG CXXXVI Fairfield Condo Sub LLC 3,581,785 0.77% 2,000,000 0.49% n/aTilden Fundamental Holdings, LLC 3,460,500 0.74% 1,454,200 0.36% n/aRegency Realty Group INC/ Fenton Vil 3,409,178 0.73% 5,234,250 1.28% 8Centrro NP Holdings 11 SPE, LLC 3,349,483 0.72% 4,813,400 1.18% 9
Note: Source: Data provided by local assessment records.
City of Fenton
June 30, 2020 and 2011Principal Property Tax Payers (Unaudited)
7 - 9

Fiscal PercentYear Current Percent Delinquent Total Tax of Levy
Tax Year June 30, Total Levy Collections Collected Collections Collections Collected
2010 2011 4,270,498$ 3,925,714$ 91.9% 317,241$ 4,242,955$ 99.4%2011 2012 3,841,135 3,566,001 92.8% 255,883 3,821,884 99.5%2012 2013 3,721,272 3,478,670 93.5% 227,994 3,706,664 99.6%2013 2014 3,668,395 3,468,400 94.6% 192,217 3,660,617 99.8%2014 2015 3,652,514 3,472,264 95.1% 168,628 3,640,892 99.7%2015 2016 3,742,407 3,596,238 96.1% 141,438 3,737,676 99.9%2016 2017 3,879,642 3,763,026 97.0% 110,661 3,873,687 99.8%2017 2018 4,000,746 3,901,735 97.5% 93,606 3,995,341 99.9%2018 2019 4,184,147 4,077,461 97.5% 98,765 4,176,226 99.8%2019 2020 4,414,367 4,284,036 97.0% 114,815 4,398,851 99.6%
Note: Source: Data provided from local Treasurer's Department.
City of Fenton
2011 - 2020Property Tax Levies and Collections (Unaudited)
7 - 10

2011 2012 2013 2014 2015 2016 2017 2018 2019 2020 Governmental Activities
Installment purchase agreements 452,045$ 359,675$ 263,965$ 164,795$ 62,039$ 31,550$ -$ 244,610$ 209,804$ 174,013$ Special assessment bonds - - - - - 555,000 500,000 445,000 390,000 335,000 Capital leases - - 7,903 54,141 22,604 10,505 - - - -
Total 452,045 359,675 271,868 218,936 84,643 597,055 500,000 689,610 599,804 509,013
Business-type ActivitiesGeneral obligation bonds 6,076,538 5,216,199 4,319,824 3,385,039 2,406,770 1,402,874 935,249 465,055 - - Capital improvement bonds 2,690,000 2,660,000 2,625,000 2,585,000 2,545,000 2,505,000 2,465,000 2,420,000 2,375,000 2,370,477 Revenue bonds 7,987,142 7,402,262 6,865,790 6,260,790 5,635,790 5,865,790 4,927,133 4,318,156 3,589,397 2,944,397
Total 16,753,680 15,278,461 13,810,614 12,230,829 10,587,560 9,773,664 8,327,382 7,203,211 5,964,397 5,314,874
Total debt of the government 17,205,725$ 15,638,136$ 14,082,482$ 12,449,765$ 10,672,203$ 10,370,719$ 8,827,382$ 7,892,821$ 6,564,201$ 5,823,887$
Total Taxable Value 407,727,266$ 367,283,717$ 356,514,046$ 351,075,928$ 349,669,782$ 358,666,678$ 377,224,844$ 377,224,844$ 410,113,823$ 437,381,370$
Ratio of total debt to taxable value 4.22% 4.26% 4.92% 4.93% 3.05% 2.89% 3.96% 2.09% 1.60% 1.33%
Total Population (1) 11,746 11,746 11,746 11,746 11,746 11,746 11,746 11,746 11,746 11,746
Total debt per capita 1,762$ 1,614$ 1,495$ 1,292$ 1,447$ 1,452$ 1,275$ 672$ 559$ 496$
Personal Income (1) 30,542$ 31,639$ 32,421$ 33,033$ 34,878$ 36,612$ 39,198$ 40,618$ 41,929$ N/A
Ratio of total debt to personal income 4.80% 4.21% 3.70% 3.21% 2.61% 2.41% 1.92% 1.65% 1.33% 1.18%
Note:Source: Actual 2010 Census Reports.(1) Source: Bureau of Economic Analysis. For fiscal year 2020 percent of personal income, the divsor used was for 2019 since 2020 Personal income is not available at this time
City of FentonRatios of Outstanding Debt (Unaudited)
2011 - 2020
7 - 11

Debt as aLimited-Tax Tax Less Pledged Other General Net Percentage of
General Obligation Supported Debt Service Obligation General Estimated Estimated DebtFiscal Year Bonds (LTGO) Bonds (UTGO) Funds Debt Bonded Debt Actual Value Actual Value Population (1) Per Capita
2011 - - - 6,076,537$ 6,076,537$ 919,502,852$ 0.66% 11,746 517 2012 - - - 5,216,199 5,216,199 821,974,414 0.63% 11,746 444 2013 - - - 4,319,825 4,319,825 728,190,650 0.59% 11,746 368 2014 - - - 3,385,039 3,385,039 771,926,770 0.44% 11,746 288 2015 - - - 2,406,770 2,406,770 783,071,802 0.31% 11,746 205 2016 - - - 1,957,874 1,957,874 851,507,232 0.23% 11,746 167 2017 - - - 1,435,249 1,435,249 936,157,572 0.15% 11,746 122 2018 - - - 910,055 910,055 1,074,987,500 0.08% 11,746 77 2019 - - - 390,000 390,000 1,077,182,300 0.04% 11,746 33 2020 - - - 335,000 335,000 1,185,461,800 0.03% 11,746 29
Note: (1) Source: 2010 Census Reports.
City of FentonRatios of General Bonded Debt Outstanding
2011 - 2020
7 - 12

Estimated Estimated Share ofGovernmental Unit Debt Outstanding % Applicable Overlapping Debt
Genesee County 219,927,958$ 4.56% 10,028,715$ Mott Community College 72,915,000 4.28% 3,120,762 Holly School District 53,734,655 0.10% 53,735 Fenton School District 24,520,000 44.21% 10,840,292 Lake Fenton School District 12,800,000 4.50% 576,000 Genesee Intermediate School District 8,715,000 4.28% 373,002 Bishop Airport Authority 6,425,000 4.56% 292,980
Total Overlapping Debt 399,037,613 25,285,486
Direct City Debt 6,530,000 100.00% 6,530,000
Total Direct and Overlapping Debt 405,567,613$ 31,815,486$
City of Fenton
June 30, 2020Direct and Overlapping Governmental Activities Debt (Unaudited)
Sources: Assessed value data used to estimate applicable percentages provided by the City Assessor. Debt outstanding data provided by eachgovernmental unit.
Overlapping governments are those that coincide, at least in part, with the geographic boundaries of the City. This schedule estimates theportion of the outstanding debt of those overlapping governments that is borne by the residents and businesses of the City of Fenton. Thisprocess recognizes that, when considering the City's ability to issue and repay long-term debt, the entire debt burden borne by the residents andbusinesses should be taken into account. However, this does not imply that every taxpayer is a resident, and therefore responsible for repayingthe debt, of each overlapping government.
7 - 13

2011 2012 2013 2014 2015 2016 2017 2018 2019 2020 Calculation of debt limit: State equalized valuation 459,751,426$ 410,987,207$ 364,095,325$ 385,963,385$ 391,535,901$ 425,753,616$ 468,078,786$ 535,493,750$ 538,591,150$ 586,768,909$ 10% of taxable value 45,975,143 41,098,720 36,409,532 38,596,338 39,153,590 42,575,361 46,807,878 53,549,375 53,859,115 58,676,891
Calculation of debt subject to limit:Total debt 22,655,285 19,313,016 17,166,930 15,206,058 17,000,316 17,055,819 14,972,382 13,904,223 11,619,834 9,955,000 Less: debt not subject to limit:
Special assessment bonds - - - - - 555,000 500,000 445,000 390,000 335,000 Revenue bonds 7,987,142 7,402,262 6,865,790 6,260,790 5,635,790 5,865,790 4,927,133 4,318,156 3,712,031 3,090,000
Net debt subject to limit 14,668,143 11,910,754 10,301,140 8,945,268 11,364,526 10,635,029 9,545,249 9,141,067 7,517,803 6,530,000
Legal debt margin 45,975,143$ 41,098,720$ 36,409,532$ 38,596,338$ 39,153,590$ 42,575,361$ 46,807,878$ 53,549,375$ 53,859,115$ 58,676,891$
Net debt subject to limit as % of debt limit 31.90% 28.98% 28.29% 23.18% 29.03% 24.98% 20.39% 17.07% 13.96% 11.13%
City of FentonLegal Debt Margin (Unaudited)
2011 - 2020
7 - 14

Gross Applicable Debt service
Fiscal Year Revenues Expenses Net Revenues Principal Interest Coverage
2011 2,843,029$ 1,987,612$ 855,417$ 515,000$ 216,257$ 1.172012 2,950,604 1,513,113 1,437,491 565,000 329,463 1.61 2013 3,045,284 1,726,019 1,319,265 580,000 315,762 1.47 2014 2,921,725 1,714,538 1,207,187 595,000 305,115 1.342015 2,803,468 2,000,575 802,893 615,000 288,274 0.892016 2,823,439 2,296,255 527,184 625,000 273,025 0.592017 2,957,767 2,298,593 659,174 605,000 179,745 0.84 2018 3,076,928 2,310,930 765,998 615,000 176,882 0.972019 2,981,784 2,213,487 768,297 643,759 152,528 0.962020 3,055,090 2,520,355 534,735 2,935,000 196,567 0.17
Gross Applicable Debt serviceFiscal Year Revenues Expenses Net Revenues Principal Interest Coverage
2011 2,517,057$ 1,254,997$ 1,262,060$ 872,805$ 324,935$ 1.052012 2,563,519 1,209,474 1,354,045 910,339 286,531 1.13 2013 2,587,701 1,233,798 1,353,903 946,375 248,044 1.13 2014 2,763,304 1,556,720 1,206,584 984,785 206,368 1.012015 2,829,299 1,720,183 1,109,116 1,028,269 161,484 0.932016 2,706,151 1,800,547 905,604 1,053,896 129,941 0.762017 2,917,535 1,859,772 1,057,763 552,625 87,321 1.65 2018 2,906,327 1,835,009 1,071,318 655,194 63,137 1.492019 2,606,663 1,974,727 631,936 550,055 30,085 1.092020 2,608,218 2,615,425 (7,207) 85,000 30,624 (0.06)
Sewer Revenue Bonds
Water Revenue Bonds
City of Fenton
2011 - 2020Pledged-Revenue Coverage (Unaudited)
7 - 15

Per Capita (2) UnemploymentFiscal Year Population (1) Personal Income (2) Personal Income Rate (3)
2011 11,746 358,746,332$ 30,542$ 11.42012 11,746 371,631,694 31,639 8.72013 11,746 380,817,066 32,421 6.22014 11,746 388,005,618 33,033 6.32015 11,746 409,676,988 34,878 6.22016 11,746 430,044,552 36,612 5.82017 11,746 460,419,708 39,198 5.02018 11,746 477,099,028 40,618 4.52019 11,746 492,498,034 41,929 4.82020 11,746 N/A N/A 9.4
Note: (1) Source: Actual 2010 Census Reports. (2) Source: Bureau of Economic Analysis. Note: 2020 data has not been released at this time. (3) Source: Michigan Department of Labor & Economic Growth.
City of Fenton
2011 - 2020Demographic and Economic Statistics (Unaudited)
7 - 16

2020 Number Percentage 2011 Number Percentageof Jobs (1) of Total of Jobs (1) of Total
Trade, Transportation, and Utilities 28,200 22.49% 27,100 20.62%Education and Health Services 23,500 18.74% 26,900 20.47%Government 17,300 13.80% 21,500 16.36%Manufacturing 10,700 8.53% 9,900 7.53%Leisure and Hospitality 11,300 9.01% 13,500 10.27%Professional and Business Services 14,900 11.88% 13,600 10.35%Natural Resources, Mining, and Construction 5,600 4.47% 3,600 2.74%Other Services 4,900 3.91% 5,900 4.49%Financial Activities 5,800 4.63% 6,300 4.79%Information 3,200 2.55% 3,100 2.36%
Total 125,400 1.00 131,400 1.00
Note: (1) Source: Michigan Department of Technology, Management & Budget
Data for Genesee County
Industry
City of Fenton
June 30, 2020Principal Employment Industries (Unaudited)
7 - 17
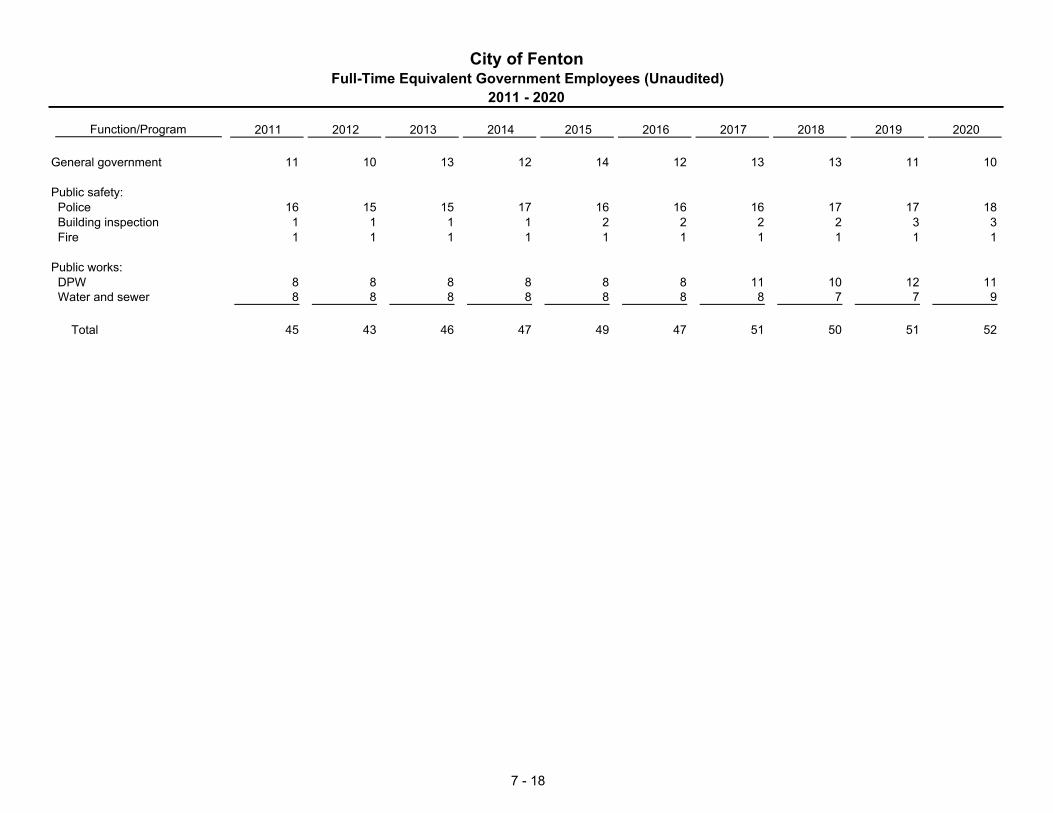
Function/Program 2011 2012 2013 2014 2015 2016 2017 2018 2019 2020
General government 11 10 13 12 14 12 13 13 11 10
Public safety: Police 16 15 15 17 16 16 16 17 17 18 Building inspection 1 1 1 1 2 2 2 2 3 3 Fire 1 1 1 1 1 1 1 1 1 1
Public works: DPW 8 8 8 8 8 8 11 10 12 11 Water and sewer 8 8 8 8 8 8 8 7 7 9
Total 45 43 46 47 49 47 51 50 51 52
City of FentonFull-Time Equivalent Government Employees (Unaudited)
2011 - 2020
7 - 18

Function/ program 2011 2012 2013 2014 2015 2016 2017 2018 2019 2020
Election data Registered voters 9,211 9,198 9,407 9,438 9,426 9,672 9,367 9,330 9,401 10,224 Voters (at the polls or absentee) 2,268 2,266 5,852 1,105 6,164 1,950 5,884 1,527 5,144 5,169 Percent voting 23.32% 23.33% 62.20% 11.71% 65.39% 20.16% 62.82% 16.37% 54.72% 50.56%
Police Physical arrests 633 481 664 470 247 305 502 423 307 407 Traffic violations 1,368 1,808 2,260 1,675 1,090 1,176 1,564 1,229 1,666 1,494 Investigations 10,458 9,603 8,818 10,767 8,440 9,303 8,859 10,586 10,164 11,496
Fire Fire runs 326 304 259 298 356 262 331 337 336 336 Emergency medical runs 140 150 181 198 143 170 178 200 195 173 Inspections 50 125 100 200 300 250 100 150 230 402
Public works Miles of street resurfaced 1.80 1.80 1.60 - 0.63 0.95 - 0.53 - -
Water Number of customers billed 3,469 3,501 3,494 3,509 3,500 3,574 3,580 3,616 3,685 3,666 Total consumption* 295,980 307,881 320,124 287,802 294,545 374,579 299,856 308,211 288,958 278,947 Average consumption per user 85 88 91 82 84 105 84 85 78 76
Sewer Average daily sewage treatment** N/A N/A N/A N/A N/A N/A N/A N/A N/A N/A
*Water consumption in thousand gallons**Sewer Plant is shared with other communitiesN/A - data not available
City of FentonOperating Indicators (Unaudited)
2011 - 2020
7 - 19
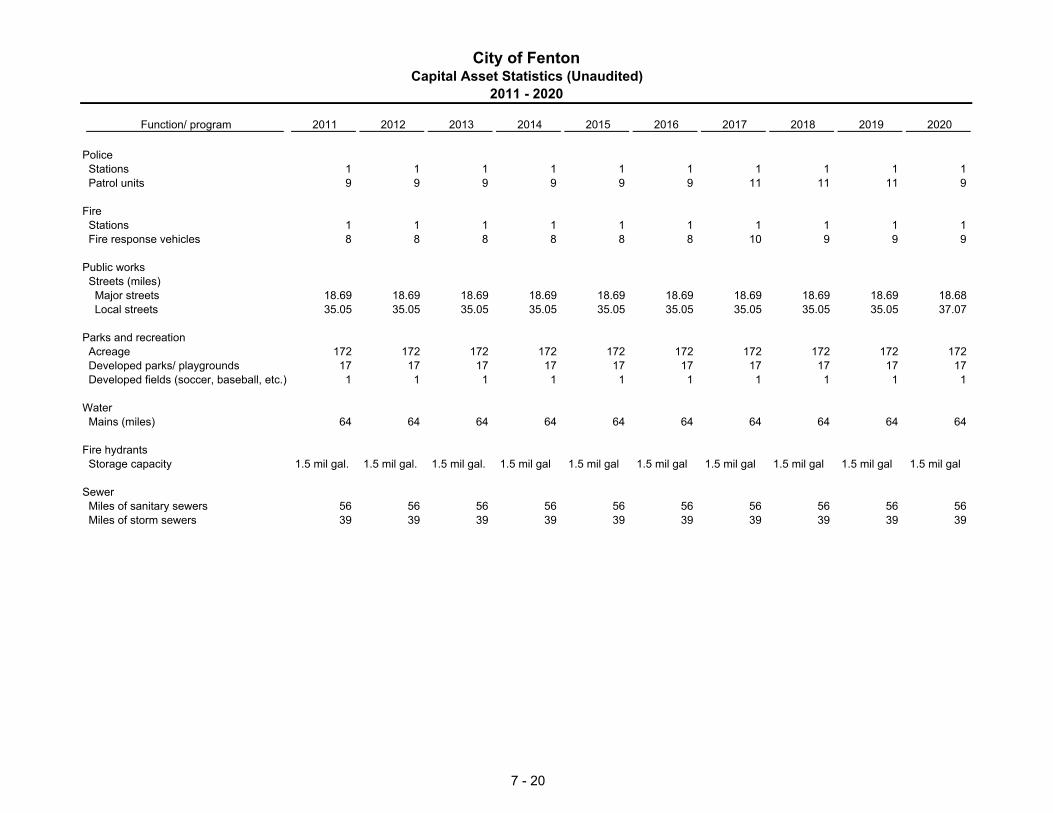
Function/ program 2011 2012 2013 2014 2015 2016 2017 2018 2019 2020
Police Stations 1 1 1 1 1 1 1 1 1 1 Patrol units 9 9 9 9 9 9 11 11 11 9
Fire Stations 1 1 1 1 1 1 1 1 1 1 Fire response vehicles 8 8 8 8 8 8 10 9 9 9
Public works Streets (miles) Major streets 18.69 18.69 18.69 18.69 18.69 18.69 18.69 18.69 18.69 18.68 Local streets 35.05 35.05 35.05 35.05 35.05 35.05 35.05 35.05 35.05 37.07
Parks and recreation Acreage 172 172 172 172 172 172 172 172 172 172 Developed parks/ playgrounds 17 17 17 17 17 17 17 17 17 17 Developed fields (soccer, baseball, etc.) 1 1 1 1 1 1 1 1 1 1
Water Mains (miles) 64 64 64 64 64 64 64 64 64 64
Fire hydrants Storage capacity 1.5 mil gal. 1.5 mil gal. 1.5 mil gal. 1.5 mil gal 1.5 mil gal 1.5 mil gal 1.5 mil gal 1.5 mil gal 1.5 mil gal 1.5 mil gal
Sewer Miles of sanitary sewers 56 56 56 56 56 56 56 56 56 56 Miles of storm sewers 39 39 39 39 39 39 39 39 39 39
City of FentonCapital Asset Statistics (Unaudited)
2011 - 2020
7 - 20