city of florida city, florida rpts/2016 florida city.pdf · florida city, florida comprehensive...
TRANSCRIPT

CITY OF FLORIDA CITY, FLORIDA
COMPREHENSIVE ANNUAL FINANCIAL REPORT
FOR THE FISCAL YEAR ENDED SEPTEMBER 30, 2016
Prepared by the Department of Finance

CITY OF FLORIDA CITY, FLORIDA
CONTENTS
Introductory Section
Letter of Transmittal .................................................................................................................. i-v List of Principal Officials ............................................................................................................ vi Certificate of Achievement for Excellence in Financial Reporting ........................................... vii Organization Chart .................................................................................................................... viii
Financial Section Independent Auditors’ Report ................................................................................................... 1-3
Management’s Discussion and Analysis (Required Supplementary Information) ................. 4-12
Basic Financial Statements Government-Wide Financial Statements Statement of Net Position ......................................................................................................13 Statement of Activities ...........................................................................................................14
Fund Financial Statements Governmental Fund Financial Statements Balance Sheet .....................................................................................................................15 Reconciliation of the Balance Sheet – Governmental Funds to Statement of Net Position ....................................................................................................................16 Statement of Revenues, Expenditures and Changes in Fund Balances .............................17 Reconciliation of the Statement of Revenues, Expenditures and Changes in Fund Balances of Governmental Funds to the Statement of Activities ..........................18
Proprietary Fund Financial Statements Statement of Net Position ..................................................................................................19 Statement of Revenues, Expenses and Changes in Net Position .......................................20 Statement of Cash Flows ...................................................................................................21
Fiduciary Funds Financial Statements Statement of Fiduciary Net Position ..................................................................................22 Statement of Changes in Fiduciary Net Position ...............................................................23
Notes to Basic Financial Statements .................................................................................. 24-73
Required Supplementary Information (Other Than MD&A)
Budgetary Comparison Schedule – General Fund ......................................................................74 Budgetary Comparison Schedule – CRA Fund ..........................................................................75 Note to Budgetary Comparison Schedule ...................................................................................76 Police Officers’ Substitute Pension Trust Fund Schedule of Changes in the City’s Net Pension Liability and Related Ratios .........................77 Schedule of City Contributions ................................................................................................78 Schedule of Investment Returns ..............................................................................................79 Elected Officials Retirement Plan Schedule of Changes in the City’s Net Pension Liability and Related Ratios .........................80 Schedule of City Contributions ................................................................................................81 Schedule of Investment Returns ..............................................................................................82

CITY OF FLORIDA CITY, FLORIDA
CONTENTS Required Supplementary Information (Other Than MD&A) (continued)
Florida Retirement System Pension Plan Schedule of the City’s Proportionate Share of the Net Pension Liability ................................83 Schedule of the City’s Contributions …………... ...................................................................83 Retiree Health Insurance Subsidy Program Schedule of the City’s Proportionate Share of the Net Pension Liability ................................84 Schedule of the City’s Contributions …………... ...................................................................84 Schedule of Funding Progress - Other Post-Employment Benefits ...............................................85
Combining Fund Financial Statements (Supplementary Information) Combining Balance Sheet – Nonmajor Governmental Funds ....................................................86 Combining Statement of Revenues, Expenditures and Changes in Fund Balances – Nonmajor Governmental Funds ...............................................................................................87 Combining Statement of Fiduciary Net Position ........................................................................88 Combining Statement of Changes in Fiduciary Net Position ....................................................89 Statistical Section Net Position by Component ........................................................................................................90 Changes in Net Position ..............................................................................................................91 Fund Balances of Governmental Funds ......................................................................................92 Changes in Fund Balances of Governmental Funds ...................................................................93 Assessed Value and Estimated Actual Value of Taxable Property ............................................94 Property Tax Rates – Direct and Overlapping Governments .....................................................95 Principal Property Taxpayers ......................................................................................................96 Property Tax Levies and Collections ..........................................................................................97 Ratios of Outstanding Debt by Type - Business-type Activities ................................................98 Computation of Direct and Overlapping Governmental Activities Debt ...................................99 Water Revenue Bond Coverage ................................................................................................100 Demographic and Economic Statistics .....................................................................................101 Principal Employers ..................................................................................................................102 City Government Employees by Function/Programs ...............................................................103 Operating Indicators by Function/Program ..............................................................................104 Capital Asset Statistics by Function/Program ...........................................................................105 Reporting Section Independent Auditors’ Report on Internal Control over Financial Reporting and on Compliance and Other Matters Based on an Audit of Financial Statements Performed in Accordance with Government Auditing Standards .................................. 106-107 Management Letter in Accordance with the Rules of the Auditor General of the State of Florida ............................................................................................................... 108-111 Independent Accountants’ Report on Compliance Pursuant to Section 218.415 Florida Statutes ......................................................................................................................112

INTRODUCTORY SECTION

i
June 23, 2017 To the Citizens of the City of Florida City and Other Interested Parties: State law requires that all general purpose local governments publish within nine months of the close of each fiscal year a complete set of financial statements presented in conformity with accounting principles generally accepted in the United States (GAAP) and audited in accordance with generally accepted auditing standards and government auditing standards by a firm of licensed certified public accountants. Additionally, the City’s charter requires an annual independent audit of the books of account, financial records and transactions of all departments of the City by independent certified public accountants. Pursuant to these requirements, we hereby issue the Comprehensive Annual Financial Report (CAFR) of the City of Florida City for the fiscal year ended September 30, 2016. This report consists of management’s representations concerning the finances of the City of Florida City. Consequently, management assumes full responsibility for the completeness and reliability of all of the information presented in this report. To provide a reasonable basis for making these representations, management of the City has established a comprehensive internal control framework that is designed both to protect the City’s assets from loss, theft or misuse and to compile sufficient reliable information for the preparation of the City of Florida City’s financial statements in conformity with GAAP. Since the cost of internal controls should not outweigh the benefits derived, the City’s comprehensive framework of internal controls has been designed to provide reasonable rather than absolute assurance that the financial statements will be free from material misstatement. As management, we assert that, to the best of our knowledge and belief, this financial report is complete and reliable in all material respects. The City’s financial statements have been audited by Marcum LLP, a licensed certified public accounting firm. The goal of the independent audit was to provide reasonable assurance that the City’s financial statements for the fiscal year ended September 30, 2016 are free of material misstatement. The independent audit involved examining, on a test basis, evidence supporting the amounts and disclosures in the financial statements; assessing the accounting principles used and significant estimates made by management; and evaluating the overall financial statement preparation. The independent auditor concluded, based upon their audit, that there was a reasonable basis for rendering an unmodified opinion that the City of Florida City’s financial statements for the fiscal year ended September 30, 2016, are fairly presented in conformity with GAAP. The independent auditors’ report is presented as the first component of the financial section of this report.

To the Citizens of the City of Florida City and Other Interested Parties: June 23, 2017
ii
GAAP requires that management provide a narrative introduction, overview and analysis to accompany the basic financial statements in the form of Management’s Discussion and Analysis (MD&A). This letter of transmittal is designed to complement the MD&A and should be read in conjunction with it. The City of Florida City’s MD&A can be found immediately following the independent auditors’ report. Profile of the Government The City of Florida City is the southernmost city on the mainland of Florida before reaching the Florida Keys. It has traditionally been primarily agricultural, but recent new development is bringing far more residential communities and is, therefore, changing the landscape of the City. Through annexation, the City is preparing to triple its size geographically. The City is currently about 3 square miles, but will become much larger if current annexation requests are approved by Miami-Dade County. The City of Florida City was incorporated in 1914 and operates under the Strong Mayor/Commission form of government. The City Commission is comprised of the Mayor and four Commissioners elected city-wide. The Mayor’s term is for four years and the commissioner’s term is for four years. The City Commission is responsible for enacting laws (resolutions, ordinances and regulations) governing the City as well as appointing the members of various advisory boards and the City Attorney. As chief executive officer of the City, the Mayor also serves as the chief administrative officer. The Mayor is responsible for enforcement of laws and appoints and supervises department heads. The Police Chief and the Director of Financial Planning and Administration (CFO) are appointed by the Mayor with the consent of the City Commission. In addition to providing residents with public safety, general government, leisure and public works type services, the City provides water, sewer, sanitation, a recycling program and recreational facilities and activities. The annual budget serves as the foundation for the City of Florida City’s financial planning and control. All departments of the City are required to submit proposed budgets to the Mayor, who then makes any necessary revisions. The Mayor then presents to the City Commission, for their review, a budget estimate of the revenues and expenditures of all the City’s departments. Two public hearings are then conducted to inform the taxpayers of the proposed budget and to receive their comments. A majority affirmative vote of the commission quorum is needed to adopt the budget, which is legally enacted prior to October 1st by the passage of a Resolution. The City’s budget is approved at the department level. The Mayor and Director of Financial Planning and Administration may amend the adopted budget for adjustments within a department administratively, but the City Commission must approve all budget adjustments that exceed or are less than originally budgeted. Supplemental appropriations of revenues and expenditures and budget adjustments are typically approved by the City Commission during the last quarter of the fiscal year. During fiscal year 2015-2016, there were budgetary amendments. Budget-to-actual comparisons are provided in this report for the general fund and the community redevelopment agency (CRA) for which an appropriated annual budget has been adopted.
To the Citizens of the City of Florida City and Other Interested Parties: June 23, 2017
iii
Factors Affecting Financial Condition The information presented in the financial statements is perhaps best understood when it is considered from the broader perspective of the specific environment within which the City of Florida City operates. Local Economy The City of Florida City’s positioning for progress is undoubtedly ensured for periods that extend far beyond the period of time the City has rebuilt itself from Hurricane Andrew in 1992. Its geographic location, southern end of the Florida Turnpike, U.S. Route #1, Everglades National Park to its west and Biscayne National Park to its east, brings over 3 million visitors every year. The transportation system is excellent including a busway completed in Florida City, the Florida Turnpike and U.S. Route #1 access to the airport and other fine communities north of Florida City, including the metropolitan Miami area. Essential to its progress, the City has a pro-business attitude towards developers, builders, contractors and others in the private sector. The City’s comprehensive plan and zoning regulations provide a balanced land use plan for the orderly development of commercial, residential and recreational development. The City of Florida City reduced its millage rate for the 2015-2016 fiscal year to 7.1858. Continued new development has slowed considerably due to the general economic climate throughout the country. In addition, as a financial policy, cost cutting measures have reduced the need to spend any fund balance. Long-Term Financial Planning and Major Initiatives The City is working diligently to annex additional land to expand our western boundary. This will provide space for planned residential and commercial expansion. New parks are being developed to provide additional open space and leisure activities for the anticipated addition to our population. A new gymnasium was recently constructed for our children to enjoy. Cash Management Policies and Practices The City invests operating funds in an effort to earn a reasonable yield on its portfolio. This is consistent with the City’s primary objective of safeguarding public assets by minimizing the level of credit and market risks assumed. The investment priority is safety of capital, liquidity of funds and investment income, in that order. To that end, the City’s investments are guided by a detailed investment policy which is reviewed annually to determine if any changes may be required. When fiscally responsible, the City also invests in negotiable certificates of deposit.
To the Citizens of the City of Florida City and Other Interested Parties: June 23, 2017
iv
Pension Benefits The City maintains a single-employer defined benefit pension plan for its police officers. An independent actuary is engaged by the pension plan to calculate the amount of the annual contribution the City must make to ensure that the plan will be able to fully meet its obligations to retired employees in a timely manner. As a matter of policy, the City fully funds the required annual contribution to the pension plan as determined by the actuary. This is accounted for in the police pension trust fund. On May 1, 2008, the City and police officers had agreed to enter the Florida Retirement System. A replacement plan was adopted to protect the participants’ assets. For the fiscal year ended September 30, 2016 the City contributed an amount to make the plan actuarially sound. One management type general employee (through a formal management plan) received 18% contribution by the City. The general employee contributed an amount much greater than the minimum of 2%. On February 1, 2009, a new pension plan was adopted with the Florida Retirement System (FRS) for all authorized general employees. The new FRS pension plan is a cost-sharing multiple employer defined benefit plan. The FRS funding policy provides for monthly employer contributions at actuarially determined rates that, expressed as percentages of annual covered payroll along with a required 3% employee contribution. In addition to the defined benefit pension plan for police officers, the City maintains a defined contribution pension plan for its general employees created in accordance with Internal Revenue Code Section 403(b). The City further maintains a single-employer defined benefit pension plan for its elected officials. An independent actuary is retained by the pension plan to calculate the amount of the annual contribution the City must make to ensure the plan will be able to fully meet its obligations to retired elected officials in a timely manner. Awards and Acknowledgments The Government Finance Officers Association of the United States and Canada (GFOA) awarded a Certificate of Achievement for Excellence in Financial Reporting to the City of Florida City for its comprehensive annual financial report (CAFR) for the fiscal year ended September 30, 2015. This was the nineteenth consecutive year that the government has achieved this prestigious award. In order to be awarded a Certificate of Achievement, a government must publish an easily readable and efficiently organized CAFR. This report must satisfy both generally accepted accounting principles (GAAP) and applicable legal requirements. A Certificate of Achievement is valid for a period of one year only. We believe that our current CAFR continues to meet the Certificate of Achievement Program’s requirements and we are submitting it to the GFOA to determine its eligibility for another certificate.

To the Citizens of the City of Florida City and Other Interested Parties: June 23, 2017
v
The presentation of the CAFR on a timely basis was made possible by the dedicated service of the entire staff of the Finance Department. Each member of the department has our sincere appreciation for the contributions made in preparation of this report. Special recognition is given to Chad Burkhalter, Assistant Director of Finance of the Finance Department, for his many contributions leading to a successful audit and preparation of this report. We also wish to recognize the assistance provided by the firm of Marcum LLP. In closing, without the leadership and support of the Mayor and the City Commissioners, preparation of this report would not have been possible. Sincerely,

vi
CITY OF FLORIDA CITY, FLORIDA
LIST OF PRINCIPAL OFFICIALS AS OF SEPTEMBER 30, 2016
MAYOR-COMMISSION FORM OF GOVERNMENT
CITY COMMISSION
Otis T. Wallace, Mayor
R.S. Shiver, Vice Mayor
Sharon Butler
Eugene D. Berry
Avis Brown
CITY CLERK
Jennifer Evelyn
CITY ATTORNEY
Jeff H. Cazeau
DIRECTOR OF FINANCIAL PLANNING AND ADMINISTRATION
Mark Ben-Asher, CGFO
INDEPENDENT AUDITORS
Marcum LLP

vii
viii
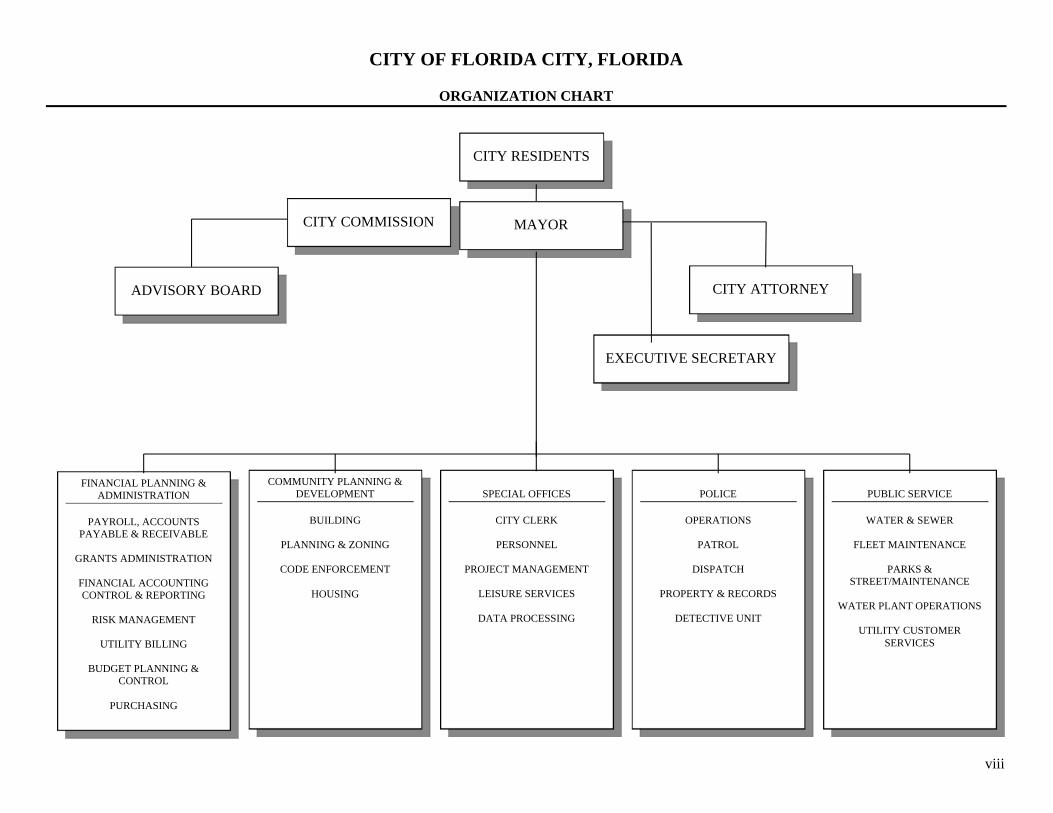
CITY OF FLORIDA CITY, FLORIDA
ORGANIZATION CHART
CITY RESIDENTS
CITY COMMISSION
MAYOR
ADVISORY BOARD
CITY ATTORNEY
EXECUTIVE SECRETARY
FINANCIAL PLANNING & ADMINISTRATION
PAYROLL, ACCOUNTS
PAYABLE & RECEIVABLE
GRANTS ADMINISTRATION
FINANCIAL ACCOUNTING CONTROL & REPORTING
RISK MANAGEMENT
UTILITY BILLING
BUDGET PLANNING &
CONTROL
PURCHASING
PUBLIC SERVICE
WATER & SEWER
FLEET MAINTENANCE
PARKS &
STREET/MAINTENANCE
WATER PLANT OPERATIONS
UTILITY CUSTOMER SERVICES
POLICE
OPERATIONS
PATROL
DISPATCH
PROPERTY & RECORDS
DETECTIVE UNIT
SPECIAL OFFICES
CITY CLERK
PERSONNEL
PROJECT MANAGEMENT
LEISURE SERVICES
DATA PROCESSING
COMMUNITY PLANNING & DEVELOPMENT
BUILDING
PLANNING & ZONING
CODE ENFORCEMENT
HOUSING


FINANCIAL SECTION

INDEPENDENT AUDITORS’ REPORT

Marcum LLP n One Southeast Third Avenue n Suite 1100 n Miami, Florida 33131 n Phone 305.995.9600 n Fax 305.995.9601 n www.marcumllp.com
1
INDEPENDENT AUDITORS’ REPORT
To the Honorable Mayor and City Commission City of Florida City, Florida Report on the Financial Statements We have audited the accompanying financial statements of the governmental activities, business-type activities, each major fund, and the aggregate remaining fund information of the City of Florida City, Florida (the City), as of and for the fiscal year ended September 30, 2016, and the related notes to the financial statements, which collectively comprise the City’s basic financial statements as listed in the table of contents. Management’s Responsibility for the Financial Statements Management is responsible for the preparation and fair presentation of these financial statements in accordance with accounting principles generally accepted in the United States of America; this includes the design, implementation, and maintenance of internal control relevant to the preparation and fair presentation of financial statements that are free from material misstatement, whether due to fraud or error. Auditors’ Responsibility Our responsibility is to express opinions on these financial statements based on our audit. We conducted our audit in accordance with auditing standards generally accepted in the United States of America and the standards applicable to financial audits contained in Government Auditing Standards, issued by the Comptroller General of the United States. Those standards require that we plan and perform the audit to obtain reasonable assurance about whether the financial statements are free from material misstatement. An audit involves performing procedures to obtain audit evidence about the amounts and disclosures in the financial statements. The procedures selected depend on the auditors’ judgment, including the assessment of the risks of material misstatement of the financial statements, whether due to fraud or error. In making those risk assessments, the auditor considers internal control relevant to the entity’s preparation and fair presentation of the financial statements in order to design audit procedures that are appropriate in the circumstances, but not for the purpose of expressing an opinion on the effectiveness of the entity’s internal control. Accordingly, we express no such opinion. An audit also includes evaluating the appropriateness of accounting policies used and the reasonableness of significant accounting estimates made by management, as well as evaluating the overall presentation of the financial statements.

2
We believe that the audit evidence we have obtained is sufficient and appropriate to provide a basis for our audit opinions. Opinions In our opinion, the financial statements referred to above present fairly, in all material respects, the respective financial position of the governmental activities, business-type activities, each major fund, and the aggregate remaining fund information of the City, as of September 30, 2016, and the respective changes in financial position and, where applicable, cash flows thereof for the fiscal year then ended in accordance with accounting principles generally accepted in the United States of America. Other Matters Required Supplementary Information Accounting principles generally accepted in the United States of America require that the management’s discussion and analysis on pages 4 through 12, the budgetary comparison schedules on pages 74 and 75, and the required supplementary information for the pensions and OPEB on pages 77 to 85, be presented to supplement the basic financial statements. Such information, although not a part of the basic financial statements, is required by the Governmental Accounting Standards Board who considers it to be an essential part of financial reporting for placing the basic financial statements in an appropriate operational, economic, or historical context. We have applied certain limited procedures to the required supplementary information in accordance with auditing standards generally accepted in the United States of America, which consisted of inquiries of management about the methods of preparing the information and comparing the information for consistency with management’s responses to our inquiries, the basic financial statements, and other knowledge we obtained during our audit of the basic financial statements. We do not express an opinion or provide any assurance on the information because the limited procedures do not provide us with sufficient evidence to express an opinion or provide any assurance. Supplementary and Other Information Our audit was conducted for the purpose of forming opinions on the financial statements that collectively comprise the City’s basic financial statements. The introductory and statistical sections and the combining fund financial statements, are presented for purposes of additional analysis and are not a required part of the basic financial statements. The combining fund financial statements are the responsibility of management and were derived from and relate directly to the underlying accounting and other records used to prepare the basic financial statements. Such information has been subjected to the auditing procedures applied in the audit of the basic financial statements and certain additional procedures, including comparing and reconciling such information directly to the underlying accounting and other records used to prepare the basic financial statements or to the basic financial statements themselves, and other additional procedures in accordance with auditing standards generally accepted in the United States of America. In our opinion, the combining fund financial statements are fairly stated, in all material respects, in relation to the basic financial statements as a whole.

3
The introductory and statistical sections have not been subjected to the auditing procedures applied in the audit of the basic financial statements, and accordingly, we do not express an opinion or provide any assurance on them. Other Reporting Required by Government Auditing Standards
In accordance with Government Auditing Standards, we have also issued our report dated June 23, 2017 on our consideration of the City’s internal control over financial reporting and on our tests of its compliance with certain provisions of laws, regulations, contracts, and grant agreements and other matters. The purpose of that report is to describe the scope of our testing of internal control over financial reporting and compliance and the results of that testing, and not to provide an opinion on internal control over financial reporting or on compliance. That report is an integral part of an audit performed in accordance with Government Auditing Standards in considering City’s internal control over financial reporting and compliance. Miami, Florida June 23, 2017

MANAGEMENT’S DISCUSSION AND ANALYSIS (MD&A)

4
CITY OF FLORIDA CITY, FLORIDA
MANAGEMENT’S DISCUSSION AND ANALYSIS As management of the City of Florida City, we offer readers of the City’s financial statements this narrative overview and analysis of the financial activities of the City of Florida City for the fiscal year ended September 30, 2016. FINANCIAL HIGHLIGHTS The assets of the City of Florida City exceeded its liabilities at the close of the most recent fiscal year by $60,039,028 (net position). Of this amount, $12,045,808 (unrestricted net position) may be used to meet the City’s ongoing obligations to citizens and creditors. There were no funds budgeted or appropriated from unrestricted net position for the fiscal year 2015-2016. In the government-wide financial statements, the City’s total net position increased by $267,138. This increase is attributable primarily to income derived from the settlement proceeds received ($411,015) as a result of the oil spill. For the fiscal year ended September 30, 2015, the City’s governmental funds reported combined ending fund balances of $20,277,791. This represents an increase of $762,999 from last year. At the end of the current fiscal year, unassigned fund balance for the General Fund was $11,800,144 or 102 % of total general fund expenditures. OVERVIEW OF THE FINANCIAL STATEMENTS This discussion and analysis is intended to serve as an introduction to the City’s basic financial statements. The City’s basic financial statements comprise three components; (1) government-wide financial statements, (2) fund financial statements and (3) notes to the basic financial statements. This report also contains required and other supplementary information in addition to the basic financial statements themselves. Government-wide Financial Statements The government-wide financial statements are designed to provide readers with a broad overview of the City’s finances, in a manner similar to a private sector business. The statement of net position presents information on all the City’s assets, liabilities and deferred inflows and outflows of resources, with the difference between the two reported as net position. Over time, increases or decreases in net position may serve as a useful indicator of whether the financial position of the City is improving or deteriorating. The statement of activities presents information on how the City’s net position changed during the most recent fiscal year. All changes in net position are reported as soon as the underlying event giving rise to the change occurs, regardless of the timing of related cash flows. Thus, revenues and expenses are reported in this statement for some items that will result in cash flows in future fiscal periods (e.g., uncollected taxes and earned but unused vacation leave).

5
Both of the government-wide financial statements distinguish functions of the City that are principally supported by taxes and intergovernmental revenues (governmental activities) from other functions that are intended to recover all or a significant portion of their costs through user fees and charges (business-type activities). The governmental activities of the City include general government, public works, public safety and parks and recreation. The business-type activities of the City include a Water and Sewer Utility. The government-wide financial statements include not only the City itself (known as the primary government,) but also a legally separate community redevelopment agency (CRA) for which the City of Florida City is financially accountable. Financial information for the CRA is reported as part of the financial information presented for the primary government. Separate disclosure of the CRA activities is presented in the Notes to Basic Financial Statements. The government-wide financial statements can be found on pages 13 through 14 of this report. Fund Financial Statements A fund is a grouping of related accounts that is used to maintain control over resources that have been segregated for specific activities or objectives. The City of Florida City, like other state and local governments, uses fund accounting to ensure and demonstrate compliance with finance related legal requirements. The City of Florida City has three (3) fund categories; governmental funds, a proprietary fund and a fiduciary fund. Governmental Funds Governmental funds are used to account for essentially the same functions reported as governmental activities in the government-wide financial statements. However, unlike the government-wide financial statements, the governmental fund financial statement focuses on near-term inflows and outflows of spendable resources as well as on balances of spendable resources available at the end of the fiscal year. Such information may be useful in evaluating a government’s near-term financing requirements. Because the focus of governmental funds is narrower than that of the government-wide financial statements, it is useful to compare the information presented for the governmental funds with similar information presented for governmental activities in the government-wide financial statements. By doing so, readers may better understand the long-term impact of the City’s near-term financing decisions. Both the governmental funds balance sheet and the governmental funds statement of revenues, expenditures and changes in fund balances provide a reconciliation to facilitate this comparison between governmental funds and governmental activities. The City of Florida City maintains six (6) governmental funds; the General Fund, CRA and Grants funds are presented as major funds. The three (3) Other Governmental Funds are combined into a single aggregated presentation. The City of Florida City adopts an annual appropriated budget for its General Fund and for the CRA Fund. Budgetary comparison schedules have been provided for the General Fund and the CRA Fund to demonstrate compliance with this budget. These schedules can be found on pages 74 and 75. The basic governmental fund financial statements can be found on pages 15 through 18.

6
Proprietary Funds The City of Florida City maintains one type of proprietary fund. Enterprise funds are used to report the same functions presented as business-type activities in the government-wide financial statements. The City uses an enterprise fund to account for its Water and Sewer Operation. The basic proprietary fund financial statements can be found on pages 19 through 21. Fiduciary Funds Fiduciary funds are used to account for resources held for the benefit of parties outside the City. Fiduciary funds are not reflected in the government-wide financial statements because the resources of those funds are not available to support the City’s own programs. The accounting used for fiduciary funds is much like that used for proprietary funds. The City maintains two fiduciary funds, one for the operation of its Police Officers Defined Benefit Pension Plan and one to report the Elected Officials Retirement Plan. The basic fiduciary fund financial statements can be found on pages 22 through 23. Notes to the Basic Financial Statements The notes provide additional information that is essential to a full understanding of the data provided in the government-wide and fund financial statements. The notes to the basic financial statements can be found on pages 24 through 73. Other Information In addition to the basic financial statements and accompanying notes, this report also presents certain required supplementary information concerning the City’s progress in funding its obligation to provide pension benefits to its employees. This required supplementary information can be found on pages 74 through 85. Government-wide Financial Analysis As noted earlier, net position may serve over time as a useful indicator of a government’s financial position. In the case of the City of Florida City, assets plus deferred outflows exceeded liabilities plus deferred inflows by $60,039,028 at the close of the most recent fiscal year. A portion of the City’s net position, $39,610,024 or 65.97%, reflects its investment in capital assets (e.g., land, buildings, machinery and equipment) less any related debt to acquire those assets that is still outstanding. The City of Florida City uses these capital assets to provide services to citizens; consequently, these assets are not available for future spending. Although the City’s investment in capital assets is reported net of related debt, it should be noted that the resources needed to repay this debt must be provided from other sources, since the capital assets themselves cannot be used to liquidate these liabilities.

7
A summary of the City’s net position is presented in Table 1 and a summary of the changes in net position is presented in Table 2.
2016 2015 2016 2015 2016 2015Current assets and other assets 22,753,383$ 22,041,218$ 7,788,566$ 7,535,612$ 30,541,949$ 29,576,830$ Capital assets, net 21,448,269 21,861,674 18,458,217 19,010,548 39,906,486 40,872,222
Total Assets 44,201,652 43,902,892 26,246,783 26,546,160 70,448,435 70,449,052
Current liabilities 2,197,899 2,165,159 848,444 1,040,076 3,046,343 3,205,235 Noncurrent liabilities 9,935,866 5,650,256 758,166 569,083 10,694,032 6,219,339 Deferred Inflows of Resources 364,001 1,037,788 29,921 70,712 393,922 1,108,500 Total Liabilities and Deferred Inflows of Resources 12,497,766 8,853,203 1,636,531 1,679,871 14,134,297 10,533,074
Net Investment in Capital Assets 21,277,007 21,568,418 18,333,017 18,845,943 39,610,024 40,414,361 Restricted 7,664,448 6,667,253 718,748 775,428 8,383,196 7,442,681 Unrestricted 6,304,336 7,612,827 5,741,472 5,303,590 12,045,808 12,916,417
Total Net Position 35,245,791$ 35,848,498$ 24,793,237$ 24,924,961$ 60,039,028$ 60,773,459$
Table 1Summary of Net Position
Governmental Activities Business-type Activities Total
2016 2015 2016 2015 2016 2015Revenues:
Program revenues:Charges for services 6,003,210$ 5,116,492$ 3,679,482$ 3,066,695$ 9,682,692$ 8,183,187$ Operating grants and contributions 33,050 90,551 33,050 90,551 Capital grants and contributions 1,756,154 1,986,078 1,756,154 1,986,078
General revenues:Property taxes 1,863,171 1,981,186 1,863,171 1,981,186 Utility taxes 840,030 820,057 840,030 820,057 Communication services tax 219,444 232,298 219,444 232,298 Franchise fees based on gross receipts 708,833 712,573 708,833 712,573 Unrestricted intergovernmental revenue 1,730,376 1,751,141 1,730,376 1,751,141 Unrestricted intergovernmental revenue 336,926 314,056 336,926 314,056 Unrestricted investment earnings 50,103 58,642 46,173 35,355 96,276 93,997 Impact Fees 175,222 141,494 175,222 141,494
Settlement Proceeds 411,015 -- -- -- 411,015 --
Total Revenues 14,127,534 13,204,568 3,725,655 3,102,050 17,853,189 16,306,618
ExpensesGeneral government 5,142,885 5,504,388 5,142,885 5,504,388 Public works 2,781,545 2,498,493 2,781,545 2,498,493 Public safety 4,536,937 3,800,750 4,536,937 3,800,750 Parks and recreation 808,091 773,483 808,091 773,483 Interest on Long-Term Debt 2,901 5,566 2,901 5,566 Water and sewer -- -- 4,313,692 3,514,528 4,313,692 3,514,528
Total Expenses 13,272,359 12,582,680 4,313,692 3,514,528 17,586,051 16,097,208
Excess (Deficiency) Before Transfers 855,175 621,888 (588,037) (412,478) 267,138 209,410
Transfers (456,313) (406,023) 456,313 406,023 -- -- Extraordinary Item (Claims Proceeds) -- 746,881 -- -- -- 746,881
Increase (Decrease) in Net Position 398,862 962,746 (131,724) (6,455) 267,138 956,291
Net Position - Beginning, as Restated 34,846,929 34,885,752 24,924,961 24,931,416 59,771,890 59,817,168
Net Position - Ending 35,245,791$ 35,848,498$ 24,793,237$ 24,924,961$ 60,039,028$ 60,773,459$
Table 2Summary of Changes in Net Position
Governmental Activities Business-type Activities Total
The City’s net position increased by $267,138 over 2015 due primarily to settlement proceeds. This increase is illustrated in the summary above.

8
Governmental Activities Net position of the City’s governmental activities increased by $398,862 or 1.0% from $34,846,929 in the last fiscal year, after prior period adjustment, to $35,245,791 in the current fiscal year. General government, public works and public safety comprise 94% of the City’s total governmental activities. General government program revenues fund just over 56% of its activities. Public works program revenues fund more than 100% of its activities while public safety program revenues fund just a bit less than 34%. General revenues, primarily property taxes, fund the balance of these activities. Parks and recreation show program revenues fund more than 100% of expenses. This is due primarily to the success of the City owned RV and Camp Site. Program revenues, comprised of charges for services, and operating and capital grants and contributions amounts to $7,792,414; the governmental activities total general revenues total $5,878,807. Due to a small property tax base, reliance on grant funds is critical to meeting citizens’ demand for services. Property taxes, which represent a bit less than 34% of total revenues for governmental activities, are non-program specific and are used to fund all activities not covered by program revenues. Property Tax Revenue decreased by $118,015 between 2016 and 2015 due to the general economy and fewer taxpayers making timely payments. The tax rate remained the same from 2015 to 2016.
-$2,000,000
$0
$2,000,000
$4,000,000
$6,000,000
$8,000,000
$10,000,000
$12,000,000
$14,000,000
$16,000,000Revenues - Governmental Activities
$0
$2,000,000
$4,000,000
$6,000,000
$8,000,000
$10,000,000
$12,000,000
$14,000,000
Generalgovernment
Public works Public safety Parks andrecreation
Interest on long-term debt
Total Expenses
Expenses - Governmental Activities

9
41.16%
0.23%
12.04%
12.78%
5.76%
1.50%
4.86%
11.87%2.31%
0.34%
1.20%
2.82%
-3.13%
Charges for services
Operating grants and contributions
Capital grants and contributions
Property taxes
Utility taxes
Communication service taxes
Franchise taxes
Intergovernmental
State Shared
Investment income
Impact Fees
Settlement Proceeds
Transfers
Business-type Activities Business-type activities decreased the City’s net position by $131,724 since 2015. The City maintains a water & sewer fund that accounts for this change to net position. Operating expenses exceeded charges for services by $627,276. $46,173 was realized as a result of unrestricted investment earnings. Revenues increased between 2016 and 2015 by $623,605. Expenses, however, also increased by $799,164. The above three graphs represent governmental activities; revenues, expenses and revenues by source. Governmental Funds The focus of the City of Florida City’s governmental funds is to provide information on near-term inflows, outflows and balances of spendable resources. Such information is useful in assessing the City’s financing requirements. At the end of the current fiscal year, fund balance of the General Fund was $16,939,723, an increase of $583,584 in comparison with the prior year. The general fund is the chief operating fund of the City of Florida City. As a measure of the general fund’s liquidity it may be useful to compare total fund balance to total fund expenditures. Total unassigned fund balance represents 102% of total general fund expenditures. A summary of the general fund’s condensed balance sheet and statement of revenues, expenditures and changes in fund balance is presented in Table 3 and 4 for September 30, 2016 and 2015, as follows:

10
General Fund 2016 2015Total Assets 19,176,997$ 18,494,743$
Total liabilities 2,112,617$ 2,107,907$ Total deferred inflows of resources 124,657 30,697 Fund balance 16,939,723 16,356,139
Total Liabilities, Deferred Inflows of Resources and Fund Balance 19,176,997$ 18,494,743$
Table 3Condensed Balance Sheet
General Fund 2016 2015Total revenues 12,163,541$ 10,978,522$ Total expenditures 11,579,957 11,200,134 Extraordinary Item (Claims Proceeds) -- 746,881
Net Change in Fund Balance 583,584$ 525,269$
Table 4Condensed Statement of Revenues,
Expenditures and Changes in Fund Balance
General Fund Budgetary Highlights There was a difference via budget amendments between the original and final budgeted amounts for expenditures in the General Fund of $397,761 less than originally budgeted, however, actual expenditures were $10,280 more than the final budgeted amount. Budgeted revenues between original and final were increased by approximately $256,788 due to changes in revenue estimates provided by the State of Florida, however, actual revenues were less than the final budgeted amount by $93,314. While the City ultimately expended approximately $10,280 more than budgeted, the net change in fund balance was an increase of $583,584. The following summary depicts this activity:
VarianceActual Positive
General Fund Original Final Amounts (Negative)Revenues 12,000,067$ 12,256,855$ 12,163,541$ (93,314)$ Expenditures 11,967,438 11,569,677 11,579,957 (10,280)
Excess (deficiency) of revenues over expenditures 32,629 687,178 583,584 (103,594)
Other financing sources and uses (32,629) -- -- --
Net Change in Fund Balance --$ 687,178$ 583,584$ (103,594)$
Budgeted Amounts

11
Community Redevelopment Agency (CRA) The CRA incurred the following expenditures during the fiscal year ended September 30, 2016 and September 30, 2015 respectively:
CRA 2016 2015Expenditures, general government 710,966$ 780,050$ Expenditures, capital outlay 705,927 926,576
1,416,893$ 1,706,626$
In 2016, the following projects were funded by CRA’s Infrastructure Fund: $345,844 - Streetscape Project for beautification. $ 85,232 - Consulting and Engineering expenditures. $300,000 - Community Policing. $ 98,348 - Administrative Functions.
In 2015, the following projects were funded by CRA’s Infrastructure Fund: $807,107 - Streetscape Project for beautification. $202,056 - Consulting and Engineering expenditures. $269,640 - Community Policing. $102,888 - Administrative Functions.
Capital Assets As of September 30, 2016, the City’s investment in capital assets for both governmental activities and business-type activities amounted to $39,906,486 ($21,448,269 in governmental activities and $18,458,217 in business-type activities). The total decrease in capital assets for the fiscal year ($965,736) was primarily attributed to as follows: Governmental activities’ capital assets decreased by $413,405 due primarily to capital grants less depreciation on buildings and equipment. Business-type activities’ capital assets decreased by $552,331 due primarily to capital grants less depreciation on utility infrastructure. Additional information on the City’s capital assets can be found in Note 7 on Pages 39 and 40 of the Notes to Basic Financial Statements.

12
Long-Term Debt At September 30, 2016, the City had total debt outstanding of $10,694,032 ($9,935,866 for governmental activities and $758,166 for business-type activities). Of this amount, $125,200 represents total revenue bonds payable secured solely by specified revenue sources (water revenue). The remainder is comprised of compensated absences of $784,997 in governmental activities, $44,604 in business-type activities, $135,000 notes payable in governmental activities, $8,366,745 of Net Pension Liability in governmental activities, $649,124 of Net OPEB Obligation in governmental activities, and $115,954 Net OPEB Obligations in business-type activities. See Note 8 for a more detailed explanation of long-term debt on Pages 39 through 41 of the Notes to Basic Financial Statements. Economic Factors and Next Year’s Budget and Rates The unemployment rate for the City dropped with the State of Florida rate and the National rate. The City’s rate is expected to drop further next year as well due primarily to this nation’s general economy. The occupancy rate of the City’s hospitality service industry has remained stable for the past several years. Inflationary trends in the region compare similarly to national indices. The City’s rates for water and sewer fees are being reviewed with an eye towards increasing the rates to improve the debt service coverage ratio and provide additional funds for renewal and replacement of infrastructure. There were no funds budgeted or appropriated from unrestricted net position (unassigned fund balance) for the fiscal year September 30, 2017 budget for the general fund. The millage rate for FY 2017 remained the same as FY 2016 at 7.1858. All of these factors were considered in preparing the City of Florida City’s budget for the 2015-2016 fiscal year. Requests for Information This financial report is designed to provide a general overview of the City of Florida City’s finances for all those with an interest in the City’s finances. Questions concerning any of the information provided in this report or requests for additional financial information should be addressed to Mark Ben-Asher, Director of Financial Planning and Administration, Finance Department, 404 West Palm Drive, P.O. Box 343570, Florida City, FL 33034-0570.

Page left intentionally blank


BASIC FINANCIAL STATEMENTS

Governmental Business-typeActivities Activities Total
AssetsCash 15,613,712$ 6,359,073$ 21,972,785$ Receivables, net 1,481,109 366,034 1,847,143 Investment 394,141 -- 394,141 Internal balances 194,018 (194,018) -- Restricted cash 4,517,393 1,257,477 5,774,870 Prepaid items 66,067 -- 66,067 Other assets 161,759 -- 161,759 Net pension asset 153,036 -- 153,036 Assets held for resale 172,148 -- 172,148 Capital assets not being depreciated 6,062,271 2,221,307 8,283,578 Capital assets being depreciated, net 15,385,998 16,236,910 31,622,908
Total Assets 44,201,652 26,246,783 70,448,435
Deferred Outflows of ResourcesPensions 3,541,905 182,985 3,724,890
Liabilities and Deferred Inflows of ResourcesAccounts payable 884,520 281,236 1,165,756 Accrued liabilities 587,274 28,479 615,753 Customer deposits 138,865 538,729 677,594 Unearned revenue 587,240 -- 587,240 Noncurrent liabilities:
Due within one year 213,500 19,860 233,360 Due in more than one year 9,722,366 738,306 10,460,672
Total Liabilities 12,133,765 1,606,610 13,740,375
Deferred Inflows of ResourcesPensions 364,001 29,921 393,922
Net PositionNet investment in capital assets 21,277,007 18,333,017 39,610,024 Restricted:
Transportation projects 4,225,590 -- 4,225,590 Grants and contributions 1,734,376 -- 1,734,376 Assets held for resale 103,808 -- 103,808 Capital projects 1,499,884 -- 1,499,884 Impact fees - public safety 100,790 -- 100,790 Sewer system capital improvements -- 656,304 656,304 Reserve fund -- 62,444 62,444
Unrestricted 6,304,336 5,741,472 12,045,808
Total Net Position 35,245,791$ 24,793,237$ 60,039,028$
CITY OF FLORIDA CITY, FLORIDA
STATEMENT OF NET POSITION
SEPTEMBER 30, 2016
The accompanying notes are an integral part of these financial statements.
13

Charges Operating Capital Business-for Grants and Grants and Governmental type
Functions/Programs Expenses Services Contributions Contributions Activities Activities Total
Governmental ActivitiesGeneral government 5,142,885$ 1,087,410$ 33,050$ 1,756,154$ (2,266,271)$ --$ (2,266,271)$ Public works 2,781,545 2,494,257 -- -- (287,288) -- (287,288) Public safety 4,536,937 1,547,654 -- -- (2,989,283) -- (2,989,283) Parks and recreation 808,091 873,889 -- -- 65,798 -- 65,798 Interest on long-term debt 2,901 -- -- -- (2,901) -- (2,901)
Total Governmental Activities 13,272,359 6,003,210 33,050 1,756,154 (5,479,945) -- (5,479,945)
Business-type ActivitiesWater and sewer 4,313,692 3,679,482 -- -- -- (634,210) (634,210)
Total Business-type Activities 4,313,692 3,679,482 -- -- -- (634,210) (634,210)
Total 17,586,051$ 9,682,692$ 33,050$ 1,756,154$ (5,479,945) (634,210) (6,114,155)
General RevenuesProperty taxes 1,863,171 -- 1,863,171 Utility taxes 840,030 -- 840,030 Communication services tax 219,444 -- 219,444 Franchise fees based on gross receipts 708,833 -- 708,833 Unrestricted intergovernmental revenue 2,067,302 -- 2,067,302 Unrestricted investment earnings 50,103 46,173 96,276 Impact fees 175,222 -- 175,222 Settlement proceeds 411,015 -- 411,015
Transfers (456,313) 456,313 --
Total General Revenues and Transfers 5,878,807 502,486 6,381,293
Change in Net Position 398,862 (131,724) 267,138
Net Position - Beginning, as previously reported 35,848,498 24,924,961 60,773,459
Prior period adjustment (See Note 18) (1,001,569) -- (1,001,569)
Net Position - Beginning, restated 34,846,929 24,924,961 59,771,890
Net Position- Ending 35,245,791$ 24,793,237$ 60,039,028$
Program Revenues
CITY OF FLORIDA CITY, FLORIDA
STATEMENT OF ACTIVITIES
FOR THE FISCAL YEAR ENDED SEPTEMBER 30, 2016
Net (Expense) Revenue andChanges in Net Position
The accompanying notes are an integral part of these financial statements.
14

Nonmajor TotalGovernmental Governmental
General CRA Grants Funds FundsAssets
Cash 12,357,775$ 1,379,247$ 1,520,688$ 356,002$ 15,613,712$ Receivables:
Billed and other 546,885 -- -- 34,191 581,076 Unbilled 94,183 -- -- -- 94,183 Taxes 788,876 -- -- -- 788,876 Intergovernmental -- -- 16,974 -- 16,974
Investment 394,141 -- -- -- 394,141 Due from other funds 564,799 -- -- - 564,799 Restricted cash 4,281,682 -- -- 235,711 4,517,393 Prepaid items 66,067 -- -- -- 66,067 Assets held for resale 68,340 103,808 -- -- 172,148 Other assets 14,249 147,510 -- -- 161,759
Total Assets 19,176,997$ 1,630,565$ 1,537,662$ 625,904$ 22,971,128$
Liabilities, Deferred Inflows of Resourcesand Fund Balances
LiabilitiesAccounts payable 884,520$ --$ --$ --$ 884,520$ Accrued liabilities 566,186 -- 15,436 5,652 587,274 Due to other funds -- 26,873 256,671 87,237 370,781 Customer deposits 138,865 -- -- -- 138,865 Unearned revenue 523,046 -- -- 64,194 587,240
Total Liabilities 2,112,617 26,873 272,107 157,083 2,568,680
Deferred Inflows of ResourcesUnavailable revenue 124,657 -- -- -- 124,657
Total Liabilities and Deferred Inflowsof Resources 2,237,274 26,873 272,107 157,083 2,693,337
Fund BalancesNon-spendable:
Prepaid items 66,067 -- -- -- 66,067 Assets held for resale 68,340 -- -- -- 68,340 Restricted:
Transportation projects 4,142,817 -- -- -- 4,142,817 Grants and contributions -- -- 1,265,555 468,821 1,734,376 Impact fees - public safety 100,790 -- -- -- 100,790
Assets held for resale -- 103,808 -- -- 103,808 Capital projects -- 1,499,884 -- -- 1,499,884
Committed:Stormwater 761,565 -- -- -- 761,565
Unassigned:General fund 11,800,144 -- -- -- 11,800,144
Total Fund Balances 16,939,723 1,603,692 1,265,555 468,821 20,277,791
19,176,997$ 1,630,565$ 1,537,662$ 625,904$ 22,971,128$
CITY OF FLORIDA CITY, FLORIDA
BALANCE SHEETGOVERNMENTAL FUNDS
SEPTEMBER 30, 2016
Total Liabilities, Deferred Inflows of Resources and Fund Balances
The accompanying notes are an integral part of these financial statements.
15
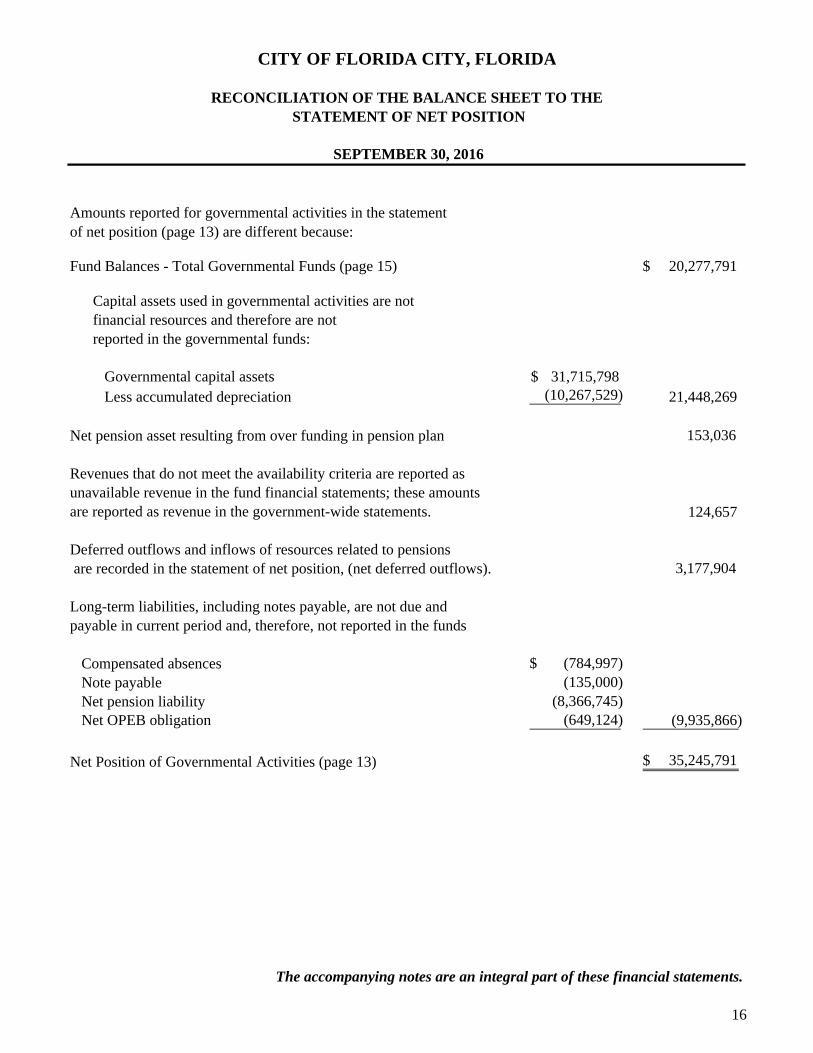
Amounts reported for governmental activities in the statement of net position (page 13) are different because:
Fund Balances - Total Governmental Funds (page 15) 20,277,791$
Capital assets used in governmental activities are notfinancial resources and therefore are notreported in the governmental funds:
Governmental capital assets 31,715,798$ Less accumulated depreciation (10,267,529) 21,448,269
Net pension asset resulting from over funding in pension plan 153,036
Revenues that do not meet the availability criteria are reported asunavailable revenue in the fund financial statements; these amountsare reported as revenue in the government-wide statements. 124,657
Deferred outflows and inflows of resources related to pensions are recorded in the statement of net position, (net deferred outflows). 3,177,904
Long-term liabilities, including notes payable, are not due andpayable in current period and, therefore, not reported in the funds
Compensated absences $ (784,997)Note payable (135,000)Net pension liability (8,366,745)Net OPEB obligation (649,124) (9,935,866)
Net Position of Governmental Activities (page 13) 35,245,791$
CITY OF FLORIDA CITY, FLORIDA
RECONCILIATION OF THE BALANCE SHEET TO THE STATEMENT OF NET POSITION
SEPTEMBER 30, 2016
The accompanying notes are an integral part of these financial statements.
16

Nonmajor TotalGovernmental Governmental
General CRA Grants Funds FundsRevenues
Taxes 3,631,478$ 1,012,003$ --$ --$ 4,643,481$ Intergovernmental 2,067,302 662,824 -- -- 2,730,126 Charges for services 3,482,795 -- -- -- 3,482,795 Investment earnings 40,362 1,260 7,529 952 50,103 Impact fees 175,222 -- -- -- 175,222 Licenses and permits 474,597 -- -- -- 474,597 Fines and forfeitures 1,471,060 -- -- 54,544 1,525,604 Grants -- -- 56,449 -- 56,449 Settlement proceeds 411,015 -- -- -- 411,015 Miscellaneous 409,710 24,878 275 49,319 484,182
Total Revenues 12,163,541 1,700,965 64,253 104,815 14,033,574
ExpendituresCurrent:
General government 3,752,175 710,966 114,567 7,234 4,584,942 Public safety 3,984,997 -- -- 63,100 4,048,097 Public works 2,737,680 -- -- -- 2,737,680 Parks and recreation 628,338 -- -- -- 628,338 Capital outlay 338,866 705,927 88,824 -- 1,133,617
Debt service: Principal 135,000 -- -- -- 135,000
Interest 2,901 -- -- -- 2,901
Total Expenditures 11,579,957 1,416,893 203,391 70,334 13,270,575
Excess (Deficiency) of Revenuesover Expenditures 583,584 284,072 (139,138) 34,481 762,999
Fund Balances - Beginning 16,356,139 1,319,620 1,404,693 434,340 19,514,792
Fund Balances - Ending 16,939,723$ 1,603,692$ 1,265,555$ 468,821$ 20,277,791$
CITY OF FLORIDA CITY, FLORIDA
STATEMENT OF REVENUES, EXPENDITURES AND CHANGES IN FUND BALANCESGOVERNMENTAL FUNDS
FOR THE FISCAL YEAR ENDED SEPTEMBER 30, 2016
The accompanying notes are an integral part of these financial statements.
17

Amounts reported for governmental activities in the statement of activities (Page 14) are different because:
Net change in fund balances - total governmental funds (Page 17) 762,999$
Governmental funds report capital outlays as expenditures. However, in the statement of activities, the cost of those assets is allocated over their estimated useful lives and reported as depreciation expense. This is the amount by which capital outlay exceeded depreciation in the current period.
The details of the difference are as follows: Capital outlay 1,122,020$ Depreciation expense (1,066,036)
Net adjustment 55,984
Repayment of long-term debt is reported as an expenditure in the governmental funds, but the repayment reduces long-term liabilities in the statement of net position. 135,000
Transfers of capital assets to business-type activities from governmental activities decreases net position of governmental activities in the statement of activities, but are not reported in the governmental funds because they are not financial resources. (456,313)
Some expenses reported in the statement of activities do not require current financial resources and, therefore, are not reported as expenditures in governmental funds.
The details of the difference are as follows: Loss on sale of capital assets (13,076) Net pension asset (39,870) Compensated absences (45,742)
Net OPEB obligation (65,353) Net pension liability (28,727)
Net adjustment (192,768)
Under the modified accrual basis of accounting used in the governmental funds,
revenues are not recognized until funds are measurable and available to
finance current expenditures. In the statement of activities, however, which is
presented on the accrual basis, revenues are reported when earned. 93,960
Change in net position of governmental activities (Page 14) 398,862$
CITY OF FLORIDA CITY, FLORIDA
RECONCILIATION OF THE STATEMENT OF REVENUES, EXPENDITURES AND CHANGESIN FUND BALANCES OF GOVERNMENTAL FUNDS TO THE STATEMENT OF ACTIVITIES
FOR THE FISCAL YEAR ENDED SEPTEMBER 30, 2016
The accompanying notes are an integral part of these financial statements.
18

Enterprise FundWater and
Sewer Assets
Current AssetsCash 6,359,073$ Receivables, net 366,034 Restricted cash 1,257,477
Total Current Assets 7,982,584
Noncurrent AssetsCapital assets:
Land 1,578,818 Construction in progress 642,489 Machinery and equipment 706,097 Plant distribution system 35,065,719 Less accumulated depreciation (19,534,906)
Total capital assets, net 18,458,217
Total Assets 26,440,801
Deferred Outflows of ResourcesPensions 182,985
Liabilities
Current LiabilitiesAccounts payable 281,236 Accrued liabilities 28,479Due to other funds 194,018Customer deposits 538,729 Current portion of revenue bonds payable 15,400 Current portion of compensated absences 4,460
Total Current Liabilities 1,062,322
Noncurrent LiabilitiesRevenue bonds payable 109,800 Net OPEB obligation 115,954Net pension liability 472,408Compensated absences 40,144
Total Noncurrent Liabilities 738,306
Total Liabilities 1,800,628
Deferred Inflows of ResourcesPensions 29,921
Net PositionNet Investment in capital assets 18,333,017 Restricted for sewer system capital improvements 656,304 Restricted for reserve fund 62,444 Unrestricted 5,741,472
Total Net Position 24,793,237$
CITY OF FLORIDA CITY, FLORIDA
STATEMENT OF NET POSITIONPROPRIETARY FUND
SEPTEMBER 30, 2016
The accompanying notes are an integral part of these financial statements.
19

Enterprise FundWater and
Sewer Operating Revenues
Charges for services 3,679,482$
Operating ExpensesGeneral and administrative 3,260,405 Depreciation 1,046,353
Total Operating Expenses 4,306,758
Operating Loss (627,276)
Non-Operating Revenues (Expenses)Interest income 46,173 Interest expense (6,934)
Total Non-Operating Revenues 39,239
Loss before Capital Contribution (588,037)
Contribution of Capital Assets 456,313
Change in Net Position (131,724)
Net Position - Beginning 24,924,961
Net Position - Ending 24,793,237$
CITY OF FLORIDA CITY, FLORIDA
STATEMENT OF REVENUES, EXPENSES AND CHANGES IN NET POSITIONPROPRIETARY FUND
FOR THE FISCAL YEAR ENDED SEPTEMBER 30, 2016
The accompanying notes are an integral part of these financial statements.
20

Cash Flows from Operating ActivitiesReceipts from customers and users 3,644,228$ Payments to suppliers (3,344,156) Payments to employees (90,844)
Payments to other funds (85,575)
Net Cash Provided by Operating Activities 123,653
Cash Flows from Capital and Related Financing ActivitiesPrincipal paid on debt (14,700) Interest paid on bonds (6,934) Acquisition of capital assets (37,709)
Net Cash Used in Capital and Related Financing Activities (59,343)
Cash Flows from Investing ActivitiesInterest received 46,173
Net Cash Provided by Investing Activities 46,173
Net Increase in Cash 110,483
Cash, Beginning (Including Restricted) 7,506,067
Cash, Ending (Including Restricted) 7,616,550$
Reconciliation of Operating Loss to Net Cash Provided by Operating Activities
Operating loss (627,276)$
Adjustments to reconcile operating loss to net cash provided by operating activities:
Depreciation 1,046,353 Changes in operating assets, liabilities and deferred
inflows/outflows:(Increase) decrease in:
Receivables (56,896) Deferred outflows - pensions (124,313)
Increase (decrease) in:Accounts payable and accrued liabilities (213,274) Customer deposits 21,642 Compensated absences 6,991 Net OPEB obligation 11,882 Net pension liability 184,910 Deferred inflows - pensions (40,791) Due to other funds (85,575)
Total adjustments 750,929
Net Cash Provided by Operating Activities 123,653$
Noncash Investing, Capital and Related Financing ActivitiesContribution of capital assets from grants fund 456,313$
Water and Sewer
CITY OF FLORIDA CITY, FLORIDA
STATEMENT OF CASH FLOWSPROPRIETARY FUND
FOR THE FISCAL YEAR ENDED SEPTEMBER 30, 2016
Enterprise Fund
The accompanying notes are an integral part of these financial statements.
21

PensionTrust
Assets
Cash 3,098,206$
InvestmentsMoney market mutual funds 124,207 Common stock 1,964,676 Corporate bonds 336,822 Government securities 548,813
Total Investments 2,974,518
ReceivablesCity contributions 6,633 Accrued interest 4,770
Total Receivables 11,403
Total Assets 6,084,127
Net Position Restricted forPension Benefits 6,084,127$
CITY OF FLORIDA CITY, FLORIDA
STATEMENT OF FIDUCIARY NET POSITIONFIDUCIARY FUNDS
SEPTEMBER 30, 2016
The accompanying notes are an integral part of these financial statements.
22

PensionTrust
Additions
Contributions City 506,633$
Total Contributions 506,633
Investment EarningsNet appreciation in fair value of investments 182,546 Interest and dividends 55,063
Investment Earnings 237,609
Total Additions 744,242
DeductionsBenefits paid 284,400 Administrative expenses 36,760
Total Deductions 321,160
Change in Net Position 423,082
Net Position Restricted for Pension Benefits- Beginning 5,661,045
Net Position Restricted for Pension Benefits - Ending 6,084,127$
CITY OF FLORIDA CITY, FLORIDA
STATEMENT OF CHANGES IN FIDUCIARY NET POSITIONFIDUCIARY FUNDS
FOR THE FISCAL YEAR ENDED SEPTEMBER 30, 2016
The accompanying notes are an integral part of these financial statements.
23

Page left intentionally blank

NOTES TO BASIC FINANCIAL STATEMENTS

CITY OF FLORIDA CITY, FLORIDA
NOTES TO BASIC FINANCIAL STATEMENTS
FOR THE FISCAL YEAR ENDED SEPTEMBER 30, 2016
24
NOTE 1 – SUMMARY OF SIGNIFICANT ACCOUNTING POLICIES
The City of Florida City (the City), located in Miami-Dade County, Florida (the County) is a political subdivision of the State of Florida. The City, which was created by the Florida Legislature, was incorporated in 1915. The City operates under a Strong-Mayor form of government and provides the following services as authorized by its charter; public safety, water and sewer, sanitation, culture recreation, public works and improvements, planning and zoning, highways and streets, and general administrative services. The City does not provide any educational facilities or fire services; those services are provided by the Miami-Dade County School Board and the County, respectively.
The financial statements of the City have been prepared in conformity with accounting principles generally accepted in the United States (GAAP) as applied to governmental units. The Governmental Accounting Standards Board (GASB) is the accepted standard-setting body for establishing governmental accounting and financial reporting principles. The more significant of the City’s accounting policies are described below:
A. FINANCIAL REPORTING ENTITY
Under governmental accounting and financial reporting standards, the City’s reporting entity consists of the City, organizations for which the City is financial accountable and other organizations for which the nature and significance of their relationship with the City are such that exclusion would cause the City’s financial statements to be misleading or incomplete. The City is considered financially accountable if it appoints a voting majority of an organization’s governing body and is either able to impose its will on that organization, or has a financial benefit/burden relationship with the organization. The City may also be financially accountable if an organization is fiscally dependent on the primary government and the two also have a financial benefit or burden relationship.
Component units are included in the reporting entity either as blended or as discretely presented. Blended component units, although legally separate entities, are, in substance, part of the City’s operations. Accordingly, data from these component units are combined with data of the primary government. The City has met the criteria as having the operational and financial responsibilities as noted above for the blended component units listed below and these entities have been included in the City’s financial reporting entity.

CITY OF FLORIDA CITY, FLORIDA
NOTES TO BASIC FINANCIAL STATEMENTS
FOR THE FISCAL YEAR ENDED SEPTEMBER 30, 2016
25
NOTE 1 – SUMMARY OF SIGNIFICANT ACCOUNTING POLICIES (CONTINUED)
A. FINANCIAL REPORTING ENTITY (CONTINUED)
(i) The Community Redevelopment Agency (the CRA) was created under the Community Redevelopment Act of 1969, enacted by Florida Legislature. The CRA’s board of directors is the City Commission. The CRA’s executive director is the City’s Mayor. The City has operational responsibility for the CRA. The CRA has a September 30th year end and is presented as a major fund.
(ii) The Florida City Foundation, Inc. (the Foundation) is a nonprofit (501(c)(3)) organization. The Foundation accepts charitable contributions which are used to pay for activities and other items to benefit the citizens of the City. The City Commission serves as the board of the Foundation. The City has operational responsibility for the Foundation. The Foundation, which is presented as a nonmajor fund, has a December 31st year end and therefore the amounts presented for the Foundation are as of and for the year ended December 31, 2015.
B. GOVERNMENT-WIDE AND FUND FINANCIAL STATEMENTS
The government-wide financial statements (i.e., the statement of net position and the statement of activities) report information on all of the non-fiduciary activities of the City. For the most part, the effect of interfund activity has been removed from these statements with the exception of interfund services provided and used which are not eliminated.
Governmental activities, which normally are supported by taxes and intergovernmental revenues, are reported separately from business-type activities, which rely to a significant extent on fees and charges for support.
The statement of activities demonstrates the degree to which the direct expenses of a given function or segment are offset by program revenues. Direct expenses are those that are clearly identifiable with a specific function or segment. Program revenues include 1) charges to customers or applicants who purchase, use, or directly benefit from goods, services, or privileges provided by a given function or segment and 2) grants and contributions that are restricted to meeting the operational or capital requirements of a particular function or segment. Taxes and other items not properly included among program revenues are reported instead as general revenues.
Separate financial statements are provided for governmental funds, proprietary funds, and fiduciary funds, even though the latter are excluded from the government-wide financial statements. Major individual governmental funds and the major enterprise fund are reported as separate columns in the fund financial statements. All remaining nonmajor governmental funds are aggregated and reported as nonmajor governmental funds.

CITY OF FLORIDA CITY, FLORIDA
NOTES TO BASIC FINANCIAL STATEMENTS
FOR THE FISCAL YEAR ENDED SEPTEMBER 30, 2016
26
NOTE 1 – SUMMARY OF SIGNIFICANT ACCOUNTING POLICIES (CONTINUED)
C. MEASUREMENT FOCUS, BASIS OF ACCOUNTING, AND FINANCIAL STATEMENT PRESENTATION
The government-wide financial statements are reported using the economic resources measurement focus and the accrual basis of accounting, as are the proprietary fund and fiduciary fund financial statements. Revenues are recorded when earned and expenses are recorded when a liability is incurred, regardless of the timing of related cash flows. Property taxes are recognized as revenues in the year for which they are levied. Grants and similar items are recognized as revenue as soon as all eligibility requirements imposed by the provider have been met.
Governmental fund financial statements are reported using the current financial resources measurement focus and the modified accrual basis of accounting. Revenues are recognized as soon as they are both measurable and available. Revenues are considered to be available when they are collectible within the current period or soon enough thereafter to pay liabilities of the current period. For this purpose, the City considers revenues to be available if they are collected within 60 days of the end of the current fiscal period. Expenditures are recorded when a liability is incurred, as under accrual accounting. However, debt service expenditures, as well as expenditures related to compensated absences and claims and judgments, are recorded only when payment is due.
Property taxes, franchise fees and other taxes, licenses, rent, and interest associated with the current fiscal period are all considered to be susceptible to accrual and so have been recognized as revenues of the current fiscal period. Revenues for expenditure driven grants are recognized when the qualifying expenditures are incurred. All other revenue items are considered to be measurable and available only when cash is received by the City.
The City reports the following major governmental funds:
The General Fund is the City’s primary operating fund. It accounts for all financial resources of the general government, except those required to be accounted for in another fund. The Community Redevelopment Agency (CRA) was created to promote economic development for local businesses and for new businesses. This fund is used to account for monies received from Tax Increment Financing (TIF) from the City of Florida City and Miami-Dade County for use in the area designated as the CRA.
The Grants Fund accounts for all grant monies and the related program income from federal, state, and local grants received.

CITY OF FLORIDA CITY, FLORIDA
NOTES TO BASIC FINANCIAL STATEMENTS
FOR THE FISCAL YEAR ENDED SEPTEMBER 30, 2016
27
NOTE 1 – SUMMARY OF SIGNIFICANT ACCOUNTING POLICIES (CONTINUED)
C. MEASUREMENT FOCUS, BASIS OF ACCOUNTING, AND FINANCIAL STATEMENT PRESENTATION (CONTINUED)
The City reports the following major proprietary fund in the basic financial statements:
The Water and Sewer Fund accounts for activities of providing water and sewer services to the public.
Additionally, the City reports the following fund type:
The Fiduciary Funds are used to account for the City’s single-employer defined benefit pension plans covering substantially all of its police officers and elected officials.
As a general rule, the effect of interfund activity has been eliminated from the government-wide financial statements. Exceptions to this general rule are payments-in-lieu of taxes and other charges between the City’s various utility functions and various other functions of the City. Elimination of these charges would distort the direct costs and program revenues reported for the various functions concerned.
Amounts reported as program revenues include 1) charges to customers or applicants for goods, services, or privileges provided, 2) operating grants and contributions, and 3) capital grants and contributions. Internally dedicated resources are reported as general revenues rather than as program revenues. Likewise, general revenues include all taxes.
Proprietary funds distinguish operating revenues and expenses from non-operating items. Operating revenues and expenses generally result from providing services and producing and delivering goods in connection with a proprietary fund’s principal ongoing operations. The principal operating revenues of the City’s water and sewer fund are charges to customers for services. Operating expenses for the enterprise fund includes the costs of services, administrative expenses, and depreciation on capital assets. All revenues and expenses not meeting this definition are reported as non-operating revenues and expenses.

CITY OF FLORIDA CITY, FLORIDA
NOTES TO BASIC FINANCIAL STATEMENTS
FOR THE FISCAL YEAR ENDED SEPTEMBER 30, 2016
28
NOTE 1 – SUMMARY OF SIGNIFICANT ACCOUNTING POLICIES (CONTINUED)
D. ASSETS, DEFERRED OUTFLOWS OF RESOURCES, LIABILITIES, DEFERRED INFLOWS OF RESOURCES, FUND BALANCE/NET POSITION
1. Deposits and Investments The City’s cash represents cash deposits. The City’s investment in Florida PRIME (external investment pool) is recorded at amortized cost. All other investments are reported at fair value. The nature of investments of the City are governed by the provisions of Florida Statutes Section 218. Under this statute, authorized investments are limited, unless otherwise authorized by law or ordinance, to the local government surplus funds trust fund, money market funds, direct or unconditionally guaranteed obligations of the United States Government, obligations of certain governmental agencies, interest bearing time deposits or savings accounts. Investments in the Police Officers’ Substitute Pension Trust Fund are governed by the plan’s investment policy and Florida Statutes Section 112.661. The Elected Officials Retirement Plan currently does not have a formal investment policy in place and therefore all of the plan’s assets are in a money market savings account. 2. Receivables and Payables Activity between funds that are representative of current lending/borrowing arrangements outstanding at the end of the fiscal year are referred to as “due to/from other funds”. Any residual balances outstanding between the governmental activities and business-type activities are reported in the government-wide financial statements as “internal balances”. 3. Capital Assets Capital assets, which include property, plant and equipment, intangibles and certain infrastructure assets (e.g., streets, alleys, sidewalks, drainage, lighting systems, and similar items), are reported in the applicable governmental or business-type activities columns in the government-wide financial statements. The City did not retroactively report infrastructure assets. Capital assets are defined by the City as assets with an initial, individual cost of more than $5,000 and an estimated useful life in excess of one year. Such assets are recorded at historical cost or estimated historical cost if purchased or constructed. Donated capital assets are recorded at acquisition cost at the date of donation. The costs of normal maintenance and repairs that do not add to the value of the asset or materially extend assets lives are not capitalized.

CITY OF FLORIDA CITY, FLORIDA
NOTES TO BASIC FINANCIAL STATEMENTS
FOR THE FISCAL YEAR ENDED SEPTEMBER 30, 2016
29
NOTE 1 – SUMMARY OF SIGNIFICANT ACCOUNTING POLICIES (CONTINUED)
D. ASSETS, DEFERRED OUTFLOWS OF RESOURCES, LIABILITIES, DEFERRED INFLOWS OF RESOURCES, FUND BALANCE/NET POSITION (CONTINUED)
3. Capital Assets (continued) Major outlays for capital assets and improvements are capitalized as projects are constructed. Interest incurred during the construction phase of capital assets of business-type activities is included as part of the capitalized value of the asset constructed. No such costs were capitalized in 2016. Capital assets of the City are depreciated using the straight line method over the following estimated useful lives:
Assets Years Buildings 10-50 Equipment and Machinery 3-5 Plant Distribution System 25-50
4. Compensated Absences City employees are granted vacation and sick pay leave in varying amounts based on length of service and the department in which the employee provides service. It is the City’s policy to permit full-time employees to accumulate limited amounts of earned vacation leave and a limited amount of earned sick pay. Upon separation from service, employees receive payment for all unused vacation leave and 50% of unused sick leave for general employees and 75% of unused sick leave for police officers. In the governmental funds, a liability is recorded only for vacation and sick leave payouts for employees that resigned or terminated prior to fiscal year end and were subsequently paid with current available financial resources.
5. Long-Term Obligations In the government-wide financial statements, and proprietary fund types in the fund financial statements, long-term debt and other long-term obligations are reported as liabilities in the applicable governmental activities, business-type activities, or proprietary fund type statement of net position. Bond premiums and discounts are deferred and amortized over the life of the bonds using the straight-line amortization method. The results of using this method do not differ significantly from the effective interest method. Issuance costs are expensed in the year incurred. Bonds payable are reported net of the applicable bond premium or discount.

CITY OF FLORIDA CITY, FLORIDA
NOTES TO BASIC FINANCIAL STATEMENTS
FOR THE FISCAL YEAR ENDED SEPTEMBER 30, 2016
30
NOTE 1 – SUMMARY OF SIGNIFICANT ACCOUNTING POLICIES (CONTINUED)
D. ASSETS, DEFERRED OUTFLOWS OF RESOURCES, LIABILITIES, DEFERRED INFLOWS OF RESOURCES, FUND BALANCE/NET POSITION (CONTINUED)
5. Long-Term Obligations (continued) In the fund financial statements, governmental fund types recognize bond premiums and discounts, as well as bond issuance costs, during the current period. The face amount of debt issued is reported as other financing sources. Premiums received on debt issuances are reported as other financing sources while discounts on debt issuances are reported as other financing uses. Issuance costs, whether or not withheld from the actual debt proceeds received, are reported as debt service expenditures in the year incurred.
6. Net Position Net position of the government-wide and proprietary funds are categorized as net investment in capital assets, restricted or unrestricted. Net investment in capital assets is that portion of net position that relates to the City’s capital assets reduced by accumulated depreciation, deferred outflows or inflows related to debt, and by any outstanding debt incurred to acquire, construct or improve those assets, excluding unexpended proceeds. Restricted net position is that portion of net position that has been restricted for general use by external parties (creditors, grantors, contributors, or laws or regulations of other governments) or imposed by law through constitutional provisions or enabling legislation. Unrestricted net position consists of net position that does not meet the definition of either of the other two components. 7. Deferred Outflows/Inflows of Resources In addition to assets, the statement of net position will sometimes report a separate section for deferred outflows of resources. This separate financial statement element, deferred outflows of resources, represents a consumption of net position that applies to a future period and so will not be recognized as an outflow of resources (expense/expenditure) until then. The City reports within its government-wide statement of net position as deferred outflows of resources, amounts contributed during fiscal year 2016 for the City’s various pension plans and cost-sharing multiple employer pension plans (cost-sharing plans). The net pension liabilities/assets associated with the City’s pension plans were measured as of September 30, 2015 and as of June 30, 2016 for the cost-sharing plans. The amounts paid to the pension plans during fiscal year 2016, subsequent to the measurement dates, will be reflected within the City’s pension expense and related liability/asset when the net pension liability/asset is measured for the next fiscal year.

CITY OF FLORIDA CITY, FLORIDA
NOTES TO BASIC FINANCIAL STATEMENTS
FOR THE FISCAL YEAR ENDED SEPTEMBER 30, 2016
31
D. ASSETS, DEFERRED OUTFLOWS OF RESOURCES, LIABILITIES, DEFERRED INFLOWS OF RESOURCES, FUND BALANCE/NET POSITION (CONTINUED)
7. Deferred Outflows/Inflows of Resources (continued) In addition to liabilities, the statement of net position will sometimes report a separate section for deferred inflows of resources. This separate financial statement element, deferred inflows of resources, represents an acquisition of net position that applies to a future period and so will not be recognized as an inflow of resources (revenue) until that time. Within the government-wide statement of net position, the City reports deferred inflows related to unavailable revenues that qualify for reporting in this category. The governmental funds report this item as a deferred inflow until the criteria for revenue recognition has been met. Also, within the government-wide statement of net position, the City reports as deferred inflows or outflows, amounts representing the net difference between or differences between expected and actual results, changes in assumptions and projected and actual earnings of its pension plan. Differences between projected and actual earnings will be amortized over a five year closed period beginning in the year in which the difference occurred and are presented as a net deferred inflow or outflow at the measurement date. All other amounts are presented as either a deferred inflow or outflow established at their respective measurement date when the difference occurred and is amortized over the remaining service lives of employees. 8. Net Position Flow Assumption Sometimes the City will fund outlays for a particular purpose from both restricted (e.g., restricted bond or grant proceeds) and unrestricted resources. In order to calculate the amounts to report as restricted - net position and unrestricted - net position in the government-wide and proprietary fund financial statements, a flow assumption must be made about the order in which the resources are considered to be applied. It is the City’s policy to consider restricted – net position to have been depleted before unrestricted - net position is applied.
9. Fund Balance Flow Assumptions Sometimes the City will fund outlays for a particular purpose from both restricted and unrestricted resources (the total of committed, assigned, and unassigned fund balance). In order to calculate the amounts to report as restricted, committed, assigned, and unassigned fund balance in the governmental fund financial statements a flow assumption must be made about the order in which the resources are considered to be applied. It is the City’s policy to consider restricted fund balance to have been depleted before using any of the components of unrestricted fund balance. Further, when the components of unrestricted fund balance can be used for the same purpose, committed fund balance is depleted first, followed by assigned fund balance. Unassigned fund balance is applied last.

CITY OF FLORIDA CITY, FLORIDA
NOTES TO BASIC FINANCIAL STATEMENTS
FOR THE FISCAL YEAR ENDED SEPTEMBER 30, 2016
32
NOTE 1 – SUMMARY OF SIGNIFICANT ACCOUNTING POLICIES (CONTINUED) D. ASSETS, DEFERRED OUTFLOWS OF RESOURCES, LIABILITIES, DEFERRED INFLOWS OF
RESOURCES, FUND BALANCE/NET POSITION (CONTINUED) 10. Fund Balance Policies The City’s accounting and finance policies are used to interpret the nature and/or requirements of the funds and their corresponding assignment of restricted, committed, assigned or unassigned.
The City reports the following classifications:
Non-spendable fund balance. Non-spendable fund balances are amounts that cannot be spent because they are either (a) not in spendable form or (b) legally or contractually required to be maintained intact. Restricted fund balance. Restricted fund balances are amounts that can be spent only for specific purposes stipulated by (a) external resource providers such as creditors (by debt covenants), grantors, contributors, or laws or regulations of other governments; or (b) imposed by law through constitutional provisions or enabling legislation. Committed fund balance. These amounts can only be used for the specific purposes pursuant to constraints imposed by a formal action of the government’s highest level of decision-making authority. The City Council is the highest level of decision-making authority for the government that can, by adoption of a resolution or an ordinance (equally binding), commit fund balance. Once adopted, the limitation remains in place until the City Council removes or revises the limitation by taking the same type of action (the adoption of another resolution or ordinance). This classification also includes contractual obligations to the extent that existing resources in the fund have been specifically committed for use in satisfying those contractual requirements. Assigned fund balance. This classification reflects the amounts constrained by the City’s “intent” to be used for specific purposes, but are neither restricted nor committed. The City’s policy is that the City Council and the Mayor have the authority to assign amounts to be used for specific purposes. Assigned fund balances include all remaining amounts (except negative balances) that are reported in governmental funds, other than the General Fund, that are not classified as non-spendable and are neither restricted nor committed. Unassigned fund balance. This fund balance is the residual classification for the General Fund. It is also used to report negative fund balances in other governmental funds.

CITY OF FLORIDA CITY, FLORIDA
NOTES TO BASIC FINANCIAL STATEMENTS
FOR THE FISCAL YEAR ENDED SEPTEMBER 30, 2016
33
NOTE 1 – SUMMARY OF SIGNIFICANT ACCOUNTING POLICIES (CONTINUED) D. ASSETS, DEFERRED OUTFLOWS OF RESOURCES, LIABILITIES, DEFERRED INFLOWS OF
RESOURCES, FUND BALANCE/NET POSITION (CONTINUED) 11. Use of Estimates The preparation of financial statements in conformity with accounting principles generally accepted in the United States of America requires management to make estimates and assumptions that affect the amounts of assets and deferred outflows of resources, liabilities and deferred inflows of resources, disclosures of contingent liabilities, revenues and expenditures/expenses reported in the financial statements and accompanying notes. Actual results could differ from those estimates.
12. Unearned/Unavailable Revenue Unearned revenue arises when resources are received by the City before it has a legal claim to them. In addition, inflows that do not yet meet the criteria for revenue recognition are recorded as unearned revenue or a deferred inflow in the government-wide and the fund financial statements. In subsequent periods, when the City has a legal claim to the resources, the liability for unearned revenue or a deferred inflow is removed and revenue is recognized. In the governmental funds, unavailable revenue may also arise if the funds are not received in the availability period; the funds are then not considered a current available resource. At September 30, 2016, the City reported unavailable revenues related to transportation surtax and rent revenue. 13. Implementation of Governmental Accounting Standards Board Statements The City implemented the following GASB Statements that impacted the financial statements during the fiscal year ended September 30, 2016: GASB Statement No. 72, Fair Value Measurement and Application. This Statement addresses accounting and financial reporting issues related to fair value measurements. This Statement provides guidance for determining a fair value measurement for financial reporting purposes. This Statement also provides guidance for applying fair value to certain investments and disclosures related to all fair value measurements. GASB Statement No. 79, Certain External Investment Pools and Pool Participants. This Statement addresses accounting and financial reporting for certain external investment pools and pool participants. Specifically, it establishes criteria for an external investment pool to qualify for making the election to measure all of its investments at amortized cost for financial reporting purposes.

CITY OF FLORIDA CITY, FLORIDA
NOTES TO BASIC FINANCIAL STATEMENTS
FOR THE FISCAL YEAR ENDED SEPTEMBER 30, 2016
34
NOTE 2 – DEPOSITS AND INVESTMENTS DEPOSITS In addition to insurance provided by the Federal Depository Insurance Corporation (FDIC), all deposits are held in banking institutions approved by the State Treasurer of the State of Florida to hold public funds. Under Florida Statutes Chapter 280, Florida Security for Public Deposits Act, the State Treasurer requires all Florida qualified public depositories to deposit with the Treasurer or another banking institution eligible collateral. In the event of a failure of a qualified public depository, the remaining public depositories would be responsible for covering any resulting losses. Accordingly, all amounts reported as cash deposits are insured or collateralized. INVESTMENTS The City has adopted an investment policy in accordance with Florida Statutes to establish guidelines for the efficient management of its cash reserves. The City is authorized to invest in obligations of the U.S. Treasury, its agencies and instrumentalities, certificates of deposit, the State Board of Administration investment pool, any intergovernmental investment pools authorized pursuant to Chapter 163 of the Florida Statutes, SEC registered money market funds with the highest credit quality rating from a nationally recognized rating agency, and securities of any interest in any open-end or closed-end management type investment company or investment trust registered under the Investment Company Act of 1940, provided that the portfolio is limited to obligations of the U.S. government, its agencies and instrumentalities and to repurchase agreements fully collateralized by such U.S. government obligations and provided that such investment company or investment trust takes delivery of such collateral either directly or through an authorized custodian. The State Board of Administration (SBA) administers the Florida PRIME which is governed by Chapter 19-7 of the Florida Administrative Code and Chapters 218 and 215 of the Florida Statutes. These rules provide guidance and establish the policies and general operating procedures for the administration of the Florida PRIME. The Florida PRIME is not a registrant with the Securities and Exchange Commission (SEC); however, the Board has adopted operating procedures consistent with the requirements for a 2a-7 fund, which permits money market funds to use amortized cost to maintain a constant net asset value (NAV) of $1 per share. In accordance with GASB Statement No. 79, Certain External Investment Pools and Pool Participants, the City’s investment in the Florida PRIME meets the definition of a qualifying investment pool that measures, for financial reporting purposes, all of its investments at amortized cost and should disclose the presence of any limitations or restrictions on withdrawals. As of September 30, 2016, there were no redemption fees or maximum transaction amounts, or any other requirements that serve to limit a participant’s daily access to 100 percent of their account value.

CITY OF FLORIDA CITY, FLORIDA
NOTES TO BASIC FINANCIAL STATEMENTS
FOR THE FISCAL YEAR ENDED SEPTEMBER 30, 2016
35
NOTE 2 – DEPOSITS AND INVESTMENTS (CONTINUED) INVESTMENTS (CONTINUED)
The investment in the Florida PRIME is not insured by FDIC or any other governmental agency. As of September 30, 2016, the City had the following investment subject to interest rate risk:
WeightedAverage
Investment Maturity
SBA - Florida PRIME 394,140$ 50 days
Interest Rate Risk The City has an investment policy of structuring the investment portfolio so that the investments mature to meet cash requirements for ongoing operations, thereby avoiding the need to sell investments on the open market prior to maturity and investing operating funds primarily in cash, short-term securities, certificates of deposit, or similar investment pools. Credit Risk The City’s investment policy limits investments to the highest ratings issued by a nationally recognized statistical rating organization (NRSRO). The Florida PRIME is rated AAAm by Standard and Poor’s. FAIR VALUE HIERARCHY Fair value is defined as the price that would be received to sell an asset or paid to transfer a liability in an orderly transaction between market participants at the measurement date. The City and the City’s pension plan categorizes their fair value measurements within the fair value hierarchy established by generally accepted accounting principles. The fair value hierarchy categorizes the inputs to valuation techniques used to measure fair value into three levels based on the extent to which inputs used in measuring fair value are observable in the market. The City has no investments that are reported at fair value. Level 1 - Investments' fair values based on prices quoted in active markets for identical assets. Level 2 - Investments' fair values based on observable inputs for the assets either directly or indirectly, other than those considered Level 1 inputs, which may include quoted prices for identical assets in markets that are not considered to be active, and quoted prices of similar assets in active or inactive markets. Level 3 - Investments' fair values based upon unobservable inputs.

CITY OF FLORIDA CITY, FLORIDA
NOTES TO BASIC FINANCIAL STATEMENTS
FOR THE FISCAL YEAR ENDED SEPTEMBER 30, 2016
36
NOTE 3 - RECEIVABLES
Receivables as of September 30, 2016 for the City’s individual major funds and non-major funds, including the allowances for uncollectible accounts, are as follows:
Water and Florida City
General Grants Sewer Foundation TotalCustomers billed 771,658$ --$ 543,650$ --$ 1,315,308$ Customers unbilled 94,183 -- 152,691 -- 246,874 Taxes 788,876 -- -- -- 788,876 Intergovernmental -- 68,812 -- -- 68,812 Other receivables 9,615 -- -- 34,191 43,806
Gross receivables 1,664,332 68,812 696,341 34,191 2,463,676 Less: allowance (234,388) (51,838) (330,307) -- (616,533)
Total Receivables, Net 1,429,944$ 16,974$ 366,034$ 34,191$ 1,847,143$
NOTE 4 – PROPERTY TAXES
Under Florida law, the assessment of all properties and the collection of all county, municipal and school board property taxes are consolidated in the offices of the Miami-Dade County Property Appraiser and County Tax Collector. The laws of the State regulating tax assessments are also designed to ensure a consistent property valuation method statewide. State statutes permit municipalities to levy property taxes at a rate of up to 10 mills ($10 per $1,000 of assessed taxable valuation). The millage rate assessed by the City for fiscal year ended September 30, 2016 is 7.1858 per $1,000. All property is reassessed according to its fair market value as of January 1 of each year. Each assessment roll is submitted to the Executive Director of the State Department of Revenue for review to determine if the rolls meet all of the appropriate requirements of State statutes. Property taxes are centrally billed and collected by the County and remitted to the City for their proportionate share of collected taxes. Current year property values are assessed as of January 1st, the lien date, of each year for the fiscal year beginning October 1st and are billed on November 1st, subject to a 1% per month discount for the period November through February, and are due no later than March 31st. On April 1st, unpaid amounts become delinquent and are subject to interest and penalties. Beginning June 1st, tax certificates representing delinquent taxes with interest and penalties are sold by the County, with remittance to the City for its share of those receipts. Generally, the City collects more than 95% of the current year’s property taxes during the year in which they are due. There were no material delinquent property taxes as of September 30, 2016.

CITY OF FLORIDA CITY, FLORIDA
NOTES TO BASIC FINANCIAL STATEMENTS
FOR THE FISCAL YEAR ENDED SEPTEMBER 30, 2016
37
NOTE 5 – INTERFUND RECEIVABLES, PAYABLES
The composition of interfund balances as of September 30, 2016 is as follows:
Receivable Fund Payable Fund AmountGeneral Grants 256,671$ General Water and Sewer 194,018 General Law Enforcement Trust Fund Federal 46,711 General Law Enforcement Trust Fund State 40,526 General CRA 26,873
Total Interfund Balances 564,799$
The outstanding balances between funds result mainly from the time lag between the dates (1) interfund goods and services are provided or reimbursable expenditures occur, (2) transactions are recorded in the accounting system, and (3) payments between funds are made.
NOTE 6 – RESTRICTED CASH
General FundTransportation 4,142,817$ Customer deposits 138,865
Total General Fund 4,281,682$
Other Governmental FundsLaw enforcement trust funds 235,711$
Water and SewerCustomer deposits 538,729$ Sewer system capital improvements 656,304 Reserve fund 62,444
Total Water and Sewer 1,257,477$
The water revenue bond resolutions require that certain monies held by the water fund be restricted for the following purposes:

CITY OF FLORIDA CITY, FLORIDA
NOTES TO BASIC FINANCIAL STATEMENTS
FOR THE FISCAL YEAR ENDED SEPTEMBER 30, 2016
38
NOTE 6 – RESTRICTED CASH (CONTINUED)
A. RESERVE FUND The reserve fund is required to accumulate $22,247; as of September 30, 2016 the balance is $62,444. This fund is used in order to meet unforeseen operating expenses of an emergency nature or for renewals and replacement of assets, paying principal and interest in the event of a deficiency or unavailable funds.
B. SEWER SYSTEM CAPITAL IMPROVEMENTS The City is required under a 1988 State grant to reserve $32,453 a year in a sewer system capital improvement account to accumulate the equivalent value of the sewer system grant received by the City, as adjusted for inflationary cost increases. Annual deposits of $32,453 were required to be made until the sum of all deposits exceeds $649,060. As of September 30, 2016 the balance is $656,304.
C. CUSTOMER DEPOSITS This amount is restricted based on deposits paid to the City by its water and sewer customers.

CITY OF FLORIDA CITY, FLORIDA
NOTES TO BASIC FINANCIAL STATEMENTS
FOR THE FISCAL YEAR ENDED SEPTEMBER 30, 2016
39
NOTE 7 – CAPITAL ASSETS
Capital asset activity for the year ended September 30, 2016 was as follows:
Beginning EndingBalance Increases Decreases Balance
Governmental ActivitiesCapital Assets Not Being Depreciated Land 5,968,172$ 89,525$ (13,076)$ 6,044,621$ Construction in progress (1) -- 473,963 (456,313) 17,650
Total Capital Assets Not Being Depreciated 5,968,172 563,488 (469,389) 6,062,271
Capital Assets Being Depreciated Buildings 22,114,553 368,315 -- 22,482,868 Equipment and machinery 2,980,442 190,217 -- 3,170,659
Total Capital Assets Being Depreciated 25,094,995 558,532 -- 25,653,527
Less accumulated depreciation for: Buildings (6,972,998) (663,676) -- (7,636,674) Equipment and machinery (2,228,495) (402,360) -- (2,630,855)
Total Accumulated Depreciation (9,201,493) (1,066,036) -- (10,267,529)
Total Capital Assets Being Depreciated, Net 15,893,502 (507,504) -- 15,385,998
Governmental Activities Capital Assets, Net 21,861,674$ 55,984$ (469,389)$ 21,448,269$
Business-type ActivitiesCapital Assets Not Being Depreciated
Land 1,578,818$ --$ --$ 1,578,818$ Construction in progress (1) 2,014,577 459,208 (1,831,296) 642,489
Total Capital Assets Not Being Depreciated 3,593,395 459,208 (1,831,296) 2,221,307
Capital Assets Being Depreciated Machinery and equipment 711,984 7,450 (13,337) 706,097 Plant distribution system 33,207,059 1,858,660 -- 35,065,719
Total Capital Assets Being Depreciated 33,919,043 1,866,110 (13,337) 35,771,816
Less accumulated depreciation for: Machinery and equipment (641,665) (14,114) 13,337 (642,442) Plant distribution system (17,860,225) (1,032,239) -- (18,892,464)
Total Accumulated Depreciation (18,501,890) (1,046,353) 13,337 (19,534,906)
Total Capital Assets Being Depreciated, Net 15,417,153 819,757 -- 16,236,910
Business-type Activities Capital Assets, Net 19,010,548$ 1,278,965$ (1,831,296)$ 18,458,217$
(1) Increases include assets contributed from governmental activities to business-type activities of $456,313.
(1) Increases and decreases include assets acquired and constructed by governmental activities of $456,313 contributed to the water and sewer fund.

CITY OF FLORIDA CITY, FLORIDA
NOTES TO BASIC FINANCIAL STATEMENTS
FOR THE FISCAL YEAR ENDED SEPTEMBER 30, 2016
40
NOTE 7 – CAPITAL ASSETS (CONTINUED) Depreciation expense was charged as functions/programs of the primary government as follows:
Governmental Activities General government 732,425$ Public safety 149,044 Public works 12,339 Parks and recreation 172,228
Total Depreciation Expense - Governmental Activities 1,066,036$ Business-type Activities Water and sewer 1,046,353$
NOTE 8 – LONG-TERM DEBT The following is a summary of changes in long-term liabilities of the City for governmental activities for the fiscal year ended September 30, 2016:
Beginning Ending Due Within
Balance Additions Reductions Balance One Year
Governmental Activities
Notes payable 270,000$ --$ (135,000)$ 135,000$ 135,000$
Compensated absences 739,255 465,304 (419,562) 784,997 78,500
Net OPEB obligation 583,771 65,353 -- 649,124 --
Net pension liability (as restated) 5,441,590 4,213,215 (1,288,060) 8,366,745 --
Governmental Activities Long-Term Liabilities 7,034,616$ 4,743,872$ (1,842,622)$ 9,935,866$ 213,500$
All governmental activities obligations are generally liquidated by the general fund.

CITY OF FLORIDA CITY, FLORIDA
NOTES TO BASIC FINANCIAL STATEMENTS
FOR THE FISCAL YEAR ENDED SEPTEMBER 30, 2016
41
NOTE 8 – LONG-TERM DEBT (CONTINUED)
NOTE PAYABLE On June 12, 2013, the City obtained a $300,000 note payable with 1st National Bank of South Florida, with a fixed interest rate of 2.2% per annum. The note payable has a maturity date of 16 months from the date of execution. On November 12, 2014, the City repaid $30,000 of principal and refinanced the balance of $270,000 at the same interest rate. Interest is payable monthly and principal is due in two payments. As of September 30, 2016, the principal balance is $135,000. The following is a summary of changes in long-term liabilities of the City for business-type activities for the fiscal year ended September 30, 2016:
Beginning Ending Due Within
Balance Additions Reductions Balance One Year
Business-type Activities
Water revenue bonds, Series 1981 139,900$ --$ (14,700)$ 125,200$ 15,400$
Compensated absences 37,613 29,050 (22,059) 44,604 4,460
Net OPEB obligation 104,072 11,882 -- 115,954 --
Net pension liability 287,498 239,826 (54,916) 472,408 --
Business-type Activities Long-Term Liabilities 569,083$ 280,758$ (91,675)$ 758,166$ 19,860$
WATER REVENUE BONDS – SERIES 1981 On September 16, 1983, the City issued bonds in the amount of $365,000 as an addition to 1977 Water Revenue Bonds for the purpose of completing the construction of additions, extensions, and improvements to the water system. Payments are due in annual principal installments on September 1st, matures September 2023; interest at 5%. As of September 30, 2016, the principal balance is $125,200. The City pledges its water system revenues which consist of the charges for services to the customers of the water utility system. For the fiscal year ended September 30, 2016, debt service of approximately $21,695 is only 0.5% of the approximate $3,700,000 of the pledged revenues. Over the life of the debt which matures in 2023, it is estimated that debt service will be less than 4% of the total pledged revenues.

CITY OF FLORIDA CITY, FLORIDA
NOTES TO BASIC FINANCIAL STATEMENTS
FOR THE FISCAL YEAR ENDED SEPTEMBER 30, 2016
42
NOTE 8 – LONG-TERM DEBT (CONTINUED)
WATER REVENUE BONDS – SERIES 1981 (CONTINUED) Debt service requirements to maturity for the bonds at September 30, 2016 are as follows:
Fiscal Year Ending September 30 Principal Interest Total2017 15,400$ 6,260$ 21,660$ 2018 16,100 5,490 21,590 2019 17,000 4,685 21,685 2020 17,800 3,835 21,635 2021 18,700 2,945 21,645
2022 – 2024 40,200 3,040 43,240
Total Debt Service Requirements 125,200$ 26,255$ 151,455$
Water Revenue Bonds
NOTE 9 – COMMITMENTS AND CONTINGENCIES
A. LITIGATION The City is involved in several lawsuits incidental to its operations, the outcome of which, in the opinion of management and legal counsel, would not have a material adverse effect on the financial condition of the City. B. GRANTS CONTINGENCY Amounts received or receivable from grant agencies are subject to audit and adjustment by grantor agencies, principally the federal government and the State of Florida. Any disallowed claims, including amounts already collected, may constitute a liability of the applicable funds. The amount, if any, of expenditures that may be disallowed by the grantor cannot be determined at this time, although the City expects such amounts, if any, to be immaterial.
C. RISK MANAGEMENT The City is exposed to various risks of loss related to torts, theft of, damage to and destruction of assets, errors and omissions and natural disasters for which the City carries commercial insurance. There were no reductions in coverage from the prior year. Settled claims have not exceeded the City’s coverage in any of the past three fiscal years.

CITY OF FLORIDA CITY, FLORIDA
NOTES TO BASIC FINANCIAL STATEMENTS
FOR THE FISCAL YEAR ENDED SEPTEMBER 30, 2016
43
NOTE 10 – DEFINED CONTRIBUTION PLAN
Effective October 1, 1998, the City adopted the City of Florida City Defined Contribution Plan, created in accordance with Internal Revenue Code Section 401(a) for all of its general employees. Employees are eligible to participate in this Plan after completing one year of service. Contributions to this Plan began on January 1, 1999 after the General Employees Retirement Plan was frozen on December 31, 1998. The Plan is administered by VALIC. Amendments to the Plan are authorized by the City Commission. Employees contribute 2% of their compensation and the City contributes 4% of participants’ compensation. The participants are 100% vested in their contributions and vest over a three year period in the City’s contributions. Employee contributions to the Plan for fiscal year ended September 30, 2016 were $ 2,808; the City’s contribution was $27,170.
NOTE 11 – POLICE OFFICERS’ SUBSTITUTE PENSION TRUST FUND
A. PLAN DESCRIPTION The City is the sponsor of a single-employer Public Employee Retirement System (PERS) which provides pension benefits for its police officers. The PERS is considered to be part of the City’s financial reporting entity and is included in the City’s basic financial statements as a pension trust fund. The retirement plan does not issue a separate financial report. Included below are the Statement of Fiduciary Net Position and the Statement of Changes in Fiduciary Net Position as of and for the fiscal year ended September 30, 2016.
Assets
InvestmentsMoney market mutual funds 124,207$ Common stock 1,964,676 Corporate bonds 336,822 Government securities 548,813
Total Investments 2,974,518
ReceivablesAccrued interest 4,770
Total Assets 2,979,288
Net Position Restricted for Pension Benefits 2,979,288$
Police Officers' Substitute Pension Trust FundStatement of Fiduciary Net Position
September 30, 2016

CITY OF FLORIDA CITY, FLORIDA
NOTES TO BASIC FINANCIAL STATEMENTS
FOR THE FISCAL YEAR ENDED SEPTEMBER 30, 2016
44
NOTE 11 – POLICE OFFICERS’ SUBSTITUTE PENSION TRUST FUND (CONTINUED)
A. PLAN DESCRIPTION (CONTINUED)
Additions
Contributions Employer --$
Total Contributions --
Investment EarningsNet appreciation in fair value of investments 182,546Interest and dividends 55,063
Total Investment Earnings 237,609
Total Additions 237,609
DeductionsBenefits paid 284,400Administrative expenses 36,760
Total Deductions 321,160
Change in Net Position (83,551)
Net Position Restricted for Pension Benefits - Beginning 3,062,839
Net Position Restricted for Pension Benefits - Ending 2,979,288$
For the Fiscal Year Ended September 30, 2016
Police Officers' Substitute Pension Trust FundStatement of Changes in Fiduciary Net Position

CITY OF FLORIDA CITY, FLORIDA
NOTES TO BASIC FINANCIAL STATEMENTS
FOR THE FISCAL YEAR ENDED SEPTEMBER 30, 2016
45
NOTE 11 – POLICE OFFICERS’ SUBSTITUTE PENSION TRUST FUND (CONTINUED) A. PLAN DESCRIPTION (CONTINUED) At October 1, 2014, the date of the most recent actuarial valuation, membership in the police officers’ substitute pension trust fund consisted of the following:
Inactive plan members or beneficiaries currently receiving benefits 5 Inactive plan members entitled to but not yet receiving benefits 42
47
Effective May 1, 2008, a new replacement plan was established under Ordinance 07-03 (new local plan). The new plan is called the “Substitute Pension Trust Fund”. The Board of Trustees serve as the trustees of the new plan. Simultaneous with the creation of the new plan and effective May 1, 2008, under Ordinance 08-03, the old Chapter 185 Plan which had originally been created under Ordinance 69-25, was terminated (the old plan). Essentially, the new plan was a continuation of the old plan with the exception that the new plan was not a Chapter 185 Plan. On May 1, 2008, the City of Florida City also joined the Florida Retirement System (FRS) for its police officers. A referendum was held to allow the police officers to: stay in the new local plan, join the FRS without being eligible for an employer benefit under the new local or join the FRS and keep their deferred vested benefit under the new plan. At the time of the conversion, two officers stayed in the City’s new local plan, twenty-two officers joined FRS while being ineligible to receive an employer benefit under the new local plan, and six officers joined FRS while retaining their accrued benefit under the new local plan. Additionally, all new officers are enrolled into the FRS upon employment.
All full-time permanent police employees were eligible to participate in the Plan from the date of employment. Police employees who retire at or after age 60 are entitled to a normal retirement benefit of 2.5% of Average Compensation multiplied by credited service years of service to a maximum of 30 years. Benefits vest at a rate of 10% per year.
Vested employees may retire at or after age 50 with at least ten years of credited service and receive reduced retirement benefits. Benefits, upon early retirement, are reduced by 3% for each year early retirement precedes normal retirement date. Active participants are allowed to purchase service credit for military service or prior service rendered as a police officer. Pension benefits are established and may be amended only by the City Commission.
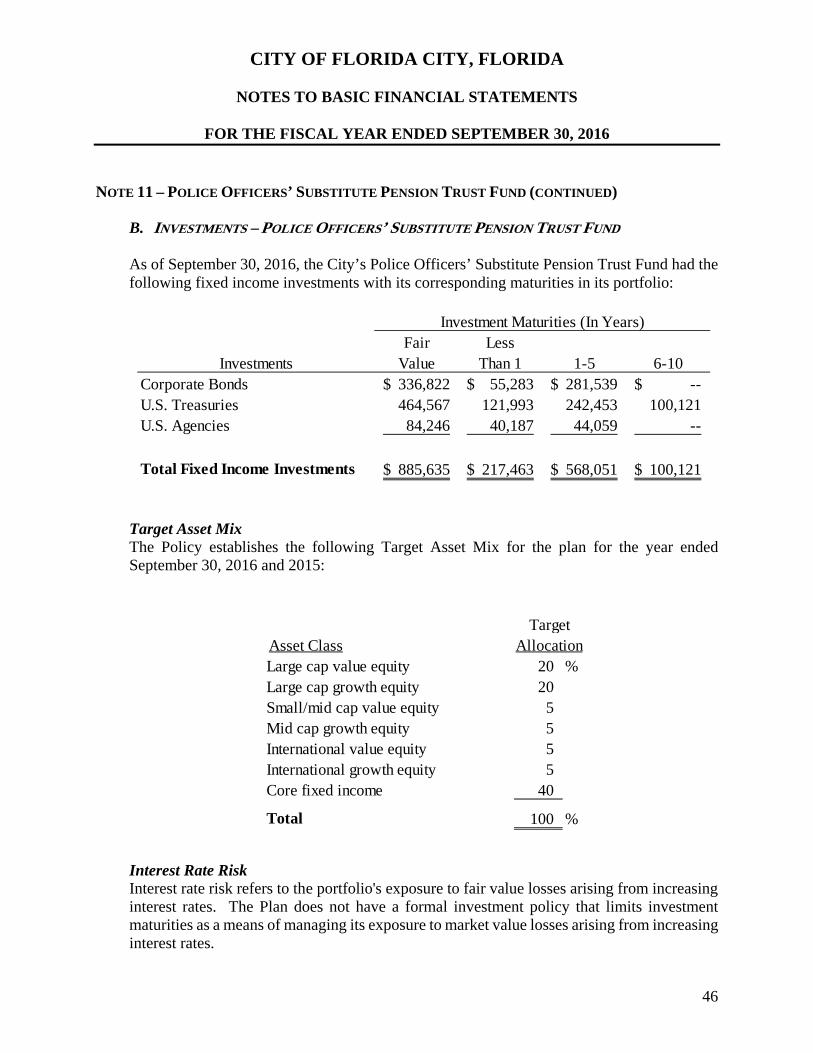
CITY OF FLORIDA CITY, FLORIDA
NOTES TO BASIC FINANCIAL STATEMENTS
FOR THE FISCAL YEAR ENDED SEPTEMBER 30, 2016
46
NOTE 11 – POLICE OFFICERS’ SUBSTITUTE PENSION TRUST FUND (CONTINUED)
B. INVESTMENTS – POLICE OFFICERS’ SUBSTITUTE PENSION TRUST FUND
As of September 30, 2016, the City’s Police Officers’ Substitute Pension Trust Fund had the following fixed income investments with its corresponding maturities in its portfolio:
Fair LessInvestments Value Than 1 1-5 6-10
Corporate Bonds 336,822$ 55,283$ 281,539$ --$ U.S. Treasuries 464,567 121,993 242,453 100,121 U.S. Agencies 84,246 40,187 44,059 --
Total Fixed Income Investments 885,635$ 217,463$ 568,051$ 100,121$
Investment Maturities (In Years)
Target Asset Mix The Policy establishes the following Target Asset Mix for the plan for the year ended September 30, 2016 and 2015:
Asset ClassLarge cap value equity 20 %Large cap growth equity 20 Small/mid cap value equity 5 Mid cap growth equity 5 International value equity 5 International growth equity 5 Core fixed income 40
Total 100 %
TargetAllocation
Interest Rate Risk Interest rate risk refers to the portfolio's exposure to fair value losses arising from increasing interest rates. The Plan does not have a formal investment policy that limits investment maturities as a means of managing its exposure to market value losses arising from increasing interest rates.

CITY OF FLORIDA CITY, FLORIDA
NOTES TO BASIC FINANCIAL STATEMENTS
FOR THE FISCAL YEAR ENDED SEPTEMBER 30, 2016
47
NOTE 11 – POLICE OFFICERS’ SUBSTITUTE PENSION TRUST FUND (CONTINUED)
B. INVESTMENTS – POLICE OFFICERS’ SUBSTITUTE PENSION TRUST FUND (CONTINUED)
Credit Risk The Plan’s investment policy limits investments in bonds, stocks, or other evidences of indebtedness issued or guaranteed by a corporation organized under the laws of the United States, any state or organized territory of the United States, or the District of Columbia, provided the corporation is listed on any one or more of the recognized national stock exchanges or on the National Market System of the NASDAQ Stock Market and in the case of bonds only, holds a rating in one of the three highest classifications by a major rating service. The Plan's corporate bonds were all rated "A" or better under Standard & Poor's ratings. The Plan’s government securities were all rated AAA by Standard & Poor’s. Concentration of Credit Risk The Plan's investment policy prohibits equity securities concentrations greater than 7.5% in the securities of any one company at cost and fixed income securities concentrations greater than 10% in any one issuer with the exception of U.S. government or agency issues. As of September 30, 3016, the value of each position held in the Plan’s portfolio comprised less than 5% of Plan net position. Rate of Return For the fiscal year ended September 30, 2016 and 2015, the annual money-weighted rate of return on pension plan investments, net of pension plan investment expense, was 7.08% and -2.48% respectively. The money-weighted rate of return expresses investment performance, net of investment manager and consultant expenses adjusted for the changing amounts actually invested. Inputs to the internal rate of return calculation are determined on a monthly basis. Fair Value Hierarchy The following is a description of the fair value techniques for the Police Officers’ Substitute Pension Trust Fund’s investments. Level 1 and 2 prices are obtained from various pricing sources by the Plan's custodian bank: The Plan also holds money market funds, which are reported at amortized cost. Common stock and U.S. Treasury securities, classified in Level 1, are valued using prices quoted in active markets for those securities, U.S. Agency securities, classified in Level 2, are valued using pricing models maximizing the use of observable inputs for similar securities.

CITY OF FLORIDA CITY, FLORIDA
NOTES TO BASIC FINANCIAL STATEMENTS
FOR THE FISCAL YEAR ENDED SEPTEMBER 30, 2016
48
NOTE 11 – POLICE OFFICERS’ SUBSTITUTE PENSION TRUST FUND (CONTINUED)
B. INVESTMENTS – POLICE OFFICERS’ SUBSTITUTE PENSION TRUST FUND (CONTINUED)
Fair Value Hierarchy (continued) Corporate bonds, classified in Level 2, are valued using pricing models maximizing the use of observable inputs for similar securities. This includes basing the value on yields currently available on comparable securities of issuers with similar credit ratings. When quoted prices are not available for identical or similar bonds, the bond is valued under a discounted cash flows approach that maximizes observable inputs, such as current yield of similar instruments, but includes adjustments for certain risks that may not be observable, such as credit and liquidity risks or a broker quote, if available. The Plan does not value any of its investments using level 3 inputs. The following is a summary of the fair value hierarchy of the fair value of investments as of September 30, 2016:
Quoted Pricesin Active Significant
Markets for OtherIdentical ObservableAssets Inputs
9/30/2016 (Level 1) (Level 2)Investments by Fair Value Level
Debt securitiesCorporate Bonds 336,822$ --$ 336,822$ U.S. Treasuries 464,567 464,567 --
U.S. Agencies 84,246 -- 84,246
Total debt securities 885,635 464,567 421,068
Equity securities
Common stock 1,964,676 1,964,676 --
Total investments by fair value 2,850,311 2,429,243$ 421,068$
Money market funds (exempt) 124,207
Total investments 2,974,518$
Fair Value Measurements Using

CITY OF FLORIDA CITY, FLORIDA
NOTES TO BASIC FINANCIAL STATEMENTS
FOR THE FISCAL YEAR ENDED SEPTEMBER 30, 2016
49
NOTE 11 – POLICE OFFICERS’ SUBSTITUTE PENSION TRUST FUND (CONTINUED)
B. INVESTMENTS – POLICE OFFICERS’ SUBSTITUTE PENSION TRUST FUND (CONTINUED)
Risks and Uncertainties The Plan invests in various investment securities. Investment securities are exposed to various risks such as interest rate, market, and credit risks. Due to the level of risk associated with certain investment securities, it is at least reasonably possible that changes in the values of investment securities will occur in the near term and those such changes could materially affect the amounts reported in the statement of fiduciary net position. The Plan, through its investment advisor, monitors the Plan’s investments and the risks associated therewith on a regular basis which the Plan believes minimizes these risks. C. CONTRIBUTIONS AND FUNDING POLICY Active members, if any, are required to contribute 7% of their salaries to the PERS. If an employee leaves covered employment or dies before ten years of service, accumulated employee contributions with credited interest are refunded. The City is required to make contributions at actuarially determined amounts; there was no contribution required for the fiscal year ended September 30, 2016. The minimum contribution consists of the normal cost plus the amortization of the components of the unfunded actuarial accrued liability, which should provide sufficient resources to pay employee pension benefits when due. The annual required contributions for the Plan for the current year were determined as part of the October 1, 2014 actuarial valuation using the aggregate actuarial cost method. The aggregate actuarial cost method does not identify and separately amortize unfunded actuarial liabilities and therefore, information about funding status and funding progress is presented using the entry age normal cost method for the Plan. D. ACCOUNTING POLICIES The Plan follows the accrual basis of accounting. Contributions are recorded when paid or when the City has made the commitment to contribute to the Plan. Purchases and sales are recorded on the trade-date basis. Benefits and refunds are recognized when due and payable in accordance with the terms of the Plan. Administrative costs of the Plan are funded through investment earnings.

CITY OF FLORIDA CITY, FLORIDA
NOTES TO BASIC FINANCIAL STATEMENTS
FOR THE FISCAL YEAR ENDED SEPTEMBER 30, 2016
50
NOTE 11 – POLICE OFFICERS’ SUBSTITUTE PENSION TRUST FUND (CONTINUED)
E. NET PENSION LIABILITY OF THE CITY As of September 30, 2016, the City reported the following net pension asset (NPA) which was measured as of September 30, 2015 (measurement date in accordance with GASB Statement No. 68). In addition, in accordance with GASB Statement No. 67, information as of September 30, 2016 has been disclosed:
2016 2015Total pension liability 2,934,049$ 2,909,803$
Plan fiduciary net position (2,979,288) (3,062,839)
Net Pension Asset (45,239)$ (153,036)$
Plan fiduciary net position as a percentage of the total pension liability 101.54% 105.26%
September 30,
Changes in the Net Pension Liability
Total Plan Fiduciary Net PensionPension Net LiabilityLiability Position (Asset)
(a) (b) (a) - (b)
Balances at September 30, 2014 2,923,878$ (3,254,448)$ (330,570)$
Changes for the year: Expected interest growth 173,844 (193,544) (19,700) Unexpected investment income -- 240,713 240,713 Demographic experience (10,934) -- (10,934) Benefit payments, including refunds of employee contributions (101,502) 101,502 -- Administrative expenses -- 42,938 42,938 Assumption changes (75,483) -- (75,483)
Net changes (14,075) 191,609 177,534
Balances at September 30, 2015 2,909,803$ (3,062,839)$ (153,036)$
Increase (Decrease)

CITY OF FLORIDA CITY, FLORIDA
NOTES TO BASIC FINANCIAL STATEMENTS
FOR THE FISCAL YEAR ENDED SEPTEMBER 30, 2016
51
NOTE 11 – POLICE OFFICERS’ SUBSTITUTE PENSION TRUST FUND (CONTINUED)
E. NET PENSION LIABILITY OF THE CITY (CONTINUED) Significant Actuarial Assumptions The total pension liability of the City was determined by an actuarial valuation using the following actuarial assumptions as of September 30, 2016 and 2015:
Actuarial valuation October 1, 2014Interest rates:
Single discount rate: 6.08%Inflation rate: 2.00%
Long-Term Expected Rate of Return The long-term expected rate of return on pension plan investments was determined using a building-block method in which best-estimate ranges of expected future real rates of return (expected returns, net of pension plan investment expense and inflation) are developed for each major asset class. These ranges are combined to produce the long-term expected rate of return by weighting the expected future real rates of return by the target asset allocation percentage and by adding expected inflation. Best estimates of arithmetic real rates of return for each major asset class included in the pension plan's target asset allocation as of September 30, 2016 and 2015 are summarized in the following table:
Asset Class
Large cap value equityLarge cap growth equitySmall/mid cap value equityMid cap growth equityInternational value equityInternational growth equityCore fixed income
5.8%
5.7%
Long-Term Expected Real Rate of Return
2016 2015
1.5%
6.0%6.0%6.8%6.5%5.9%5.4%1.9%
5.5%
5.7%6.5%6.2%

CITY OF FLORIDA CITY, FLORIDA
NOTES TO BASIC FINANCIAL STATEMENTS
FOR THE FISCAL YEAR ENDED SEPTEMBER 30, 2016
52
NOTE 11 – POLICE OFFICERS’ SUBSTITUTE PENSION TRUST FUND (CONTINUED)
E. NET PENSION LIABILITY OF THE CITY (CONTINUED) Discount Rate The discount rate used to measure the total pension liability as of September 30, 2016 and 2015 was 6.08 percent. The projection of cash flows used to determine the discount rates assumed that plan member contributions will be made at the current contribution rate and that City contributions will be made at the actuarially determined contribution rate. Based on those assumptions, the pension plan's fiduciary net position was projected to be available to make all projected future benefit payments of current plan members. Therefore, there was no need to adjust the long-term expected rate of return on Plan investments to determine the total pension liability. Sensitivity of the Net Pension Liability to Changes in the Discount Rate The following presents the net pension liability (asset) of the City, calculated using the discount rate of 6.08 percent as of September 30, 2016 and 2015, as well as what the City's net pension liability (asset) would be if it were calculated using a discount rate that is 1-percentage-point lower or 1-percentage-point higher than the current rate:
As of September 30, 2016:
1% Current 1%Decrease Discount Increase(5.08%) Rate (6.08%) (7.08%)
Net Pension Liability (Asset) 316,388$ (45,239)$ (344,537)$
As of September 30, 2015:1% Current 1%
Decrease Discount Increase(5.08%) Rate (6.08%) (7.08%)
Net Pension Liability (Asset) 218,113$ (153,036)$ (459,049)$

CITY OF FLORIDA CITY, FLORIDA
NOTES TO BASIC FINANCIAL STATEMENTS
FOR THE FISCAL YEAR ENDED SEPTEMBER 30, 2016
53
NOTE 11 – POLICE OFFICERS’ SUBSTITUTE PENSION TRUST FUND (CONTINUED)
E. NET PENSION LIABILITY OF THE CITY (CONTINUED) Pension Expense, Deferred Outflows of Resources and Deferred Inflows of Resources related to the Pension For the year ended September 30, 2016, based on a September 30, 2015 measurement date, the City recognized pension expense of $39,370 relating to the Plan. In addition, the City reported a deferred outflows of resources and deferred inflows of resources related to the Plan from the following sources:
Deferred Outflows Deferred InflowsDescription of Resources of Resources
Net unexpected investment income 136,276$ --$
Demographic experience -- 9,321
Assumption changes -- 64,350
Total 136,276$ 73,671$
The amounts reported as deferred inflows and outflows of resources above related to the pension will be recognized in pension expense as follows:
Fiscal Year Ending September 30, Amount2017 16,632$ 2018 16,632 2019 16,633 2020 35,395 2021 (12,746)
Thereafter (9,941)
Total 62,605$
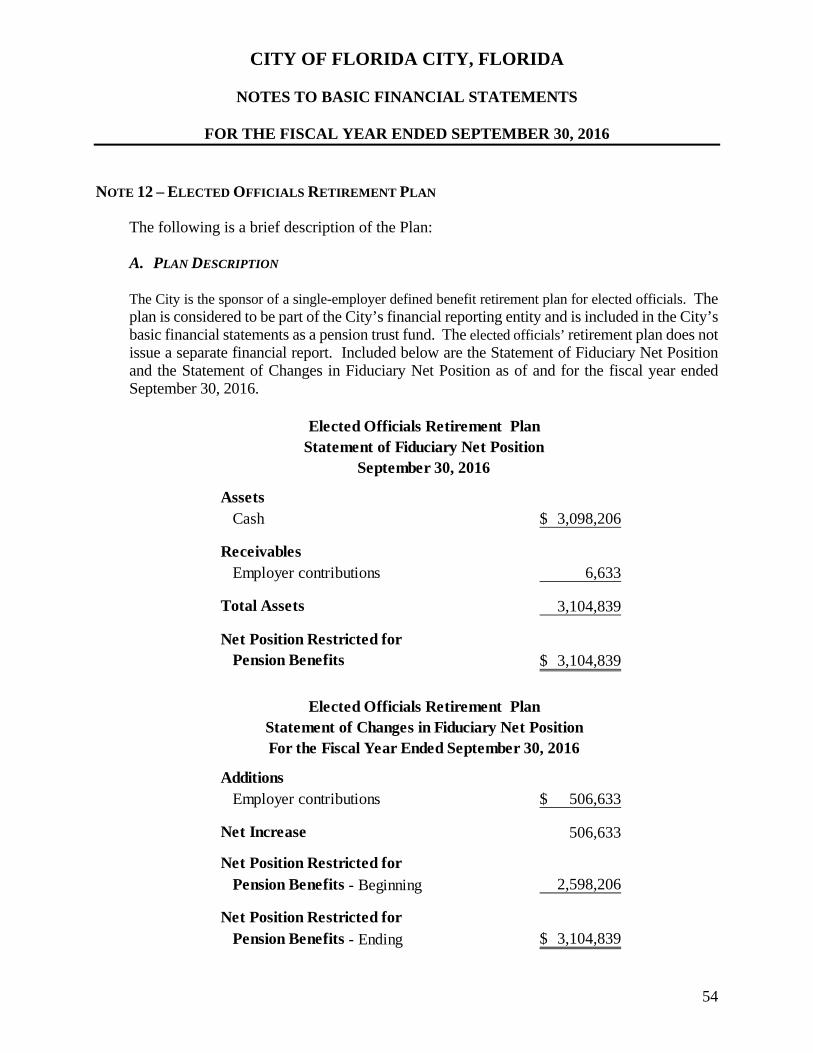
CITY OF FLORIDA CITY, FLORIDA
NOTES TO BASIC FINANCIAL STATEMENTS
FOR THE FISCAL YEAR ENDED SEPTEMBER 30, 2016
54
NOTE 12 – ELECTED OFFICIALS RETIREMENT PLAN The following is a brief description of the Plan: A. PLAN DESCRIPTION The City is the sponsor of a single-employer defined benefit retirement plan for elected officials. The plan is considered to be part of the City’s financial reporting entity and is included in the City’s basic financial statements as a pension trust fund. The elected officials’ retirement plan does not issue a separate financial report. Included below are the Statement of Fiduciary Net Position and the Statement of Changes in Fiduciary Net Position as of and for the fiscal year ended September 30, 2016.
AssetsCash 3,098,206$
ReceivablesEmployer contributions 6,633
Total Assets 3,104,839
Net Position Restricted for Pension Benefits 3,104,839$
Elected Officials Retirement PlanStatement of Fiduciary Net Position
September 30, 2016
Additions Employer contributions 506,633$
Net Increase 506,633
Net Position Restricted forPension Benefits - Beginning 2,598,206
Net Position Restricted forPension Benefits - Ending 3,104,839$
For the Fiscal Year Ended September 30, 2016
Elected Officials Retirement PlanStatement of Changes in Fiduciary Net Position

CITY OF FLORIDA CITY, FLORIDA
NOTES TO BASIC FINANCIAL STATEMENTS
FOR THE FISCAL YEAR ENDED SEPTEMBER 30, 2016
55
NOTE 12 – ELECTED OFFICIALS RETIREMENT PLAN (CONTINUED) A. PLAN DESCRIPTION (CONTINUED) At October 1, 2014, the date of the most recent actuarial valuation, membership in the elected officials’ retirement plan consisted of the following:
Inactive plan members or beneficiaries currently receiving benefits 2 Active plan members 5
7
Effective October 1, 2009, the Elected Officials Retirement Plan was established under Ordinance 05-09. The Board of Trustees serve as the trustees of the plan. Any person who was elected in a general or special election to serve as Mayor or as a City Commissioner is eligible to participate in the Plan. City Commissioner Benefits City Commissioners who retire at or after age 55 are entitled to a normal retirement benefit of 48% of the average annual compensation paid during the highest three years of service. For any service beyond 12 years, the pension benefit is increased by four percent of the average annual compensation for each and every year up to a maximum of 20 years of service and pension benefit equal to 80 percent of the average annual compensation. Benefits vest after 12 consecutive years of service. Mayor Benefits Mayors who retire at or after age 55 are entitled to a normal retirement benefit of 40% of the average annual compensation paid during the highest three years of service. For any service beyond 10 years, the pension benefit is increased by four percent of the average annual compensation for each and every year up to a maximum of 20 years of service and pension benefit equal to 80 percent of the average annual compensation. Benefits vest after 10 consecutive years of service.
B. CONTRIBUTIONS AND FUNDING POLICY Active members are not required to contribute into the Plan. The City is required to make contributions at actuarially determined amounts; during the fiscal year ending September 30, 2016, the City contributed $500,000 which represents an average contribution rate of 220.87%. The minimum contribution consists of the normal cost plus the amortization of the components of the unfunded actuarial accrued liability, which should provide sufficient resources to pay pension benefits when due. The annual required contributions for the Plan for the current year were determined as part of the October 1, 2014 actuarial valuation individual entry-age actuarial cost method.

CITY OF FLORIDA CITY, FLORIDA
NOTES TO BASIC FINANCIAL STATEMENTS
FOR THE FISCAL YEAR ENDED SEPTEMBER 30, 2016
56
NOTE 12 – ELECTED OFFICIALS RETIREMENT PLAN (CONTINUED) C. ACCOUNTING POLICIES The Plan follows the accrual basis of accounting. Contributions are recorded when paid or when the City has made the commitment to contribute to the Plan. Purchases and sales are recorded on the trade-date basis. Benefits and refunds are recognized when due and payable in accordance with the terms of the Plan. Currently, pension benefits and administrative costs are being paid out of the City’s general fund. D. NET PENSION LIABILITY OF THE CITY As of September 30, 2016, the City reported the following net pension liability which was measured as of September 30, 2015 (measurement date in accordance with GASB Statement No. 68). In addition, in accordance with GASB Statement No. 67, information as of September 30, 2016 has been disclosed:
2016 2015Total pension liability 4,278,027$ 4,002,763$
Plan fiduciary net position (3,098,206) (2,598,206)
Net Pension Liability 1,179,821$ 1,404,557$
Plan fiduciary net position as a percentage of the total pension liability 72.42% 64.91%
September 30,
Changes in the Net Pension Liability
Total Plan Fiduciary Net PensionPension Net Liability
Balances at September 30, 2014 3,742,691$ (2,215,356)$ 1,527,335$
Changes for the year: Service cost 143,487 -- 143,487 Expected interest growth 116,585 -- 116,585 Unexpected investment income -- (59) (59)
Contributions - employer -- (382,791) (382,791)
Net changes 260,072 (382,850) (122,778)
Balances at September 30, 2015 4,002,763$ (2,598,206)$ 1,404,557$
Increase (Decrease)

CITY OF FLORIDA CITY, FLORIDA
NOTES TO BASIC FINANCIAL STATEMENTS
FOR THE FISCAL YEAR ENDED SEPTEMBER 30, 2016
57
NOTE 12 – ELECTED OFFICIALS RETIREMENT PLAN (CONTINUED) D. NET PENSION LIABILITY OF THE CITY (CONTINUED) Significant Actuarial Assumptions The total pension liability of the City was determined by an actuarial valuation using the following actuarial assumptions as of September 30, 2016 and 2015:
Actuarial valuation October 1, 2014Interest rates:
Single discount rate: 3.00%Inflation rate: 3.00%
Discount Rate and Long-Term Expected Rate of Return The assets related to the Plan are held in a money market account until a formal investment policy is created for the Plan. As such, a single discount rate of 3.00% was used to measure the total pension liability. The single discount rate was based on the expected rate of return on pension plan investments of 3.00%. The projection of cash flows used to determine this single discount rate assumed that employer contributions will be made equal to the total actuarially determined contribution rates. Based on these assumptions, the pension plan’s fiduciary net position was projected to be available to make all projected future benefit payments of current plan members. Therefore, the long-term expected rate of return on pension plan investments (3.00%) was applied to all periods of projected benefit payments to determine the total pension liability. Sensitivity of the Net Pension Liability to Changes in the Discount Rate The following presents the net pension liability of the City, calculated using the discount rate of 3.00 percent as of September 30, 2016 and 2015, as well as what the City's net pension liability would be if it were calculated using a discount rate that is 1-percentage-point lower or 1-percentage-point higher than the current rate:
As of September 30, 2016:1% Current 1%
Decrease Discount Increase(2.00%) Rate (3.00%) (4.00%)
Net Pension Liability 1,719,212$ 1,179,821$ 741,353$
As of September 30, 2015:1% Current 1%
Decrease Discount Increase(2.00%) Rate (3.00%) (4.00%)
Net Pension Liability 1,905,812$ 1,404,557$ 988,288$

CITY OF FLORIDA CITY, FLORIDA
NOTES TO BASIC FINANCIAL STATEMENTS
FOR THE FISCAL YEAR ENDED SEPTEMBER 30, 2016
58
NOTE 12 – ELECTED OFFICIALS RETIREMENT PLAN (CONTINUED) D. NET PENSION LIABILITY OF THE CITY (CONTINUED) Pension Expense, Deferred Outflows of Resources and Deferred Inflows of Resources related to the Pension For the year ended September 30, 2016, based on a September 30, 2015 measurement date, the City recognized pension expense of $202,298 relating to the Plan. In addition, the City reported deferred outflows of resources related to the Plan from the following sources:
Deferred OutflowsDescription of Resources
Net unexpected investment income 57,715$
Employer contributions subsequent to the measurement date 500,000
Total 557,715$
The deferred outflows of resources related to pensions, totaling $500,000, resulting from City contributions subsequent to the measurement date, will be recognized as a reduction of the net pension liability in the fiscal year ended September 30, 2017. The other amount reported as deferred outflows of resources related to pensions will be recognized in pension expense as follows:
Fiscal Year Ending September 30, Amount2017 14,429$ 2018 14,429 2019 14,429 2020 14,428
Total 57,715$
Payable to the Pension Plan At September 30, 2016, the City reported a payable of $6,633 for the outstanding amount of contributions to the pension plan required for the year ended September 30, 2016.

CITY OF FLORIDA CITY, FLORIDA
NOTES TO BASIC FINANCIAL STATEMENTS
FOR THE FISCAL YEAR ENDED SEPTEMBER 30, 2016
59
NOTE 13 – COST-SHARING DEFINED BENEFIT PLANS
Effective May 1, 2008, the City of Florida City commenced participation in the Florida Retirement System (FRS), a cost-sharing multiple employer Public Employee Retirement System (PERS). There are two defined benefit plans as part of the Florida Retirement System. The FRS is a cost-sharing, multiple-employer defined benefit pension plan with a Deferred Retirement Option Program (DROP) for eligible employees. An additional plan is also available to provide a defined contribution plan alternative to the defined benefit plan for FRS members. This integrated defined contribution pension plan is the FRS Investment Plan. The Retiree Health Insurance Subsidy Program (“HIS”) is a cost-sharing, multiple-employer defined benefit pension plan The FRS and HIS were created by the Florida Legislature and are administered by the State of Florida. Essentially all regular employees of the City are eligible to enroll as members of the State- administered FRS. Provisions relating to the FRS are established by Chapters 121 and 122, Florida Statutes; Chapter 112, Part IV, Florida Statutes; Chapter 238, Florida Statutes; and FRS Rules, Chapter 60S, Florida Administrative Code; wherein eligibility, contributions, and benefits are defined and described in detail. Such provisions may be amended at any time by further action from the Florida Legislature.
The FRS is a single retirement system administered by the Florida Department of Management Services, Division of Retirement, and consists of the two cost-sharing, multiple-employer defined benefit plans and other nonintegrated programs. A comprehensive annual financial report of the FRS, which includes its financial statements, required supplementary information, actuarial report, and other relevant information, is available from the Florida Department of Management Services’ website:
(http://www.dms.myflorida.com/workforce_operations/retirement/publications). A. PLAN DESCRIPTION FRS Pension Plan The FRS Pension Plan (Plan) is a cost-sharing multiple-employer defined benefit pension plan, with a Deferred Retirement Option Program (DROP) for eligible employees. The general classes of membership are as follows: Regular Class – Members of the FRS who do not qualify for membership in the other classes. Elected County Officers Class – Members who hold specified elective offices in local government. Senior Management Service Class (SMSC) – Members in senior management level positions.

CITY OF FLORIDA CITY, FLORIDA
NOTES TO BASIC FINANCIAL STATEMENTS
FOR THE FISCAL YEAR ENDED SEPTEMBER 30, 2016
60
NOTE 13 – COST-SHARING DEFINED BENEFIT PLANS A. PLAN DESCRIPTION (CONTINUED) FRS Pension Plan (continued) Special Risk Class – Members who are employed as law enforcement officers and meet the criteria to qualify for this class. Employees enrolled in the Plan prior to July 1, 2011, vest at six years of creditable service and employees enrolled in the Plan on or after July 1, 2011, vest at eight years of creditable service. All vested members, enrolled prior to July 1, 2011, are eligible for normal retirement benefits at age 62 or at any age after 30 years of service (except for members classified as special risk who are eligible for normal retirement benefits at age 55 or at any age after 25 years of service). All members enrolled in the Plan on or after July 1, 2011, once vested, are eligible for normal retirement benefits at age 65 or any time after 33 years of creditable service (except for members classified as special risk who are eligible for normal retirement benefits at age 60 or at any age after 30 years of service). Members of the Plan may include up to 4 years of credit for military service toward creditable service. The Plan also includes an early retirement provision; however, there is a benefit reduction for each year a member retires before his or her normal retirement date. The Plan provides retirement, disability, death benefits, and annual cost-of-living adjustments to eligible participants. DROP, subject to provisions of Section 121.091, Florida Statutes, permits employees eligible for normal retirement under the Plan to defer receipt of monthly benefit payments while continuing employment with an FRS employer. An employee may participate in DROP for a period not to exceed 60 months after electing to participate. During the period of DROP participation, deferred monthly benefits are held in the FRS Trust Fund and accrue interest. The net pension liability does not include amounts for DROP participants, as these members are considered retired and are not accruing additional pension benefits. HIS Plan The Retiree Health Insurance Subsidy Program (HIS Plan) is a cost-sharing multiple-employer defined benefit pension plan established under Section 112.363, Florida Statutes, and may be amended by the Florida Legislature at any time. The benefit is a monthly payment to assist retirees of the State-administered retirement systems in paying their health insurance costs and is administered by the Division of Retirement within the Florida Department of Management Services.

CITY OF FLORIDA CITY, FLORIDA
NOTES TO BASIC FINANCIAL STATEMENTS
FOR THE FISCAL YEAR ENDED SEPTEMBER 30, 2016
61
NOTE 13 – COST-SHARING DEFINED BENEFIT PLANS B. BENEFITS PROVIDED FRS Pension Plan Benefits under the Plan are computed on the basis of age and/or years of service, average final compensation, and service credit. Credit for each year of service is expressed as a percentage of the average final compensation. For members initially enrolled before July 1, 2011, the average final compensation is the average of the five highest fiscal years’ earnings; for members initially enrolled on or after July 1, 2011, the average final compensation is the average of the eight highest fiscal years’ earnings. The total percentage value of the benefit received is determined by calculating the total value of all service, which is based on the retirement class to which the member belonged when the service credit was earned. Members are eligible for in-line-of-duty or regular disability and survivors’ benefits. The following chart shows the percentage value for each year of service credit earned: Regular Class members initially enrolled before July 1, 2011: Retirement up to age 62 or up to 30 years of service 1.60% Retirement at age 63 or with 31 years of service 1.63% Retirement at age 64 or with 32 years of service 1.65% Retirement at age 65 or with 33 or more years of service 1.68% Regular Class members initially enrolled on or after July 1, 2011: Retirement up to age 65 or up to 33 years of service 1.60% Retirement at age 66 or with 34 years of service 1.63% Retirement at age 67 or with 35 years of service 1.65% Retirement at age 68 or with 36 or more years of service 1.68% Elected County Officers: 3.00% Senior Management Service Class: 2.00% Special Risk Regular Class: 3.00% As provided in Section 121.101, Florida Statutes, if the member is initially enrolled in the FRS before July 1, 2011, and all service credit was accrued before July 1, 2011, the annual cost-of-living adjustment is 3 percent per year. If the member is initially enrolled before July 1, 2011, and has service credit on or after July 1, 2011, there is an individually calculated cost-of-living adjustment. The annual cost-of-living adjustment is a proportion of 3 percent determined by dividing the sum of the pre-October 2011 service credit by the total service credit at retirement multiplied by 3 percent. Plan members initially enrolled on or after July 1, 2011, will not have a cost-of-living adjustment after retirement.

CITY OF FLORIDA CITY, FLORIDA
NOTES TO BASIC FINANCIAL STATEMENTS
FOR THE FISCAL YEAR ENDED SEPTEMBER 30, 2016
62
NOTE 13 – COST-SHARING DEFINED BENEFIT PLANS (CONTINUED) B. BENEFITS PROVIDED (CONTINUED) HIS Plan For the fiscal year ended September 30, 2016 eligible retirees and beneficiaries received a monthly HIS payment of $5 for each year of creditable service completed at the time of retirement, with a minimum HIS payment of $30 and a maximum HIS payment of $150 per month, pursuant to Section 112.363, Florida Statutes. To be eligible to receive a HIS Plan benefit, a retiree under a State-administered retirement system must provide proof of health insurance coverage, which may include Medicare. C. CONTRIBUTIONS FRS Pension Plan The Florida Legislature establishes contribution rates for participating employers and employees. Employees are required to contribute 3% of gross salary. Employer contribution is based on class. The contribution rate for FRS Regular, Special Risk (Police Officers) and Drop was 5.56%, 20.34% and 11.22% respectively, for the period from October 1, 2015 through June 30, 2016 and was 5.8%, 20.85% and 11.33% respectively, from July 1, 2016 through September 30, 2016. The City’s contributions for FRS totaled $617,469 and employee contributions totaled $144,752 for the fiscal year ended September 30, 2016. HIS Plan The HIS Plan is funded by required contributions from FRS participating employers as set by the Florida Legislature. Employer contributions are a percentage of gross compensation for all active FRS members. For the fiscal year ended September 30, 2016, the HIS contribution rate was 1.66 percent, respectively. The City contributed 100 percent of its statutorily required contributions for the current year and preceding three years. The HIS Plan contributions are deposited in a separate trust fund from which payments are authorized. HIS Plan benefits are not guaranteed and are subject to annual legislative appropriation. In the event the legislative appropriation or available funds fail to provide full subsidy benefits to all participants, benefits may be reduced or canceled. The City’s contributions to the HIS Plan totaled $80,135 for the fiscal year ended September 30, 2016.

CITY OF FLORIDA CITY, FLORIDA
NOTES TO BASIC FINANCIAL STATEMENTS
FOR THE FISCAL YEAR ENDED SEPTEMBER 30, 2016
63
NOTE 13 – COST-SHARING DEFINED BENEFIT PLANS (CONTINUED) D. PENSION LIABILITIES, PENSION EXPENSE, AND DEFERRED OUTFLOWS OF RESOURCES
AND DEFERRED INFLOWS OF RESOURCES RELATED TO PENSIONS At September 30, 2016, the City reported liabilities of $5,626,880 for its proportionate share of the FRS net pension liability and $1,807,716 for the HIS net pension liability. The net pension liability was measured as of June 30, 2016, and the total pension liability used to calculate the net pension liability was determined by an actuarial valuation as of July 1, 2016. The City’s proportionate share of the net pension liability was based on the City’s fiscal year 2016 contributions relative to the fiscal year 2016 contributions of all participating members. At June 30, 2016, the City’s proportionate share was 0.02228 percent for the FRS plan and 0.01551 percent for the HIS plan, which was a decrease of 0.00192 percent and an increase of 0.0001 percent respectively, from the proportionate share measured as of June 30, 2015. For the fiscal year ended September 30, 2016, the City recognized pension expense of for the FRS plan and the HIS plan in the amount of $895,039 and $148,799, respectively. In addition, the City reported, in the government-wide financial statements, deferred outflows of resources and deferred inflows of resources related to both plans from the following sources:
FRS HIS Total
Differences between expected and actual experience 430,837$ --$ 430,837$
Assumption changes 340,409 283,677 624,086 Net difference between projected and actual earnings on pension plan investments 1,454,480 914 1,455,394 Changes in proportion and differences between City contributions and proportionate share of contributions 322,399 8,413 330,812 Employer contributions subsequent to the measurement date 168,231 21,539 189,770
Total Deferred Outflows of Resources 2,716,356$ 314,543$ 3,030,899$
FRS HIS Total
Differences between expected and actual experience 52,390$ 4,117$ 56,507$ Changes in proportion and differences between City contributions and proportionate share of contributions 251,342 12,402 263,744
Total Deferred Inflows of Resources 303,732$ 16,519$ 320,251$
Deferred Inflows of Resources
Deferred Outflows of Resources

CITY OF FLORIDA CITY, FLORIDA
NOTES TO BASIC FINANCIAL STATEMENTS
FOR THE FISCAL YEAR ENDED SEPTEMBER 30, 2016
64
NOTE 13 – COST-SHARING DEFINED BENEFIT PLANS (CONTINUED) D. PENSION LIABILITIES, PENSION EXPENSE, AND DEFERRED OUTFLOWS OF RESOURCES
AND DEFERRED INFLOWS OF RESOURCES RELATED TO PENSIONS (CONTINUED) The deferred outflows of resources related to pensions, totaling $189,770, resulting from City contributions subsequent to the measurement date, will be recognized as a reduction of the net pension liability in the fiscal year ended September 30, 2017. Other amounts reported as deferred outflows of resources and deferred inflows of resources related to pensions will be recognized in pension expense as follows:
Fiscal Year Ending September 30 FRS HIS Total
2017 287,304$ 48,640$ 335,944$ 2018 287,304 48,640 335,944 2019 854,350 48,466 902,816 2020 634,365 48,383 682,748 2021 136,136 44,007 180,143
Thereafter 44,934 38,349 83,283
Total 2,244,393$ 276,485$ 2,520,878$
Employer Share of Deferred Outflows / (Inflows)
E. ACTUARIAL ASSUMPTIONS Actuarial assumptions for both cost-sharing defined benefit plans are reviewed annually by the Florida Retirement System Actuarial Assumptions Conference. The FRS plan has a valuation performed annually. The HIS Program has a valuation performed biennially that is updated for GASB reporting in the year a valuation is not performed. The total pension liability was determined using the following actuarial assumptions, applied to all periods included in the measurement:
FRS HIS
Experience StudyActuarial Cost MethodInvestment rate of return 7.60% 2.85%Projected salary increases 3.25% 3.25%Inflation 2.60% 2.60%
Generational RP-2000 with Projection Scale BB Tables Mortality Table7/1/08-6/30/13
Individual Entry Age Normal

CITY OF FLORIDA CITY, FLORIDA
NOTES TO BASIC FINANCIAL STATEMENTS
FOR THE FISCAL YEAR ENDED SEPTEMBER 30, 2016
65
NOTE 13 – COST-SHARING DEFINED BENEFIT PLANS (CONTINUED) F. LONG-TERM EXPECTED RATE OF RETURN FRS Pension Plan The long-term expected rate of return on the Plan investments was not based on historical returns, but instead is based on a forward-looking capital market economic model. The allocation policy’s description of each asset class was used to map the target allocation to the asset classes shown below. Each asset class assumption is based on a consistent set of underlying assumptions, and includes an adjustment for the inflation assumption. The target allocation and best estimates of arithmetic and geometric real rates of return for each major asset class are summarized in the following table:
CompoundAnnual Annual
Target Arithmetic (Geometric) Standard
Asset Class Allocation (1)
Return Return DeviationCash 1% 3.0% 3.0% 1.7%Fixed income 18% 4.7% 4.6% 4.6%Global equity 53% 8.1% 6.8% 17.2%Real estate (property) 10% 6.4% 5.8% 12.0%Private equity 6% 11.5% 7.8% 30.0%Strategic investments 12% 6.1% 5.6% 11.1%Total 100%
Assumed inflation-Mean 2.6% 1.9%
(1) As outlined in the Plan's investment policy G. DISCOUNT RATE The discount rate used to measure the total pension liability was 7.60% for the FRS plan. The fiduciary net position was projected to be available to make all projected future benefit payments of current active and inactive employees. Therefore, the discount rate for calculating the total pension liability is equal to the long-term expected rate of return. The HIS program uses a pay as you go funding structure, so therefore, the depletion date is considered to be immediate and the single equivalent discount rate is equal to the municipal bond rate. The municipal bond rate of 2.85% was used to determine the total pension liability for the program. The Bond Buyer General Obligation 20-Bond Municipal Bond Index was adopted as the applicable municipal bond index.

CITY OF FLORIDA CITY, FLORIDA
NOTES TO BASIC FINANCIAL STATEMENTS
FOR THE FISCAL YEAR ENDED SEPTEMBER 30, 2016
66
NOTE 13 – COST-SHARING DEFINED BENEFIT PLANS (CONTINUED) H. SENSITIVITY OF THE CITY’S PROPORTIONATE SHARE OF THE NET POSITION LIABILITY TO
CHANGES IN THE DISCOUNT RATE. The following table presents the sensitivity of the City’s proportionate share of the net pension liability to changes in the discount rate. The sensitivity analysis shows the impact to the City’s proportionate share of the net pension liability if the discount rate was 1.00% lower or 1.00% higher than the current discount rate at June 30, 2016.
Current1% Discount 1%
Pension Plan Decrease Rate IncreaseFRS 10,359,466$ 5,626,880$ 1,687,626$ HIS 2,073,961$ 1,807,716$ 1,586,830$
City's Proportionate Share of the Net Pension Liability
I. PENSION PLAN FIDUCIARY NET POSITION Detailed information about the fiduciary net position of both benefit plans are available in the separately issued FRS Pension Plan and Other State Administered Systems Comprehensive Annual Financial Report. J. FRS – INVESTMENT PLAN The City contributes to the FRS defined contribution Investment Plan (Investment Plan). The Investment Plan is administered by the State Board of Administration (SBA), and is reported in the SBA’s annual financial statements and in the State of Florida Comprehensive Annual Financial Report. As provided in Section 121.4501, Florida Statutes, eligible FRS members may elect to participate in the Investment Plan in lieu of the FRS defined benefit plan. City employees participating in the DROP are not eligible to participate in the Investment Plan. Employer and employee contributions, including amounts contributed to individual member’s accounts, are defined by law, but the ultimate benefit depends in part on the performance of investment funds. Benefit terms, including contribution requirements, for the Investment Plan are established and may be amended by the Florida Legislature. The Investment Plan is funded with the same employer and employee contribution rates that are based on salary and membership class (Regular Class, Elected County Officers, etc.), as the FRS Pension Plan. Contributions are directed to individual member accounts, and the individual members allocate contributions and account balances among various approved investment choices. Allocations to the investment member’s accounts, as established by Section 121.72, Florida Statutes, are based on a percentage of gross compensation, by class.

CITY OF FLORIDA CITY, FLORIDA
NOTES TO BASIC FINANCIAL STATEMENTS
FOR THE FISCAL YEAR ENDED SEPTEMBER 30, 2016
67
NOTE 13 – COST-SHARING DEFINED BENEFIT PLANS (CONTINUED) J. FRS – INVESTMENT PLAN (CONTINUED) For all membership classes, employees are immediately vested in their own contributions and are vested after one year of service for employer contributions and investment earnings. If an accumulated benefit obligation for service credit originally earned under the FRS Pension Plan is transferred to the Investment Plan, the member must have the years of service required for FRS Pension Plan vesting (including the service credit represented by the transferred funds) to be vested for these funds and the earnings on the funds. Non-vested employer contributions are placed in a suspense account for up to five years. If the employee returns to FRS-covered employment within the five-year period, the employee will regain control over their account. If the employee does not return within the five-year period, the employee will forfeit the accumulated account balance. Costs of administering the Investment Plan, including the FRS Financial Guidance Program, are funded through an employer contribution of 0.06 percent of payroll and by forfeited benefits of Investment Plan members. For the fiscal year ended September 30, 2016, the information for the amount of forfeitures was unavailable from the SBA; however, management believes that these amounts, if any, would be immaterial to the City. After termination and applying to receive benefits, the member may rollover vested funds to another qualified plan, structure a periodic payment under the Investment Plan, receive a lump-sum distribution, leave the funds invested for future distribution, or any combination of these options. Disability coverage is provided; the member may either transfer the account balance to the FRS Pension Plan when approved for disability retirement to receive guaranteed lifetime monthly benefits under the FRS Pension Plan, or remain in the Investment Plan and rely upon that account balance for retirement income. The City’s Investment Plan pension contributions totaled $110,524 for the fiscal year ended September 30, 2016.

CITY OF FLORIDA CITY, FLORIDA
NOTES TO BASIC FINANCIAL STATEMENTS
FOR THE FISCAL YEAR ENDED SEPTEMBER 30, 2016
68
NOTE 14 – PENSION SUMMARY
The following summarizes the total net pension liability, net pension asset and other amounts related to pensions for the City as of the indicated measurement date:
Net Net Deferred Deferred Pension
Measurement Pension Pension Outflows Inflows Expense
Date Liability Asset of Resources of Resources (Income)
Police Officers' Substitute Pension Trust Fund 9/30/2015 --$ 153,036$ 136,276$ 73,671$ 39,870$
Elected Officials Retirement Plan 9/30/2015 1,404,557 -- 557,715 -- 202,298
FRS (cost-sharing PERS) 6/30/2016 5,626,880 -- 2,716,356 303,732 895,039 HIS (cost-sharing PERS) 6/30/2016 1,807,716 -- 314,543 16,519 148,799
8,839,153$ 153,036$ 3,724,890$ 393,922$ 1,286,006$
NOTE 15 – OTHER POST-EMPLOYMENT BENEFITS Accounting and Financial Reporting by Employers for Post-employment Benefits Other Than Pensions (OPEB) standard does not require funding of OPEB expense, but any difference between the annual required contribution (ARC) and the amount funded during the year is required to be recorded in the employer’s statement of net position as an increase (or decrease) in the OPEB obligation. Recognition of the liability accumulated from prior years will be phased in over 30 years, commencing with the 2013 liability. PLAN DESCRIPTION The City provides an optional single employer defined benefit post-employment healthcare plan to eligible individuals. The plan allows its employees and their beneficiaries, at their own cost, to continue to obtain health, dental and other insurance benefits upon retirement. The benefits of the plan conform to Florida Statutes, which are the legal authority for the plan. The plan has no assets and does not issue a separate financial report. FUNDING POLICY AND ANNUAL OPEB COST The City does not directly make a contribution to the plan on behalf of retirees. Retirees and their beneficiaries pay the same group rates as are charged to the City for active employees by its healthcare provider. However, the City’s actuaries, in their actuarial valuation dated October 1, 2015, calculate an offset to the cost of these benefits as an employer contribution, based upon an implicit rate subsidy. This offset equals the total age-adjusted costs paid by the City or its active employees for coverage of the retirees and their dependents for the year net of the retiree’s own payments for the year.

CITY OF FLORIDA CITY, FLORIDA
NOTES TO BASIC FINANCIAL STATEMENTS
FOR THE FISCAL YEAR ENDED SEPTEMBER 30, 2016
69
NOTE 15 – OTHER POST-EMPLOYMENT BENEFITS (CONTINUED) FUNDING POLICY AND ANNUAL OPEB COST (CONTINUED) The City’s annual other postemployment benefit (OPEB) cost is calculated based on the annual required contribution of the employer (ARC). The City has elected to calculate the ARC and related information using the alternative measurement method permitted by GASB Statement No. 45 for employers in plans with fewer than one hundred total plan members. The ARC represents a level of funding that, if paid on an ongoing basis, is projected to cover normal cost each year and to amortize any unfunded actuarial liabilities (or funding excess) over a period not to exceed thirty years. The annual OPEB cost for the City for the current year and the related information is as follows:
Required contribution rates:Employer Pay-as-you-goPlan members N/A
Annual required contribution 94,257$ Interest on normal cost 20,635 Adjustment to the annual required contribution (24,566)
Annual OPEB cost 90,326 Employer contribution (13,091)
Increase in net OPEB obligation 77,235 Net OPEB obligation - beginning of year 687,843
Net OPEB Obligation - End of Year 765,078$
The annual OPEB cost, the percentage of annual OPEB cost contributed to the plan and the net OPEB obligation were as follows:
Percentage NetFiscal Year Ended OPEB of OPEB Cost OPEB
September 30, Cost Contributed Obligation2016 90,326$ 14% 765,078$ 2015 99,133 24% 687,843 2014 94,550 23% 612,193

CITY OF FLORIDA CITY, FLORIDA
NOTES TO BASIC FINANCIAL STATEMENTS
FOR THE FISCAL YEAR ENDED SEPTEMBER 30, 2016
70
NOTE 15 – OTHER POST-EMPLOYMENT BENEFITS (CONTINUED) FUNDED STATUS AND FUNDING PROGRESS
Actuarial UAAL as a
Actuarial Accrued Unfunded Percentage
Actuarial Value of Liability AAL Funded Covered of Covered
Valuation Assets (AAL) (UAAL) Ratio Payroll Payroll
Date (a) (b) (b-a) (ab) (c) ((b-a)c)
October 1, 2015 --$ 658,807$ 658,807$ 0.0% 4,564,353$ 14.4%
The projection of future benefit payments for an ongoing plan involves estimates of the value of reported amounts and assumptions about the probability of occurrence of events far into the future. Examples include assumptions about future employment, mortality, and the healthcare cost trend. Amounts determined regarding the funded status of the plan and the annual required contributions of the employer are subject to continual revision as actual results are compared with past expectations and new estimates are made about the future.
The schedule of funding progress, presented as required supplementary information following the notes to the financial statements, presents multiyear trend information about whether the actuarial value of plan assets is increasing or decreasing over time relative to the actuarial accrued liabilities for benefits. METHODS AND ASSUMPTIONS Projections of benefits for financial reporting purposes are based on the substantive plan (the plan as understood by the employer and plan members) and include the types of benefits provided at the time of each valuation and the historical pattern of sharing of benefit costs between the employer and plan members to that point. The methods and assumptions used include techniques that are designed to reduce the effects of short-term volatility in actuarial accrued liabilities and the actuarial value of assets, consistent with the long-term perspective of the calculations.

CITY OF FLORIDA CITY, FLORIDA
NOTES TO BASIC FINANCIAL STATEMENTS
FOR THE FISCAL YEAR ENDED SEPTEMBER 30, 2016
71
NOTE 15 – OTHER POST-EMPLOYMENT BENEFITS (CONTINUED) METHODS AND ASSUMPTIONS (CONTINUED)
Contribution rate 0.0%Actuarial valuation date October 1, 2015Actuarial cost method Entry age normalAmortization method Level percentage, closedRemaining amortization 28 yearsAsset valuation method UnfundedActuarial assumptions:
Investment rate of return* 3.0%Payroll growth assumptions 3.0%Initial trend rate 7.5%Healthcare trends 7.5%
* Includes inflation at 2.8%
As authorized by GASB 45, The Alternative Measurement Method allows the employer to use simplifications of certain assumptions in measuring actuarial accrued liabilities and the ARC. The following simplifying assumptions were made: Retirement Age for Active Employees – Retirement age for active employees have been determined as the earliest age eligible for normal retirement under Florida Retirement System. If the employees had already attained their normal retirement age as of the time when this calculation was performed, they were assumed to retire in the next year. Active Member Marital Status – Assumption of marital status for active employees has been incorporated in the acceptance probability for spousal coverage. Using this approach, the percentage of future retired plan members taking spousal coverage was assumed at 20%. For active employees, spouses’ genders were assumed to be opposite to the members’ genders and females were assumed 3 years younger than their spouses. Covered spouse data were collected for current retired plan members as of the valuation date, and were assumed to remain unchanged until the assumed death of the spouses. Mortality – Life expectancies were based on the RP2000 Generational Combined Healthy Male and Female mortality tables projected from the year 2000 using Projection Scale AA.

CITY OF FLORIDA CITY, FLORIDA
NOTES TO BASIC FINANCIAL STATEMENTS
FOR THE FISCAL YEAR ENDED SEPTEMBER 30, 2016
72
NOTE 15 – OTHER POST-EMPLOYMENT BENEFITS (CONTINUED) METHODS AND ASSUMPTIONS (CONTINUED) Turnover – Non-group-specific age-based turnover data provided in GASB Statement 45 were used as the basis for assigning active members a probability of remaining employed until the assumed retirement age and for developing an unexpected future working lifetime assumption for purposes of allocating to periods the present value of total benefits to be paid. Health Insurance Premiums – Health insurance premiums for retirees in effect on the fiscal year ending date were used as the basis for calculation of the present value of total benefits to be paid.
NOTE 16 – COMMUNITY REDEVELOPMENT COMMUNITY AGENCY (CRA)
The CRA incurred the following expenditures during the fiscal year ended September 30, 2016:
In 2016, the major project funded by CRA’s Infrastructure Fund was expenditures of $345,844 for the Streetscape Project. In addition, expenditures were incurred for consulting and engineering of approximately $85,232, administrative functions for approximately $98,348, and Community Policing for approximately $300,000.
NOTE 17 – EXCESS OF EXPENDITURES OVER APPROPRIATIONS
The City had excess of expenditures over appropriations in General Government of $172,332, Public Safety of $4,720 and Public Works of $15,480. These overexpenditures were funded by excess revenues over expenditures.

CITY OF FLORIDA CITY, FLORIDA
NOTES TO BASIC FINANCIAL STATEMENTS
FOR THE FISCAL YEAR ENDED SEPTEMBER 30, 2016
73
NOTE 18 – PRIOR PERIOD ADJUSTMENT
During fiscal year September 30, 2016, the City recorded a net pension liability related to the Elected Officials Retirement Plan due to the City’s determination that the plan met the criteria of being administered through a trust or similar arrangement as defined by GASB Statement No. 67 and 68. The City adjusted opening balances to net position as follows:
GovernmentalActivities
Net position, beginning, as previously reported 35,848,498$
Prior period adjustment:Record opening net pension liability using a
measurement date as of September 30, 2014 (1,527,335) Record opening deferred outflow of resources for City
contributions made during fiscal year 2015 382,791 Eliminate prior year net pension obligation 142,975
Total prior period adjustment (1,001,569)
Net Position, Beginning, as Restated 34,846,929$

REQUIRED SUPPLEMENTARY INFORMATION
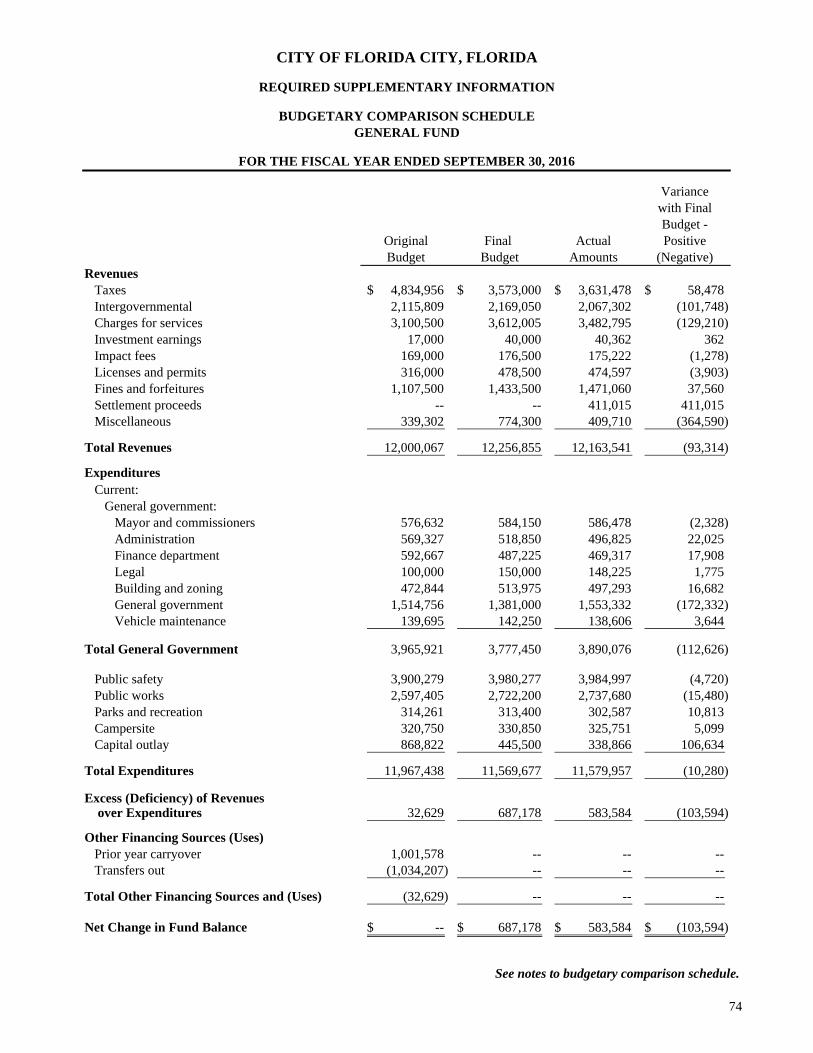
Variancewith FinalBudget -
Original Final Actual PositiveBudget Budget Amounts (Negative)
RevenuesTaxes 4,834,956$ 3,573,000$ 3,631,478$ 58,478$ Intergovernmental 2,115,809 2,169,050 2,067,302 (101,748) Charges for services 3,100,500 3,612,005 3,482,795 (129,210) Investment earnings 17,000 40,000 40,362 362 Impact fees 169,000 176,500 175,222 (1,278) Licenses and permits 316,000 478,500 474,597 (3,903) Fines and forfeitures 1,107,500 1,433,500 1,471,060 37,560 Settlement proceeds -- -- 411,015 411,015 Miscellaneous 339,302 774,300 409,710 (364,590)
Total Revenues 12,000,067 12,256,855 12,163,541 (93,314)
ExpendituresCurrent:
General government:Mayor and commissioners 576,632 584,150 586,478 (2,328) Administration 569,327 518,850 496,825 22,025 Finance department 592,667 487,225 469,317 17,908 Legal 100,000 150,000 148,225 1,775 Building and zoning 472,844 513,975 497,293 16,682 General government 1,514,756 1,381,000 1,553,332 (172,332) Vehicle maintenance 139,695 142,250 138,606 3,644
Total General Government 3,965,921 3,777,450 3,890,076 (112,626)
Public safety 3,900,279 3,980,277 3,984,997 (4,720) Public works 2,597,405 2,722,200 2,737,680 (15,480) Parks and recreation 314,261 313,400 302,587 10,813 Campersite 320,750 330,850 325,751 5,099 Capital outlay 868,822 445,500 338,866 106,634
Total Expenditures 11,967,438 11,569,677 11,579,957 (10,280)
Excess (Deficiency) of Revenues over Expenditures 32,629 687,178 583,584 (103,594)
Other Financing Sources (Uses)Prior year carryover 1,001,578 -- -- -- Transfers out (1,034,207) -- -- --
Total Other Financing Sources and (Uses) (32,629) -- -- --
Net Change in Fund Balance --$ 687,178$ 583,584$ (103,594)$
CITY OF FLORIDA CITY, FLORIDA
BUDGETARY COMPARISON SCHEDULEGENERAL FUND
FOR THE FISCAL YEAR ENDED SEPTEMBER 30, 2016
REQUIRED SUPPLEMENTARY INFORMATION
See notes to budgetary comparison schedule.
74
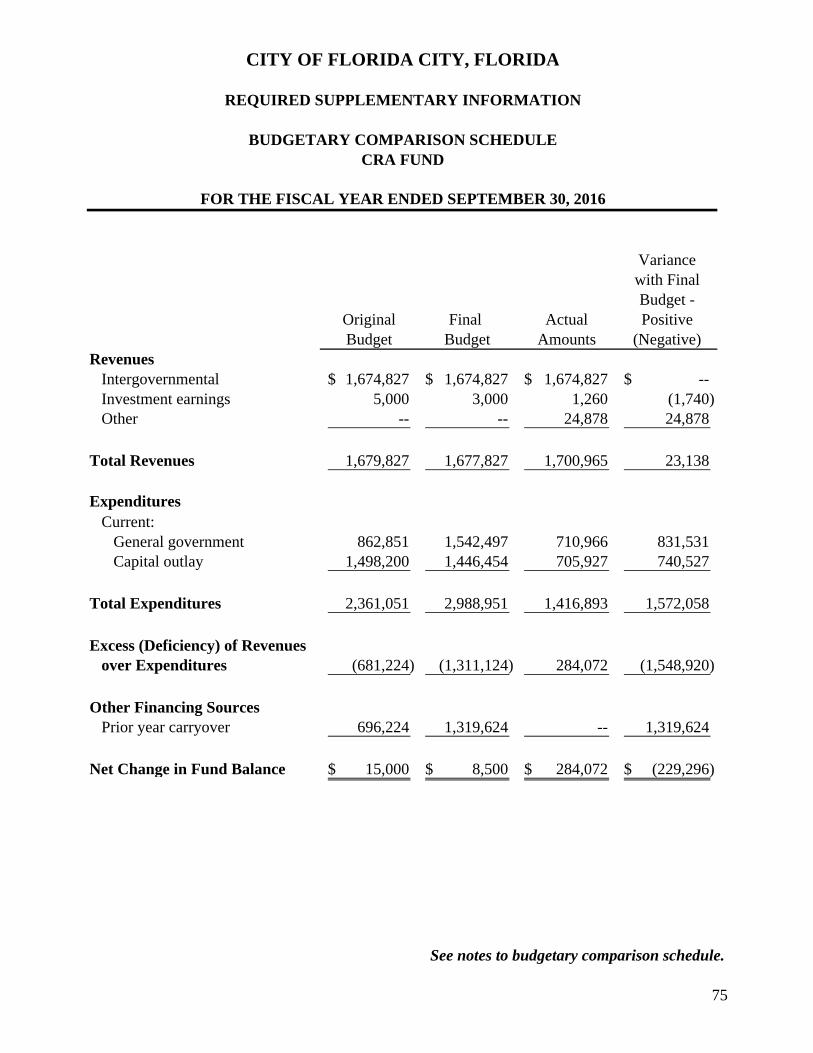
Variancewith FinalBudget -
Original Final Actual PositiveBudget Budget Amounts (Negative)
RevenuesIntergovernmental 1,674,827$ 1,674,827$ 1,674,827$ --$ Investment earnings 5,000 3,000 1,260 (1,740) Other -- -- 24,878 24,878
Total Revenues 1,679,827 1,677,827 1,700,965 23,138
ExpendituresCurrent:
General government 862,851 1,542,497 710,966 831,531 Capital outlay 1,498,200 1,446,454 705,927 740,527
Total Expenditures 2,361,051 2,988,951 1,416,893 1,572,058
Excess (Deficiency) of Revenues over Expenditures (681,224) (1,311,124) 284,072 (1,548,920)
Other Financing Sources Prior year carryover 696,224 1,319,624 -- 1,319,624
Net Change in Fund Balance 15,000$ 8,500$ 284,072$ (229,296)$
FOR THE FISCAL YEAR ENDED SEPTEMBER 30, 2016
CITY OF FLORIDA CITY, FLORIDA
REQUIRED SUPPLEMENTARY INFORMATION
BUDGETARY COMPARISON SCHEDULECRA FUND
See notes to budgetary comparison schedule.
75

CITY OF FLORIDA CITY, FLORIDA
REQUIRED SUPPLEMENTARY INFORMATION
NOTE TO BUDGETARY COMPARISON SCHEDULE
FOR THE FISCAL YEAR ENDED SEPTEMBER 30, 2016
76
NOTE 1 – BUDGETS AND BUDGETARY ACCOUNTING
An annual appropriated budget is adopted on a basis consistent with accounting principles generally accepted in the United States for the general fund and CRA, except for hurricane related expenditures.
The City follows these procedures in establishing the budgetary data reflected in the accompanying financial statements:
a. Management submits to the City Commission a proposed operating budget for the
ensuing fiscal year. The operating budget includes appropriations and the means of financing them with an explanation regarding each expenditure that is not of a routine nature;
b. Public hearings are conducted to obtain taxpayer comments;
c. Prior to October 1st, the budget is legally enacted through passage of a resolution;
d. The City Commission, by motion, may make supplemental appropriations for the year up to the amount of revenue in excess of those estimated appropriations. There were no supplemental appropriations in the City and $627,900 in supplemental appropriations in the CRA for the fiscal year ended September 30, 2016.
e. Formal budgetary integration is employed as a management control device during the year for all funds;
f. Amendments to the budget within a department can be authorized by the Mayor as the City’s Chief administrator. Any amendments outside of a department must be approved by the City Commission. Therefore, the legal level of control is at the department level.
g. Unencumbered appropriations lapse at year end.
h. Budgeted amounts are as originally adopted or as amended. Individual type amendments were not material in relation to the original appropriations.

2016 2015 2014Total Pension Liability
Interest 172,476$ 173,844$ 165,349$ Differences between expected and actual experience -- (10,934) -- Changes of assumptions -- (75,483) -- Benefit payments, including refunds of member contributions (148,230) (101,502) (124,493)
Net Change in Total Pension Liability 24,246 (14,075) 40,856
Total Pension Liability - Beginning 2,909,803 2,923,878 2,883,022
Total Pension Liability - Ending (a) 2,934,049$ 2,909,803$ 2,923,878$
Plan Fiduciary Net PositionContributions - employer --$ --$ 12,172$ Contributions - member -- -- -- Net Investment income 558,769 (47,169) 272,251 Benefit payments, including refunds of member contributions (284,400) (101,502) (99,584) Administrative expense (36,760) (42,938) (36,091)
Net Change in Plan Fiduciary Net Position 237,609 (191,609) 148,748
Plan Fiduciary Net Position - Beginning 3,062,839 3,254,448 3,105,700
Plan Fiduciary Net Position - Ending (b) 3,300,448$ 3,062,839$ 3,254,448$
Net Pension Liability (Asset) - Ending (a) - (b) (366,399)$ (153,036)$ (330,570)$
Plan Fiduciary Net Position as a Percentage of the TotalPension Liability (Asset) 112.49% 105.26% 111.31%
Covered Employee Payroll --$ --$ --$
Net Pension Liability (Asset) as a Percentage of Covered-Employee Payroll N/A N/A N/A
This schedule is presented as required by accounting principles generally accepted in the United States ofAmerica, however, until a full 10-year trend is compiled, information is presented for those years available.
CITY OF FLORIDA CITY, FLORIDA
REQUIRED SUPPLEMENTARY INFORMATION
SCHEDULE OF CHANGES IN THE CITY'S NET PENSION LIABILITY ANDRELATED RATIOS
LAST THREE FISCAL YEARSPOLICE OFFICERS' SUBSTITUTE PENSION TRUST FUND
77

2016 2015 2014Actuarially determined contribution --$ --$ 12,172$
Contributions in relation to the actuarially determined contribution -- -- 12,172
Contribution deficiency (excess) --$ --$ --$
Covered-employee payroll --$ --$ --$
Contributions as a percentage or covered-employee payroll N/A N/A N/A
Notes to Schedule
Valuation date: October 1, 2014
Methods and assumptions used to determine contribution rates:
Actuarial cost method AggregateAmortization method Level percentage, openRemaining amortization period 30 yearsAsset valuation method Market valueInflation 2.75%Salary increases N/AInvestment rate of return 7.0%Retirement age
This schedule is presented as required by accounting principles generally accepted in the United States ofAmerica, however, until a full 10-year trend is compiled, information is presented for those years available.
CITY OF FLORIDA CITY, FLORIDA
REQUIRED SUPPLEMENTARY INFORMATION
SCHEDULE OF CITY CONTRIBUTIONS
LAST THREE FISCAL YEARS
Actuarially determined contribution rates are calculated as of October 1, two years prior to the end of the fiscalyear in which contributions are reported.
Age 55 with at least 10 years of service, or any age with at least 25 years of service.
POLICE OFFICERS' SUBSTITUTE PENSION TRUST FUND
78

2016 2015 2014
Annual money-weighted rate of return, net of investment expense 7.08% -2.48% 7.92%
This schedule is presented as required by accounting principles generally accepted in the UnitedStates of America, however, until a full 10-year trend is compiled, information is presented forthose years available.
CITY OF FLORIDA CITY, FLORIDA
REQUIRED SUPPLEMENTARY INFORMATION
POLICE OFFICERS' SUBSTITUTE PENSION TRUST FUNDLAST THREE FISCAL YEARS
SCHEDULE OF INVESTMENT RETURNS
79

2016 2015Total Pension Liability
Service cost 150,661$ 143,487$ Interest 124,603 116,585
Net Change in Total Pension Liability 275,264 260,072
Total Pension Liability - Beginning 4,002,763 3,742,691
Total Pension Liability - Ending (a) 4,278,027$ 4,002,763$
Plan Fiduciary Net PositionContributions - employer 500,000$ 382,791$ Net Investment income -- 59
Net Change in Plan Fiduciary Net Position 500,000 382,850
Plan Fiduciary Net Position - Beginning 2,598,206 2,215,356
Plan Fiduciary Net Position - Ending (b) 3,098,206$ 2,598,206$
Net Pension Liability - Ending (a) - (b) 1,179,821$ 1,404,557$
Plan Fiduciary Net Position as a Percentage of the TotalPension Liability 72.42% 64.91%
Covered Employee Payroll 226,381$ 215,601$
Net Pension Liability as a Percentage of Covered-Employee Payroll 521.17% 651.46%
This schedule is presented as required by accounting principles generally accepted in the UnitedStates of America, however, until a full 10-year trend is compiled, information is presented for thoseyears available.
CITY OF FLORIDA CITY, FLORIDA
REQUIRED SUPPLEMENTARY INFORMATION
SCHEDULE OF CHANGES IN THE CITY'S NET PENSION LIABILITY ANDRELATED RATIOS
LAST TWO FISCAL YEARSELECTED OFFICIALS RETIREMENT PLAN
80

2016 2015Actuarially determined contribution 506,633$ 382,791$
Contributions in relation to the actuarially determined contribution 500,000 382,791
Contribution deficiency (excess) 6,633$ --$
Covered-employee payroll 226,381$ 215,601$
Contributions as a percentage or covered-employee payroll 220.87% 177.55%
Notes to Schedule
Valuation date: October 1, 2014
Methods and assumptions used to determine contribution rates:
Actuarial cost method Entry Age NormalAmortization method Level Dollar, ClosedRemaining amortization period 10 yearsAsset valuation method Market valueInflation 3.00%Salary increases 5.0%Investment rate of return 3.0%Retirement age 100% when first eligible for Normal Retirement
This schedule is presented as required by accounting principles generally accepted in the UnitedStates of America, however, until a full 10-year trend is compiled, information is presented for thoseyears available.
CITY OF FLORIDA CITY, FLORIDA
REQUIRED SUPPLEMENTARY INFORMATION
SCHEDULE OF CITY CONTRIBUTIONS
LAST TWO FISCAL YEARS
Actuarially determined contribution rates are calculated as of October 1, two years prior to the end ofthe fiscal year in which contributions are reported.
ELECTED OFFICIALS RETIREMENT PLAN
81

2016 2015
Annual money-weighted rate of return 0.00% 0.00%
CITY OF FLORIDA CITY, FLORIDA
REQUIRED SUPPLEMENTARY INFORMATION
SCHEDULE OF INVESTMENT RETURNS
LAST TWO FISCAL YEARS
This schedule is presented as required by accounting principles generally accepted inthe United States of America, however, until a full 10-year trend is compiled,information is presented for those years available.
ELECTED OFFICIALS RETIREMENT PLAN
82

2016 2015City's proportion of the net pension liability 0.0223% 0.0204%
City's proportionate share of the FRS net pension liability 5,626,880$ 2,629,988$
City's covered employee payroll 4,788,287$ 4,690,842$
City's proportionate share of the FRS net pension liability as a percentage of its covered employee payroll 117.5% 56.1%
FRS Plan fiduciary net position as a percentage of the totalpension liability 84.9% 92%
2016 2015Contractually required FRS contribution 543,466$ 496,436$
FRS contribution in relation to the contractually required contribution 543,466 496,436
FRS contribution deficiency (excess) --$ --$
City's covered payroll 4,827,426$ 4,690,842$
FRS contribution as a percentage of covered employee payroll 11.26% 10.58%
CITY OF FLORIDA CITY, FLORIDA
REQUIRED SUPPLEMENTARY INFORMATION
SCHEDULE OF THE CITY'S PROPORTIONATE SHAREOF THE NET PENSION LIABILITY
FLORIDA RETIREMENT SYSTEM PENSION PLAN
The schedules presented above illustrate the requirements of GASB Statement No. 68. Currently, only data for years 2015 and 2016 are available.
Note: The amounts presented above were determined as of June 30th.
Note: The amounts presented above were determined as of September 30th.
SCHEDULE OF THE CITY'S CONTRIBUTIONSFLORIDA RETIREMENT SYSTEM PENSION PLAN
83

2016 2015City's proportionate share of the net pension liability 0.0155% 0.0154%
City's proportionate share of the HIS net pension liability 1,807,716$ 1,571,765$
City's covered employee payroll 4,788,287$ 4,690,842$
City's proportionate share of the HIS net pension liability as a percentage of its covered employee payroll 37.8% 33.5%
HIS Plan fiduciary net position as a percentage of the totalpension liability 0.97% 0.5%
2016 2015Contractually required HIS contribution 79,503$ 58,914$
HIS contribution in relation to the contractually required contribution 79,503 58,914
HIS contribution deficiency (excess) --$ --$
City's covered payroll 4,827,426$ 4,690,842$
HIS contribution as a percentage of covered employee payroll 1.65% 1.26%
RETIREE HEALTH INSURANCE SUBSIDY PROGRAM
The schedules presented above illustrate the requirements of GASB Statement No. 68. Currently, only data for years 2015 and 2016 are available.
Note: The amounts presented above were determined as of September 30th.
Note: The amounts presented above were determined as of June 30th.
CITY OF FLORIDA CITY, FLORIDA
REQUIRED SUPPLEMENTARY INFORMATION
SCHEDULE OF THE CITY'S PROPORTIONATE SHAREOF THE NET PENSION LIABILITY
RETIREE HEALTH INSURANCE SUBSIDY PROGRAM
SCHEDULE OF THE CITY'S CONTRIBUTIONS
84

Actuarial UAALActuarial Accrued Unfunded as a %
Actuarial Value of Liability AAL Funded Covered of CoveredValuation Assets (AAL) (UAAL) Ratio Payroll Payroll
Date (a) (b) (b) - (a) (a) ÷ (b) (c) ((b - a) ÷ c)September 30, 2010 --$ 792,989$ 792,989$ 0.0% 4,101,157$ 19.3%September 30, 2013 -- 657,014 657,014 0.0% 4,414,519 14.9%October 1, 2015 -- 658,807 658,807 0.0% 4,564,353 14.4%
CITY OF FLORIDA CITY, FLORIDA
REQUIRED SUPPLEMENTARY INFORMATION
OTHER POST-EMPLOYMENT BENEFITS
SCHEDULE OF FUNDING PROGRESS
85

COMBINING FUND FINANCIAL STATEMENTS

NONMAJOR GOVERNMENTAL FUNDS
SPECIAL REVENUE FUNDS
Special revenue funds are used to account for revenues derived from specific sources that are legally restricted to expenditures for particular purposes.
Law Enforcement Forfeiture – Federal. This fund accounts for assets received from the Federal Government (Department of Justice and Treasury Department) from federally forfeited cash, property, proceeds and any interest earned thereon, which are equitably shared with the participating agency and restricted to expenditure for law enforcement purposes under their Federal Equitable Sharing Agreement. Law Enforcement Forfeiture – State. This fund accounts for assets acquired pursuant to Florida Statute 921.701, Florida Contraband Forfeiture Act. Proceeds from the sale of such forfeited property are restricted for expenditure for law enforcement purposes, which are those other than the normal law enforcement operating expenditures. Florida City Foundation – This fund is a component unit of the City reflecting the activity of a non-profit organization, which provides activities to benefit the citizens of the City. This component unit has a December 31st year end and is reported as of and for the year ended December 31, 2015.

Law Law TotalEnforcement Enforcement Florida NonmajorForfeiture - Forfeiture - City Governmental
Federal State Foundation FundsAssets
Cash --$ --$ 356,002$ 356,002$ Accounts receivable -- -- 34,191 34,191 Restricted cash 113,223 122,488 -- 235,711
Total Assets 113,223$ 122,488$ 390,193$ 625,904$
Liabilities and Fund BalancesAccrued liabilities 5,652$ --$ --$ 5,652$ Due to other funds 46,711 40,526 -- 87,237 Unearned revenue -- 64,194 -- 64,194
Total Liabilities 52,363 104,720 -- 157,083
Fund Balance Restricted 60,860 17,768 390,193 468,821
Total Liabilities and Fund Balances 113,223$ 122,488$ 390,193$ 625,904$
CITY OF FLORIDA CITY, FLORIDA
SEPTEMBER 30, 2016
COMBINING BALANCE SHEETNONMAJOR GOVERNMENTAL FUNDS
86

Law Law Total Enforcement Enforcement Florida NonmajorForfeiture - Forfeiture - City Governmental
Federal State Foundation FundsRevenues
Investment earnings 451$ 494$ 7$ 952$ Forfeitures 41,875 12,669 -- 54,544 Other -- 16,269 33,050 49,319
Total Revenues 42,326 29,432 33,057 104,815
ExpendituresCurrent:
General government -- -- 7,234 7,234 Public safety 42,326 20,774 -- 63,100
Total Expenditures 42,326 20,774 7,234 70,334
Excess of Revenuesover Expenditures -- 8,658 25,823 34,481
Fund Balances - Beginning 60,860 9,110 364,370 434,340
Fund Balances - Ending 60,860$ 17,768$ 390,193$ 468,821$
CITY OF FLORIDA CITY, FLORIDA
CHANGES IN FUND BALANCESNONMAJOR GOVERNMENTAL FUNDS
FOR THE FISCAL YEAR ENDED SEPTEMBER 30, 2016
COMBINING STATEMENT OF REVENUES, EXPENDITURES AND
87

FIDUCIARY FUNDS

FIDUCIARY FUNDS Police Officers’ Substitute Pension Trust Fund – This fund accounts for the accumulation of resources and for contributions and benefits of certain police officers. Elected Officials Retirement Plan – This fund accounts for the accumulation of resources and for contributions and benefits for elected officials.

Police Officers' Substitute
Pension Trust Fund
Elected Officials
Retirement Plan TotalAssets
Cash --$ 3,098,206$ 3,098,206$
InvestmentsMoney market mutual funds 124,207 -- 124,207 Common stock 1,964,676 -- 1,964,676 Corporate bonds 336,822 -- 336,822 Government securities 548,813 -- 548,813
Total Investments 2,974,518 -- 2,974,518
ReceivablesCity contributions -- 6,633 6,633 Accrued interest 4,770 -- 4,770
Total Receivables 4,770 6,633 11,403
Total Assets 2,979,288 3,104,839 6,084,127
Net Position Restricted for Pension Benefits 2,979,288$ 3,104,839$ 6,084,127$
CITY OF FLORIDA CITY, FLORIDA
COMBINING STATEMENT OF FIDUCIARY NET POSITIONFIDUCIARY FUNDS
SEPTEMBER 30, 2016
88

Police Officers'
Substitute Pension Trust
Fund
Elected Officials
Retirement Plan Total
Additions
Contributions City --$ 506,633$ 506,633$
Total Contributions -- 506,633 506,633
Investment EarningsNet appreciation in fair value of investments 182,546 -- 182,546 Interest and dividends 55,063 -- 55,063
Total Investments Earnings 237,609 -- 237,609
Total Additions 237,609 506,633 744,242
DeductionsBenefits paid 284,400 -- 284,400 Administrative expenses 36,760 -- 36,760
Total Deductions 321,160 -- 321,160
-- Change in Net Position (83,551) 506,633 423,082
Net Position Restricted for Pension Benefits - Beginning 3,062,839 2,598,206 5,661,045
Net Position Restricted for Pension Benefits - Ending 2,979,288$ 3,104,839$ 6,084,127$
CITY OF FLORIDA CITY, FLORIDA
COMBINING STATEMENT OF CHANGES IN FIDUCIARY NET POSITIONFIDUCIARY FUNDS
FOR THE FISCAL YEAR ENDED SEPTEMBER 30, 2016
89

STATISTICAL SECTION

Statistical Section
This part of the City of Florida City’s comprehensive annual financial report represents detailedinformation as a context for understanding what the information in the financial statements, notedisclosures, and required supplementary information says about the City’s overall financial health.
Contents Page
Financial Trends
These schedules contain trend information to help the reader understand how the City’s financialperformance and well-being have changed over time. 90-93
Revenue Capacity
These schedules contain information to help the reader understand and assess the City’s mostsignificant local revenue source, the property tax. 94-97
Debt CapacityThese schedules represent information to help the reader assess the affordability of the City’s currentlevels of outstanding debt and the City’s ability to issue additional debt in the future. 98-100
Demographic and Economic Information
These schedules offer demographic and economic indicators to help the reader understand theenvironment within which the City's financial activities take place. 101-103
Operating Information
These schedules contain service and infrastructure data to help the reader understand how theinformation in the City’s financial reports relates to the services the City provides and the activities itperforms. 104-105
Sources: Unless otherwise noted, the information in these schedules is derived from theComprehensive Annual Financial Reports for the relevant years.

2016 2015 2014 2013 2012 2011 2010 2009 2008 2007Governmental Activities
Net investment in capital assets 21,277,007$ 21,568,418$ 21,097,350$ 20,600,344$ 18,618,782$ 15,445,091$ 13,265,395$ 11,738,467$ 9,903,919$ 9,216,440$ Restricted 7,664,448 6,667,253 5,950,637 5,384,144 6,338,849 7,534,643 2,697,968 2,423,478 2,672,279 3,415,653 Unrestricted 6,304,336 7,612,827 11,987,073 11,772,235 12,635,960 12,408,125 18,368,238 18,036,360 16,157,755 13,518,231
Total Governmental Activities Net Position 35,245,791$ 35,848,498$ 39,035,060$ 37,756,723$ 37,593,591$ 35,387,859$ 34,331,601$ 32,198,305$ 28,733,953$ 26,150,324$
Business-type ActivitiesNet investment in capital assets 18,333,017$ 18,845,943$ 18,841,730$ 18,893,662$ 18,768,900$ 17,693,353$ 17,569,157$ 17,240,977$ 13,424,540$ 11,229,432$ Restricted 779,698 775,428 770,866 446,818 442,669 436,975 432,135 424,144 412,451 392,064 Unrestricted 5,680,522 5,303,590 5,640,832 5,890,234 6,057,692 6,121,328 6,000,444 5,892,055 5,527,742 5,909,421
Total Business-type Activities Net Position 24,793,237$ 24,924,961$ 25,253,428$ 25,230,714$ 25,269,261$ 24,251,656$ 24,001,736$ 23,557,176$ 19,364,733$ 17,530,917$
Primary government:Net investment in capital assets 39,610,024$ 40,414,361$ 39,939,080$ 39,494,006$ 37,387,682$ 33,138,444$ 30,834,552$ 28,979,444$ 23,328,459$ 20,445,872$ Restricted 8,444,146 7,442,681 6,721,503 5,830,962 6,781,518 7,971,618 3,130,103 2,847,622 3,084,730 3,807,717 Unrestricted 11,984,858 12,916,417 17,627,905 17,662,469 18,693,652 18,529,453 24,368,682 23,928,415 21,685,497 19,427,652
Total Primary Government Net Position 60,039,028$ 60,773,459$ 64,288,488$ 62,987,437$ 62,862,852$ 59,639,515$ 58,333,337$ 55,755,481$ 48,098,686$ 43,681,241$
Note: The City implemented GASB Statement No. 63 during the fiscal year ended September 30, 2013 and utilized the new terminology for all years presented.
CITY OF FLORIDA CITY, FLORIDA
NET POSITION BY COMPONENTLAST TEN FISCAL YEARS
(ACCRUAL BASIS OF ACCOUNTING)
Fiscal Year
90

CHANGES IN NET POSITIONLAST TEN FISCAL YEARS
(ACCRUAL BASIS OF ACCOUNTING)
2016 2015 2014 2013 2012 2011 2010 2009 2008 2007Expenses
Governmental activities:General government 5,142,885$ 5,504,388$ 4,639,915$ 5,185,940$ 4,842,342$ 5,051,175$ 5,020,179$ 4,651,826$ 7,523,141$ 5,667,814$ Public works 2,781,545 2,498,493 2,584,261 2,586,344 2,516,237 2,471,340 2,751,993 2,504,853 2,306,644 2,262,054 Public safety 4,536,937 3,800,750 3,589,591 3,543,627 3,219,661 3,335,702 3,103,892 3,072,338 2,762,759 2,721,738 Parks and recreation 808,091 773,483 670,491 651,931 556,506 563,291 576,549 576,109 472,468 483,585 Interest on long-term debt 2,901 5,566 -- -- -- -- -- 2,907 -- --
Total Governmental Activities Expenses 13,272,359 12,582,680 11,484,258 11,967,842 11,134,746 11,421,508 11,452,613 10,808,033 13,065,012 11,135,191
Business-type ActivitiesWater and sewer 4,313,692 3,514,528 3,218,483 3,456,755 3,305,656 3,037,330 3,012,668 2,789,256 3,109,161 2,897,951
Total Business-type Activities Expenses 4,313,692 3,514,528 3,218,483 3,456,755 3,305,656 3,037,330 3,012,668 2,789,256 3,109,161 2,897,951
Total Primary Government Expenses 17,586,051$ 16,097,208$ 14,702,741$ 15,424,597$ 14,440,402$ 14,458,838$ 14,465,281$ 13,597,289$ 16,174,173$ 14,033,142$
Program RevenueGovernmental activities:
Charge for services:Refuse collection 2,412,091$ 2,265,470$ 2,194,985$ 2,208,676$ 2,171,831$ 2,164,331$ 2,118,146$ 2,168,138$ 2,070,686$ 2,048,653$ Recycling fees 82,166 74,239 60,751 50,358 64,933 66,197 63,324 68,572 58,116 55,022 Public safety 1,547,654 1,369,746 1,416,465 1,089,815 1,574,803 393,234 529,790 104,893 145,873 49,140 Parks and recreation 873,889 769,811 655,729 777,801 767,224 662,055 634,142 623,469 645,184 734,439 Other activities 1,087,410 637,226 719,881 624,835 447,734 488,028 510,199 418,830 686,445 1,077,228
Operating grants and contributions 33,050 90,551 38,011 174,183 357,988 568,881 390,603 244,052 3,144,190 2,273,359 Capital grants and contributions 1,756,154 1,986,078 2,055,216 2,440,842 3,959,800 2,800,895 2,009,897 5,918,099 842,630 788,951
Total Governmental Activities Programs Revenues 7,792,414 7,193,121 7,141,038 7,366,510 9,344,313 7,143,621 6,256,101 9,546,053 7,593,125 7,026,792
Business-type ActivitiesCharge for services:
Water and sewer 3,679,482 3,066,695 2,851,205 2,712,231 2,651,685 2,580,149 2,519,473 2,473,213 2,164,536 2,525,153 Operating grants and contributions -- -- -- -- -- -- -- -- -- -- Capital grants and contributions -- -- -- -- -- -- -- -- 2,588,502 1,449,731
Total Business-type Activities Programs Revenues 3,679,482 3,066,695 2,851,205 2,712,231 2,651,685 2,580,149 2,519,473 2,473,213 4,753,038 3,974,884
Total Primary Government ProgramRevenues 11,471,896$ 10,259,816$ 9,992,243$ 10,078,741$ 11,995,998$ 9,723,770$ 8,775,574$ 12,019,266$ 12,346,163$ 11,001,676$
Net (Expense) RevenueGovernmental activities (5,479,945) (5,389,559) (4,343,220) (4,601,332) (1,790,433) (4,277,887)$ (5,196,512)$ (1,261,980)$ (5,471,887)$ (4,108,399)$ Business-type activities (634,210) (447,833) (367,278) (744,524) (653,971) (457,181) (493,195) (316,043) 1,643,877 1,076,933
Total Primary Government Net (Expense) Revenue (6,114,155)$ (5,837,392)$ (4,710,498)$ (5,345,856)$ (2,444,404)$ (4,735,068)$ (5,689,707)$ (1,578,023)$ (3,828,010)$ (3,031,466)$
General Revenues and Other Changes in Net Position
Governmental activities:Taxes:Property taxes 1,863,171$ 1,981,186$ 1,945,005$ 1,930,823$ 2,218,407$ 2,513,413$ 4,390,868$ 5,834,352$ 5,046,491$ 4,680,375$ Utility Taxes 840,030 820,057 808,197 737,749 698,784 650,087 629,105 605,045 592,559 503,507
Communication services tax 219,444 232,298 230,135 257,366 265,274 275,703 320,014 326,375 307,618 295,276 Franchise fees based on gross receipts 708,833 712,573 702,210 650,210 659,738 601,814 637,019 742,064 670,884 603,862
Unrestricted intergovernmental revenue 1,730,376 1,751,141 1,630,558 1,546,817 1,412,896 1,254,721 1,195,745 534,167 584,714 583,721 Unrestricted state shared revenues 336,926 314,056 262,786 224,173 177,259 157,197 145,554 -- -- -- Unrestricted investment earnings 50,103 58,642 29,723 70,800 136,182 401,293 706,281 735,173 649,354 823,122 Miscellaneous 175,222 141,494 366,025 -- 71,972 35,700 98,969 237,062 203,895 134,039 Settlement Proceeds 411,015 -- -- -- -- -- -- -- -- --
Transfers (456,313) (406,023) (353,082) (653,474) (1,644,347) (555,783) (793,747) (4,287,906) -- -- Extraordinary Item
Claims Proceeds -- 746,881 -- -- -- -- -- -- -- --
Total Governmental Activities 5,878,807 6,352,305 5,621,557 4,764,464 3,996,165 5,334,145 7,329,808 4,726,332 8,055,515 7,623,902
Business-type ActivitiesUnrestricted Investment earnings 46,173 35,355 36,910 52,503 27,229 151,318 144,008 220,580 254,925 278,190
Transfers 456,313 406,023 353,082 653,474 1,644,347 555,783 793,747 4,287,906 -- --
Total Business-type Activities 502,486 441,378 389,992 705,977 1,671,576 707,101 937,755 4,508,486 254,925 278,190
Total Primary Government 6,381,293$ 6,793,683$ 6,011,549$ 5,470,441$ 5,667,741$ 6,041,246$ 8,267,563$ 9,234,818$ 8,310,440$ 7,902,092$
Change in Net PositionGovernmental activities 398,862$ 962,746$ 1,278,337$ 163,132$ 2,205,732$ 1,056,258$ 2,133,296$ 3,464,352$ 2,583,628$ 3,515,503$ Business-type activities (131,724) (6,455) 22,714 (38,547) 1,017,605 249,920 444,560 4,192,443 1,898,802 1,355,123
Total Primary Government 267,138$ 956,291$ 1,301,051$ 124,585$ 3,223,337$ 1,306,178$ 2,577,856$ 7,656,795$ 4,482,430$ 4,870,626$
CITY OF FLORIDA CITY, FLORIDA
Fiscal Year
Note: The City implemented GASB Statement No. 63 during the fiscal year ended September 30, 2013 and utilized the new terminology for all years presented.
91

2007 2008 2009 2010 2011 2012 2013 2014 2015 2016
General FundReserved 2,234,868$ 1,611,948$ 1,944,008$ 1,606,214$ --$ --$ --$ --$ --$ --$ Unreserved 9,436,411 11,362,289 12,662,817 13,214,399 -- -- -- -- -- -- Non-Spendable -- -- -- -- 252 54,202 56,605 4,182 2,182 134,407 Restricted -- -- -- -- 1,554,119 1,400,862 1,941,151 2,700,205 3,508,603 4,243,607 Committed -- -- -- -- 218,692 358,373 392,394 717,806 880,994 761,565 Unassigned -- -- -- -- 13,114,469 13,299,783 12,677,903 12,408,676 11,964,363 11,800,144
Total General Fund 11,671,279$ 12,974,237$ 14,606,825$ 14,820,613$ 14,887,532$ 15,113,220$ 15,068,053$ 15,830,869$ 16,356,142$ 16,939,723$
All Other Governmental FundsReserved 44,771$ 44,771$ --$ --$ --$ --$ --$ --$ --$ --$ Unreserved, reported in:
Special revenue funds 5,500,637 6,389,207 6,393,842 6,983,660 -- -- -- -- -- -- Restricted -- -- -- -- 5,980,524 4,937,981 3,442,993 3,250,432 3,158,653 3,338,068 Unassigned -- -- -- -- -- -- (17,579) (2,977) -- --
Total All Other Governmental
Funds 5,545,408$ 6,433,978$ 6,393,842$ 6,983,660$ 5,980,524$ 4,937,981$ 3,425,414$ 3,247,455$ 3,158,653$ 3,338,068$
Note: The City implemented GASB Statement No. 54 for the fiscal year ended September 30, 2011.
CITY OF FLORIDA CITY, FLORIDA
FUND BALANCES OF GOVERNMENTAL FUNDSLAST TEN FISCAL YEARS
(MODIFIED ACCRUAL BASIS OF ACCOUNTING)
92

2007 2008 2009 2010 2011 2012 2013 2014 2015 2016Revenues
Taxes 6,083,020$ 6,617,552$ 7,507,836$ 5,977,006$ 4,041,017$ 3,842,203$ 3,576,149$ 3,685,547$ 3,746,114$ 4,643,481$ Intergovernmental 1,938,026 2,070,344 2,379,640 2,457,943 3,730,546 3,301,572 3,517,619 3,584,423 3,630,545 2,730,126 Charges for services 3,013,128 2,972,925 2,955,335 2,980,585 3,067,264 3,100,203 3,069,658 2,927,599 3,168,385 3,482,795 Program income 6,751 4,665 -- -- -- -- -- -- -- --Interest/Investment Earnings 823,122 649,354 735,173 706,281 401,293 136,182 70,800 29,723 58,642 50,103 Impact fees 256,263 141,041 46,526 88,865 35,700 71,972 -- 366,025 141,494 175,222 Licenses and permits 645,951 363,774 285,958 355,720 386,001 278,495 277,841 349,120 345,898 474,597 Donations 20,535 2,100 -- -- -- -- -- -- -- --Confiscated property 10,551 3,587 -- -- -- -- -- -- -- --Fines and forfeitures 38,589 124,978 96,083 263,003 157,679 1,405,419 1,089,815 1,416,465 1,325,006 1,525,604 Grants 1,638,886 2,375,807 4,073,802 945,725 632,528 2,553,273 718,773 387,648 444,241 56,449 Settlement Proceeds -- -- -- -- -- -- -- - - 411,015 Other revenues 175,872 322,513 479,938 604,528 581,521 295,506 463,793 369,127 313,546 484,182
Total Revenues 14,650,694 15,648,640 18,560,291 14,379,656 13,033,549 14,984,825 12,784,448 13,115,677 13,173,871 14,033,574 --
Expenditures General government 3,959,431 4,303,450 5,516,655 4,589,607 4,554,946 4,298,963 4,714,663 4,046,725 4,872,313 4,584,942 Public safety 2,559,295 2,622,265 2,928,761 2,908,019 3,136,898 3,060,753 3,382,184 3,466,200 3,865,141 4,048,097 Public works 2,200,313 2,233,032 2,564,748 2,440,690 2,407,302 2,461,659 2,566,960 2,573,820 2,499,820 2,737,680 Parks and recreation 392,531 369,972 459,774 451,007 441,081 434,114 471,430 506,526 606,996 628,338 Capital outlay 2,332,956 3,876,217 5,445,725 3,186,728 3,429,539 5,546,185 3,506,951 1,937,549 1,604,449 1,133,617 Debt service:
Principal 115,882 52,176 49,269 -- -- -- -- -- 30,000 135,000 Interest -- -- 2,907 -- -- -- -- -- 5,566 2,901
Total Expenditures 11,560,408 13,457,112 16,967,839 13,576,051 13,969,766 15,801,674 14,642,188 12,530,820 13,484,285 13,270,575 --
Excess of Revenues Over (Under) Expenditures 3,090,286 2,191,528 1,592,452 803,605 (936,217) (816,849) (1,857,740) 584,857 (310,414) 762,999 --
Extraordinary Item Claims Proceeds -- -- -- -- -- -- -- -- 746,881 -
Other Financing Sources (Uses Transfer in 1,130,053 1,441,320 2,031,361 1,998,075 37,816 109,573 -- -- -- --Transfer out (1,130,053) (1,441,320) (2,031,361) (1,998,075) (37,816) (109,573) -- -- -- --Other financing source 147,969 -- -- -- -- -- 300,000 -- -- --
Total Other Financing Sources (Uses) 147,969 -- -- -- -- -- 300,000 -- -- --
Net Change in Fund Balances 3,238,255$ 2,191,528$ 1,592,452$ 803,605$ (936,217)$ (816,849)$ (1,557,740)$ 584,857 436,467 762,999
Debt service as a percentage of noncapital expenditures* 1.26% 0.54% 0.45% 0.00% 0.00% 0.00% 0.00% 0.00% 0.00% 0.00%
*See pg 17 for capital expenditures
CITY OF FLORIDA CITY, FLORIDA
CHANGES IN FUND BALANCES OF GOVERNMENTAL FUNDSLAST TEN FISCAL YEARS
(MODIFIED ACCRUAL BASIS OF ACCOUNTING)
93

AssessedLess Total Value as a Total
Estimated Estimated Estimated Tax Taxable Estimated Percentage DirectFiscal Assessed Actual Assessed Actual Assessed Actual Exempt Assessed Actual of Estimated TaxYear Value Value Value Value Value Value Property Value Value Value Rate
2007 328,686$ 329,998$ 373,662$ 443,925$ 39,434$ 38,714$ 72,027$ 669,755$ 812,637$ 82.42% 7.75002008 476,932 655,100 173,618 273,485 36,396 37,117 72,100 614,846 965,702 63.67% 7.75002009 586,664 766,492 202,672 313,428 39,995 45,075 83,862 745,469 1,124,995 66.26% 7.75002010 499,708 696,426 154,640 244,370 40,419 45,551 88,483 606,284 986,347 61.47% 7.75002011 409,445 582,038 98,227 144,406 41,215 46,306 86,152 548,887 772,750 71.03% 7.75002012 353,890 504,597 69,038 95,980 36,876 42,145 81,867 459,804 642,722 71.54% 7.75002013 346,047 500,735 50,139 80,010 39,202 44,887 83,512 435,388 625,632 69.59% 7.58992014 362,989 524,167 10,602 46,003 36,492 42,852 87,193 410,083 613,022 66.90% 7.58992015 455,702 518,823 37,878 47,362 41,504 41,504 126,927 408,158 607,689 67.17% 7.18582016 475,552 542,433 38,383 55,792 46,240 46,240 133,546 426,629 644,465 66.20% 7.1858
(1) Information obtained from Miami-Dade County Department of Property Appraiser.
TotalCommercial Residential Personal Property
Real Property
CITY OF FLORIDA CITY, FLORIDA
ASSESSED VALUE AND ESTIMATED ACTUAL VALUE OF TAXABLE PROPERTYLAST TEN FISCAL YEARS
(DOLLARS IN THOUSANDS)
94

Total School Miami- SpecialFiscal Operating City District State Dade District TotalYear Millage Millage Millage Millage County Millages Millage
2007 7.7500 7.7500 7.9480 0.6585 4.8646 3.0552 24.2763 2008 7.7500 7.7500 7.7970 0.6585 5.1229 3.0305 24.3589 2009 7.7500 7.7500 7.9950 0.6585 5.1229 3.1093 24.6357 2010 7.7500 7.7500 8.2490 0.6585 5.8725 3.3793 25.9093 2011 7.7500 7.7500 8.0050 0.4708 5.0900 3.1422 24.4580 2012 7.7500 7.7500 7.9980 0.4634 4.9885 3.1352 24.3351 2013 7.5899 7.5899 7.9770 0.4455 5.1255 3.1348 24.2727 2014 7.5899 7.5899 7.9740 0.4187 5.1169 3.2161 24.3156 2015 7.1858 7.1858 7.6120 0.3871 5.1169 3.2133 23.5151 2016 7.1858 7.1858 7.3220 0.3627 5.0669 3.2122 23.1496
(1) Information Obtained from Miami-Dade County Department of Property Appraiser
City of Florida CityDirect Rates Overlapping Rates
CITY OF FLORIDA CITY, FLORIDA
LAST TEN FISCAL YEARSDIRECT AND OVERLAPPING GOVERNMENTS
PROPERTY TAX RATES (1)
95

Percentage Percentageof Total City of Total City
Taxable Taxable Taxable TaxableAssessed Assessed Assessed Assessed
Taxpayer Type of Business Value Rank Value Value Rank Value
Wal-Mart Store Retail Shopping 21,500$ 1 5.18% 24,688$ 2 4.31%Home Depot USA, Inc. Retail Shopping 11,725 2 2.82% 14,177 3 2.47%Largo Motors Co LTD Car Dealership 11,655 3 2.81% -- 0.00%Florida Keys Factory Shops Mall 9,850 4 2.37% 8,000 4 1.40%RA & RE Inc Motel 6,100 5 1.47% -- 0.00%Bonita Pointe Associates Real Estate 5,901 6 1.42% 5,975 6 1.04%South Florida Motel Corp. Motel 5,324 7 1.28% -- 0.00%RD & RD Corporation Real Estate 5,000 8 1.20% -- 0.00%ATJ Corporation Real Estate 4,607 9 1.11% -- 0.00%Hotel Two LLC Hotel 4,311 10 1.04% -- 0.00%GREC Homes IX, LLC Rental -- 0.00% 25,437 1 4.44%Delmar Homes IV, LLC Agricultural -- 0.00% 6,967 5 1.22%Hotel One, Inc. Hotel -- 0.00% 5,563 7 0.97%Cameron Creek, Ltd Rental -- 0.00% 5,500 8 0.96%Parlon Corporation Motel -- 0.00% 4,829 9 0.84%Jubilee Courtyards Assoc. Ltd. Rental -- 0.00% 4,000 10 0.70%
Total 85,972$ 20.71% 105,136$ 18.34%
(1) The total assessed valuation of taxable property for 2016 is $415,125(2) The total assessed valuation of taxable property for 2007 is $573,318
CITY OF FLORIDA CITY, FLORIDA
PRINCIPAL PROPERTY TAXPAYERS
AS OF SEPTEMBER 30, 2016 AND NINE YEARS AGO
2016 2007
(DOLLARS IN THOUSANDS)
96

Ratio ofPercent Collection Ratio of
of (2) Total Tax (3) Delinquent(1) Current Current Delinquent Total Collection Outstanding Taxes
Fiscal Total Tax Taxes Tax Tax to Total Delinquent to TotalYear Tax Levy Collections Collected Collections Collections Tax Levy Taxes Tax Levy
2007 5,579,344$ 4,669,535$ 83.7% 10,840$ 4,680,375$ 83.9% N/A 0.0%2008 5,580,238 4,927,302 88.3% 119,190 5,046,491 90.4% N/A 0.0%2009 6,102,410 5,560,785 91.1% 273,567 5,834,352 95.6% N/A 0.0%2010 5,579,798 4,109,922 73.7% 280,946 4,390,868 78.7% N/A 0.0%2011 2,934,969 2,934,969 100.0% -- 2,934,969 100.0% 913,986 31.1%2012 3,189,744 3,040,397 95.3% 149,347 3,189,744 100.0% 92,794 2.9%2013 3,112,481 2,609,331 83.8% 415,019 3,024,350 97.2% N/A 0.0%2014 3,097,876 2,509,987 81.0% 82,616 2,592,603 83.7% N/A 0.0%2015 3,065,672 2,372,031 77.4% 205,177 2,577,207 84.1% N/A 0.0%2016 3,263,787 2,513,343 77.0% 12,652 2,525,995 77.4% N/A 0.0%
(1) Information taken from Florida Municipal Ad Valorem Tax Profile.
(2) Information obtained from City of Florida City's financial statements.
(3) Information obtained from Miami-Dade County Tax Collector.
N/A - Not available.
CITY OF FLORIDA CITY, FLORIDA
PROPERTY TAX LEVIES AND COLLECTIONSLAST TEN FISCAL YEARS
97

Percentage PerGovernmental Activities Total of Capita
Fiscal Notes Notes Water Primary Household HouseholdYear Payable Payable Bonds Government Income* Income*
2007 --$ 1,500,000$ 619,500$ 2,119,500$ N/A N/A2008 -- 1,200,000 569,600 1,769,600 0.29% 5,175 2009 -- 1,200,000 517,200 1,717,200 N/A N/A2010 -- 1,000,000 462,300 1,462,300 N/A N/A2011 -- 1,000,000 403,800 1,403,800 0.67% 9,337 2012 -- 800,000 342,700 1,142,700 0.58% 6,637 2013 300,000 500,000 279,100 1,079,100 0.62% 6,637 2014 300,000 100,000 211,800 611,800 1.08% 6,637 2015 270,000 -- 139,900 409,900 2.06% 8,426 2016 135,000 -- 125,200 260,200 2.55% 6,637
N/A: Not Available
*Information obtained from Zip Atlas.
CITY OF FLORIDA CITY, FLORIDA
RATIOS OF OUTSTANDING DEBT BY TYPELAST TEN FISCAL YEARS
Business-type Activities
98

Net Percentage AmountGeneral Applicable Applicable
Obligation to toBonded City of City of
Debt Florida FloridaOutstanding City (2) City
School Board of Miami-Dade County 519,258$ 0.48% 2,476$ Miami-Dade County (1) 1,597,781 0.48% 7,620
2,117,039$ 10,096$
(1) Information obtained from Miami-Dade County, Finance Department for 2016 (2) Percentage based upon population of Florida City v Miami-Dade County
(DOLLARS IN THOUSANDS)
SEPTEMBER 30, 2016
CITY OF FLORIDA CITY, FLORIDA
COMPUTATION OF OVERLAPPING BONDED DEBTGENERAL OBLIGATIONS BONDS
99

NetRevenueAvailable
Gross Operating forFiscal Revenue Expenses DebtYear (1) (2) Service Principal Interest Total Coverage
2007 2,547$ 2,778$ (231)$ 50 31 81 (2.85)2008 2,235 2,999 (764) 52 28 80 (9.55)2009 2,370 2,738 (368) 55 26 81 (4.54)2010 2,505 2,944 (439) 59 23 82 (5.37)2011 2,537 2,992 (455) 61 20 81 (5.60)2012 2,507 3,277 (770) 64 17 81 (9.54)2013 2,600 3,511 (911) 67 14 81 (11.25)2014 2,714 3,242 (528) 72 11 83 (6.36)2015 2,888 3,526 (637) 15 7 22 (29.38)2016 3,520 3,833 (313) 15 6 22 (14.44)
(1) Total revenue (including interest) exclusive of tap fees.(2) Total operating expenses.(3) Includes principal and interest of revenue bonds only.
Requirements (3)
CITY OF FLORIDA CITY, FLORIDA
WATER REVENUE BOND COVERAGELAST TEN FISCAL YEARS
(DOLLARS IN THOUSANDS)
Debt Service
100

HouseholdIncome Per
(Thousands Capitaof Household Unemployment
Year Population Dollars) Income Rate
2007 9,318 N/A N/A N/A2008 10,193 18,111$ 5,175$ 18.6%2009 10,217 18,285 N/A 18.6%2010 10,568 23,888 N/A 26.2%2011 11,704 25,132 9,337 18.2%2012 11,850 21,635 6,637 20.9%2013 12,222 21,635 6,637 20.9%2014 12,430 21,635 6,637 20.9%2015 12,577 26,539 8,426 28.7%2016 12,832 26,539 8,426 28.7%
N/A - Information not available for year indicated.
(1) Population for City of Florida City obtained from Bureau of Economic and Business Research, University of Florida.
(2) Unemployment rate for City of Florida City obtained from American Fact Finder.
CITY OF FLORIDA CITY, FLORIDA
DEMOGRAPHIC AND ECONOMIC STATISTICSLAST TEN FISCAL YEARS
101
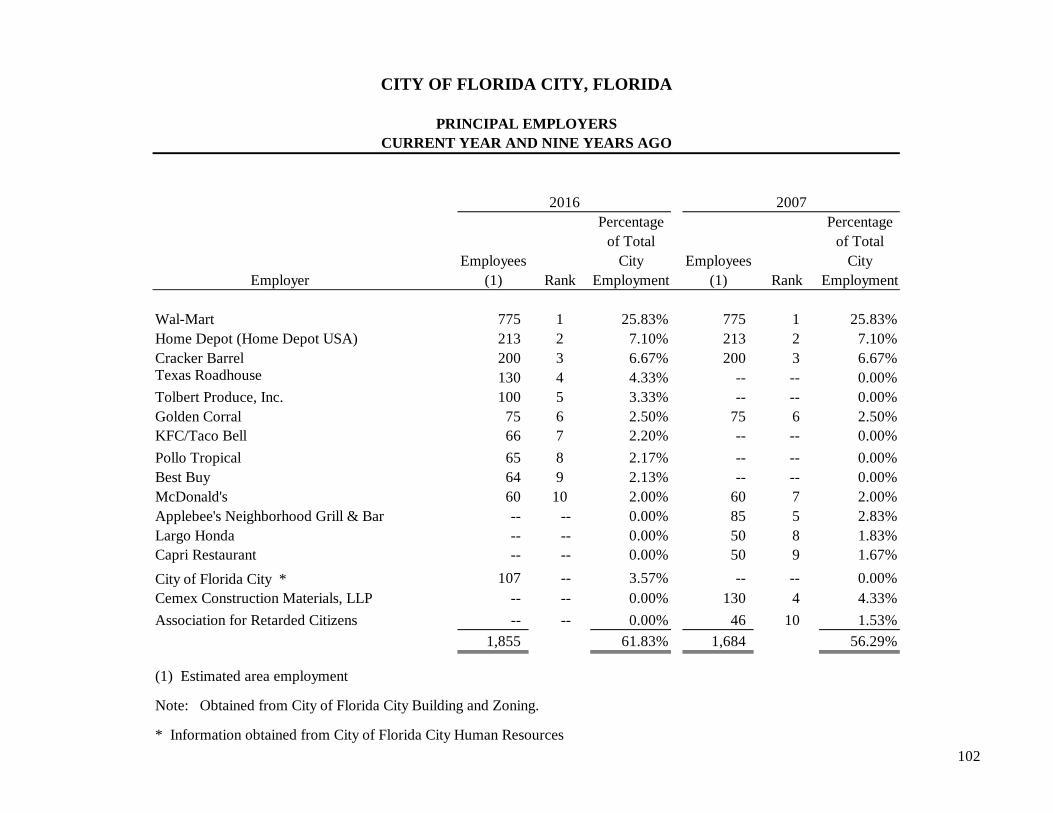
Percentage Percentageof Total of Total
Employees City Employees CityEmployer (1) Rank Employment (1) Rank Employment
Wal-Mart 775 1 25.83% 775 1 25.83%Home Depot (Home Depot USA) 213 2 7.10% 213 2 7.10%Cracker Barrel 200 3 6.67% 200 3 6.67%Texas Roadhouse 130 4 4.33% -- -- 0.00%Tolbert Produce, Inc. 100 5 3.33% -- -- 0.00%Golden Corral 75 6 2.50% 75 6 2.50%KFC/Taco Bell 66 7 2.20% -- -- 0.00%
Pollo Tropical 65 8 2.17% -- -- 0.00%Best Buy 64 9 2.13% -- -- 0.00%McDonald's 60 10 2.00% 60 7 2.00%Applebee's Neighborhood Grill & Bar -- -- 0.00% 85 5 2.83%Largo Honda -- -- 0.00% 50 8 1.83%Capri Restaurant -- -- 0.00% 50 9 1.67%
City of Florida City * 107 -- 3.57% -- -- 0.00%Cemex Construction Materials, LLP -- -- 0.00% 130 4 4.33%
Association for Retarded Citizens -- -- 0.00% 46 10 1.53%
1,855 61.83% 1,684 56.29%
(1) Estimated area employment
Note: Obtained from City of Florida City Building and Zoning.
* Information obtained from City of Florida City Human Resources
2016 2007
CITY OF FLORIDA CITY, FLORIDA
PRINCIPAL EMPLOYERSCURRENT YEAR AND NINE YEARS AGO
102
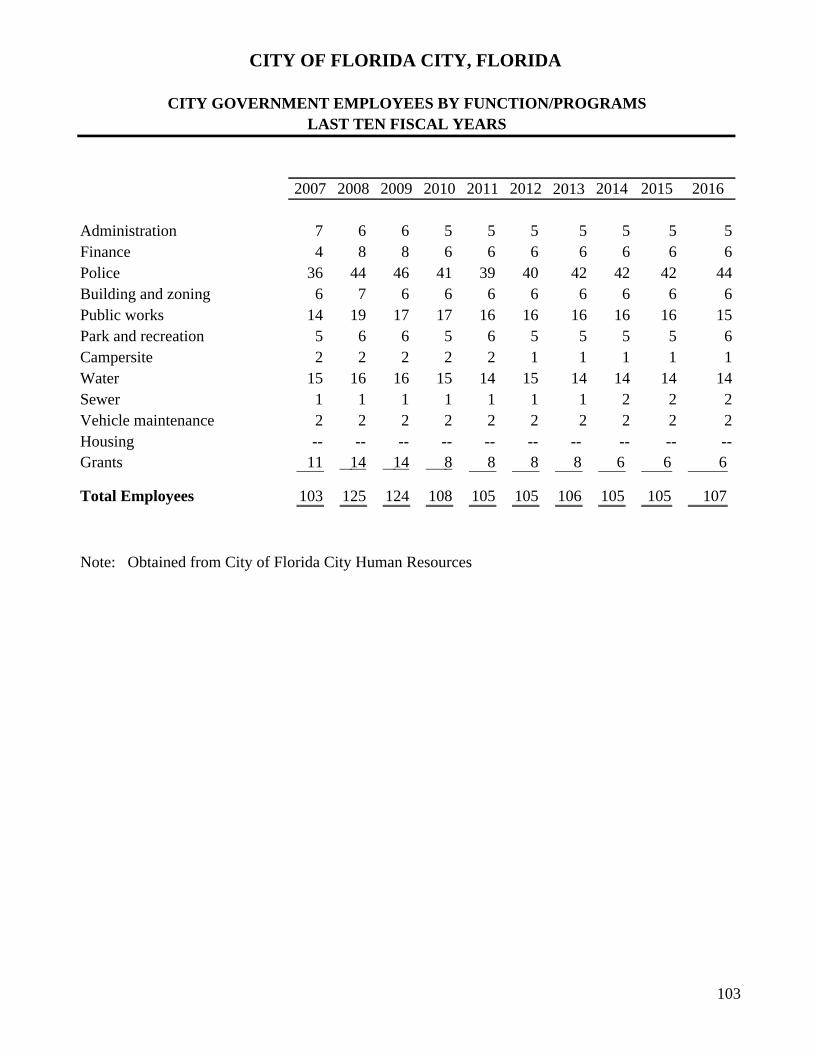
2007 2008 2009 2010 2011 2012 2013 2014 2015 2016
Administration 7 6 6 5 5 5 5 5 5 5Finance 4 8 8 6 6 6 6 6 6 6Police 36 44 46 41 39 40 42 42 42 44Building and zoning 6 7 6 6 6 6 6 6 6 6Public works 14 19 17 17 16 16 16 16 16 15Park and recreation 5 6 6 5 6 5 5 5 5 6Campersite 2 2 2 2 2 1 1 1 1 1Water 15 16 16 15 14 15 14 14 14 14Sewer 1 1 1 1 1 1 1 2 2 2Vehicle maintenance 2 2 2 2 2 2 2 2 2 2Housing -- -- -- -- -- -- -- -- -- --Grants 11 14 14 8 8 8 8 6 6 6
Total Employees 103 125 124 108 105 105 106 105 105 107
Note: Obtained from City of Florida City Human Resources
CITY OF FLORIDA CITY, FLORIDA
CITY GOVERNMENT EMPLOYEES BY FUNCTION/PROGRAMSLAST TEN FISCAL YEARS
103

2007 2008 2009 2010 2011 2012 2013 2014 2015 2016Police
Physical arrest 1,348 1,666 1,635 1,617 1,312 978 994 824 818 821Juvenile arrest 116 221 194 167 175 186 155 135 100 87Traffic violations 2,169 2,010 1,770 2,048 1,327 1,047 913 1,087 1,337 1,184
WaterNumber of service connections 1,555 78 1,481 1,167 1,618 752 612 322 667 1,168 Average monthly consumption
(thousands of dollar) 65,281$ 63,202$ 69,438$ 67,550$ 72,320$ 71,665$ 75,039$ 80,384$ 81,449$ 89,419$
SewerNumber of service connections 2,009 122 1,711 1,498 1,708 844 663 308 904 993Average monthly sewage treatment
(thousands of dollar) 93,788$ 94,392$ 109,791$ 113,672$ 120,905$ 121,322$ 127,715$ 137,677$ 143,778$ 185,119$
Electric Distribution SystemNumber of customers 3,196 3,196 3,196 3,196 3,196 3,196 3196 3196 3196 4678
Facilities and Services not Includedin the Primary Government
Cable television system:Number of customers 1,027 1,027 1,027 1,027 1,027 1,027 1027 1027 1027 1027Miles of service 37.57 37.57 37.57 37.57 37.57 37.57 37.57 37.57 37.57 37.57
Education:Number of elementary schools 1 1 1 1 1 1 1 1 1 1Number of instructors 88 88 88 88 88 88 88 88 88 88
N/A - Not Available
Note: Obtained from City of Florida City Records
CITY OF FLORIDA CITY, FLORIDA
OPERATING INDICATORS BY FUNCTION/PROGRAMLAST TEN FISCAL YEARS
104

2007 2008 2009 2010 2011 2012 2013 2014 2015 2016Police
Station 1 1 1 1 1 1 1 1 1 1Patrol units 18 18 21 21 21 21 22 23 22 25
Other Public WorksStreets (miles) 42 42 42 42 42 42 42 42 42 42Streetlights 460 460 460 460 460 460 460 460 466 474 Traffic signals 6 6 6 6 6 6 6 6 10 10
Park and RecreationAcreage 40 40 40 40 40 40 40 40 40 40Playgrounds 4 4 4 4 4 4 4 4 4 4Tennis court 2 2 2 2 2 2 2 2 2 2Community centers 1 1 1 1 1 1 2 2 2 2
WaterWater mains (miles) 43 43 43 43 43 43 43 43 58 58Fire hydrants 662 662 662 662 662 662 662 662 665 667Store capacity
(thousands of gallons) 4,000 4,000 4,000 4,000 4,000 4,000 4,000 4,000 5,800 5,800
SewerSanitary sewer (miles) 23 23 23 23 23 23 23 23 38 38Storm sewers (miles) 4 4 4 4 4 4 4 4 5 5.2
N/A - Not Available
Note: Obtained from City of Florida City Records
LAST TEN FISCAL YEARSCAPITAL ASSET STATISTICS BY FUNCTION/PROGRAM
CITY OF FLORIDA CITY, FLORIDA
105

REPORTING SECTION

Marcum LLP n One Southeast Third Avenue n Suite 1100 n Miami, Florida 33131 n Phone 305.995.9600 n Fax 305.995.9601 n www.marcumllp.com
106
INDEPENDENT AUDITORS’ REPORT ON INTERNAL CONTROL OVER
FINANCIAL REPORTING AND ON COMPLIANCE AND OTHER MATTERS BASED ON AN AUDIT OF FINANCIAL STATEMENTS PERFORMED IN ACCORDANCE
WITH GOVERNMENT AUDITING STANDARDS To the Honorable Mayor and City Commission City of Florida City, Florida We have audited, in accordance with the auditing standards generally accepted in the United States of America and the standards applicable to financial audits contained in Government Auditing Standards issued by the Comptroller General of the United States, the financial statements of the governmental activities, business-type activities, each major fund, and the aggregate remaining fund information of the City of Florida City, Florida (the City) as of and for the fiscal year ended September 30, 2016, and the related notes to the financial statements, which collectively comprise the City’s basic financial statements, and have issued our report thereon dated June 23, 2017. Internal Control Over Financial Reporting In planning and performing our audit of the financial statements, we considered the City’s internal control over financial reporting (internal control) to determine the audit procedures that are appropriate in the circumstances for the purpose of expressing our opinions on the financial statements, but not for the purpose of expressing an opinion on the effectiveness of the City’s internal control. Accordingly, we do not express an opinion on the effectiveness of the City’s internal control.
A deficiency in internal control exists when the design or operation of a control does not allow management or employees, in the normal course of performing their assigned functions, to prevent, or detect and correct, misstatements on a timely basis. A material weakness is a deficiency, or a combination of deficiencies, in internal control, such that there is a reasonable possibility that a material misstatement of the City’s financial statements will not be prevented, or detected and corrected on a timely basis. A significant deficiency is a deficiency, or a combination of deficiencies, in internal control that is less severe than a material weakness, yet important enough to merit attention by those charged with governance.
Our consideration of internal control was for the limited purpose described in the first paragraph of this section and was not designed to identify all deficiencies in internal control that might be material weaknesses or significant deficiencies. Given these limitations, during our audit we did not identify any deficiencies in internal control that we consider to be material weaknesses. However, material weaknesses may exist that have not been identified.

107
Compliance and Other Matters As part of obtaining reasonable assurance about whether the City’s financial statements are free from material misstatement, we performed tests of its compliance with certain provisions of laws, regulations, contracts, and grant agreements, noncompliance with which could have a direct and material effect on the determination of financial statement amounts. However, providing an opinion on compliance with those provisions was not an objective of our audit, and accordingly, we do not express such an opinion. The results of our tests disclosed no instances of noncompliance or other matters that are required to be reported under Government Auditing Standards. Purpose of this Report The purpose of this report is solely to describe the scope of our testing of internal control and compliance and the results of that testing, and not to provide an opinion on the effectiveness of the City’s internal control or on compliance. This report is an integral part of an audit performed in accordance with Government Auditing Standards in considering the City’s internal control and compliance. Accordingly, this communication is not suitable for any other purpose. Miami, Florida June 23, 2017

Marcum LLP n One Southeast Third Avenue n Suite 1100 n Miami, Florida 33131 n Phone 305.995.9600 n Fax 305.995.9601 n www.marcumllp.com
108
MANAGEMENT LETTER IN ACCORDANCE WITH THE RULES OF THE AUDITOR GENERAL OF THE STATE OF FLORIDA
To the Honorable Mayor and City Commission City of Florida City, Florida Report on the Financial Statements We have audited the financial statements of the City of Florida City, Florida (the City) as of and for the fiscal year ended September 30, 2016, and have issued our report thereon dated June 23, 2017. Auditors’ Responsibility We conducted our audit in accordance with auditing standards generally accepted in the United States of America; the standards applicable to financial audits contained in Government Auditing Standards, issued by the Comptroller General of the United States; and Chapter 10.550, Rules of the Auditor General. Other Reports We have issued our Independent Auditors’ Report on Internal Control over Financial Reporting and Compliance and Other Matters Based on an Audit of the Financial Statements Performed in Accordance with Government Auditing Standards; and Independent Accountants’ Report on Compliance Pursuant to Section 218.415 Florida Statutes, regarding compliance requirements in accordance with Chapter 10.550, Rules of the Auditor General. Disclosures in those reports, which are dated June 23, 2017, should be considered in conjunction with this management letter. Prior Audit Findings Section 10.554(1)(i)1., Rules of the Auditor General, requires that we determine whether or not corrective actions have been taken to address findings and recommendations made in the preceding annual financial audit report. There were no recommendations made in the preceding annual financial audit report.

109
Official Title and Legal Authority Section 10.554(1)(i)4., Rules of the Auditor General, requires that the name or official title and legal authority for the primary government and each component unit of the reporting entity be disclosed in this management letter, unless disclosed in the notes to the financial statements. The City has made these disclosures in the notes to the financial statements. Financial Condition Section 10.554(1)(i)5.a. and 10.556(7), Rules of the Auditor General, requires that we apply appropriate procedures and report the results of our determination as to whether or not the City has met one or more of the conditions described in Section 218.503(1), Florida Statutes, and identification of the specific condition(s) met. In connection with our audit, we determined that the City did not meet any of the conditions described in Section 218.503(1), Florida Statutes. Pursuant to Sections 10.554(1)(i)5.c. and 10.556(8), Rules of the Auditor General, we applied financial condition assessment procedures. It is management’s responsibility to monitor the City’s financial condition, and our financial condition assessment was based in part on representations made by management and the review of financial information provided by same. This assessment was done as of the fiscal year end. Annual Financial Report Section 10.554(1)(i)5.b. and 10.556(7), Rules of the Auditor General, requires that we apply appropriate procedures and report the results of our determination as to whether the annual financial report for the City for the fiscal year ended September 30, 2016, filed with the Florida Department of Financial Services pursuant to Section 218.32(1)(a), Florida Statutes, is in agreement with the annual financial audit report for the fiscal year ended September 30, 2016. In connection with our audit, we determined that these two reports were in agreement. Special District Component Units Section 10.554(1)(i)5.d., Rules of the Auditor General, requires that we determine whether or not a special district that is a component unit of a county, municipality, or special district, provided the financial information necessary for proper reporting of the component unit, within the audited financial statements of the county, municipality, or special district in accordance with Section 218.39(3)(b), Florida Statutes. In connection with our audit, we determined that the special district component unit provided the necessary information for proper reporting in accordance with Section 218,39(3)(b), Florida Statutes. Other Matters Section 10.554(1)(i)2., Rules of the Auditor General, requires that we address in the management letter any recommendations to improve financial management. In connection with our audit, we did not have any such recommendations. Such recommendations are included in Current Year Findings and Recommendations to Improve Financial Management as item ML 2016-01.

110
Section 10.554(1)(i)3., Rules of the Auditor General, requires that we address noncompliance with provisions of contracts or grant agreements, or abuse, that have occurred, or are likely to have occurred, that have an effect on the financial statements that is less than material but which warrants the attention of those charged with governance. In connection with our audit, we did not have any such findings. Purpose of this Letter Our management letter is intended solely for the information and use of the Legislative Auditing Committee, members of the Florida Senate and the Florida House of Representatives, the Florida Auditor General, Federal, State and other granting agencies, the Honorable Mayor, City Commission, and applicable management, and is not intended to be and should not be used by anyone other than these specified parties. Miami, Florida June 23, 2017

111
CITY OF FLORIDA CITY, FLORIDA
CURRENT YEAR FINDINGS AND RECOMMENDATIONS TO IMPROVE FINANCIAL MANAGEMENT
ML 2016-001 Lack of a Formal Investment Policy for the Elected Officials Retirement Plan Observation Section 112.661, Florida Statutes, states that a written investment policy be adopted by a pension plan’s (the Plan) Board of Trustees (the Board) to maximize the financial return to Plan consistent with the risks incumbent in each investment and shall be structured to establish and maintain an appropriate diversification of the Plan’s assets. In connection with our audit, we noted that the Elected Officials Retirement Plan did not have a formal investment policy in place as of yet. Currently, Plan investments are being held in a money market savings account and therefore not maximizing the financial return to the Plan. Recommendation We recommend that the Plan’s Board establish a formal investment policy in accordance with Section 112.661, Florida Statutes. Views of Responsible Officials and Planned Corrective Actions The City will endeavor to create an investment policy for the Elected Official’s Pension Plan by the end of this calendar year, 2017.

Marcum LLP n One Southeast Third Avenue n Suite 1100 n Miami, Florida 33131 n Phone 305.995.9600 n Fax 305.995.9601 n www.marcumllp.com
112
INDEPENDENT ACCOUNTANTS’ REPORT ON COMPLIANCE PURSUANT TO SECTION 218.415 FLORIDA STATUTES
To The Honorable Mayor and City Commission City of Florida City, Florida We have examined the City of Florida City’s (the City) compliance with Section 218.415 Florida Statutes for the fiscal year ended September 30, 2016. Management is responsible for the City’s compliance with the specified requirements. Our responsibility is to express an opinion on the City’s compliance based on our examination. Our examination was conducted in accordance with attestation standards established by the American Institute of Certified Public Accountants. Those standards require that we plan and perform the examination to obtain reasonable assurance about whether the City complied, in all material respects, with the specified requirements referenced above. An examination involves performing procedures to obtain evidence about whether the City complied with the specified requirements. The nature, timing, and extent of the procedures selected depend on our judgment, including an assessment of the risks of material noncompliance, whether due to fraud or error. We believe that the evidence we obtained is sufficient and appropriate to provide a reasonable basis for our opinion. Our examination does not provide a legal determination on the City’s compliance with specified requirements. In our opinion, the City complied, in all material respects, with Section 218.415 Florida Statutes for the fiscal year ended September 30, 2016. This report is intended to describe our testing of compliance with Section 218.415 Florida Statutes and it is not suitable for any other purpose. Miami, FL June 23, 2017