city of fort worth, texasfortworthtexas.gov/files/d8d5bcd3-b77e-46e0-9d2c-3c86cc... ·...
TRANSCRIPT

City of Fort Worth, Texas Monthly Financial Report
For the Fiscal Period Ended October 31, 2017(Unaudited)

City of Fort Worth, TexasFiscal Period Ended October 31, 2017
CONTENTSPAGE
Transmittal Letter................................................................................................................................................................................................................................................................................................................................................................................................................................................................................................................................1
Executive Summary................................................................................................................................................................................................................................................................................................................................................................................................................................................................................................................................3
Governmental Funds
General Fund
General Fund................................................................................................................................................................................................................................................................................................................................................................................................................................................................................................................................11
General Fund Departmental Schedules
City Attorney's Office................................................................................................................................................................................................................................................................................................................................................................................................................................................................................................................................15
City Auditor's Office................................................................................................................................................................................................................................................................................................................................................................................................................................................................................................................................16
City Manager's Office................................................................................................................................................................................................................................................................................................................................................................................................................................................................................................................................17
City Secretary's Office................................................................................................................................................................................................................................................................................................................................................................................................................................................................................................................................18
Code Compliance Department................................................................................................................................................................................................................................................................................................................................................................................................................................................................................................................................19
Communications and Public Engagement Department................................................................................................................................................................................................................................................................................................................................................................................................................................................................................................................................20
Economic Development Department................................................................................................................................................................................................................................................................................................................................................................................................................................................................................................................................21
Financial Management Services Department................................................................................................................................................................................................................................................................................................................................................................................................................................................................................................................................22
Fire Department................................................................................................................................................................................................................................................................................................................................................................................................................................................................................................................................23
Human Resources Department................................................................................................................................................................................................................................................................................................................................................................................................................................................................................................................................24
Library Department................................................................................................................................................................................................................................................................................................................................................................................................................................................................................................................................25
Municipal Courts Department................................................................................................................................................................................................................................................................................................................................................................................................................................................................................................................................26
Neighborhood Services Department................................................................................................................................................................................................................................................................................................................................................................................................................................................................................................................................27
Non-Departmental................................................................................................................................................................................................................................................................................................................................................................................................................................................................................................................................28
Parks and Recreation Department................................................................................................................................................................................................................................................................................................................................................................................................................................................................................................................................29
Performance and Budget Department................................................................................................................................................................................................................................................................................................................................................................................................................................................................................................................................30
Planning and Development Department................................................................................................................................................................................................................................................................................................................................................................................................................................................................................................................................31
Police Department................................................................................................................................................................................................................................................................................................................................................................................................................................................................................................................................32
Property Management Department................................................................................................................................................................................................................................................................................................................................................................................................................................................................................................................................33
Transportation and Public Works Department................................................................................................................................................................................................................................................................................................................................................................................................................................................................................................................................34
Wastewater Department................................................................................................................................................................................................................................................................................................................................................................................................................................................................................................................................35
Water Department................................................................................................................................................................................................................................................................................................................................................................................................................................................................................................................................36
Endowment Funds
PARD Endowment Gas Lease Fund................................................................................................................................................................................................................................................................................................................................................................................................................................................................................................................................38
General Endowment Gas Lease Fund................................................................................................................................................................................................................................................................................................................................................................................................................................................................................................................................40

City of Fort Worth, TexasFiscal Period Ended October 31, 2017
CONTENTSPAGE
Governmental Debt Service Funds
General Debt Service Fund................................................................................................................................................................................................................................................................................................................................................................................................................................................................................................................................43
Culture and Tourism Debt Service Fund................................................................................................................................................................................................................................................................................................................................................................................................................................................................................................................................45
Venue Debt Service Fund................................................................................................................................................................................................................................................................................................................................................................................................................................................................................................................................47
Rock Creek PID Debt Service Fund................................................................................................................................................................................................................................................................................................................................................................................................................................................................................................................................49
Special Revenue Funds
Crime Control and Prevention District Fund................................................................................................................................................................................................................................................................................................................................................................................................................................................................................................................................52
Red Light Enforcement Program Fund................................................................................................................................................................................................................................................................................................................................................................................................................................................................................................................................54
Environmental Protection Fund................................................................................................................................................................................................................................................................................................................................................................................................................................................................................................................................56
Special Purpose Fund................................................................................................................................................................................................................................................................................................................................................................................................................................................................................................................................58
Golf Fund................................................................................................................................................................................................................................................................................................................................................................................................................................................................................................................................60
Golf Fund Detailed Schedules
Golf Course Management................................................................................................................................................................................................................................................................................................................................................................................................................................................................................................................................63
Meadowbrook Golf Course................................................................................................................................................................................................................................................................................................................................................................................................................................................................................................................................64
Pecan Valley Golf Course................................................................................................................................................................................................................................................................................................................................................................................................................................................................................................................................65
Rockwood Golf Course................................................................................................................................................................................................................................................................................................................................................................................................................................................................................................................................66
Sycamore Golf Course................................................................................................................................................................................................................................................................................................................................................................................................................................................................................................................................67
Culture and Tourism Funds
Culture and Tourism Fund................................................................................................................................................................................................................................................................................................................................................................................................................................................................................................................................69
Culture and Tourism 2% City Hotel Fund................................................................................................................................................................................................................................................................................................................................................................................................................................................................................................................................71
Culture and Tourism Project Financing Zone Fund................................................................................................................................................................................................................................................................................................................................................................................................................................................................................................................................73
DFW Revenue Sharing Fund................................................................................................................................................................................................................................................................................................................................................................................................................................................................................................................................75
Grant Funds
Grants Operating Federal Fund................................................................................................................................................................................................................................................................................................................................................................................................................................................................................................................................78
Grants Operating State Fund................................................................................................................................................................................................................................................................................................................................................................................................................................................................................................................................80
Grants Operating Other Fund................................................................................................................................................................................................................................................................................................................................................................................................................................................................................................................................82
Asset Forfeiture Funds
Treasury Asset Forfeiture Fund................................................................................................................................................................................................................................................................................................................................................................................................................................................................................................................................85
Justice Asset Forfeiture Fund................................................................................................................................................................................................................................................................................................................................................................................................................................................................................................................................87
State Asset Forfeiture Fund................................................................................................................................................................................................................................................................................................................................................................................................................................................................................................................................89
HIDTA Asset Forfeiture Fund................................................................................................................................................................................................................................................................................................................................................................................................................................................................................................................................91
City of Fort Worth, TexasFiscal Period Ended October 31, 2017
CONTENTSPAGE
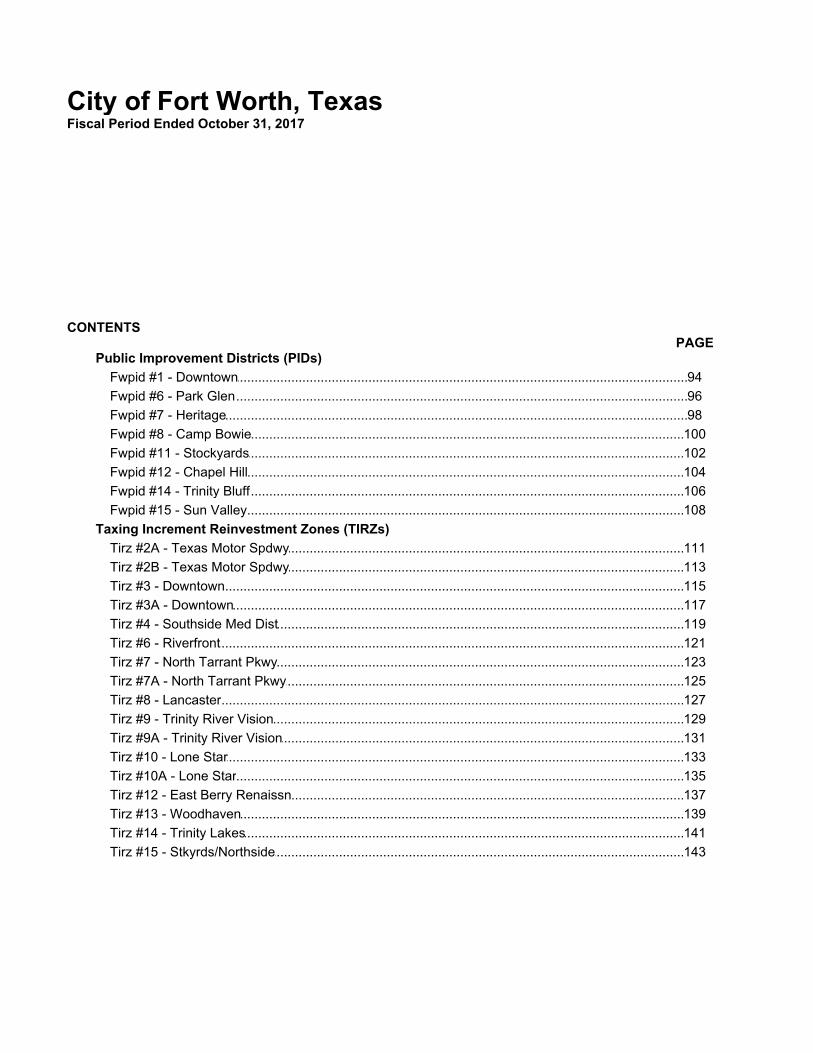
Public Improvement Districts (PIDs)
Fwpid #1 - Downtown................................................................................................................................................................................................................................................................................................................................................................................................................................................................................................................................94
Fwpid #6 - Park Glen................................................................................................................................................................................................................................................................................................................................................................................................................................................................................................................................96
Fwpid #7 - Heritage................................................................................................................................................................................................................................................................................................................................................................................................................................................................................................................................98
Fwpid #8 - Camp Bowie................................................................................................................................................................................................................................................................................................................................................................................................................................................................................................................................100
Fwpid #11 - Stockyards................................................................................................................................................................................................................................................................................................................................................................................................................................................................................................................................102
Fwpid #12 - Chapel Hill................................................................................................................................................................................................................................................................................................................................................................................................................................................................................................................................104
Fwpid #14 - Trinity Bluff................................................................................................................................................................................................................................................................................................................................................................................................................................................................................................................................106
Fwpid #15 - Sun Valley................................................................................................................................................................................................................................................................................................................................................................................................................................................................................................................................108
Taxing Increment Reinvestment Zones (TIRZs)
Tirz #2A - Texas Motor Spdwy................................................................................................................................................................................................................................................................................................................................................................................................................................................................................................................................111
Tirz #2B - Texas Motor Spdwy................................................................................................................................................................................................................................................................................................................................................................................................................................................................................................................................113
Tirz #3 - Downtown................................................................................................................................................................................................................................................................................................................................................................................................................................................................................................................................115
Tirz #3A - Downtown................................................................................................................................................................................................................................................................................................................................................................................................................................................................................................................................117
Tirz #4 - Southside Med Dist................................................................................................................................................................................................................................................................................................................................................................................................................................................................................................................................119
Tirz #6 - Riverfront................................................................................................................................................................................................................................................................................................................................................................................................................................................................................................................................121
Tirz #7 - North Tarrant Pkwy................................................................................................................................................................................................................................................................................................................................................................................................................................................................................................................................123
Tirz #7A - North Tarrant Pkwy................................................................................................................................................................................................................................................................................................................................................................................................................................................................................................................................125
Tirz #8 - Lancaster................................................................................................................................................................................................................................................................................................................................................................................................................................................................................................................................127
Tirz #9 - Trinity River Vision................................................................................................................................................................................................................................................................................................................................................................................................................................................................................................................................129
Tirz #9A - Trinity River Vision................................................................................................................................................................................................................................................................................................................................................................................................................................................................................................................................131
Tirz #10 - Lone Star................................................................................................................................................................................................................................................................................................................................................................................................................................................................................................................................133
Tirz #10A - Lone Star................................................................................................................................................................................................................................................................................................................................................................................................................................................................................................................................135
Tirz #12 - East Berry Renaissn................................................................................................................................................................................................................................................................................................................................................................................................................................................................................................................................137
Tirz #13 - Woodhaven................................................................................................................................................................................................................................................................................................................................................................................................................................................................................................................................139
Tirz #14 - Trinity Lakes................................................................................................................................................................................................................................................................................................................................................................................................................................................................................................................................141
Tirz #15 - Stkyrds/Northside................................................................................................................................................................................................................................................................................................................................................................................................................................................................................................................................143

City of Fort Worth, TexasFiscal Period Ended October 31, 2017
CONTENTSPAGE
Other Special Revenue Funds
Special Donations Legacy Fund................................................................................................................................................................................................................................................................................................................................................................................................................................................................................................................................146
Special Donations Fund................................................................................................................................................................................................................................................................................................................................................................................................................................................................................................................................148
Library Special Revenue Fund................................................................................................................................................................................................................................................................................................................................................................................................................................................................................................................................150
Community Tree Planting Program Fund................................................................................................................................................................................................................................................................................................................................................................................................................................................................................................................................152
Lake Worth Trust Fund................................................................................................................................................................................................................................................................................................................................................................................................................................................................................................................................154
Alliance Maintenance Facility................................................................................................................................................................................................................................................................................................................................................................................................................................................................................................................................156
Botanic Gardens................................................................................................................................................................................................................................................................................................................................................................................................................................................................................................................................158
Proprietary Funds
Enterprise Funds
Major Enterprise Funds
Water and Sewer Fund................................................................................................................................................................................................................................................................................................................................................................................................................................................................................................................................163
Stormwater Utility Fund................................................................................................................................................................................................................................................................................................................................................................................................................................................................................................................................166
Nonmajor Enterprise Funds
Municipal Airport Fund................................................................................................................................................................................................................................................................................................................................................................................................................................................................................................................................169
Municipal Airport Fund Detailed Schedules
General Administration................................................................................................................................................................................................................................................................................................................................................................................................................................................................................................................................172
Alliance Airport................................................................................................................................................................................................................................................................................................................................................................................................................................................................................................................................173
Meacham Airport................................................................................................................................................................................................................................................................................................................................................................................................................................................................................................................................174
Spinks Airport................................................................................................................................................................................................................................................................................................................................................................................................................................................................................................................................175
Municipal Parking Fund................................................................................................................................................................................................................................................................................................................................................................................................................................................................................................................................176
Municipal Parking Fund Detailed Schedules
Management................................................................................................................................................................................................................................................................................................................................................................................................................................................................................................................................179
Surface Lots................................................................................................................................................................................................................................................................................................................................................................................................................................................................................................................................180
Parking Meters................................................................................................................................................................................................................................................................................................................................................................................................................................................................................................................................181
Taylor Street Parking Garage................................................................................................................................................................................................................................................................................................................................................................................................................................................................................................................................182
Commerce Street Parking Garage................................................................................................................................................................................................................................................................................................................................................................................................................................................................................................................................183
Houston Street Parking Garage................................................................................................................................................................................................................................................................................................................................................................................................................................................................................................................................184
Western Heritage Parking Garage................................................................................................................................................................................................................................................................................................................................................................................................................................................................................................................................185
Solid Waste Fund................................................................................................................................................................................................................................................................................................................................................................................................................................................................................................................................186

City of Fort Worth, TexasFiscal Period Ended October 31, 2017
CONTENTSPAGE
Enterprise Debt Service Funds
Water Prior Lien Debt Service Fund................................................................................................................................................................................................................................................................................................................................................................................................................................................................................................................................189
Water Sub Lien Debt Service Fund................................................................................................................................................................................................................................................................................................................................................................................................................................................................................................................................191
Water Debt Reserve Fund................................................................................................................................................................................................................................................................................................................................................................................................................................................................................................................................193
Stormwater Debt Service Fund................................................................................................................................................................................................................................................................................................................................................................................................................................................................................................................................195
Municipal Parking Debt Service Fund................................................................................................................................................................................................................................................................................................................................................................................................................................................................................................................................197
Solid Waste Debt Service Fund................................................................................................................................................................................................................................................................................................................................................................................................................................................................................................................................199
Internal Service Funds
Equipment Services Fund................................................................................................................................................................................................................................................................................................................................................................................................................................................................................................................................202
Capital Project Services Fund................................................................................................................................................................................................................................................................................................................................................................................................................................................................................................................................204
Information Systems Fund................................................................................................................................................................................................................................................................................................................................................................................................................................................................................................................................206
Group Health and Life Insurance Fund................................................................................................................................................................................................................................................................................................................................................................................................................................................................................................................................208
Risk Financing Fund................................................................................................................................................................................................................................................................................................................................................................................................................................................................................................................................210
Fiduciary Funds
Retiree Healthcare Trust Fund................................................................................................................................................................................................................................................................................................................................................................................................................................................................................................................................213
Additional Schedules
Schedule of Transfers In and Transfers Out ................................................................................................................................................................................................................................................................................................................................................................................................................................................................................................................................216
Schedule of Advances To and Advances From................................................................................................................................................................................................................................................................................................................................................................................................................................................................................................................................218
Schedule of Due To and Due From................................................................................................................................................................................................................................................................................................................................................................................................................................................................................................................................219
Delegated Purchasing Authority Report................................................................................................................................................................................................................................................................................................................................................................................................................................................................................................................................220

DEPARTMENT OF FINANCETHE CITY OF FORT WORTH * 200 TEXAS STREET * FORT WORTH, TEXAS 76102
(817) 392-8500 * FAX (817) 392-8502
November 22, 2017
The Honorable Mayor, City Council and City ManagerCity of Fort Worth, Texas
Ladies and Gentlemen:
We are pleased to submit the Monthly Financial Report for the month ended October 31, 2017. This report contains information pertaining to WKH�&LW\¶V�2SHUDWLQJ�)XQGV���*RYHUQPHQWDO�)XQGV�XVH�WKH�6FKHGXOH�RI�Revenues and Expenditures and the Schedule of Assets, Liabilities, Deferred Inflows of Resources, and Fund Balance (Deficit). Proprietary Funds use the Schedule of Revenues and Expenses and the Schedule of Assets, Liabilities, Deferred Inflows of Resources, and Net Position (Deficit).
The October report now includes the addition of Retiree Healthcare Trust Fund, which use the Schedule of Changes in Fiduciary Net Position and the Schedule of Assets, Liabilities, Deferred Inflows of Resources, and Fiduciary Net Position (Deficit).
The financial statements presented within this report are done on a budget-to-actual basis, with calculated variances between these figures. The budget-to-actual financial statements do not reflect any adjustments to present this information in conformity with Generally Accepted Accounting Principles (GAAP). The October report highlights variances that are calculated at 8.3% plus or minus 10%, to reflect the completion of one month of the fiscal year.
7KH�3URSULHWDU\�)XQGV¶�6FKHGXOH�RI�$VVHWV��/LDELOLWies, Deferred Inflows of Resources, and Net Position (Deficit) for FY2018 reflects operational activities and excludes account balances from the following categories: Prepaids, Noncurrent Assets (i.e. Capital Assets, etc.), and Long-Term Liabilities.
InclXGHG�RQ�WKH�IROORZLQJ�SDJHV�LV�DQ�([HFXWLYH�6XPPDU\�RI�WKH�&LW\¶V�SULPDU\ Governmental Funds, with highlights for the month of October, an overview of assets, liabilities, deferred inflows of resources, and fund balance, and a comparison of actual revenues to actual expenditures is presented. Future versions of the Executive Summary will include highlights from Proprietary Funds and Fiduciary Funds.
Also included within this report is a Schedule of Transfers In and Transfers Out, a Schedule of Advances To and Advances From, and a Schedule of Due To and Due From.
A Delegated Purchasing Authority Report is included to show what purchases, contracts, and change orders were done XQGHU�WKH�&LW\�0DQDJHU¶V�DXWKRULW\�IRU�the fiscal year to date through October 2017.
Accounts Payable and Accrued Payroll accounts fluctuate between periods and when compared to the prior year due to timing of disbursements to employees, vendors, etc. at the end of the month.
In order to close the General Ledger on a timely basis, investment income is recorded one month in arrears.
Asset, Liability, and beginning Fund Balance amounts for the Funds are subject to change from month to month until the audit for FY2017 is complete and the General Ledger is closed.
The PDF comes fully bookmarked for your convenience.
1
DEPARTMENT OF FINANCETHE CITY OF FORT WORTH * 200 TEXAS STREET * FORT WORTH, TEXAS 76102
(817) 392-8500 * FAX (817) 392-8502
If you have any questions about this information, please feel free to contact me at 817-392-8500.
Respectfully Submitted,
Aaron J. BovosChief Financial Officer
2

�
+LJKOLJKWV�IRU�WKLV�PRQWK¶V�UHSRUW�LQFOXGH�WKH�IROORZLQJ��x� *HQHUDO�)XQG��
��
�
2WKHU�/RFDO�7D[HV�UHYHQXHV��VSHFLILFDOO\�WKH�6WDWH�0L[HG�%HYHUDJH�7D[�DV�VKRZQ�RQ�SDJH�2��KDYH�FRPH�LQ�VWURQJ�DQG�DUH�FRQVLVWHQW�ZLWK�ZKDW�WKH\�ZHUH�LQ� WKH�VDPH�SHULRG�ODVW�\HDU���:KLOH�)UDQFKLVH�)HHV�KDYH�DOVR�FRPH�LQ�VWURQJ�DV�RI�WKH�UHSRUWLQJ�SHULRG��DV�VKRZQ RQ�SDJH��2��WKH\�UHIOHFW�VOLJKW�GHFUHDVHV��ZKHQ�FRPSDUHG�WR�WKLV�VDPH�SHULRG�ODVW�\HDU�����'HSDUWPHQWDO�H[SHQGLWXUHV�LQ�WKH�*HQHUDO�)XQG�DUH�ZLWKLQ�EXGJHWHG�H[SHFWDWLRQV���
x� 3URSHUW\�7D[HV��)RU�)<������WKH�&LW\¶V�FRPELQHG�SURSHUW\�WD[�UDWH�ZDV�ORZHUHG�WR���������SHU������RI�DVVHVVHG�YDOXDWLRQ�ZLWK� D� ����� SHUFHQW� FROOHFWLRQ� UDWH�� �%DVHG� RQ� WKH�0DLQWHQDQFH� DQG�2SHUDWLRQV�OHY\�UDWH�RI���������SHU������RI�DVVHVVHG�YDOXDWLRQ��WKH�*HQHUDO�)XQG�3RUWLRQ�RI�WKH�SURSHUW\�WD[�UDWH�LV�H[SHFWHG�WR�\LHOG�DSSUR[LPDWHO\��������PLOOLRQ�LQ�UHYHQXH�IRU�)<�������7KH�GHEW�VHUYLFH�OHY\�UDWH�RI���������SHU������RI�DVVHVVHG�YDOXDWLRQ�LV�H[SHFWHG�WR� \LHOG� DSSUR[LPDWHO\� ������ PLOOLRQ�� ZKLFK� ZLOO� DOORZ� UHSD\PHQW� RI� DOO� FXUUHQW� DQG�SURSRVHG�GHEW�REOLJDWLRQV��H[FHUSW�IURP�)<�����UHFRPPHQGHG�EXGJHW��SDJH�������3URSHUW\�WD[�ELOOV�DUH�PDLOHG�RQ�2FWREHU����RU�DV�VRRQ�DV�SRVVLEOH�WKHUHDIWHU��WR�UHDO�DQG�EXVLQHVV� SHUVRQDO� SURSHUW\� RZQHUV� WKURXJKRXW� 7DUUDQW� &RXQW\�� � 7KH� FXUUHQW� FROOHFWLRQ�SHULRG�EHJLQV�LQ�2FWREHU�ZLWK�WKH�IXOO�DPRXQW�GXH�RQ�-DQXDU\�������������3URSHUW\� WD[HV�DUH�GHOLQTXHQW� LI� QRW�SDLG�EHIRUH�)HEUXDU\���������� �3HQDOW\�EHJLQV�DW���SHUFHQW�DQG�LQFUHDVHV�PRQWKO\�WR�D�PD[LPXP�RI����SHUFHQW�LQ�-XO\��������,QWHUHVW�EHJLQV�WR�DFFUXH�DW�WKH�UDWH�RI���SHUFHQW�SHU�PRQWK�XQWLO�WKH�DFFRXQW�LV�SDLG�LQ�IXOO�����2Q�-XO\����������DOO�GHOLQTXHQW�DFFRXQWV� IRU� WKH�FXUUHQW�\HDU�DUH� WXUQHG�RYHU� WR� WKH� WD[�DWWRUQH\V�IRU�FROOHFWLRQ���$�FROOHFWLRQ�SHQDOW\�XS�WR����SHUFHQW�RI�WKH�WRWDO�XQSDLG�EDODQFH�LV�DGGHG�WR�WKH�FXUUHQW�GHOLQTXHQW�FROOHFWLRQ�IHH���
x� *RYHUQPHQWDO�'HEW�6HUYLFH�)XQGV���9HQXH�'HEW�6HUYLFH�)XQG��7KLV�)XQG�ZDV�HVWDEOLVKHG�LQ�-XO\������WR�UHSD\�ERUURZHG�IXQGV�IRU�'LFNLHV�$UHQD�DQG�DVVRFLDWHG�IDFLOLWLHV�WKDW�ZLOO�DGG�WR�WKH�WRXULVP�DWWUDFWLRQV�LQ�WKH�&LW\�RI�)RUW�:RUWK����5RFN�&UHHN�3,'�'HEW�6HUYLFH�)XQG��7KLV�)XQG�ZDV�HVWDEOLVKHG�LQ�6HSWHPEHU������WR�UHSD\�ERUURZHG�IXQGV�IRU�SURYLGLQJ�PDMRU�LPSURYHPHQWV�DV�RXWOLQHG�LQ�WKH�)RUW�:RUWK�3XEOLF�,PSURYHPHQW�'LVWULFW�1R�����6HUYLFH�DQG�$VVHVVPHQW�SODQ��DQG�WR�IXQG�WKH�UHTXLUHG�UHVHUYH�DQG�FDSLWDOL]HG�LQWHUHVW�DFFRXQWV����
� �
([HFXWLYH�6XPPDU\�
3

�x� $GRSWLRQ�RI�7KLUW\�)LUVW�6XSSOHPHQWDO�2UGLQDQFH�$XWKRUL]LQJ�,VVXDQFH�DQG�6DOH�RI�
Water�DQG�6HZHU�6\VWHP�5HYHQXH�%RQGV��6HULHV�����%��2Q� 2FWREHU� ���� ������ WKH� 0D\RU� DQG� &RXQFLO� DGRSWHG� WKH� 7KLUW\�)LUVW� 6XSSOHPHQWDO�2UGLQDQFH� DXWKRUL]LQJ� LVVXDQFH� DQG� VDOH� RI�:DWHU� DQG� 6HZHU� 6\VWHP�5HYHQXH�%RQGV��6HULHV�����%��LQ�WKH�DJJUHJDWH�SULQFLSDO�DPRXQW�RI����������������DQG�DSSURYLQJ�WKH�VDOH�RI�WKH�ERQGV�WR�WKH�7H[DV�:DWHU�'HYHORSPHQW�%RDUG����
�%RQG�SURFHHGV�ZLOO�EH�XVHG�WR�IXQG�WKH�VHFRQG�SKDVH�RI�WKH�WZR�SDUW�VXEVLGL]HG�ILQDQFLQJ�IRU� LPSOHPHQWDWLRQ�RI� WKH�PXOWL�SKDVH�$GYDQFHG�0HWHULQJ� ,QIUDVWUXFWXUH� �$0,��3URMHFW�DORQJ�ZLWK�DQ�DXWRPDWHG�OHDN�GHWHFWLRQ�V\VWHP���6DOH�RI�WKHVH�ERQGV�LV�SURMHFWHG�WR�FORVH�RQ�1RYHPEHU�����������DQG�WKH�SURFHHGV�ZLOO�EH�XVHG�WR�SD\�IRU�ILQDO�SKDVHV�RI�WKH�SURMHFW��IXQGLQJ�D�UHVHUYH�IXQG�IRU�WKH�ERQGV��DQG�SD\LQJ�WKH�FRVWV�RI�LVVXDQFH�����7KH�SODQQHG�SURMHFW�FRPHV�XQGHU� WKH�DXVSLFHV�RI�7:'%V�6WDWH�:DWHU� ,PSOHPHQWDWLRQ�5HYHQXH�)XQG�IRU�7H[DV��6:,5)7��3URJUDP��ZKLFK�SURYLGHV�ORZ�FRVW�ILQDQFLDO�DVVLVWDQFH�IRU�HOLJLEOH�SURMHFWV�� �7KH�VXEVLGL]HG� LQWHUHVW� UDWHV�RIIHUHG�E\� WKH�SURJUDP�DUH� OHVV� WKDQ�WUDGLWLRQDO�GHEW�ILQDQFLQJ�FRVWV�� �7KH�HVWLPDWHG�ERUURZLQJ�FRVW� IRU� WKLV�GHEW� LVVXDQFH� LV������SHUFHQW���
� �
4

�
�
)RU�RXU�SULPDU\�IXQGV��WKH�FKDUWV�EHORZ�DQG�RQ�WKH�IROORZLQJ�SDJH�SURYLGH�D�KLJK�OHYHO�RYHUYLHZ�RI�$VVHWV��/LDELOLWLHV��'HIHUUHG�,QIORZV�RI�5HVRXUFHV��DQG�)XQG�%DODQFH��DV�ZHOO�DV�)<�����(QGLQJ�)XQG�%DODQFH�DQG�)<�����%XGJHWHG�(QGLQJ�)XQG�%DODQFH���$OO�IXQGV�KDYH�D�SRVLWLYH�HQGLQJ�)XQG�%DODQFH������
�
�
����������
ΨϰϵϮ͕ϯϲϵ͕ϯϵϰ�
ΨϮϯ͕ϰϲϵ͕ϵϵϯ�
ΨϯϳϬ͕ϱϭϬ͕ϳϱϳ�
Ψϵϴ͕ϯϴϴ͕ϲϰϰ�
����������
������ ����������� ����������������������������� �����������
&zϮϬϭϳ��ŶĚŝŶŐ�&ƵŶĚ��ĂůĂŶĐĞ͗�ΨϭϬϴ͕ϳϬϱ͕ϱϬϱ
&zϮϬϭϴ��ƵĚŐĞƚĞĚ��ŶĚŝŶŐ�&ƵŶĚ��ĂůĂŶĐĞ͗�ΨϭϬϴ͕ϳϬϱ͕ϱϬϱ
ΨϭϮϭ͕ϰϱϭ͕ϳϳϬ�
Ψϵϰ͕ϲϮϮ͕ϮϮϱ�
ΨϮϲ͕ϴϮϵ͕ϱϰϱ�
�����������������������
������ ����������������������������� �����������
&zϮϬϭϳ��ŶĚŝŶŐ�&ƵŶĚ��ĂůĂŶĐĞ͗�ΨϮϰ͕ϬϯϮ͕ϬϮϴ
&zϮϬϭϴ��ƵĚŐĞƚĞĚ��ŶĚŝŶŐ�&ƵŶĚ��ĂůĂŶĐĞ͗�Ψϯϰ͕ϬϬϯ͕ϱϯϲ
Ψϭ͕ϲϴϴ͕ϭϯϳ�
Ψϴϵ͕ϴϳϯ�
Ψϭ͕ϱϵϴ͕Ϯϲϰ�
����������������������������
������ ����������� �����������
&zϮϬϭϳ��ŶĚŝŶŐ�&ƵŶĚ��ĂůĂŶĐĞ͗�Ψϭ͕ϱϭϱ͕ϰϬϬ��&zϮϬϭϴ��ƵĚŐĞƚĞĚ��ŶĚŝŶŐ�&ƵŶĚ��ĂůĂŶĐĞ͗�Ψϭ͕ϱϭϱ͕ϰϬϬ�
%DODQFH�6KHHW�2YHUYLHZ�
5

��
�
�
�
�� �
Ψϭϲ͕ϰϲϲ͕ϵϭϵ�
Ψϭ͕ϴϬϱ͕ϬϭϮ�
Ψϭϰ͕ϲϲϭ͕ϵϬϳ�
�����������������������������������������
������ ����������� �����������
Ψϳ͕ϰϱϬ͕ϰϬϱ�
ΨϮ͕ϲϴϭ͕ϱϵϭ�
Ψϰ͕ϳϲϴ͕ϴϭϰ�
���������������������������������
������ ����������� �����������
ΨϮϵϰ͕ϳϴϭ�
Ψϭϴϰ͕ϰϴϴ�
ΨϭϭϬ͕Ϯϵϯ�
�������
������ ����������� �����������
Ψϭϰ͕ϱϭϴ͕Ϭϵϲ�
ΨϮ͕ϲϭϲ͕ϯϲϰ�
Ψϭϭ͕ϵϬϭ͕ϳϯϮ�
�����������������������
������ ����������� �����������
&zϮϬϭϳ��ŶĚŝŶŐ�&ƵŶĚ��ĂůĂŶĐĞ͗�Ψϭϭ͕ϳϮϯ͕ϮϱϬ
&zϮϬϭϴ��ƵĚŐĞƚĞĚ��ŶĚŝŶŐ�&ƵŶĚ��ĂůĂŶĐĞ͗�Ψϭϭ͕ϳϮϯ͕ϮϱϬ
&zϮϬϭϳ��ŶĚŝŶŐ�&ƵŶĚ��ĂůĂŶĐĞ͗�Ψϰ͕ϲϬϮ͕ϲϮϭ�
�&zϮϬϭϴ��ƵĚŐĞƚĞĚ��ŶĚŝŶŐ�&ƵŶĚ��ĂůĂŶĐĞ͗�Ψϰ͕ϴϬϯ͕ϱϲϭ�
&zϮϬϭϳ��ŶĚŝŶŐ�&ƵŶĚ��ĂůĂŶĐĞ͗�ΨϬ��&zϮϬϭϴ��ƵĚŐĞƚĞĚ��ŶĚŝŶŐ�&ƵŶĚ��ĂůĂŶĐĞ͗�ΨϬ�
&zϮϬϭϳ��ŶĚŝŶŐ�&ƵŶĚ��ĂůĂŶĐĞ͗�Ψϭϯ͕ϴϴϰ͕ϯϴϴ��&zϮϬϭϴ��ƵĚŐĞƚĞĚ��ŶĚŝŶŐ�&ƵŶĚ��ĂůĂŶĐĞ͗�Ψϭϯ͕ϴϴϰ͕ϯϴϴ�
6

�
�)RU�RXU�SULPDU\�IXQGV��WKH�FKDUWV�EHORZ�DQG�RQ�WKH�IROORZLQJ�SDJH�SURYLGH�D�KLJK�OHYHO�RYHUYLHZ�RI�DFWXDO�UHYHQXHV�FRPSDUHG�WR�DFWXDO�H[SHQGLWXUHV��H[FOXGLQJ�RWKHU�ILQDQFLQJ�VRXUFHV���XVHV��IRU�FXUUHQW� ILVFDO� \HDU�WR�GDWH� DFWLYLWLHV�� �$FWXDO� UHYHQXHV� H[FHHG� DFWXDO� H[SHQGLWXUHV� IRU� DOO� IXQGV��H[FHSW�WKH�*HQHUDO�)XQG���*HQHUDO�'HEW�6HUYLFH�)XQG�SD\V�LQWHUHVW�VHPL�DQQXDOO\�LQ�)HEUXDU\�RU�0DUFK� DQG� $XJXVW� RU� 6HSWHPEHU�� DQG� SULQFLSDO� DQQXDOO\� LQ� )HEUXDU\� RU� 0DUFK�� � 7KXV�� QR�H[SHQGLWXUHV�UHFRUGHG�DV�RI�WKH�UHSRUWLQJ�SHULRG�LQ�WKH�*HQHUDO�'HEW�6HUYLFH�)XQG�����
�
�
�������
ΨϯϮ͕ϯϰϯ͕ϯϵϬ�
ΨϰϮ͕Ϭϱϱ͕ϳϬϴ�
����������
������������ ����������������
Ψϭ͕ϰϳϰ͕ϯϰϮ�
ΨͲ
�����������������������
������������ ����������������
DĂũŽƌ��džƉĞŶĚŝƚƵƌĞƐ�ŝŶĐůƵĚĞ͗���Ğďƚ�^ĞƌǀŝĐĞ WĂLJŵĞŶƚƐ
Ψϲ͕ϰϳϲ͕ϬϮϱ�
Ψϯ͕ϴϲϵ͕Ϯϲϰ�
�����������������������������������������
������������ ����������������
DĂũŽƌ��džƉĞŶĚŝƚƵƌĞƐ�ŝŶĐůƵĚĞ͗�ŝǀŝů�^ĞƌǀŝĐĞ��ĂƐĞ�WĂLJ͕�ĂŶĚ�ZĞƚŝƌĞŵĞŶƚ͕�ZĞŐƵůĂƌ��ŵƉůŽLJĞĞ�^ĂůĂƌŝĞƐ͕�ĂŶĚ�KƚŚĞƌ��ŽŶƚƌĂĐƚƵĂů�^ĞƌǀŝĐĞƐ
�$FWXDOV�&RPSDULVRQ�
DĂũŽƌ��džƉĞŶĚŝƚƵƌĞƐ�ŝŶĐůƵĚĞ͗���ŝǀŝů�^ĞƌǀŝĐĞ��ĂƐĞ�WĂLJ�ĂŶĚ�ZĞƚŝƌĞŵĞŶƚ͕�ĂŶĚ�ZĞŐƵůĂƌ��ŵƉůŽLJĞĞ�^ĂůĂƌLJ�
DĂũŽƌ�ZĞǀĞŶƵĞƐ�ŝŶĐůƵĚĞ͗��'ĞŶĞƌĂů�WƌŽƉĞƌƚLJ�dĂdž�
DĂũŽƌ�ZĞǀĞŶƵĞƐ�ŝŶĐůƵĚĞ͗��'ĞŶĞƌĂů�WƌŽƉĞƌƚLJ�dĂdž͕�^ĂůĞƐ�dĂdž͕�ĂŶĚ�&ƌĂŶĐŚŝƐĞ�&ĞĞƐ͘�
DĂũŽƌ�ZĞǀĞŶƵĞƐ�ŝŶĐůƵĚĞ͗�^ĂůĞƐ�dĂdž�
7

��
�
�
�
�����
ΨϯϮϱ͕Ϭϲϱ�
Ψϭϵϳ͕ϱϵϯ�
����������������������������
������������ ����������������
ΨϳϯϮ͕ϲϱϲ�ΨϮϯϰ͕ϵϮϬ�
���������������������������������
������������ ����������������
DĂũŽƌ��džƉĞŶĚŝƚƵƌĞƐ�ŝŶĐůƵĚĞ͗�ĂŵĞƌĂ�>ĞĂƐĞ͕�ĂŶĚ�^ƚĂƚĞ�WĂLJŵĞŶƚ
DĂũŽƌ�ZĞǀĞŶƵĞƐ ŝŶĐůƵĚĞ͗ZĞĚ�>ŝŐŚƚ�&ŝŶĞƐ
Ψϯϵϭ͕ϴϱϯ�
Ψϯϯϭ͕ϳϬϳ�
�������
������������ ����������������
DĂũŽƌ�ZĞǀĞŶƵĞƐ�ŝŶĐůƵĚĞ͗dĂdžĂďůĞ�ĂŶĚ�EŽŶͲdĂdžĂďůĞ��ŚĂƌŐĞƐ�ĨŽƌ�^ĞƌǀŝĐĞƐ
DĂũŽƌ��džƉĞŶĚŝƚƵƌĞƐ�ŝŶĐůƵĚĞ͗ZĞŐƵůĂƌ��ŵƉůŽLJĞĞ�^ĂůĂƌŝĞƐ�
ΨϮ͕ϱϳϱ͕Ϭϱϱ�
ΨϮ͕Ϯϳϰ͕ϰϵϭ�
�����������������������
������������ ����������������
DĂũŽƌ�ZĞǀĞŶƵĞƐ�ŝŶĐůƵĚĞ͗��,ŽƚĞůͬDŽƚĞů�dĂdž�ĂŶĚ��ŽŵŵƵŶŝƚLJ �džŚŝďŝƚ��ƵŝůĚŝŶŐ�>ĞĂƐĞ
DĂũŽƌ��džƉĞŶĚŝƚƵƌĞƐ ŝŶĐůƵĚĞ͗��ZĞŐƵůĂƌ��ŵƉůŽLJĞĞ�^ĂůĂƌŝĞƐ͕�ĂŶĚ�KƚŚĞƌ��ŽŶƚƌĂĐƚƵĂů�^ĞƌǀŝĐĞƐ
DĂũŽƌ�ZĞǀĞŶƵĞƐ�ŝŶĐůƵĚĞ͗��ŶǀŝƌŽŶŵĞŶƚĂů�&ĞĞƐ�
DĂũŽƌ��džƉĞŶĚŝƚƵƌĞƐ�ŝŶĐůƵĚĞ͗��ZĞŐƵůĂƌ��ŵƉůŽLJĞĞ�^ĂůĂƌLJ͕�ĂŶĚ��ŝƐƉŽƐĂů�
8

*29(510(17$/
)81'6

*(1(5$/
)81'

City of Fort WorthGeneral FundSchedule of Assets, Liabilities, Deferred Inflows of Resources, and Fund Balance (Deficit)October 2017, Fiscal Period 1
FY2018 FY2017
ASSETS
Cash, Cash Equivalents, & Investments $ 74,594,555 $ 73,391,661
Cash, Cash Equivalents, & Investments Held byTrustees 451,482 360,000
Receivables, Net of Allowance for Uncollectible:
Taxes 375,256,170 335,849,104
Interest 108,753 811,136
Accounts and Other 39,794,447 40,667,101
Inventories (at Cost) 1,803,834 1,837,271
Prepaids, Deposits, and Other 360,153 268,312
Total Assets $ 492,369,394 $ 453,184,585
LIABILITIES, DEFERRED INFLOWS OF RESOURCES,AND FUND BALANCE (DEFICIT)
Liabilities
Accounts Payable $ 6,889,776 $ 5,298,861
Construction Payable 29,754 29,754
Escrow Accounts Payable 3,097,999 3,111,086
Accrued Payroll 12,453,333 14,671,478
Accrued Interest Payable - 2,476
Other 668,473 480,201
Unearned Revenue 330,658 255,936
Total Liabilities 23,469,993 23,849,792
Deferred Inflows of Resources 370,510,757 334,835,997
Fund Balance (Deficit) 98,388,644 94,498,796
Total Liabilities, Deferred Inflows of Resources,and Fund Balance (Deficit) $ 492,369,394 $ 453,184,585
11

City of Fort WorthGeneral FundSchedule of Revenues and Expenditures for October 2017, Fiscal Period 1
FY2018 FY2017
AdoptedBudget
AmendedBudget Actuals YTD
% Actualsto Budget
Prior YearActuals YTD
% Actuals toPrior Year
Budget
Beginning Fund Balance (Deficit) $ 108,705,505 $ 108,705,505 $ 108,705,505 $ 104,668,506
Revenues:
General Property Tax 371,503,291 371,503,291 5,714,117 %1.5 9,627,802 %2.8
Sales Tax 154,573,000 154,573,000 11,918,838 %7.7 11,101,191 %7.9
Other Local Taxes (1) 4,805,565 4,805,565 1,101,271 %22.9 1,056,471 %22.8
Franchise Fees (2) 49,757,740 49,757,740 9,389,931 %18.9 9,637,179 %19.1
Charges for Services 26,698,246 26,698,246 2,150,047 %8.1 2,341,122 %7.2
Licenses and Permits 16,136,753 16,136,753 1,347,610 %8.4 1,280,098 %9.3
Fines and Forfeitures 6,090,674 6,090,674 533,645 %8.8 525,302 %6.7
Use of Money and Property 472,368 472,368 50,012 %10.6 18,943 %5.6
Investment Income - - 170 %- - %-
Intergovernmental 369,315 369,315 - %- 190,203 %28.9
Other 2,634,064 2,634,064 122,354 %4.6 170,286 %4.0
Contributions 161,699 161,699 15,395 %9.5 648 %330.6
Total Revenues 633,202,715 633,202,715 32,343,390 %5.1 35,949,245 %6.0
Other Financing Sources:
Transfers In 45,730,600 45,730,600 3,662,252 %8.0 2,651,568 %6.2
Total Revenues And Other FinancingSources 678,933,315 678,933,315 36,005,642 %5.3 38,600,813 %5.9
Footnotes:
(1) Other Local Taxes - State Mixed Beverage Tax is in line with prior year's collections for this period.
(2) Franchise Fees - Oncor quarterly payment is in line with prior year's collections for the period.
12

FY2018 FY2017
AdoptedBudget
AmendedBudget Actuals YTD
% Actualsto Budget
Prior YearActuals YTD
% Actuals toPrior Year
Budget
Expenditures:
City Attorney's Office 6,854,668 6,854,668 490,536 %7.2 506,367 %7.9
City Auditor's Office 1,844,889 1,844,889 128,491 %7.0 139,325 %7.7
City Manager's Office 9,089,555 9,095,627 505,975 %5.6 730,864 %8.6
City Secretary's Office 1,591,936 1,591,936 123,116 %7.7 125,607 %7.0
Code Compliance 20,210,080 20,210,080 1,307,867 %6.5 1,516,111 %7.6
Communication and Public Engagement 4,060,413 4,060,413 228,064 %5.6 - %-
Economic Development 17,761,213 17,761,213 216,195 %1.2 217,563 %1.3
Financial Management Services 11,575,697 11,575,697 715,769 %6.2 762,461 %6.7
Fire 144,961,968 144,958,969 10,311,921 %7.1 11,658,048 %8.2
Human Resources 4,550,811 4,550,811 274,013 %6.0 367,089 %7.8
Library 19,954,915 19,954,915 1,236,735 %6.2 1,311,193 %6.7
Municipal Courts 15,910,123 15,910,123 1,124,437 %7.1 1,314,927 %7.5
Neighborhood Services 6,152,882 6,146,810 318,090 %5.2 371,873 %4.1
Non-Departmental (3) 13,508,568 13,508,568 (137) %- - %-
Parks and Recreation 40,768,691 40,768,691 2,745,472 %6.7 3,183,635 %7.7
Performance and Budget 6,157,844 6,157,844 870,361 %14.1 265,634 %4.3
Planning and Development 16,966,584 16,966,584 963,279 %5.7 1,547,809 %11.0
Police 239,552,122 239,555,121 17,950,356 %7.5 18,960,638 %8.1
Property Management 11,280,749 11,280,749 582,674 %5.2 658,804 %6.1
Transportation and Public Works 34,356,504 34,356,504 1,962,494 %5.7 2,074,522 %6.3
Debt Service 880,311 880,311 21,865 %2.5 11,151 %1.3
Total Expenditures 627,990,523 627,990,523 42,077,573 %6.7 45,723,621 %7.6
Other Financing Uses:
Transfers Out 50,942,792 50,942,792 4,244,930 %8.3 3,046,902 %5.1
Total Expenditures and Other FinancingUses 678,933,315 678,933,315 46,322,503 %6.8 48,770,523 %-
Change in Fund Balance (10,316,861) (10,169,710)
Planned Contribution to / (Use of)Fund Balance - -
Estimated Ending Fund Balance (Deficit) $ 108,705,505 $ 108,705,505 $ 98,388,644 $ 94,498,796
Footnotes:
(3) Non-Departmental - Credit balance is due to a payroll adjustment. This will be corrected in the next period.
13

GENERAL FUND
DEPARTMENTAL
SCHEDULES
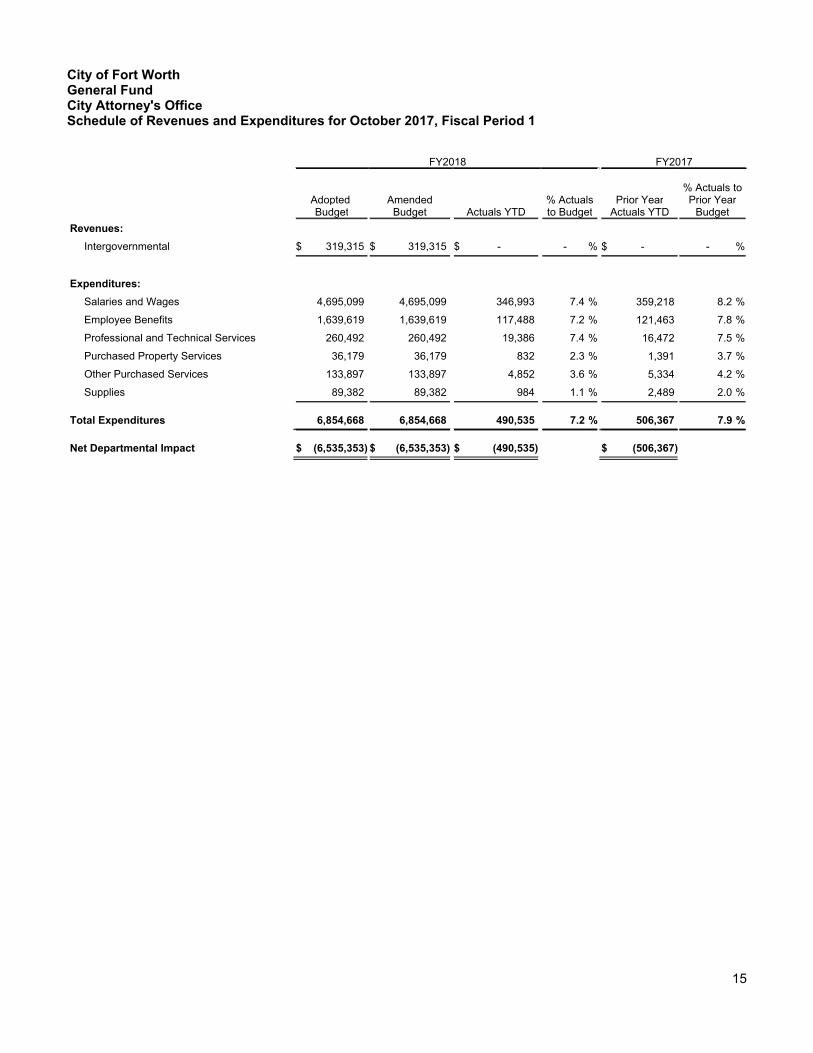
City of Fort WorthGeneral FundCity Attorney's OfficeSchedule of Revenues and Expenditures for October 2017, Fiscal Period 1
FY2018 FY2017
AdoptedBudget
AmendedBudget Actuals YTD
% Actualsto Budget
Prior YearActuals YTD
% Actuals toPrior Year
Budget
Revenues:
Intergovernmental $ 319,315 $ 319,315 $ - %- $ - %-
Expenditures:
Salaries and Wages 4,695,099 4,695,099 346,993 %7.4 359,218 %8.2
Employee Benefits 1,639,619 1,639,619 117,488 %7.2 121,463 %7.8
Professional and Technical Services 260,492 260,492 19,386 %7.4 16,472 %7.5
Purchased Property Services 36,179 36,179 832 %2.3 1,391 %3.7
Other Purchased Services 133,897 133,897 4,852 %3.6 5,334 %4.2
Supplies 89,382 89,382 984 %1.1 2,489 %2.0
Total Expenditures 6,854,668 6,854,668 490,535 %7.2 506,367 %7.9
Net Departmental Impact $ (6,535,353) $ (6,535,353) $ (490,535) $ (506,367)
15

City of Fort WorthGeneral FundCity Auditor's OfficeSchedule of Revenues and Expenditures for October 2017, Fiscal Period 1
FY2018 FY2017
AdoptedBudget
AmendedBudget Actuals YTD
% Actualsto Budget
Prior YearActuals YTD
% Actuals toPrior Year
Budget
Expenditures:
Salaries and Wages $ 1,255,862 $ 1,255,862 $ 88,425 %7.0 $ 97,713 %7.9
Employee Benefits 443,287 443,287 30,420 %6.9 34,363 %7.8
Professional and Technical Services 97,002 97,002 5,998 %6.2 4,741 %7.5
Purchased Property Services 11,198 11,198 214 %1.9 435 %3.7
Other Purchased Services 32,382 32,382 3,434 %10.6 1,967 %4.9
Supplies 5,158 5,158 - %- 106 %1.0
Total Expenditures 1,844,889 1,844,889 128,491 %7.0 139,325 %7.7
Net Departmental Impact $ (1,844,889) $ (1,844,889) $ (128,491) $ (139,325)
16

City of Fort WorthGeneral FundCity Manager's OfficeSchedule of Revenues and Expenditures for October 2017, Fiscal Period 1
FY2018 FY2017
AdoptedBudget
AmendedBudget Actuals YTD
% Actualsto Budget
Prior YearActuals YTD
% Actuals toPrior Year
Budget
Revenues:
Other $ - $ - $ - %- $ 1,606 %-
Other Financing Sources:
Transfers In - - - %- 22,916 %8.3
Total Revenues And Other FinancingSources - - - %- 24,522 %8.9
Expenditures:
Salaries and Wages 3,583,496 3,583,496 275,269 %7.7 388,603 %8.5
Employee Benefits 1,110,472 1,116,544 82,399 %7.4 127,586 %8.5
Professional and Technical Services 3,825,516 3,825,516 85,200 %2.2 118,591 %8.0
Purchased Property Services 128,300 128,300 4,663 %3.6 10,397 %7.2
Other Purchased Services 401,711 401,711 54,907 %13.7 83,501 %11.5
Supplies 40,060 40,060 3,536 %8.8 2,186 %4.2
Total Expenditures 9,089,555 9,095,627 505,974 %5.6 730,864 %8.6
Net Departmental Impact $ (9,089,555) $ (9,095,627) $ (505,974) $ (706,342)
17

City of Fort WorthGeneral FundCity Secretary's OfficeSchedule of Revenues and Expenditures for October 2017, Fiscal Period 1
FY2018 FY2017
AdoptedBudget
AmendedBudget Actuals YTD
% Actualsto Budget
Prior YearActuals YTD
% Actuals toPrior Year
Budget
Revenues:
Charges for Services (1) $ 5,000 $ 5,000 $ 926 %18.5 $ 61 %0.5
Other 500 500 - %- - %-
Total Revenues 5,500 5,500 926 %16.8 61 %0.4
Expenditures:
Salaries and Wages 944,755 944,755 60,495 %6.4 59,548 %7.9
Employee Benefits 417,700 417,700 25,792 %6.2 27,993 %7.9
Professional and Technical Services (2) 137,090 137,090 32,754 %23.9 33,558 %5.8
Purchased Property Services 23,258 23,258 429 %1.8 704 %3.2
Other Purchased Services 63,096 63,096 3,390 %5.4 3,822 %5.9
Supplies 6,037 6,037 257 %4.3 (17) %(0.2)
Total Expenditures 1,591,936 1,591,936 123,117 %7.7 125,608 %7.0
Net Departmental Impact $ (1,586,436) $ (1,586,436) $ (122,191) $ (125,547)
Footnotes:
(1) Charges for Services - Open records fees were higher than anticipated.
(2) Professional and Technical Services - Other contractual service contract completed in this period.
18

City of Fort WorthGeneral FundCode Compliance DepartmentSchedule of Revenues and Expenditures for October 2017, Fiscal Period 1
FY2018 FY2017
AdoptedBudget
AmendedBudget Actuals YTD
% Actualsto Budget
Prior YearActuals YTD
% Actuals toPrior Year
Budget
Revenues:
Charges for Services $ 2,430,478 $ 2,430,478 $ 257,538 %10.6 $ 332,324 %14.0
Licenses and Permits 2,423,041 2,423,041 194,373 %8.0 176,466 %7.4
Other 27,440 27,440 4,229 %15.4 3,772 %16.8
Contributions - - - %- 632 %-
Total Revenues 4,880,959 4,880,959 456,140 %9.3 513,194 %10.7
Other Financing Sources:
Transfers In 1,825,850 1,825,850 152,154 %8.3 136,657 %8.3
Total Revenues And Other FinancingSources 6,706,809 6,706,809 608,294 %9.1 649,851 %10.1
Expenditures:
Salaries and Wages 10,034,189 10,034,189 696,960 %6.9 862,988 %8.5
Employee Benefits 4,777,553 4,777,553 329,942 %6.9 378,749 %7.7
Professional and Technical Services 2,176,502 2,176,502 116,090 %5.3 128,599 %7.1
Purchased Property Services 1,673,390 1,673,390 58,494 %3.5 86,045 %5.2
Other Purchased Services 318,225 318,225 18,200 %5.7 23,008 %6.9
Supplies 1,230,221 1,230,221 88,181 %7.2 36,722 %3.1
Total Expenditures 20,210,080 20,210,080 1,307,867 %6.5 1,516,111 %7.6
Net Departmental Impact $ (13,503,271) $ (13,503,271) $ (699,573) $ (866,260)
19

City of Fort WorthGeneral FundCommunications and Public Engagement Department *Schedule of Revenues and Expenditures for October 2017, Fiscal Period 1
FY2018
AdoptedBudget
AmendedBudget Actuals YTD
% Actualsto Budget
Other Financing Sources:
Transfers In $ 1,550,558 $ 1,550,558 $ 129,513 %8.4
Expenditures:
Salaries and Wages 2,333,764 2,333,764 139,168 %6.0
Employee Benefits 981,289 981,289 62,524 %6.4
Professional and Technical Services 502,532 502,532 21,675 %4.3
Purchased Property Services 22,668 22,668 786 %3.5
Other Purchased Services 186,758 186,758 3,559 %1.9
Supplies 33,402 33,402 352 %1.1
Total Expenditures 4,060,413 4,060,413 228,064 %5.6
Net Departmental Impact $ (2,509,855) $ (2,509,855) $ (98,551)
*New Department in FY2018, as this division was part of the City Manager's Office in FY2017.
20

City of Fort WorthGeneral FundEconomic Development DepartmentSchedule of Revenues and Expenditures for October 2017, Fiscal Period 1
FY2018 FY2017
AdoptedBudget
AmendedBudget Actuals YTD
% Actualsto Budget
Prior YearActuals YTD
% Actuals toPrior Year
Budget
Revenues:
Use of Money and Property $ 147,337 $ 147,337 $ 15,888 %10.8 $ 4,508 %2.9
Other 150 150 200 %133.3 3,478 %56.6
Total Revenues 147,487 147,487 16,088 %10.9 7,986 %4.9
Other Financing Sources:
Transfers In 567,924 567,924 - %- - %-
Total Revenues And Other FinancingSources 715,411 715,411 16,088 %2.2 7,986 %1.2
Expenditures:
Salaries and Wages 1,128,697 1,128,697 105,008 %9.3 94,840 %8.4
Employee Benefits 436,931 436,931 40,549 %9.3 38,344 %8.2
Professional and Technical Services 15,797,445 15,796,928 20,339 %0.1 2,116 %-
Purchased Property Services 165,645 165,645 4,150 %2.5 2,743 %4.2
Other Purchased Services (1) 223,304 223,821 45,952 %20.5 79,325 %15.4
Supplies 9,191 9,191 197 %2.1 195 %0.9
Total Expenditures 17,761,213 17,761,213 216,195 %1.2 217,563 %1.3
Net Departmental Impact $ (17,045,802) $ (17,045,802) $ (200,107) $ (209,577)
Footnotes:
(1) Other Purchased Services - Dues and Memberships are in line with prior year.
21
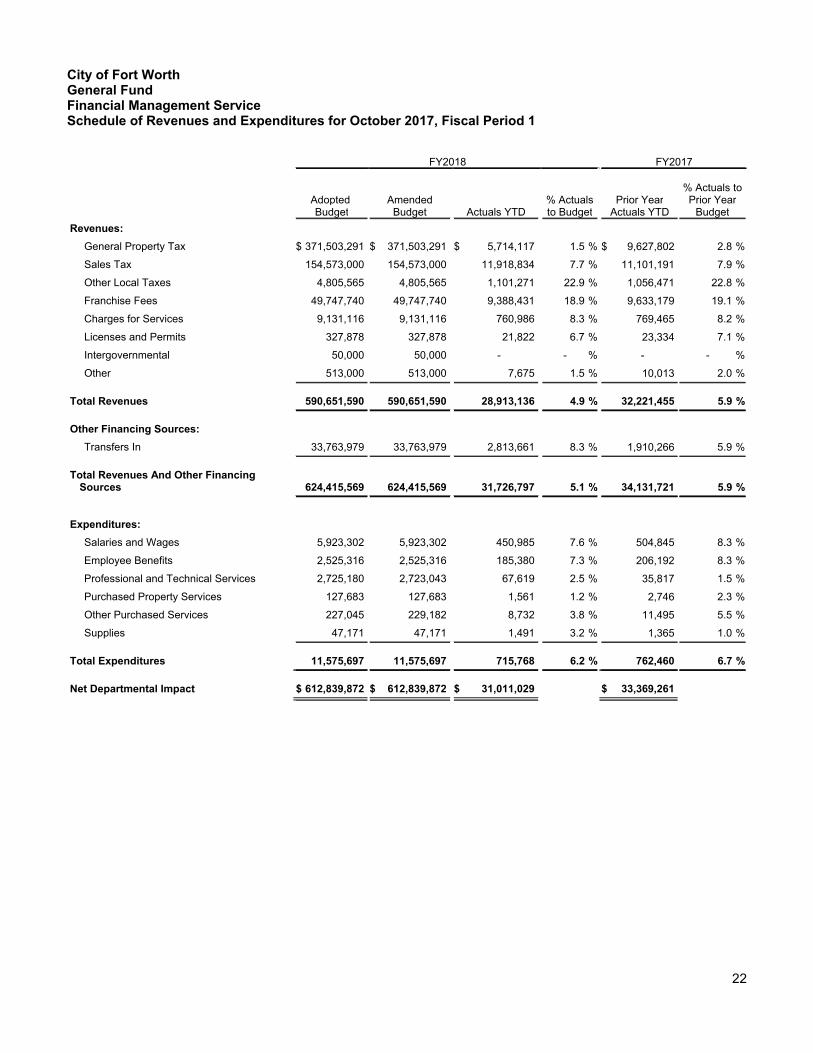
City of Fort WorthGeneral FundFinancial Management ServiceSchedule of Revenues and Expenditures for October 2017, Fiscal Period 1
FY2018 FY2017
AdoptedBudget
AmendedBudget Actuals YTD
% Actualsto Budget
Prior YearActuals YTD
% Actuals toPrior Year
Budget
Revenues:
General Property Tax $ 371,503,291 $ 371,503,291 $ 5,714,117 %1.5 $ 9,627,802 %2.8
Sales Tax 154,573,000 154,573,000 11,918,834 %7.7 11,101,191 %7.9
Other Local Taxes 4,805,565 4,805,565 1,101,271 %22.9 1,056,471 %22.8
Franchise Fees 49,747,740 49,747,740 9,388,431 %18.9 9,633,179 %19.1
Charges for Services 9,131,116 9,131,116 760,986 %8.3 769,465 %8.2
Licenses and Permits 327,878 327,878 21,822 %6.7 23,334 %7.1
Intergovernmental 50,000 50,000 - %- - %-
Other 513,000 513,000 7,675 %1.5 10,013 %2.0
Total Revenues 590,651,590 590,651,590 28,913,136 %4.9 32,221,455 %5.9
Other Financing Sources:
Transfers In 33,763,979 33,763,979 2,813,661 %8.3 1,910,266 %5.9
Total Revenues And Other FinancingSources 624,415,569 624,415,569 31,726,797 %5.1 34,131,721 %5.9
Expenditures:
Salaries and Wages 5,923,302 5,923,302 450,985 %7.6 504,845 %8.3
Employee Benefits 2,525,316 2,525,316 185,380 %7.3 206,192 %8.3
Professional and Technical Services 2,725,180 2,723,043 67,619 %2.5 35,817 %1.5
Purchased Property Services 127,683 127,683 1,561 %1.2 2,746 %2.3
Other Purchased Services 227,045 229,182 8,732 %3.8 11,495 %5.5
Supplies 47,171 47,171 1,491 %3.2 1,365 %1.0
Total Expenditures 11,575,697 11,575,697 715,768 %6.2 762,460 %6.7
Net Departmental Impact $ 612,839,872 $ 612,839,872 $ 31,011,029 $ 33,369,261
22

City of Fort WorthGeneral FundFire DepartmentSchedule of Revenues and Expenditures for October 2017, Fiscal Period 1
FY2018 FY2017
AdoptedBudget
AmendedBudget Actuals YTD
% Actualsto Budget
Prior YearActuals YTD
% Actuals toPrior Year
Budget
Revenues:
Charges for Services $ 1,018,181 $ 1,018,181 $ 129,520 %12.7 $ 32,643 %3.3
Licenses and Permits 1,204,000 1,204,000 118,565 %9.8 74,596 %7.4
Other 286,575 286,575 37,932 %13.2 64,748 %22.6
Total Revenues 2,508,756 2,508,756 286,017 %11.4 171,987 %7.5
Other Financing Sources:
Transfers In 59,501 59,501 4,958 %8.3 4,583 %8.3
Total Revenues And Other FinancingSources 2,568,257 2,568,257 290,975 %11.3 176,570 %7.5
Expenditures:
Salaries and Wages 92,837,515 92,837,515 6,580,378 %7.1 7,583,440 %8.3
Employee Benefits 37,240,813 37,240,813 2,694,593 %7.2 2,931,948 %8.3
Professional and Technical Services 5,785,562 5,785,562 408,148 %7.1 435,750 %7.2
Purchased Property Services 5,192,216 5,192,216 432,901 %8.3 455,318 %8.6
Other Purchased Services 944,990 941,991 64,433 %6.8 61,402 %8.1
Supplies 2,960,872 2,960,872 131,468 %4.4 190,191 %5.9
Total Expenditures 144,961,968 144,958,969 10,311,921 %7.1 11,658,049 %8.2
Other Financing Uses:
Transfers Out 203,927 203,927 16,993 %8.3 4,583 %2.3
Total Expenditures and Other FinancingUses 145,165,895 145,162,896 10,328,914 %7.1 11,662,632 %-
Net Departmental Impact $(142,597,638) $ (142,594,639) $ (10,037,939) $ (11,486,062)
23

City of Fort WorthGeneral FundHuman Resources DepartmentSchedule of Revenues and Expenditures for October 2017, Fiscal Period 1
FY2018 FY2017
AdoptedBudget
AmendedBudget Actuals YTD
% Actualsto Budget
Prior YearActuals YTD
% Actuals toPrior Year
Budget
Expenditures:
Salaries and Wages $ 2,408,287 $ 2,408,287 $ 170,870 %7.1 $ 201,256 %8.6
Employee Benefits 1,135,299 1,135,299 79,125 %7.0 101,229 %8.2
Professional and Technical Services 817,761 817,761 16,658 %2.0 40,440 %4.3
Purchased Property Services 56,428 56,428 971 %1.7 1,957 %3.6
Other Purchased Services 117,941 117,941 5,322 %4.5 4,076 %4.6
Supplies 15,095 15,095 1,067 %7.1 18,130 %120.1
Total Expenditures 4,550,811 4,550,811 274,013 %6.0 367,088 %7.8
Net Departmental Impact $ (4,550,811) $ (4,550,811) $ (274,013) $ (367,088)
24

City of Fort WorthGeneral FundLibrary DepartmentSchedule of Revenues and Expenditures for October 2017, Fiscal Period 1
FY2018 FY2017
AdoptedBudget
AmendedBudget Actuals YTD
% Actualsto Budget
Prior YearActuals YTD
% Actuals toPrior Year
Budget
Revenues:
Sales Tax $ - $ - $ 4 %- $ - %-
Charges for Services 212,506 212,506 13,462 %6.3 17,333 %9.2
Fines and Forfeitures 256,875 256,875 23,611 %9.2 (22,301) %4.9
Use of Money and Property 182 182 6 %3.3 16 %8.2
Other 4,425 4,425 475 %10.7 289 %5.8
Total Revenues 473,988 473,988 37,558 %7.9 (4,663) %1.8
Expenditures:
Salaries and Wages 9,070,711 9,070,711 663,618 %7.3 797,261 %8.8
Employee Benefits 4,145,463 4,145,463 305,679 %7.4 354,393 %8.7
Professional and Technical Services 2,538,444 2,538,444 132,038 %5.2 96,516 %4.6
Purchased Property Services 590,800 590,800 19,552 %3.3 35,050 %5.4
Other Purchased Services 328,581 328,581 21,378 %6.5 15,644 %5.0
Supplies 3,280,916 3,280,916 94,470 %2.9 12,329 %0.4
Total Expenditures 19,954,915 19,954,915 1,236,735 %6.2 1,311,193 %6.7
Net Departmental Impact $ (19,480,927) $ (19,480,927) $ (1,199,177) $ (1,315,856)
25

City of Fort WorthGeneral FundMunicipal Courts DepartmentSchedule of Revenues and Expenditures for October 2017, Fiscal Period 1
FY2018 FY2017
AdoptedBudget
AmendedBudget Actuals YTD
% Actualsto Budget
Prior YearActuals YTD
% Actuals toPrior Year
Budget
Revenues:
Charges for Services $ 5,203,429 $ 5,203,429 $ 424,907 %8.2 $ 651,420 %8.2
Fines and Forfeitures 5,833,799 5,833,799 510,033 %8.7 503,001 %6.8
Other 111,031 111,031 238 %0.2 2,245 %4.2
Total Revenues 11,148,259 11,148,259 935,178 %8.4 1,156,666 %7.5
Expenditures:
Salaries and Wages 9,014,266 9,014,266 706,508 %7.8 778,847 %8.4
Employee Benefits 4,080,727 4,080,727 278,108 %6.8 331,765 %8.4
Professional and Technical Services 1,574,421 1,574,421 105,826 %6.7 82,503 %6.0
Purchased Property Services 717,124 717,124 7,441 %1.0 89,514 %11.8
Other Purchased Services 291,261 291,261 17,310 %5.9 12,467 %0.6
Supplies 232,324 232,324 9,244 %4.0 19,832 %8.6
Total Expenditures 15,910,123 15,910,123 1,124,437 %7.1 1,314,928 %7.5
Net Departmental Impact $ (4,761,864) $ (4,761,864) $ (189,259) $ (158,262)
26

City of Fort WorthGeneral FundNeighborhood Services DepartmentSchedule of Revenues and Expenditures for October 2017, Fiscal Period 1
FY2018 FY2017
AdoptedBudget
AmendedBudget Actuals YTD
% Actualsto Budget
Prior YearActuals YTD
% Actuals toPrior Year
Budget
Revenues:
Charges for Services $ 514,398 $ 514,398 $ 7,813 %1.5 $ 3,203 %0.6
Use of Money and Property 23,125 23,125 780 %3.4 1,935 %8.4
Other (1) - - (230) %- - %-
Contributions 157,017 157,017 15,000 %9.6 - %-
Total Revenues 694,540 694,540 23,363 %3.4 5,138 %0.9
Expenditures:
Salaries and Wages 2,767,312 2,767,312 183,215 %6.6 225,743 %8.4
Employee Benefits 1,133,579 1,127,507 76,583 %6.8 88,764 %7.4
Professional and Technical Services 1,428,449 1,428,449 31,816 %2.2 26,713 %0.6
Purchased Property Services 457,253 457,253 15,221 %3.3 10,836 %3.0
Other Purchased Services 113,921 113,921 4,639 %4.1 11,645 %5.9
Supplies 252,368 252,368 6,616 %2.6 8,172 %3.4
Total Expenditures 6,152,882 6,146,810 318,090 %5.2 371,873 %4.1
Net Departmental Impact $ (5,458,342) $ (5,452,270) $ (294,727) $ (366,735)
Footnotes:
(1) Other Revenue - Cash Over or Short was higher than anticipated.
27

City of Fort WorthGeneral FundNon- DepartmentalSchedule of Revenues and Expenditures for October 2017, Fiscal Period 1
FY2018 FY2017
AdoptedBudget
AmendedBudget Actuals YTD
% Actualsto Budget
Prior YearActuals YTD
% Actuals toPrior Year
Budget
Revenues:
Other $ - $ - $ 3,132 %- $ 3,211 %-
Expenditures:
Salaries and Wages 7,513,537 7,513,537 (135) %- - %-
Employee Benefits 4,172,478 4,172,478 (2) %- - %-
Professional and Technical Services 1,310,303 1,310,303 - %- - %-
Other Purchased Services 512,150 512,150 - %- - %-
Supplies 100 100 - %- - %-
Total Expenditures 13,508,568 13,508,568 (137) %- - %-
Net Departmental Impact $ (13,508,568) $ (13,508,568) $ 3,269 $ 3,211
28

City of Fort WorthGeneral FundParks and Recreation DepartmentSchedule of Revenues and Expenditures for October 2017, Fiscal Period 1
FY2018 FY2017
AdoptedBudget
AmendedBudget Actuals YTD
% Actualsto Budget
Prior YearActuals YTD
% Actuals toPrior Year
Budget
Revenues:
Charges for Services $ 1,889,028 $ 1,889,028 $ 120,662 %6.4 $ 117,358 %6.9
Use of Money and Property 153,306 153,306 12,241 %8.0 12,500 %8.1
Other 40,547 40,547 2,486 %6.1 4,478 %10.2
Contributions 4,500 4,500 388 %8.6 - %-
Total Revenues 2,087,381 2,087,381 135,777 %6.5 134,336 %7.0
Other Financing Sources:
Transfers In 365,780 365,780 - %- 3,607 %1.0
Total Revenues And Other FinancingSources 2,453,161 2,453,161 135,777 %5.5 137,943 %6.1
Expenditures:
Salaries and Wages 12,537,582 12,537,582 896,593 %7.2 1,151,250 %9.2
Employee Benefits 6,453,835 6,453,835 464,861 %7.2 544,410 %8.4
Professional and Technical Services 13,858,700 13,858,700 1,048,221 %7.6 1,022,714 %7.6
Purchased Property Services 5,230,694 5,230,694 232,040 %4.4 280,996 %5.6
Other Purchased Services 556,200 556,200 32,769 %5.9 120,338 %7.2
Supplies 2,131,680 2,131,680 70,987 %3.3 63,927 %3.1
Total Expenditures 40,768,691 40,768,691 2,745,471 %6.7 3,183,635 %7.7
Other Financing Uses:
Transfers Out 3,805,941 3,805,941 317,162 %8.3 6,914 %0.2
Total Expenditures and Other FinancingUses 44,574,632 44,574,632 3,062,633 %6.9 3,190,549 %-
Net Departmental Impact $ (42,121,471) $ (42,121,471) $ (2,926,856) $ (3,052,606)
29

City of Fort WorthGeneral FundPerformance and Budget DepartmentSchedule of Revenues and Expenditures for October 2017, Fiscal Period 1
FY2018 FY2017
AdoptedBudget
AmendedBudget Actuals YTD
% Actualsto Budget
Prior YearActuals YTD
% Actuals toPrior Year
Budget
Other Financing Sources:
Transfers In $ - $ - $ - %- $ 10,449 %9.1
Expenditures:
Salaries and Wages 1,881,938 1,881,938 129,116 %6.9 159,794 %8.4
Employee Benefits 607,687 607,687 38,988 %6.4 51,314 %8.2
Professional and Technical Services (1) 3,240,076 3,240,076 656,948 %20.3 42,270 %1.4
Purchased Property Services 26,555 26,555 407 %1.5 714 %2.5
Other Purchased Services 124,723 124,723 21,171 %17.0 10,684 %1.8
Supplies 276,865 276,865 23,732 %8.6 857 %1.1
Total Expenditures 6,157,844 6,157,844 870,362 %14.1 265,633 %4.3
Net Departmental Impact $ (6,157,844) $ (6,157,844) $ (870,362) $ (255,184)
Footnotes:
(1) Professional and Technical Services - Consultant & Other Professional Services are higher than in previous year for this period.
30

City of Fort WorthGeneral FundPlanning and Development DepartmentSchedule of Revenues and Expenditures for October 2017, Fiscal Period 1
FY2018 FY2017
AdoptedBudget
AmendedBudget Actuals YTD
% Actualsto Budget
Prior YearActuals YTD
% Actuals toPrior Year
Budget
Revenues:
Charges for Services $ 4,123,438 $ 4,123,438 $ 268,595 %6.5 $ 287,902 %7.7
Licenses and Permits 12,101,394 12,101,394 1,010,661 %8.4 1,001,851 %10.0
Other 175,132 175,132 16,699 %9.5 9,551 %6.1
Total Revenues 16,399,964 16,399,964 1,295,955 %7.9 1,299,304 %9.3
Other Financing Sources:
Transfers In 808,780 808,780 39,198 %4.8 - %-
Total Revenues And Other FinancingSources 17,208,744 17,208,744 1,335,153 %7.8 1,299,304 %9.0
Expenditures:
Salaries and Wages 8,708,353 8,708,353 581,813 %6.7 612,919 %7.7
Employee Benefits 3,879,377 3,879,377 255,411 %6.6 268,807 %7.7
Professional and Technical Services 3,382,030 3,382,030 92,618 %2.7 612,841 %34.2
Purchased Property Services 214,752 214,752 10,836 %5.0 14,984 %7.7
Other Purchased Services 358,493 358,493 12,609 %3.5 11,637 %3.3
Supplies 423,579 423,579 9,937 %2.3 26,622 %10.9
Total Expenditures 16,966,584 16,966,584 963,224 %5.7 1,547,810 %11.0
Net Departmental Impact $ 242,160 $ 242,160 $ 371,929 $ (248,506)
31

City of Fort WorthGeneral FundPolice DepartmentSchedule of Revenues and Expenditures for October 2017, Fiscal Period 1
FY2018 FY2017
AdoptedBudget
AmendedBudget Actuals YTD
% Actualsto Budget
Prior YearActuals YTD
% Actuals toPrior Year
Budget
Revenues:
Charges for Services $ 632,445 $ 632,445 $ 57,148 %9.0 $ 47,994 %1.1
Licenses and Permits 15,440 15,440 640 %4.1 2,915 %31.2
Intergovernmental - - - %- 190,207 %391.2
Other 1,413,433 1,413,433 35,111 %2.5 66,363 %2.2
Total Revenues 2,061,318 2,061,318 92,899 %4.5 307,479 %4.1
Other Financing Sources:
Transfers In 2,354,110 2,354,110 196,176 %8.3 4,030 %0.1
Total Revenues And Other FinancingSources 4,415,428 4,415,428 289,075 %6.5 311,509 %3.0
Expenditures:
Salaries and Wages 146,199,937 146,199,937 11,039,896 %7.6 12,277,848 %8.5
Employee Benefits 61,870,534 61,870,534 4,667,067 %7.5 4,851,208 %8.5
Professional and Technical Services 17,364,832 17,364,832 1,079,977 %6.2 948,402 %5.9
Purchased Property Services 6,322,352 6,322,352 485,608 %7.7 448,569 %7.8
Other Purchased Services 2,182,880 2,186,655 242,715 %11.1 213,530 %6.7
Supplies 5,595,587 5,594,811 435,094 %7.8 221,083 %4.0
Purchased Property 16,000 16,000 - %- - %-
Debt Service 262,375 262,375 21,865 %8.3 11,151 %4.3
Total Expenditures 239,814,497 239,817,496 17,972,222 %7.5 18,971,791 %8.1
Net Departmental Impact $(235,399,069) $ (235,402,068) $ (17,683,147) $ (18,660,282)
32

City of Fort WorthGeneral FundProperty Management DepartmentSchedule of Revenues and Expenditures for October 2017, Fiscal Period 1
FY2018 FY2017
AdoptedBudget
AmendedBudget Actuals YTD
% Actualsto Budget
Prior YearActuals YTD
% Actuals toPrior Year
Budget
Revenues:
Charges for Services $ 159,814 $ 159,814 $ 10,834 %6.8 $ 300 %0.3
Use of Money and Property 148,600 148,600 21,103 %14.2 - %-
Investment Income - - 171 %- - %-
Other 6,460 6,460 96 %1.5 308 %3.1
Total Revenues 314,874 314,874 32,204 %10.2 608 %0.6
Other Financing Sources:
Transfers In 511,420 511,420 - %- - %-
Total Revenues And Other FinancingSources 826,294 826,294 32,204 %3.9 608 %-
Expenditures:
Salaries and Wages 4,676,210 4,676,210 347,579 %7.4 376,066 %8.5
Employee Benefits 1,740,522 1,740,522 125,148 %7.2 132,614 %6.8
Professional and Technical Services 2,190,633 2,190,633 52,746 %2.4 38,730 %2.5
Purchased Property Services 791,041 791,041 30,206 %3.8 24,445 %2.9
Other Purchased Services 301,754 301,754 10,533 %3.5 47,637 %13.7
Supplies 1,580,589 1,580,589 16,462 %1.0 39,312 %2.4
Debt Service 617,936 617,936 - %- - %-
Total Expenditures 11,898,685 11,898,685 582,674 %4.9 658,804 %5.8
Other Financing Uses:
Transfers Out - 3,320,000 - %- - %-
Total Expenditures and Other FinancingUses 11,898,685 15,218,685 582,674 %3.8 658,804 %-
Net Departmental Impact $ (11,072,391) $ (14,392,391) $ (550,470) $ (658,196)
33

City of Fort WorthGeneral FundTransportation and Public Works DepartmentSchedule of Revenues and Expenditures for October 2017, Fiscal Period 1
FY2018 FY2017
AdoptedBudget
AmendedBudget Actuals YTD
% Actualsto Budget
Prior YearActuals YTD
% Actuals toPrior Year
Budget
Revenues:
Franchise Fees $ 10,000 $ 10,000 $ 1,500 %15.0 $ 4,000 %2.3
Charges for Services 992,280 992,280 97,656 %9.8 81,120 %9.1
Licenses and Permits 65,000 65,000 1,550 %2.4 936 %1.4
Other 166,504 166,504 14,312 %8.6 225 %0.2
Total Revenues 1,233,784 1,233,784 115,018 %9.3 86,281 %6.9
Other Financing Sources:
Transfers In 3,919,104 3,919,104 326,592 %8.3 95,738 %3.0
Total Revenues And Other FinancingSources 5,152,888 5,152,888 441,610 %8.6 182,019 %4.1
Expenditures:
Salaries and Wages 11,910,827 11,910,827 820,761 %6.9 947,642 %8.1
Employee Benefits 7,946,839 7,946,839 587,226 %7.4 630,098 %8.0
Professional and Technical Services 2,909,221 2,909,221 131,124 %4.5 94,414 %3.5
Purchased Property Services 6,042,310 6,042,310 150,187 %2.5 246,977 %5.4
Other Purchased Services 425,350 425,350 20,071 %4.7 41,502 %6.0
Supplies 5,121,957 5,121,957 253,124 %4.9 113,889 %2.1
Total Expenditures 34,356,504 34,356,504 1,962,493 %5.7 2,074,522 %6.3
Net Departmental Impact $ (29,203,616) $ (29,203,616) $ (1,520,883) $ (1,892,503)
34

City of Fort WorthGeneral FundWastewater DepartmentSchedule of Revenues and Expenditures for October 2017, Fiscal Period 1
FY2018 FY2017
AdoptedBudget
AmendedBudget Actuals YTD
% Actualsto Budget
Prior YearActuals YTD
% Actuals toPrior Year
Budget
Other Financing Sources:
Transfers In (1) $ - $ - $ - %- $ 161,005 %-
Net Departmental Impact $ - $ - $ - $ 161,005
Footnotes:
(1) Transfers In - The Transfers In were erroneously posted to Wastewater Department instead of the Financial Management ServicesDepartment for PILOT from the Water and Sewer Fund. These amounts were reclassified in Period 2.
35
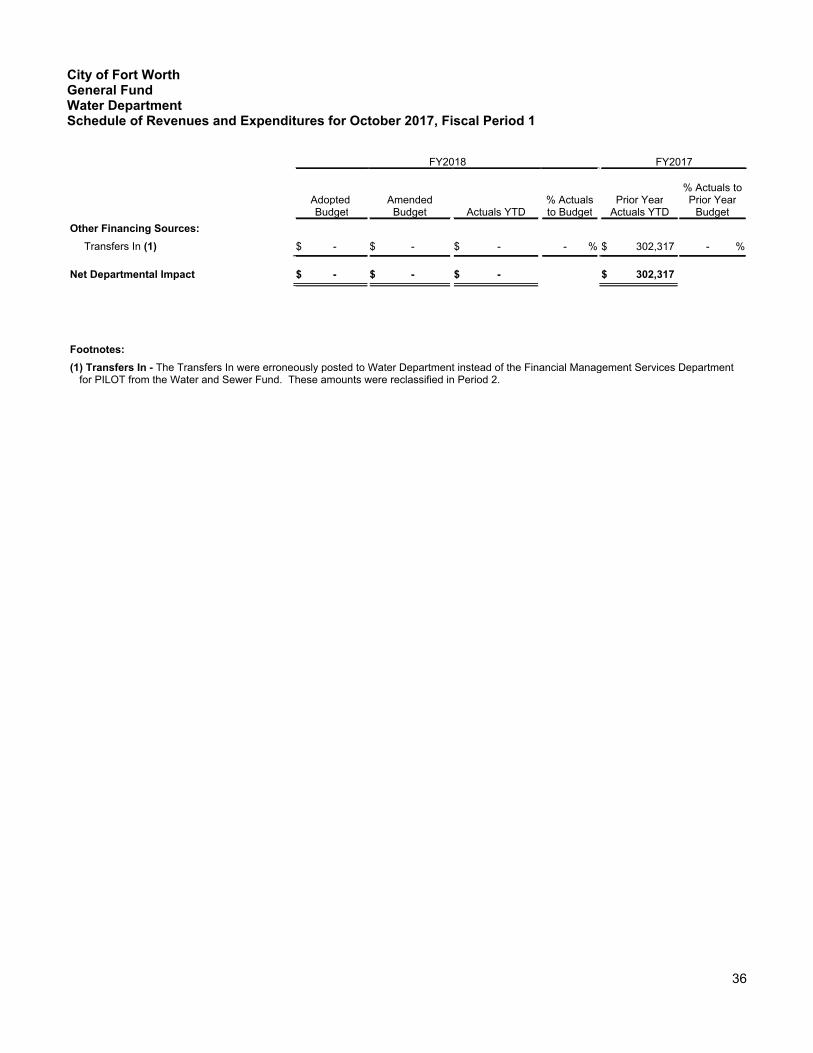
City of Fort WorthGeneral FundWater DepartmentSchedule of Revenues and Expenditures for October 2017, Fiscal Period 1
FY2018 FY2017
AdoptedBudget
AmendedBudget Actuals YTD
% Actualsto Budget
Prior YearActuals YTD
% Actuals toPrior Year
Budget
Other Financing Sources:
Transfers In (1) $ - $ - $ - %- $ 302,317 %-
Net Departmental Impact $ - $ - $ - $ 302,317
Footnotes:
(1) Transfers In - The Transfers In were erroneously posted to Water Department instead of the Financial Management Services Departmentfor PILOT from the Water and Sewer Fund. These amounts were reclassified in Period 2.
36

(1'2:0(17
)81'6

City of Fort WorthPARD Endowment Gas Lease Fund *Schedule of Assets, Liabilities, Deferred Inflows of Resources, and Fund Balance (Deficit)October 2017, Fiscal Period 1
FY2018 FY2017
ASSETS
Cash, Cash Equivalents, & Investments $ 91,813 $ 103,808
Cash, Cash Equivalents, & InvestmentsHeld by Trustees 12,181,661 10,815,081
Receivables, Net of Allowance for Uncollectible:
Interest 12,236 11,684
Accounts and Other 38,551 85,163
Total Assets $ 12,324,261 $ 11,015,736
LIABILITIES, DEFERRED INFLOWS OF RESOURCES,AND FUND BALANCE (DEFICIT)
Fund Balance (Deficit) $ 12,324,261 $ 11,015,736
Total Liabilities, Deferred Inflows of Resources,and Fund Balance (Deficit) $ 12,324,261 $ 11,015,736
* The PARD Endowment Gas Lease Fund is used to aggregate specific gas well revenues fromParks and Recreation Department land owned by the City.
38

City of Fort WorthPARD Endowment Gas Lease Fund *Schedule of Revenues and Expenditures for October 2017, Fiscal Period 1
FY2018 FY2017
Actuals YTDPrior Year
Actuals YTD
Beginning Fund Balance (Deficit) $ 12,315,337 $ 11,137,357
Revenues:
Investment Income/(Loss) (1) - (164,185)
Gas Lease and Royalties 9,192 46,658
Total Revenues 9,192 (117,527)
Expenditures:
Parks and Recreation 268 4,094
Change in Fund Balance 8,924 (121,621)
Estimated Ending Fund Balance (Deficit) $ 12,324,261 $ 11,015,736
Footnotes:
(1) Investment Income/(Loss) - Gas well investments recorded a loss duringthis period in the prior year.
* The PARD Endowment Gas Lease Fund is used to aggregate specific gas wellrevenues from Parks and Recreation Department land owned by the City. ThisFund does not have an adopted budget.
39

City of Fort WorthGeneral Endowment Gas Lease *Schedule of Assets, Liabilities, Deferred Inflows of Resources, and Fund Balance (Deficit)October 2017, Fiscal Period 1
FY2018 FY2017
ASSETS
Cash, Cash Equivalents, & Investments $ 163,207 $ 187,276
Cash, Cash Equivalents, & InvestmentsHeld by Trustees 18,106,263 15,459,022
Receivables, Net of Allowance for Uncollectibles:
Interest 23,314 23,090
Accounts and Other 274,890 201,515
Total Assets $ 18,567,674 $ 15,870,903
LIABILITIES, DEFERRED INFLOWS OF RESOURCES,AND FUND BALANCE (DEFICIT)
Fund Balance (Deficit) $ 18,567,674 $ 15,870,903
Total Liabilities, Deferred Inflows of Resources,and Fund Balance (Deficit) $ 18,567,674 $ 15,870,903
* The General Endowment Gas Lease Fund is used to aggregate specific gas well revenues ongovernmental land owned by the City (other than Parks and Recreation Department land).
40

City of Fort WorthGeneral Endowment Gas LeaseSchedule of Revenues and Expenditures for October 2017, Fiscal Period 1
FY2018 FY2017
Actuals YTDPrior Year
Actuals YTD
Beginning Fund Balance (Deficit) $ 18,504,039 $ 15,983,250
Revenues:
Investment Income/(Loss) (1) - (216,402)
Gas Lease and Royalties 65,545 110,404
Total Revenues 65,545 (105,998)
Expenditures:
Planning and Development - 5,017
Property Management 1,910 1,332
Total Expenditures 1,910 6,349
Change in Fund Balance 63,635 (112,347)
Estimated Ending Fund Balance (Deficit) $ 18,567,674 $ 15,870,903
Footnotes:
(1) Investment Income/(Loss) - Gas well investments recorded a loss duringthis period in the prior year
* The General Endowment Gas Lease Fund is used to aggregate specific gaswell revenues on governmental land owned by the City (other than Parks andRecreation Department Land). This Fund does not have an adopted budget.
41

*29(510(17$/
'(%7�6(59,&(
)81'6

City of Fort WorthGeneral Debt Service FundSchedule of Assets, Liabilities, Deferred Inflows of Resources, and Fund Balance (Deficit)October 2017, Fiscal Period 1
FY2018 FY2017
ASSETS
Cash, Cash Equivalents, & Investments $ 25,879,950 $ 25,525,527
Receivables, Net of Allowance for Uncollectible:
Taxes 94,996,129 88,200,874
Interest 575,691 42,741
Total Assets $ 121,451,770 $ 113,769,142
LIABILITIES, DEFERRED INFLOWS OF RESOURCES,AND FUND BALANCE (DEFICIT)
Deferred Inflows of Resources $ 94,622,225 $ 87,975,090
Fund Balance (Deficit) 26,829,545 25,794,052
Total Liabilities, Deferred Inflows of Resources,and Fund Balance (Deficit) $ 121,451,770 $ 113,769,142
43

City of Fort WorthGeneral Debt Service FundSchedule of Revenues and Expenditures for October 2017, Fiscal Period 1
FY2018 FY2017
AdoptedBudget
AmendedBudget Actuals YTD
% Actualsto Budget
Prior YearActuals YTD
% Actuals toPrior Year
Budget
Beginning Fund Balance (Deficit) $ 24,832,028 $ 24,832,028 $ 24,832,028 $ 22,768,012
Revenues:
General Property Tax 94,314,246 94,314,246 1,460,582 %1.5 2,523,725 %2.8
Use of Money and Property - - 9,034 %- 9,034 %-
Investment Income 2,706,156 2,706,156 4,726 %0.2 (4,643) %(0.2)
Total Revenues 97,020,402 97,020,402 1,474,342 %1.5 2,528,116 %2.7
Other Financing Sources:
Transfers In 4,905,210 4,905,210 523,175 %10.7 497,924 %16.3
Total Revenues And Other FinancingSources 101,925,612 101,925,612 1,997,517 %2.0 3,026,040 %3.1
Expenditures:
Debt Service 92,754,104 92,754,104 - %- - %-
Change in Fund Balance 1,997,517 3,026,040
Planned Contribution to / (Use of) FundBalance 9,171,508 9,171,508
Estimated Ending Fund Balance (Deficit) $ 34,003,536 $ 34,003,536 $ 26,829,545 $ 25,794,052
44
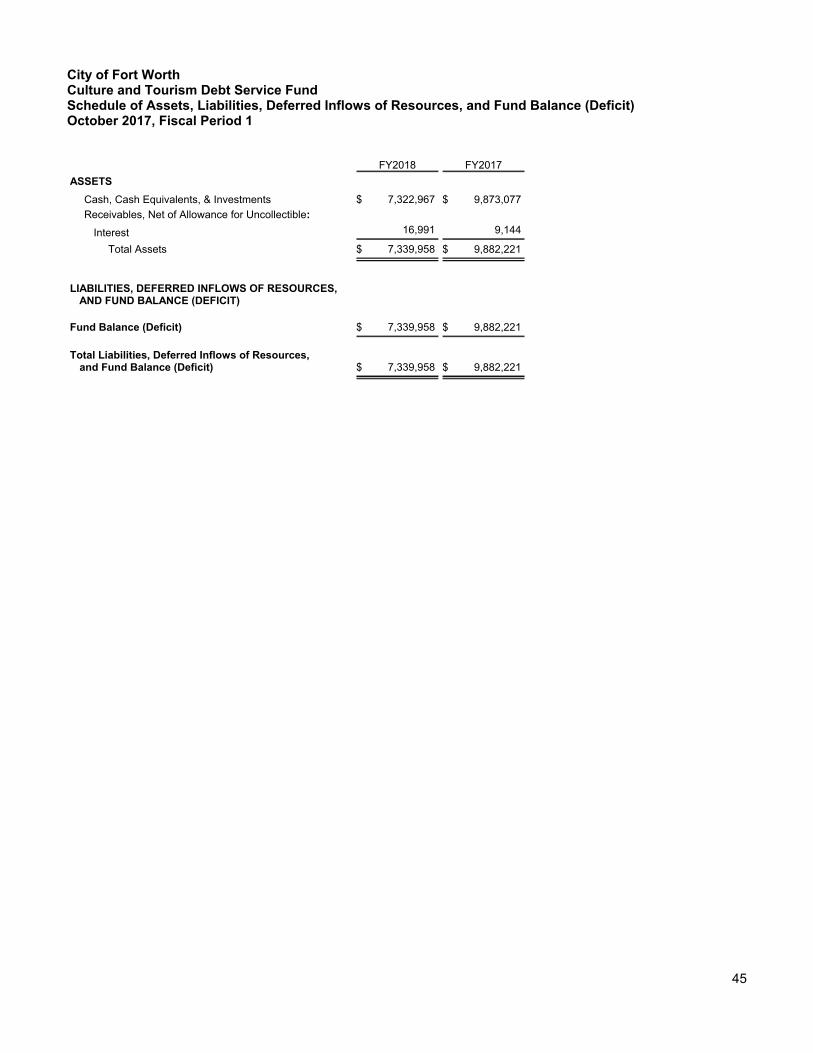
City of Fort WorthCulture and Tourism Debt Service FundSchedule of Assets, Liabilities, Deferred Inflows of Resources, and Fund Balance (Deficit)October 2017, Fiscal Period 1
FY2018 FY2017
ASSETS
Cash, Cash Equivalents, & Investments $ 7,322,967 $ 9,873,077
Receivables, Net of Allowance for Uncollectible:
Interest 16,991 9,144
Total Assets $ 7,339,958 $ 9,882,221
LIABILITIES, DEFERRED INFLOWS OF RESOURCES,AND FUND BALANCE (DEFICIT)
Fund Balance (Deficit) $ 7,339,958 $ 9,882,221
Total Liabilities, Deferred Inflows of Resources,and Fund Balance (Deficit) $ 7,339,958 $ 9,882,221
45

City of Fort WorthCulture and Tourism Debt Service FundSchedule of Revenues and Expenditures for October 2017, Fiscal Period 1
FY2018 FY2017
AdoptedBudget
AmendedBudget Actuals YTD
% Actualsto Budget
Prior YearActuals YTD
% Actuals toPrior Year
Budget
Beginning Fund Balance (Deficit) $ 6,377,463 $ 6,377,463 $ 6,377,463 $ 8,703,329
Revenues:
Investment Income 75,300 75,300 - %- - %-
Other Financing Sources:
Transfers In 7,051,988 7,051,988 962,495 %13.6 1,178,892 %14.6
Total Revenues And Other FinancingSources 7,127,288 7,127,288 962,495 %13.5 1,178,892 %14.4
Expenditures:
Debt Service 7,051,988 7,051,988 - %- - %-
Change in Fund Balance 962,495 1,178,892
Planned Contribution to / (Use of) FundBalance 75,300 75,300
Estimated Ending Fund Balance (Deficit) $ 6,452,763 $ 6,452,763 $ 7,339,958 $ 9,882,221
46

City of Fort WorthVenue Debt Service Fund*Schedule of Assets, Liabilities, Deferred Inflows of Resources, and Fund Balance (Deficit)October 2017, Fiscal Period 1
FY2018 FY2017
ASSETS
Cash, Cash Equivalents, & Investments $ 18,701,866 $ -
LIABILITIES, DEFERRED INFLOWS OF RESOURCES,AND FUND BALANCE (DEFICIT)
Fund Balance (Deficit) $ 18,701,866 $ -
Total Liabilities, Deferred Inflows of Resources,and Fund Balance (Deficit) $ 18,701,866 $ -
* New Venue Debt Service Fund established in July 2017.
47

City of Fort WorthVenue Debt Service Fund*Schedule of Revenues and Expenditures for October 2017, Fiscal Period 1
FY2018 FY2017
AdoptedBudget
AmendedBudget Actuals YTD
% Actualsto Budget
Prior YearActuals YTD
% Actuals toPrior Year
Budget
Beginning Fund Balance (Deficit) $ 18,349,000 $ 18,349,000 $ 18,349,000 $ -
Revenues:
Investment Income (1) - - 256,016 %- - %-
Other Financing Sources:
Transfers In 961,341 961,341 96,850 %10.1 - %-
Total Revenues And Other FinancingSources 961,341 961,341 352,866 %36.7 - %-
Expenditures:
Debt Service 11,326,273 11,326,273 - %- - %-
Change in Fund Balance 352,866 -
Planned Contribution to / (Use of) FundBalance (10,364,932) (10,364,932)
Estimated Ending Fund Balance (Deficit) $ 7,984,068 $ 7,984,068 $ 18,701,866 $ -
Footnotes:
(1) Investment Income - Under review by the Financial Management Services Department. If any adjustments are needed, they will be made ina subsequent period.
* New Venue Debt Service Fund established in July 2017.
48

City of Fort WorthRock Creek PID Debt Service Fund*Schedule of Assets, Liabilities, Deferred Inflows of Resources, and Fund Balance (Deficit)October 2017, Fiscal Period 1
FY2018 FY2017
ASSETS
Cash, Cash Equivalents, & InvestmentsHeld by Trustees $ 3,049,267 $ -
LIABILITIES, DEFERRED INFLOWS OF RESOURCES,AND FUND BALANCE (DEFICIT)
Fund Balance (Deficit) $ 3,049,267 $ -
Total Liabilities, Deferred Inflows of Resources,and Fund Balance (Deficit) $ 3,049,267 $ -
* New Rock Creek PID Debt Service Fund established in September 2017.
49

City of Fort WorthRock Creek PID Debt Service Fund*Schedule of Revenues and Expenditures for October 2017, Fiscal Period 1
FY2018 FY2017
AdoptedBudget**
AmendedBudget** Actuals YTD
% Actualsto Budget
Prior YearActuals YTD
% Actuals toPrior Year
Budget
Beginning Fund Balance (Deficit) $ 3,049,267 $ 3,049,267 $ 3,049,267 $ -
Change in Fund Balance - -
Planned Contribution to / (Use of) FundBalance - -
Estimated Ending Fund Balance (Deficit) $ 3,049,267 $ 3,049,267 $ 3,049,267 $ -
* New Rock Creek PID Debt Service Fund established in September 2017.
** For FY2018, the City did not adopt a budget for the Rock Creek PID Debt Service Fund.
50

63(&,$/�5(9(18(
)81'6

City of Fort WorthCrime Control and Prevention District FundSchedule of Assets, Liabilities, Deferred Inflows of Resources, and Fund Balance (Deficit)October 2017, Fiscal Period 1
FY2018 FY2017
ASSETS
Cash, Cash Equivalents, & Investments $ 3,495,949 $ 2,867,786
Receivables, Net of Allowance for Uncollectible:
Interest 70,263 33,048
Accounts and Other 12,900,707 11,887,092
Total Assets $ 16,466,919 $ 14,787,926
LIABILITIES, DEFERRED INFLOWS OF RESOURCES,AND FUND BALANCE (DEFICIT)
Liabilities
Accounts Payable $ 676,032 $ 720,658
Accrued Payroll 1,128,980 1,376,745
Total Liabilities 1,805,012 2,097,403
Fund Balance (Deficit) 14,661,907 12,690,523
Total Liabilities, Deferred Inflows of Resources,and Fund Balance (Deficit) $ 16,466,919 $ 14,787,926
52

City of Fort WorthCrime Control and Prevention District FundSchedule of Revenues and Expenditures for October 2017, Fiscal Period 1
FY2018 FY2017
AdoptedBudget
AmendedBudget Actuals YTD
% Actualsto Budget
Prior YearActuals YTD
% Actuals toPrior Year
Budget
Beginning Fund Balance (Deficit) $ 13,884,388 $ 13,884,388 $ 13,884,388 $ 12,491,874
Revenues:
Sales Tax 73,729,000 73,729,000 5,675,995 %7.7 5,267,697 %7.8
Investment Income 189,305 189,305 - %- - %-
Intergovernmental 5,330,459 5,330,459 789,378 %14.8 732,361 %14.6
Other 217,238 217,238 10,652 %4.9 - %-
Total Revenues 79,466,002 79,466,002 6,476,025 %8.1 6,000,058 %8.3
Other Financing Sources:
Proceeds from Disposal of Property 144,918 144,918 5,900 %4.1 - %-
Total Revenues And Other FinancingSources 79,610,920 79,610,920 6,481,925 %8.1 6,000,058 %8.3
Expenditures:
Neighborhood Services 722,240 722,240 31,312 %4.3 30,695 %3.9
Parks and Recreation 1,097,638 1,097,638 68,232 %6.2 82,257 %7.8
Police 55,769,332 55,769,332 3,769,720 %6.8 4,102,905 %7.2
Debt Service - - - %- 10,714 %-
Total Expenditures 57,589,210 57,589,210 3,869,264 %6.7 4,226,571 %7.2
Other Financing Uses:
Transfers Out 22,021,710 22,021,710 1,835,142 %8.3 1,574,838 %9.9
Total Expenditures and Other FinancingUses 79,610,920 79,610,920 5,704,406 %7.2 5,801,409 %-
Change in Fund Balance 777,519 198,649
Planned Contribution to / (Use of) FundBalance - -
Estimated Ending Fund Balance (Deficit) $ 13,884,388 $ 13,884,388 $ 14,661,907 $ 12,690,523
53
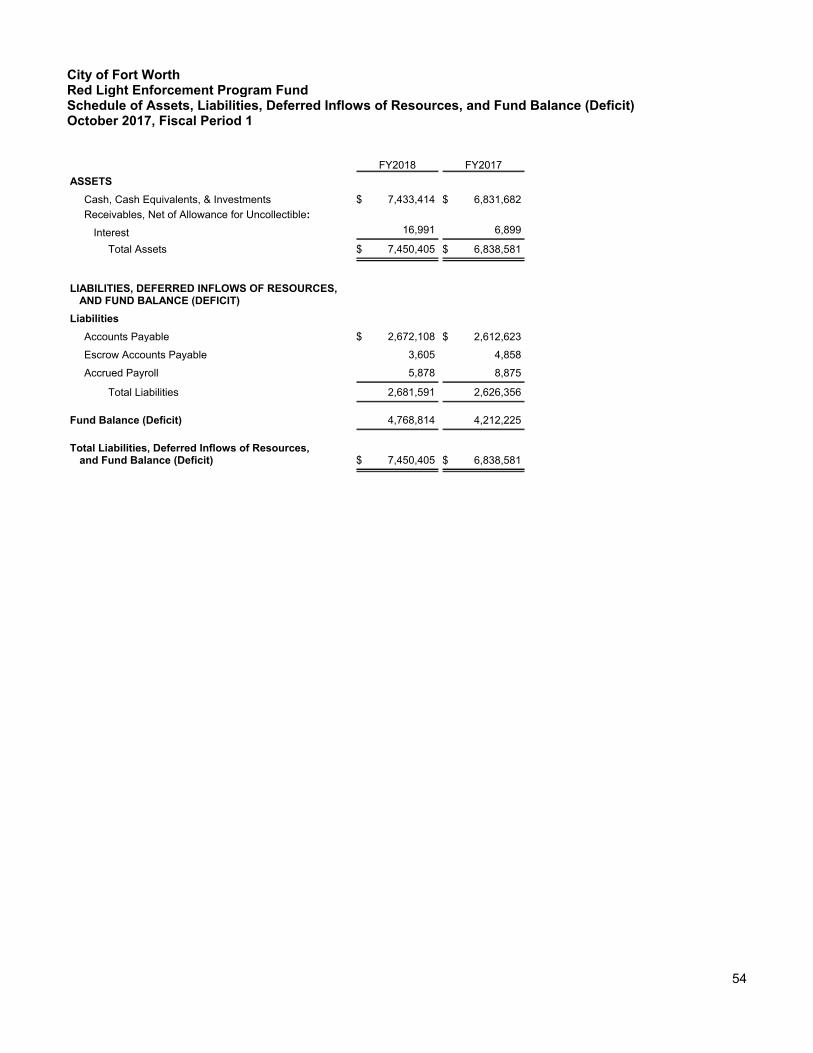
City of Fort WorthRed Light Enforcement Program FundSchedule of Assets, Liabilities, Deferred Inflows of Resources, and Fund Balance (Deficit)October 2017, Fiscal Period 1
FY2018 FY2017
ASSETS
Cash, Cash Equivalents, & Investments $ 7,433,414 $ 6,831,682
Receivables, Net of Allowance for Uncollectible:
Interest 16,991 6,899
Total Assets $ 7,450,405 $ 6,838,581
LIABILITIES, DEFERRED INFLOWS OF RESOURCES,AND FUND BALANCE (DEFICIT)
Liabilities
Accounts Payable $ 2,672,108 $ 2,612,623
Escrow Accounts Payable 3,605 4,858
Accrued Payroll 5,878 8,875
Total Liabilities 2,681,591 2,626,356
Fund Balance (Deficit) 4,768,814 4,212,225
Total Liabilities, Deferred Inflows of Resources,and Fund Balance (Deficit) $ 7,450,405 $ 6,838,581
54

City of Fort WorthRed Light Enforcement Program FundSchedule of Revenues and Expenditures for October 2017, Fiscal Period 1
FY2018 FY2017
AdoptedBudget
AmendedBudget Actuals YTD
% Actualsto Budget
Prior YearActuals YTD
% Actuals toPrior Year
Budget
Beginning Fund Balance (Deficit) $ 4,602,621 $ 4,602,621 $ 4,602,621 $ 3,713,351
Revenues:
Charges for Services 2,000 2,000 50 %2.5 300 %10.0
Fines and Forfeitures 8,873,770 8,873,770 656,560 %7.4 654,544 %8.3
Other 1,586,319 1,586,319 76,046 %4.8 57,375 %4.1
Total Revenues 10,462,089 10,462,089 732,656 %7.0 712,219 %7.6
Expenditures:
Transportation and Public Works 6,284,693 6,284,693 234,920 %3.7 208,787 %3.5
Other Financing Uses:
Transfers Out 3,976,456 3,976,456 331,543 %8.3 4,558 %0.1
Total Expenditures and Other FinancingUses 10,261,149 10,261,149 566,463 %5.5 213,345 %-
Change in Fund Balance 166,193 498,874
Planned Contribution to / (Use of) FundBalance 200,940 200,940
Estimated Ending Fund Balance (Deficit) $ 4,803,561 $ 4,803,561 $ 4,768,814 $ 4,212,225
55

City of Fort WorthEnvironmental Protection FundSchedule of Assets, Liabilities, Deferred Inflows of Resources, and Fund Balance (Deficit)October 2017, Fiscal Period 1
FY2018 FY2017
ASSETS
Cash, Cash Equivalents, & Investments $ 1,316,036 $ 3,741,862
Receivables, Net of Allowance for Uncollectible:
Interest 14,904 7,678
Accounts and Other 357,197 375,510
Total Assets $ 1,688,137 $ 4,125,050
LIABILITIES, DEFERRED INFLOWS OF RESOURCES,AND FUND BALANCE (DEFICIT)
Liabilities
Accounts Payable $ 39,602 $ 175,182
Accrued Payroll 50,271 68,261
Total Liabilities 89,873 243,443
Deferred Inflows of Resources - 6,161
Fund Balance (Deficit) 1,598,264 3,875,446
Total Liabilities, Deferred Inflows of Resources,and Fund Balance (Deficit) $ 1,688,137 $ 4,125,050
56

City of Fort WorthEnvironmental Protection FundSchedule of Revenues and Expenditures for October 2017, Fiscal Period 1
FY2018 FY2017
AdoptedBudget
AmendedBudget Actuals YTD
% Actualsto Budget
Prior YearActuals YTD
% Actuals toPrior Year
Budget
Beginning Fund Balance (Deficit) $ 1,515,400 $ 1,515,400 $ 1,515,400 $ 4,036,731
Revenues:
Charges for Services 3,755,648 3,755,648 312,492 %8.3 297,436 %6.8
Investment Income 58,905 58,905 - %- - %-
Other (1) 19,325 19,325 12,573 %65.1 27 %0.2
Total Revenues 3,833,878 3,833,878 325,065 %8.5 297,463 %6.7
Other Financing Sources:
Transfers In - - - %- 31,087 %8.3
Total Revenues And Other FinancingSources 3,833,878 3,833,878 325,065 %8.5 328,550 %6.8
Expenditures:
Code Compliance 3,300,746 3,300,746 197,593 %6.0 203,205 %5.2
Other Financing Uses:
Transfers Out 533,132 533,132 44,608 %8.4 286,630 %8.3
Total Expenditures and Other FinancingUses 3,833,878 3,833,878 242,201 %6.3 489,835 %-
Change in Fund Balance 82,864 (161,285)
Planned Contribution to / (Use of) FundBalance - -
Estimated Ending Fund Balance (Deficit) $ 1,515,400 $ 1,515,400 $ 1,598,264 $ 3,875,446
Footnotes:
(1) Other - Miscellaneous Revenue is higher than expected and currently under review by the Financial Management Services Department.Any adjustments (if necessary) will be recorded in a future period.
57

City of Fort WorthSpecial Purpose FundSchedule of Assets, Liabilities, Deferred Inflows of Resources, and Fund Balance (Deficit)October 2017, Fiscal Period 1
FY2018 FY2017
ASSETS
Cash, Cash Equivalents, & Investments $ 13,780,711 $ 15,614,570
Cash, Cash Equivalents, & InvestmentsHeld by Trustees (1) 350,360 315,285
Receivables, Net of Allowance for Uncollectible:
Interest 31,746 16,702
Accounts and Other 297,443 146,934
Total Assets $ 14,460,260 $ 16,093,491
LIABILITIES, DEFERRED INFLOWS OF RESOURCES,AND FUND BALANCE (DEFICIT)
Liabilities
Accounts Payable $ 39,456 $ 41,630
Escrow Accounts Payable (1) 334,360 315,214
Accrued Payroll 17,822 61,221
Other - 51,356
Total Liabilities 391,638 469,421
Fund Balance (Deficit) 14,068,622 15,624,070
Total Liabilities, Deferred Inflows of Resources,and Fund Balance (Deficit) $ 14,460,260 $ 16,093,491
Footnotes:
(1) Cash, Cash Equivalents, & Investments Held by Trustees & Escrow Accounts Payable- Monies held by the Trustee that may be awarded to other governmental agencies orindividuals. These monies relate to investment earnings from gas lease revenues for the WHLittle property.
58

City of Fort WorthSpecial Purpose FundSchedule of Revenues and Expenditures for October 2017, Fiscal Period 1
FY2018 FY2017
AdoptedBudget
AmendedBudget Actuals YTD
% Actualsto Budget
Prior YearActuals YTD
% Actuals toPrior Year
Budget
Beginning Fund Balance (Deficit) $ 13,783,840 $ 13,783,840 $ 13,783,840 $ 15,443,336
Revenues:
Charges for Services 1,516,672 1,516,672 198,048 %13.1 85,234 %5.2
Municipal Court Fees 510,322 510,322 52,576 %10.3 47,636 %6.0
Investment Income 21,462 21,462 250 %1.2 458 %2.1
Intergovernmental 148,089 148,089 - %- - %-
Public Educaton & Government AccessFunding 1,198,003 1,198,003 160,754 %13.4 140,953 %11.7
Contributions 221,000 221,000 11,846 %5.4 198,058 %10.3
Total Revenues 3,615,548 3,615,548 423,474 %11.7 472,339 %8.2
Other Financing Sources:
Transfers In - - - %- 6,914 %8.3
Total Revenues And Other FinancingSources 3,615,548 3,615,548 423,474 %11.7 479,253 %8.2
Expenditures:
City Manager's Office 331,575 331,575 4,907 %1.5 519 %38.7
Code Compliance - - - %- 2,801 %-
Municipal Courts 825,709 825,709 16,897 %2.0 35,565 %5.0
Neighborhood Services 276,986 276,986 4,365 %1.6 1,518 %0.5
Parks and Recreation 1,360,686 1,360,686 28,842 %2.1 131,680 %3.9
Police 148,089 148,089 348 %0.2 2,650 %1.8
Transportation and Public Works - - - %- 869 %40.9
Total Expenditures 2,943,045 2,943,045 55,359 %1.9 175,602 %3.9
Other Financing Uses:
Transfers Out 1,000,000 1,000,000 83,333 %8.3 122,917 %8.3
Total Expenditures and Other FinancingUses 3,943,045 3,943,045 138,692 %3.5 298,519 %5.0
Change in Fund Balance 284,782 180,734
Planned Contribution to / (Use of) FundBalance (327,497) (327,497)
Estimated Ending Fund Balance (Deficit) $ 13,456,343 $ 13,456,343 $ 14,068,622 $ 15,624,070
59
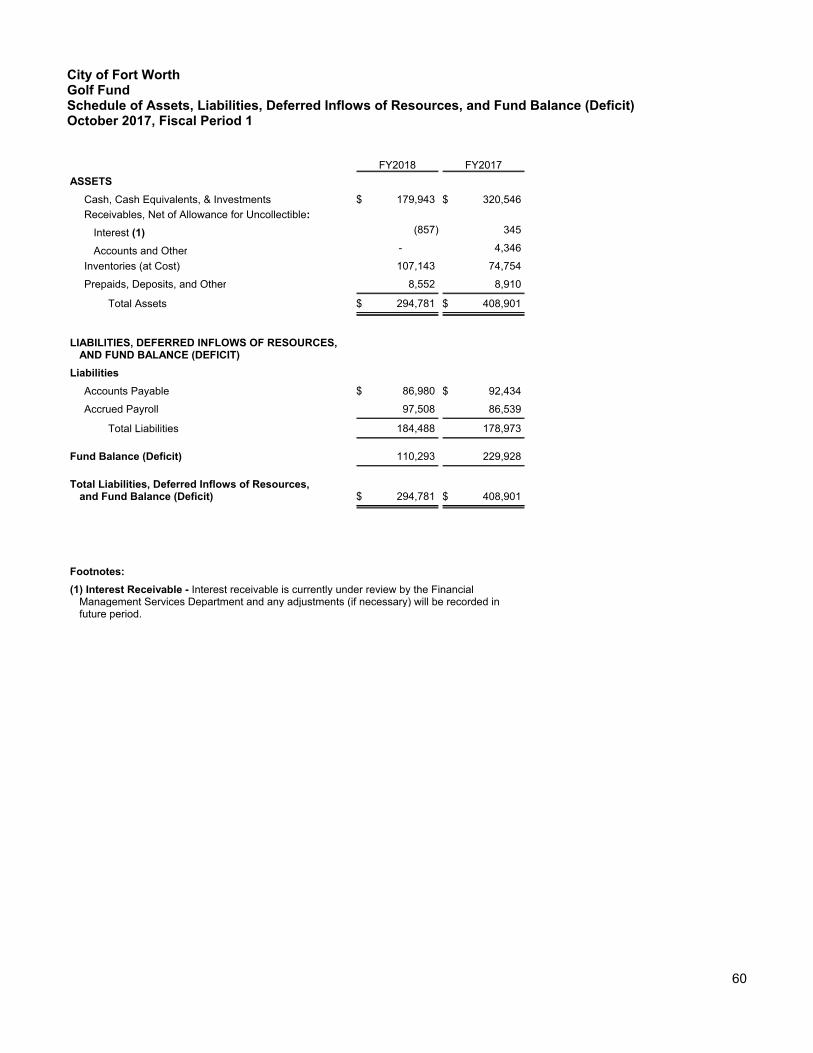
City of Fort WorthGolf FundSchedule of Assets, Liabilities, Deferred Inflows of Resources, and Fund Balance (Deficit)October 2017, Fiscal Period 1
FY2018 FY2017
ASSETS
Cash, Cash Equivalents, & Investments $ 179,943 $ 320,546
Receivables, Net of Allowance for Uncollectible:
Interest (1) (857) 345
Accounts and Other - 4,346
Inventories (at Cost) 107,143 74,754
Prepaids, Deposits, and Other 8,552 8,910
Total Assets $ 294,781 $ 408,901
LIABILITIES, DEFERRED INFLOWS OF RESOURCES,AND FUND BALANCE (DEFICIT)
Liabilities
Accounts Payable $ 86,980 $ 92,434
Accrued Payroll 97,508 86,539
Total Liabilities 184,488 178,973
Fund Balance (Deficit) 110,293 229,928
Total Liabilities, Deferred Inflows of Resources,and Fund Balance (Deficit) $ 294,781 $ 408,901
Footnotes:
(1) Interest Receivable - Interest receivable is currently under review by the FinancialManagement Services Department and any adjustments (if necessary) will be recorded infuture period.
60

City of Fort WorthGolf FundSchedule of Revenues and Expenditures for October 2017, Fiscal Period 1
FY2018 FY2017
AdoptedBudget
AmendedBudget Actuals YTD
% Actualsto Budget
Prior YearActuals YTD
% Actuals toPrior Year
Budget
Beginning Fund Balance (Deficit) $ - $ - $ - %- $ 272,323
Revenues:
Charges for Services 4,602,391 4,602,391 391,575 %8.5 274,507 %5.9
Other 10,000 10,000 278 %2.8 255 %2.6
Total Revenues 4,612,391 4,612,391 391,853 %8.5 274,762 %5.9
Other Financing Sources:
Transfers In 615,000 615,000 51,250 %8.3 - %-
Total Revenues And Other FinancingSources 5,227,391 5,227,391 443,103 %8.5 274,762 %4.7
Expenditures:
Parks and Recreation 5,134,109 5,134,109 331,707 %6.5 316,054 %5.4
Other Financing Uses:
Transfers Out 93,282 93,282 1,103 %1.2 1,103 %8.3
Total Expenditures and Other FinancingUses 5,227,391 5,227,391 332,810 %6.4 317,157 %-
Change in Fund Balance 110,293 (42,395)
Planned Contribution to / (Use of) FundBalance - -
Estimated Ending Fund Balance (Deficit) $ - $ - $ 110,293 $ 229,928
61

GOLF FUND
'(7$,/('
SCHEDULES

City of Fort WorthGolf FundMeadowbrook Golf CourseSchedule of Revenues and Expenditures for October 2017, Fiscal Period 1
FY2018 FY2017
AdoptedBudget
AmendedBudget Actuals YTD
% Actualsto Budget
Prior YearActuals YTD
% Actuals toPrior Year
Budget
Revenues:
Charges for Services $ 1,044,222 $ 1,044,222 $ 64,988 %6.2 $ 84,888 %8.2
Other - - 162 %- 113 %-
Total Revenues 1,044,222 1,044,222 65,150 %6.2 85,001 %8.2
Expenditures:
Salaries and Wages 481,160 481,160 67,181 %14.0 42,043 %8.1
Employee Benefits 167,486 167,486 9,710 %5.8 14,045 %9.0
Professional and Technical Services 85,617 85,617 5,510 %6.4 3,816 %5.6
Purchased Property Services 161,727 161,727 2,260 %1.4 6,792 %3.9
Other Purchased Services 14,030 14,030 1,881 %13.4 508 %17.7
Supplies 236,421 236,421 1,393 %0.6 2,931 %1.3
Total Expenditures 1,146,441 1,146,441 87,935 %7.7 70,135 %6.1
Net Impact $ (102,219) $ (102,219) $ (22,785) $ 14,866
64

City of Fort WorthGolf FundPecan Valley Golf CourseSchedule of Revenues and Expenditures for October 2017, Fiscal Period 1
FY2018 FY2017
AdoptedBudget
AmendedBudget Actuals YTD
% Actualsto Budget
Prior YearActuals YTD
% Actuals toPrior Year
Budget
Revenues:
Charges for Services $ 2,098,117 $ 2,098,117 $ 130,845 %6.2 $ 155,823 %7.7
Other - - 23 %- 194 %-
Total Revenues 2,098,117 2,098,117 130,868 %6.2 156,017 %7.7
Expenditures:
Salaries and Wages 621,836 621,836 44,973 %7.2 49,188 %7.7
Employee Benefits 277,678 277,678 18,924 %6.8 18,826 %7.5
Professional and Technical Services 130,485 130,485 9,029 %6.9 7,319 %7.0
Purchased Property Services 212,214 212,214 2,695 %1.3 9,104 %3.7
Other Purchased Services 18,403 18,403 2,152 %11.7 550 %16.8
Supplies 386,238 386,238 4,721 %1.2 19,635 %5.3
Total Expenditures 1,646,854 1,646,854 82,494 %5.0 104,622 %6.5
Net Impact $ 451,263 $ 451,263 $ 48,374 $ 51,395
65
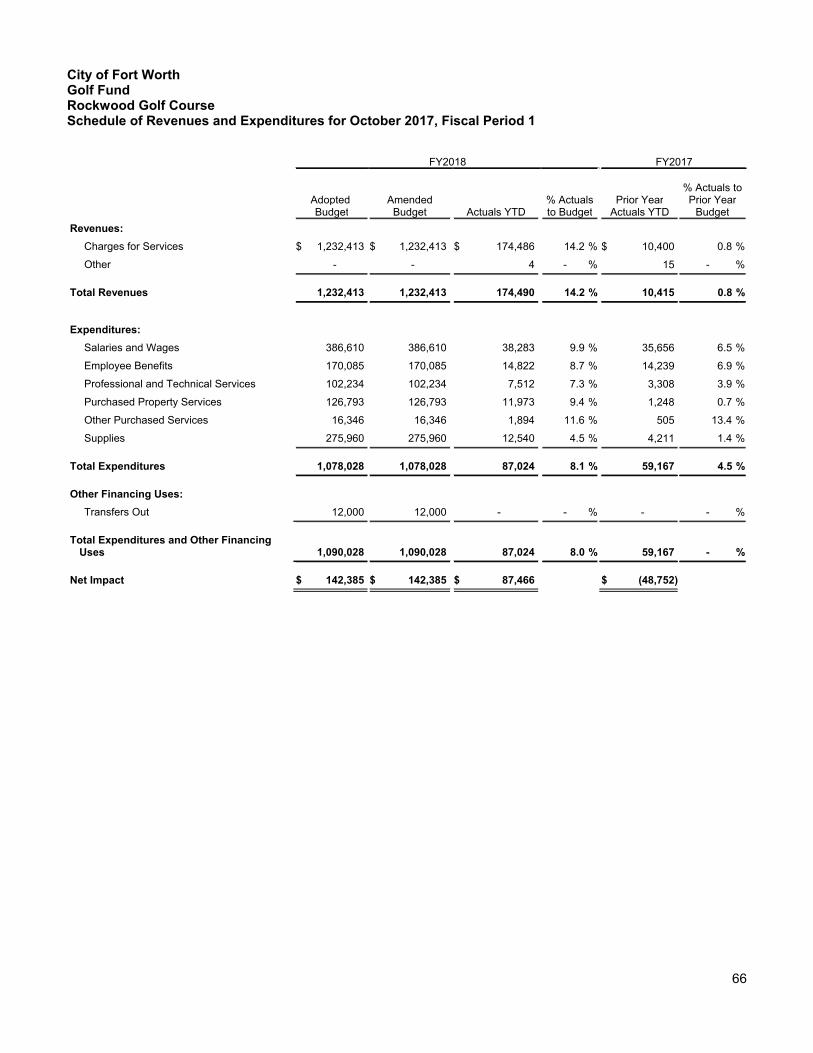
City of Fort WorthGolf FundRockwood Golf CourseSchedule of Revenues and Expenditures for October 2017, Fiscal Period 1
FY2018 FY2017
AdoptedBudget
AmendedBudget Actuals YTD
% Actualsto Budget
Prior YearActuals YTD
% Actuals toPrior Year
Budget
Revenues:
Charges for Services $ 1,232,413 $ 1,232,413 $ 174,486 %14.2 $ 10,400 %0.8
Other - - 4 %- 15 %-
Total Revenues 1,232,413 1,232,413 174,490 %14.2 10,415 %0.8
Expenditures:
Salaries and Wages 386,610 386,610 38,283 %9.9 35,656 %6.5
Employee Benefits 170,085 170,085 14,822 %8.7 14,239 %6.9
Professional and Technical Services 102,234 102,234 7,512 %7.3 3,308 %3.9
Purchased Property Services 126,793 126,793 11,973 %9.4 1,248 %0.7
Other Purchased Services 16,346 16,346 1,894 %11.6 505 %13.4
Supplies 275,960 275,960 12,540 %4.5 4,211 %1.4
Total Expenditures 1,078,028 1,078,028 87,024 %8.1 59,167 %4.5
Other Financing Uses:
Transfers Out 12,000 12,000 - %- - %-
Total Expenditures and Other FinancingUses 1,090,028 1,090,028 87,024 %8.0 59,167 %-
Net Impact $ 142,385 $ 142,385 $ 87,466 $ (48,752)
66

City of Fort WorthGolf FundSycamore Golf CourseSchedule of Revenues and Expenditures for October 2017, Fiscal Period 1
FY2018 FY2017
AdoptedBudget
AmendedBudget Actuals YTD
% Actualsto Budget
Prior YearActuals YTD
% Actuals toPrior Year
Budget
Revenues:
Charges for Services $ 227,639 $ 227,639 $ 21,255 %9.3 $ 23,396 %10.4
Other - - 89 %- (67) %-
Total Revenues 227,639 227,639 21,344 %9.4 23,329 %10.3
Expenditures:
Salaries and Wages 169,680 169,680 14,562 %8.6 15,402 %7.4
Employee Benefits 85,687 85,687 6,031 %7.0 6,339 %7.6
Professional and Technical Services 43,491 43,491 2,647 %6.1 1,569 %4.3
Purchased Property Services 94,143 94,143 7,802 %8.3 2,004 %2.1
Other Purchased Services 10,415 10,415 602 %5.8 68 %7.5
Supplies 68,334 68,334 (5) %- 236 %0.4
Total Expenditures 471,750 471,750 31,639 %6.7 25,618 %5.2
Net Impact $ (244,111) $ (244,111) $ (10,295) $ (2,289)
67

&8/785(�$1'�
7285,60
)81'6
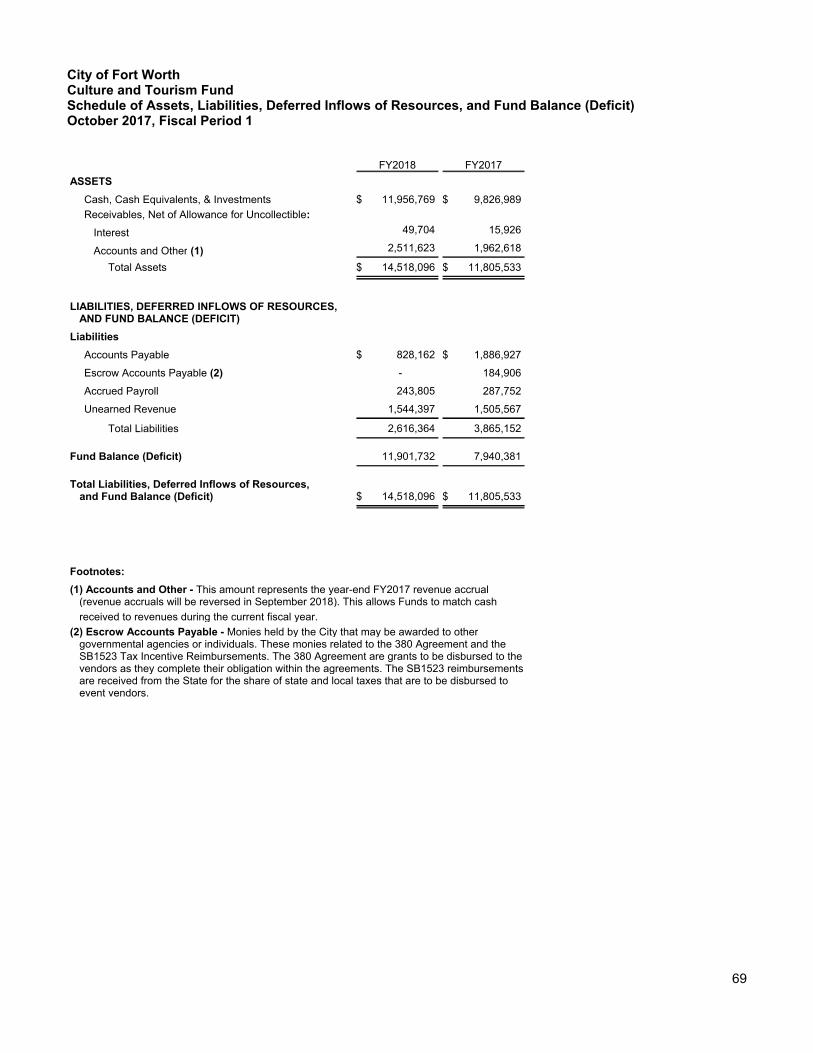
City of Fort WorthCulture and Tourism FundSchedule of Assets, Liabilities, Deferred Inflows of Resources, and Fund Balance (Deficit)October 2017, Fiscal Period 1
FY2018 FY2017
ASSETS
Cash, Cash Equivalents, & Investments $ 11,956,769 $ 9,826,989
Receivables, Net of Allowance for Uncollectible:
Interest 49,704 15,926
Accounts and Other (1) 2,511,623 1,962,618
Total Assets $ 14,518,096 $ 11,805,533
LIABILITIES, DEFERRED INFLOWS OF RESOURCES,AND FUND BALANCE (DEFICIT)
Liabilities
Accounts Payable $ 828,162 $ 1,886,927
Escrow Accounts Payable (2) - 184,906
Accrued Payroll 243,805 287,752
Unearned Revenue 1,544,397 1,505,567
Total Liabilities 2,616,364 3,865,152
Fund Balance (Deficit) 11,901,732 7,940,381
Total Liabilities, Deferred Inflows of Resources,and Fund Balance (Deficit) $ 14,518,096 $ 11,805,533
Footnotes:
(1) Accounts and Other - This amount represents the year-end FY2017 revenue accrual(revenue accruals will be reversed in September 2018). This allows Funds to match cash
received to revenues during the current fiscal year.
(2) Escrow Accounts Payable - Monies held by the City that may be awarded to othergovernmental agencies or individuals. These monies related to the 380 Agreement and theSB1523 Tax Incentive Reimbursements. The 380 Agreement are grants to be disbursed to thevendors as they complete their obligation within the agreements. The SB1523 reimbursementsare received from the State for the share of state and local taxes that are to be disbursed toevent vendors.
69

City of Fort WorthCulture and Tourism FundSchedule of Revenues and Expenditures for October 2017, Fiscal Period 1
FY2018 FY2017
AdoptedBudget
AmendedBudget Actuals YTD
% Actualsto Budget
Prior YearActuals YTD
% Actuals toPrior Year
Budget
Beginning Fund Balance (Deficit) $ 11,723,250 $ 11,723,250 $ 11,723,250 $ 8,367,845
Revenues:
Other Local Taxes 22,639,968 22,639,968 1,960,954 %8.7 1,777,712 %8.3
Charges for Services 3,445,708 3,445,708 96,143 %2.8 242,656 %7.2
Licenses and Permits 20,000 20,000 3,000 %15.0 1,650 %8.3
Use of Money and Property 6,489,000 6,489,000 431,208 %6.6 623,503 %10.9
Investment Income 200,000 200,000 - %- - %-
Other 1,873,000 1,873,000 83,750 %4.5 195,062 %9.6
Contributions 800,344 800,344 - %- - %-
Total Revenues 35,468,020 35,468,020 2,575,055 %7.3 2,840,583 %8.6
Other Financing Sources:
Transfers In 5,013,602 5,013,602 417,799 %8.3 - %-
Total Revenues And Other FinancingSources 40,481,622 40,481,622 2,992,854 %7.4 2,840,583 %8.3
Expenditures:
Culture and Tourism 35,330,979 35,330,979 2,274,491 %6.4 3,189,922 %10.4
Other Financing Uses:
Transfers Out 5,150,643 5,150,643 539,881 %10.5 78,125 %2.2
Total Expenditures and Other FinancingUses 40,481,622 40,481,622 2,814,372 %7.0 - %-
Change in Fund Balance 178,482 (427,464)
Planned Contribution to / (Use of) FundBalance - -
Estimated Ending Fund Balance (Deficit) $ 11,723,250 $ 11,723,250 $ 11,901,732 $ 7,940,381
70

City of Fort WorthCulture and Tourism 2% City Hotel FundSchedule of Assets, Liabilities, Deferred Inflows of Resources, and Fund Balance (Deficit)October 2017, Fiscal Period 1
FY2018 FY2017
ASSETS
Cash, Cash Equivalents, & Investments (1) $ (126,766) $ (870,291)
Receivables, Net of Allowance for Uncollectible:
Accounts and Other (2) 563,713 507,916
Total Assets $ 436,947 $ (362,375)
LIABILITIES, DEFERRED INFLOWS OF RESOURCES,AND FUND BALANCE (DEFICIT)
Fund Balance (Deficit) $ 436,947 $ (362,375)
Total Liabilities, Deferred Inflows of Resources,and Fund Balance (Deficit) $ 436,947 $ (362,375)
Footnotes:
(1) Cash, Cash Equivalents, & Investments - For the purposes of the investment incomeallocation, this Fund's negative cash position is combined with the Culture and Tourism DebtService Fund, therefore the Culture and Tourism Debt Service Fund receives less investmentincome as a result.
(2) Accounts and Other - This amount represents the year-end FY2017 revenue accrual(revenue accruals will be reversed in September 2018). This allows Funds to match cashreceived to revenues during the current fiscal year.
71

City of Fort WorthCulture and Tourism 2% City Hotel FundSchedule of Revenues and Expenditures for October 2017, Fiscal Period 1
FY2018 FY2017
AdoptedBudget
AmendedBudget Actuals YTD
% Actualsto Budget
Prior YearActuals YTD
% Actuals toPrior Year
Budget
Beginning Fund Balance (Deficit) $ 563,713 $ 563,713 $ 563,713 $ -
Revenues:
Other Local Taxes (1) 6,454,276 6,454,276 563,713 %8.7 507,916 %8.3
Other Financing Uses:
Transfers Out 6,454,276 6,454,276 690,479 %10.7 870,291 %14.2
Change in Fund Balance (126,766) (362,375)
Planned Contribution to / (Use of) FundBalance - -
Estimated Ending Fund Balance (Deficit) $ 563,713 $ 563,713 $ 436,947 $ (362,375)
Footnotes:
(1) Other Local Taxes - This amount represents the year-end FY2017 revenue accrual (revenue accruals will be reversed in September 2018).This allows Funds to match cash received to revenues during the current fiscal year.
72

City of Fort WorthCulture and Tourism Project Financing Zone FundSchedule of Assets, Liabilities, Deferred Inflows of Resources, and Fund Balance (Deficit)October 2017, Fiscal Period 1
FY2018 FY2017
ASSETS
Cash, Cash Equivalents, & Investments $ 4,046,768 $ 2,762,430
Receivables, Net of Allowance for Uncollectible:
Accounts and Other (1) 352,572 352,572
Total Assets $ 4,399,340 $ 3,115,002
LIABILITIES, DEFERRED INFLOWS OF RESOURCES,AND FUND BALANCE (DEFICIT)
Fund Balance (Deficit) $ 4,399,340 $ 3,115,002
Total Liabilities, Deferred Inflows of Resources,and Fund Balance (Deficit) $ 4,399,340 $ 3,115,002
Footnotes:
(1) Accounts and Other - The FY2016 revenue accrual has yet to be reversed on the FY2017CAFR, therefore, in Period 2 this amount will be $0.
73

City of Fort WorthCulture and Tourism Project Financing Zone FundSchedule of Revenues and Expenditures for October 2017, Fiscal Period 1
FY2018 FY2017
AdoptedBudget
AmendedBudget Actuals YTD
% Actualsto Budget
Prior YearActuals YTD
% Actuals toPrior Year
Budget
Beginning Fund Balance (Deficit) $ 4,450,152 $ 4,450,152 $ 4,450,152 $ 3,115,002
Revenues:
Intergovernmental 2,598,779 2,598,779 - %- - %-
Other Financing Uses:
Transfers Out 504,369 504,369 50,812 %10.1 - %-
Change in Fund Balance (50,812) -
Planned Contribution to / (Use of) FundBalance 2,094,410 2,094,410
Estimated Ending Fund Balance (Deficit) $ 6,544,562 $ 6,544,562 $ 4,399,340 $ 3,115,002
74

City of Fort WorthDFW Revenue Sharing FundSchedule of Assets, Liabilities, Deferred Inflows of Resources, and Fund Balance (Deficit)October 2017, Fiscal Period 1
FY2018 FY2017
ASSETS
Cash, Cash Equivalents, & Investments $ 332,764 $ (366,115)
LIABILITIES, DEFERRED INFLOWS OF RESOURCES,AND FUND BALANCE (DEFICIT)
Fund Balance (Deficit) $ 332,764 $ (366,115)
Total Liabilities, Deferred Inflows of Resources,and Fund Balance (Deficit) $ 332,764 $ (366,115)
75

City of Fort WorthDFW Revenue Sharing FundSchedule of Revenues and Expenditures for October 2017, Fiscal Period 1
FY2018 FY2017
AdoptedBudget
AmendedBudget Actuals YTD
% Actualsto Budget
Prior YearActuals YTD
% Actuals toPrior Year
Budget
Beginning Fund Balance (Deficit) $ 925,638 $ 925,638 $ 925,638 $ 315,339
Revenues:
Other Local Taxes 5,900,000 5,900,000 - %- - %-
Other Financing Uses:
Transfers Out 5,900,000 5,900,000 592,874 %10.0 681,454 %12.4
Change in Fund Balance (592,874) (681,454)
Planned Contribution to / (Use of) FundBalance - -
Estimated Ending Fund Balance (Deficit) $ 925,638 $ 925,638 $ 332,764 $ (366,115)
76
*5$17 )81'6

City of Fort WorthGrants Operating Federal FundSchedule of Assets, Liabilities, Deferred Inflows of Resources, and Fund Balance (Deficit)October 2017, Fiscal Period 1
FY2018 FY2017
ASSETS
Cash, Cash Equivalents, & Investments (1) $ (496,368) $ 877,459
Receivables, Net of Allowance for Uncollectible:
Grants and Other Governments 1,140,895 4,345,513
Loans 12,003,114 10,220,743
Interest - 6,143
Inventories (at Cost) - (32)
Long-Term Loans Receivable 13,695,807 10,782,941
Total Assets $ 26,343,448 $ 26,232,767
LIABILITIES, DEFERRED INFLOWS OF RESOURCES,AND FUND BALANCE (DEFICIT)
Liabilities
Accounts Payable $ 235,071 $ 380,533
Escrow Accounts Payable (2) 74,256 71,982
Accrued Payroll 276,580 358,768
Unearned Revenue (3) 25,698,921 23,712,173
Total Liabilities 26,284,828 24,523,456
Deferred Inflows of Resources - 2,069,958
Fund Balance (Deficit) 58,620 (360,647)
Total Liabilities, Deferred Inflows of Resources,and Fund Balance (Deficit) $ 26,343,448 $ 26,232,767
Footnotes:
(1) Cash, Cash Equivalents, & Investments - For the purposes of the investment incomeallocation, this Fund's negative cash position is combined with the General Debt Service Fund,therefore the General Debt Service Fund receives less investment income as a result.
(2) Escrow Accounts Payable - Monies held by the City that may be awarded to othergovernmental agencies or individuals.
(3) Unearned Revenue - Money received from grantors prior to the City completing therequirements of the grants.
78

City of Fort WorthGrants Operating Federal Fund * Schedule of Revenues and Expenditures for October 2017, Fiscal Period 1
FY2018 FY2017
Actuals YTDPrior Year
Actuals YTD
Beginning Fund Balance (Deficit) $ 1,243,571 $ 447,370
Revenues:
Use of Money and Property 200,776 14,084
Investment Income 20,298 4
Intergovernmental (1) 37,711 649,861
Other 7 -
Total Revenues 258,792 663,949
Expenditures:
City Manager's Office 57,923 57,470
Code Compliance 58,202 35,661
Financial Management Services 1,652 13,691
Fire 165,783 152,627
Neighborhood Services 999,031 951,637
Parks and Recreation 968 3,416
Planning and Development 5,243 5,526
Police 148,830 251,938
Transportation and Public Works 6,111 -
Total Expenditures 1,443,743 1,471,966
Change in Fund Balance (2) (1,184,951) (808,017)
Estimated Ending Fund Balance (Deficit) $ 58,620 $ (360,647)
Footnotes:
(1) Intergovernmental Revenue - Lower amounts of Intergovernmental Revenuereceived from Health/Human Services in FY2018 as of the report date.
(2) Change in Fund Balance - Deficit due to timing difference between whenexpenditures are paid and when the Grant requests reimbursement.
* Each Grant has a separately adopted budget that can span over multiple years,therefore, no Adopted Budget or Amended Budget amounts are presented.
79
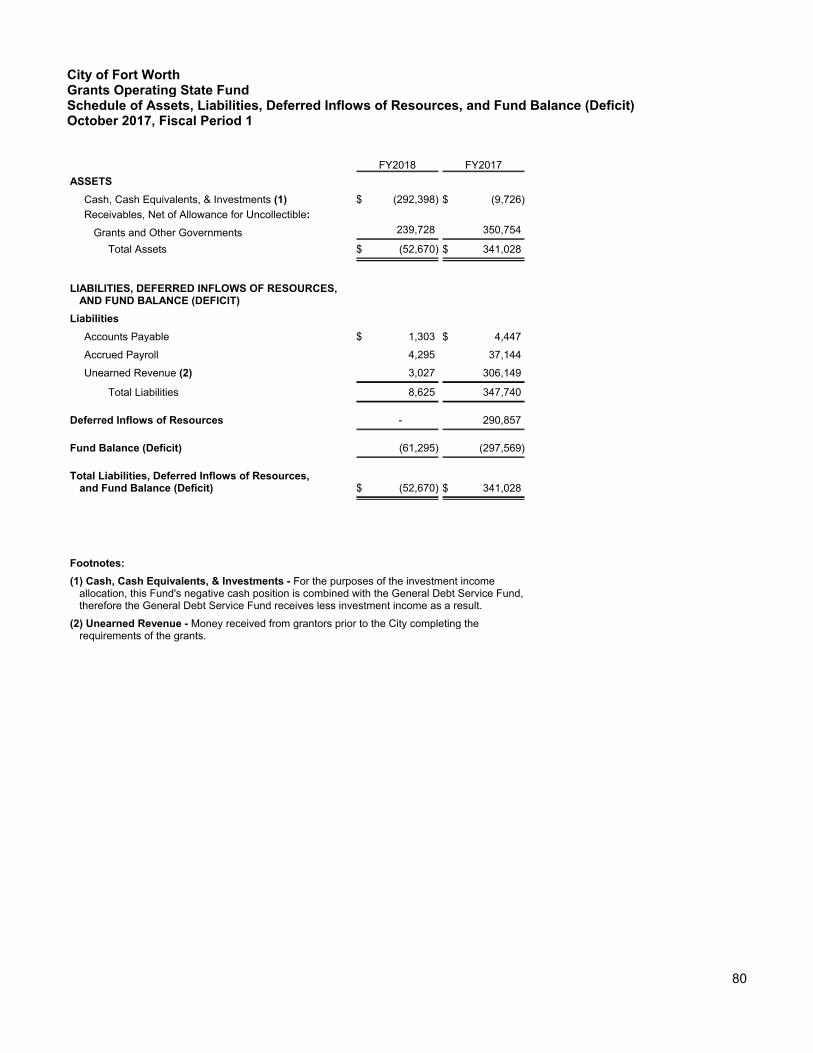
City of Fort WorthGrants Operating State FundSchedule of Assets, Liabilities, Deferred Inflows of Resources, and Fund Balance (Deficit)October 2017, Fiscal Period 1
FY2018 FY2017
ASSETS
Cash, Cash Equivalents, & Investments (1) $ (292,398) $ (9,726)
Receivables, Net of Allowance for Uncollectible:
Grants and Other Governments 239,728 350,754
Total Assets $ (52,670) $ 341,028
LIABILITIES, DEFERRED INFLOWS OF RESOURCES,AND FUND BALANCE (DEFICIT)
Liabilities
Accounts Payable $ 1,303 $ 4,447
Accrued Payroll 4,295 37,144
Unearned Revenue (2) 3,027 306,149
Total Liabilities 8,625 347,740
Deferred Inflows of Resources - 290,857
Fund Balance (Deficit) (61,295) (297,569)
Total Liabilities, Deferred Inflows of Resources,and Fund Balance (Deficit) $ (52,670) $ 341,028
Footnotes:
(1) Cash, Cash Equivalents, & Investments - For the purposes of the investment incomeallocation, this Fund's negative cash position is combined with the General Debt Service Fund,therefore the General Debt Service Fund receives less investment income as a result.
(2) Unearned Revenue - Money received from grantors prior to the City completing therequirements of the grants.
80

City of Fort WorthGrants Operating State Fund * Schedule of Revenues and Expenditures for October 2017, Fiscal Period 1
FY2018 FY2017
Actuals YTDPrior Year
Actuals YTD
Beginning Fund Balance (Deficit) $ (84,890) $ (247,561)
Revenues:
Intergovernmental 43,512 33,264
Expenditures:
Code Compliance 3,583 19,520
Economic Development - 48,533
Neighborhood Services 6,253 -
Police 9,920 15,219
Transportation and Public Works 161 -
Total Expenditures 19,917 83,272
Change in Fund Balance 23,595 (50,008)
Estimated Ending Fund Balance (Deficit) (1) $ (61,295) $ (297,569)
Footnotes:
(1) Estimated Ending Fund Balance (Deficit) - Deficit due to timing differencebetween when expenditures are paid and when the Grant requests reimbursement.The majority of the grants in this fund are reimbursement grants.
* Each Grant has a separately adopted budget that can span over multiple years,therefore, no Adopted Budget or Amended Budget amounts are presented.
81

City of Fort WorthGrants Operating Other FundSchedule of Assets, Liabilities, Deferred Inflows of Resources, and Fund Balance (Deficit)October 2017, Fiscal Period 1
FY2018 FY2017
ASSETS
Cash, Cash Equivalents, & Investments $ 114,914 $ 1,473,251
Receivables, Net of Allowance for Uncollectible:
Grants and Other Governments 52,158 222,893
Total Assets $ 167,072 $ 1,696,144
LIABILITIES, DEFERRED INFLOWS OF RESOURCES,AND FUND BALANCE (DEFICIT)
Liabilities
Accounts Payable $ 43,799 $ 8,851
Fund Balance (Deficit) 117,265 1,255,480
Total Liabilities, Deferred Inflows of Resources,and Fund Balance (Deficit) $ 167,072 $ 1,696,144
82

City of Fort WorthGrants Operating Other Fund * Schedule of Revenues and Expenditures for October 2017, Fiscal Period 1
FY2018 FY2017
Actuals YTDPrior Year
Actuals YTD
Beginning Fund Balance (Deficit) $ 198,193 $ 1,326,069
Revenues:
Intergovernmental 18,296 -
Other - 50
Contributions 21,008 37,559
Total Revenues 39,304 37,609
Expenditures:
Culture and Tourism 134 -
Financial Management Services 2,132 -
Fire 45 -
Information Systems 3 -
Neighborhood Services 101,514 113,409
Parks and Recreation (316) (5,211)
Police 15,303 -
Transportation and Public Works 1,417 -
Total Expenditures 120,232 108,198
Change in Fund Balance (1) (80,928) (70,589)
Estimated Ending Fund Balance (Deficit) $ 117,265 $ 1,255,480
Footnotes:
(1) Change in Fund Balance - Deficit due to timing difference between whenexpenditures are paid and when the Grant requests reimbursement.
* Each Grant has a separately adopted budget that can span over multiple years,therefore, no Adopted Budget or Amended Budget amounts are presented.
83

$66(7�)25)(,785(�
)81'6

City of Fort WorthTreasury Asset Forfeiture FundSchedule of Assets, Liabilities, Deferred Inflows of Resources, and Fund Balance (Deficit)October 2017, Fiscal Period 1
FY2018 FY2017
ASSETS
Cash, Cash Equivalents, & Investments $ 36,822 $ 1,261,653
Receivables, Net of Allowance for Uncollectible:
Interest 2,083 1,946
Total Assets $ 38,905 $ 1,263,599
LIABILITIES, DEFERRED INFLOWS OF RESOURCES,AND FUND BALANCE (DEFICIT)
Fund Balance (Deficit) $ 38,905 $ 1,263,599
Total Liabilities, Deferred Inflows of Resources,and Fund Balance (Deficit) $ 38,905 $ 1,263,599
85
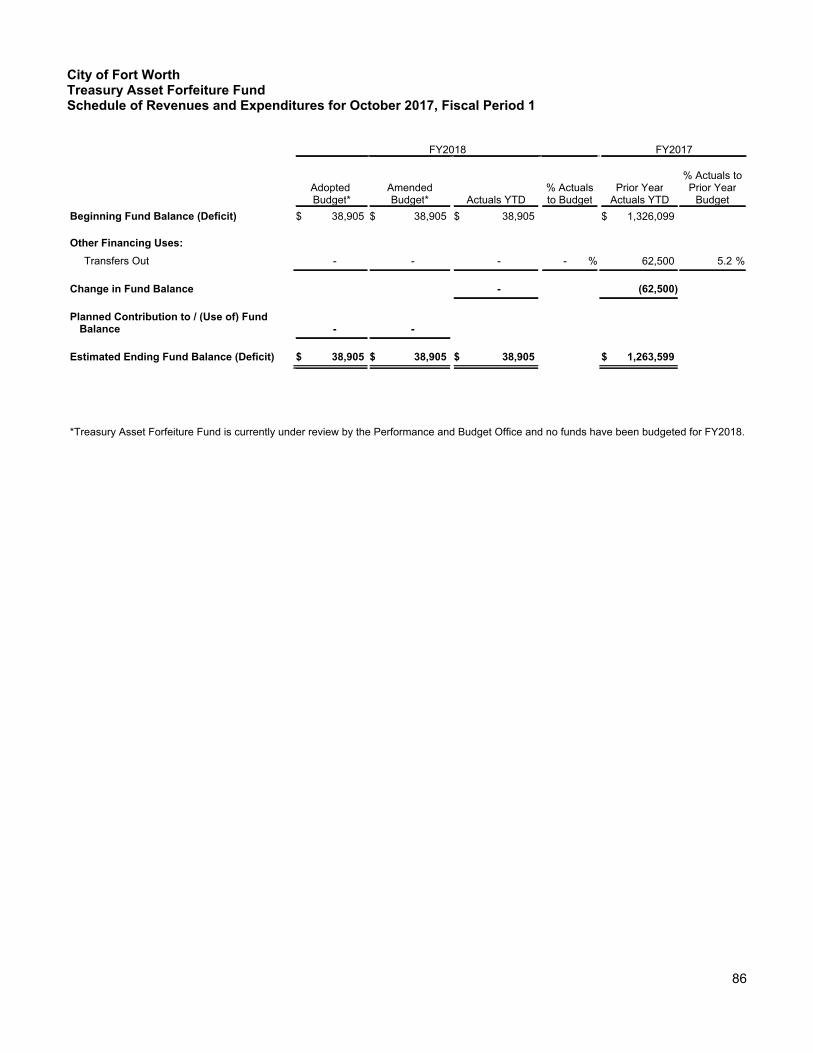
City of Fort WorthTreasury Asset Forfeiture FundSchedule of Revenues and Expenditures for October 2017, Fiscal Period 1
FY2018 FY2017
AdoptedBudget*
AmendedBudget* Actuals YTD
% Actualsto Budget
Prior YearActuals YTD
% Actuals toPrior Year
Budget
Beginning Fund Balance (Deficit) $ 38,905 $ 38,905 $ 38,905 $ 1,326,099
Other Financing Uses:
Transfers Out - - - %- 62,500 %5.2
Change in Fund Balance - (62,500)
Planned Contribution to / (Use of) FundBalance - -
Estimated Ending Fund Balance (Deficit) $ 38,905 $ 38,905 $ 38,905 $ 1,263,599
*Treasury Asset Forfeiture Fund is currently under review by the Performance and Budget Office and no funds have been budgeted for FY2018.
86
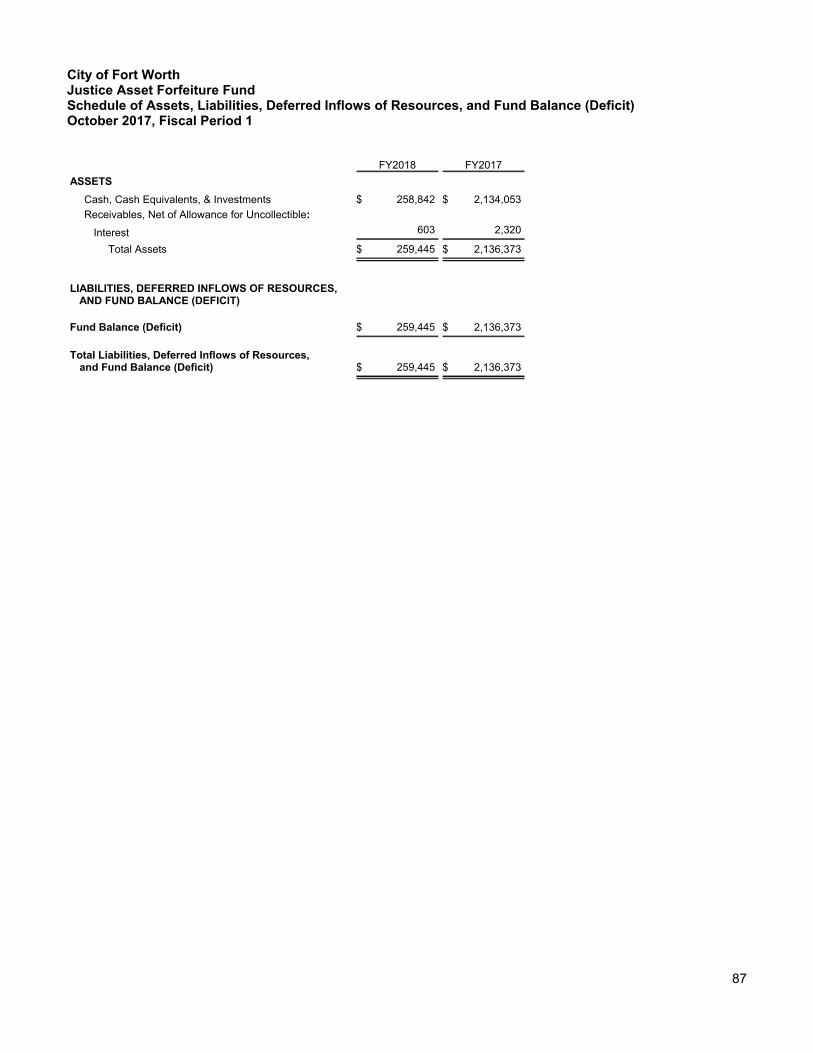
City of Fort WorthJustice Asset Forfeiture FundSchedule of Assets, Liabilities, Deferred Inflows of Resources, and Fund Balance (Deficit)October 2017, Fiscal Period 1
FY2018 FY2017
ASSETS
Cash, Cash Equivalents, & Investments $ 258,842 $ 2,134,053
Receivables, Net of Allowance for Uncollectible:
Interest 603 2,320
Total Assets $ 259,445 $ 2,136,373
LIABILITIES, DEFERRED INFLOWS OF RESOURCES,AND FUND BALANCE (DEFICIT)
Fund Balance (Deficit) $ 259,445 $ 2,136,373
Total Liabilities, Deferred Inflows of Resources,and Fund Balance (Deficit) $ 259,445 $ 2,136,373
87

City of Fort WorthJustice Asset Forfeiture FundSchedule of Revenues and Expenditures for October 2017, Fiscal Period 1
FY2018 FY2017
AdoptedBudget*
AmendedBudget* Actuals YTD
% Actualsto Budget
Prior YearActuals YTD
% Actuals toPrior Year
Budget
Beginning Fund Balance (Deficit) $ 259,326 $ 259,326 $ 259,326 $ 2,161,881
Revenues:
Intergovernmental - - 119 %- - %-
Other Financing Uses:
Transfers Out - - - %- 25,508 %-
Change in Fund Balance 119 (25,508)
Planned Contribution to / (Use of) FundBalance - -
Estimated Ending Fund Balance (Deficit) $ 259,326 $ 259,326 $ 259,445 $ 2,136,373
*Justice Asset Forfeiture Fund is currently under review by the Performance and Budget Office and no funds have been budgeted for FY2018.
88

City of Fort WorthState Asset Forfeiture FundSchedule of Assets, Liabilities, Deferred Inflows of Resources, and Fund Balance (Deficit)October 2017, Fiscal Period 1
FY2018 FY2017
ASSETS
Cash, Cash Equivalents, & Investments $ 429,351 $ 987,451
Receivables, Net of Allowance for Uncollectible:
Interest 898 1,063
Total Assets $ 430,249 $ 988,514
LIABILITIES, DEFERRED INFLOWS OF RESOURCES,AND FUND BALANCE (DEFICIT)
Liabilities
Escrow Accounts Payable (1) $ 3,912 $ 3,912
Fund Balance (Deficit) 426,337 984,602
Total Liabilities, Deferred Inflows of Resources,and Fund Balance (Deficit) $ 430,249 $ 988,514
Footnotes:
(1) Escrow Accounts Payable - Monies held by the City that may be awarded to othergovernmental agencies or individuals.
89

City of Fort WorthState Asset Forfeiture FundSchedule of Revenues and Expenditures for October 2017, Fiscal Period 1
FY2018 FY2017
AdoptedBudget*
AmendedBudget* Actuals YTD
% Actualsto Budget
Prior YearActuals YTD
% Actuals toPrior Year
Budget
Beginning Fund Balance (Deficit) $ 381,873 $ 381,873 $ 381,873 $ 987,327
Revenues:
Intergovernmental - - 40,964 %- 8,882 %-
Other - - 3,500 %- - %-
Total Revenues - - 44,464 %- 8,882 %-
Other Financing Uses:
Transfers Out - - - %- 11,607 %-
Change in Fund Balance 44,464 (2,725)
Planned Contribution to / (Use of) FundBalance - -
Estimated Ending Fund Balance (Deficit) $ 381,873 $ 381,873 $ 426,337 $ 984,602
*State Asset Forfeiture Fund is currently under review by the Performance and Budget Office and no funds have been budgeted for FY2018.
90

City of Fort WorthHIDTA Asset Forfeiture FundSchedule of Assets, Liabilities, Deferred Inflows of Resources, and Fund Balance (Deficit)October 2017, Fiscal Period 1
FY2018 FY2017
ASSETS
Cash, Cash Equivalents, & Investments $ 780,348 $ 772,702
Receivables, Net of Allowance for Uncollectible:
Interest 1,820 828
Total Assets $ 782,168 $ 773,530
LIABILITIES, DEFERRED INFLOWS OF RESOURCES,AND FUND BALANCE (DEFICIT)
Liabilities
Escrow Accounts Payable (1) $ 58,718 $ 58,718
Fund Balance (Deficit) 723,450 714,812
Total Liabilities, Deferred Inflows of Resources,and Fund Balance (Deficit) $ 782,168 $ 773,530
Footnotes:
(1) Escrow Accouns Payable - Monies held by the City that may be awarded to othergovernmental agencies or individuals.
91

City of Fort WorthHIDTA Asset Forfeiture FundSchedule of Revenues and Expenditures for October 2017, Fiscal Period 1
FY2018 FY2017
AdoptedBudget*
AmendedBudget* Actuals YTD
% Actualsto Budget
Prior YearActuals YTD
% Actuals toPrior Year
Budget
Beginning Fund Balance (Deficit) $ 723,450 $ 723,450 $ 723,450 $ 714,812
Change in Fund Balance - -
Planned Contribution to / (Use of) FundBalance - -
Estimated Ending Fund Balance (Deficit) $ 723,450 $ 723,450 $ 723,450 $ 714,812
*HIDTA Asset Forfeiture Fund is currently under review by the Performance and Budget Office and no funds have been budgeted for FY2018.
92

38%/,&�
,03529(0(17�
',675,&76��3,'6�

City of Fort WorthFwpid #1 - DowntownSchedule of Assets, Liabilities, Deferred Inflows of Resources, and Fund Balance (Deficit)October 2017, Fiscal Period 1
FY2018 FY2017
ASSETS
Cash, Cash Equivalents, & Investments $ 174,878 $ 435,537
Receivables, Net of Allowance for Uncollectible:
Interest 1,072 435
Accounts and Other 461 563
Total Assets $ 176,411 $ 436,535
LIABILITIES, DEFERRED INFLOWS OF RESOURCES,AND FUND BALANCE (DEFICIT)
Liabilities
Accounts Payable $ - $ 164,561
Fund Balance (Deficit) 176,411 271,974
Total Liabilities, Deferred Inflows of Resources,and Fund Balance (Deficit) $ 176,411 $ 436,535
94

City of Fort WorthFwpid #1 - DowntownSchedule of Revenues and Expenditures for October 2017, Fiscal Period 1
FY2018 FY2017
AdoptedBudget
AmendedBudget Actuals YTD
% Actualsto Budget
Prior YearActuals YTD
% Actuals toPrior Year
Budget
Beginning Fund Balance (Deficit) $ 143,791 $ 143,791 $ 143,791 $ 239,997
Revenues:
Charges for Services - - - %- 29,010 %8.3
Other 153,141 153,141 - %- - %-
Contribution from Special Assessments 2,487,232 2,487,232 7,904 %0.3 6,707 %0.3
Total Revenues 2,640,373 2,640,373 7,904 %0.3 35,717 %1.5
Other Financing Sources:
Transfers In 351,009 351,009 29,251 %8.3 - %-
Total Revenues And Other FinancingSources 2,991,382 2,991,382 37,155 %1.2 35,717 %1.5
Expenditures:
Financial Management Services 2,874,150 2,874,150 - %- - %-
Other Financing Uses:
Transfers Out 54,420 54,420 4,535 %8.3 3,740 %8.3
Total Expenditures and Other FinancingUses 2,928,570 2,928,570 4,535 %0.2 3,740 %-
Change in Fund Balance 32,620 31,977
Planned Contribution to / (Use of)Fund Balance 62,812 62,812
Estimated Ending Fund Balance (Deficit) $ 206,603 $ 206,603 $ 176,411 $ 271,974
95

City of Fort WorthFwpid #6 - Park GlenSchedule of Assets, Liabilities, Deferred Inflows of Resources, and Fund Balance (Deficit)October 2017, Fiscal Period 1
FY2018 FY2017
ASSETS
Cash, Cash Equivalents, & Investments $ 585,429 $ 764,578
Receivables, Net of Allowance for Uncollectible:
Interest 1,782 1,169
Accounts and Other 1,887 223
Total Assets $ 589,098 $ 765,970
LIABILITIES, DEFERRED INFLOWS OF RESOURCES,AND FUND BALANCE (DEFICIT)
Liabilities
Accounts Payable $ 5,529 $ 1,001
Fund Balance (Deficit) 583,569 764,969
Total Liabilities, Deferred Inflows of Resources,and Fund Balance (Deficit) $ 589,098 $ 765,970
96

City of Fort WorthFwpid #6 - Park GlenSchedule of Revenues and Expenditures for October 2017, Fiscal Period 1
FY2018 FY2017
AdoptedBudget
AmendedBudget Actuals YTD
% Actualsto Budget
Prior YearActuals YTD
% Actuals toPrior Year
Budget
Beginning Fund Balance (Deficit) $ 578,221 $ 578,221 $ 578,221 $ 730,451
Revenues:
Charges for Services - - - %- 16,193 %8.3
Contribution from Special Assessments 1,537,587 1,537,587 12,444 %0.8 31,747 %2.3
Total Revenues 1,537,587 1,537,587 12,444 %0.8 47,940 %3.0
Other Financing Sources:
Transfers In 199,556 199,556 16,630 %8.3 - %-
Total Revenues And Other FinancingSources 1,737,143 1,737,143 29,074 %1.7 47,940 %3.0
Expenditures:
Financial Management Services 1,793,544 1,793,544 21,163 %1.2 - %-
Performance and Budget - - - %- 11,100 %0.6
Total Expenditures 1,793,544 1,793,544 21,163 %1.2 11,100 %0.6
Other Financing Uses:
Transfers Out 30,752 30,752 2,563 %8.3 2,322 %8.3
Total Expenditures and Other FinancingUses 1,824,296 1,824,296 23,726 %1.3 13,422 %-
Change in Fund Balance 5,348 34,518
Planned Contribution to / (Use of)Fund Balance (87,153) (87,153)
Estimated Ending Fund Balance (Deficit) $ 491,068 $ 491,068 $ 583,569 $ 764,969
97

City of Fort WorthFwpid #7 - HeritageSchedule of Assets, Liabilities, Deferred Inflows of Resources, and Fund Balance (Deficit)October 2017, Fiscal Period 1
FY2018 FY2017
ASSETS
Cash, Cash Equivalents, & Investments $ 782,661 $ 831,391
Receivables, Net of Allowance for Uncollectible:
Interest 2,043 873
Accounts and Other 752 1,554
Total Assets $ 785,456 $ 833,818
LIABILITIES, DEFERRED INFLOWS OF RESOURCES,AND FUND BALANCE (DEFICIT)
Liabilities
Accounts Payable $ - $ 111,727
Fund Balance (Deficit) 785,456 722,091
Total Liabilities, Deferred Inflows of Resources,and Fund Balance (Deficit) $ 785,456 $ 833,818
98

City of Fort WorthFwpid #7 - HeritageSchedule of Revenues and Expenditures for October 2017, Fiscal Period 1
FY2018 FY2017
AdoptedBudget
AmendedBudget Actuals YTD
% Actualsto Budget
Prior YearActuals YTD
% Actuals toPrior Year
Budget
Beginning Fund Balance (Deficit) $ 780,963 $ 780,963 $ 780,963 $ 700,688
Revenues:
Charges for Services - - - %- 15,811 %8.3
Contribution from Special Assessments 1,954,758 1,954,758 15,744 %0.8 41,833 %2.3
Total Revenues 1,954,758 1,954,758 15,744 %0.8 57,644 %2.9
Other Financing Sources:
Transfers In 191,096 191,096 15,925 %8.3 - %-
Total Revenues And Other FinancingSources 2,145,854 2,145,854 31,669 %1.5 57,644 %2.9
Expenditures:
Financial Management Services 2,181,759 2,181,759 23,918 %1.1 - %-
Performance and Budget - - - %- 33,253 %1.6
Total Expenditures 2,181,759 2,181,759 23,918 %1.1 33,253 %1.6
Other Financing Uses:
Transfers Out 39,095 39,095 3,258 %8.3 2,988 %8.3
Total Expenditures and Other FinancingUses 2,220,854 2,220,854 27,176 %1.2 36,241 %-
Change in Fund Balance 4,493 21,403
Planned Contribution to / (Use of)Fund Balance (75,000) (75,000)
Estimated Ending Fund Balance (Deficit) $ 705,963 $ 705,963 $ 785,456 $ 722,091
99

City of Fort WorthFwpid #8 - Camp BowieSchedule of Assets, Liabilities, Deferred Inflows of Resources, and Fund Balance (Deficit)October 2017, Fiscal Period 1
FY2018 FY2017
ASSETS
Cash, Cash Equivalents, & Investments $ 315,716 $ 236,535
Receivables, Net of Allowance for Uncollectible:
Interest 782 243
Accounts and Other 4,003 868
Total Assets $ 320,501 $ 237,646
LIABILITIES, DEFERRED INFLOWS OF RESOURCES,AND FUND BALANCE (DEFICIT)
Liabilities
Accounts Payable $ - $ 79,789
Fund Balance (Deficit) 320,501 157,857
Total Liabilities, Deferred Inflows of Resources,and Fund Balance (Deficit) $ 320,501 $ 237,646
100

City of Fort WorthFwpid #8 - Camp BowieSchedule of Revenues and Expenditures for October 2017, Fiscal Period 1
FY2018 FY2017
AdoptedBudget
AmendedBudget Actuals YTD
% Actualsto Budget
Prior YearActuals YTD
% Actuals toPrior Year
Budget
Beginning Fund Balance (Deficit) $ 312,079 $ 312,079 $ 312,079 $ 147,138
Revenues:
Charges for Services - - - %- 3,314 %8.3
Contribution from Special Assessments 355,286 355,286 7,670 %2.2 8,136 %1.9
Total Revenues 355,286 355,286 7,670 %2.2 11,450 %2.4
Other Financing Sources:
Transfers In 17,791 17,791 1,483 %8.3 - %-
Total Revenues And Other FinancingSources 373,077 373,077 9,153 %2.5 11,450 %2.4
Expenditures:
Financial Management Services 491,270 491,270 - %- - %-
Other Financing Uses:
Transfers Out 8,770 8,770 731 %8.3 731 %8.3
Total Expenditures and Other FinancingUses 500,040 500,040 731 %0.1 731 %-
Change in Fund Balance 8,422 10,719
Planned Contribution to / (Use of)Fund Balance (126,963) (126,963)
Estimated Ending Fund Balance (Deficit) $ 185,116 $ 185,116 $ 320,501 $ 157,857
101

City of Fort WorthFwpid #11 - StockyardsSchedule of Assets, Liabilities, Deferred Inflows of Resources, and Fund Balance (Deficit)October 2017, Fiscal Period 1
FY2018 FY2017
ASSETS
Cash, Cash Equivalents, & Investments $ 34,139 $ 29,522
Receivables, Net of Allowance for Uncollectible:
Interest 79 30
Accounts and Other 255 -
Total Assets $ 34,473 $ 29,552
LIABILITIES, DEFERRED INFLOWS OF RESOURCES,AND FUND BALANCE (DEFICIT)
Liabilities
Accounts Payable $ - $ 8,886
Fund Balance (Deficit) 34,473 20,666
Total Liabilities, Deferred Inflows of Resources,and Fund Balance (Deficit) $ 34,473 $ 29,552
102

City of Fort WorthFwpid #11 - StockyardsSchedule of Revenues and Expenditures for October 2017, Fiscal Period 1
FY2018 FY2017
AdoptedBudget
AmendedBudget Actuals YTD
% Actualsto Budget
Prior YearActuals YTD
% Actuals toPrior Year
Budget
Beginning Fund Balance (Deficit) $ 34,392 $ 34,392 $ 34,392 $ 18,948
Revenues:
Other 15,000 15,000 - %- - %-
Contribution from Special Assessments 83,666 83,666 248 %0.3 1,885 %2.2
Total Revenues 98,666 98,666 248 %0.3 1,885 %2.2
Expenditures:
Financial Management Services 84,433 84,433 - %- - %-
Other Financing Uses:
Transfers Out 2,000 2,000 167 %8.4 167 %8.4
Total Expenditures and Other FinancingUses 86,433 86,433 167 %0.2 167 %-
Change in Fund Balance 81 1,718
Planned Contribution to / (Use of)Fund Balance 12,233 12,233
Estimated Ending Fund Balance (Deficit) $ 46,625 $ 46,625 $ 34,473 $ 20,666
103

City of Fort WorthFwpid #12 - Chapel HillSchedule of Assets, Liabilities, Deferred Inflows of Resources, and Fund Balance (Deficit)October 2017, Fiscal Period 1
FY2018 FY2017
ASSETS
Cash, Cash Equivalents, & Investments $ 19,739 $ 40,069
Receivables, Net of Allowance for Uncollectible:
Interest 71 44
Total Assets $ 19,810 $ 40,113
LIABILITIES, DEFERRED INFLOWS OF RESOURCES,AND FUND BALANCE (DEFICIT)
Liabilities
Accounts Payable $ 14 $ 4,130
Fund Balance (Deficit) 19,796 35,983
Total Liabilities, Deferred Inflows of Resources,and Fund Balance (Deficit) $ 19,810 $ 40,113
104

City of Fort WorthFwpid #12 - Chapel HillSchedule of Revenues and Expenditures for October 2017, Fiscal Period 1
FY2018 FY2017
AdoptedBudget
AmendedBudget Actuals YTD
% Actualsto Budget
Prior YearActuals YTD
% Actuals toPrior Year
Budget
Beginning Fund Balance (Deficit) $ 21,725 $ 21,725 $ 21,725 $ 36,499
Revenues:
Contribution from Special Assessments 61,431 61,431 665 %1.1 2,077 %3.7
Expenditures:
Financial Management Services 80,643 80,643 2,427 %3.0 - %-
Performance and Budget - - - %- 2,426 %3.8
Total Expenditures 80,643 80,643 2,427 %3.0 2,426 %3.8
Other Financing Uses:
Transfers Out 2,000 2,000 167 %8.4 167 %8.4
Total Expenditures and Other FinancingUses 82,643 82,643 2,594 %3.1 2,593 %-
Change in Fund Balance (1,929) (516)
Planned Contribution to / (Use of)Fund Balance (21,212) (21,212)
Estimated Ending Fund Balance (Deficit) $ 513 $ 513 $ 19,796 $ 35,983
105

City of Fort WorthFwpid #14 - Trinity BluffSchedule of Assets, Liabilities, Deferred Inflows of Resources, and Fund Balance (Deficit)October 2017, Fiscal Period 1
FY2018 FY2017
ASSETS
Cash, Cash Equivalents, & Investments $ 70,764 $ 94,262
Receivables, Net of Allowance for Uncollectible:
Interest 185 101
Total Assets $ 70,949 $ 94,363
LIABILITIES, DEFERRED INFLOWS OF RESOURCES,AND FUND BALANCE (DEFICIT)
Liabilities
Accounts Payable $ - $ 27,662
Fund Balance (Deficit) 70,949 66,701
Total Liabilities, Deferred Inflows of Resources,and Fund Balance (Deficit) $ 70,949 $ 94,363
106

City of Fort WorthFwpid #14 - Trinity BluffSchedule of Revenues and Expenditures for October 2017, Fiscal Period 1
FY2018 FY2017
AdoptedBudget
AmendedBudget Actuals YTD
% Actualsto Budget
Prior YearActuals YTD
% Actuals toPrior Year
Budget
Beginning Fund Balance (Deficit) $ 71,116 $ 71,116 $ 71,116 $ 66,508
Revenues:
Contribution from Special Assessments 65,019 65,019 - %- 360 %-
Expenditures:
Financial Management Services 68,560 68,560 - %- - %-
Other Financing Uses:
Transfers Out 2,000 2,000 167 %8.4 167 %-
Total Expenditures and Other FinancingUses 70,560 70,560 167 %0.2 167 %-
Change in Fund Balance (167) 193
Planned Contribution to / (Use of)Fund Balance (5,541) (5,541)
Estimated Ending Fund Balance (Deficit) $ 65,575 $ 65,575 $ 70,949 $ 66,701
107

City of Fort WorthFwpid #15 - Sun ValleySchedule of Assets, Liabilities, Deferred Inflows of Resources, and Fund Balance (Deficit)October 2017, Fiscal Period 1
FY2018 FY2017
ASSETS
Cash, Cash Equivalents, & Investments $ 42,525 $ 47,693
Receivables, Net of Allowance for Uncollectible:
Interest 129 51
Accounts and Other 102 56
Total Assets $ 42,756 $ 47,800
LIABILITIES, DEFERRED INFLOWS OF RESOURCES,AND FUND BALANCE (DEFICIT)
Liabilities
Accounts Payable $ - $ 6,008
Fund Balance (Deficit) 42,756 41,792
Total Liabilities, Deferred Inflows of Resources,and Fund Balance (Deficit) $ 42,756 $ 47,800
108

City of Fort WorthFwpid #15 - Sun ValleySchedule of Revenues and Expenditures for October 2017, Fiscal Period 1
FY2018 FY2017
AdoptedBudget
AmendedBudget Actuals YTD
% Actualsto Budget
Prior YearActuals YTD
% Actuals toPrior Year
Budget
Beginning Fund Balance (Deficit) $ 42,906 $ 42,906 $ 42,906 $ 41,275
Revenues:
Contribution from Special Assessments 87,615 87,615 17 %- 684 %0.9
Expenditures:
Financial Management Services 107,300 107,300 - %- - %-
Other Financing Uses:
Transfers Out 2,000 2,000 167 %8.4 167 %8.4
Total Expenditures and Other FinancingUses 109,300 109,300 167 %0.2 167 %-
Change in Fund Balance (150) 517
Planned Contribution to / (Use of)Fund Balance (21,685) (21,685)
Estimated Ending Fund Balance (Deficit) $ 21,221 $ 21,221 $ 42,756 $ 41,792
109

7$;,1*�,1&5(0(17�
5(,19(670(17�
=21(6 (7,5=6)

City of Fort WorthTirz #2A - Texas Motor SpdwySchedule of Assets, Liabilities, Deferred Inflows of Resources, and Fund Balance (Deficit)October 2017, Fiscal Period 1
FY2018 FY2017
ASSETS
Cash, Cash Equivalents, & Investments $ 635,165 $ 669,330
Receivables, Net of Allowance for Uncollectible:
Interest 1,481 810
Total Assets $ 636,646 $ 670,140
LIABILITIES, DEFERRED INFLOWS OF RESOURCES,AND FUND BALANCE (DEFICIT)
Fund Balance (Deficit) $ 636,646 $ 670,140
Total Liabilities, Deferred Inflows of Resources,and Fund Balance (Deficit) $ 636,646 $ 670,140
111

City of Fort WorthTirz #2A - Texas Motor SpdwySchedule of Revenues and Expenditures for October 2017, Fiscal Period 1
FY2018 FY2017
AdoptedBudget
AmendedBudget Actuals YTD*
% Actualsto Budget
Prior YearActuals YTD
% Actuals toPrior Year
Budget
Beginning Fund Balance (Deficit) $ 636,646 $ 636,646 $ 636,646 $ 670,140
Revenues:
Investment Income 1,689 1,689 - %- - %-
Intergovernmental 558,015 558,015 - %- - %-
Total Revenues 559,704 559,704 - %- - %-
Expenditures:
Economic Development 897,456 897,456 - %- - %-
Change in Fund Balance - -
Planned Contribution to / (Use of)Fund Balance (337,752) (337,752)
Estimated EndingFund Balance (Deficit) $ 298,894 $ 298,894 $ 636,646 $ 670,140
*Tirz Revenue is often recorded seasonally and Expenditures will be recorded at year end.
112

City of Fort WorthTirz #2B - Texas Motor SpdwySchedule of Assets, Liabilities, Deferred Inflows of Resources, and Fund Balance (Deficit)October 2017, Fiscal Period 1
FY2018 FY2017
ASSETS
Cash, Cash Equivalents, & Investments $ 330,607 $ 182,748
Receivables, Net of Allowance for Uncollectibles:
Interest 771 197
Total Assets $ 331,378 $ 182,945
LIABILITIES, DEFERRED INFLOWS OF RESOURCES,AND FUND BALANCE (DEFICIT)
Fund Balance (Deficit) $ 331,378 $ 182,945
Total Liabilities, Deferred Inflows of Resources,and Fund Balance (Deficit) $ 331,378 $ 182,945
113

City of Fort WorthTirz #2B - Texas Motor SpdwySchedule of Revenues and Expenditures for October 2017, Fiscal Period 1
FY2018 FY2017
AdoptedBudget
AmendedBudget Actuals YTD*
% Actualsto Budget
Prior YearActuals YTD
% Actuals toPrior Year
Budget
Beginning Fund Balance (Deficit) $ 331,378 $ 331,378 $ 331,378 $ 182,945
Revenues:
Investment Income 1,306 1,306 - %- - %-
Intergovernmental 431,594 431,594 - %- - %-
Total Revenues 432,900 432,900 - %- - %-
Expenditures:
Economic Development 694,105 694,105 - %- - %-
Change in Fund Balance - -
Planned Contribution to / (Use of)Fund Balance (261,205) (261,205)
Estimated EndingFund Balance (Deficit) $ 70,173 $ 70,173 $ 331,378 $ 182,945
114

City of Fort WorthTirz #3 - DowntownSchedule of Assets, Liabilities, Deferred Inflows of Resources, and Fund Balance (Deficit)October 2017, Fiscal Period 1
FY2018 FY2017
ASSETS
Cash, Cash Equivalents, & Investments $ 4,470,733 $ 807,442
Receivables, Net of Allowance for Uncollectible:
Interest 10,540 870
Total Assets $ 4,481,273 $ 808,312
LIABILITIES, DEFERRED INFLOWS OF RESOURCES,AND FUND BALANCE (DEFICIT)
Fund Balance (Deficit) $ 4,481,273 $ 808,312
Total Liabilities, Deferred Inflows of Resources,and Fund Balance (Deficit) $ 4,481,273 $ 808,312
115

City of Fort WorthTirz #3 - DowntownSchedule of Revenues and Expenditures for October 2017, Fiscal Period 1
FY2018 FY2017
AdoptedBudget
AmendedBudget Actuals YTD*
% Actualsto Budget
Prior YearActuals YTD
% Actuals toPrior Year
Budget
Beginning Fund Balance (Deficit) $ 4,481,273 $ 4,481,273 $ 4,481,273 $ 808,312
Revenues:
General Property Tax 2,781,187 2,781,187 - %- - %-
Investment Income 38,381 38,381 - %- - %-
Intergovernmental 1,281,872 1,281,872 - %- - %-
Total Revenues 4,101,440 4,101,440 - %- - %-
Expenditures:
Economic Development 8,284,383 8,284,383 - %- - %-
Change in Fund Balance - -
Planned Contribution to / (Use of)Fund Balance (4,182,943) (4,182,943)
Estimated EndingFund Balance (Deficit) $ 298,330 $ 298,330 $ 4,481,273 $ 808,312
*Tirz Revenue is often recorded seasonally and Expenditures will be recorded at year end.
116
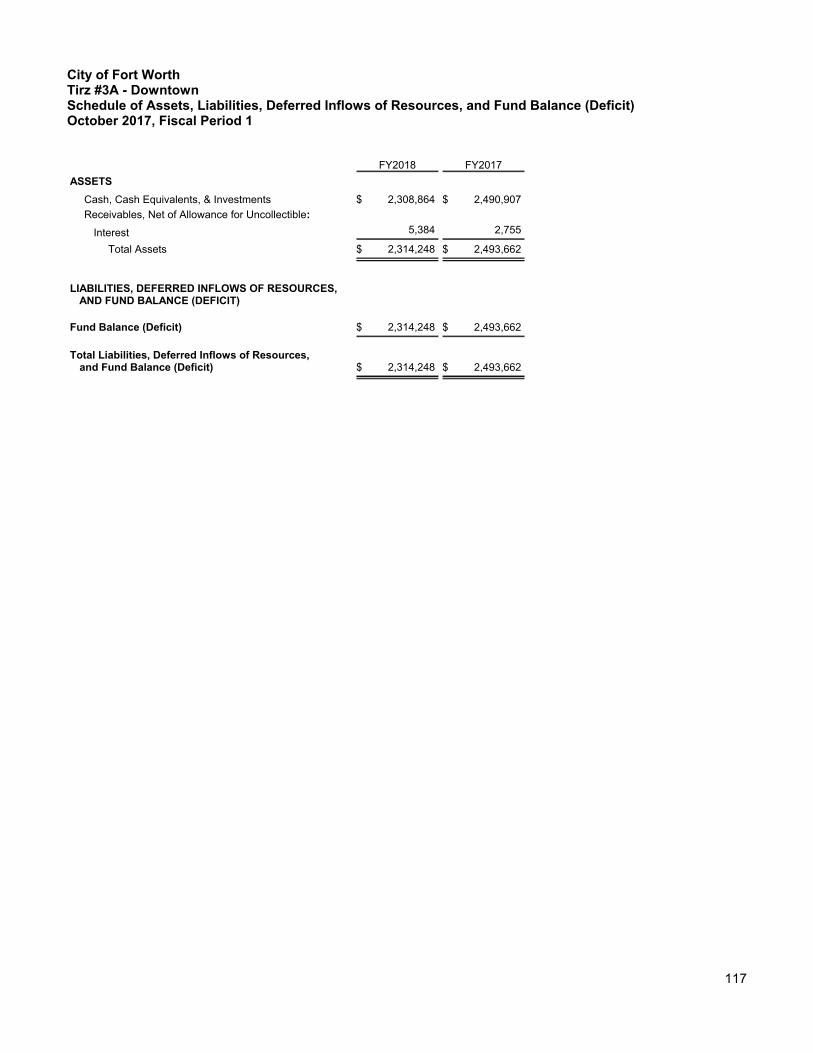
City of Fort WorthTirz #3A - DowntownSchedule of Assets, Liabilities, Deferred Inflows of Resources, and Fund Balance (Deficit)October 2017, Fiscal Period 1
FY2018 FY2017
ASSETS
Cash, Cash Equivalents, & Investments $ 2,308,864 $ 2,490,907
Receivables, Net of Allowance for Uncollectible:
Interest 5,384 2,755
Total Assets $ 2,314,248 $ 2,493,662
LIABILITIES, DEFERRED INFLOWS OF RESOURCES,AND FUND BALANCE (DEFICIT)
Fund Balance (Deficit) $ 2,314,248 $ 2,493,662
Total Liabilities, Deferred Inflows of Resources,and Fund Balance (Deficit) $ 2,314,248 $ 2,493,662
117

City of Fort WorthTirz #3A - DowntownSchedule of Revenues and Expenditures for October 2017, Fiscal Period 1
FY2018 FY2017
AdoptedBudget
AmendedBudget Actuals YTD*
% Actualsto Budget
Prior YearActuals YTD
% Actuals toPrior Year
Budget
Beginning Fund Balance (Deficit) $ 2,314,248 $ 2,314,248 $ 2,314,248 $ 2,493,662
Revenues:
General Property Tax 638,992 638,992 - %- - %-
Investment Income 8,865 8,865 - %- - %-
Intergovernmental 297,950 297,950 - %- - %-
Total Revenues 945,807 945,807 - %- - %-
Expenditures:
Economic Development 1,910,412 1,910,412 - %- - %-
Change in Fund Balance - -
Planned Contribution to / (Use of)Fund Balance (964,605) (964,605)
Estimated EndingFund Balance (Deficit) $ 1,349,643 $ 1,349,643 $ 2,314,248 $ 2,493,662
*Tirz Revenue is often recorded seasonally and Expenditures will be recorded at year end.
118

City of Fort WorthTirz #4 - Southside Med DistSchedule of Assets, Liabilities, Deferred Inflows of Resources, and Fund Balance (Deficit)October 2017, Fiscal Period 1
FY2018 FY2017
ASSETS
Cash, Cash Equivalents, & Investments $ 11,543,355 $ 9,503,196
Receivables, Net of Allowance for Uncollectible:
Interest 27,038 10,307
Total Assets $ 11,570,393 $ 9,513,503
LIABILITIES, DEFERRED INFLOWS OF RESOURCES,AND FUND BALANCE (DEFICIT)
Fund Balance (Deficit) $ 11,570,393 $ 9,513,503
Total Liabilities, Deferred Inflows of Resources,and Fund Balance (Deficit) $ 11,570,393 $ 9,513,503
119

City of Fort WorthTirz #4 - Southside Med DistSchedule of Revenues and Expenditures for October 2017, Fiscal Period 1
FY2018 FY2017
AdoptedBudget
AmendedBudget Actuals YTD*
% Actualsto Budget
Prior YearActuals YTD
% Actuals toPrior Year
Budget
Beginning Fund Balance (Deficit) $ 11,570,393 $ 11,570,393 $ 11,570,393 $ 9,513,503
Revenues:
General Property Tax 3,446,860 3,446,860 - %- - %-
Investment Income 71,275 71,275 - %- - %-
Intergovernmental 1,567,530 1,567,530 - %- - %-
Total Revenues 5,085,665 5,085,665 - %- - %-
Expenditures:
Economic Development 19,340,642 19,340,642 - %- - %-
Change in Fund Balance - -
Planned Contribution to / (Use of)Fund Balance (14,254,977) (14,254,977)
Estimated EndingFund Balance (Deficit) $ (2,684,584) $ (2,684,584) $ 11,570,393 $ 9,513,503
*Tirz Revenue is often recorded seasonally and Expenditures will be recorded at year end.
120

City of Fort WorthTirz #6 - RiverfrontSchedule of Assets, Liabilities, Deferred Inflows of Resources, and Fund Balance (Deficit)October 2017, Fiscal Period 1
FY2018 FY2017
ASSETS
Cash, Cash Equivalents, & Investments $ 112,472 $ 1,717
Receivables, Net of Allowance for Uncollectible:
Interest 262 67
Total Assets $ 112,734 $ 1,784
LIABILITIES, DEFERRED INFLOWS OF RESOURCES,AND FUND BALANCE (DEFICIT)
Fund Balance (Deficit) $ 112,734 $ 1,784
Total Liabilities, Deferred Inflows of Resources,and Fund Balance (Deficit) $ 112,734 $ 1,784
121

City of Fort WorthTirz #6 - RiverfrontSchedule of Revenues and Expenditures for October 2017, Fiscal Period 1
FY2018 FY2017
AdoptedBudget
AmendedBudget Actuals YTD*
% Actualsto Budget
Prior YearActuals YTD
% Actuals toPrior Year
Budget
Beginning Fund Balance (Deficit) $ 112,734 $ 112,734 $ 112,734 $ 1,784
Revenues:
Investment Income 368 368 - %- - %-
Intergovernmental 70,875 70,875 - %- - %-
Total Revenues 71,243 71,243 - %- - %-
Expenditures:
Economic Development 144,853 144,853 - %- - %-
Change in Fund Balance - -
Planned Contribution to / (Use of)Fund Balance (73,610) (73,610)
Estimated EndingFund Balance (Deficit) $ 39,124 $ 39,124 $ 112,734 $ 1,784
*Tirz Revenue is often recorded seasonally and Expenditures will be recorded at year end.
122

City of Fort WorthTirz #7 - North Tarrant PkwySchedule of Assets, Liabilities, Deferred Inflows of Resources, and Fund Balance (Deficit)October 2017, Fiscal Period 1
FY2018 FY2017
ASSETS
Cash, Cash Equivalents, & Investments $ 6,182,564 $ 2,370,699
Receivables, Net of Allowance for Uncollectible:
Interest 14,417 2,554
Total Assets $ 6,196,981 $ 2,373,253
LIABILITIES, DEFERRED INFLOWS OF RESOURCES,AND FUND BALANCE (DEFICIT)
Fund Balance (Deficit) $ 6,196,981 $ 2,373,253
Total Liabilities, Deferred Inflows of Resources,and Fund Balance (Deficit) $ 6,196,981 $ 2,373,253
123

City of Fort WorthTirz #7 - North Tarrant PkwySchedule of Revenues and Expenditures for October 2017, Fiscal Period 1
FY2018 FY2017
AdoptedBudget
AmendedBudget Actuals YTD*
% Actualsto Budget
Prior YearActuals YTD
% Actuals toPrior Year
Budget
Beginning Fund Balance (Deficit) $ 6,196,981 $ 6,196,981 $ 6,196,981 $ 2,373,253
Revenues:
General Property Tax 5,748,798 5,748,798 - %- - %-
Investment Income 1,251 1,251 - %- - %-
Intergovernmental 1,888,449 1,888,449 - %- - %-
Total Revenues 7,638,498 7,638,498 - %- - %-
Expenditures:
Economic Development 7,442,286 7,442,286 - %- - %-
Other Financing Uses:
Transfers Out 196,212 196,212 - %- - %-
Total Expenditures and Other FinancingUses 7,638,498 7,638,498 - %- - %-
Change in Fund Balance - -
Planned Contribution to / (Use of)Fund Balance - -
Estimated EndingFund Balance (Deficit) $ 6,196,981 $ 6,196,981 $ 6,196,981 $ 2,373,253
*Tirz Revenue is often recorded seasonally, and Expenditures will be recorded at year end.
124

City of Fort WorthTirz #7A - North Tarrant PkwySchedule of Assets, Liabilities, Deferred Inflows of Resources, and Fund Balance (Deficit)October 2017, Fiscal Period 1
FY2018 FY2017
ASSETS
Cash, Cash Equivalents, & Investments $ 535,260 $ 259,060
Receivables, Net of Allowance for Uncollectible:
Interest 1,248 279
Total Assets $ 536,508 $ 259,339
LIABILITIES, DEFERRED INFLOWS OF RESOURCES,AND FUND BALANCE (DEFICIT)
Fund Balance (Deficit) $ 536,508 $ 259,339
Total Liabilities, Deferred Inflows of Resources,and Fund Balance (Deficit) $ 536,508 $ 259,339
125

City of Fort WorthTirz #7A - North Tarrant PkwySchedule of Revenues and Expenditures for October 2017, Fiscal Period 1
FY2018 FY2017
AdoptedBudget
AmendedBudget Actuals YTD*
% Actualsto Budget
Prior YearActuals YTD
% Actuals toPrior Year
Budget
Beginning Fund Balance (Deficit) $ 536,508 $ 536,508 $ 536,508 $ 259,339
Revenues:
General Property Tax 208,722 208,722 - %- - %-
Investment Income 49 49 - %- - %-
Intergovernmental 70,359 70,359 - %- - %-
Total Revenues 279,130 279,130 - %- - %-
Expenditures:
Economic Development 271,730 271,730 - %- - %-
Other Financing Uses:
Transfers Out 7,400 7,400 - %- - %-
Total Expenditures and Other FinancingUses 279,130 279,130 - %- - %-
Change in Fund Balance - -
Planned Contribution to / (Use of)Fund Balance - -
Estimated EndingFund Balance (Deficit) $ 536,508 $ 536,508 $ 536,508 $ 259,339
*Tirz Revenue is often recorded seasonally and Expenditures will be recorded at year end.
126

City of Fort WorthTirz #8 - LancasterSchedule of Assets, Liabilities, Deferred Inflows of Resources, and Fund Balance (Deficit)October 2017, Fiscal Period 1
FY2018 FY2017
ASSETS
Cash, Cash Equivalents, & Investments $ 10,673,909 $ 9,248,073
Receivables, Net of Allowance for Uncollectible:
Interest 24,891 9,964
Total Assets $ 10,698,800 $ 9,258,037
LIABILITIES, DEFERRED INFLOWS OF RESOURCES,AND FUND BALANCE (DEFICIT)
Fund Balance (Deficit) $ 10,698,800 $ 9,258,037
Total Liabilities, Deferred Inflows of Resources,and Fund Balance (Deficit) $ 10,698,800 $ 9,258,037
127

City of Fort WorthTirz #8 - LancasterSchedule of Revenues and Expenditures for October 2017, Fiscal Period 1
FY2018 FY2017
AdoptedBudget
AmendedBudget Actuals YTD*
% Actualsto Budget
Prior YearActuals YTD
% Actuals toPrior Year
Budget
Beginning Fund Balance (Deficit) $ 10,698,800 $ 10,698,800 $ 10,698,800 $ 9,258,037
Revenues:
General Property Tax 1,242,443 1,242,443 - %- - %-
Investment Income 54,806 54,806 - %- - %-
Intergovernmental 615,245 615,245 - %- - %-
Total Revenues 1,912,494 1,912,494 - %- - %-
Expenditures:
Economic Development 12,797,962 12,797,962 - %- - %-
Other Financing Uses:
Transfers Out 75,747 75,747 - %- - %-
Total Expenditures and Other FinancingUses 12,873,709 12,873,709 - %- - %-
Change in Fund Balance - -
Planned Contribution to / (Use of)Fund Balance (10,961,215) (10,961,215)
Estimated EndingFund Balance (Deficit) (1) $ (262,415) $ (262,415) $ 10,698,800 $ 9,258,037
Footnotes:
(1) Estimated Ending Fund Balance (Deficit) - Original Budget appropriations for FY2018 included the anticipated Fund Balance fromFY2017. Due to financial performance in FY2017, the actual Fund Balance is undetermined for this period. Appropriations will be lowered tomatch the available financial resources after the FY2017 audit is complete.
*Tirz Revenue is often recorded seasonally and Expenditures will be recorded at year end.
128

City of Fort WorthTirz #9 - Trinity River VisionSchedule of Assets, Liabilities, Deferred Inflows of Resources, and Fund Balance (Deficit)October 2017, Fiscal Period 1
FY2018 FY2017
ASSETS
Cash, Cash Equivalents, & Investments $ 302,278 $ 74,813
Receivables, Net of Allowance for Uncollectible:
Interest 705 80
Total Assets $ 302,983 $ 74,893
LIABILITIES, DEFERRED INFLOWS OF RESOURCES,AND FUND BALANCE (DEFICIT)
Liabilities
Accounts Payable $ 302,983 $ -
Fund Balance (Deficit) - 74,893
Total Liabilities, Deferred Inflows of Resources,and Fund Balance (Deficit) $ 302,983 $ 74,893
129

City of Fort WorthTirz #9 - Trinity River VisionSchedule of Revenues and Expenditures for October 2017, Fiscal Period 1
FY2018 FY2017
AdoptedBudget
AmendedBudget Actuals YTD*
% Actualsto Budget
Prior YearActuals YTD
% Actuals toPrior Year
Budget
Beginning Fund Balance (Deficit) $ - $ - %- $ 74,893
Revenues:
General Property Tax 1,948,430 1,948,430 - %- - %-
Investment Income 1,143 1,143 - %- - %-
Intergovernmental 2,444,065 2,444,065 - %- - %-
Total Revenues 4,393,638 4,393,638 - %- - %-
Expenditures:
Economic Development 4,622,322 4,622,322 - %- - %-
Change in Fund Balance - -
Planned Contribution to / (Use of)Fund Balance (228,684) (228,684)
Estimated EndingFund Balance (Deficit) (1) $ (228,684) $ (228,684) $ - $ 74,893
Footnotes:
(1) Estimated Ending Fund Balance (Deficit) - Original Budget appropriations for FY2018 included the anticipated Fund Balance fromFY2017. Due to financial performance in FY2017, the actual Fund Balance is undetermined for this period. Appropriations will be lowered tomatch the available financial resources after the FY2017 audit is complete.
*Tirz Revenue is often recorded seasonally and Expenditures will be recorded at year end.
130

City of Fort WorthTirz #9A - Trinity River VisionSchedule of Assets, Liabilities, Deferred Inflows of Resources, and Fund Balance (Deficit)October 2017, Fiscal Period 1
FY2018 FY2017
ASSETS
Cash, Cash Equivalents, & Investments $ 6,747 $ 6,055
Receivables, Net of Allowance for Uncollectible:
Interest 16 6
Total Assets $ 6,763 $ 6,061
LIABILITIES, DEFERRED INFLOWS OF RESOURCES,AND FUND BALANCE (DEFICIT)
Liabilities
Accounts Payable $ 6,763 $ -
Fund Balance (Deficit) - 6,061
Total Liabilities, Deferred Inflows of Resources,and Fund Balance (Deficit) $ 6,763 $ 6,061
131

City of Fort WorthTirz #9A - Trinity River VisionSchedule of Revenues and Expenditures for October 2017, Fiscal Period 1
FY2018 FY2017
AdoptedBudget
AmendedBudget Actuals YTD*
% Actualsto Budget
Prior YearActuals YTD
% Actuals toPrior Year
Budget
Beginning Fund Balance (Deficit) $ - $ - $ - $ 6,061
Revenues:
General Property Tax 28,282 28,282 - %- - %-
Investment Income 12 12 - %- - %-
Intergovernmental 22,316 22,316 - %- - %-
Total Revenues 50,610 50,610 - %- - %-
Expenditures:
Economic Development 52,939 52,939 - %- - %-
Change in Fund Balance - -
Planned Contribution to / (Use of)Fund Balance (2,329) (2,329)
Estimated EndingFund Balance (Deficit) (1) $ (2,329) $ (2,329) $ - $ 6,061
Footnotes:
(1) Estimated Ending Fund Balance (Deficit) - Original Budget appropriations for FY2018 included the anticipated Fund Balance fromFY2017. Due to financial performance in FY2017, the actual Fund Balance is undetermined for this period. Appropriations will be lowered tomatch the available financial resources after the FY2017 audit is complete.
*Tirz Revenue is often recorded seasonally and Expenditures will be recorded at year end.
132

City of Fort WorthTirz #10 - Lone StarSchedule of Assets, Liabilities, Deferred Inflows of Resources, and Fund Balance (Deficit)October 2017, Fiscal Period 1
FY2018 FY2017
ASSETS
Cash, Cash Equivalents, & Investments $ 2,815 $ 697
Receivables, Net of Allowance for Uncollectible:
Interest 6 -
Total Assets $ 2,821 $ 697
LIABILITIES, DEFERRED INFLOWS OF RESOURCES,AND FUND BALANCE (DEFICIT)
Fund Balance (Deficit) $ 2,821 $ 697
Total Liabilities, Deferred Inflows of Resources,and Fund Balance (Deficit) $ 2,821 $ 697
133

City of Fort WorthTirz #10 - Lone StarSchedule of Revenues and Expenditures for October 2017, Fiscal Period 1
FY2018 FY2017
AdoptedBudget
AmendedBudget Actuals YTD*
% Actualsto Budget
Prior YearActuals YTD
% Actuals toPrior Year
Budget
Beginning Fund Balance (Deficit) $ 2,821 $ 2,821 $ 2,821 $ 697
Revenues:
General Property Tax 552,588 552,588 - %- - %-
Investment Income 1 1 - %- - %-
Intergovernmental 226,002 226,002 - %- - %-
Total Revenues 778,591 778,591 - %- - %-
Expenditures:
Economic Development 778,782 778,782 - %- - %-
Change in Fund Balance - -
Planned Contribution to / (Use of)Fund Balance (191) (191)
Estimated EndingFund Balance (Deficit) $ 2,630 $ 2,630 $ 2,821 $ 697
*Tirz Revenue is often recorded seasonally and Expenditures will be recorded at year end.
134

City of Fort WorthTirz #10A - Lone StarSchedule of Assets, Liabilities, Deferred Inflows of Resources, and Fund Balance (Deficit)October 2017, Fiscal Period 1
FY2018 FY2017
ASSETS
Cash, Cash Equivalents, & Investments $ 970 $ 232
Receivables, Net of Allowance for Uncollectible:
Interest 2 -
Total Assets $ 972 $ 232
LIABILITIES, DEFERRED INFLOWS OF RESOURCES,AND FUND BALANCE (DEFICIT)
Fund Balance (Deficit) $ 972 $ 232
Total Liabilities, Deferred Inflows of Resources,and Fund Balance (Deficit) $ 972 $ 232
135

City of Fort WorthTirz #10A - Lone StarSchedule of Revenues and Expenditures for October 2017, Fiscal Period 1
FY2018 FY2017
AdoptedBudget
AmendedBudget Actuals YTD*
% Actualsto Budget
Prior YearActuals YTD
% Actuals toPrior Year
Budget
Beginning Fund Balance (Deficit) $ 972 $ 972 $ 972 $ 232
Revenues:
General Property Tax 101,221 101,221 - %- - %-
Investment Income 1 1 - %- - %-
Intergovernmental 38,737 38,737 - %- - %-
Total Revenues 139,959 139,959 - %- - %-
Expenditures:
Economic Development 139,993 139,993 - %- - %-
Change in Fund Balance - -
Planned Contribution to / (Use of)Fund Balance (34) (34)
Estimated EndingFund Balance (Deficit) $ 938 $ 938 $ 972 $ 232
*Tirz Revenue is often recorded seasonally and Expenditures are recorded at year end.
136

City of Fort WorthTirz #12 - East Berry RenaissnSchedule of Assets, Liabilities, Deferred Inflows of Resources, and Fund Balance (Deficit)October 2017, Fiscal Period 1
FY2018 FY2017
ASSETS
Cash, Cash Equivalents, & Investments $ 661,459 $ 450,970
Receivables, Net of Allowance for Uncollectible:
Interest 1,542 486
Total Assets $ 663,001 $ 451,456
LIABILITIES, DEFERRED INFLOWS OF RESOURCES,AND FUND BALANCE (DEFICIT)
Fund Balance (Deficit) $ 663,001 $ 451,456
Total Liabilities, Deferred Inflows of Resources,and Fund Balance (Deficit) $ 663,001 $ 451,456
137

City of Fort WorthTirz #12 - East Berry RenaissnSchedule of Revenues and Expenditures for October 2017, Fiscal Period 1
FY2018 FY2017
AdoptedBudget
AmendedBudget Actuals YTD*
% Actualsto Budget
Prior YearActuals YTD
% Actuals toPrior Year
Budget
Beginning Fund Balance (Deficit) $ 663,001 $ 663,001 $ 663,001 $ 451,456
Revenues:
General Property Tax 586,929 586,929 - %- - %-
Investment Income 3,375 3,375 - %- - %-
Intergovernmental 382,501 382,501 - %- - %-
Total Revenues 972,805 972,805 - %- - %-
Expenditures:
Economic Development 1,619,822 1,619,822 - %- - %-
Other Financing Uses:
Transfers Out 27,927 27,927 - %- - %-
Total Expenditures and Other FinancingUses 1,647,749 1,647,749 - %- - %-
Change in Fund Balance - -
Planned Contribution to / (Use of)Fund Balance (674,944) (674,944)
Estimated EndingFund Balance (Deficit) (1) $ (11,943) $ (11,943) $ 663,001 $ 451,456
Footnotes:
(1) Estimated Ending Fund Balance (Deficit) - Original Budget appropriations for FY2018 included the anticipated Fund Balance fromFY2017. Due to financial performance in FY2017, the actual Fund Balance is undetermined for this period. Appropriations will be lowered tomatch the available financial resources after the FY2017 audit is complete.
*Tirz Revenue is often recorded seasonally and Expenditures will be recorded at year end.
138

City of Fort WorthTirz #13 - WoodhavenSchedule of Assets, Liabilities, Deferred Inflows of Resources, and Fund Balance (Deficit)October 2017, Fiscal Period 1
FY2018 FY2017
ASSETS
Cash, Cash Equivalents, & Investments $ 1,477,838 $ 422,542
Receivables, Net of Allowance for Uncollectible:
Interest 3,446 455
Total Assets $ 1,481,284 $ 422,997
LIABILITIES, DEFERRED INFLOWS OF RESOURCES,AND FUND BALANCE (DEFICIT)
Fund Balance (Deficit) $ 1,481,284 $ 422,997
Total Liabilities, Deferred Inflows of Resources,and Fund Balance (Deficit) $ 1,481,284 $ 422,997
139

City of Fort WorthTirz #13 - WoodhavenSchedule of Revenues and Expenditures for October 2017, Fiscal Period 1
FY2018 FY2017
AdoptedBudget
AmendedBudget Actuals YTD*
% Actualsto Budget
Prior YearActuals YTD
% Actuals toPrior Year
Budget
Beginning Fund Balance (Deficit) $ 1,481,284 $ 1,481,284 $ 1,481,284
Revenues:
General Property Tax 764,076 764,076 - %- - %-
Investment Income 7,449 7,449 - %- - %-
Intergovernmental 434,459 434,459 - %- - %-
Total Revenues 1,205,984 1,205,984 - %- - %-
Expenditures:
Economic Development 2,678,574 2,678,574 - %- - %-
Other Financing Uses:
Transfers Out 17,243 17,243 - %- - %-
Total Expenditures and Other FinancingUses 2,695,817 2,695,817 - %- - %-
Change in Fund Balance - -
Planned Contribution to / (Use of)Fund Balance (1,489,833) (1,489,833)
Estimated EndingFund Balance (Deficit) (1) $ (8,549) $ (8,549) $ 1,481,284 $ 422,997
Footnotes:
(1) Estimated Ending Fund Balance (Deficit) - Original Budget appropriations for FY2018 included the anticipated Fund Balance fromFY2017. Due to financial performance in FY2017, the actual Fund Balance is undetermined for this period. Appropriations will be lowered tomatch the available financial resources after the FY2017 audit is complete.
*Tirz Revenue is often recorded seasonally and Expenditures will be recorded at year end.
140

City of Fort WorthTirz #14 - Trinity LakesSchedule of Assets, Liabilities, Deferred Inflows of Resources, and Fund Balance (Deficit)October 2017, Fiscal Period 1
FY2018 FY2017
ASSETS
Cash, Cash Equivalents, & Investments $ 2,105,339 $ 1,293,006
Receivables, Net of Allowance for Uncollectible:
Interest 4,910 1,393
Total Assets $ 2,110,249 $ 1,294,399
LIABILITIES, DEFERRED INFLOWS OF RESOURCES,AND FUND BALANCE (DEFICIT)
Fund Balance (Deficit) $ 2,110,249 $ 1,294,399
Total Liabilities, Deferred Inflows of Resources,and Fund Balance (Deficit) $ 2,110,249 $ 1,294,399
141
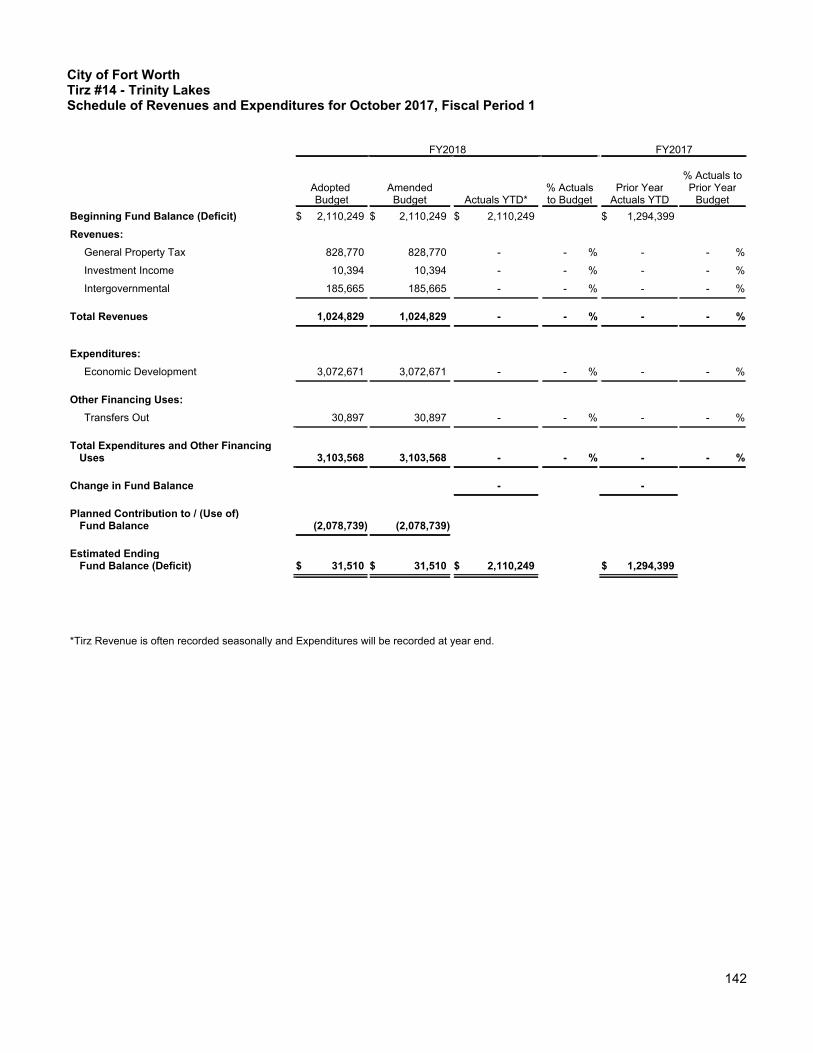
City of Fort WorthTirz #14 - Trinity LakesSchedule of Revenues and Expenditures for October 2017, Fiscal Period 1
FY2018 FY2017
AdoptedBudget
AmendedBudget Actuals YTD*
% Actualsto Budget
Prior YearActuals YTD
% Actuals toPrior Year
Budget
Beginning Fund Balance (Deficit) $ 2,110,249 $ 2,110,249 $ 2,110,249 $ 1,294,399
Revenues:
General Property Tax 828,770 828,770 - %- - %-
Investment Income 10,394 10,394 - %- - %-
Intergovernmental 185,665 185,665 - %- - %-
Total Revenues 1,024,829 1,024,829 - %- - %-
Expenditures:
Economic Development 3,072,671 3,072,671 - %- - %-
Other Financing Uses:
Transfers Out 30,897 30,897 - %- - %-
Total Expenditures and Other FinancingUses 3,103,568 3,103,568 - %- - %-
Change in Fund Balance - -
Planned Contribution to / (Use of)Fund Balance (2,078,739) (2,078,739)
Estimated EndingFund Balance (Deficit) $ 31,510 $ 31,510 $ 2,110,249 $ 1,294,399
*Tirz Revenue is often recorded seasonally and Expenditures will be recorded at year end.
142

City of Fort WorthTirz #15 - Stkyrds/NorthsideSchedule of Assets, Liabilities, Deferred Inflows of Resources, and Fund Balance (Deficit)October 2017, Fiscal Period 1
FY2018 FY2017
ASSETS
Cash, Cash Equivalents, & Investments $ 88,390 $ 10,682
LIABILITIES, DEFERRED INFLOWS OF RESOURCES,AND FUND BALANCE (DEFICIT)
Fund Balance (Deficit) $ 88,390 $ 10,682
Total Liabilities, Deferred Inflows of Resources,and Fund Balance (Deficit) $ 88,390 $ 10,682
143

City of Fort WorthTirz #15 - Stkyrds/NorthsideSchedule of Revenues and Expenditures for October 2017, Fiscal Period 1
FY2018 FY2017
AdoptedBudget
AmendedBudget Actuals YTD*
% Actualsto Budget
Prior YearActuals YTD
% Actuals toPrior Year
Budget
Beginning Fund Balance (Deficit) $ 88,390 $ 88,390 $ 88,390 $ 10,682
Revenues:
General Property Tax 87,048 87,048 - %- - %-
Investment Income 495 495 - %- - %-
Intergovernmental 46,034 46,034 - %- - %-
Total Revenues 133,577 133,577 - %- - %-
Expenditures:
Economic Development 227,041 227,041 - %- - %-
Other Financing Uses:
Transfers Out 5,498 5,498 - %- - %-
Total Expenditures and Other FinancingUses 232,539 232,539 - %- - %-
Change in Fund Balance - -
Planned Contribution to / (Use of)Fund Balance (98,962) (98,962)
Estimated EndingFund Balance (Deficit) (1) $ (10,572) $ (10,572) $ 88,390 $ 10,682
Footnotes:
(1) Estimated Ending Fund Balance (Deficit) - Original Budget appropriations for FY2018 included the anticipated Fund Balance fromFY2017. Due to financial performance in FY2017, the actual Fund Balance is undetermined for this period. Appropriations will be lowered tomatch the available financial resources after the FY2017 audit is complete.
*Tirz Revenue is often recorded seasonally and Expenditures will be recorded at year end.
144

27+(5�
63(&,$/�5(9(18(
)81'6

City of Fort WorthSpecial Donations Legacy Fund *Schedule of Assets, Liabilities, Deferred Inflows of Resources, and Fund Balance (Deficit)October 2017, Fiscal Period 1
FY2018 FY2017
ASSETS
Cash, Cash Equivalents, & Investments $ 517,912 $ 517,768
Receivables, Net of Allowance for Uncollectible:
Interest - 173
Total Assets $ 517,912 $ 517,941
LIABILITIES, DEFERRED INFLOWS OF RESOURCES,AND FUND BALANCE (DEFICIT)
Fund Balance (Deficit) $ 517,912 $ 517,941
Total Liabilities, Deferred Inflows of Resources,and Fund Balance (Deficit) $ 517,912 $ 517,941
* Special Donations Legacy Fund is currently under review for closure by the FinancialManagement Services Department.
146

City of Fort WorthSpecial Donations Legacy Fund*Schedule of Revenues and Expenditures for October 2017, Fiscal Period 1
FY2018 FY2017
AdoptedBudget
AmendedBudget Actuals YTD
% Actualsto Budget
Prior YearActuals YTD
% Actuals toPrior Year
Budget
Beginning Fund Balance (Deficit) $ 517,912 $ 517,912 $ 517,912 $ 517,912
Revenues:
Contributions - - - %- 29 %-
Change in Fund Balance - 29
Planned Contribution to / (Use of) FundBalance - -
Estimated Ending Fund Balance (Deficit) $ 517,912 $ 517,912 $ 517,912 $ 517,941
* Special Donations Legacy Fund is currently under review for closure by the Financial Management Services Department.
147

City of Fort WorthSpecial Donations FundSchedule of Assets, Liabilities, Deferred Inflows of Resources, and Fund Balance (Deficit)October 2017, Fiscal Period 1
FY2018 FY2017
ASSETS
Cash, Cash Equivalents, & Investments $ 377,229 $ 425,576
LIABILITIES, DEFERRED INFLOWS OF RESOURCES,AND FUND BALANCE (DEFICIT)
Liabilities
Accounts Payable $ - $ 151,259
Fund Balance (Deficit) 377,229 274,317
Total Liabilities, Deferred Inflows of Resources,and Fund Balance (Deficit) $ 377,229 $ 425,576
148

City of Fort WorthSpecial Donations FundSchedule of Revenues and Expenditures for October 2017, Fiscal Period 1
FY2018 FY2017
AdoptedBudget
AmendedBudget Actuals YTD
% Actualsto Budget
Prior YearActuals YTD
% Actuals toPrior Year
Budget
Beginning Fund Balance (Deficit) $ 360,820 $ 360,820 $ 360,820 $ 266,264
Revenues:
Contributions (1) 2,027,260 2,027,260 16,780 %0.8 8,380 %0.1
Expenditures:
City Manager's Office - 5,945 371 %6.2 327 %2.9
Library 27,260 27,260 - %- - %-
Non-Departmental (1) 2,000,000 1,994,055 - %- - %-
Total Expenditures 2,027,260 2,027,260 371 %- 327 %-
Change in Fund Balance 16,409 8,053
Planned Contribution to / (Use of) FundBalance - -
Estimated Ending Fund Balance (Deficit) $ 360,820 $ 360,820 $ 377,229 $ 274,317
Footnotes:
(1) Contributions & Non-Departmental - Once a donation is received, a budget journal entry will transfer both the revenue and expenditurebudget to the applicable center for the Department receiving the donation within the Fund.
149

City of Fort WorthLibrary Special Revenue FundSchedule of Assets, Liabilities, Deferred Inflows of Resources, and Fund Balance (Deficit)October 2017, Fiscal Period 1
FY2018 FY2017
ASSETS
Cash, Cash Equivalents, & Investments $ 1,590,287 $ 1,949,125
Receivables, Net of Allowance for Uncollectible:
Interest 3,661 2,114
Total Assets $ 1,593,948 $ 1,951,239
LIABILITIES, DEFERRED INFLOWS OF RESOURCES,AND FUND BALANCE (DEFICIT)
Liabilities
Accounts Payable $ 445 $ 39,101
Accrued Payroll 4,544 5,590
Total Liabilities 4,989 44,691
Fund Balance (Deficit) 1,588,959 1,906,548
Total Liabilities, Deferred Inflows of Resources,and Fund Balance (Deficit) $ 1,593,948 $ 1,951,239
150

City of Fort WorthLibrary Special Revenue FundSchedule of Revenues and Expenditures for October 2017, Fiscal Period 1
FY2018 FY2017
AdoptedBudget
AmendedBudget Actuals YTD
% Actualsto Budget
Prior YearActuals YTD
% Actuals toPrior Year
Budget
Beginning Fund Balance (Deficit) $ 1,567,616 $ 1,567,616 $ 1,567,616 $ 1,920,105
Revenues:
Charges for Services (1) 182,404 182,404 36,229 %19.9 - %-
Expenditures:
Library 519,851 519,851 14,886 %2.9 13,557 %8.8
Change in Fund Balance 21,343 (13,557)
Planned Contribution to / (Use of) FundBalance (337,447) (337,447)
Estimated Ending Fund Balance (Deficit) $ 1,230,169 $ 1,230,169 $ 1,588,959 $ 1,906,548
Footnotes:
(1) Charges for services - Library Auto System revenue is higher than expected.
151

City of Fort WorthCommunity Tree Planting Program FundSchedule of Assets, Liabilities, Deferred Inflows of Resources, and Fund Balance (Deficit)October 2017, Fiscal Period 1
FY2018 FY2017
ASSETS
Cash, Cash Equivalents, & Investments $ 4,005 $ 220,347
Receivables, Net of Allowance for Uncollectible:
Interest 80 267
Total Assets $ 4,085 $ 220,614
LIABILITIES, DEFERRED INFLOWS OF RESOURCES,AND FUND BALANCE (DEFICIT)
Liabilities
Accounts Payable $ 1,182 $ 1,378
Accrued Payroll 8,274 11,021
Total Liabilities 9,456 12,399
Fund Balance (Deficit) (5,371) 208,215
Total Liabilities, Deferred Inflows of Resources,and Fund Balance (Deficit) $ 4,085 $ 220,614
152

City of Fort WorthCommunity Tree Planting Program FundSchedule of Revenues and Expenditures for October 2017, Fiscal Period 1
FY2018 FY2017
AdoptedBudget
AmendedBudget Actuals YTD
% Actualsto Budget
Prior YearActuals YTD
% Actuals toPrior Year
Budget
Beginning Fund Balance (Deficit) $ 23,804 $ 23,804 $ 23,804 $ 239,194
Revenues:
Charges for Services (1) 39,344 39,344 - %- - %-
Other Financing Sources:
Transfers In (2) 360,656 360,656 - %- - %-
Total Revenues And Other FinancingSources 400,000 400,000 - %- - %-
Expenditures:
Parks and Recreation 400,000 400,000 29,175 %7.3 30,979 %8.1
Change in Fund Balance (29,175) (30,979)
Planned Contribution to / (Use of) FundBalance - -
Estimated Ending Fund Balance (Deficit) (1)$ 23,804 $ 23,804 $ (5,371) $ 208,215
Footnotes:
(1) Charges for Services & Estimated Ending Fund Balance (Deficit) - No Urban Forestry Fees recorded as of the report date.
(2) Transfers In - Budgeted Transfers in have not been recorded as of the report date.
153

City of Fort WorthLake Worth Trust Fund *Schedule of Assets, Liabilities, Deferred Inflows of Resources, and Fund Balance (Deficit)October 2017, Fiscal Period 1
FY2018 FY2017
ASSETS
Cash, Cash Equivalents, & Investments $ 1,884,358 $ 1,766,058
Receivables, Net of Allowance for Uncollectible:
Interest 4,814 1,887
Total Assets $ 1,889,172 $ 1,767,945
LIABILITIES, DEFERRED INFLOWS OF RESOURCES,AND FUND BALANCE (DEFICIT)
Fund Balance (Deficit) $ 1,889,172 $ 1,767,945
Total Liabilities, Deferred Inflows of Resources,and Fund Balance (Deficit) $ 1,889,172 $ 1,767,945
* An M&C is currently being routed to close this Fund in FY2017. This Fund will be removedfrom this report once that M&C has been approved by Mayor and City Council.
154

City of Fort WorthLake Worth Trust Fund *Schedule of Revenues and Expenditures for October 2017, Fiscal Period 1
FY2018 FY2017
AdoptedBudget
AmendedBudget Actuals YTD
% Actualsto Budget
Prior YearActuals YTD
% Actuals toPrior Year
Budget
Beginning Fund Balance (Deficit) $ 2,069,172 $ 2,069,172 $ 2,069,172 $ 1,753,281
Revenues:
Charges for Services - - - %- 507 %1.6
Use of Money and Property - - - %- 14,110 %8.9
Investment Income - - - %- 47 %-
Total Revenues - - - %- 14,664 %7.7
Other Financing Uses:
Transfers Out (1) - - 180,000 %- - %-
Change in Fund Balance (180,000) 14,664
Planned Contribution to / (Use of) FundBalance - -
Estimated Ending Fund Balance (Deficit) $ 2,069,172 $ 2,069,172 $ 1,889,172 $ 1,767,945
Footnotes:
(1) Transfer Out - Transfer Out of $180,000 is currently under review by the Financial Management Services Department. Any adjustments (ifnecessary) will be recorded in future period.
* An M&C is currently being routed to close this Fund in FY2017. This Fund will be removed from this report once that M&C has been approvedby Mayor and City Council.
155

City of Fort WorthAlliance Maintenance FacilitySchedule of Assets, Liabilities, Deferred Inflows of Resources, and Fund Balance (Deficit)October 2017, Fiscal Period 1
FY2018 FY2017
ASSETS
Cash, Cash Equivalents, & Investments $ 5,859,691 $ 7,276,523
Receivables, Net of Allowance for Uncollectible:
Accounts and Other 1,711,615 2,334,230
Total Assets $ 7,571,306 $ 9,610,753
LIABILITIES, DEFERRED INFLOWS OF RESOURCES,AND FUND BALANCE (DEFICIT)
Liabilities
Accounts Payable $ 1,656,806 $ 1,671,108
Other 84,013 84,013
Unearned Revenue 15,000 -
Total Liabilities 1,755,819 1,755,121
Fund Balance (Deficit) 5,815,487 7,855,632
Total Liabilities, Deferred Inflows of Resources,and Fund Balance (Deficit) $ 7,571,306 $ 9,610,753
156

City of Fort WorthAlliance Maintenance FacilitySchedule of Revenues and Expenditures for October 2017, Fiscal Period 1
FY2018 FY2017
AdoptedBudget
AmendedBudget Actuals YTD
% Actualsto Budget
Prior YearActuals YTD
% Actuals toPrior Year
Budget
Beginning Fund Balance (Deficit) $ 5,516,402 $ 5,516,402 $ 5,516,402 $ 7,827,401
Revenues:
Use of Money and Property (1) 453,667 453,667 93,004 %20.5 56,008 %10.1
Other 2,094,861 2,094,861 206,081 %9.8 222,685 %5.7
Total Revenues 2,548,528 2,548,528 299,085 %11.7 278,693 %6.3
Expenditures:
Property Management 6,197,476 6,697,476 - %- 225,462 %2.8
Other Financing Uses:
Transfers Out - - - %- 25,000 %-
Total Expenditures and Other FinancingUses 6,197,476 6,697,476 - %- 250,462 %-
Change in Fund Balance 299,085 28,231
Planned Contribution to / (Use of) FundBalance (3,648,948) (4,148,948)
Estimated Ending Fund Balance (Deficit) $ 1,867,454 $ 1,367,454 $ 5,815,487 $ 7,855,632
Footnotes:
(1) Use of Money and Property - Lease revenues are higher than expected.
* Additional adjustments from Alliance Maintenance Facility financial statements are one month in arrears, external adjustments are notpresented for October 2017.
157

City of Fort WorthBotanic Gardens *Schedule of Assets, Liabilities, Deferred Inflows of Resources, and Fund Balance (Deficit)October 2017, Fiscal Period 1
FY2018 FY2017
ASSETS
Cash, Cash Equivalents, & Investments $ 1,382,254 $ -
LIABILITIES, DEFERRED INFLOWS OF RESOURCES,AND FUND BALANCE (DEFICIT)
Liabilities
Accounts Payable $ 22,073 $ -
Accrued Payroll 103,239 -
Total Liabilities 125,312 -
Fund Balance (Deficit) 1,256,942 -
Total Liabilities, Deferred Inflows of Resources,and Fund Balance (Deficit) $ 1,382,254 $ -
* New Botanic Gardens Fund established in April 2017
158

City of Fort WorthBotanic Gardens *Schedule of Revenues and Expenditures for October 2017, Fiscal Period 1
FY2018 FY2017
AdoptedBudget
AmendedBudget Actuals YTD
% Actualsto Budget
Prior YearActuals YTD
% Actuals toPrior Year
Budget
Beginning Fund Balance (Deficit) $ 492,973 $ 492,973 $ 492,973 $ -
Revenues:
Charges for Services 2,298,574 2,298,574 207,387 %9.0 - %-
Other (1) 206,365 206,365 642,982 %311.6 - %-
Contributions 50,392 50,392 36 %0.1 - %-
Total Revenues 2,555,331 2,555,331 850,405 %33.3 - %-
Other Financing Sources:
Transfers In 3,045,821 3,045,821 218,020 %7.2 - %-
Total Revenues And Other FinancingSources 5,601,152 5,601,152 1,068,425 %19.1 - %-
Expenditures:
Parks and Recreation 5,601,152 5,601,152 304,456 %5.4 - %-
Change in Fund Balance 763,969 -
Planned Contribution to / (Use of) FundBalance - -
Estimated Ending Fund Balance (Deficit) $ 492,973 $ 492,973 $ 1,256,942 $ -
Footnotes:
(1) Other - Fort Worth Botanical Society retained funds received October 2017.
* New Botanic Gardens Fund established in April 2017
159

35235,(7$5<�
)81'6
(17(535,6(
)81'6

0$-25�
(17(535,6(�
)81'6

City of Fort WorthWater & Sewer FundSchedule of Assets, Deferred Outflows of Resources,Liabilities, Deferred Inflows of Resources, and Net Position (Deficit)October 2017, Fiscal Period 1
FY2018 FY2017
ASSETS AND DEFERRED OUTFLOWS OF RESOURCES
Assets
Current Assets:
Cash, Cash Equivalents, & Investments $ 127,883,362 $ 105,852,197
Interest Receivable 399,664 101,594
Accounts and Other Receivables,Net of Allowance for Uncollectible 44,739,541 52,014,153
Inventories (at Cost) 3,149,452 3,376,227
Total Current Assets 176,172,019 161,344,171
LIABILITIES, DEFERRED INFLOWS OF RESOURCES, ANDNET POSITION (DEFICIT)
Liabilities
Current Liabilities:
Accounts Payable 4,342,895 13,360,442
Escrow Accounts Payable 1,144,664 991,668
Accrued Payroll 1,761,726 2,087,034
Current Portion of Long-Term Liabilities - 9,359
Payable from Restricted Assets:
Customer Deposits 17,872,648 16,133,677
Unearned Revenue 164,757 1,323,108
Total Current Liabilities 25,286,690 33,905,288
NET POSITION (DEFICIT) $ 150,885,329 $ 127,438,883
163

City of Fort WorthWater & Sewer FundSchedule of Revenues and Expenses for October 2017, Fiscal Period 1
FY2018 FY2017
AdoptedBudget
AmendedBudget Actuals YTD
% Actuals toBudget
Prior YearActuals YTD
% Actuals toPrior Year
Budget
Beginning Net Position (Deficit) $ 140,477,400 $ 140,477,400 $ 140,477,400 $ 130,445,848
Operating Revenues:
Charges for Services
Sewer Contracts 26,532,369 26,532,369 2,120,067 %8.0 2,285,955 %8.8
Sewer Service 148,153,257 148,153,257 13,058,311 %8.8 12,849,255 %9.0
Water Contracts 58,400,000 58,400,000 2,452,977 %4.2 5,555,520 %9.5
Water Line Extensions 1,936,998 1,936,998 203,406 %10.5 160,712 %9.7
Water Service 185,409,093 185,409,093 16,930,842 %9.1 16,254,591 %9.1
Wholesale Reclaimed Water (1) 348,552 348,552 81,053 %23.3 58,998 %19.3
Other Charges for Services 4,770,720 4,770,720 686,727 %14.4 466,434 %10.5
Other 10,481,274 10,481,274 980,753 %9.4 924,618 %8.8
Total Operating Revenues 436,032,263 436,032,263 36,514,136 %8.4 38,556,083 %9.1
Operating Expenses:
Personnel Services 73,129,408 73,129,408 5,017,094 %6.9 5,550,732 %8.2
Supplies and Materials 25,093,275 25,093,275 888,685 %3.5 1,110,456 %4.7
Contractual Services 164,611,813 164,611,813 9,428,331 %5.7 19,557,429 %12.9
Total Operating Expenses 262,834,496 262,834,496 15,334,110 %5.8 26,218,617 %10.8
Operating Income (Loss) 173,197,767 173,197,767 21,180,026 %12.2 12,337,466 %6.9
Nonoperating Revenues (Expenses):
Investment Income 514,838 514,838 - %- - %-
Sale of Property and Equipment (2) 43,500 43,500 195,000 %448.3 975 %2.2
Interest and Service Charges (658,049) (658,049) - %- - %-
Total Nonoperating Revenues(Expenses) (99,711) (99,711) 195,000 %(195.6) 975 %(0.3)
Income (Loss) Before Transfers andContributions 173,098,056 173,098,056 21,375,026 %12.3 12,338,441 %6.9
Debt Service Transfers Out (95,781,603) (95,781,603) (7,981,797) %8.3 (12,955,308) %12.9
Transfers In 17,333,839 17,333,839 212,578 %1.2 202,555 %1.8
Transfers Out (93,106,528) (93,106,528) (3,197,878) %3.4 (2,592,653) %3.1
Changes in Net Position (Deficit) 10,407,929 (3,006,965)
Contribution to / (Use of) Net Position 1,543,764 1,543,764
Estimated Ending Net Position (Deficit) $ 142,021,164 $ 142,021,164 $ 150,885,329 $ 127,438,883
See next page for Footnotes above.
164

Footnotes:
(1) Wholesale Reclaimed Water - Wholesale Reclaim Water revenue is higher than expected.
(2) Sale of Property and Equipment - Sale of Capital Asset consists of land plots sold around Lake Worth.
165

City of Fort WorthStormwater Utility FundSchedule of Assets, Deferred Outflows of Resources,Liabilities, Deferred Inflows of Resources, and Net Position (Deficit)October 2017, Fiscal Period 1
FY2018 FY2017
ASSETS AND DEFERRED OUTFLOWS OF RESOURCES
Assets
Current Assets:
Cash, Cash Equivalents, & Investments $ 20,507,512 $ 15,676,279
Interest Receivable 98,897 21,278
Accounts and Other Receivables,Net of Allowance for Uncollectible 3,140,096 3,287,484
Total Current Assets 23,746,505 18,985,041
Noncurrent Assets:
Restricted Assets:
Interest Receivable (1) - 11,000
Total Assets 23,746,505 18,996,041
LIABILITIES, DEFERRED INFLOWS OF RESOURCES, ANDNET POSITION (DEFICIT)
Liabilities
Current Liabilities:
Accounts Payable 248,242 122,672
Accrued Payroll 210,504 244,930
Total Current Liabilities 458,746 367,602
NET POSITION (DEFICIT) $ 23,287,759 $ 18,628,439
Footnotes:
(1) Interest Receivable - Interest Receivable has been reviewed and necessary adjustment has been madein August (Period 11) of FY2017.
166

City of Fort WorthStormwater Utility FundSchedule of Revenues and Expenses for October 2017, Fiscal Period 1
FY2018 FY2017
AdoptedBudget
AmendedBudget Actuals YTD
% Actuals toBudget
Prior YearActuals YTD
% Actuals toPrior Year
Budget
Beginning Net Position (Deficit) $ 23,167,780 $ 23,167,780 $ 23,167,780 $ 19,639,386
Operating Revenues:
Charges for Services
Utility Fee for Commercial andResidential 38,737,046 38,737,046 3,215,856 %8.3 3,101,236 %8.2
Other 20,000 20,000 - %- - %-
Total Operating Revenues 38,757,046 38,757,046 3,215,856 %8.3 3,101,236 %8.2
Operating Expenses:
Personnel Services 8,477,356 8,477,356 564,135 %6.7 616,030 %8.1
Supplies and Materials 488,825 488,825 58,721 %12.0 94,741 %17.6
Contractual Services 5,472,770 5,472,770 181,880 %3.3 177,463 %3.2
Total Operating Expenses 14,438,951 14,438,951 804,736 %5.6 888,234 %6.5
Operating Income (Loss) 24,318,095 24,318,095 2,411,120 %9.9 2,213,002 %9.2
Nonoperating Revenues (Expenses):
Investment Income 250,000 250,000 - %- - %-
Sale of Property and Equipment (2) 40,000 40,000 - %- - %-
Total Nonoperating Revenues(Expenses) 290,000 290,000 - %- - %-
Income (Loss) Before Transfers andContributions 24,608,095 24,608,095 2,411,120 %9.8 2,213,002 %9.0
Debt Service Transfers Out (9,142,297) (9,142,297) (768,637) %8.4 (1,118,767) %16.7
Transfers Out (15,401,367) (15,401,367) (1,522,504) %9.9 (2,105,182) %12.3
Changes in Net Position (Deficit) 119,979 (1,010,947)
Contribution to / (Use of) Net Position 64,431 64,431
Estimated Ending Net Position (Deficit) $ 23,232,211 $ 23,232,211 $ 23,287,759 $ 18,628,439
167

1210$-25
(17(535,6(
)81'6

City of Fort WorthMunicipal Airport FundSchedule of Assets, Deferred Outflows of Resources,Liabilities, Deferred Inflows of Resources, and Net Position (Deficit)October 2017, Fiscal Period 1
FY2018 FY2017
ASSETS AND DEFERRED OUTFLOWS OF RESOURCES
Assets
Current Assets:
Cash, Cash Equivalents, & Investments $ 4,618,393 $ 3,356,548
Interest Receivable 10,759 (23,403)
Accounts and Other Receivables,Net of Allowance for Uncollectible 409,722 257,179
Total Current Assets 5,038,874 3,590,324
LIABILITIES, DEFERRED INFLOWS OF RESOURCES, ANDNET POSITION (DEFICIT)
Liabilities
Current Liabilities:
Accounts Payable 46,739 176,565
Accrued Payroll 54,062 63,536
Unearned Revenue 376,536 261,425
Total Current Liabilities 477,337 501,526
NET POSITION (DEFICIT) $ 4,561,537 $ 3,088,798
169

City of Fort WorthMunicipal Airport FundSchedule of Revenues and Expenses for October 2017, Fiscal Period 1
FY2018 FY2017
AdoptedBudget
AmendedBudget Actuals YTD
% Actuals toBudget
Prior YearActuals YTD
% Actuals toPrior Year
Budget
Beginning Net Position (Deficit) $ 4,264,596 $ 4,264,596 $ 4,264,596 $ 3,024,810
Operating Revenues:
Charges for Services
Administrative Building Office Lease 318,392 318,392 40,161 %12.6 17,320 %9.6
Aircraft Landing Fee 1,631,664 1,631,664 - %- 24,200 %1.6
Fuel Flowage Fee 1,061,493 1,061,493 7,912 %0.7 - %-
Hangar Lease 1,513,594 1,513,594 137,627 %9.1 96,110 %8.5
Other Charges for Services 2,030,230 2,030,230 193,918 %9.6 172,925 %9.3
Other (1) 30,080 30,080 158,958 %528.5 1,518 %7.4
Total Operating Revenues 6,585,453 6,585,453 538,576 %8.2 312,073 %5.4
Operating Expenses:
Personnel Services 2,116,379 2,116,379 144,536 %6.8 153,997 %8.1
Supplies and Materials 173,438 173,438 3,719 %2.1 4,335 %2.5
Contractual Services 3,671,080 3,671,080 59,181 %1.6 70,976 %2.1
Total Operating Expenses 5,960,897 5,960,897 207,436 %3.5 229,308 %4.2
Operating Income (Loss) 624,556 624,556 331,140 %53.0 82,765 %24.9
Nonoperating Revenues (Expenses):
Transfers In 59,501 59,501 4,958 %8.3 4,583 %6.7
Transfers Out (668,079) (668,079) (39,157) %5.9 (23,360) %5.0
Changes in Net Position (Deficit) 296,941 63,988
Contribution to / (Use of) Net Position 15,978 15,978
Estimated Ending Net Position (Deficit) $ 4,280,574 $ 4,280,574 $ 4,561,537 $ 3,088,798
Footnotes:
(1) Other - Revenues are higher than expected due to an erroneous entry. A correcting entry will be made and posted in Period 2.
170

MUNICIPAL
AIRPORT FUND
DE7$,/('
SCHEDULES

City of Fort WorthMunicipal Airport FundGeneral AdministrationSchedule of Revenues and Expenses for October 2017, Fiscal Period 1
FY2018 FY2017
AdoptedBudget
AmendedBudget Actuals YTD
% Actualsto Budget
Prior YearActuals YTD
% Actuals toPrior Year
Budget
Operating Expenses:
Personnel Services $ 628,061 $ 628,061 $ 42,802 %6.8 $ 55,568 %8.4
Supplies and Materials 16,052 16,052 229 %1.4 593 %4.2
Contractual Services 329,699 329,699 21,745 %6.6 21,062 %7.4
Total Operating Expenses 973,812 973,812 64,776 %6.7 77,223 %8.0
Net Impact $ (973,812) $ (973,812) $ (64,776) $ (77,223)
172

City of Fort WorthMunicipal Airport FundAllliance AirportSchedule of Revenues and Expenses for October 2017, Fiscal Period 1
FY2018 FY2017
AdoptedBudget
AmendedBudget Actuals YTD
% Actualsto Budget
Prior YearActuals YTD
% Actuals toPrior Year
Budget
Operating Revenues:
Charges for Services
Aircraft Landing Fee $ 1,631,664 $ 1,631,664 $ - %- $ 24,200 %1.6
Fuel Flowage Fee 350,493 350,493 - %- - %-
Other Charges for Services 320,223 320,223 20,799 %6.5 35,539 %11.3
Other (1) 10,000 10,000 156,426 %1,564.3 - %-
Total Operating Revenues 2,312,380 2,312,380 177,225 %7.7 59,739 %2.7
Operating Expenses:
Personnel Services 7,933 7,933 661 %8.3 - %-
Contractual Services 1,763,213 1,763,213 829 %- 671 %-
Total Operating Expenses 1,771,146 1,771,146 1,490 %0.1 671 %-
Operating Income (Loss) 541,234 541,234 175,735 %1,579.1 59,068 %12.9
Net Impact $ 541,234 $ 541,234 $ 175,735 $ 59,068
Footnotes:
(1) Other - Revenues are higher than expected due to an erroneous entry. A correcting entry will be made and posted in Period 2.
173

City of Fort WorthMunicipal Airport FundMeacham AirportSchedule of Revenues and Expenses for October 2017, Fiscal Period 1
FY2018 FY2017
AdoptedBudget
AmendedBudget Actuals YTD
% Actualsto Budget
Prior YearActuals YTD
% Actuals toPrior Year
Budget
Operating Revenues:
Charges for Services
Admin Bldg Office Lease $ 318,392 $ 318,392 $ 39,971 %12.6 $ 17,130 %10.2
Fuel Flowage Fee 660,000 660,000 3,288 %0.5 - %-
Hangar Lease 1,029,228 1,029,228 96,203 %9.3 87,534 %8.7
Other Charges for Services 1,436,990 1,436,990 148,225 %10.3 117,058 %8.8
Other 5,000 5,000 2,163 %43.3 1,146 %10.8
Total Operating Revenues 3,449,610 3,449,610 289,850 %8.4 222,868 %7.1
Operating Expenses:
Personnel Services 1,080,297 1,080,297 72,108 %6.7 67,448 %7.7
Supplies and Materials 139,256 139,256 3,119 %2.2 2,912 %2.1
Contractual Services 1,213,375 1,213,375 29,018 %2.4 35,008 %3.5
Total Operating Expenses 2,432,928 2,432,928 104,245 %4.3 105,368 %5.3
Operating Income (Loss) 1,016,682 1,016,682 185,605 %87.3 117,500 %51.8
Income (Loss) Before Transfers andContributions 1,016,682 1,016,682 185,605 %87.3 117,500 %51.8
Transfers In 55,000 55,000 4,583 %8.3 4,583 %8.3
Transfers Out (623,578) (623,578) (35,449) %5.7 (23,360) %(7.5)
Net Impact $ 448,104 $ 448,104 $ 154,739 $ 98,723
174

City of Fort WorthMunicipal Airport FundSpinks AirportSchedule of Revenues and Expenses for October 2017, Fiscal Period 1
FY2018 FY2017
AdoptedBudget
AmendedBudget Actuals YTD
% Actualsto Budget
Prior YearActuals YTD
% Actuals toPrior Year
Budget
Operating Revenues:
Charges for Services
Admin Bldg Office Lease $ - $ - $ 190 %- $ 190 %1.6
Fuel Flowage Fee 51,000 51,000 4,624 %9.1 - %-
Hangar Lease 484,366 484,366 41,424 %8.6 8,576 %7.1
Other Charges for Services 273,017 273,017 24,894 %9.1 20,328 %9.4
Other 15,080 15,080 370 %2.5 370 %-
Total Operating Revenues 823,463 823,463 71,502 %8.7 29,464 %7.6
Operating Expenses:
Personnel Services 400,088 400,088 28,966 %7.2 30,981 %8.5
Supplies and Materials 18,130 18,130 371 %2.0 830 %3.8
Contractual Services 364,793 364,793 7,589 %2.1 14,234 %3.4
Total Operating Expenses 783,011 783,011 36,926 %4.7 46,045 %5.7
Operating Income (Loss) 40,452 40,452 34,576 %40.6 (16,581) %33.8
Income (Loss) Before Transfers andContributions 40,452 40,452 34,576 %40.6 (16,581) %33.8
Transfers In 4,501 4,501 375 %8.3 - %-
Transfers Out (44,501) (44,501) (3,708) %8.3 - %-
Net Impact $ 452 $ 452 $ 31,243 $ (16,581)
175

City of Fort WorthMunicipal Parking FundSchedule of Assets, Deferred Outflows of Resources,Liabilities, Deferred Inflows of Resources, and Net Position (Deficit)October 2017, Fiscal Period 1
FY2018 FY2017
ASSETS AND DEFERRED OUTFLOWS OF RESOURCES
Assets
Current Assets:
Cash, Cash Equivalents, & Investments $ 2,306,485 $ 1,754,822
Interest Receivable 23,424 3,257
Accounts and Other Receivables,Net of Allowance for Uncollectible 34,822 53,679
Total Current Assets 2,364,731 1,811,758
LIABILITIES, DEFERRED INFLOWS OF RESOURCES, ANDNET POSITION (DEFICIT)
Liabilities
Current Liabilities:
Accounts Payable 50,641 180,513
Accrued Payroll 20,896 20,295
Total Current Liabilities 71,537 200,808
NET POSITION (DEFICIT) $ 2,293,194 $ 1,610,950
176

City of Fort WorthMunicipal Parking FundSchedule of Revenues and Expenses for October 2017, Fiscal Period 1
FY2018 FY2017
AdoptedBudget
AmendedBudget Actuals YTD
% Actuals toBudget
Prior YearActuals YTD
% Actuals toPrior Year
Budget
Beginning Net Position (Deficit) $ 2,192,754 $ 2,192,754 $ 2,192,754 $ 1,561,862
Operating Revenues:
Charges for Services
Parking Daily 4,924,496 4,924,496 457,687 %9.3 427,839 %8.4
Parking Meters 2,175,778 2,175,778 199,188 %9.2 172,137 %8.3
Other Charges for Services 249,719 249,719 38,774 %15.5 16,785 %6.0
Other 715 715 - %- - %-
Total Operating Revenues 7,350,708 7,350,708 695,649 %9.5 616,761 %8.3
Operating Expenses:
Personnel Services 762,663 762,663 56,910 %7.5 49,969 %7.5
Supplies and Materials 91,034 91,034 3,481 %3.8 174 %0.2
Contractual Services 2,198,143 2,198,143 34,924 %1.6 34,036 %1.4
Total Operating Expenses 3,051,840 3,051,840 95,315 %3.1 84,179 %2.7
Operating Income (Loss) 4,298,868 4,298,868 600,334 %14.0 532,582 %12.3
Nonoperating Revenues (Expenses):
Investment Income 2,500 2,500 - %- - %-
Income (Loss) Before Transfers andContributions 4,301,368 4,301,368 600,334 %14.0 532,582 %12.3
Debt Service Transfers Out (4,158,694) (4,158,694) (496,696) %11.9 (480,296) %11.8
Transfers Out (38,369) (38,369) (3,198) %8.3 (3,198) %8.3
Changes in Net Position (Deficit) 100,440 49,088
Contribution to / (Use of) Net Position 104,305 104,305
Estimated Ending Net Position (Deficit) $ 2,297,059 $ 2,297,059 $ 2,293,194 $ 1,610,950
177

MUNICIPAL
PARKING FUND
DE7$,/('
SCHEDULES

City of Fort WorthMunicipal Parking FundManagementSchedule of Revenues and Expenses for October 2017, Fiscal Period 1
FY2018 FY2017
AdoptedBudget
AmendedBudget Actuals YTD
% Actualsto Budget
Prior YearActuals YTD
% Actuals toPrior Year
Budget
Operating Expenses:
Personnel Services $ 591,046 $ 591,046 $ 44,521 %7.5 $ 39,337 %7.9
Supplies and Materials 14,828 14,828 3,211 %21.7 135 %0.9
Contractual Services 166,954 166,954 15,404 %9.2 7,226 %2.1
Total Operating Expenses 772,828 772,828 63,136 %8.2 46,698 %5.5
Income (Loss) Before Transfers andContributions (772,828) (772,828) (63,136) %38.4 (46,698) %10.9
Debt Service Transfers Out (351,511) (351,511) (54,399) %15.5 (36,640) %15.6
Transfers Out (3,369) (3,369) (281) %8.3 (281) %8.3
Net Impact $ (1,900,536) $ (1,900,536) $ (117,816) $ (83,619)
* Management is a consolidation of Parking Administration, Parking Compliance Program, IT Services, Operations and Safety, OrganizationalManagement, and Southeast Routine Maintenance.
179

City of Fort WorthMunicipal Parking FundSurface LotsSchedule of Revenues and Expenses for October 2017, Fiscal Period 1
FY2018 FY2017
AdoptedBudget
AmendedBudget Actuals YTD
% Actualsto Budget
Prior YearActuals YTD
% Actuals toPrior Year
Budget
Operating Revenues:
Charges for Services
Other Charges for Services $ 73,239 $ 73,239 $ 7,196 %9.8 $ 12,392 %11.8
Other 75 75 - %- - %-
Total Operating Revenues 73,314 73,314 7,196 %9.8 12,392 %11.8
Operating Expenses:
Contractual Services 23,642 23,642 408 %1.7 1,128 %8.3
Operating Income (Loss) 49,672 49,672 6,788 %11.5 11,264 %20.1
Net Impact $ 49,672 $ 49,672 $ 6,788 $ 11,264
180

City of Fort WorthMunicipal Parking FundParking MetersSchedule of Revenues and Expenses for October 2017, Fiscal Period 1
FY2018 FY2017
AdoptedBudget
AmendedBudget Actuals YTD
% Actualsto Budget
Prior YearActuals YTD
% Actuals toPrior Year
Budget
Operating Revenues:
Charges for Services
Parking Meters $ 2,160,778 $ 2,160,778 $ 199,003 %9.2 $ 171,923 %8.4
Other Charges for Services 66,563 66,563 1,389 %2.1 1,855 %2.8
Other 300 300 - %- - %-
Total Operating Revenues 2,227,641 2,227,641 200,392 %9.0 173,778 %8.2
Operating Expenses:
Personnel Services 171,617 171,617 12,389 %7.2 10,721 %6.3
Supplies and Materials 76,206 76,206 270 %0.4 39 %0.1
Contractual Services 147,048 147,048 9,149 %6.2 14,750 %10.2
Total Operating Expenses 394,871 394,871 21,808 %5.5 25,510 %6.5
Operating Income (Loss) 1,832,770 1,832,770 178,584 %25.1 148,268 %27.8
Income (Loss) Before Transfers andContributions 1,832,770 1,832,770 178,584 %25.1 148,268 %27.8
Transfers Out (35,000) (35,000) (2,917) %8.3 (2,917) %8.3
Net Impact $ 1,797,770 $ 1,797,770 $ 175,667 $ 145,351
181

City of Fort WorthMunicipal Parking FundTaylor Street Parking GarageSchedule of Revenues and Expenses for October 2017, Fiscal Period 1
FY2018 FY2017
AdoptedBudget
AmendedBudget Actuals YTD
% Actualsto Budget
Prior YearActuals YTD
% Actuals toPrior Year
Budget
Operating Revenues:
Charges for Services
Parking Daily $ 231,984 $ 231,984 $ 18,635 %8.0 $ 20,621 %8.9
Other Charges for Services 109,917 109,917 30,190 %27.5 2,538 %2.3
Other 75 75 - %- - %-
Total Operating Revenues 341,976 341,976 48,825 %14.3 23,159 %6.8
Operating Expenses:
Contractual Services 81,134 81,134 656 %0.8 788 %0.9
Operating Income (Loss) 260,842 260,842 48,169 %36.3 22,371 %12.1
Nonoperating Revenues (Expenses):
Investment Income 2,500 2,500 - %- - %-
Income (Loss) Before Transfers andContributions 263,342 263,342 48,169 %36.3 22,371 %12.1
Net Impact $ 263,342 $ 263,342 $ 48,169 $ 22,371
182

City of Fort WorthMunicipal Parking FundCommerce Street Parking GarageSchedule of Revenues and Expenses for October 2017, Fiscal Period 1
FY2018 FY2017
AdoptedBudget
AmendedBudget Actuals YTD
% Actualsto Budget
Prior YearActuals YTD
% Actuals toPrior Year
Budget
Operating Revenues:
Charges for Services
Parking Daily $ 788,000 $ 788,000 $ 73,479 %9.3 $ 62,498 %7.3
Other 75 75 - %- - %-
Total Operating Revenues 788,075 788,075 73,479 %9.3 62,498 %7.3
Operating Expenses:
Personnel Services - - - %- (89) %8.3
Contractual Services 220,820 220,820 1,917 %0.9 108 %-
Total Operating Expenses 220,820 220,820 1,917 %0.9 19 %-
Operating Income (Loss) 567,255 567,255 71,562 %10.2 62,479 %15.6
Net Impact $ 567,255 $ 567,255 $ 71,562 $ 62,479
183

City of Fort WorthMunicipal Parking FundHouston Street Parking GarageSchedule of Revenues and Expenses for October 2017, Fiscal Period 1
FY2018 FY2017
AdoptedBudget
AmendedBudget Actuals YTD
% Actualsto Budget
Prior YearActuals YTD
% Actuals toPrior Year
Budget
Operating Revenues:
Charges for Services
Parking Daily $ 1,769,607 $ 1,769,607 $ 111,346 %6.3 $ 151,541 %9.2
Other 95 95 - %- - %-
Total Operating Revenues 1,769,702 1,769,702 111,346 %6.3 151,541 %9.2
Operating Expenses:
Contractual Services 459,156 459,156 3,953 %0.9 2,234 %0.5
Operating Income (Loss) 1,310,546 1,310,546 107,393 %7.2 149,307 %9.7
Income (Loss) Before Transfers andContributions 1,310,546 1,310,546 107,393 %7.2 149,307 %9.7
Debt Service Transfers Out (1,528,981) (1,528,981) (181,000) %11.8 (181,556) %11.8
Net Impact $ (218,435) $ (218,435) $ (73,607) $ 149,307
184

City of Fort WorthMunicipal Parking FundWestern Heritage Parking GarageSchedule of Revenues and Expenses for October 2017, Fiscal Period 1
FY2018 FY2017
AdoptedBudget
AmendedBudget Actuals YTD
% Actualsto Budget
Prior YearActuals YTD
% Actuals toPrior Year
Budget
Operating Revenues:
Charges for Services
Parking Daily $ 2,134,905 $ 2,134,905 $ 254,227 %11.9 $ 193,178 %8.3
Parking Meters 15,000 15,000 184 %1.2 214 %1.1
Other 95 95 - %- - %-
Total Operating Revenues 2,150,000 2,150,000 254,411 %11.8 193,392 %8.2
Operating Expenses:
Contractual Services 1,099,389 1,099,389 3,437 %0.3 7,802 %0.7
Operating Income (Loss) 1,050,611 1,050,611 250,974 %13.4 185,590 %10.1
Income (Loss) Before Transfers andContributions 1,050,611 1,050,611 250,974 %13.4 185,590 %10.1
Debt Service Transfers Out (2,278,202) (2,278,202) (261,297) %11.5 (262,100) %11.5
Net Impact $ (1,227,591) $ (1,227,591) $ (10,323) $ 185,590
185

City of Fort WorthSolid Waste FundSchedule of Assets, Deferred Outflows of Resources,Liabilities, Deferred Inflows of Resources, and Net Position (Deficit)October 2017, Fiscal Period 1
FY2018 FY2017
ASSETS AND DEFERRED OUTFLOWS OF RESOURCES
Assets
Current Assets:
Cash, Cash Equivalents, & Investments $ 23,807,798 $ 23,892,833
Interest Receivable 73,367 27,734
Accounts and Other Receivables,Net of Allowance for Uncollectible 6,708,837 6,878,878
Total Current Assets 30,590,002 30,799,445
Noncurrent Assets:
Restricted Assets:
Cash, Cash Equivalents, & Investments Held by Trustees (1) 5,483,713 4,991,439
Total Restricted Assets 5,483,713 4,991,439
Advances to Other Funds 7,022,957 10,522,957
Total Assets and Deferred Outflows of Resources 43,096,672 46,313,841
LIABILITIES, DEFERRED INFLOWS OF RESOURCES, AND NETPOSITION (DEFICIT)
Liabilities
Current Liabilities:
Accounts Payable 861,142 1,102,839
Accrued Payroll 197,177 253,799
Payable from Restricted Assets:
Customer Deposits 915,853 888,125
Unearned Revenue (2) (62) -
Total Current Liabilities 1,974,110 2,244,763
NET POSITION (DEFICIT) $ 41,122,562 $ 44,069,078
Footnotes:
(1) Cash, Cash Equivalents, & Investments Held by Trustees - Monetary funds held in SE Landfill Trust forLandfill Closure/Post Closure.
(2) Unearned Revenue - Unearned Revenue on the customer deposits is currently under review by theFinancial Management Services Department and any adjustment (if necessary) will be made in a futureperiod.
186

City of Fort WorthSolid Waste FundSchedule of Revenues and Expenses for October 2017, Fiscal Period 1
FY2018 FY2017
AdoptedBudget
AmendedBudget Actuals YTD
% Actuals toBudget
Prior YearActuals YTD
% Actuals toPrior Year
Budget
Beginning Net Position (Deficit) $ 37,151,792 $ 37,151,792 $ 37,151,792 $ 40,847,227
Operating Revenues:
Charges for Services
Container Hauling Fees 2,715,622 2,715,622 497,188 %18.3 30,389 %1.0
Landfill Lease 4,078,031 4,078,031 250,265 %6.1 250,957 %6.2
Residential Billing Revenue 48,536,825 48,536,825 4,243,100 %8.7 3,985,162 %8.5
Other Charges for Services 583,061 583,061 57,906 %9.9 52,081 %9.3
Other 5,669,259 5,669,259 367,732 %6.5 594,806 %11.7
Total Operating Revenues 61,582,798 61,582,798 5,416,191 %8.8 4,913,395 %8.2
Operating Expenses:
Personnel Services 8,253,946 8,253,946 549,487 %6.7 670,811 %8.1
Supplies and Materials 859,968 859,968 17,494 %2.0 15,733 %1.8
Contractual Services 44,479,056 44,479,056 137,581 %0.3 147,826 %0.3
Total Operating Expenses 53,592,970 53,592,970 704,562 %1.3 834,370 %1.6
Operating Income (Loss) 7,989,828 7,989,828 4,711,629 %59.0 4,079,025 %55.0
Nonoperating Revenues (Expenses):
Investment Income 182,990 182,990 2,441 %1.3 - %-
Interest and Service Charges (300) (300) - %- - %-
Total Nonoperating Revenues(Expenses) 182,690 182,690 2,441 %1.3 - %-
Income (Loss) Before Transfers andContributions 8,172,518 8,172,518 4,714,070 %57.7 4,079,025 %53.8
Debt Service Transfers Out (546,424) (546,424) (84,701) %15.5 (85,943) %15.4
Transfers In 2,330,000 2,330,000 194,167 %8.3 - %-
Transfers Out (10,229,599) (10,229,599) (852,766) %8.3 (771,231) %6.5
Changes in Net Position (Deficit) 3,970,770 3,221,851
Contribution to / (Use of) Net Position (273,505) (273,505)
Estimated Ending Net Position (Deficit) $ 36,878,287 $ 36,878,287 $ 41,122,562 $ 44,069,078
187

(17(535,6(
'(%7�6(59,&(
)81'6

City of Fort WorthWater Prior Lien Debt ServiceSchedule of Assets, Deferred Outflows of Resources,Liabilities, Deferred Inflows of Resources, and Net Position (Deficit)October 2017, Fiscal Period 1
FY2018 FY2017
ASSETS AND DEFERRED OUTFLOWS OF RESOURCES
Assets
Current Assets:
Cash, Cash Equivalents, & Investments $ 18,178,515 $ 17,131,537
Interest Receivable 38,226 (4,760)
Total Current Assets 18,216,741 17,126,777
Noncurrent Assets:
Restricted Assets:
Cash & Cash Equivalents 23,597 2,573,727
Cash, Cash Equivalents, & Investments Held by Trustees 31,016 6,377
Total Restricted Assets 54,613 2,580,104
Total Assets 18,271,354 19,706,881
LIABILITIES, DEFERRED INFLOWS OF RESOURCES, ANDNET POSITION (DEFICIT)
NET POSITION (DEFICIT) $ 18,271,354 $ 19,706,881
189

City of Fort WorthWater Prior Lien Debt ServiceSchedule of Revenues and Expenses for October 2017, Fiscal Period 1
FY2018 FY2017
AdoptedBudget
AmendedBudget Actuals YTD
% Actuals toBudget
Prior YearActuals YTD
% Actuals toPrior Year
Budget
Beginning Net Position (Deficit) $ 10,751,194 $ 10,751,194 $ 10,751,194 $ 7,559,343
Nonoperating Revenues (Expenses):
Investment Income - - 2,475 %- 4,508 %-
Interest and Service Charges (31,998,744) (31,998,744) - %- - %-
Total Nonoperating Revenues(Expenses) (31,998,744) (31,998,744) 2,475 %- 4,508 %-
Income (Loss) Before Transfers andContributions (31,998,744) (31,998,744) 2,475 %- 4,508 %-
Debt Service Transfers In 90,214,837 90,214,837 7,517,685 %8.3 12,143,030 %13.1
Debt Principal Payments (58,216,093) (58,216,093) - %- - %-
Changes in Net Position (Deficit) 7,520,160 12,147,538
Contribution to / (Use of) Net Position - -
Estimated Ending Net Position (Deficit) $ 10,751,194 $ 10,751,194 $ 18,271,354 $ 19,706,881
190

City of Fort WorthWater Sub Lien Debt ServiceSchedule of Assets, Deferred Outflows of Resources,Liabilities, Deferred Inflows of Resources, and Net Position (Deficit)October 2017, Fiscal Period 1
FY2018 FY2017
ASSETS AND DEFERRED OUTFLOWS OF RESOURCES
Assets
Current Assets:
Cash, Cash Equivalents, & Investments $ 3,094,532 $ 1,541,371
Interest Receivable 6,134 57,502
Total Current Assets 3,100,666 1,598,873
LIABILITIES, DEFERRED INFLOWS OF RESOURCES, ANDNET POSITION (DEFICIT)
NET POSITION (DEFICIT) $ 3,100,666 $ 1,598,873
191

City of Fort WorthWater Sub Lien Debt ServiceSchedule of Revenues and Expenses for October 2017, Fiscal Period 1
FY2018 FY2017
AdoptedBudget
AmendedBudget Actuals YTD
% Actuals toBudget
Prior YearActuals YTD
% Actuals toPrior Year
Budget
Beginning Net Position (Deficit) $ 2,636,554 $ 2,636,554 $ 2,636,554 $ 786,595
Nonoperating Revenues (Expenses):
Interest and Service Charges (1,254,347) (1,254,347) - %- - %-
Income (Loss) Before Transfers andContributions (1,254,347) (1,254,347) - %- - %-
Debt Service Transfers In 5,569,347 5,569,347 464,112 %8.3 812,278 %10.5
Debt Principal Payments (4,315,000) (4,315,000) - %- - %-
Changes in Net Position (Deficit) 464,112 812,278
Contribution to / (Use of) Net Position - -
Estimated Ending Net Position (Deficit) $ 2,636,554 $ 2,636,554 $ 3,100,666 $ 1,598,873
192

City of Fort WorthWater Debt Reserve Fund *Schedule of Assets, Deferred Outflows of Resources,Liabilities, Deferred Inflows of Resources, and Net Position (Deficit)October 2017, Fiscal Period 1
FY2018 FY2017
ASSETS AND DEFERRED OUTFLOWS OF RESOURCES
Assets
Current Assets:
Cash, Cash Equivalents, & Investments $ 4,443,648 $ -
LIABILITIES, DEFERRED INFLOWS OF RESOURCES, ANDNET POSITION (DEFICIT)
NET POSITION (DEFICIT) $ 4,443,648 $ -
* New Water Debt Reserve Fund established in March 2017
193

City of Fort WorthWater Debt Reserve Fund *Schedule of Revenues and Expenses for October 2017, Fiscal Period 1
FY2018 FY2017
AdoptedBudget
AmendedBudget Actuals YTD
% Actuals toBudget
Prior YearActuals YTD
% Actuals toPrior Year
Budget
Beginning Net Position (Deficit) $ 4,443,648 $ 4,443,648 $ 4,443,648 $ -
Changes in Net Position (Deficit) - -
Contribution to / (Use of) Net Position - -
Estimated Ending Net Position (Deficit) $ 4,443,648 $ 4,443,648 $ 4,443,648 $ -
* New Water Debt Reserve Fund established in March 2017
194

City of Fort WorthStormwater Debt Service FundSchedule of Assets, Deferred Outflows of Resources,Liabilities, Deferred Inflows of Resources, and Net Position (Deficit)October 2017, Fiscal Period 1
FY2018 FY2017
ASSETS AND DEFERRED OUTFLOWS OF RESOURCES
Assets
Cash, Cash Equivalents, & Investments $ 3,988,561 $ 6,457,408
Interest Receivable 7,510 16,462
Total Current Assets 3,996,071 6,473,870
LIABILITIES, DEFERRED INFLOWS OF RESOURCES, ANDNET POSITION (DEFICIT)
NET POSITION (DEFICIT) $ 3,996,071 $ 6,473,870
195
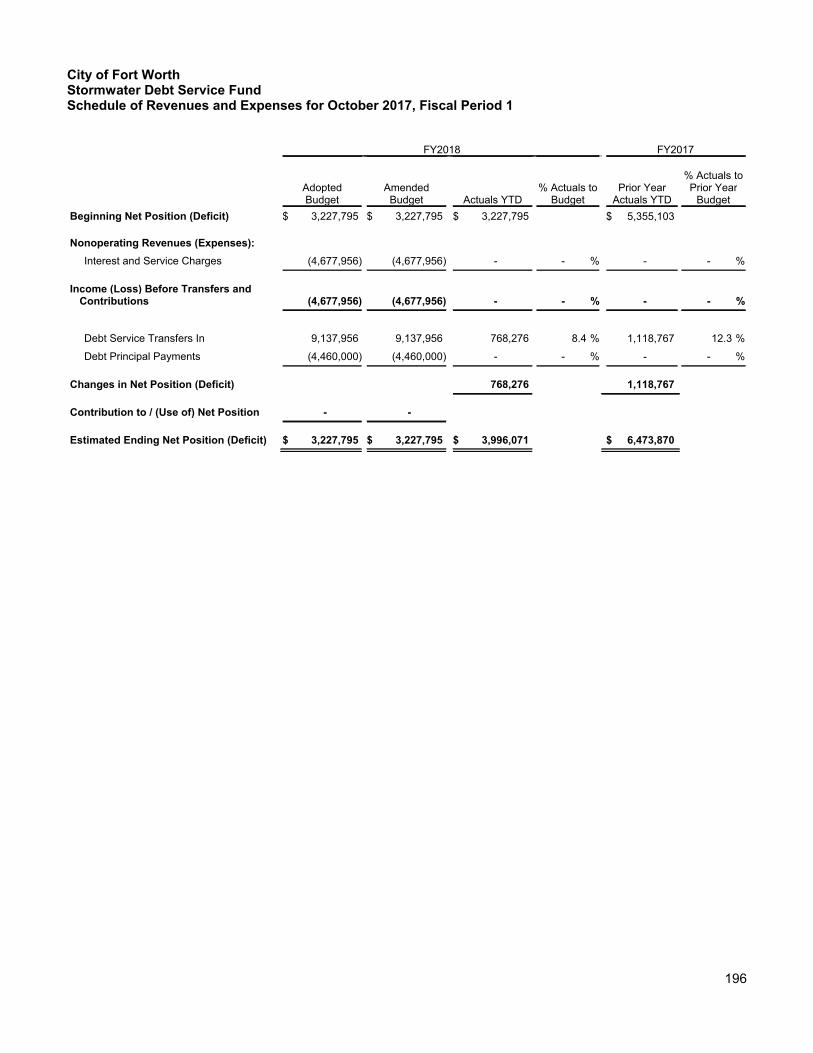
City of Fort WorthStormwater Debt Service FundSchedule of Revenues and Expenses for October 2017, Fiscal Period 1
FY2018 FY2017
AdoptedBudget
AmendedBudget Actuals YTD
% Actuals toBudget
Prior YearActuals YTD
% Actuals toPrior Year
Budget
Beginning Net Position (Deficit) $ 3,227,795 $ 3,227,795 $ 3,227,795 $ 5,355,103
Nonoperating Revenues (Expenses):
Interest and Service Charges (4,677,956) (4,677,956) - %- - %-
Income (Loss) Before Transfers andContributions (4,677,956) (4,677,956) - %- - %-
Debt Service Transfers In 9,137,956 9,137,956 768,276 %8.4 1,118,767 %12.3
Debt Principal Payments (4,460,000) (4,460,000) - %- - %-
Changes in Net Position (Deficit) 768,276 1,118,767
Contribution to / (Use of) Net Position - -
Estimated Ending Net Position (Deficit) $ 3,227,795 $ 3,227,795 $ 3,996,071 $ 6,473,870
196

City of Fort WorthMunicipal Parking Debt Service FundSchedule of Assets, Deferred Outflows of Resources,Liabilities, Deferred Inflows of Resources, and Net Position (Deficit)October 2017, Fiscal Period 1
FY2018 FY2017
ASSETS AND DEFERRED OUTFLOWS OF RESOURCES
Assets
Cash, Cash Equivalents, & Investments $ 1,328,360 $ 1,373,868
Interest Receivable 1,972 16,734
Total Current Assets 1,330,332 1,390,602
LIABILITIES, DEFERRED INFLOWS OF RESOURCES, ANDNET POSITION (DEFICIT)
NET POSITION (DEFICIT) $ 1,330,332 $ 1,390,602
197

City of Fort WorthMunicipal Parking Debt Service FundSchedule of Revenues and Expenses for October 2017, Fiscal Period 1
FY2018 FY2017
AdoptedBudget
AmendedBudget Actuals YTD
% Actuals toBudget
Prior YearActuals YTD
% Actuals toPrior Year
Budget
Beginning Net Position (Deficit) $ 847,682 $ 847,682 $ 847,682 $ 910,307
Nonoperating Revenues (Expenses):
Interest and Service Charges (1,624,100) (1,624,100) - %- - %-
Income (Loss) Before Transfers andContributions (1,624,100) (1,624,100) - %- - %-
Debt Service Transfers In 4,054,100 4,054,100 482,650 %11.9 480,295 %11.9
Debt Principal Payments (2,430,000) (2,430,000) - %- - %-
Changes in Net Position (Deficit) 482,650 480,295
Contribution to / (Use of) Net Position - -
Estimated Ending Net Position (Deficit) $ 847,682 $ 847,682 $ 1,330,332 $ 1,390,602
198

City of Fort WorthSolid Waste Debt Service FundSchedule of Assets, Deferred Outflows of Resources,Liabilities, Deferred Inflows of Resources, and Net Position (Deficit)October 2017, Fiscal Period 1
FY2018 FY2017
ASSETS AND DEFERRED OUTFLOWS OF RESOURCES
Assets
Current Assets:
Cash, Cash Equivalents, & Investments $ 593,089 $ 581,482
Interest Receivable 1,186 531
Total Current Assets 594,275 582,013
LIABILITIES, DEFERRED INFLOWS OF RESOURCES, ANDNET POSITION (DEFICIT)
NET POSITION (DEFICIT) $ 594,275 $ 582,013
199

City of Fort WorthSolid Waste Debt Service FundSchedule of Revenues and Expenses for October 2017, Fiscal Period 1
FY2018 FY2017
AdoptedBudget
AmendedBudget Actuals YTD
% Actuals toBudget
Prior YearActuals YTD
% Actuals toPrior Year
Budget
Beginning Net Position (Deficit) $ 509,574 $ 509,574 $ 509,574 $ 496,070
Nonoperating Revenues (Expenses):
Interest and Service Charges (76,424) (76,424) - %- - %-
Income (Loss) Before Transfers andContributions (76,424) (76,424) - %- - %-
Debt Service Transfers In 546,424 546,424 84,701 %15.5 85,943 %15.4
Debt Principal Payments (470,000) (470,000) - %- - %-
Changes in Net Position (Deficit) 84,701 85,943
Contribution to / (Use of) Net Position - -
Estimated Ending Net Position (Deficit) $ 509,574 $ 509,574 $ 594,275 $ 582,013
200

,17(51$/�6(59,&(
)81'6

City of Fort WorthEquipment Services FundSchedule of Assets, Deferred Outflows of Resources,Liabilities, Deferred Inflows of Resources, and Net Position (Deficit)October 2017, Fiscal Period 1
FY2018 FY2017
ASSETS AND DEFERRED OUTFLOWS OF RESOURCES
Assets
Current Assets:
Cash, Cash Equivalents, & Investments $ 5,653,794 $ 4,093,548
Interest Receivable 14,888 6,699
Inventories (at Cost) 190,650 117,161
Total Current Assets 5,859,332 4,217,408
LIABILITIES, DEFERRED INFLOWS OF RESOURCES, ANDNET POSITION (DEFICIT)
Liabilities
Current Liabilities:
Accounts Payable 1,741,494 1,491,969
Accrued Payroll 206,476 237,313
Current Portion of Long-Term Liabilities - 963
Total Current Liabilities 1,947,970 1,730,245
NET POSITION (DEFICIT) $ 3,911,362 $ 2,487,163
202

City of Fort WorthEquipment Services FundSchedule of Revenues and Expenses for October 2017, Fiscal Period 1
FY2018 FY2017
AdoptedBudget
AmendedBudget Actuals YTD
% Actuals toBudget
Prior YearActuals YTD
% Actuals toPrior Year
Budget
Beginning Net Position (Deficit) $ 3,273,427 $ 3,273,427 $ 3,273,427 $ 2,062,627
Operating Revenues:
Charges for Services
Diesel Sales 2,189,024 2,189,024 116,054 %5.3 130,612 %6.2
Equipment/Maintenance Labor Costs 9,132,164 9,132,164 879,109 %9.6 801,922 %9.5
ESD Administrative Charge 2,409,395 2,409,395 209,845 %8.7 186,855 %8.2
Fleet Fuel Card 1,705,124 1,705,124 227,132 %13.3 150,912 %9.4
Motor Vehicles Repair & MaintenanceSupplies 4,243,500 4,243,500 358,146 %8.4 355,323 %8.4
Motor Vehicles Repair & MaintenanceOverhead 1,398,118 1,398,118 115,006 %8.2 107,419 %9.1
Outside Repair & Maintenance Costs 2,485,028 2,485,028 400,530 %16.1 382,764 %10.1
Unleaded Sales 1,799,117 1,799,117 64,245 %3.6 93,932 %5.6
Other Charges for Services 182,950 182,950 5,846 %3.2 9,911 %5.1
Other 18,500 18,500 916 %5.0 333 %1.0
Total Operating Revenues 25,562,920 25,562,920 2,376,829 %9.3 2,219,983 %8.7
Operating Expenses:
Personnel Services 9,400,023 9,400,023 627,869 %6.7 677,165 %7.9
Supplies and Materials 9,914,553 9,914,553 563,730 %5.7 582,899 %6.0
Contractual Services 5,778,654 5,778,654 504,306 %8.7 477,130 %7.2
Total Operating Expenses 25,093,230 25,093,230 1,695,905 %6.8 1,737,194 %7.0
Operating Income (Loss) 469,690 469,690 680,924 %145.0 482,789 %66.0
Nonoperating Revenues (Expenses):
Investment Income 27,754 27,754 - %- - %-
Sale of Property and Equipment 10,000 10,000 - %- - %-
Total Nonoperating Revenues(Expenses) 37,754 37,754 - %- - %-
Income (Loss) Before Transfers andContributions 507,444 507,444 680,924 %134.2 482,789 %65.1
Transfers Out (507,444) (507,444) (42,989) %8.5 (58,253) %5.0
Changes in Net Position (Deficit) 637,935 424,536
Contribution to / (Use of) Net Position - -
Estimated Ending Net Position (Deficit) $ 3,273,427 $ 3,273,427 $ 3,911,362 $ 2,487,163
203

City of Fort WorthCapital Project Services FundSchedule of Assets, Deferred Outflows of Resources,Liabilities, Deferred Inflows of Resources, and Net Position (Deficit)October 2017, Fiscal Period 1
FY2018 FY2017
ASSETS AND DEFERRED OUTFLOWS OF RESOURCES
Assets
Current Assets:
Cash, Cash Equivalents, & Investments $ 2,497,004 $ 1,792,152
Accounts and Other Receivables,Net of Allowance for Uncollectible 5,678 -
Total Current Assets 2,502,682 1,792,152
LIABILITIES, DEFERRED INFLOWS OF RESOURCES, ANDNET POSITION (DEFICIT)
Liabilities
Current Liabilities:
Accounts Payable 92,026 26,414
Accrued Payroll 203,409 182,997
Total Current Liabilities 295,435 209,411
NET POSITION (DEFICIT) $ 2,207,247 $ 1,582,741
204
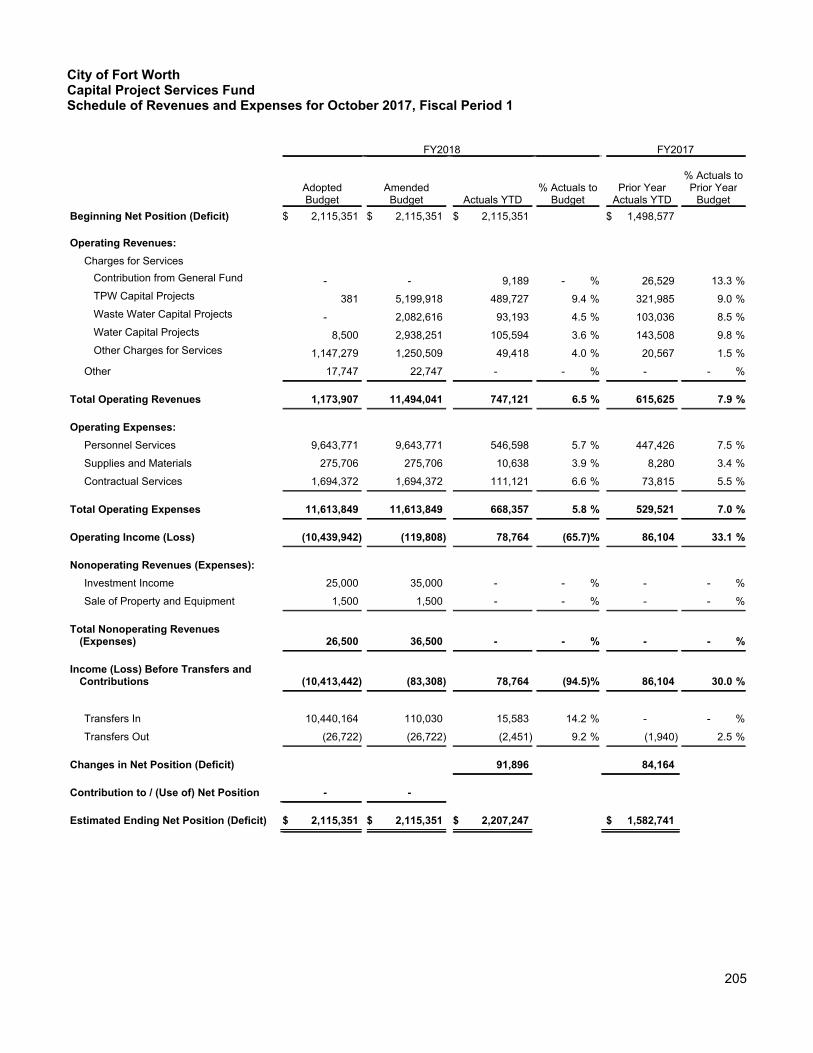
City of Fort WorthCapital Project Services FundSchedule of Revenues and Expenses for October 2017, Fiscal Period 1
FY2018 FY2017
AdoptedBudget
AmendedBudget Actuals YTD
% Actuals toBudget
Prior YearActuals YTD
% Actuals toPrior Year
Budget
Beginning Net Position (Deficit) $ 2,115,351 $ 2,115,351 $ 2,115,351 $ 1,498,577
Operating Revenues:
Charges for Services
Contribution from General Fund - - 9,189 %- 26,529 %13.3
TPW Capital Projects 381 5,199,918 489,727 %9.4 321,985 %9.0
Waste Water Capital Projects - 2,082,616 93,193 %4.5 103,036 %8.5
Water Capital Projects 8,500 2,938,251 105,594 %3.6 143,508 %9.8
Other Charges for Services 1,147,279 1,250,509 49,418 %4.0 20,567 %1.5
Other 17,747 22,747 - %- - %-
Total Operating Revenues 1,173,907 11,494,041 747,121 %6.5 615,625 %7.9
Operating Expenses:
Personnel Services 9,643,771 9,643,771 546,598 %5.7 447,426 %7.5
Supplies and Materials 275,706 275,706 10,638 %3.9 8,280 %3.4
Contractual Services 1,694,372 1,694,372 111,121 %6.6 73,815 %5.5
Total Operating Expenses 11,613,849 11,613,849 668,357 %5.8 529,521 %7.0
Operating Income (Loss) (10,439,942) (119,808) 78,764 %(65.7) 86,104 %33.1
Nonoperating Revenues (Expenses):
Investment Income 25,000 35,000 - %- - %-
Sale of Property and Equipment 1,500 1,500 - %- - %-
Total Nonoperating Revenues(Expenses) 26,500 36,500 - %- - %-
Income (Loss) Before Transfers andContributions (10,413,442) (83,308) 78,764 %(94.5) 86,104 %30.0
Transfers In 10,440,164 110,030 15,583 %14.2 - %-
Transfers Out (26,722) (26,722) (2,451) %9.2 (1,940) %2.5
Changes in Net Position (Deficit) 91,896 84,164
Contribution to / (Use of) Net Position - -
Estimated Ending Net Position (Deficit) $ 2,115,351 $ 2,115,351 $ 2,207,247 $ 1,582,741
205

City of Fort WorthInformation Systems FundSchedule of Assets, Deferred Outflows of Resources,Liabilities, Deferred Inflows of Resources, and Net Position (Deficit)October 2017, Fiscal Period 1
FY2018 FY2017
ASSETS AND DEFERRED OUTFLOWS OF RESOURCES
Assets
Current Assets:
Cash, Cash Equivalents, & Investments $ 6,816,740 $ 7,533,637
Interest Receivable 27,381 11,267
Accounts and Other Receivables,Net of Allowance for Uncollectible 1,494,797 8,076
Inventories (at Cost) 78,630 84,047
Total Current Assets 8,417,548 7,637,027
LIABILITIES, DEFERRED INFLOWS OF RESOURCES, ANDNET POSITION (DEFICIT)
Liabilities
Current Liabilities:
Accounts Payable 459,109 626,797
Accrued Payroll 450,728 406,092
Total Current Liabilities 909,837 1,032,889
NET POSITION (DEFICIT) $ 7,507,711 $ 6,604,138
206

City of Fort WorthInformation Systems FundSchedule of Revenues and Expenses for October 2017, Fiscal Period 1
FY2018 FY2017
AdoptedBudget
AmendedBudget Actuals YTD
% Actuals toBudget
Prior YearActuals YTD
% Actuals toPrior Year
Budget
Beginning Net Position (Deficit) $ 4,920,465 $ 4,920,465 $ 4,920,465 $ 5,541,924
Operating Revenues:
Charges for Services
Computing Services Fee 29,019,520 29,019,520 2,418,295 %8.3 1,880,828 %8.3
Radio Service Fee (1) 2,318,653 2,318,653 1,666,974 %71.9 162,824 %8.3
Radio Tower and Other Subscriptions 2,093,813 2,093,813 117,427 %5.6 58,198 %2.9
Telephone Service Fee 564,637 564,637 47,057 %8.3 141,155 %8.3
Other Charges for Services 1,495,391 1,495,391 124,618 %8.3 202,911 %8.3
Other - - 11,088 %- 55,880 %18.3
Total Operating Revenues 35,492,014 35,492,014 4,385,459 %12.4 2,501,796 %8.1
Operating Expenses:
Personnel Services 16,722,673 16,722,673 1,210,433 %7.2 1,006,305 %7.5
Supplies and Materials 424,509 424,509 11,346 %2.7 12,037 %2.8
Contractual Services 18,770,887 18,770,887 340,435 %1.8 403,756 %2.4
Total Operating Expenses 35,918,069 35,918,069 1,562,214 %4.3 1,422,098 %4.7
Operating Income (Loss) (426,055) (426,055) 2,823,245 %(662.6) 1,079,698 %204.8
Transfers Out (2,821,507) (2,821,507) (235,999) %8.4 (17,484) %1.4
Changes in Net Position (Deficit) 2,587,246 1,062,214
Contribution to / (Use of) Net Position (3,247,562) (3,247,562)
Estimated Ending Net Position (Deficit) $ 1,672,903 $ 1,672,903 $ 7,507,711 $ 6,604,138
Footnotes:
(1) Radio Service Fee - Radio Subscriber fee is higher than expected and currently under review by the Financial Management ServicesDepartment. Any adjustments (if necessary) will be recorded in a future period.
207

City of Fort WorthGroup Health and Life Insurance FundSchedule of Assets, Deferred Outflows of Resources,Liabilities, Deferred Inflows of Resources, and Net Position (Deficit)October 2017, Fiscal Period 1
FY2018 FY2017
ASSETS AND DEFERRED OUTFLOWS OF RESOURCES
Assets
Current Assets:
Cash, Cash Equivalents, & Investments $ 20,571,275 $ 23,600,058
Interest Receivable 46,659 24,023
Total Current Assets 20,617,934 23,624,081
Noncurrent Assets:
Restricted Assets:
Cash, Cash Equivalents, & Investments Held by Trustees (1) 1,870,000 1,870,000
Total Assets 22,487,934 25,494,081
LIABILITIES, DEFERRED INFLOWS OF RESOURCES, AND NETPOSITION (DEFICIT)
Liabilities
Current Liabilities:
Accounts Payable 3,452,462 2,498,116
Accrued Payroll 27,602 27,244
Total Current Liabilities 3,480,064 2,525,360
NET POSITION (DEFICIT) $ 19,007,870 $ 22,968,721
Footnotes:
(1) Cash, Cash Equivalents, & Investments Held by Trustees - United Healthcare's Imprest Account forpaying employee's healthcare claims until the City is invoiced and United Healthcare is reimbursed.
208

City of Fort WorthGroup Health and Life Insurance FundSchedule of Revenues and Expenses for October 2017, Fiscal Period 1
FY2018 FY2017
AdoptedBudget
AmendedBudget Actuals YTD
% Actuals toBudget
Prior YearActuals YTD
% Actuals toPrior Year
Budget
Beginning Net Position (Deficit) $ 18,026,425 $ 18,026,425 $ 18,026,425 $ 23,193,394
Operating Revenues:
Charges for Services
Contribution from Capital ProjectServices Fund 860,354 860,354 49,949 %5.8 162,585 %-
Contribution from CCPD Fund 3,661,737 3,661,737 269,854 %7.4 294,453 %-
Contribution from Culture and TourismFund 1,082,206 1,082,206 70,479 %6.5 82,683 %-
Contribution from Employees 19,952,298 19,952,298 1,420,657 %7.1 1,544,771 %-
Contribution from Equipment ServicesFund 991,003 991,003 69,059 %7.0 74,583 %-
Contribution from General Fund 41,914,241 41,914,241 2,903,983 %6.9 3,272,218 %-
Contribution from ITS Fund 1,400,403 1,400,403 102,886 %7.3 85,864 %-
Contribution from Retirees - - - %- 15,628 %-
Contribution from Solid Waste Fund 951,034 951,034 62,679 %6.6 76,483 %-
Contribution from Stormwater UtilityFund 932,942 932,942 59,676 %6.4 66,779 %-
Contribution from Water and SewerFund 7,551,700 7,551,700 527,859 %7.0 613,765 %-
Other Charges for Services 3,452,990 3,452,990 243,428 %7.0 143,596 %-
Other - - 16,133 %- - %-
Total Operating Revenues 82,750,908 82,750,908 5,796,642 %7.0 6,433,408 %-
Operating Expenses:
Personnel Services 1,916,742 1,916,742 70,204 %3.7 68,714 %-
Supplies and Materials 30,612 30,612 4,822 %15.8 256 %-
Contractual Services 81,151,958 81,151,958 4,739,424 %5.8 6,588,761 %-
Total Operating Expenses 83,099,312 83,099,312 4,814,450 %5.8 6,657,731 %-
Operating Income (Loss) (348,404) (348,404) 982,192 %(281.9) (224,323) %-
Nonoperating Revenues (Expenses):
Investment Income 357,366 357,366 - %- - %-
Income (Loss) Before Transfers andContributions 8,962 8,962 982,192 %10,959.5 (224,323) %-
Transfers In - - - %- 397 %-
Transfers Out (8,962) (8,962) (747) %8.3 (747) %-
Changes in Net Position (Deficit) 981,445 (224,673)
Contribution to / (Use of) Net Position - -
Estimated Ending Net Position (Deficit) $ 18,026,425 $ 18,026,425 $ 19,007,870 $ 22,968,721
209

City of Fort WorthRisk Financing FundSchedule of Assets, Deferred Outflows of Resources,Liabilities, Deferred Inflows of Resources, and Net Position (Deficit)October 2017, Fiscal Period 1
FY2018 FY2017
ASSETS AND DEFERRED OUTFLOWS OF RESOURCES
Assets
Current Assets:
Cash, Cash Equivalents, & Investments $ 29,755,799 $ 30,514,248
Interest Receivable 57,900 26,066
Accounts and Other Receivables,Net of Allowance for Uncollectible 529,975 9,602
Total Current Assets 30,343,674 30,549,916
Noncurrent Assets:
Restricted Assets:
Cash, Cash Equivalents, & Investments Held by Trustees (1) 662,553 800,000
Total Assets 31,006,227 31,349,916
LIABILITIES, DEFERRED INFLOWS OF RESOURCES, AND NETPOSITION (DEFICIT)
Liabilities
Current Liabilities:
Accounts Payable 114,752 711,247
Accrued Payroll 37,799 55,387
Total Current Liabilities 152,551 766,634
NET POSITION (DEFICIT) $ 30,853,676 $ 30,583,282
Footnotes:
(1) Cash, Cash Equivalents, & Investments Held by Trustees - Monies held by York to pay employee'sWorkers' Compensation claims.
210

City of Fort WorthRisk Financing FundSchedule of Revenues and Expenses for October 2017, Fiscal Period 1
FY2018 FY2017
AdoptedBudget
AmendedBudget Actuals YTD
% Actuals toBudget
Prior YearActuals YTD
% Actuals toPrior Year
Budget
Beginning Net Position (Deficit) $ 30,012,404 $ 30,012,404 $ 30,012,404 $ 29,827,672
Operating Revenues:
Charges for Services
Contribution from CCPD Fund 532,820 532,820 44,402 %8.3 - %-
Contribution from Culture and TourismFund 329,614 329,614 27,468 %8.3 59,649 %8.3
Contribution from Equipment ServicesFund 304,884 304,884 25,407 %8.3 24,912 %8.3
Contribution from General Fund 13,133,695 13,133,695 1,094,498 %8.3 1,154,846 %8.3
Contribution from Water and SewerFund 2,685,474 2,685,474 223,799 %8.3 257,450 %8.3
Other Charges for Services 1,439,450 1,452,310 106,236 %7.3 74,391 %8.3
Other 798,387 785,527 80,905 %10.3 56,870 %4.8
Total Operating Revenues 19,224,324 19,224,324 1,602,715 %8.3 1,628,118 %8.1
Operating Expenses:
Personnel Services 1,686,359 1,686,359 123,566 %7.3 140,920 %8.8
Supplies and Materials 28,375 28,375 2,294 %8.1 403 %1.2
Contractual Services 17,669,338 17,669,338 635,225 %3.6 729,694 %4.2
Total Operating Expenses 19,384,072 19,384,072 761,085 %3.9 871,017 %4.5
Operating Income (Loss) (159,748) (159,748) 841,630 %(526.8) 757,101 %86.4
Nonoperating Revenues (Expenses):
Investment Income 168,000 168,000 330 %0.2 39 %0.1
Income (Loss) Before Transfers andContributions 8,252 8,252 841,960 %10,203.1 757,140 %82.8
Transfers Out (8,252) (8,252) (688) %8.3 (1,530) %0.1
Changes in Net Position (Deficit) 841,272 755,610
Contribution to / (Use of) Net Position - -
Estimated Ending Net Position (Deficit) $ 30,012,404 $ 30,012,404 $ 30,853,676 $ 30,583,282
211

f iduciary
f un ds

City of Fort WorthRetiree Healthcare Trust FundSchedule of Assets, Deferred Outflows of Resources,Liabilities, Deferred Inflows of Resources, and Fiduciary Net Position (Deficit)October 2017, Fiscal Period 1
FY2018 FY2017
ASSETS AND DEFERRED OUTFLOWS OF RESOURCES
Assets
Current Assets:
Cash & Cash Equivalents (1) $ 3,058,703 $ 1,622,252
Cash & Investments Held by Trustee:
Short-Term Mutual Fund Investments (1) 68,049,845 68,049,845
Accrued Income (1) 636 636
Accounts and Other Receivables,Net of Allowance for Uncollectible - 615,473
Total Current Assets 71,109,184 70,288,206
LIABILITIES, DEFERRED INFLOWS OF RESOURCES, ANDNET POSITION (DEFICIT)
Liabilities
Current Liabilities:
Accrued Liabilities 1,902,484 1,015,579
NET POSITION (DEFICIT) $ 69,206,700 $ 69,272,627
Footnotes:
(1) Cash & Cash Equivalents, Short-Term Mutual Fund Investments, & Accrued Income - An adjustingentry will be made to these accounts when the 9/30/17 PARS investment activity statement is received inPeriod 3.
213
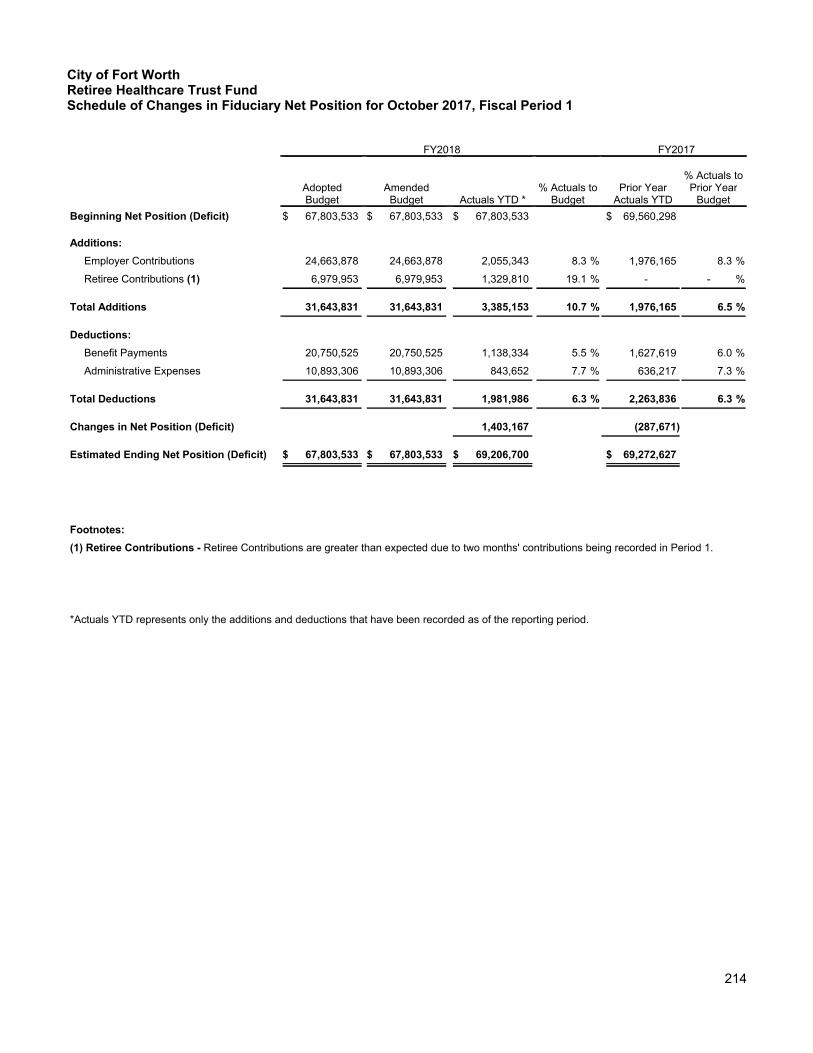
City of Fort WorthRetiree Healthcare Trust FundSchedule of Changes in Fiduciary Net Position for October 2017, Fiscal Period 1
FY2018 FY2017
AdoptedBudget
AmendedBudget Actuals YTD *
% Actuals toBudget
Prior YearActuals YTD
% Actuals toPrior Year
Budget
Beginning Net Position (Deficit) $ 67,803,533 $ 67,803,533 $ 67,803,533 $ 69,560,298
Additions:
Employer Contributions 24,663,878 24,663,878 2,055,343 %8.3 1,976,165 %8.3
Retiree Contributions (1) 6,979,953 6,979,953 1,329,810 %19.1 - %-
Total Additions 31,643,831 31,643,831 3,385,153 %10.7 1,976,165 %6.5
Deductions:
Benefit Payments 20,750,525 20,750,525 1,138,334 %5.5 1,627,619 %6.0
Administrative Expenses 10,893,306 10,893,306 843,652 %7.7 636,217 %7.3
Total Deductions 31,643,831 31,643,831 1,981,986 %6.3 2,263,836 %6.3
Changes in Net Position (Deficit) 1,403,167 (287,671)
Estimated Ending Net Position (Deficit) $ 67,803,533 $ 67,803,533 $ 69,206,700 $ 69,272,627
Footnotes:
(1) Retiree Contributions - Retiree Contributions are greater than expected due to two months' contributions being recorded in Period 1.
*Actuals YTD represents only the additions and deductions that have been recorded as of the reporting period.
214

$'',7,21$/
6&+('8/(6

)XQG $PRXQW )XQG $PRXQW&DSLWDO�3URMHFWV�6HUYLFH�)XQG ������������������������������� *HQHUDO�'HEW�6HUYLFH�)XQG ��������������������������������
,76�&DSLWDO�3URMHFWV ��������������������������������
6XE�7RWDO ������������������������������� 6XE�7RWDO ��������������������������������&ULPH�&RQWURO��3UHY�'LVWU ���������������������������� &&3'�&DSLWDO�3URMHFWV�)XQG ������������������������������
*HQHUDO�'HEW�6HUYLFH�)XQG ������������������������������
*HQHUDO�)XQG ������������������������������
,76�&DSLWDO�3URMHFWV ������������������������������
6ROLG�:DVWH�)XQG ������������������������������
6XE�7RWDO ���������������������������� 6XE�7RWDO �����������������������������&XOWXUH��7RXU�3URM�)LQ�=RQH ������������������������������ 9HQXH�'HEW�6HUYLFH�)XQG �������������������������������
&XOWXUH��7RXULVP�)XQG ����������������������������� &XOWXUH��7RXULVP�&DS�3URMHFWV ������������������������������
&XOWXUH��7RXULVP�'HEW�6HUYLFH �������������������������������
*HQHUDO�'HEW�6HUYLFH�)XQG ������������������������������
,76�&DSLWDO�3URMHFWV ���������������������������������
9HKLFOH�$QG�(TXLS�5HSODFHPHQW �������������������������������
9HQXH�'HEW�6HUYLFH�)XQG �������������������������������
6XE�7RWDO ����������������������������� 6XE�7RWDO ������������������������������&XOWXUH�7RXULVP����&<�+RWHO ����������������������������� &XOWXUH��7RXU�'):�5HY�6K�&DS ������������������������������
&XOWXUH��7RXULVP�'HEW�6HUYLFH ������������������������������
6XE�7RWDO ����������������������������� 6XE�7RWDO ������������������������������'):�5HY�6KDULQJ ����������������������������� &XOWXUH��7RXU�'):�5HY�6K�&DS ������������������������������
&XOWXUH��7RXULVP�'HEW�6HUYLFH ������������������������������
6XE�7RWDO ����������������������������� 6XE�7RWDO ������������������������������
(QYLURQPHQWDO�3URWHFWLRQ ������������������������������ *HQHUDO�'HEW�6HUYLFH�)XQG ���������������������������������
*HQHUDO�)XQG ��������������������������������
,76�&DSLWDO�3URMHFWV ��������������������������������
:DWHU��6HZHU�)XQG �������������������������������
6XE�7RWDO ������������������������������ 6XE�7RWDO �������������������������������
)OHHW��(TXLSPHQW��6HUY�)XQG ������������������������������ (6'�&DSLWDO�3URMHFWV �������������������������������
*HQHUDO�'HEW�6HUYLFH�)XQG ��������������������������������
,76�&DSLWDO�3URMHFWV ��������������������������������
6XE�7RWDO ������������������������������ 6XE�7RWDO �������������������������������
):3,'������'RZQWRZQ ������������������������������� *HQHUDO�)XQG ��������������������������������
):3,'������3DUN�*OHQ ������������������������������� *HQHUDO�)XQG ��������������������������������
):3,'������+HULWDJH ������������������������������� *HQHUDO�)XQG ��������������������������������
):3,'������&DPS�%RZLH �������������������������������� *HQHUDO�)XQG ���������������������������������
):3,'�������6WRFN\DUGV �������������������������������� *HQHUDO�)XQG ���������������������������������
):3,'�������&KDSHO�+LOO �������������������������������� *HQHUDO�)XQG ���������������������������������
):3,'�������7ULQLW\�%OXII �������������������������������� *HQHUDO�)XQG ���������������������������������
):3,'�������6XQ�9DOOH\ �������������������������������� *HQHUDO�)XQG ���������������������������������
*HQHUDO�)XQG ���������������������������� %RWDQLF�*DUGHQV�6SHFO�5HY�)XQG ������������������������������
*HQHUDO�&DSLWDO�3URMHFWV �����������������������������
*HQHUDO�'HEW�6HUYLFH�)XQG �������������������������������
,76�&DSLWDO�3URMHFWV ������������������������������
0XQLFLSDO�$LUSRUW�)XQG ��������������������������������
0XQLFLSDO�*ROI�)XQG �������������������������������
9HKLFOH�$QG�(TXLS�5HSODFHPHQW ������������������������������
&XOWXUH��7RXULVP�)XQG ������������������������������
):3,'������'RZQWRZQ �������������������������������
):3,'������3DUN�*OHQQ �������������������������������
):3,'������+HULWDJH �������������������������������
):3,'������&DPS�%RZLH ��������������������������������
6XE�7RWDO ���������������������������� 6XE�7RWDO �����������������������������*URXS�+HDOWK�,QVXUDQFH�)XQG �������������������������������� ,76�&DSLWDO�3URMHFWV ���������������������������������
,QIR�7HFKQRORJ\�6\VWHPV�)XQG ����������������������������� *HQHUDO�'HEW�6HUYLFH�)XQG ��������������������������������
,76�&DSLWDO�3URMHFWV ������������������������������
6XE�7RWDO ����������������������������� 6XE�7RWDO ������������������������������
&,7<�2)�)257�:257+��7(;$6
6&+('8/(�2)�75$16)(56�,1�$1'�75$16)(56�287
2FWREHU���������
75$16)(56�287 75$16)(56�,1
216

)XQG $PRXQW )XQG $PRXQW
&,7<�2)�)257�:257+��7(;$6
6&+('8/(�2)�75$16)(56�,1�$1'�75$16)(56�287
2FWREHU���������
75$16)(56�287 75$16)(56�,1
/DNH�:RUWK�7UXVW�)XQG ���������������������������� *HQHUDO�&DSLWDO�3URMHFWV �����������������������������
0XQLFLSDO�$LUSRUW�)XQG ������������������������������ *HQHUDO�)XQG ��������������������������������
,76�&DSLWDO�3URMHFWV ���������������������������������
0XQLFLSDO�$LUSRUW�&DSLWDO�3URM �������������������������������
6XE�7RWDO ������������������������������ 6XE�7RWDO �������������������������������0XQLFLSDO�*ROI�)XQG ������������������������������� ,76�&DSLWDO�3URMHFWV ��������������������������������
0XQLFLSDO�3DUNLQJ�)XQG ����������������������������� *HQHUDO�'HEW�6HUYLFH�)XQG �������������������������������
,76�&DSLWDO�3URMHFWV ���������������������������������
0XQL�3DUNLQJ�'HEW�6HUYLFH ������������������������������
0XQLFLSDO�3DUNLQJ�&DSLWDO�3URM ��������������������������������
6XE�7RWDO ����������������������������� 6XE�7RWDO ������������������������������5HG�/LJKW�(QIRUFHPHQW�3URJUDP ����������������������������� *HQHUDO�'HEW�6HUYLFH�)XQG ���������������������������������
*HQHUDO�)XQG ������������������������������
,76�&DSLWDO�3URMHFWV ���������������������������������
6XE�7RWDO ����������������������������� 6XE�7RWDO ������������������������������5LVN�)LQDQFLQJ�)XQG �������������������������������� ,76�&DSLWDO�3URMHFWV ���������������������������������
6ROLG�:DVWH�)XQG ����������������������������� *HQHUDO�)XQG ������������������������������
,76�&DSLWDO�3URMHFWV �������������������������������
6ROLG�:DVWH�&DSLWDO�3URMHFWV ������������������������������
6ROLG�:DVWH�'HEW�6HUYLFH �������������������������������
:DWHU��6HZHU�)XQG �������������������������������
6XE�7RWDO ����������������������������� 6XE�7RWDO ������������������������������6SHFLDO�3XUSRVH�)XQG ������������������������������ *HQHUDO�&DSLWDO�3URMHFWV �������������������������������
6WRUPZDWHU�8WLOLW\�)XQG ���������������������������� *HQHUDO�'HEW�6HUYLFH�)XQG ���������������������������������
*HQHUDO�)XQG ������������������������������
,76�&DSLWDO�3URMHFWV ��������������������������������
6WRUPZDWHU�&DSLWDO�3URMHFWV �����������������������������
6WRUPZDWHU�'HEW�6HUYLFH ������������������������������
:DWHU��6HZHU�)XQG �������������������������������
6XE�7RWDO ���������������������������� 6XE�7RWDO �����������������������������
:DWHU��6HZHU�)XQG ��������������������������� %RWDQLF�*DUGHQV�6SHFO�5HY�)XQG ��������������������������������
*HQHUDO�'HEW�6HUYLFH�)XQG ��������������������������������
*HQHUDO�)XQG �����������������������������
6SHFLDOO\�)XQGHG�3URMHFWV�)XQG ������������������������������
:DWHU�&DSLWDO�)XQG ������������������������������
:DWHU�&DSLWDO�3URMHFWV�)XQG ������������������������������
:DWHU�3ULRU�/LHQ�'HEW�6HUYLFH �����������������������������
:DWHU�6XE�/LHQ�'HEW�6HUYLFH ������������������������������
&DSLWDO�3URMHFWV�6HUYLFH�)XQG �������������������������������
6XE�7RWDO ��������������������������� 6XE�7RWDO ����������������������������
7RWDO�7UDQVIHUV�2XW �������������������������� 7RWDO�7UDQVIHUV�,Q ���������������������������
7UDQVIHUV�DUH�WUDQVDFWLRQV�DSSURYHG�E\�WKH�0D\RU�DQG�&LW\�&RXQFLO�WR�PRYH�UHVRXUFHV�EHWZHHQ�)XQGV��DQG�LV�FRQVLGHUHG�2WKHU�)LQDQFLQJ�6RXUFHV�
�8VHV����6RPH�WUDQVIHUV�PD\�LQFOXGH�DQ�XQQDWXUDO�EDODQFH�GXH�WR�WKH�UHWXUQ�RI�H[FHVV�IXQGV�RULJLQDOO\�WUDQVIHUUHG�IRU�D�JUDQW�PDWFK�RU�RWKHU�
SXUSRVHV�
217

Fund Amount Fund AmountAviation Endowment Gas Lease 1,190,055.58$ Specially Funded Projects Fund (1,190,055.58)$
Solid Waste Fund 7,022,957.00 Public Safety Training Facilty (7,022,957.00)
Total Receivable 8,213,012.58$ Total Payable (8,213,012.58)$
Advances are long term interfund loans used to cover anticipated expenditures/expenses until other revenues or funding sources are available to repay the loan.
CITY OF FORT WORTH, TEXAS
SCHEDULE OF ADVANCES TO AND ADVANCES FROM
October 31, 2017
RECEIVABLE FUND PAYABLE FUND
218

Fund Amount Fund Amount
Total Due From -$ Total Due To -$
* No Interfund Receivables or Payables
Interfund Receivables are short term loans, usually for working capital purposes, for intragovernmental items where no goods were sold or services were rendered between funds.
CITY OF FORT WORTH, TEXAS
SCHEDULE OF DUE TO AND DUE FROM
October 31, 2017
RECEIVABLE FUND/DUE FROM PAYABLE FUND/DUE TO
219

18-00101430 PYMT-2017 TRAINING REGISTRATION/OCT&NOV
FORT WORTH CHAPTER OF THE INSTITUTE OF INTERNAL AUDITORS
$5,800.00 10/21/17 - 10/21/17 $5,800.00 OFFICE OF CITY AUDITOR
18-00101400 RFQ - MEACHAM AIRPORT ASPHALT REPAIR BETWEEN 3N AND 4N
C C ZAMORA CONSTRUCTION LLC
$4,592.00 10/19/17 - 10/19/17 $4,592.00 AVIATION
18-00101549 HAUL OFF SERVICES HGRS 22S & 23S ASA $2,997.12 10/26/17 - 10/26/17 $2,997.12 AVIATION
17-00100886 PYMT- MUSIC LICENSE FEE ASCAP $6,535.22 09/14/17 - 10/16/17 $6,535.22 CITY MANAGER
17-00101061 FORT WORTH CONNECTIONS FALL ISSUE-ENG-SPAN TRANSLATION
LOMONACO, GABRIELA EDITH
$992.00 09/26/17 ($96.71) 10/11/17 $895.29 CITY MANAGER
18-00005270 LUNCHEON ON 10/17/17 FOR CM BRIAN BYRD & MICHAEL CRAIN
FORT WORTH CLUB $84.00 10/05/17 - 10/05/17 $84.00 CITY MANAGER
18-00005351 ATTENDING LUNCHEON ON 10/17/17 FOR CM BRIAN BYRD AND MICHAEL CRAIN
FORT WORTH CLUB $84.00 10/07/17 - 10/07/17 $84.00 CITY MANAGER
18-00101388 CS - LOBBY SERVICES BILLY PHENIX GOVERNMENT AFFAIRS
$49,000.00 10/18/17 - 10/18/17 $49,000.00 CITY MANAGER
18-00101502 PYMT - C-27646/ CSC49628-E1 DENTON, NAVARRO, ROCHA, BERNAL, HYDE & ZECH PC
$16,432.88 10/25/17 - 10/27/17 $16,432.88 CITY MANAGER
18-00101527 PYMT - FY 2017-18 - ANNUAL DUES TARRANT REGIONAL TRANSPORTATION COALITION
$30,000.00 10/25/17 - 10/25/17 $30,000.00 CITY MANAGER
17-00096735 CS - REMOVAL & DISPOSAL OF CONTAMINATED MATERIAL
INTERCON ENVIRONMENTAL INC
$50,000.00 11/18/16 $12,500.00 10/20/17 $62,500.00 CODE COMPLIANCE
17-00097766 PETROLEUM STORAGE TANK TESTING
VALLEY TANK TESTING LLC
$20,000.00 02/02/17 ($19,635.00) 10/16/17 $365.00 CODE COMPLIANCE
17-00098112 REMOVAL & BACKFILL OF USTS - FIRE STATION #10 & #30
SWS ENVIRONMENTAL SERVICES INC
$50,000.00 02/23/17 ($11,144.90) 10/10/17 $38,855.10 CODE COMPLIANCE
17-00098444 DISPOSAL OF USED OIL/ANTIFREEZE MIDSTATE ENVIRONMENTAL SERVICES LP
$2,958.15 03/20/17 $4,075.00 10/19/17 $7,033.15 CODE COMPLIANCE
17-00098644 EMETGENCY RESPONSE SERVICES FOR ENVIRONMENTAL HAZARDS
ES&H OF DALLAS LLC $24,999.00 03/29/17 ($12,582.30) 10/12/17 $12,416.70 CODE COMPLIANCE
17-00098729 EMERGENCY RESPONSE SERVICES FOR ENVIRONMENTAL HAZARDS
SWS ENVIRONMENTAL SERVICES INC
$24,999.00 04/05/17 ($9,028.73) 10/12/17 $15,970.27 CODE COMPLIANCE
17-00099858 TRANSPORTATION, DISPOSAL AND PACKAGING OF HAZARDOUS WASTE
VEOLIA ES TECHNICAL SOLUTIONS LLC
$50,000.00 06/29/17 ($32,374.50) 10/23/17 $17,625.50 CODE COMPLIANCE
17-00099865 ENVIRONMENTAL AND ENGINEERING CONSULTING SERVICES
ENERCON $100,000.00 06/29/17 - 10/13/17 $100,000.00 CODE COMPLIANCE
17-00100093 ASBESTOS, MOLD AND INDUSTRIAL HYGIENE CONSULTING SERVICES
INDUSTRIAL HYGIENE & SAFETY TECHNOLOGY INC
$30,000.00 07/18/17 ($11,428.84) 10/19/17 $18,571.16 CODE COMPLIANCE
17-00100640 WASTE RECYCLING & DISPOSAL SERVICES
LRT LIGHTING RESOURCES TEXAS LLC
$10,000.00 08/28/17 ($5,286.97) 10/19/17 $4,713.03 CODE COMPLIANCE
18-00101283 FOR FY18 EMETGENCY RESPONSE SERVICES FOR ENVIRONMENTAL HAZARDS
ES&H OF DALLAS LLC $12,582.30 10/12/17 - 10/12/17 $12,582.30 CODE COMPLIANCE
18-00101285 FOR FY18 EMERGENCY RESPONSE SERVICES FOR ENVIRONMENTAL HAZARDS
SWS ENVIRONMENTAL SERVICES INC
$9,028.73 10/12/17 - 10/12/17 $9,028.73 CODE COMPLIANCE
18-00101323 FOR FY18 PETROLEUM STORAGE TANK TESTING
VALLEY TANK TESTING LLC
$865.00 10/16/17 - 10/16/17 $865.00 CODE COMPLIANCE
18-00101332 FOR FY18 ENV 17-03: SYC - SYCAMORE CREEK BACTERIA MANAGEMENT
ATKINS NORTH AMERICA INC
$99,922.66 10/16/17 - 10/16/17 $99,922.66 CODE COMPLIANCE
18-00101358 COOP - POLICE EQUIPMENT ACCESSORIES AND AMMUNITION
MULTIPLE VENDORS $5,000.00 10/17/17 - 10/17/17 $5,000.00 CODE COMPLIANCE
Delegated Purchasing Authority ReportFor October 2017, Fiscal Period 1
DescriptionPO Number
Vendor Name Starting Amount
PO Date
Change Amount
Chg Date
Total Amount
Department
220

18-00101407 BRICK DISPOSAL D BRANCH 10/17 SILVER CREEK MATERIALS INC
$400.00 10/19/17 - 10/19/17 $400.00 CODE COMPLIANCE
18-00101415 FOR FY 18 ASBESTOS, MOLD AND INDUSTRIAL HYGIENE CONSULTING SERVICES
INDUSTRIAL HYGIENE & SAFETY TECHNOLOGY INC
$81,428.84 10/20/17 - 10/20/17 $81,428.84 CODE COMPLIANCE
18-00101416 FOR FY18 WASTE RECYCLING & DISPOSAL SERVICES
LRT LIGHTING RESOURCES TEXAS LLC
$25,286.97 10/20/17 - 10/20/17 $25,286.97 CODE COMPLIANCE
18-00101533 ACC RADIOS AND REPAIR - FY18 AEROWAVE TECHNOLOGIES INC
$2,990.00 10/26/17 - 10/26/17 $2,990.00 CODE COMPLIANCE
18-00101593 FY18 TRANSPORTATION, DISPOSAL AND PACKAGING OF HAZARDOUS WASTE
VEOLIA ES TECHNICAL SOLUTIONS LLC
$82,374.50 10/30/17 - 10/30/17 $82,374.50 CODE COMPLIANCE
18-00101483 CHARGES FOR CABLE OFFICE CHARTER COMMUNICATIONS HOLDING COMPANY LLC
$300.00 10/24/17 - 10/24/17 $300.00 COMMUNICATIONS AND PUBLIC ENGAGEMENT
18-00101484 CABLE SERVICE FOR JANICE T-B CHARTER COMMUNICATIONS HOLDING COMPANY LLC
$120.00 10/24/17 - 10/24/17 $120.00 COMMUNICATIONS AND PUBLIC ENGAGEMENT
18-00005109 RCAMS ANNUAL SUPPORT PROGRAM
INTERSECT SYSTEMS INC
$2,000.00 10/03/17 - 10/03/17 $2,000.00 CITY SECRETARY
18-00101142 SNACKS FOR COUNCIL ANYTIME SNACKS $225.00 10/05/17 - 10/05/17 $225.00 CITY SECRETARY
18-00101300 CSCO - 43895 - MONTHLY PAGE UPDATES TO THE CITY CODE
AMERICAN LEGAL PUBLISHING CORP
$44,640.00 10/13/17 - 10/13/17 $44,640.00 CITY SECRETARY
18-00101353 CSCO - FOIA MODULE FY18 ANNUAL INVOICE (12 MONTHS OF SERVICE)
WEBQA INC $25,920.00 10/17/17 - 10/17/17 $25,920.00 CITY SECRETARY
18-00005671 BUSINESS CARDS - MELVIN DENNIS JOHN SONS PRESS $17.17 10/26/17 - 10/26/17 $17.17 ECONOMIC AND COMMUNITY DEVELOPMENT
18-00101100 CHAIR FOR MICHAEL HENING ERGOGENESIS WORKPLACE SOLUTIONS LLC
$579.76 10/03/17 $7.01 10/17/17 $586.77 ECONOMIC AND COMMUNITY DEVELOPMENT
18-00101160 SECURITY UNIFORM SHIRTS FY17-18 CEN TEX UNIFORM SALES
$99.54 10/05/17 $67.15 10/05/17 $166.69 ECONOMIC AND COMMUNITY DEVELOPMENT
18-00101328 RECOGNITION AWARD - CHERYL JONES
CROWN TROPHY $55.00 10/16/17 - 10/16/17 $55.00 ECONOMIC AND COMMUNITY DEVELOPMENT
17-00100875 INSTALL TURN DOWN EXHAUST TIPS
LONGHORN HARLEY DAVIDSON BUELL
$1,000.00 09/14/17 ($572.71) 10/16/17 $427.29 EQUIPMENT SERVICES DEPARTMENT
17-00096597 COOP - NEISD - EMS GLOVES SAF T GLOVE INC $50,000.00 11/15/16 $5,000.00 10/16/17 $55,000.00 FIRE
17-00098029 2017 KW2D PROMO ITEMS JOY PROMOTIONS INC $8,084.00 02/20/17 ($15.90) 10/05/17 $8,068.10 FIRE
18-00005549 ADV #039653/110617 WHITE, BRILEY $186.66 10/19/17 - 10/19/17 $186.66 FIRE
18-00005577 ADV# 042370/110617* HANSEN, MATTHEW KEITH
$429.55 10/20/17 - 10/20/17 $429.55 FIRE
18-00101112 PYMT - AFTER THE FACT - FD INFINITY SOUND INSTALL MONITOR/SOFTWARE/SOUND
INFINITY SOUND LTD $3,782.91 10/03/17 - 10/06/17 $3,782.91 FIRE
18-00101123 RFQUOTES - FIRE SAFETY EDUCATION INFLATABLE
BOULDER BLIMP COMPANY
$9,274.00 10/04/17 - 10/04/17 $9,274.00 FIRE
18-00101129 KW2D PROMO DRAWSTRING BACKPACKS
JOY PROMOTIONS INC $2,994.90 10/04/17 - 10/04/17 $2,994.90 FIRE
18-00101135 COOP - SAVVIK - CARBON MONOXIDE MONITOR
AIRSPACE MONITORING SYSTEMS INC
$50,000.00 10/04/17 - 10/04/17 $50,000.00 FIRE
18-00101159 FIREJE18-PARTS WASHER SERVICE SAFETY KLEEN SYSTEMS INC
$1,368.00 10/05/17 - 10/19/17 $1,368.00 FIRE
18-00101236 CACHE CELLULAR DEVICES T MOBILE $933.75 10/10/17 $1,867.50 10/10/17 $2,801.25 FIRE
Delegated Purchasing Authority ReportFor October 2017, Fiscal Period 1
DescriptionPO Number
Vendor Name Starting Amount
PO Date
Change Amount
Chg Date
Total Amount
Department
221

18-00101246 COOP-GSA-CEM PLANNER PREVISTAR INC $3,000.00 10/10/17 - 10/10/17 $3,000.00 FIRE
18-00101336 AFTER THE FACT - LONE STAR INVOICE FOR C RYAN
LONE STAR ITC $23,653.85 10/16/17 - 10/16/17 $23,653.85 FIRE
18-00101463 RFQUOTES - COMMERCIAL POOL SERVICE
CONNOR POOL SERVICE LLC
$50,000.00 10/24/17 - 10/24/17 $50,000.00 FIRE
18-00101556 AIR CONTROLLED STORAGE FOR OLD EOC EQUIPMENT
AIR CONTROLLED STORAGE LTD
$1,584.00 10/27/17 - 10/27/17 $1,584.00 FIRE
18-00101559 RFID RENEWAL 10/1/17-1/31/18 RADIANT RFID LLC $1,874.54 10/27/17 - 10/27/17 $1,874.54 FIRE
18-00101640 COOP - NEISD - EMS GLOVES SAF T GLOVE INC $50,000.00 10/31/17 - 10/31/17 $50,000.00 FIRE
18-00005602 BUSINESS CARDS FOR MELVIN DENNIS
JOHN SONS PRESS $17.17 10/24/17 - 10/24/17 $17.17 HOUSING AND ECONOMIC DEVELOPMENT
18-00005707 JASON DELI JASONS DELI $293.79 10/30/17 - 10/30/17 $293.79 HOUSING AND ECONOMIC DEVELOPMENT
17-00095741 TAILOREDADJFY17 TAILORED ADJUSTMENT SERVICES INC
$3,000.00 10/05/16 ($2,809.98) 10/11/17 $190.02 HUMAN RESOURCES
17-00097218 WELLNESS INCENTIVES ADMIN FEE-RETIREES A
COVER TEK INC $25,000.00 12/22/16 ($3,351.25) 10/18/17 $21,648.75 HUMAN RESOURCES
17-00099421 LEGAL EXPENSE-MEDIATION FOR MEJIA
M BETH KRUGLER JD MS
$2,920.00 05/23/17 ($2,369.99) 10/11/17 $550.01 HUMAN RESOURCES
17-00099453 DWQ-WRITTEN DEPO-MEJIA WRITTEN DEPOSITION SERVICE LLC
$2,900.00 05/24/17 ($1,751.28) 10/11/17 $1,148.72 HUMAN RESOURCES
17-00100887 BILINGUAL TESTING- PD BERLITZ LANGUAGES INC
$200.00 09/15/17 ($50.00) 10/13/17 $150.00 HUMAN RESOURCES
17-00100888 SEPT EMPLOYMENT VERIFICATIONS TALX CORPORATION $850.00 09/15/17 ($67.43) 10/18/17 $782.57 HUMAN RESOURCES
17-00101011 COOP-ORIGAMI RISK MANAGEMENT SOFTWARE
ORIGAMI RISK LLC $68,613.00 09/21/17 $200.00 10/13/17 $68,813.00 HUMAN RESOURCES
18-00005423 OUTSIDE ATTY FEES - GALINDO GALINDO, LUIS A $14,137.01 10/11/17 - 10/11/17 $14,137.01 HUMAN RESOURCES
18-00005425 AAA SERVICES 17-086* AAA INVESTIGATIONS INC
$5,293.35 10/12/17 - 10/12/17 $5,293.35 HUMAN RESOURCES
18-00101095 CLAIMS PAYMENT- ENTERPRISE INVOICE- LEAMON
ENTERPRISE RENT A CAR
$720.68 10/03/17 - 10/03/17 $720.68 HUMAN RESOURCES
18-00101097 CLAIM PAYMENT- PD RENTAL- JONES
ENTERPRISE RENT A CAR
$1,628.07 10/03/17 - 10/03/17 $1,628.07 HUMAN RESOURCES
18-00101098 CLAIM PAYMENT-VEH APPRAISAL-PEREZ
TAILORED ADJUSTMENT SERVICES INC
$101.00 10/03/17 - 10/03/17 $101.00 HUMAN RESOURCES
18-00101108 3PC00770 HEJL ROMANCE SERVICES $85.00 10/03/17 - 10/03/17 $85.00 HUMAN RESOURCES
18-00101139 SAFETY TEAM POSTCARDS JOHN SONS PRESS $347.80 10/04/17 - 10/04/17 $347.80 HUMAN RESOURCES
18-00101170 CLAIMS PAYMENT- VEHICLE RENTAL-LEAMON
ENTERPRISE RENT A CAR
$720.68 10/06/17 - 10/06/17 $720.68 HUMAN RESOURCES
18-00101212 CLAIM PAYMENT- RENTAL INVOICE- LEAMON
ENTERPRISE RENT A CAR
$720.68 10/09/17 - 10/09/17 $720.68 HUMAN RESOURCES
18-00101216 CLAIMS PAYMENT- RENTAL INVOICE-JONES
ENTERPRISE RENT A CAR
$1,628.07 10/09/17 - 10/09/17 $1,628.07 HUMAN RESOURCES
18-00101239 DDC RENEWALS NATIONAL SAFETY COUNCIL
$1,765.00 10/10/17 - 10/10/17 $1,765.00 HUMAN RESOURCES
18-00101242 CLAIMS EXPSENSE-VEH APPRASIAL-ROBINSON
TAILORED ADJUSTMENT SERVICES INC
$98.00 10/10/17 - 10/10/17 $98.00 HUMAN RESOURCES
18-00101252 BILINGUAL TESTING-LIBRARY/TPW BERLITZ LANGUAGES INC
$450.00 10/11/17 - 10/11/17 $450.00 HUMAN RESOURCES
18-00101254 RECUITMENT-WATER AD CLUB ADVERTISING SERVICES
$600.00 10/11/17 - 10/11/17 $600.00 HUMAN RESOURCES
18-00101263 DDC RENEWALS NATIONAL SAFETY COUNCIL
$1,765.00 10/11/17 - 10/11/17 $1,765.00 HUMAN RESOURCES
Delegated Purchasing Authority ReportFor October 2017, Fiscal Period 1
DescriptionPO Number
Vendor Name Starting Amount
PO Date
Change Amount
Chg Date
Total Amount
Department
222

18-00101266 LEGAL EXPENSES - THOMAS THOMAS, D LEE $3,000.00 10/11/17 - 10/11/17 $3,000.00 HUMAN RESOURCES
18-00101269 TAILORED INVOICE -3PC00475 TAILORED ADJUSTMENT SERVICES INC
$3,000.00 10/11/17 - 10/11/17 $3,000.00 HUMAN RESOURCES
18-00101280 CLAIM PAYMENT-COPART CHARGES COPART $1,605.65 10/12/17 - 10/12/17 $1,605.65 HUMAN RESOURCES
18-00101282 ELRD-PROMOTIONAL ITEMS HALO BRANDED SOLUTIONS INC
$936.06 10/12/17 - 10/12/17 $936.06 HUMAN RESOURCES
18-00101325 CLAIMS PAYMENT- TAILORED ADJUSTMENT
TAILORED ADJUSTMENT SERVICES INC
$112.50 10/16/17 - 10/16/17 $112.50 HUMAN RESOURCES
18-00101392 PYMT - LEGAL INVOICES (KENNETH EAST)
FOSTER & EAST $5,359.63 10/18/17 - 10/18/17 $5,359.63 HUMAN RESOURCES
18-00101397 STOLEN CART REPLACEMENT (1PC00669)
YAMAHA MOTOR CORPORATION U S A
$2,000.00 10/19/17 - 10/19/17 $2,000.00 HUMAN RESOURCES
18-00101399 HEALTH FAIR PROUCT INVOICE HALO BRANDED SOLUTIONS INC
$287.48 10/19/17 - 10/19/17 $287.48 HUMAN RESOURCES
18-00101402 TAILORED INVOICE(3PC00475) (REDO)
TAILORED ADJUSTMENT SERVICES INC
$2,999.00 10/19/17 - 10/19/17 $2,999.00 HUMAN RESOURCES
18-00101405 LEGAL EXPENSES - THOMAS (REDO) THOMAS, D LEE $2,999.00 10/19/17 - 10/19/17 $2,999.00 HUMAN RESOURCES
18-00101409 CYBER INSURANCE POLICY HUB INTERNATIONAL TEXAS INC
$99,730.05 10/19/17 - 10/19/17 $99,730.05 HUMAN RESOURCES
18-00101410 REPLACEMENT CART (2) 1PC00669 YAMAHA MOTOR CORPORATION U S A
$2,000.00 10/19/17 - 10/19/17 $2,000.00 HUMAN RESOURCES
18-00101446 FEDEX INVOICE FEDEX OFFICE $11.00 10/23/17 - 10/23/17 $11.00 HUMAN RESOURCES
18-00101448 CLAIMS EXPENSE- TAILORED INVOICE- POUNDS
TAILORED ADJUSTMENT SERVICES INC
$101.00 10/23/17 - 10/23/17 $101.00 HUMAN RESOURCES
18-00101450 CLAIMS EXPENSE-TAILORED INVOICE-ROBINSON
TAILORED ADJUSTMENT SERVICES INC
$105.00 10/23/17 - 10/23/17 $105.00 HUMAN RESOURCES
18-00101451 FURNITURE MOVE STAPLES CONTRACT & COMMERCIAL INC
$1,183.75 10/23/17 - 10/23/17 $1,183.75 HUMAN RESOURCES
18-00101511 FEDEX INVOICE FEDEX OFFICE $11.00 10/25/17 - 10/25/17 $11.00 HUMAN RESOURCES
18-00101519 CLAIMS EXPENSE-TAILORED INVOICE- B. ROBINSON
TAILORED ADJUSTMENT SERVICES INC
$99.00 10/25/17 - 10/25/17 $99.00 HUMAN RESOURCES
18-00101534 BILINGUAL TESTING-LIBRARY/TPW/PD
BERLITZ LANGUAGES INC
$520.00 10/26/17 - 10/26/17 $520.00 HUMAN RESOURCES
18-00101535 TX CIVIL SERVICE UPDATES #49 FY18
TEXAS CIVIL SERVICE $99.00 10/26/17 - 10/26/17 $99.00 HUMAN RESOURCES
18-00101536 RECUITMENT-WATER AD CLUB ADVERTISING SERVICES
$350.00 10/26/17 - 10/26/17 $350.00 HUMAN RESOURCES
18-00101537 BILINGUAL TESTING-CODE BERLITZ LANGUAGES INC
$150.00 10/26/17 - 10/26/17 $150.00 HUMAN RESOURCES
18-00101544 HOLLY PLANT (1PC00658) BLACKMON MOORING COMPANY
$120.00 10/26/17 - 10/26/17 $120.00 HUMAN RESOURCES
18-00101545 BLACMON MOORING -SHAMBLEE LIBRARY
BLACKMON MOORING COMPANY
$1,327.60 10/26/17 - 10/26/17 $1,327.60 HUMAN RESOURCES
18-00101546 LEGAL EXPENSE - DEPOSITION MCMULLEN LAW FIRM
$2,995.00 10/26/17 - 10/26/17 $2,995.00 HUMAN RESOURCES
18-00101566 PYMT - OUTSIDE ATTY FEES - K EAST
THE LAW OFFICE OF KENNETH E EAST
$5,863.63 10/27/17 - 10/27/17 $5,863.63 HUMAN RESOURCES
18-00101592 CLAIM EXPENSE-TAILORED ADJUSTMENT APPRAISAL-HOON
TAILORED ADJUSTMENT SERVICES INC
$102.00 10/30/17 - 10/30/17 $102.00 HUMAN RESOURCES
18-00101598 AT&T-MARTIN CLAIM SETTLEMENT AT&T $1,709.03 10/30/17 - 10/30/17 $1,709.03 HUMAN RESOURCES
Delegated Purchasing Authority ReportFor October 2017, Fiscal Period 1
DescriptionPO Number
Vendor Name Starting Amount
PO Date
Change Amount
Chg Date
Total Amount
Department
223

18-00101614 CLAIMS EXPENSE- VEH. VALUATION-TOBIAS
TAILORED ADJUSTMENT SERVICES INC
$277.00 10/31/17 - 10/31/17 $277.00 HUMAN RESOURCES
18-00101623 CLAIMS EXPENSE- TAILORED ADJ INVOICE-COLE
TAILORED ADJUSTMENT SERVICES INC
$101.00 10/31/17 - 10/31/17 $101.00 HUMAN RESOURCES
18-00101639 FIRST AID CPR/AED 10-10-17 AMERICAN RED CROSS HEALTH & SAFETY SERVICES
$297.00 10/31/17 - 10/31/17 $297.00 HUMAN RESOURCES
18-00101641 ADULT & CHILD FIRST AID/CPR/AED AMERICAN RED CROSS HEALTH & SAFETY SERVICES
$392.00 10/31/17 - 10/31/17 $392.00 HUMAN RESOURCES
17-00101000 COOP-DIR-SPOK PAGERS SPOK INC $50,000.00 09/20/17 - 10/06/17 $50,000.00 INFORMATION TECHNOLOGY SOLUTIONS
18-00101093 XEROX PRINTER SEPTEMBER 2017 XEROX CORPORATION
$649.50 10/03/17 $175.00 10/04/17 $824.50 INFORMATION TECHNOLOGY SOLUTIONS
18-00101101 JANITORIAL SEPTEMBER TELECOM AMERICAN FACILITY SERVICES INC
$1,200.00 10/03/17 ($134.00) 10/13/17 $1,066.00 INFORMATION TECHNOLOGY SOLUTIONS
18-00101102 JANITORIAL SEPTEMBER DDS/CABLE
AMERICAN FACILITY SERVICES INC
$434.00 10/03/17 ($263.44) 10/13/17 $170.56 INFORMATION TECHNOLOGY SOLUTIONS
18-00101103 GRANICUS SEPTEMBER 2017 GRANICUS INC $2,806.13 10/03/17 - 10/03/17 $2,806.13 INFORMATION TECHNOLOGY SOLUTIONS
18-00101119 ITSM#713378 - BATTERY MODULES ANIXTER INC $1,578.00 10/04/17 - 10/04/17 $1,578.00 INFORMATION TECHNOLOGY SOLUTIONS
18-00101134 SOLARWINDS DAMEWARE FOR LIBRARY - ITSM 721206
DLT SOLUTIONS LLC $317.90 10/04/17 - 10/04/17 $317.90 INFORMATION TECHNOLOGY SOLUTIONS
18-00101143 COOP-DIR-ZIX MAIL SHI GOVERNMENT SOLUTIONS INC
$3,575.00 10/05/17 - 10/05/17 $3,575.00 INFORMATION TECHNOLOGY SOLUTIONS
18-00101155 PC'S-IA60404LAP IA36714PC IA37024LAP IA60405LAP IA60402LAP IA60397LAP
SHI GOVERNMENT SOLUTIONS INC
$384.00 10/05/17 - 10/05/17 $384.00 INFORMATION TECHNOLOGY SOLUTIONS
18-00101172 TRITECH 34842-A3 ADD/REMOVE INFORM MODULES
TRITECH SOFTWARE SYSTEMS INC
$7,532.76 10/06/17 - 10/06/17 $7,532.76 INFORMATION TECHNOLOGY SOLUTIONS
18-00101186 COOP-DIR-DATA DOMAIN AND STORAGE HARDWARE /SOFTWARE SUPPORT
EST GROUP LLC $61,671.81 10/06/17 - 10/06/17 $61,671.81 INFORMATION TECHNOLOGY SOLUTIONS
18-00101223 FY18 - FRONTIER CITY LAND LINES- ITS CIRCUITS
FRONTIER COMMUNICATIONS OF TEXAS
$7,500.00 10/10/17 - 10/10/17 $7,500.00 INFORMATION TECHNOLOGY SOLUTIONS
18-00101240 ORION DISPATCH TOW/IMPOUND MANAGER MAINTENANCE
ORION COMMUNICATIONS INC
$27,455.00 10/10/17 - 10/10/17 $27,455.00 INFORMATION TECHNOLOGY SOLUTIONS
18-00101256 LEVEL 3 SEPTEMBER 2017 INVOICES LEVEL 3 COMMUNICATIONS LLC
$35,154.11 10/11/17 - 10/11/17 $35,154.11 INFORMATION TECHNOLOGY SOLUTIONS
18-00101258 ONESOURCE INTERNET FOR ANIMAL CONTROL FY18
ONESOURCE COMMUNICATIONS
$5,100.00 10/11/17 - 10/11/17 $5,100.00 INFORMATION TECHNOLOGY SOLUTIONS
18-00101262 IRON MOUNTAIN AUGUST 2017 IRON MOUNTAIN INFORMATION MANAGEMENT INC
$1,927.00 10/11/17 - 10/11/17 $1,927.00 INFORMATION TECHNOLOGY SOLUTIONS
18-00101301 A8987834: FUJITSU COMPUTER PRODUCTS - FUJITSU SCANSNAP IX500 - DOCUMENT SCANNER + A7116596 3YR WRNTY
GTS TECHNOLOGY SOLUTIONS INC
$617.96 10/13/17 - 10/13/17 $617.96 INFORMATION TECHNOLOGY SOLUTIONS
18-00101322 WATER FOR DDS/CABLE 401 W 2ND ST AUG/SEPT
NESTLE WATERS NORTH AMERICA INC
$38.88 10/16/17 - 10/16/17 $38.88 INFORMATION TECHNOLOGY SOLUTIONS
Delegated Purchasing Authority ReportFor October 2017, Fiscal Period 1
DescriptionPO Number
Vendor Name Starting Amount
PO Date
Change Amount
Chg Date
Total Amount
Department
224

18-00101327 STAPLES DELIVERY FOR 17-98085-55 STAPLES CONTRACT & COMMERCIAL INC
$39.00 10/16/17 - 10/16/17 $39.00 INFORMATION TECHNOLOGY SOLUTIONS
18-00101330 FRONTIER AUGUST 2017 817-431-5639 FRONTIER COMMUNICATIONS OF TEXAS
$91.63 10/16/17 - 10/16/17 $91.63 INFORMATION TECHNOLOGY SOLUTIONS
18-00101367 MERAKI MX64 ADV/ SECURITY LICENSE
PRESIDIO NETWORKED SOLUTIONS GROUP LLC
$2,604.00 10/18/17 - 10/18/17 $2,604.00 INFORMATION TECHNOLOGY SOLUTIONS
18-00101370 BURNETT PLAZA SEPTEMBER 2017 UTILITIES
BURNETT PLAZA LP $1,759.26 10/18/17 - 10/18/17 $1,759.26 INFORMATION TECHNOLOGY SOLUTIONS
18-00101372 SOLARWINDS DAMEWARE FOR LIBRARY - ITSM 721206
DLT SOLUTIONS LLC $317.90 10/18/17 - 10/18/17 $317.90 INFORMATION TECHNOLOGY SOLUTIONS
18-00101434 IRON MOUNTAIN SEPTEMBER 2017 IRON MOUNTAIN INFORMATION MANAGEMENT INC
$2,126.09 10/23/17 - 10/23/17 $2,126.09 INFORMATION TECHNOLOGY SOLUTIONS
18-00101461 PLOTTER REPAIR ON HP T2500 PM61376
ARCHIVE SUPPLIES INC
$300.00 10/24/17 - 10/24/17 $300.00 INFORMATION TECHNOLOGY SOLUTIONS
18-00101498 CASEWARE CLOUD LICENSES CASEWARE INTERNATIONAL INC
$1,753.00 10/25/17 - 10/25/17 $1,753.00 INFORMATION TECHNOLOGY SOLUTIONS
18-00101513 SNAGIT SOFTWARE - FMS36592LAP-ITSM 725518
SHI GOVERNMENT SOLUTIONS INC
$35.00 10/25/17 - 10/25/17 $35.00 INFORMATION TECHNOLOGY SOLUTIONS
18-00101525 IDM ULTRAEDIT NAMED USER FOR ERP
SHI GOVERNMENT SOLUTIONS INC
$1,698.30 10/25/17 - 10/25/17 $1,698.30 INFORMATION TECHNOLOGY SOLUTIONS
18-00101606 ITSM#728824 ITS / ITSM#729933 - PE - BELINDA NORRIS
NETSYNC NETWORK SOLUTIONS
$798.00 10/31/17 - 10/31/17 $798.00 INFORMATION TECHNOLOGY SOLUTIONS
18-00101152 CSCO-ON-LINE LEGAL RESEARCH LEXISNEXIS $50,000.00 10/05/17 - 10/05/17 $50,000.00 LEGAL DEPARTMENT
18-00101309 PYMT - GHOST PO FOR UT CLE ON P-CARD
UNIVERSITY OF TEXAS AT AUSTIN
$3,300.00 10/13/17 - 10/13/17 $3,300.00 LEGAL DEPARTMENT
18-00101310 PYMT - IMLA DUES AND CLE PO FY2018
INTERNATIONAL MUNICIPAL LAWYERS ASSOCIATION
$6,160.00 10/13/17 - 10/13/17 $6,160.00 LEGAL DEPARTMENT
18-00101311 PYMT - TARRANT CO BAR DUES FY18
TARRANT COUNTY BAR ASSOCIATION
$4,810.00 10/13/17 - 10/13/17 $4,810.00 LEGAL DEPARTMENT
18-00101313 PYMT- STATE BAR DUES FY18 CLERK, SUPREME COURT
$8,695.00 10/13/17 - 10/13/17 $8,695.00 LEGAL DEPARTMENT
18-00101371 2018 WORK COMP MANUAL POST HOC PRESS LLC $272.00 10/18/17 - 10/18/17 $272.00 LEGAL DEPARTMENT
18-00101485 OUTSIDE COUNSEL FEES FOR CONFLICT CHECK
KELLY HART & HALLMAN LLP
$1,000.00 10/24/17 - 10/24/17 $1,000.00 LEGAL DEPARTMENT
18-00101486 OUTSIDE COUNSEL CONFLICT CHECK FOR AUDIT
MOSES PALMER & HOWELL LLP
$300.00 10/24/17 - 10/24/17 $300.00 LEGAL DEPARTMENT
18-00101126 FOR 2018 - YOGA FOR LITTLES YOGEES YOGA 4 KIDS LLC
$1,000.00 10/04/17 - 10/04/17 $1,000.00 LIBRARY
18-00101127 FOR 2018 - ZUMBA AT EMS OLIVER, MANDIE $405.00 10/04/17 - 10/04/17 $405.00 LIBRARY
18-00101128 FOR 2018 - ZUMBA AT ESTR LADYLEMON FITNESS $450.00 10/04/17 - 10/04/17 $450.00 LIBRARY
18-00101137 FOR 2018 - PUBLIC INTERNET USAGE UNIVERSITY OF TEXAS AT AUSTIN
$2,575.26 10/04/17 - 10/04/17 $2,575.26 LIBRARY
18-00101141 FOR 2018 - CEN TEX UNIFORMS - COURIERS
CEN TEX UNIFORM SALES
$1,202.56 10/04/17 - 10/04/17 $1,202.56 LIBRARY
18-00101149 FY 2017 - ENVISIONWARE PROFESSIONAL SERVICES
ENVISIONWARE INC $300.00 10/05/17 - 10/05/17 $300.00 LIBRARY
18-00101209 FOR 2018 - CLIBURN CONCERT - NOVEMBER 2017 - SMITH PIANO SERVICING
SMITH PIANO SERVICING
$150.00 10/09/17 - 10/09/17 $150.00 LIBRARY
Delegated Purchasing Authority ReportFor October 2017, Fiscal Period 1
DescriptionPO Number
Vendor Name Starting Amount
PO Date
Change Amount
Chg Date
Total Amount
Department
225
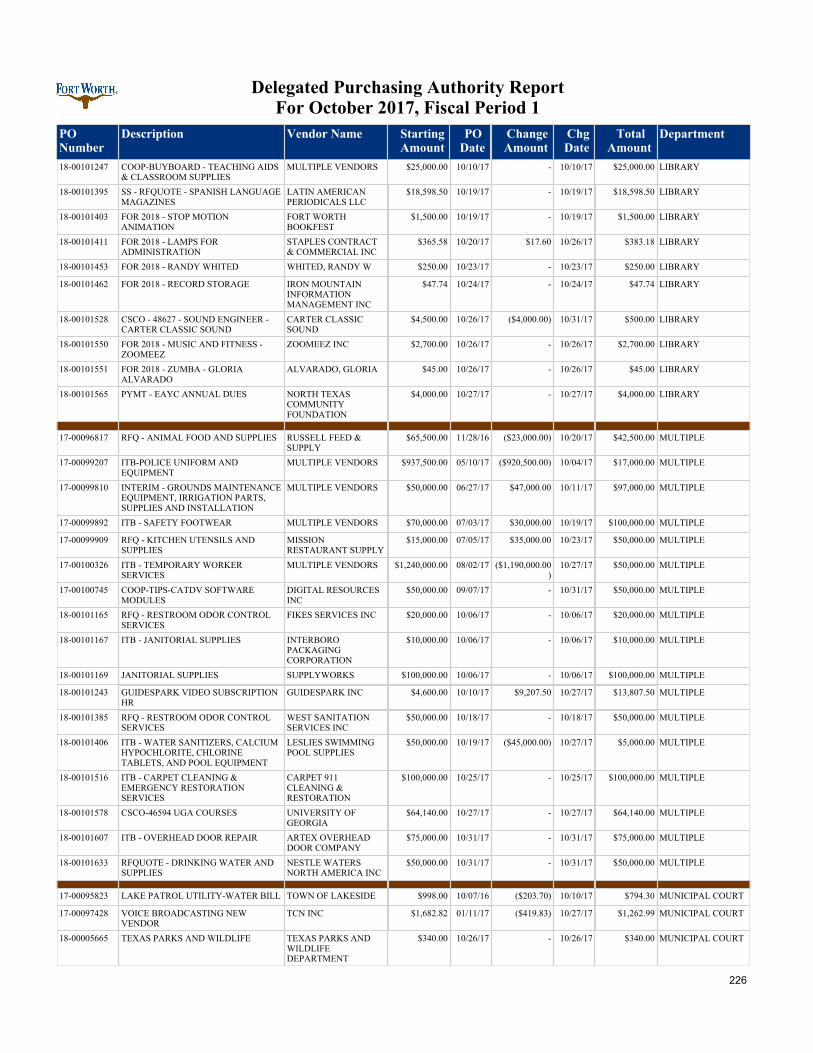
18-00101247 COOP-BUYBOARD - TEACHING AIDS & CLASSROOM SUPPLIES
MULTIPLE VENDORS $25,000.00 10/10/17 - 10/10/17 $25,000.00 LIBRARY
18-00101395 SS - RFQUOTE - SPANISH LANGUAGE MAGAZINES
LATIN AMERICAN PERIODICALS LLC
$18,598.50 10/19/17 - 10/19/17 $18,598.50 LIBRARY
18-00101403 FOR 2018 - STOP MOTION ANIMATION
FORT WORTH BOOKFEST
$1,500.00 10/19/17 - 10/19/17 $1,500.00 LIBRARY
18-00101411 FOR 2018 - LAMPS FOR ADMINISTRATION
STAPLES CONTRACT & COMMERCIAL INC
$365.58 10/20/17 $17.60 10/26/17 $383.18 LIBRARY
18-00101453 FOR 2018 - RANDY WHITED WHITED, RANDY W $250.00 10/23/17 - 10/23/17 $250.00 LIBRARY
18-00101462 FOR 2018 - RECORD STORAGE IRON MOUNTAIN INFORMATION MANAGEMENT INC
$47.74 10/24/17 - 10/24/17 $47.74 LIBRARY
18-00101528 CSCO - 48627 - SOUND ENGINEER - CARTER CLASSIC SOUND
CARTER CLASSIC SOUND
$4,500.00 10/26/17 ($4,000.00) 10/31/17 $500.00 LIBRARY
18-00101550 FOR 2018 - MUSIC AND FITNESS - ZOOMEEZ
ZOOMEEZ INC $2,700.00 10/26/17 - 10/26/17 $2,700.00 LIBRARY
18-00101551 FOR 2018 - ZUMBA - GLORIA ALVARADO
ALVARADO, GLORIA $45.00 10/26/17 - 10/26/17 $45.00 LIBRARY
18-00101565 PYMT - EAYC ANNUAL DUES NORTH TEXAS COMMUNITY FOUNDATION
$4,000.00 10/27/17 - 10/27/17 $4,000.00 LIBRARY
17-00096817 RFQ - ANIMAL FOOD AND SUPPLIES RUSSELL FEED & SUPPLY
$65,500.00 11/28/16 ($23,000.00) 10/20/17 $42,500.00 MULTIPLE
17-00099207 ITB-POLICE UNIFORM AND EQUIPMENT
MULTIPLE VENDORS $937,500.00 05/10/17 ($920,500.00) 10/04/17 $17,000.00 MULTIPLE
17-00099810 INTERIM - GROUNDS MAINTENANCE EQUIPMENT, IRRIGATION PARTS, SUPPLIES AND INSTALLATION
MULTIPLE VENDORS $50,000.00 06/27/17 $47,000.00 10/11/17 $97,000.00 MULTIPLE
17-00099892 ITB - SAFETY FOOTWEAR MULTIPLE VENDORS $70,000.00 07/03/17 $30,000.00 10/19/17 $100,000.00 MULTIPLE
17-00099909 RFQ - KITCHEN UTENSILS AND SUPPLIES
MISSION RESTAURANT SUPPLY
$15,000.00 07/05/17 $35,000.00 10/23/17 $50,000.00 MULTIPLE
17-00100326 ITB - TEMPORARY WORKER SERVICES
MULTIPLE VENDORS $1,240,000.00 08/02/17 ($1,190,000.00)
10/27/17 $50,000.00 MULTIPLE
17-00100745 COOP-TIPS-CATDV SOFTWARE MODULES
DIGITAL RESOURCES INC
$50,000.00 09/07/17 - 10/31/17 $50,000.00 MULTIPLE
18-00101165 RFQ - RESTROOM ODOR CONTROL SERVICES
FIKES SERVICES INC $20,000.00 10/06/17 - 10/06/17 $20,000.00 MULTIPLE
18-00101167 ITB - JANITORIAL SUPPLIES INTERBORO PACKAGING CORPORATION
$10,000.00 10/06/17 - 10/06/17 $10,000.00 MULTIPLE
18-00101169 JANITORIAL SUPPLIES SUPPLYWORKS $100,000.00 10/06/17 - 10/06/17 $100,000.00 MULTIPLE
18-00101243 GUIDESPARK VIDEO SUBSCRIPTION HR
GUIDESPARK INC $4,600.00 10/10/17 $9,207.50 10/27/17 $13,807.50 MULTIPLE
18-00101385 RFQ - RESTROOM ODOR CONTROL SERVICES
WEST SANITATION SERVICES INC
$50,000.00 10/18/17 - 10/18/17 $50,000.00 MULTIPLE
18-00101406 ITB - WATER SANITIZERS, CALCIUM HYPOCHLORITE, CHLORINE TABLETS, AND POOL EQUIPMENT
LESLIES SWIMMING POOL SUPPLIES
$50,000.00 10/19/17 ($45,000.00) 10/27/17 $5,000.00 MULTIPLE
18-00101516 ITB - CARPET CLEANING & EMERGENCY RESTORATION SERVICES
CARPET 911 CLEANING & RESTORATION
$100,000.00 10/25/17 - 10/25/17 $100,000.00 MULTIPLE
18-00101578 CSCO-46594 UGA COURSES UNIVERSITY OF GEORGIA
$64,140.00 10/27/17 - 10/27/17 $64,140.00 MULTIPLE
18-00101607 ITB - OVERHEAD DOOR REPAIR ARTEX OVERHEAD DOOR COMPANY
$75,000.00 10/31/17 - 10/31/17 $75,000.00 MULTIPLE
18-00101633 RFQUOTE - DRINKING WATER AND SUPPLIES
NESTLE WATERS NORTH AMERICA INC
$50,000.00 10/31/17 - 10/31/17 $50,000.00 MULTIPLE
17-00095823 LAKE PATROL UTILITY-WATER BILL TOWN OF LAKESIDE $998.00 10/07/16 ($203.70) 10/10/17 $794.30 MUNICIPAL COURT
17-00097428 VOICE BROADCASTING NEW VENDOR
TCN INC $1,682.82 01/11/17 ($419.83) 10/27/17 $1,262.99 MUNICIPAL COURT
18-00005665 TEXAS PARKS AND WILDLIFE TEXAS PARKS AND WILDLIFE DEPARTMENT
$340.00 10/26/17 - 10/26/17 $340.00 MUNICIPAL COURT
Delegated Purchasing Authority ReportFor October 2017, Fiscal Period 1
DescriptionPO Number
Vendor Name Starting Amount
PO Date
Change Amount
Chg Date
Total Amount
Department
226

18-00101147 INFAX - 2017/2018 ANNUAL SERVICE AGREEMENT RENEWAL
INFAX INC $2,200.00 10/05/17 - 10/05/17 $2,200.00 MUNICIPAL COURT
18-00101198 LAKE PATROL UTILITY-WATER BILL TOWN OF LAKESIDE $998.00 10/09/17 - 10/09/17 $998.00 MUNICIPAL COURT
18-00101350 ANNUAL MAINTENANCE FOR CURENCY COUNTERS FOR FINANCIAL MANAGEMENT
CUMMINS ALLISON CORP
$577.00 10/17/17 - 10/17/17 $577.00 MUNICIPAL COURT
18-00101352 SW-ANNUAL MAINTENANCE AGREEMENT FOR VAULT DOORS
HAMILTON VAULTRONICS LLC
$2,851.00 10/17/17 - 10/17/17 $2,851.00 MUNICIPAL COURT
18-00101358 COOP - POLICE EQUIPMENT ACCESSORIES AND AMMUNITION
MULTIPLE VENDORS $88,500.00 10/17/17 - 10/17/17 $88,500.00 MUNICIPAL COURT
18-00101548 2018 - QUARTERLY MONITORING FIRE STAR ALARM & COMMUNICATIONS INC
$644.00 10/26/17 - 10/26/17 $644.00 MUNICIPAL COURT
18-00101617 T-SHIRTS FOR COURT WEEK 2017 TSHIRTS1 $431.25 10/31/17 - 10/31/17 $431.25 MUNICIPAL COURT
17-00098123 CS-SHAH SOFTWARE LICENSE SHAH SOFTWARE INC $20,130.00 02/24/17 $5,105.00 10/30/17 $25,235.00 NEIGHBORHOOD SERVICES
17-00099758 FIRST CHOICE-N2N ASSISTANCE PROGRAM
FIRST CHOICE POWER LP
$3,000.00 06/21/17 ($2,285.84) 10/12/17 $714.16 NEIGHBORHOOD SERVICES
17-00100318 GEBCO- LEAD SAFE TRAINING GEBCO ASSOCIATES LP
$2,000.00 08/01/17 ($1,400.00) 10/27/17 $600.00 NEIGHBORHOOD SERVICES
17-00100751 PYMT-DENTAL ASSISTANT SCHOOL NATIONAL DENTAL SERVICES NDS DENTAL
$5,847.00 09/07/17 ($112.00) 10/04/17 $5,735.00 NEIGHBORHOOD SERVICES
17-00100779 PYMT-CDL TRUCK DRIVING TRAINING
C1 TRUCK DRIVER TRAINING LLC
$4,595.00 09/08/17 - 10/04/17 $4,595.00 NEIGHBORHOOD SERVICES
17-00101049 NS- POOL TABLE TRANSPORTATION & SUPPLIES (FORT WORTH BILLIARDS)
FORT WORTH BILLIARDS
$1,099.89 09/22/17 - 10/04/17 $1,099.89 NEIGHBORHOOD SERVICES
18-00101148 TRANSPORTATION-HURRICAN HARVEY VICTIMS
FORT WORTH TRANSPORTATION AUTHORITY
$187.50 10/05/17 - 10/05/17 $187.50 NEIGHBORHOOD SERVICES
18-00101161 VETERAN-UAA VETERAN ENERGY LLC
$705.21 10/05/17 - 10/05/17 $705.21 NEIGHBORHOOD SERVICES
18-00101201 TRAINING EVENT SHAH SOFTWARE INC $700.00 10/09/17 - 10/09/17 $700.00 NEIGHBORHOOD SERVICES
18-00101208 CLEANING SERVICES AMERICAN FACILITY SERVICES INC
$500.00 10/09/17 - 10/09/17 $500.00 NEIGHBORHOOD SERVICES
18-00101225 SLATER,BILLY-VETERANS MEB PROPERTIES LLC $800.00 10/10/17 - 10/10/17 $800.00 NEIGHBORHOOD SERVICES
18-00101231 RENTAL ASSISTANCE ADVANTAGE PROPERTY INC
$775.00 10/10/17 - 10/10/17 $775.00 NEIGHBORHOOD SERVICES
18-00101245 FOR 2017 RENTAL ASSISTANCE BRAZOS ON HULEN APARTMENTS
$800.00 10/10/17 - 10/10/17 $800.00 NEIGHBORHOOD SERVICES
18-00101293 VETERAN-UAA VETERAN ENERGY LLC
$2,000.00 10/12/17 - 10/12/17 $2,000.00 NEIGHBORHOOD SERVICES
18-00101295 FY2017 TARRANT COUNTY COLLEGE
$3,000.00 10/12/17 - 10/16/17 $3,000.00 NEIGHBORHOOD SERVICES
18-00101316 MLK-HIP HOP DANCE CLASS PRICE, LASHONDA PAMELA
$525.00 10/13/17 - 10/13/17 $525.00 NEIGHBORHOOD SERVICES
18-00101331 HOWARD,KAY OAKLAND HILLS $685.00 10/16/17 - 10/16/17 $685.00 NEIGHBORHOOD SERVICES
18-00101334 FY17-WARNER, MALLORY SUNRIDGE APARTMENTS
$776.00 10/16/17 - 10/17/17 $776.00 NEIGHBORHOOD SERVICES
18-00101338 FY18-GIBSON,GLENIS ALI, SAFDAR $750.00 10/17/17 - 10/17/17 $750.00 NEIGHBORHOOD SERVICES
18-00101339 FY18- THOMPKINS,DANIELLE PLANTATION WEST APARTMENTS
$1,185.02 10/17/17 - 10/17/17 $1,185.02 NEIGHBORHOOD SERVICES
18-00101341 FY17-COMMO CC BENBROOK STABLES $1,200.00 10/17/17 - 10/17/17 $1,200.00 NEIGHBORHOOD SERVICES
18-00101344 FY18-JACKSON,DARNISHA COOKSCREEK 255 LLC $1,113.71 10/17/17 - 10/17/17 $1,113.71 NEIGHBORHOOD SERVICES
18-00101365 FY17-RENTAL ASSISTANCE BRAZOS ON HULEN $800.00 10/18/17 - 10/18/17 $800.00 NEIGHBORHOOD SERVICES
Delegated Purchasing Authority ReportFor October 2017, Fiscal Period 1
DescriptionPO Number
Vendor Name Starting Amount
PO Date
Change Amount
Chg Date
Total Amount
Department
227

18-00101368 FY18-CAP SCHEDULER ITFRONTDESK INC $2,400.00 10/18/17 - 10/18/17 $2,400.00 NEIGHBORHOOD SERVICES
18-00101390 PYMT - CLOSING COST FOR FIRE STATION #10
RATTIKIN TITLE COMPANY
$3,930.90 10/18/17 - 10/18/17 $3,930.90 NEIGHBORHOOD SERVICES
18-00101468 FY18-WASHINGTON,GLADYS THE SPRINGS APARTMENTS
$765.00 10/24/17 - 10/24/17 $765.00 NEIGHBORHOOD SERVICES
18-00101473 FY17-WASHINGTON,GLADYS THE SPRINGS APARTMENTS
$336.34 10/24/17 - 10/24/17 $336.34 NEIGHBORHOOD SERVICES
18-00101476 FY17-JONES,DANNY FOREST VIEW APARTMENTS
$1,890.00 10/24/17 - 10/24/17 $1,890.00 NEIGHBORHOOD SERVICES
18-00101477 FY18-GODINA,FRANCISCO CARR, DOUGLAS $1,550.00 10/24/17 - 10/24/17 $1,550.00 NEIGHBORHOOD SERVICES
18-00101478 FY17-BORIS,JEANNIE HUNTER CHASE APARTMENTS
$1,429.00 10/24/17 - 10/24/17 $1,429.00 NEIGHBORHOOD SERVICES
18-00101504 FY17-BORIS,JEANNIE TXU ENERGY RETAIL COMPANY LLC
$737.43 10/25/17 - 10/25/17 $737.43 NEIGHBORHOOD SERVICES
18-00101543 STOCKED FISH TANK @ FW READING CELEBRATION
NEAR SOUTHEAST CDC INC
$700.00 10/26/17 - 10/26/17 $700.00 NEIGHBORHOOD SERVICES
18-00101564 CONTRACT AMENDMENT 47288-A1 DAY RESOURCE CENTER FOR THE HOMELESS
$22,372.17 10/27/17 - 10/27/17 $22,372.17 NEIGHBORHOOD SERVICES
18-00101596 #2545 TOWN CENTER MALL LP
$1,736.25 10/30/17 - 10/30/17 $1,736.25 NEIGHBORHOOD SERVICES
18-00101601 CSCO - NORRIS CONF CENTER-COWBOY SANTAS EVENT
NORRIS CONFERENCE CENTERS
$4,660.47 10/30/17 - 10/30/17 $4,660.47 NEIGHBORHOOD SERVICES
18-00101602 RENTAL ASSISTANCE COTTO, EDWIN $550.00 10/30/17 - 10/30/17 $550.00 NEIGHBORHOOD SERVICES
18-00101610 FY18-RENTAL ASSISTANCE PENNSYLVANIA PLACE APARTMENTS
$250.00 10/31/17 - 10/31/17 $250.00 NEIGHBORHOOD SERVICES
17-00095773 LAKE WORTH TRAIL - PHASE 1 HAYDON BUILDING CORP
$51,734.00 10/06/16 $1,287.00 10/19/17 $53,021.00 PARK & RECREATION
17-00096063 FY17 FSCC - CHARTER CABLE CHARTER COMMUNICATIONS HOLDING COMPANY LLC
$177.48 10/18/16 ($118.32) 10/28/17 $59.16 PARK & RECREATION
17-00096681 FY17 HHCC FITNESS EQUIP MAINTENANCE
COMM FIT SERVICE LLC
$580.00 11/17/16 ($290.00) 10/09/17 $290.00 PARK & RECREATION
17-00097422 FY17 CTCC FITNESS EQUIP MAINTENANCE
COMM FIT SERVICE LLC
$1,540.00 01/10/17 ($385.00) 10/28/17 $1,155.00 PARK & RECREATION
17-00098518 CYBERGOLF HOST THE SITE FOR FORT WORTH GOLF ON A SECURE PLATFORM
CYBERGOLF LLC $2,880.00 03/22/17 ($1,440.00) 10/23/17 $1,440.00 PARK & RECREATION
17-00099480 RFQ - SUMMER DAY CAMP T-SHIRTS TSHIRTS1 - 05/25/17 $25,000.00 10/19/17 $25,000.00 PARK & RECREATION
17-00100660 FIRE STATION PARK C02638 FORT WORTH SOUTH INC
$23,000.00 08/29/17 - 10/11/17 $23,000.00 PARK & RECREATION
17-00100879 ARCADIA PARK AIRGAS USA LLC $127.03 09/14/17 $6.90 10/04/17 $133.93 PARK & RECREATION
18-00005548 NET GATE REV SEPT 2017 FWNCR FRIENDS OF THE FORT WORTH NATURE CENTER & REFUGE INC
$59.92 10/19/17 - 10/19/17 $59.92 PARK & RECREATION
18-00101091 SUPPLIES TO REPAIR DOUBLE CHECK VALVE
MACARTHUR GAUGE $225.93 10/03/17 - 10/03/17 $225.93 PARK & RECREATION
18-00101092 FOSTER PARK FORT WORTH MONUMENT INC
$125.00 10/03/17 - 10/03/17 $125.00 PARK & RECREATION
18-00101096 CSCO - FORT WORTH SPARC FORT WORTH SPARC $50,000.00 10/03/17 - 10/13/17 $50,000.00 PARK & RECREATION
18-00101109 PMP CERTIFICATION TRAINING CLASS
PROJECT TRAINING SOLUTIONS
$5,460.00 10/03/17 - 10/03/17 $5,460.00 PARK & RECREATION
18-00101125 ITB - ANNUAL BEDDING PLANTS MULTIPLE VENDORS $79,000.00 10/04/17 - 10/04/17 $79,000.00 PARK & RECREATION
18-00101131 ITB - ROSEDALE PLANTING BED MAINTENANCE
MEAN GREEN $50,000.00 10/04/17 - 10/04/17 $50,000.00 PARK & RECREATION
Delegated Purchasing Authority ReportFor October 2017, Fiscal Period 1
DescriptionPO Number
Vendor Name Starting Amount
PO Date
Change Amount
Chg Date
Total Amount
Department
228

18-00101181 PROJECT MANAGEMENT TRAINING PROJECT TRAINING SOLUTIONS
$5,460.00 10/06/17 - 10/06/17 $5,460.00 PARK & RECREATION
18-00101214 ITB - GRAFITTI ABATEMENT SERVICES
J AND H MOBILE POWERWASHING CO LLC
$90,000.00 10/09/17 - 10/09/17 $90,000.00 PARK & RECREATION
18-00101241 RFQUOTE - DOORHANGERS ADVERTISEMENT
COWTOWN MEDIA $10,000.00 10/10/17 - 10/10/17 $10,000.00 PARK & RECREATION
18-00101244 EPOCH-PV-FY17 EPOCH EYEWEAR $192.00 10/10/17 - 10/10/17 $192.00 PARK & RECREATION
18-00101247 COOP-BUYBOARD - TEACHING AIDS & CLASSROOM SUPPLIES
MULTIPLE VENDORS $22,661.00 10/10/17 - 10/10/17 $22,661.00 PARK & RECREATION
18-00101257 COOP - BUYBOARD - YAMAHA GOLF CARTS PARTS AND NON-WARRANTY LABOR
YAMAHA GOLF CAR COMPANY
$50,000.00 10/11/17 - 10/11/17 $50,000.00 PARK & RECREATION
18-00101303 ROLLING HILLS MACARTHUR GAUGE $422.00 10/13/17 $1,132.10 10/25/17 $1,554.10 PARK & RECREATION
18-00101363 EAGLE MOUNTAIN RANCH PARK PLAYWELL GROUP INC
$1,413.34 10/18/17 - 10/18/17 $1,413.34 PARK & RECREATION
18-00101378 METRO IRRIGATION-HAWS METRO IRRIGATION SUPPLY CO LTD
$346.07 10/18/17 - 10/18/17 $346.07 PARK & RECREATION
18-00101452 CYBERGOLF HOST THE SITE FOR FORT WORTH GOLF ON A SECURE PLATFORM
CYBERGOLF LLC $2,880.00 10/23/17 - 10/23/17 $2,880.00 PARK & RECREATION
18-00101488 RW M&M MANUFACTURING M&M MANUFACTURING LLC
$15.94 10/24/17 - 10/24/17 $15.94 PARK & RECREATION
18-00101492 TT CONSIGNMENT: ARTISTIC SOLUTIONS
ARTISTIC SOLUTIONS INC
$48.60 10/24/17 - 10/24/17 $48.60 PARK & RECREATION
18-00101493 CONSIGNMENT TT ORDER DANCE PARTY
DANCE PARTY STUDIO
$258.20 10/24/17 - 10/24/17 $258.20 PARK & RECREATION
18-00101561 PSC RECOVERY PSC RECOVERY SYSTEMS LLC
$250.00 10/27/17 - 10/27/17 $250.00 PARK & RECREATION
18-00101562 PSC RECOVERY PSC RECOVERY SYSTEMS LLC
$2,750.00 10/27/17 - 10/27/17 $2,750.00 PARK & RECREATION
18-00101599 RFQUOTE - MULCH THE ORGANIC RECYCLER OF TEXAS
$50,000.00 10/30/17 - 10/30/17 $50,000.00 PARK & RECREATION
18-00101608 COOP - BUYBOARD - FOOD SERVICE EQUIPMENT, SUPPLIES AND APPLIANCES
MISSION RESTAURANT SUPPLY
$50,000.00 10/31/17 - 10/31/17 $50,000.00 PARK & RECREATION
17-00096944 PID #12 CHAPEL HILL RTI COMMUNITY MANAGEMENT ASSOCIATES INC
$36,678.00 12/02/16 $6,492.87 10/20/17 $43,170.87 PERFORMANCE BUDGET
18-00101124 MIDWEST BENCHMARKING PARTNERSHIP PROJECT
MANAGEMENT PARTNERS INC
$3,975.00 10/04/17 $3,975.00 10/13/17 $7,950.00 PERFORMANCE BUDGET
18-00101454 CSCO - PROF SERVICES TRAINING NEUROLEADERSHIP
NEUROLEADERSHIP INSTITUTE INC
$45,000.00 10/23/17 - 10/23/17 $45,000.00 PERFORMANCE BUDGET
18-00101512 BIC MESSAGE PENS PROMOTIONAL DESIGNS INC
$1,680.00 10/25/17 - 10/25/17 $1,680.00 PERFORMANCE BUDGET
16-00093534 WATER FOUNTAIN MAINT. HAYDON HORTICULTURE INC
$686.18 05/03/16 ($227.00) 10/16/17 $459.18 PLANNING AND DEVELOPMENT
17-00095804 FEDEX OFFICE SERVICES FEDEX OFFICE $70.75 10/06/16 ($33.96) 10/09/17 $36.79 PLANNING AND DEVELOPMENT
17-00095805 FEDEX OFFICE SERVICES FEDEX OFFICE $33.96 10/06/16 $38.40 10/10/17 $72.36 PLANNING AND DEVELOPMENT
17-00096886 PROF SVCS - PUBLIC ART ROSA LOWINGER & ASSOCIATES
$60,000.00 11/30/16 ($57,930.00) 10/26/17 $2,070.00 PLANNING AND DEVELOPMENT
17-00097785 FINAL DESIGN WESTCREEK DR VOLKAN ALKANOGLU DESIGN LLC
$29,960.00 02/03/17 $22,000.00 10/03/17 $51,960.00 PLANNING AND DEVELOPMENT
17-00100273 REPAIR ZONING EXPORT TOOL GEOGRAPHIC INFORMATION SERVICES INC
$5,000.00 07/31/17 ($2,376.02) 10/23/17 $2,623.98 PLANNING AND DEVELOPMENT
18-00005277 FOR 2017 PLBG DEP REF NORTH TEXAS INSPECTION SERVICES
$19,760.00 10/05/17 - 10/05/17 $19,760.00 PLANNING AND DEVELOPMENT
Delegated Purchasing Authority ReportFor October 2017, Fiscal Period 1
DescriptionPO Number
Vendor Name Starting Amount
PO Date
Change Amount
Chg Date
Total Amount
Department
229

18-00005282 FOR 2017 PLBG DEP REF NORTH TEXAS INSPECTION SERVICES
$15,040.00 10/05/17 - 10/05/17 $15,040.00 PLANNING AND DEVELOPMENT
18-00005343 FOR 2017 PLBG DEP REF BUREAU VERITAS NORTH AMERICA INC
$480.00 10/06/17 - 10/06/17 $480.00 PLANNING AND DEVELOPMENT
18-00005348 FOR 2017 PLBG DEP REF BUREAU VERITAS NORTH AMERICA INC
$1,040.00 10/06/17 - 10/06/17 $1,040.00 PLANNING AND DEVELOPMENT
18-00005349 FOR 2017 PLBG DEP REF BUREAU VERITAS NORTH AMERICA INC
$880.00 10/06/17 - 10/06/17 $880.00 PLANNING AND DEVELOPMENT
18-00005350 FOR 2017 PLBG DEP REF BUREAU VERITAS NORTH AMERICA INC
$640.00 10/06/17 - 10/06/17 $640.00 PLANNING AND DEVELOPMENT
18-00005415 FOR 2018 PLBG DEP REF WINSTON SERVICES INC
$14,278.40 10/11/17 - 10/11/17 $14,278.40 PLANNING AND DEVELOPMENT
18-00005464 FOR 2018 PLBG DEP REF BUREAU VERITAS NORTH AMERICA INC
$720.00 10/13/17 ($480.00) 10/31/17 $240.00 PLANNING AND DEVELOPMENT
18-00005572 FOR 2018 PLBG DEP REF METRO CODE ANALYSIS LLC
$10,080.00 10/20/17 - 10/20/17 $10,080.00 PLANNING AND DEVELOPMENT
18-00005687 FOR 2018 PLBG DEP REF METRO CODE ANALYSIS LLC
$10,800.00 10/31/17 - 10/31/17 $10,800.00 PLANNING AND DEVELOPMENT
18-00005703 FOR 2018 PARKWAY METER REFUND BYRNE CONSTRUCTION SERVICES
$6,183.24 10/30/17 - 10/30/17 $6,183.24 PLANNING AND DEVELOPMENT
18-00101110 FINAL DESIGN COMMISSION CONTRACT
NONSTOP INC $50,000.00 10/03/17 - 10/03/17 $50,000.00 PLANNING AND DEVELOPMENT
18-00101194 1 ENDORSE WORK MID BACK MESH BACK BIG AND TALL CHAIR WITH INSTALL AND DELIVERY FOR DJ
STAPLES CONTRACT & COMMERCIAL INC
$536.17 10/06/17 - 10/06/17 $536.17 PLANNING AND DEVELOPMENT
18-00101195 3 ENDORSE WORK MID-BACK MESH BACK BIG AND 4 ACCOMMODATE BARIATRIC LL AND DELIVERY
STAPLES CONTRACT & COMMERCIAL INC
$2,973.51 10/06/17 - 10/06/17 $2,973.51 PLANNING AND DEVELOPMENT
18-00101221 RFP-CONSTRUCTION PROJECTS PLAN REVIEW
WEST COAST CODE CONSULTANTS
$30,000.00 10/10/17 - 10/10/17 $30,000.00 PLANNING AND DEVELOPMENT
18-00101227 FEDEX OFFICE SERVICES FEDEX OFFICE $33.96 10/10/17 - 10/10/17 $33.96 PLANNING AND DEVELOPMENT
18-00101235 FEDEX OFFICE SERVICES FOR DESIGN REVIEW
FEDEX OFFICE $49.53 10/10/17 - 10/10/17 $49.53 PLANNING AND DEVELOPMENT
18-00101312 8 MESH BACK & MESH FABRIC SEAT, QUOTE#5609376
STAPLES CONTRACT & COMMERCIAL INC
$2,527.80 10/13/17 - 10/13/17 $2,527.80 PLANNING AND DEVELOPMENT
18-00101557 PROF SVCS - PUBLIC ART ROSA LOWINGER & ASSOCIATES
$60,000.00 10/27/17 - 10/27/17 $60,000.00 PLANNING AND DEVELOPMENT
18-00101567 TRAVEL EXPENSES - GARY H FOR OCTOBER 2017
TRAINING FOR WINNERS
$741.90 10/27/17 - 10/27/17 $741.90 PLANNING AND DEVELOPMENT
18-00005608 REGISTRATION FOR R. SIMMONS SOUTHERN POLICE INSTITUTE
$695.00 10/24/17 - 10/24/17 $695.00 POLICE
18-00101104 CSCO - POLICE - WELLINGTON SQ OCT 2017-SEPT 2018
WELLINGTON SQUARE SHOPPING CENTER
$19,200.00 10/03/17 - 10/03/17 $19,200.00 POLICE
18-00101115 CSCO - 5335 BONNELL 10/01-09/2018 WEST MOUNT MORIAH MISSIONARY BAPTIST CHURCH
$5,400.00 10/03/17 - 10/03/17 $5,400.00 POLICE
18-00101116 CSCO - FY2018 SUNDANCE SQUARE PARKING CENTRAL DIV.
SUNDANCE SQUARE $27,600.00 10/03/17 - 10/03/17 $27,600.00 POLICE
18-00101117 ITB - EAST DISTRICT GROUNDS MAINTENANCE
WHITMORE & SONS INC
$12,288.00 10/04/17 - 10/04/17 $12,288.00 POLICE
18-00101140 POLICE - IAD IA PRO ANNUAL MAINT 10/17-09/18
CI TECHNOLOGIES INC
$2,731.05 10/04/17 - 10/04/17 $2,731.05 POLICE
18-00101153 AUTO POUND - UNIFORM RENTALS G&K SERVICES $3,000.00 10/05/17 - 10/05/17 $3,000.00 POLICE
18-00101154 POLICE FLEET - UNIFORM RENTALS (SPEND DOWN)
G&K SERVICES $3,000.00 10/05/17 - 10/05/17 $3,000.00 POLICE
18-00101193 RADAR REPAIR - RMA# 138216 STALKER RADAR $360.00 10/06/17 - 10/06/17 $360.00 POLICE
18-00101200 CSCO - BEACH BASSWOOD CSC 25809-A3 M&C 28345
BASSWOODBEACH CROSSING LTD
$35,200.00 10/09/17 - 10/09/17 $35,200.00 POLICE
18-00101213 RFQ - MOTORCYCLE DRESS BOOTS TPMA
RED THE UNIFORM TAILOR INC
$20,000.00 10/09/17 - 10/09/17 $20,000.00 POLICE
Delegated Purchasing Authority ReportFor October 2017, Fiscal Period 1
DescriptionPO Number
Vendor Name Starting Amount
PO Date
Change Amount
Chg Date
Total Amount
Department
230
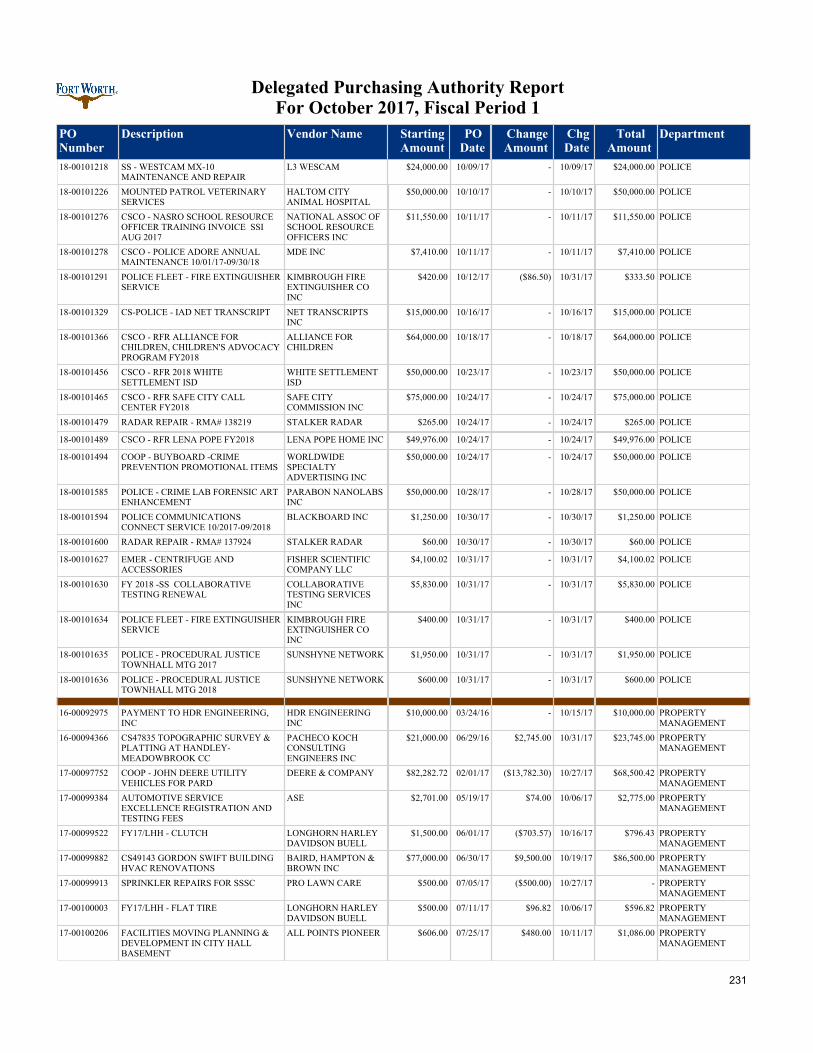
18-00101218 SS - WESTCAM MX-10 MAINTENANCE AND REPAIR
L3 WESCAM $24,000.00 10/09/17 - 10/09/17 $24,000.00 POLICE
18-00101226 MOUNTED PATROL VETERINARY SERVICES
HALTOM CITY ANIMAL HOSPITAL
$50,000.00 10/10/17 - 10/10/17 $50,000.00 POLICE
18-00101276 CSCO - NASRO SCHOOL RESOURCE OFFICER TRAINING INVOICE SSI AUG 2017
NATIONAL ASSOC OF SCHOOL RESOURCE OFFICERS INC
$11,550.00 10/11/17 - 10/11/17 $11,550.00 POLICE
18-00101278 CSCO - POLICE ADORE ANNUAL MAINTENANCE 10/01/17-09/30/18
MDE INC $7,410.00 10/11/17 - 10/11/17 $7,410.00 POLICE
18-00101291 POLICE FLEET - FIRE EXTINGUISHER SERVICE
KIMBROUGH FIRE EXTINGUISHER CO INC
$420.00 10/12/17 ($86.50) 10/31/17 $333.50 POLICE
18-00101329 CS-POLICE - IAD NET TRANSCRIPT NET TRANSCRIPTS INC
$15,000.00 10/16/17 - 10/16/17 $15,000.00 POLICE
18-00101366 CSCO - RFR ALLIANCE FOR CHILDREN, CHILDREN'S ADVOCACY PROGRAM FY2018
ALLIANCE FOR CHILDREN
$64,000.00 10/18/17 - 10/18/17 $64,000.00 POLICE
18-00101456 CSCO - RFR 2018 WHITE SETTLEMENT ISD
WHITE SETTLEMENT ISD
$50,000.00 10/23/17 - 10/23/17 $50,000.00 POLICE
18-00101465 CSCO - RFR SAFE CITY CALL CENTER FY2018
SAFE CITY COMMISSION INC
$75,000.00 10/24/17 - 10/24/17 $75,000.00 POLICE
18-00101479 RADAR REPAIR - RMA# 138219 STALKER RADAR $265.00 10/24/17 - 10/24/17 $265.00 POLICE
18-00101489 CSCO - RFR LENA POPE FY2018 LENA POPE HOME INC $49,976.00 10/24/17 - 10/24/17 $49,976.00 POLICE
18-00101494 COOP - BUYBOARD -CRIME PREVENTION PROMOTIONAL ITEMS
WORLDWIDE SPECIALTY ADVERTISING INC
$50,000.00 10/24/17 - 10/24/17 $50,000.00 POLICE
18-00101585 POLICE - CRIME LAB FORENSIC ART ENHANCEMENT
PARABON NANOLABS INC
$50,000.00 10/28/17 - 10/28/17 $50,000.00 POLICE
18-00101594 POLICE COMMUNICATIONS CONNECT SERVICE 10/2017-09/2018
BLACKBOARD INC $1,250.00 10/30/17 - 10/30/17 $1,250.00 POLICE
18-00101600 RADAR REPAIR - RMA# 137924 STALKER RADAR $60.00 10/30/17 - 10/30/17 $60.00 POLICE
18-00101627 EMER - CENTRIFUGE AND ACCESSORIES
FISHER SCIENTIFIC COMPANY LLC
$4,100.02 10/31/17 - 10/31/17 $4,100.02 POLICE
18-00101630 FY 2018 -SS COLLABORATIVE TESTING RENEWAL
COLLABORATIVE TESTING SERVICES INC
$5,830.00 10/31/17 - 10/31/17 $5,830.00 POLICE
18-00101634 POLICE FLEET - FIRE EXTINGUISHER SERVICE
KIMBROUGH FIRE EXTINGUISHER CO INC
$400.00 10/31/17 - 10/31/17 $400.00 POLICE
18-00101635 POLICE - PROCEDURAL JUSTICE TOWNHALL MTG 2017
SUNSHYNE NETWORK $1,950.00 10/31/17 - 10/31/17 $1,950.00 POLICE
18-00101636 POLICE - PROCEDURAL JUSTICE TOWNHALL MTG 2018
SUNSHYNE NETWORK $600.00 10/31/17 - 10/31/17 $600.00 POLICE
16-00092975 PAYMENT TO HDR ENGINEERING, INC
HDR ENGINEERING INC
$10,000.00 03/24/16 - 10/15/17 $10,000.00 PROPERTY MANAGEMENT
16-00094366 CS47835 TOPOGRAPHIC SURVEY & PLATTING AT HANDLEY-MEADOWBROOK CC
PACHECO KOCH CONSULTING ENGINEERS INC
$21,000.00 06/29/16 $2,745.00 10/31/17 $23,745.00 PROPERTY MANAGEMENT
17-00097752 COOP - JOHN DEERE UTILITY VEHICLES FOR PARD
DEERE & COMPANY $82,282.72 02/01/17 ($13,782.30) 10/27/17 $68,500.42 PROPERTY MANAGEMENT
17-00099384 AUTOMOTIVE SERVICE EXCELLENCE REGISTRATION AND TESTING FEES
ASE $2,701.00 05/19/17 $74.00 10/06/17 $2,775.00 PROPERTY MANAGEMENT
17-00099522 FY17/LHH - CLUTCH LONGHORN HARLEY DAVIDSON BUELL
$1,500.00 06/01/17 ($703.57) 10/16/17 $796.43 PROPERTY MANAGEMENT
17-00099882 CS49143 GORDON SWIFT BUILDING HVAC RENOVATIONS
BAIRD, HAMPTON & BROWN INC
$77,000.00 06/30/17 $9,500.00 10/19/17 $86,500.00 PROPERTY MANAGEMENT
17-00099913 SPRINKLER REPAIRS FOR SSSC PRO LAWN CARE $500.00 07/05/17 ($500.00) 10/27/17 - PROPERTY MANAGEMENT
17-00100003 FY17/LHH - FLAT TIRE LONGHORN HARLEY DAVIDSON BUELL
$500.00 07/11/17 $96.82 10/06/17 $596.82 PROPERTY MANAGEMENT
17-00100206 FACILITIES MOVING PLANNING & DEVELOPMENT IN CITY HALL BASEMENT
ALL POINTS PIONEER $606.00 07/25/17 $480.00 10/11/17 $1,086.00 PROPERTY MANAGEMENT
Delegated Purchasing Authority ReportFor October 2017, Fiscal Period 1
DescriptionPO Number
Vendor Name Starting Amount
PO Date
Change Amount
Chg Date
Total Amount
Department
231

17-00100239 FY17/TM - TRANSOM REPAIRS TRIAD MARINE & INDUSTRIAL SUPPLY INC
$2,900.00 07/27/17 ($536.83) 10/24/17 $2,363.17 PROPERTY MANAGEMENT
17-00100418 FIRE TRUCK A/C RETROFIT FY17/MF METRO FIRE APPARATUS SPECIALISTS INC
$4,800.00 08/10/17 $5,025.76 10/12/17 $9,825.76 PROPERTY MANAGEMENT
17-00100494 CHECK ENGINE LIGHT TENNANT SALES AND SERVICE COMPANY
$2,500.00 08/16/17 ($1,766.35) 10/24/17 $733.65 PROPERTY MANAGEMENT
17-00100661 57000 PM THROTTLE GRIP STICKING
FREEDOM POWERSPORTS FORT WORTH LLC
$1,000.00 08/29/17 $56.30 10/12/17 $1,056.30 PROPERTY MANAGEMENT
17-00100678 KEY FOB DOES NOT WORK AUTOBAHN MOTORCARS
$600.00 08/30/17 ($475.00) 10/17/17 $125.00 PROPERTY MANAGEMENT
17-00100806 COOP - BUYBOARD - 516-16; 12' EQUIPMENT TRAILER
INTERSTATE TRAILERS INC
$7,439.00 09/11/17 - 10/12/17 $7,439.00 PROPERTY MANAGEMENT
17-00100837 FY17/QA - AIR COMPRESSOR QUALITY AIR & LIFT SERVICE
$1,000.00 09/13/17 ($905.00) 10/24/17 $95.00 PROPERTY MANAGEMENT
17-00100963 STATE VIBERATION AT 30 + FRONT HEAT SHIELD
LONGHORN HARLEY DAVIDSON BUELL
$1,000.00 09/19/17 ($374.60) 10/24/17 $625.40 PROPERTY MANAGEMENT
17-00100999 REPLACE WINDSHIELD AUTO GLASS STOP $500.00 09/20/17 ($340.00) 10/17/17 $160.00 PROPERTY MANAGEMENT
17-00101036 LH - GENERAL MAINTENANCE LONGHORN HARLEY DAVIDSON BUELL
$2,000.00 09/22/17 ($1,274.25) 10/24/17 $725.75 PROPERTY MANAGEMENT
18-00005111 PMP TRAINING COURSE MEZA 2017 PROJECT TRAINING SOLUTIONS
$1,365.00 10/03/17 - 10/03/17 $1,365.00 PROPERTY MANAGEMENT
18-00101120 7 BAR STOOLS FOR WATER SVC CTR BLUETARP CREDIT SERVICES
$350.00 10/04/17 - 10/04/17 $350.00 PROPERTY MANAGEMENT
18-00101132 REPAIR TWO WINDSHIELDS AUTO GLASS STOP $600.00 10/04/17 - 10/04/17 $600.00 PROPERTY MANAGEMENT
18-00101136 COOP-BUYBOARD- SEWER JETER TRAILER
CLS SEWER EQUIPMENT CO INC
$63,898.50 10/04/17 - 10/04/17 $63,898.50 PROPERTY MANAGEMENT
18-00101196 CABLES FOR 9100019 BTE BODY COMPANY INC
$385.00 10/06/17 - 10/06/17 $385.00 PROPERTY MANAGEMENT
18-00101222 CS49538 FAR NORTH BRANCH LIBRARY - GOLDEN TRIANGLE
CMJ ENGINEERING INC
$32,160.00 10/10/17 - 10/10/17 $32,160.00 PROPERTY MANAGEMENT
18-00101264 FY18/DK - REPAIR DOG BOX DEERSKIN MFG INC $2,500.00 10/11/17 - 10/11/17 $2,500.00 PROPERTY MANAGEMENT
18-00101271 FY17/AE - AC MACHINE REPAIR AUTOMOTIVE EQUIPMENT SERVICES INC
$1,030.15 10/11/17 - 10/11/17 $1,030.15 PROPERTY MANAGEMENT
18-00101284 HILLWOOD INV HW09192017 FOR BASSCO INV 45949 & 45947
HILLWOOD PROPERTIES
$33,659.00 10/12/17 - 10/12/17 $33,659.00 PROPERTY MANAGEMENT
18-00101288 COOP-BUYBOARD- TORO GM 5900 MOWER
PROFESSIONAL TURF PRODUCTS LP
$93,972.37 10/12/17 - 10/12/17 $93,972.37 PROPERTY MANAGEMENT
18-00101290 COOP-HGAC- 2018 CHEVY 3500 CALDWELL COUNTRY CHEVROLET
$95,520.00 10/12/17 - 10/12/17 $95,520.00 PROPERTY MANAGEMENT
18-00101292 RFQUOTE - EQUIPMENT TRAILER INTERSTATE TRAILERS INC
$31,052.00 10/12/17 - 10/12/17 $31,052.00 PROPERTY MANAGEMENT
18-00101298 LIGHTING SYSTEM & SPREADER STAND - AVIATION
BTE BODY COMPANY INC
$2,851.27 10/12/17 - 10/12/17 $2,851.27 PROPERTY MANAGEMENT
18-00101306 PAYMENT TO NORTH TX CIVIL PROCESS CPN 02272 INV 1697319
NORTH TX CIVIL PROCESS
$51.99 10/13/17 - 10/13/17 $51.99 PROPERTY MANAGEMENT
18-00101317 PYMT - TO R.E.I.S CPN 02304 INV 2017-00850
REAL ESTATE INFORMATION SERVICES INC
$3,470.00 10/13/17 - 10/13/17 $3,470.00 PROPERTY MANAGEMENT
18-00101340 INSPECT LIFTS QUALITY AIR & LIFT SERVICE
$2,500.00 10/17/17 - 10/17/17 $2,500.00 PROPERTY MANAGEMENT
18-00101342 ENGRAVED BRASS PLATE FOR CHILI COOK OFF PLAQUE
TROPHY ARTS INC $12.00 10/17/17 - 10/17/17 $12.00 PROPERTY MANAGEMENT
18-00101381 FY17/MS - AIR COMPRESSOR MARCUSE & SON INC $1,157.45 10/18/17 - 10/18/17 $1,157.45 PROPERTY MANAGEMENT
18-00101387 RFQUOTE - TRASH COLLECTION TRAILERS
NORTH TEXAS TRAILERS LLC
$47,350.88 10/18/17 - 10/25/17 $47,350.88 PROPERTY MANAGEMENT
18-00101394 PYMT - AW APPRAISALS & REVIEW SERVICES CPN 01333I
AW APPRAISALS AND REVIEW SERVICES
$19,200.00 10/18/17 - 10/18/17 $19,200.00 PROPERTY MANAGEMENT
Delegated Purchasing Authority ReportFor October 2017, Fiscal Period 1
DescriptionPO Number
Vendor Name Starting Amount
PO Date
Change Amount
Chg Date
Total Amount
Department
232

18-00101413 FY18/MK - BLUETOOTH MORITZ IMPORTS LTD $100.00 10/20/17 - 10/20/17 $100.00 PROPERTY MANAGEMENT
18-00101424 SI MACHINE 9/1/17-9/30/17 GDI TIMS $953.01 10/20/17 - 10/20/17 $953.01 PROPERTY MANAGEMENT
18-00101435 PYMT - TO ASI CPN DOE 7205 CPN 01690
APPRAISAL SOURCE INC
$6,000.00 10/23/17 - 10/23/17 $6,000.00 PROPERTY MANAGEMENT
18-00101501 FY17/NISSAN - FRONT SUSPENSION FORT WORTH NISSAN $984.24 10/25/17 - 10/25/17 $984.24 PROPERTY MANAGEMENT
18-00101522 SS-AF- FY18/ASCO - BROKEN AXLE ASSOCIATED SUPPLY CO INC
$3,601.44 10/25/17 - 10/25/17 $3,601.44 PROPERTY MANAGEMENT
18-00101573 PYMT - AW APPRAISALS & REVIEW SERVICES CPN 100276
AW APPRAISALS AND REVIEW SERVICES
$12,200.00 10/27/17 ($2,000.00) 10/31/17 $10,200.00 PROPERTY MANAGEMENT
18-00101575 LEWIS LABEL PRODUCTS - LAKE WORTH BOAT RAMP LABELS
LEWIS LABEL PRODUCTS INC
$902.00 10/27/17 - 10/27/17 $902.00 PROPERTY MANAGEMENT
18-00101576 PAYMENT TO D J ETUX LOLA HANKINS P34 TCE CPN 01419 DOE 6845
HANKINS, DAVID $200.00 10/27/17 - 10/27/17 $200.00 PROPERTY MANAGEMENT
18-00101580 PAYMENT TO BLUESTONE NATURAL RESOURCES II LLC P1-4 CPN 02304
BLUESTONE NATURAL RESOURCES II LLC
$1,729.00 10/27/17 - 10/31/17 $1,729.00 PROPERTY MANAGEMENT
18-00101581 PAYMENT TO REMINGTON WESTERN CENTER P18 CPN 02515
REMINGTON WESTERN CENTER LLC
$1,176.00 10/27/17 - 10/27/17 $1,176.00 PROPERTY MANAGEMENT
18-00101615 PAYMENT TO RON AND CAROLYN MENDOLIA CSCO 49821 CPN 02501
MENDOLIA, CAROLYN $25.00 10/31/17 - 10/31/17 $25.00 PROPERTY MANAGEMENT
18-00101616 PAYMENT TO RON AND CAROLYN MENDOLIA CSCO 49821 CPN 02501
MENDOLIA, RONALD J $25.00 10/31/17 - 10/31/17 $25.00 PROPERTY MANAGEMENT
18-00101621 FY18/ASCO - WARNING LIGHTS ASSOCIATED SUPPLY CO INC
$1,000.00 10/31/17 - 10/31/17 $1,000.00 PROPERTY MANAGEMENT
18-00101624 CS49561 BRENNAN DROP-OFF STATION ADDITION
ELEMENTS OF ARCHITECTURE INC
$98,266.00 10/31/17 - 10/31/17 $98,266.00 PROPERTY MANAGEMENT
18-00101625 CS49560 SOUTHEAST DROP-OFF STATION ADDITION
ELEMENTS OF ARCHITECTURE INC
$99,766.00 10/31/17 - 10/31/17 $99,766.00 PROPERTY MANAGEMENT
18-00101626 CS49559 OLD HEMPHILL ROAD DROP-OFF STATION ADDITION
ELEMENTS OF ARCHITECTURE INC
$98,816.00 10/31/17 - 10/31/17 $98,816.00 PROPERTY MANAGEMENT
18-00101631 AUTO GLASS STOP PAST DUE INVOICES
AUTO GLASS STOP $670.00 10/31/17 - 10/31/17 $670.00 PROPERTY MANAGEMENT
17-00097058 WRMC VENT HOODS FACILITEC SOUTHWEST
$2,990.00 12/12/16 ($5.00) 10/03/17 $2,985.00 PUBLIC EVENTS & FACILITIES
17-00097069 METAL BRACKETS FOR MULTIPURPOSE DIRT PAD PANELS
R HERON INC $2,900.00 12/13/16 ($1,299.98) 10/12/17 $1,600.02 PUBLIC EVENTS & FACILITIES
17-00097814 SERVICE CALL FORT WORTH PRODUCTION SERVICES INC
$554.63 02/07/17 ($40.79) 10/12/17 $513.84 PUBLIC EVENTS & FACILITIES
17-00098060 REBUILD SET OF STEPS FOR JUSTIN AREA
R HERON INC $2,500.00 02/22/17 ($350.00) 10/03/17 $2,150.00 PUBLIC EVENTS & FACILITIES
17-00098409 WRMC VENT HOODS FACILITEC SOUTHWEST
$2,990.00 03/15/17 ($2,284.99) 10/12/17 $705.01 PUBLIC EVENTS & FACILITIES
18-00101205 RIGGING CREW OF CEILING TILES IN WEST ARENA
FORT WORTH PRODUCTION SERVICES INC
$597.40 10/09/17 - 10/09/17 $597.40 PUBLIC EVENTS & FACILITIES
18-00101207 FOR FY 2018 - VENT A HOOD CLEANING
FACILITEC SOUTHWEST
$799.31 10/09/17 - 10/09/17 $799.31 PUBLIC EVENTS & FACILITIES
18-00101396 FOR FY 2018 - FIRE EXTINGUISHER INSPECTION
KIMBROUGH FIRE EXTINGUISHER CO INC
$800.00 10/19/17 ($145.50) 10/24/17 $654.50 PUBLIC EVENTS & FACILITIES
18-00101423 CATTLE BARN 2 VENT-A-HOOD FACILITEC SOUTHWEST
$425.00 10/20/17 - 10/20/17 $425.00 PUBLIC EVENTS & FACILITIES
18-00101482 FOR FY 2017 - AUGUST AND SEPTEMBER BEOS
TRINITY F&B SERVICES INC
$682.79 10/24/17 - 10/24/17 $682.79 PUBLIC EVENTS & FACILITIES
18-00101497 FOR FY 2018 - FOOD SERVICE TRINITY F&B SERVICES INC
$2,500.00 10/25/17 - 10/25/17 $2,500.00 PUBLIC EVENTS & FACILITIES
15-00085853 CS45819 GRANT, JOHN G $18,112.00 11/21/14 ($4,012.00) 10/27/17 $14,100.00 TRANSPORTATION & PUBLIC WORKS
Delegated Purchasing Authority ReportFor October 2017, Fiscal Period 1
DescriptionPO Number
Vendor Name Starting Amount
PO Date
Change Amount
Chg Date
Total Amount
Department
233

15-00087893 CS39375 KIMLEY HORN AND ASSOCIATES INC
$64,872.80 04/24/15 ($22,302.58) 10/13/17 $42,570.22 TRANSPORTATION & PUBLIC WORKS
15-00089142 CS46418 KIMLEY HORN AND ASSOCIATES INC
$36,745.00 07/28/15 $11,708.41 10/16/17 $48,453.41 TRANSPORTATION & PUBLIC WORKS
16-00091755 CS33120 CAH STORM DRAIN WATERSHED PLANNING STUDY 52002-020E431-5330500--100091-CAPEXP-2016
FREESE AND NICHOLS INC
$40,287.75 01/08/16 ($28,269.35) 10/17/17 $12,018.40 TRANSPORTATION & PUBLIC WORKS
16-00092680 2016 ANNUAL BRIDGE MAINTENANCE PROGRAM CONTRACT NO. 44340 REF NO. C-27365
FREESE AND NICHOLS INC
$127,399.81 03/02/16 ($28,380.86) 10/27/17 $99,018.95 TRANSPORTATION & PUBLIC WORKS
16-00094049 CS47792 C02670 KIMLEY HORN AND ASSOCIATES INC
$48,345.00 06/08/16 ($106.90) 10/16/17 $48,238.10 TRANSPORTATION & PUBLIC WORKS
16-00094111 CS47372 C02708 KIMLEY HORN AND ASSOCIATES INC
$49,124.00 06/11/16 ($237.50) 10/16/17 $48,886.50 TRANSPORTATION & PUBLIC WORKS
17-00100491 CS 49484 TEXAS HIGHWAY PRODUCTS LTD
$37,500.00 08/15/17 ($12,500.00) 10/03/17 $25,000.00 TRANSPORTATION & PUBLIC WORKS
17-00101046 CS34445-A6 REMAINING AMT FREESE AND NICHOLS INC
$12,138.62 09/22/17 - 10/16/17 $12,138.62 TRANSPORTATION & PUBLIC WORKS
18-00005486 FOR 2017 CFA 2013066 CPN 100516 TPW
ELAN WEST 7TH LP $20,292.58 10/18/17 - 10/18/17 $20,292.58 TRANSPORTATION & PUBLIC WORKS
18-00005490 FOR 2017 CFA 2015107 CPN C02697 TPW
HILLWOOD PROPERTIES
$1,554.00 10/17/17 - 10/17/17 $1,554.00 TRANSPORTATION & PUBLIC WORKS
18-00005500 FOR 2017 CFA 2016004 CPN C02629 TPW
WILBOW MORNINGSTAR DEVELOPMENT CORP
$258.92 10/18/17 - 10/18/17 $258.92 TRANSPORTATION & PUBLIC WORKS
18-00005501 FOR 2017 CFA 2015050 CPN C02566 TPW
LENNAR HOMES OF TEXAS LAND
$580.00 10/17/17 - 10/17/17 $580.00 TRANSPORTATION & PUBLIC WORKS
18-00005504 FOR 2018 CFA 2013075 CPN C02168 TPW
ELAN WEST 7TH LP $6,774.42 10/17/17 - 10/17/17 $6,774.42 TRANSPORTATION & PUBLIC WORKS
18-00005672 EASTERN HILLSLOMAR NATIONAL FLOOD PLAIN INSURANCE PROGRAM
FEDERAL EMERGENCY MANAGEMENT AGENCY
$8,250.00 10/26/17 - 10/26/17 $8,250.00 TRANSPORTATION & PUBLIC WORKS
18-00101094 BAT PREVENTION POWER PEST CORP $2,710.80 10/03/17 $200.80 10/03/17 $2,911.60 TRANSPORTATION & PUBLIC WORKS
18-00101133 GARAGE SWEEPING TSG MISTER SWEEPER LP $5,507.04 10/04/17 - 10/04/17 $5,507.04 TRANSPORTATION & PUBLIC WORKS
18-00101197 SANI SERVICE/AIR FRESHNERS FIKES SERVICES INC $29.40 10/09/17 - 10/09/17 $29.40 TRANSPORTATION & PUBLIC WORKS
18-00101204 CS 49703 KIMLEY HORN AND ASSOCIATES INC
$75,000.00 10/09/17 - 10/09/17 $75,000.00 TRANSPORTATION & PUBLIC WORKS
18-00101267 CS49643 - CPN:100751 CTC INC $95,000.00 10/11/17 - 10/11/17 $95,000.00 TRANSPORTATION & PUBLIC WORKS
18-00101355 PYMT - APWA RENEWAL 2017 AMERICAN PUBLIC WORKS ASSOCIATION
$6,395.00 10/17/17 - 10/17/17 $6,395.00 TRANSPORTATION & PUBLIC WORKS
18-00101629 WELDING RAIL CULVERT IN SAGINAW
WESTERN WELDING INC
$2,520.00 10/31/17 - 10/31/17 $2,520.00 TRANSPORTATION & PUBLIC WORKS
15-00087405 CS28082-A1 RJN GROUP INC $21,071.40 03/23/15 $38,990.61 10/31/17 $60,062.01 WATER DEPARTMENT
17-00095738 CS 47363 RENEWAL 1 JAMES DEOTTE ENGINEERING INC
$100,000.00 10/05/16 ($88,171.70) 10/18/17 $11,828.30 WATER DEPARTMENT
17-00096525 SUNGARD ANNUAL MAINTENANCE 2016-2017
SUNGARD PUBLIC SECTOR INC
$155,070.65 11/09/16 ($147,760.65) 10/05/17 $7,310.00 WATER DEPARTMENT
17-00097187 CS 48204 AS BUILT/ RECORD DRAWING SUPPORT
DANNENBAUM ENGINEERING CORPORATION
$66,571.30 12/20/16 $27,274.80 10/24/17 $93,846.10 WATER DEPARTMENT
17-00098633 JD 3/29/17 MISSION RESTAURANT SUPPLY
$600.00 03/29/17 ($450.00) 10/03/17 $150.00 WATER DEPARTMENT
17-00099687 HG INSTRUMENT REGULATOR AIRGAS USA LLC $408.00 06/15/17 - 10/10/17 $408.00 WATER DEPARTMENT
17-00100041 CS 48886 - MANAGEMENT STRUCTURE ANALYSIS
BRIO CONSULTING LLC
$99,848.00 07/14/17 ($4,642.40) 10/06/17 $95,205.60 WATER DEPARTMENT
Delegated Purchasing Authority ReportFor October 2017, Fiscal Period 1
DescriptionPO Number
Vendor Name Starting Amount
PO Date
Change Amount
Chg Date
Total Amount
Department
234
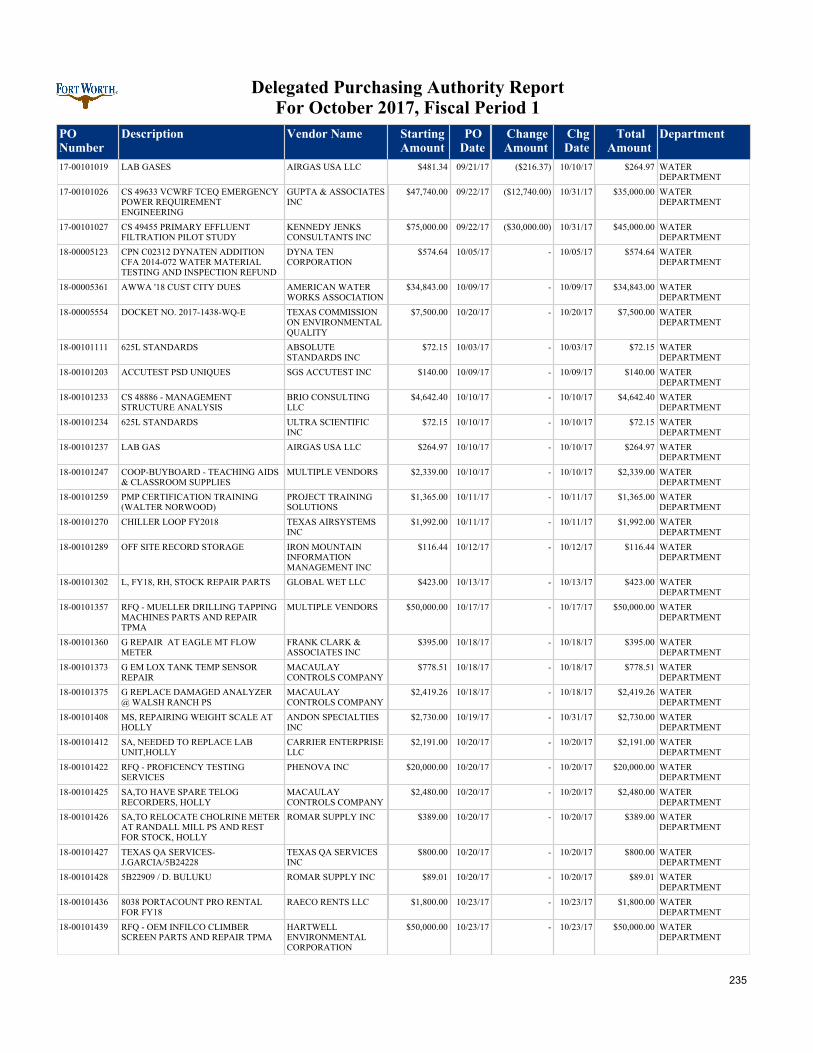
17-00101019 LAB GASES AIRGAS USA LLC $481.34 09/21/17 ($216.37) 10/10/17 $264.97 WATER DEPARTMENT
17-00101026 CS 49633 VCWRF TCEQ EMERGENCY POWER REQUIREMENT ENGINEERING
GUPTA & ASSOCIATES INC
$47,740.00 09/22/17 ($12,740.00) 10/31/17 $35,000.00 WATER DEPARTMENT
17-00101027 CS 49455 PRIMARY EFFLUENT FILTRATION PILOT STUDY
KENNEDY JENKS CONSULTANTS INC
$75,000.00 09/22/17 ($30,000.00) 10/31/17 $45,000.00 WATER DEPARTMENT
18-00005123 CPN C02312 DYNATEN ADDITION CFA 2014-072 WATER MATERIAL TESTING AND INSPECTION REFUND
DYNA TEN CORPORATION
$574.64 10/05/17 - 10/05/17 $574.64 WATER DEPARTMENT
18-00005361 AWWA '18 CUST CITY DUES AMERICAN WATER WORKS ASSOCIATION
$34,843.00 10/09/17 - 10/09/17 $34,843.00 WATER DEPARTMENT
18-00005554 DOCKET NO. 2017-1438-WQ-E TEXAS COMMISSION ON ENVIRONMENTAL QUALITY
$7,500.00 10/20/17 - 10/20/17 $7,500.00 WATER DEPARTMENT
18-00101111 625L STANDARDS ABSOLUTE STANDARDS INC
$72.15 10/03/17 - 10/03/17 $72.15 WATER DEPARTMENT
18-00101203 ACCUTEST PSD UNIQUES SGS ACCUTEST INC $140.00 10/09/17 - 10/09/17 $140.00 WATER DEPARTMENT
18-00101233 CS 48886 - MANAGEMENT STRUCTURE ANALYSIS
BRIO CONSULTING LLC
$4,642.40 10/10/17 - 10/10/17 $4,642.40 WATER DEPARTMENT
18-00101234 625L STANDARDS ULTRA SCIENTIFIC INC
$72.15 10/10/17 - 10/10/17 $72.15 WATER DEPARTMENT
18-00101237 LAB GAS AIRGAS USA LLC $264.97 10/10/17 - 10/10/17 $264.97 WATER DEPARTMENT
18-00101247 COOP-BUYBOARD - TEACHING AIDS & CLASSROOM SUPPLIES
MULTIPLE VENDORS $2,339.00 10/10/17 - 10/10/17 $2,339.00 WATER DEPARTMENT
18-00101259 PMP CERTIFICATION TRAINING (WALTER NORWOOD)
PROJECT TRAINING SOLUTIONS
$1,365.00 10/11/17 - 10/11/17 $1,365.00 WATER DEPARTMENT
18-00101270 CHILLER LOOP FY2018 TEXAS AIRSYSTEMS INC
$1,992.00 10/11/17 - 10/11/17 $1,992.00 WATER DEPARTMENT
18-00101289 OFF SITE RECORD STORAGE IRON MOUNTAIN INFORMATION MANAGEMENT INC
$116.44 10/12/17 - 10/12/17 $116.44 WATER DEPARTMENT
18-00101302 L, FY18, RH, STOCK REPAIR PARTS GLOBAL WET LLC $423.00 10/13/17 - 10/13/17 $423.00 WATER DEPARTMENT
18-00101357 RFQ - MUELLER DRILLING TAPPING MACHINES PARTS AND REPAIR TPMA
MULTIPLE VENDORS $50,000.00 10/17/17 - 10/17/17 $50,000.00 WATER DEPARTMENT
18-00101360 G REPAIR AT EAGLE MT FLOW METER
FRANK CLARK & ASSOCIATES INC
$395.00 10/18/17 - 10/18/17 $395.00 WATER DEPARTMENT
18-00101373 G EM LOX TANK TEMP SENSOR REPAIR
MACAULAY CONTROLS COMPANY
$778.51 10/18/17 - 10/18/17 $778.51 WATER DEPARTMENT
18-00101375 G REPLACE DAMAGED ANALYZER @ WALSH RANCH PS
MACAULAY CONTROLS COMPANY
$2,419.26 10/18/17 - 10/18/17 $2,419.26 WATER DEPARTMENT
18-00101408 MS, REPAIRING WEIGHT SCALE AT HOLLY
ANDON SPECIALTIES INC
$2,730.00 10/19/17 - 10/31/17 $2,730.00 WATER DEPARTMENT
18-00101412 SA, NEEDED TO REPLACE LAB UNIT,HOLLY
CARRIER ENTERPRISE LLC
$2,191.00 10/20/17 - 10/20/17 $2,191.00 WATER DEPARTMENT
18-00101422 RFQ - PROFICENCY TESTING SERVICES
PHENOVA INC $20,000.00 10/20/17 - 10/20/17 $20,000.00 WATER DEPARTMENT
18-00101425 SA,TO HAVE SPARE TELOG RECORDERS, HOLLY
MACAULAY CONTROLS COMPANY
$2,480.00 10/20/17 - 10/20/17 $2,480.00 WATER DEPARTMENT
18-00101426 SA,TO RELOCATE CHOLRINE METER AT RANDALL MILL PS AND REST FOR STOCK, HOLLY
ROMAR SUPPLY INC $389.00 10/20/17 - 10/20/17 $389.00 WATER DEPARTMENT
18-00101427 TEXAS QA SERVICES-J.GARCIA/5B24228
TEXAS QA SERVICES INC
$800.00 10/20/17 - 10/20/17 $800.00 WATER DEPARTMENT
18-00101428 5B22909 / D. BULUKU ROMAR SUPPLY INC $89.01 10/20/17 - 10/20/17 $89.01 WATER DEPARTMENT
18-00101436 8038 PORTACOUNT PRO RENTAL FOR FY18
RAECO RENTS LLC $1,800.00 10/23/17 - 10/23/17 $1,800.00 WATER DEPARTMENT
18-00101439 RFQ - OEM INFILCO CLIMBER SCREEN PARTS AND REPAIR TPMA
HARTWELL ENVIRONMENTAL CORPORATION
$50,000.00 10/23/17 - 10/23/17 $50,000.00 WATER DEPARTMENT
Delegated Purchasing Authority ReportFor October 2017, Fiscal Period 1
DescriptionPO Number
Vendor Name Starting Amount
PO Date
Change Amount
Chg Date
Total Amount
Department
235

18-00101443 WAREHOUSE STOCK / HARTWELL ENVIRONMENTAL
HARTWELL ENVIRONMENTAL CORPORATION
$1,260.00 10/23/17 - 10/23/17 $1,260.00 WATER DEPARTMENT
18-00101480 5B24217 / J. GARCIA PRAXAIR DISTRIBUTION INC
$351.20 10/24/17 - 10/24/17 $351.20 WATER DEPARTMENT
18-00101481 ARCHIVE SUPPLIES 927 TAYLOR ARCHIVE SUPPLIES INC
$364.00 10/24/17 - 10/24/17 $364.00 WATER DEPARTMENT
18-00101491 COOP GSA PREMIERPRO SERVICE FOR IVR SYSTEM
SELECTRON TECHNOLOGIES INC
$50,000.00 10/24/17 - 10/24/17 $50,000.00 WATER DEPARTMENT
18-00101553 CS38180 AMEND #3 LAKE WORTH DREDGE ENGINEERING SERVICES, TRAIL ROUTE AND EMERGENCY PLAN ACTION
FREESE AND NICHOLS INC
$12,319.50 10/27/17 - 10/31/17 $12,319.50 WATER DEPARTMENT
18-00101555 CS 47363 RENEWAL 1 ON-CALL WATER AND WASTEWATER MODELING
JAMES DEOTTE ENGINEERING INC
$88,171.70 10/27/17 - 10/27/17 $88,171.70 WATER DEPARTMENT
18-00101558 G REPAIR FOR DISTRIBUTION MACAULAY CONTROLS COMPANY
$903.11 10/27/17 - 10/27/17 $903.11 WATER DEPARTMENT
18-00101605 COOP - GSA - DISASTER RECOVERY FOUR POINTS TECHNOLOGY LLC
$58,912.32 10/30/17 - 10/30/17 $58,912.32 WATER DEPARTMENT
18-00101619 G RENTAL ON CYLINDERS PRAXAIR DISTRIBUTION INC
$126.00 10/31/17 - 10/31/17 $126.00 WATER DEPARTMENT
Delegated Purchasing Authority ReportFor October 2017, Fiscal Period 1
DescriptionPO Number
Vendor Name Starting Amount
PO Date
Change Amount
Chg Date
Total Amount
Department
236