city of lethbridge gas inventory … · city of lethbridge corporate greenhouse gas inventory...
TRANSCRIPT

City of Lethbridge Corporate Greenhouse Gas Inventory
Project Research Leo Chow
Nicole Gergely Andrew Malcolm
Jordan Vine Craig Wiebe
Project Management Gary Weikum
Department of Geography - Applied Studies
University of Lethbridge May 9, 2011

2

3
City of Lethbridge
Corporate Greenhouse Gas Inventory
Table of Contents
Page
Executive Summary…………………………………………………………………….. 7
PART 1: CONTEXT SECTION 1.0 Purpose of the Greenhouse Gas Inventory………………………………… 9
0.1 Awareness of climate change 0.2 Identification of secondary benefits of reducing GHG 0.3 Base level data 0.4 Corporate strategy 0.5 Knowledge transfer to community programs 0.6 Knowledge transfer to greater community
2.0 Overview of Climate Change………………………………………………… 13
3.0 Causes of Climate Change…………………………………………………... 16
4.0 Sources & Production of Greenhouse Gas………………………………. 21 4.1 Transportation 4.2 Fossil Fuel Industry 4.3 Mining & Manufacturing Industry 4.4 Electric & Heat Generation 4.5 Residential, Commercial & Institutional 4.6 Agriculture 4.7 Waste 4.8 Solvent & Other Product Use
5.0 Consequences of Climate Change…………………………………………. 29
6.0 Secondary Benefits of Greenhouse Gas Reduction…………………….. 31 6.1 Conservation of Fossil Fuels 6.2 Surface Level Smog 6.3 Acid Rain 6.4 Ocean Acidification

4
7.0 Types of Greenhouse Gas and Characteristics…………………………. 34 7.1 Carbon 7.2 Methane 7.3 Nitrous Oxide 7.4 Perfluorocarbons 7.5 Hydrofluorocarbons 7.6 Sulfur hexafluoride
PART 2: RESPONSES TO GREENHOUSE GAS
8.0 Organizational Response to Greenhouse Gas…………………..…… 45 8.1 International 8.2 National 8.3 Provincial 8.4 Local Government
8.4.1 Local Government Benchmarks 8.4.2 Christchurch 8.4.3 Helsinki 8.4.4 Portland 8.4.5 Spokane 8.4.6 Stockholm 8.4.7 Kelowna 8.4.8 Calgary 8.4.9 Halifax 8.4.10 Kamloops 8.4.11 Vancouver
8.5 Barriers to Greenhouse Gas Reduction
PART 3: CITY OF LETHBRIDGE – GREENHOUSE GAS EMISSION ANALYSIS 9.0 Study Methodology……………………………………………………….. 75
9.1 Data Identification and Organization 9.2 Greenhouse Gas Emission Calculation Method
10.0 Sources of Municipal Greenhouse Gas………………………………. 77
10.1 Scope 1: Direct Greenhouse Gas Emissions 10.1.1 Building Space Heating 10.1.2 Building Space Cooling 10.1.3 Vehicle Fleet (excluding Transit) 10.1.4 Transit 10.1.5 Wastewater Treatment 10.1.6 Solid Waste 10.1.7 Firewood 10.1.8 Agricultural Practices

5
10.2 Scope 2: Indirect Greenhouse Gas Emissions From Energy Purchases
10.2.1 Electricity 10.3 Scope 3: Indirect Greenhouse Gas
Emissions – Product and Service Purchases
10.3.1 Equipment, Product and Supply Purchases 10.3.2 Business Travel 10.3.3 Employee Commuting
10.4 Summary of Total Corporate Greenhouse Gas Emissions
PART 4: CONCLUSIONS AND RECOMMENDATIONS 11.0 Comparison to Other Municipal Corporations………………………. 95
12.0 Conclusions……………………………………………………………….. 97 13.0 Recommendations …………………………………………………….…. 98 14.0 References…………………………………………………………….…... 99
Appendix 1: Environment Canada Greenhouse Gas Emission Factors……………………………………………………..…….. 101
Appendix 2: Employee Commute Survey……………………………….… 107

6

7
Executive Summary
Climate is the long-term statistical expression of short-term weather. Climate can be defined as “expected weather”. When changes in the expected weather occur, they are referred to as climate changes and can be defined by the differences between average weather conditions at two separate times. Climate change is a change in multiple factors that make up the earth‟s natural weather such as temperature, precipitation and wind. These changes are impacted by heat absorbing gases known as greenhouse gases. Greenhouse gases reside in the portion of the earth‟s atmosphere that traps a small amount of the energy emitted from the sun, thus allowing life to flourish on earth. However, as human society becomes more sophisticated and technologically advanced, increasing amounts of greenhouse gases are being produced, which becomes trapped in the earth‟s atmosphere causing more heat energy to be retained; a phenomenon known as the „greenhouse effect‟. This increased heat causes the atmospheric temperature to rise, leading to global warming and consequently, climate change. The effects of global warming can greatly impact life on earth. The increase in temperature has led to a reduction in the levels of polar ice, which in turn has led to a rise in ocean levels. Global warming is also responsible for changing weather patterns such as more intense storms and prolonged droughts. The majority of the greenhouse gases released by human activity are made up of carbon dioxide and methane. In addition, humans have created greenhouse gases such as hydrofluorocarbons that do not occur naturally. The United Nations has been a prime initiator of international discussions aimed at reducing greenhouse gas production. Through the United Nations Framework Convention on Climate Change, the Kyoto Protocol was adopted in 1997 and took effect in 2005. Under the Kyoto Protocol, 39 industrialized countries and the European Union have committed to reduce six greenhouse gases (carbon dioxide, methane, nitrous oxide, sulfur hexafluoride, hydrofluorcarbons and perfluorocarbons). A benchmark year of 1990 is used to measure emission reductions. Local governments have become quite active in developing programs to reduce greenhouse gas emissions. The first step in developing a reduction program is to conduct an inventory of greenhouse gas emissions. This study found that the operations of the municipal corporation of the City of Lethbridge created approximately 129,000 tonnes (carbon dioxide equivalent) of greenhouse gas emissions in 2009. The per capita corporate greenhouse gas emissions of the City of Lethbridge are similar to other prairie cities in Canada.

8
Conclusions from this report that are specific to the City of Lethbridge include: Climate change is expected to directly impact Lethbridge with warmer summers, rainstorms that are more intense, and earlier spring thaws. Climate change resulting from greenhouse gas emissions have been recently identified as a policy area in the City of Lethbridge Municipal Development Plan/Integrated Sustainability Plan. In comparison to other Canadian prairie cities, Lethbridge does not produce an unusually high amount of corporate greenhouse gases, however, Canada is the second largest producer of greenhouse gases in the world (per capita), and Alberta is the largest greenhouse gas-producing province in Canada (per capita). The City does not yet have a formal program for tracking greenhouse gas emissions at the corporate or community level. A community greenhouse gas inventory will be relatively easy to conduct as standard methodologies have been developed by organizations such as the Federation of Canadian Municipalities. The largest sources of corporate greenhouse gas emissions within the City of Lethbridge are three municipal landfills.
In view of the information and findings provided in this report, it is recommended that the City: Implement a staff awareness program of greenhouse gas sources and implications of climate change Develop a formal database for tracking greenhouse gas emissions from corporate sources Incorporate the external costs of greenhouse gas emissions into decision-making Develop a formal plan for reducing greenhouse gas emissions Conduct a community greenhouse gas inventory as the first step in developing a community greenhouse gas reduction plan
9
PART 1: CONTEXT SECTION
1.0 Purpose of the Greenhouse Gas Inventory
Various organizations around the world are taking action to reduce greenhouse gas
emissions. In Canada, over 80% of the population resides in urban areas. Local
government therefore, has an opportunity to greatly influence the level of greenhouse
gas emissions. For example, municipal policies directed towards land use,
transportation, waste management, etc., respectively determines driving distances
between urban activities, modes of mobility and the reuse of discarded consumer
goods. However, prior to establishment of public policy aimed at the reduction of
greenhouse gas emissions, there must first be an awareness of the generation of these
gases and the consequences of this generation. The purpose of this report is to provide
the City of Lethbridge with an inventory of the greenhouse gas emissions associated
with the operation of the municipal corporation.
1.1 Awareness of climate change
Climate change is not a new phenomenon for our planet. Rather climate change has
been one of the constants. Over eons, climate change combined with geological forces
has shaped our world, creating the topography in which we live and much of the energy
resources (oil and gas) that fuel our economy. With the retreat of the last continental
ice sheet approximately 10,000 years ago, a relatively stable period of climate change
has occurred, allowing the human species to establish reliable agricultural production
and permanent settlements.
Approximately 250 years ago, humans began a significant and rapid technological
transformation to an industrial economy. The Industrial Revolution set in motion a
complex and inter-related progression of knowledge and production developments. The
positive outcomes are often measured by population growth, gross national product, life
expectancy, etc. However, there are associated negative outcomes that result from our
way of life. Resource depletion, ecological degradation, and social inequities represent
a portion of the „wicked‟ issues that we continue to grapple with as a society. There are
no easy solutions to these issues and the complex interplay of social, economic and
political forces often resist objective and rational approaches.
Human induced climate change, caused by the release of specific gases that
accentuate the greenhouse effect, has become a substantial environmental issue with
significant economic and social implications. With an increasing awareness of climate
changes, controversy over the processes causing it has risen primarily through the

10
media, but not in the scientific world (Weaver, 2008). Work by organizations such as the
Intergovernmental Panel on Climate Change (IPCC) has demonstrated overwhelmingly
that climate change is due to natural forces but climate change is also being
significantly altered by human activities (IPCC, 2007). The effects associated with this
process have included temperature extremes involving droughts, heavy precipitation,
heat waves, an increase in ocean acidity and an overall rise in sea levels.
Figure 1.1: The Greenhouse Effect (Source: State of Victoria, Australia)
1.2 Identification of secondary benefits of reducing GHG
Rising levels of carbon dioxide have been directly linked to climate change, along with 5
other key greenhouse gases. However, climate change is only one of the issues
associated with the six key greenhouse gases. For example, carbon dioxide is also
changing the chemistry of the oceans. Since pre-industrial times (1750), the observed
surface pH of the global ocean is known to have dropped by about 0.1 pH units, which
is equivalent to a 25% increase in acidity (Weaver, 2008). This change in chemistry has
the potential to change the ecological balance of ocean life. As ocean acidity increases,
coral, certain types of phytoplankton and zooplankton are negatively affected. Mollusks
and other sea creatures whose shells are made of calcium carbonate will have softer
shells.
In the 1980‟s, atmospheric release of chemicals, as the result of industrial processes
was identified as the cause of acid rain. International initiatives were launched to

11
reduce acid rain as a result of the devastating effects acid rain has on water bodies.
Human structures such as historic European marble sculptures are also negatively
impacted by acid rain. Similarly, an international effort is now being focused on the
reduction of greenhouse gases for a variety of reasons, with climate change being only
one.
Strategies aimed at reducing greenhouse gases will result in multiple benefits to our
society such as reduction in ocean acidification. Reduction strategies will also aid in the
conservation of non-renewable resources by burning less fossil fuels, burning less
wood, and even the reduction of surface level smog.
1.3 Base level data
The scientific community has created base level data regarding past and present
greenhouse gas trends attributed to human activity at both a global and national level.
In some cases lower levels of government have quantified greenhouse gas production
within their jurisdiction. The means are also available to associate greenhouse gas
production to specific businesses, homes and even individuals. In order for any
organization or individual to develop a strategy to deal with greenhouse gas, one needs
to first understand the amount of greenhouse gas associated with that organization or
individual. This study is an attempt to quantify the greenhouse gas produced by the
operations of the City of Lethbridge as a municipal corporation.
Base level data becomes a benchmark by which future greenhouse gas production can
be measured to determine if future strategies aimed at curbing greenhouse gases are
effective. For the purposes of this study, base level data was attempted for both 1990
and 2009. For obvious reasons, 2009 was chosen as the most recent calendar year for
which a complete data set could be assembled. Data for 1990 was also collected, as it
is a benchmark year used by many international organizations, the most common of
which is the Kyoto Protocol. The year 1990 is significant in that many international and
national policy documents contain strategies aimed at reducing greenhouse gases
relative to 1990 levels. (IPCC, 2007 Assessment)
1.4 Corporate Strategy
It is intended that this study raise the corporate knowledge and awareness of climate
change issues within the City of Lethbridge corporation. Many municipalities in Canada
have adopted corporate strategies to deal with greenhouse gas production. For
example, by 2010 all public service organizations in British Columbia (including
provincial and municipal agencies, school districts, universities, etc) must become

12
carbon neutral (Bill 44, Government of British Columbia). It is hoped that this study will
provide an objective and rational reason for directing efforts to reduce greenhouse
gases within the City of Lethbridge.
The costs of climate change can be measured in economic, social and environmental
terms. Likewise the benefits of limiting greenhouse gas production result in
improvements to economic, social and environmental dimensions of our society. This
study highlights the need to understand that the costs of climate change are distributed
beyond the boundaries of the City of Lethbridge, and that the City is responsible for
incremental greenhouse gas contributions that literally impact human quality of life
around the globe. Likewise the benefits of greenhouse gas reduction should be
measured by more than simply economics, and the spatial benefits need to be
expanded beyond corporate boundaries. Human induced climate change is associated
with more severe weather patterns, rising sea levels, agricultural droughts, etc., that
have potential to stress economies, displace persons and disrupt ecological cycles.
1.5 Knowledge Transfer to Community Programs
Our view of the world is changing. Globalization has resulted in complex economic
inter-relationships and inter-dependencies. Likewise, social systems are adjusting to
exposure to different cultural experiences. We are realizing that the natural
environment that provides the clean air, water and resources that are necessary to
sustain life on the planet have finite stress levels, beyond which the collapse of
ecosystems can spell disaster for humans, both socially and economically.
Understanding the impact of greenhouse gases on climate change, and the impact of
climate change on community wellbeing is the first step in developing effective
strategies. It is hoped that the knowledge provided through this study, from a corporate
perspective, will be a catalyst for the City to review existing community programs. This
in turn hopefully becomes a catalyst that raises community awareness and knowledge
of climate change issues.
1.6 Knowledge Transfer to Greater Community
The development of local climate change strategies is not going to occur without
community leadership. This leadership can emerge from grassroots movements or be
initiated by local government. The more informed that local government is of climate
change and greenhouse gas production, the more likely local government will be able to
take a leadership position. Further, local government will be better prepared to respond
to initiatives from grassroots organizations if they are knowledgeable of climate change
issues.

13
In July 2010, Lethbridge City Council adopted the Municipal Development
Plan/Integrated Community Sustainability Plan (MDP/ICSP). Within this planning
document, the community identified the broad issue of greenhouse gas generation and
the intent to minimize Lethbridge‟s ecological footprint by using resources efficiently.
Section 6.5.2 contains the following policy: “reduce the generation of greenhouse gas
and air pollutants” (City of Lethbridge Municipal Development Plan, 2010). This current
study may be viewed as the first step in implementing the greenhouse gas section of
the MDP/ICSP.
2.0 Overview of Climate Change
Human induced climate change has emerged as one of the significant challenges for
the 21st century. Just as the retreat of the last ice age represented a radical
environmental change that inextricably changed the course of the human race,
anthropogenic induced climate change also has the potential to alter the relationship of
humans to the planet. The evidence of human caused climate change is inarguable by
scientific standards. As has been evidenced in numerous ice core samples dating back
hundreds of thousands of years, there is a correlation between the amount of
greenhouse gases in the atmosphere (specifically carbon dioxide) and the average
temperature of the Earth‟s surface (Petit et al., 1999). See Figure 2.0. Six key gases,
either produced exclusively by humans, or produced by humans at quantities
significantly greater than natural means, are creating a greenhouse effect in the
atmosphere, thereby warming certain areas of the planet and causing climate change.
Carbon dioxide is not the sole source of climate change. The complex interrelationship
of various influences on climate and the lag time associated with these influences is the
reason the relationship of global temperature and carbon dioxide in the atmosphere is
not a precise overlay in Figure 2.0. However, when other factors are accounted for,
anthropogenic produced carbon dioxide is directly related to temperature change.
The Inter-governmental Panel on Climate Change has concluded “Global atmospheric
concentrations of carbon dioxide, methane and nitrous oxide have increased markedly
as a result of human activities since 1750 and now far exceed pre-industrial values
determined from ice cores spanning many thousands of years” (IPCC, 2007).
Greenhouse gas data measurements from ice cores for carbon dioxide, methane and
nitrous oxide are plotted on Figure 2.1. A detectable increase in these three
greenhouse gases has occurred since approximately 1750 and a noticeable spike has
occurred since the 1950‟s. Figure 2.1 also displays the radiative forcing of these gases.

14
Figure 2.0: Global Temperature Change and Carbon Dioxide (Graph retrieved from
www.skepticalscience.com/news, April 22, 2011)
Radiative forcing is the change in net irradiance at the atmospheric boundary between
the troposphere and the stratosphere. Net irradiance is the difference between the
incoming radiation and the outgoing radiation energy in a given climate system, and is
measured in watts per square meter. Greenhouse gases are characterized by their
ability to allow short wave radiation from the sun to pass through to the earth. These
gases trap the long wave radiation that is reflected back off the earth, thereby causing
atmospheric warming. Each of the three graphs in Figure 2.1 provides an indication of
the relative radiative forcing or warming potential of carbon dioxide, methane and
nitrous oxide. There is a pronounced increase in the radiative forcing of each of these
three gases from the base line year of 1750.

15
Figure 2.1: Selected Greenhouse Gases in Atmosphere 10,0000 BCE to 2005 CE Intergovernmental Panel on Climate Change, 2007 Assessment, Cambridge Publishers, Canada 2007

16
Greenhouse gas acts as a warming blanket for the planet. There is a direct relationship
between the amount of greenhouse gases in the atmosphere and the temperature of
the earth. For example, it has been calculated that if there were no atmosphere
surrounding earth, the average surface temperature of the planet would be -19.4C
instead of the 14.4C today (Weaver, 2008). The composition of the atmosphere is a
major factor in the earth‟s energy balance and is responsible for maintaining a relatively
stable temperature. Greenhouse gases allow short wave radiation to reach the earth,
but trap long wave radiation reflected back from the earth, thus regulating the earth‟s
temperature. Increasing greenhouse gases in the atmosphere is analogous to adding
additional blankets, and will cause a new energy equilibrium to be reached, one which
includes a higher average surface temperature.
The majority of world scientists agree that the climate is warming with potentially
disastrous effects for people, economies and the environment. In southern Alberta,
climate change could be experienced in a number of ways. Although it is difficult to
predict exactly what the impacts of climate change will be to Lethbridge, some of the
implications that Lethbridge may expect to face are:
Flooding from increased storm intensity
Disruptions to our water supply during longer drier summers
Increased number and intensity of extreme weather events such a storms in the
winter and summer droughts
New diseases resulting from increased average temperature
Increasing respiratory problems due to increased temperatures and smog effects
Indigenous plants and animals may be challenged for their ecological niches by
foreign species from warmer climates
3.0 Causes of Climate Change
The two main aspects that influence climate change are that of natural variability and
anthropogenic activity. Natural climate change is caused by a number of factors. The
most significant natural influence is the Milankovitch cycle in which the earth‟s tilt on its
axis is altered every 21,000 – 43,000 years, contributing to alternating periods of
warming and cooling. The Milankovitch cycle explains a number of past ice ages.
Other influences include sunspot activity and aerosols produced from volcanic activity.
Figure 3.0 provides an overview of the numerous factors that influence the earth
temperature.

17
Figure 3.0: Radiative Forcing Influences (Graph retrieved from
www.skepticalscience.com/news, April 22, 2011)
In gaining an understanding of the Earth‟s climate, it is important to analyze it from a
long-term perspective. Directly measured records of temperature and climate span just
a small fraction of the Earth‟s climatic history and do not provide an adequate
perspective on climate change today or in the future. By studying climate-dependent
phenomena, some of which are tree rings, ice cores and sea floor sediments, scientists
can obtain a longer perspective on the Earth‟s climate. Using the aforementioned
methods, it has been concluded that throughout the Earth‟s history climate has
fluctuated between periods of relative warmth and periods of relative cold, often
changing from one to the other at a comparatively rapid pace. Science is able to
explain these fluctuations as being not random events, but cause and effect related to
such forces as the tilting of the earth‟s axis, sunspots and volcanoes. It has also
become clearly evident that human production of greenhouse gases are changing the

18
chemical composition of the atmosphere, disrupting natural temperature cycles and
thereby causing climate change.
The four leading factors that have contributed to climate change from an anthropogenic
standpoint have been a growing world population, increasing fossil fuel combustion for
energy, rapid technology growth and intense consumption in developed nations, all of
which have increased markedly since the start of the Industrial Revolution. The
population of the earth has increased from one billion to six billion since 1750. See
Figure 3.1. Energy consumption to support the increased population has been just as
drastic. A significant portion of the energy consumed to support population growth has
come from carbon-based fuels (wood and fossil fuels) that have contributed markedly to
greenhouse gas production. See Figure 3.2.
Our economic structure has allowed immense market growth since the nineteenth
century, particularly in the energy and manufacturing sectors (O‟Brien & Leichenko,
2000). These sectors are largely responsible for the use of fossil fuels. The production
of manufactured goods has lead to significant increases in energy use both in the
manufacturing process and in the use of these products. The automobile provides such
an example, as energy is used during both the production and operation of an
automobile. See Figures 3.3 and 3.4.
Human Population
0
1
2
3
4
5
6
7
1750 1800 1850 1900 1950 2000
Date
Billio
ns
Figure 3.1 Graphic Source: Ponting, Clive; A New Green History of the World, Penquin Books, 2007

19
0500
1000150020002500300035004000
1890 1940 1960 1980 2000
Date
World Oil Production (millions of tonnes)
Figure 3.2 Graphic Source: Ponting, Clive; A New Green History of the World
0
500
1000
1500
2000
1700 1850 1980 2000
Date
World Iron and Steel Production
(millions of tonnes)
Figure 3.3 Graphic Source: Ponting, Clive; A New Green History of the World

20
0
200
400
600
800
1930 1950 1980 2000
Date
World Car Ownership
(millions)
Figure 3.4 Graphic Source: Ponting, Clive; A New Green History of the World In addition, human technology has created greenhouse gases, such as
hydrofluorocarbons (HFC) that do not occur naturally. These man made gases which
are used as refrigerants, have much greater insulating properties than naturally
produced greenhouse gases. For example, HFC-23 has insulating properties almost
12,000 times greater than carbon dioxide.
The burning of fossil fuels for energy and large-scale deforestation, both human
induced, have been the primary causes of higher carbon dioxide concentrations. The
majority of greenhouse gases from fossil fuels is produced through industrial activities
and transportation (IPCC, 2007). The rate of carbon dioxide production is increasing in
developed nations and as developing nations continue to industrialize, the global
amount of carbon dioxide produced is anticipated to increase rapidly (IPCC, 2007).
Many, if not all of these surplus greenhouse gases are the byproducts of human activity,
as there are no known natural factors causing their marked increase in production
(National Academy, 2008). Furthermore, the temperature increase that occurs over land
is much more profound than the increase over oceans, suggesting that inhabited areas
are more susceptible to human influence and therefore will be affected more adversely
(National Academy, 2008). This human activity occurs in both developed and
developing nations, with the worst destruction being imposed by industrial nations such
as China, Russia and the United States (National Academy, 2008). It is apparent that
both past and current human patterns of production, consumption, transportation and

21
waste have had damaging impacts throughout the world as the average world
temperature has increased by nearly one and a half degrees Fahrenheit since the
beginning of the twentieth century (National Academy, 2008).
Historical ice core data shows that atmospheric variations that cause climate change
can trigger internal changes to global systems such as ocean currents; changes which
can last for decades. Similarly, human generated greenhouse gases are also expected
to trigger climate changes that will last decades. However, it is also important to note
that immediate reductions in greenhouse gases will not result in immediate slowing or
reversal of climate change. Rather, the impact of current levels of greenhouse gases
may not be realized for decades into the future, as the earth‟s systems establish a new
equilibrium to the chemical composition of the atmosphere and resultant temperature of
the planet. Polar ice cover provides an enlightening example of the potential
accelerating impacts of climate change.
Polar ice cover is effective at reflecting solar radiation. When polar ice is replaced by
darker ground cover, more solar radiation is absorbed, leading to more rapid
temperature increases, which simply accelerates the melting of polar ice. The
permafrost in northern latitudes contains enormous amounts of methane. Research is
currently underway to determine how this methane, which is trapped in hydrates, can be
exploited, as some estimates suggest there may be more energy in these hydrates than
in existing global oil reserves. However, as the permafrost melts, due to global
warming, the methane is released into the atmosphere, further increasing global
warming.
4.0 Sources & Production of Greenhouse Gas
Greenhouse gases originate from a number of human activities. The operations of
municipal corporations make a relatively small contribution as compared to other
sectors of our economy. Presented below are the potential sources of greenhouse gas
in Canada in order of gross emissions.
4.1 Transportation
Transportation is the largest source of greenhouse gas production due to its prominent
role in our society. The ability to move people and goods is reliant upon several forms of
transport. These forms include automobiles, trucks, buses, aircrafts, trains, boats, and
pipeline devices. The transportation sector consumes significant amounts of fossil fuel.
This fuel consumption has had a particular effect on carbon dioxide production. By
2050, between thirty and fifty percent of carbon dioxide emissions are expected to be
from transportation alone. On average, the United States consumes roughly twenty

22
million barrels of oil daily. A 2005 study found that light vehicles consumed sixty three
percent of transportation energy, with heavy-duty vehicles being responsible for another
seventeen percent.
In Canada, the transportation sector is the largest creator of greenhouse gas emissions,
being responsible for 25% of the sum of all national emissions.
Figure 4.0: Sources of Greenhouse Gas Emissions (Environment Canada, 2010)
4.2 Fossil Fuel Industry
The fossil fuel industry also has a significant role in the production of greenhouse
gases. Coal, petroleum and natural gas are the three core fuels used in Canada. They
are an integral component in transportation, manufacturing, production and numerous
other industries. However, the production processes involved in preparing these fuels
for combustion account for 17% of all greenhouse gas emissions in Canada. It should
therefore not be surprising to learn that Alberta is the greatest producer of greenhouse
gas emissions in Canada. Alberta produces 31.4% of all greenhouse gas emissions in
Canada. (Weaver, 2007)
Coal production is responsible for significant amounts of anthropogenic carbon dioxide
as well as heavy quantities of methane and nitrous oxide. Furthermore, the coal industry
produces huge amounts of toxic waste and other environmental ailments such as
sludge, acid rain and air pollution in the form of small particulate matter.

23
Petroleum is a significant contributor to greenhouse gases, particularly carbon dioxide
through fuel production and use. This fuel holds a significant position in the operation of
the global economy and is considered an economic driver. It is used primarily as an
energy source for automobiles but has also been used in the production of plastics and
asphalt.
Natural gas, the last core fuel, is much less damaging than coal or petroleum but still
has negative impacts due to its methane content. This becomes problematic, as
methane quantities have surged in recent decades, particularly from human activity.
Furthermore, the warming potential of methane is noticeably higher than that of carbon
dioxide. Natural gas is used significantly for the heating of buildings and homes as well
as the generation of electricity.
4.3 Mining & Manufacturing Industry
The mining and manufacturing sectors are also responsible for extensive quantities of
greenhouse gases. In Canada, 18% of greenhouse gas emissions are from mining and
manufacturing. Fossil fuels are burned for energy sources to support mining and
manufacturing. However, chemicals released as part of the manufacturing processes,
and chemicals created for sale, such as refrigerants are also responsible for
greenhouse gas emissions.
4.4 Electric & Heat Generation
Electrical generation is another important component in human civilization and is usually
produced through the combustion of fossil fuels in order to generate steam power. This
process generates billions of tonnes of carbon dioxide every year. Other gases have
been attributed to electrical generation including sulfur dioxide and nitrous oxide,
causing acid rain and air pollution in the form of smog. Heat generation is another
important source of environmental degradation. Natural gas, petroleum and coal are all
used in heat generation and their combustion produces high quantities of carbon
dioxide, methane, sulfur dioxide and other known warming gases.
In Canada, industrial scale production of electricity and heat generation is responsible
for 17% of all greenhouse gas emissions.
4.5 Residential, Commercial & Institutional
The residential sector includes all non-transport emissions from residential settings
(including electricity) and the commercial includes non-transport emissions from office,

24
retail, and other business-related activities. Institutions primarily include the operations
of the public service sectors of the economy, including government, schools and
hospitals, etc. Local government, such as the City of Lethbridge would be included in
this category. The most prominent greenhouse gas found in these three sectors is
carbon dioxide, which is a direct result of the burning of natural gas, fuel oil, and
propane for heating. Although each of these sectors consume fossil fuel for
transportation and electricity for building lighting, the associated emissions have been
calculated with the transportation and electrical generation sectors respectively. In
Canada, the residential, commercial and institutional sectors combine for a total of 11%
of all greenhouse gas emissions.
The amount of greenhouse gas produced from these sectors varies depending upon
geographical location due to the fact that energy use in residential and commercial
buildings varies throughout the world. This reflects differing climatic conditions, building
construction practices, appliance and equipment variability, and overall levels of energy
demand. Residential buildings range from single family, detached dwellings to multi-
family apartment complexes. Energy consumption levels depend on building features
such as insulation levels and the energy-efficiency of windows as well as the number of
energy-using appliances, how these appliances are used, and their energy-efficiency.
Energy use in commercial buildings is also related to features of the building and
appliance and equipment penetration levels.
When you add an estimate of carbon dioxide emissions from household travel,
residential consumption produces over 35% of the carbon dioxide emitted in the United
States. This represents 8% of the world total and still does not include the carbon
dioxide produced by the factories and stores that supply us with products for our
everyday lives. Taken all together it is clear that individuals, in their day to day lives do
in fact have some control over greenhouse gas emissions.
The average US household generates over 45,000 pounds of carbon dioxide each year,
counting both household and transportation uses (assuming a single family home, and
two cars). While most attention has been focused on the cars we drive, household
emissions (electricity, natural gas, etc.) are often at least as much as those given off by
our cars.
4.6 Agriculture
According to a study at Cornell University, global agriculture is responsible for 20% of
global greenhouse gas emissions. In the United States, the national average from

25
agriculture is 8%. Agricultural emissions primarily consist of carbon dioxide, methane
and nitrous oxide.
In Canada, greenhouse gas emissions from agricultural practices account for 7% of all
greenhouse gas emissions (Weaver 2007). Canada‟s lower levels of greenhouse gas
emissions from agriculture are not from superior farming practices, but because we
generate proportionately greater emissions in other sectors of the economy.
Since the 1800s, two major agricultural sources have contributed to the rise in carbon
dioxide, this being the decomposition of soil organic matter and plant biomass burning
associated with the land conversion of native vegetation such as prairies and forests
into agriculture land. Further associated carbon dioxide is emitted from agriculture
through the burning of fossil fuels during the manufacture and operation of farming
equipment, fertilizer, and other agricultural inputs. Agricultural equipment uses fuel for
plowing, planting, applying fertilizer and pesticides, and harvesting crops, as well as for
processing and drying grains.
Emissions of methane from agriculture are linked to bacterial processes in flooded soils
under rice cultivation and from enteric fermentation that occurs in the digestive systems
of ruminant livestock (cattle, sheep, goats, horses). Large-scale livestock operations,
manure management, and landfill emissions are major contributors leading to a higher
concentration of methane in the atmosphere. Through the process of enteric
fermentation and consequent methane emissions, cattle have been identified as a
unique and major source of methane production.
The breakdown of carbohydrates in the digestive track of herbivores (including insects
and humans) results in the production of methane. The volume of methane produced
from this process (enteric fermentation) is largest in those animals that possess a
rumen, or forestomach, such as cattle, sheep, and goats (Jaques, 1997; US Energy
Information Administration, 1997). Microorganisms in the rumen, some of which are
methanogenic bacteria, accomplish digestion. Therefore methane is produced by the
methanogenic bacteria and released through normal animal respiration and eructation.
The level of methane emissions from enteric fermentation in domesticated animals is a
function of several variables, including quantity and quality of feed intake, the growth
rate of the animals, their productivity (reproduction and/or lactation), and their mobility.
Emissions factors per animal have been developed from these variables. These
emission factors are used to determine the methane production of domestic animals,
based on kg of methane per head per year (Jaques, 1997; B.H. Levelton & Associates
Ltd., 1992). Methane emissions also occur during decomposition of animal manure in
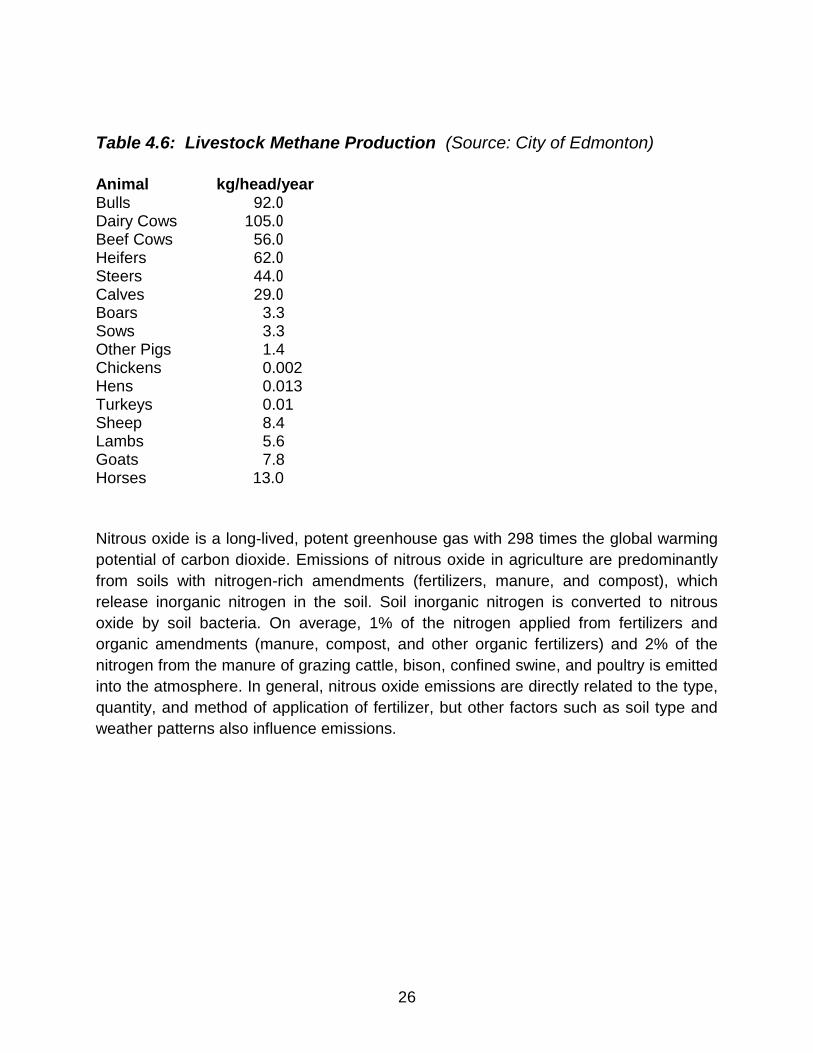
uncovered lagoons and from crop residues under very wet field conditions. Table 4.6
provides an overview of the methane produced by selected livestock.
26
Table 4.6: Livestock Methane Production (Source: City of Edmonton)
Animal kg/head/year Bulls 92.0 Dairy Cows 105.0 Beef Cows 56.0 Heifers 62.0 Steers 44.0 Calves 29.0 Boars 3.3 Sows 3.3 Other Pigs 1.4 Chickens 0.002 Hens 0.013 Turkeys 0.01 Sheep 8.4 Lambs 5.6 Goats 7.8 Horses 13.0
Nitrous oxide is a long-lived, potent greenhouse gas with 298 times the global warming
potential of carbon dioxide. Emissions of nitrous oxide in agriculture are predominantly
from soils with nitrogen-rich amendments (fertilizers, manure, and compost), which
release inorganic nitrogen in the soil. Soil inorganic nitrogen is converted to nitrous
oxide by soil bacteria. On average, 1% of the nitrogen applied from fertilizers and
organic amendments (manure, compost, and other organic fertilizers) and 2% of the
nitrogen from the manure of grazing cattle, bison, confined swine, and poultry is emitted
into the atmosphere. In general, nitrous oxide emissions are directly related to the type,
quantity, and method of application of fertilizer, but other factors such as soil type and
weather patterns also influence emissions.

27
Figure 4.6 Estimated Sources of Global Methane (Environment Canada, 2005)
4.7 Solid Waste
Waste management and treatment activities are significant sources of greenhouse gas
emissions. Waste products generally proceed through one of three waste management
options: composting, combustion, or landfill. All three options use energy for
transporting and managing the waste, and each process produces additional
greenhouse gases to varying degrees. Landfills are the most common waste
management practice.
After being placed in landfill, waste is initially decomposed by aerobic bacteria. Once
the oxygen has been depleted, the remaining waste is available for consumption by
anaerobic bacteria, which break down organic matter into substances such as cellulose,
amino acids, and sugars. Anaerobic bacteria produce carbon dioxide and methane
during this process. Significant methane production typically begins one or two years
after waste disposal in a landfill and continues for 10 – 60 years or longer.
Methane emissions from landfills are a function of several factors, including:
- Total amount of waste in landfills, which is related to total waste landfilled
annually.

28
- Characteristics of landfills receiving waste (i.e. composition of waste-in-place,
size, climate)
- Amount of methane that is recovered and either flared or used for energy
purposes
- Amount of methane oxidized in landfills instead of being released into the
atmosphere.
In Canada, greenhouse gas emissions from landfills represent 4% of all greenhouse
gas emissions (Weaver 2007). According to Environment Canada, solid waste landfills
are the third largest source of methane emissions in Canada, accounting for almost
one-quarter of all methane releases. According to the Inter-governmental Panel on
Climate Change, approximately 5-20 per cent of annual global anthropogenic methane
produced and released into the atmosphere is a by-product of the anaerobic
decomposition of waste. Although wastewater treatment is included in this figure, the
majority is associated with solid waste disposal.
In addition to climate change, methane can be a local environmental hazard if
precautions are not taken to prevent uncontrolled emissions or migration into
surrounding land. Methane gas can migrate from landfills either laterally or by venting to
the atmosphere, causing vegetation damage and unpleasant odours at low
concentrations, while at concentrations of 5-15 per cent in air, the gas may form
explosive mixtures.
4.8 Solvent & Other Product Use
Solvents and related compounds are also a source of emissions of non-methane
volatile organic compounds. No other greenhouse gases are emitted in significant
amounts from the use of solvents and related compounds, which include chemical
cleaning substances used in dry cleaning, printing, metal degreasing, and a variety of
industrial applications as well as household use. Also included in this category are
paints, lacquers, thinners and related materials used in coatings in a variety of
industrial, commercial and household applications.
This category also includes evaporative emissions of greenhouse gases arising from
other types of product use. For example, nitrous oxide emissions from medical use and
emissions arising from the use of hydrofluorocarbons in applications like refrigeration,
air conditioning, fire extinguishers, solvents, foam-blowing, cooling and aerosols. All of
the substances included here contain significant amounts of non-methane volatile
organic compounds.
Non-methane volatile organic compounds are often emitted in significant quantities from
evaporation of the volatile chemicals when these products are exposed to air during the

29
variety of dispersed activities discussed above. These emissions are sometimes
referred to as “area” sources because they occur in large numbers of small but
dispersed applications, rather than from large centralized industrial processes (or “point”
sources).
In Canada, solvents and other product uses represent less than 1% of all greenhouse
gas emissions (Weaver 2007)
5.0 Consequences of Climate Change
The consequences of anthropogenic caused climate change are well documented in
scholarly research, with the findings becoming important tools in the environmental
planning of some nations. The outcomes of fossil fuel use threaten fragile ecosystems,
including polar regions which have already experienced significant alteration. A 2008
report from the National Academy of Sciences found that levels of arctic sea ice hit a
record low in 2007, threatening the livelihood of vulnerable animal species in the region
(National Academy, 2008). In addition, mountain ranges in the western world have
experienced a loss of snowpack and glacial retreat, creating issues of water availability
and putting stress on the future functionality of hydropower. Additional strain may be
placed on these regions due to declining fish populations from a lack of melt water in
regional watersheds.
It has been common in earth‟s climatic history for relatively abrupt changes in global
climate to occur. An abrupt temperature increase or decrease is not unprecedented for
the earth, but is actually part of a natural macro-climatic cycle. However, an abrupt
change in temperature from human caused greenhouse gas emissions will be
unprecedented for our civilization. Over the past 10,000 years, the earth‟s climate has
been relatively stable, and this stability has been a principal cause for the development
of complex human societies. An abrupt change in climate will create new equilibriums
on earth (such changes have occurred countless times), however humans may not be
able to adjust to the new equilibriums in a successful manner. Jared Diamond
documents the collapse of Norse settlements in Greenland during the 1400‟s as a result
of an inability to adapt to climate change (Diamond, 2005). The ensuing future famines,
environmental refugees and resource wars that could follow an abrupt change in
climate, will be unprecedented.
It is the human-induced enhancement of the greenhouse effect that causes the most
environmental concern as it has the potential to warm the planet at a rate that has never
been experienced before, causing glaciers to retreat, sea levels to rise, and climatic
zones to shift. Depending upon emissions during the 21st century, most experts agree
that average global temperatures could rise by one to six-and-a-half degrees Celsius.

30
In Canada, this could mean an increase in annual mean temperatures in some regions
such as the Artic, a temperature increase of more than double the increase in the global
average is expected.
Climate change is more than just a warming trend. Increasing temperatures will lead to
changes in many aspects of weather, such as wind patterns, the amount and type of
precipitation, and the types and frequency of severe weather events that may be
expected to occur. Such climate change could have far-reaching and/or unpredictable
environmental, social and economic consequences.
According to the IPCC, the extent of climate change effects on individual regions will
vary over time and with the ability of different societal and environmental systems to
mitigate or adapt to change. Some of the major consequences of global change
forecasted by the Nature Conservancy include higher temperatures, changing
landscapes, risk to wildlife, rising seas, increased risk of drought and fires, stronger
storms, heat related illness and death, and economic losses.
In addition to broad global changes, we can look more specifically the impacts that will
occur within Canada. Each region within Canada will be affected differently. Below are
some of the specific impacts that climate change will have on Canada, as outlined by
the British Columbia Government program Live Smart BC:
The Prairies: Most scenarios suggest that the semi-arid regions of the Prairies can
expect an increase in the frequency and length of droughts. Average crop yields
could fall by 10-30 per cent. Increased demand for water pumping and summer
cooling and decreased winter demand due to higher temperatures could push
electrical utilities into a summer peak load position at the same time as hydropower
production is reduced by decreased water flow. This could result in increased
thermal power production with an increase in fossil fuel consumption and
greenhouse gas emissions.
The Arctic: Future winter temperature increases of 5-7C over the mainland and
much of the Arctic Islands and modest cooling in the extreme eastern Arctic are
projected. Summer temperatures are expected to increase up to 5C on the mainland
and 1-2C over marine areas. Annual precipitation is expected to increase up to 25
per cent. These changes in temperature and precipitation would reduce the tundra
and taiga/tundra ecosystems by as much as two thirds of their present size. More
than one half of the discontinuous permafrost area could disappear. Wildlife would
also be affected, with many species in fish and streams shifting northward 150 km
for each degree increase in air temperature and High Arctic Peary caribou,
muskoxen, and polar bears running the risk of extinction

31
Eastern Canada: Anywhere from 3-8C average annual warming by the latter part of
the 21st century, leading to fewer weeks of snow, a longer growing season, less
moisture in the soil, and an increase in the frequency and severity of droughts.
Atlantic Canada: Atlantic Canada is particularly vulnerable to rising sea levels,
whose impacts could include greater risk of floods; coastal erosion; coastal
sedimentation, and reductions in sea and river ice.
6.0 Secondary Benefits of Greenhouse Gas Reduction
Climate change provides a compelling argument for reducing the production of
greenhouse gases. However, there are a number of other benefits associated with
reductions in greenhouse gases. For example, one of the major sources of greenhouse
gas emissions is the combustion of fossil fuels. However, fossil fuel combustion has
been identified with other global issues such as: the long-term supply of non-renewable
resources as a cheap energy source, ground level smog and ocean acidification from
carbon dioxide released during fossil fuel combustion.
6.1 Conservation of Fossil Fuels
The burning of fossil fuels (coal and oil) is considered to be the largest contributor to
greenhouse gas emissions. The global consumption of fossil fuels has risen rapidly
since 1900. For example, oil production has risen from virtually nothing to almost 4
billion tonnes in 2000 (Ponting 2007). This significant increase over the past century
has catapulted human society into an unprecedented technological growth curve, and
put pressure on our surrounding environment, contributing to a number of detrimental
effects. Human dependence upon automobile use, consumer products and the single
family home has been largely responsible for the surge in greenhouse gas
concentrations in North America, specifically due to the burning of coal, natural gas and
oil for fuel, heating and manufacturing (National Academy, 2008). The impacts of fossil
fuel combustion range from an increase in pollution to destruction of habitats to
declining air and water quality. With the rapid consumption of oil and the approach of
peak oil, the era of cheap energy is nearing an end.
The World Resource Institute argues that fossil fuels “provide about 95 percent of the
commercial energy used in the world economy. Combustion of those fuels constitutes
the largest source of emissions of climate-altering greenhouse gases. Scientists agree
that such emissions cannot be continued indefinitely at current or increasing levels
without causing devastating effects on ecosystems and on people (England, 1994).
In addition to preventing climate change, the conservation of fossil fuels is also
important for the following reasons: the threat of developing alternative energy

32
technology that is ecologically hazardous or economically unviable, the threat of social
crisis resulting from the incompatibility of present social institutions and a new energy
technology, and the threat of rent-seeking oil wars to control dwindling petroleum
reserves (England, 1994).
The transition of fossil fuels from a living organism to a usable fuel takes millions of
years, which makes fossil fuels a scarce resource. Any limited resource has the
potential to be exhausted, and that is a very real possibility at our current rate of
consumption.
Previous efforts to conserve fossil fuels have been met with mixed results. Minimum
standards for automobile fuel consumption or efficiency standards for building heating
equipment have been outpaced by the demand for fossil fuels. Efforts aimed at reducing
greenhouse gas through the reduction of fossil fuels will also have a benefit of
conserving non-renewable resources. Climate change therefore may provide another
catalyst for altering our demand for fossil fuels.
6.2 Surface Level Smog
Smog, which is primarily composed of ground-level ozone, is formed by a chemical
reaction of carbon monoxide, nitrogen oxides, volatile organic compounds, and heat
from sunlight. On hot sunny days, these compounds react with oxygen in the air to
produce ozone, or smog, at ground level (New Hampshire Department of Environmental
Services). Unlike ozone in the upper atmosphere that occurs naturally and is beneficial
because of its protective qualities, ozone at the Earth‟s surface is a man-made air
pollutant that can have harmful effects to humans.
Smog has had noticeable health impacts in a number of urban areas. This pollutant is
associated with a variety of respiratory illnesses such as an increase in asthma attacks
as well as irritated eyes, nose and throat. Ground level ozone, sulfur dioxide and
carbon monoxide in particular have been associated with health problems such as
asthma and bronchitis (Air Now, 2005). These harmful effects are particularly
dangerous for senior citizens and children as they cause a variety of respiratory
problems ranging from inflamed breathing passages, a decrease in the lungs‟ working
capacity, shortness of breath, wheezing, and coughing. It can cause eye and nose
irritation and it dries out the protective membranes of the nose and throat and interferes
with the body‟s ability to fight infection, increasing susceptibility to illness (Clean Water
Action Council, 2010). According to the Ontario Medical Association, smog is
responsible for an estimated 9,500 premature deaths in the province each year. The
33
primary emissions that create smog (fossil fuels) are also major contributors to
greenhouse gases, so if one is minimized, so is the other.
Smog has also been found to lower crop yield and the quality of agricultural crops
(Janzen et al., 1998). In reducing our greenhouse gases we not only reduce the health
problems associated with smog, but also elevate our agricultural production. Climate
change may provide another catalyst for altering our demand for fossil fuels, thereby
reducing surface level smog.
6.3 Acid Rain
Acid rain is precipitation that contains sulfur dioxide and nitrogen oxides, which like
greenhouse gas, is the result of burning fossil fuels. Many human factors have caused
acid rain including emissions from vehicles, burning of coal, and the generation of
electricity (United Nations, 2006). This type of precipitation causes acidification of
aquatic ecosystems and surrounding vegetation and soils. It has been shown to be
destructive to trees in high elevations and is particularly harmful to small water systems
that have a lower buffering capacity. In addition, acid rain has shown to accelerate the
decay of certain building materials in urban areas. Two solutions to curbing acid rain is
the use of precipitate abatement measures and/or reduction in combustion of fossil
fuels. Climate change may provide another catalyst for altering our demand for fossil
fuels, thereby reducing acid rain.
6.4 Ocean Acidification
The ocean is a carbon sink and has been shown to absorb one third of the carbon
dioxide emitted by the burning of fossil fuels (Sabine, C.L. et al., 2004). However, when
carbon dioxide dissolves in seawater, carbonic acid is formed. As the ocean absorbs
this carbon dioxide it lowers the pH level, thus making the ocean more acidic. A marked
increase in ocean acidity will have devastating effects on phytoplankton and
zooplankton, that are the base of the marine food chain. With one of the ocean‟s main
foundation species being affected, this puts pressure on all of the remaining marine
organisms ranging from coral reefs to small invertebrates to large mammals. The
World Wildlife Fund has estimated that the loss of coral reefs in Southeast Asia could
lead to a food decline in the region of 80%.
Acidification decreases the ability for the ocean to maintain natural cyclical patterns
including disruptions within the food chain, as well as the oceanic role in systems such
as the carbon cycle. This reduces important micro level ions in the ocean, making it
difficult for micro-organisms to function properly, thereby impacting the balance of a
delicate ecosystem (Falkowski & Raven, 1999). While the understanding of the possible

34
consequences of ocean acidification is still rudimentary, both the scientific community
and the society at large are increasingly concerned about the possible risks associated
with ocean acidification for marine organisms and ecosystems (Riebesell, 2010). By
reducing our greenhouse gas emissions, the natural cycle of the ocean is better
equipped to maintain ecological stability. Climate change may provide another catalyst
for altering our demand for fossil fuels, thereby reducing ocean acidification.
6.5 Upper Atmosphere Ozone Depletion
In the 1970‟s chlorofluorocarbons were identified as an upper-atmosphere ozone
depleting man-made compound. Chlorofluorocarbon is an inert compound used as a
cleaning liquid for electronic circuits and as a propellant in many personal and
household products. However, when chlorofluorocarbons migrate to the upper
atmosphere they cause depletion of the ozone layer. Upper-atmospheric ozone filters
solar radiation to levels that can be accommodated by living organisms, including
humans. It is suspected that a variety of biological consequences such as increases in
skin cancer, cataracts, damage to plants, and reduction of plankton populations in the
ocean‟s photic zone may result from the increased UV exposure due to ozone
depletion.
It has been found that some greenhouse gases also have the potential to destroy
ozone. Besides its heat trapping effects in the atmosphere, a recent American study
has found that nitrogen oxide also depletes the ozone layer. Nitrogen oxide is now the
largest source of ozone depleting compounds after the use of chlorofluorocarbons. The
production of chlorofluorocarbons was banned by the United Nations under the 1987
Montreal Protocol.
7.0 Types of Greenhouse Gas and Characteristics
There are six main greenhouse gases that are being created by humans in quantities
sufficient to cause climate change. Each of these gases has unique characteristics that
cause them to trap long wave radiation at different rates. Carbon dioxide is often used
as the base level from which the global warming potential of other gases are measured.
See Figure 7.0. Greenhouse warming potential is the measure of how much a specific
portion of a greenhouse gas will effect global warming, which is usually analyzed
comparatively with carbon dioxide. It also depends on specific isolated factors,
including infrared radiation, locations of absorbing wavelengths and atmospheric
lifespan.
Table 7.0 IPCC Global Warming Potentials - 100-Year Time Horizon

35
Greenhouse Gas Formula Second
Assessment Report
Fourth
Assessment Report
Carbon dioxide CO2 1 1
Methane CH4 21 25
Nitrous oxide N2O 310 298
Sulphur
hexafluoride SF6 23 900 22 800
Hydrofluorocarbons (HFCs)
HFC-23 CHF3 11 700 14 800
HFC-32 CH2F2 650 675
HFC-41 CH3F 150
HFC-43-10mee C5H2F10 1 300 1 640
HFC-125 C2HF5 2 800 3 500
HFC-134
C2H2F4 (Structure: CHF2CHF2) 1 000
HFC-134a
C2H2F4
(Structure: CH2FCF3) 1 300 1 430
HFC-143
C2H3F3 (Structure:
CHF2CH2F) 300
HFC-143a
C2H3F3
(Structure: CF3CH3) 3 800 4 470
HFC-152a
C2H4F2 (Structure:
CH3CHF2) 140 124
HFC-227ea C3HF7 2 900 3 220
HFC-236fa C3H2F6 6 300 9 810
HFC-245ca C3H3F5 560
Perfluorocarbons (PFCs)
Perfluoromethane CF4 6 500 7 390
Perfluoroethane C2F6 9 200 12 200
Perfluoropropane C3F8 7 000
Perfluorobutane C4F10 7 000 8 860
Perfluorocyclobutane c-C4F8 8 700
Perfluoropentane C5F12 7 500
Perfluorohexane C6F14 7 400 9 300
Source: Environment Canada (www.ec.gc.ca/ges-ghg)
7.1 Carbon Dioxide

36
7.1.1 Properties of Carbon Dioxide Carbon dioxide is a colorless, odorless non-flammable gas and is the most prominent
greenhouse gas found in the earth‟s atmosphere. Carbon dioxide is recognized as
having a 100-year atmospheric lifetime. This means that any particular carbon dioxide
molecule can remain in the atmosphere for 100 years before it is absorbed into a
natural sink.
The creation of carbon dioxide from natural sources is more than twenty times greater than sources due to human activity. However over periods of time (several years), natural sources of carbon dioxide are closely balanced by natural sinks. These sinks are primarily created via the photosynthesis of carbon compounds by plants and marine plankton. Photosynthesis is the process of green plants and other organisms transforming light energy into chemical energy. Light energy is trapped and used to convert carbon dioxide, water, and other minerals into oxygen and energy rich organic compounds. The planet‟s natural processes creates equilibrium between the chemical composition of air, water, land and living organisms. Millions of years ago, significant
amounts of carbon dioxide were sequestered in fossil fuels. As a result of this balance,
the atmospheric concentration of carbon dioxide remained between 260 and 280 parts
per million for the 10,000 years between the end of the last glacial period and the start
of the industrial era (1750 CE). Carbon dioxide concentrations in the atmosphere have
increased by approximately 35 percent since the 1900s, rising from 280ppmv to
387ppmv in 2009.
7.1.2 Carbon Dioxide Equivalents
Each of the greenhouse gases have unique characteristics that impact their potential to
cause global warming. Carbon dioxide is commonly used as the benchmark by which
the global warming potential of other greenhouse gases are measured. Therefore,
carbon dioxide is considered to have a greenhouse warming potential of 1.
7.1.3 Sources of Carbon Dioxide
The main sources of anthropogenic carbon dioxide include: burning of fossil fuels, land
use change/deforestation, industrial processes, and cement production. The process of
burning fossil fuels to produce energy causes the carbon stored in them to be emitted
almost entirely as carbon dioxide. The primary fossil fuels burned by humans are
petroleum, natural gas and coal. Carbon dioxide is emitted from burning fossil fuels for
electrical generation, industrial uses, transportation, as well as heating homes and
commercial buildings. In 2006, petroleum supplied the largest share of domestic energy
demands for Canada, accounting for an average of 47 percent of total fossil-fuel-based
energy consumption. Coal and natural gas followed in order of importance, accounting
for 27 and 26 percent of total fossil fuel consumption, respectively.

37
Land use change (mostly deforestation in the tropics) accounts for up to one third of
total carbon dioxide emissions. The causes of deforestation are logging for lumber,
pulpwood, and fuel wood. Also contributing to deforestation is the clearing of new land
for farming and pastures. Forests and wooded areas are natural carbon sinks. Forests
are a natural sink for carbon dioxide, and release oxygen while carbon is sequestered
into the trees. As forests are combusted, the sequestered carbon is released and at the
same time the natural carbon dioxide sink is destroyed.
Industrial processes such as manufacturing, construction and mining have a huge
impact on global carbon dioxide levels. Within manufacturing, six industries – petroleum
refining, chemical production, primary metal production, paper, food, and mineral
production represent the major industries involved in large carbon dioxide emissions.
Interestingly, cement manufacturing is a significant contributor to carbon dioxide
production.
According to the World Business Council for Sustainable Development (WBCSD),
concrete is the most widely used material on earth apart from water, with nearly three
tons used annually for each man, woman, and child. Cement production can cause
environmental impacts at all stages of the process. Carbon dioxide emissions from a
cement plant are divided into two source categories: combustion and calcination.
Combustion accounts for approximately 40% and calcination 60% of the total carbon
dioxide emissions from a cement manufacturing facility. The combustion-generated
carbon dioxide emissions are related to fuel use. The carbon dioxide emissions due to
calcination are formed when the raw materials (primarily limestone and clay) are heated
to over 2500°F and carbon dioxide is liberated from the decomposed limestone. As
concrete ages, it carbonates and reabsorbs the carbon dioxide released during
calcination. Calcination is a necessary chemical reaction in cement production.
Therefore, the focus of reductions in carbon dioxide emissions during cement
manufacturing should be on energy use.
Cement production occurs at the global scale, with China producing 37% of the world‟s
cement, followed by India with 6% and the U.S. with 5%. Most facilities in China rely on
inefficient and outdated technologies; these plants contribute to 6 to 8% of the carbon
dioxide emissions in China.
7.2 Methane

38
7.2.1 Properties of Methane
Methane is a colorless and odourless gas that is lighter than air. It is a naturally
occurring gas as well as one that is created by human activities. Methane has a 12-year
atmospheric life, which is relatively short in comparison to carbon dioxide, which is 100
years. Methane concentrations have more than doubled in the past two hundred years.
7.2.2 Carbon Dioxide Equivalent for Methane
Although methane has a shorter atmospheric life than carbon dioxide (12 years vs. 100
years) it has a global warming potential of 25, which means it has twenty-five times
more global warming potential than carbon dioxide. This means that methane is more
effective than carbon dioxide at trapping long wave radiation reflected from earth.
Therefore, methane has the potential to have a relatively large global warming effect
over a short period of time, compared to carbon dioxide.
7.2.3 Sources of Methane
Methane is formed by the decomposition of organic compounds under anaerobic
conditions. Sixty percent of methane emissions arise from anthropogenic sources while
forty percent comes from natural sources. The principle sources that are human related
are domestic cattle and sheep, rice paddies, forest fires, fossil fuels, mobile combustion,
landfills and sewage treatment plants. Sources that occur in nature are swamps,
wetland areas, oceans, termites, non-wetland soils, peat deposits, and freshwater
bodies.
Fossil fuel extraction and distribution is an important anthropogenic source of methane
emissions. Methane is the major component found in natural gas. Methane is released
whenever fossil fuels are extracted from the earth whether as natural gas, coal or oil.
Further processing and transportation involved in fossil fuels aids in the creation of
additional methane emissions.
Landfills create a significant amount of methane emissions. Landfills contain
considerable amounts of organic matter that decays in an oxygen-depleted environment
(anaerobic conditions). Since landfills account for 22 percent of all methane emissions
in Canada, the rise in waste disposal will only further aid in increasing methane
emissions.
The rate and rapidity of methane production depends on many factors, including the
amount of rainfall penetrating through the organic matter, the local temperature, and the
type of the organic materials. Changes in these conditions, even many years after the

39
organic matter has been placed on a site, can result in marked changes in the rate of
methane production.
Sewage treatment plants also produce methane emissions when wastewater and its
residual solid by-product (sludge) undergo treatment in anaerobic conditions. The key
factor in determining the extent of methane production is the amount of degradable
organic fraction in the wastewater that is commonly expressed in terms of biological or
chemical oxygen demand (BOD) or (COD). Under similar conditions, the methane yield
increases with higher BOD or COD content. Environmental factors that influence
methane production include temperature, pH, retention time, degree of wastewater
treatment, competition between methanogens and sulfate reducing bacteria, and
toxicants.
7.3 Nitrous Oxide
7.3.1 Properties of Nitrous Oxide
Nitrous oxide is a greenhouse gas that is composed of two nitrogen atoms and one
oxygen atom. According to the Environmental Protection Agency (EPA) nitrous oxide is
naturally occurring in soil as well as in the ocean due to nitrification and de-nitrification
of organic nitrogen by bacteria. These two sources make up over 90% of the global
production of nitrous oxide with the remaining 10% originating from man-made sources
(EPA, 2010)
7.3.2 Carbon Dioxide Equivalent of Nitrous Oxide
Although the amount of nitrous oxide emitted into the atmosphere is extremely small
compared to other greenhouse gases its effects can be very damaging. Nitrous oxide is
described by the Environmental Protection Agency as having a lifespan of 120 years
and is 298 times more effective at capturing heat than carbon dioxide (EPA, 2010).
7.3.3 Sources of Nitrous Oxide
Nitrous oxide can be synthetically produced by humans, with the majority of the
emissions originating with fertilizer use, fossil fuel combustion and through manure
management. Wastewater and sewage treatment also contributes to nitrous oxide
emissions (EPA, 2010).
Although nitrous oxide naturally occurs in soil as well as bodies of water, it is often
introduced by humans to enrich soil for more efficient crop production. The human use
of nitrogen based fertilizers and nitrogen-fixing crops can dramatically increase the
40
nitrogen levels in the soil. The run-off from this soil into water sources can indirectly
lead to further nitrogen deposits in soil. Nitrous oxide is produced by the combustion of
fossil fuels which causes a reaction between nitrogen and oxygen molecules. The
combustion of fossil fuels in the transportation sector is a major contributor to
greenhouse gas emissions.
Nitrous oxide is also created through the bacterial nitrification and de-nitrification of
organic nitrogen which livestock manure is rich in. According to the EPA there are four
factors that contribute to nitrous oxide emissions from livestock manure:
1) Composition of manure
2) Type of bacteria involved in nitrogen cycle
3) Amount of oxygen present
4) Amount of liquid present
7.4 Perfluorocarbons (PFC)
7.4.1 Properties Perfluorocarbons
Perfluorocarbons are a classification of man-made compounds from the larger gas
group of fluorocarbons. These compounds are formed from strong carbon and fluorine
atoms, which result in six core gases. The first and most abundant of these is CF4, or
tetrafluoromethane. The second most common gas is C2F6 or hexafluoroethane. The
remaining four gases are less pronouned in the atmosphere but still require
classification; octafluoropropane, perfluorocyclobutane, perfluoronbutane and
perfluoroisobutane. These gases are distinguished by the quantity of carbon and
fluorine atoms in each compound. The anomalies between atoms give distinct
characteristics to each specific gas.
The environmental impacts from these types of gases could be particularly detrimental
as they have an atmospheric life span of up to 50,000 years and are the longest living
greenhouse gases in our atmosphere.
7.4.2 Carbon Dioxide Equivalent of Perfluorocarbons
According to the Environmental Protection Agency, tetrafluoromethane, the most
abundant perfluorocarbon, has a global warming potential that is 6500 times that of
carbon dioxide. The EPA also discovered that hexafluoroethane is 9200 times more
potent than carbon dioxide.
This means that perfluorocarbons have a strong potential to warm the planet. Combine
this with their long lifespan and there arises a potential for serious impact to the natural
environment due to the results of global warming.

41
7.4.3 Sources of Perfluorocarbons
Perfluorocarbons do not occur naturally and their anthropogenic causes have been
narrowed down to the production of aluminum, particularly with the manufacturing of
semiconductors and other computer chip-type products. Further causes have been
acknowledged in steel making, refrigeration and the production of rocket fuels. Industrial
production of perfluorocarbons has expanded immensely due to the growth in electronic
products, both for personal and corporate use. In order to prepare these materials and
operate the electronics successfully, a high level of purity is required among the
chemicals. This requires a process of electrolysis, in order to cause a split among the
elements, ultimately causing the isolation of the specific metals. It is this process that
causes the increase in perfluorocarbon gases. The quantities of perfluorocarbons are
less than one percent of total greenhouse gases, however the control and maintenance
of them may have a significant impact as the use of electronics and computers grows.
7.4.4 Alternatives to Perfluorocarbons
Perfluorocarbons are a serious issue and have been recognized and regulated by many
important organizations worldwide, including the Environmental Protection Agency as
well as in the Kyoto Accord. Additional action has been taken by the Voluntary
Aluminum Industrial Partnership. This pollution prevention initiative is operated by the
EPA, in partnership with various representatives of the aluminum industry. The primary
goals are to decrease the production of perfluorocarbons and also to increase efficiency
standards within the industry. This is done through research and development between
companies, environmental consultants and governmental departments.
7.5 Hydrofluorocarbon
7.5.1 Properties of Hydrofluorocarbon
Hydrofluorocarbons (HFCs) are an inert gas with thermodynamic properties similar to
dichlorodifluoromethane, a once highly used chlorofluorocarbon (CFC) more commonly
referred to by the trade name Freon. Compared to other greenhouse gases,
hydrofluorocarbons have a fairly small concentration in the atmosphere, but are very
effective at trapping heat.
7.5.2 Carbon Dioxide Equivalent to Hydrofluorocarbon
Over a 100-year time span, one pound of HFC-23 released into the atmosphere traps
heat 14,800 times more effectively than one pound of carbon dioxide. The atmospheric

42
lifetime for hydrofluorocarbons varies between the different types from just over a year
for HFC-152a to 260 years for HFC-23. Most of the commercially used
hydrofluorocarbons have atmospheric lifetimes of less than 15 years. The
hydrofluorocarbons with the largest measured atmospheric abundances are (in order),
HFC-134a, HFC-23, and HFC-152a.
7.5.3 Sources of Hydrofluorocarbon
Hydrofluorocarbons are a group of human made compounds and are not found
anywhere in nature. All concentrations of them in the atmosphere are anthropogenic.
Hydrofluorocarbons, like chlorofluorocarbons, are primarily used in refrigeration (both
commercial and domestic), in air-conditioning (homes, cars, offices etc.), and they are
also used as foam blowing agents, solvents, fire fighting agents and aerosol propellants.
Hydrofluorocarbons began widespread use in the early 1990‟s as a replacement for
Freon, which was banned many countries in 1994, due to the damaging effects it has on
the ozone layer. Hydrofluorocarbons, unlike chlorofluorocarbons, are broken down in
the lowest part of the atmosphere, so they pose a much smaller risk to the ozone layer,
but are unfortunately an extremely potent greenhouse gas. This has led many to refer to
the transition from using chlorofluorocarbon as refrigerants to HFC‟s as moving “out of
the frying pan and into the fire”.
Since 1990, when it was almost undetectable, global average concentrations of HFC-
134a have risen significantly. HFC-134a has an atmospheric lifetime of about 14 years
and its atmospheric concentration is expected to continue to rise in line with its
increasing use as a refrigerant around the world. Between 1978 and 1995, HFC-23
concentrations increased from 3 to 10 parts per trillion, and continue to rise. However,
recent initiatives in developed nations have started to curb the use of HFC-23, as it has
been found to harm the ozone layer. HFC-152a has increased steadily to about 0.3
parts per trillion in 2000; however, its relatively short lifetime (1.4 years) has kept its
atmospheric concentration below 1 parts per trillion.
7.5.4 Alternatives to Hydrofuorocarbon
Alternative refrigerants to hydrofluorocarbons, such as hydrocarbon-based coolants
(which are not a greenhouse gas), are already commercially available and viable.
However, hydrofluorocarbons are now used in large numbers of fridges, air
conditioners, etc. around the world. A gradual phasing out of hydrofluorocarbon use and
conversion to hydrocarbon based coolants, and careful collection and disposal of
existing hydrofluorocarbon refrigerants, seems the best option currently available for
limiting hydrofluorocarbons greenhouse gas impact.

43
7.6 Sulfur Hexafluoride
7.6.1 Properties of Sulfur Hexafluoride
Sulfur hexafluoride is a colorless and odourless gas that is completely human-made and
does not occur in nature. This compound is composed of a sulfur atom and six fluoride
atoms.
7.6.2 Carbon Dioxide Equivalent of Sulfur Hexafluoride
Sulfur hexafluoride has been found to be the most effective greenhouse gas with a
global potential warming of almost 24,000 times that of carbon dioxide. Fortunately,
sulfur hexafluoride currently represents a small portion of greenhouse gas emissions at
less than one percent. Due to the small amount of sulfur hexafluoride being emitted,
there is currently very little information on this greenhouse gas, with emission data
collected only in North America. Sulfur hexafluoride has an atmospheric lifespan of
800-3,000 years
7.6.3 Sources of Sulfur Hexafluoride
A study by David G. Victor and Gordon J. Macdonald describes the production of sulfur
hexafluoride. Sulfur hexafluoride is primarily used in heavy electrical equipment as
insulation for high voltage equipment as well as cable cooling (Environment Canada,
2010). Emissions of sulfur hexafluoride occur mainly during venting or maintenance of
associated electrical components, although the compound is also emitted from leaking
electrical equipment due to improper seals (Victor and Macdonald). Sulfur hexafluoride
is also widely used in the production of magnesium as a “cover gas” in order to prevent
the metal from oxidizing (Victor and Macdonald).
Due to the nature of the use of sulfur hexafluoride it is difficult for a municipality to track
the emissions of this compound because a municipality‟s emissions would be indirectly
produced from electrical and metal production that is outside its control.
7.7 Greenhouse Gas Characteristics Summary
Carbon dioxide is the most prevalent of greenhouse gases and has been identified as
the largest Canadian contributor to global warming based upon its volume. More potent

44
greenhouse gases such as perfluorocarbons, hydrofluorocarbons and sulfur
hexafluoride are not expected to be as significant greenhouse gas contributors due to
their low production volumes at this time. See Figure 7.7.
Figure 7.7: Relative Contribution of Canadian Greenhouse Gas Emissions to
Global Warming, Source Environment Canada, 2005

45
PART 2: RESPONSES TO GREENHOUSE GAS
8.0 Organizational Response to Greenhouse Gas
Climate change issues have been addressed through a number of institutional
responses at the international, national, regional and local levels.
8.1 International Response to Greenhouse Gas
Compared to other environmental issues (i.e. water conservation, fossil fuel
conservation, soil degradation, etc.), greenhouse gas emissions have been increasingly
addressed through international collaboration and agreement. Emissions of greenhouse
gases have a global impact as they rapidly disperse evenly throughout the global
atmosphere. This encourages nations to take action and cooperate in negotiating
agreements to reduce greenhouse gases in an effort to reduce global warming.
Although, sometimes this collaboration can lead to a “stand still”, as individual countries
have occasionally refused to take action unless other nations do as well. The release of
greenhouse gas in the atmosphere is similar to the tragedy of the commons described
by Garrett Hardin (1960) whereby, commonly owned resources are exploited by every
individual to the detriment of all users.
The principal forum for action on international climate change has been the United
Nations, which has led to the Framework Convention on Climate Change (UNFCCC)
and the Kyoto Protocol. However, other international approaches have been put in
place recently, such as the Asia Pacific Partnership, talks within the G8 and the
Copenhagen Accord, which was hoped to be the successor to the Kyoto Protocol.
8.1.1 The UN Climate Change Negotiations
In 1988 the World Meteorological Organization (WMO) and the United Nations
Environment Program (UNEP) set up the Intergovernmental Panel on Climate Change
(IPCC), a scientific intergovernmental body that would assess the most recent scientific,
technical and socio-economic information on climate change. As a reaction to the
concerns brought forth in the IPCC‟s first report, the UN established the UNFCCC (an
international environmental treaty) in 1992. The treaty sets no mandatory limits on
greenhouse gas emissions for individual countries and contains no enforcement
mechanisms. However, the treaty does provide for updates (called “protocols”) that
would set mandatory emission limits. The principal update to the UNFCCC is the Kyoto
Protocol, which has become much better known than the UNFCCC itself.

46
The Kyoto Protocol (established in 1997) set out specific commitments for “Annex I
countries” (total of 39 industrialized nations and “economies-in-transition”, including the
European Union) to adhere to. The Protocol decided that the emissions covered would
be carbon dioxide, methane, nitrous oxide, hydrofluorocarbons, perfluorocarbons and
sulfur hexafluoride. It was also decided that countries would reduce their collective
emissions by 5.2% from 1990 levels by the end of the Protocol period (2012) or sooner.
In order for the Kyoto Protocol to enter into force and become legally binding it had to
be ratified by at least 55 countries. The ratifying countries had to include enough Annex
I countries to represent at least 55% of the total emissions from all Annex I countries in
1990. In 2001, the United States of America (which had earlier signed the Protocol)
announced that it would not ratify the Protocol. As the United States emits more than a
quarter of all greenhouse gas emissions from Annex I countries, this put the ratification
of the Protocol in jeopardy. However, eventually the Protocol was ratified by a sufficient
amount of countries and came into force in February of 2005.
8.1.2 Effects of the Kyoto Protocol
The first complete set of data for the industrialized parties of the UNFCCC was released
at the Nairobi meeting in 2006 and shows that greenhouse gas emissions continue to
increase despite measures under the Kyoto Protocol. Figures from 1990 to 2004 show
that the Annex I countries had a total decline in emissions of 3.3% from 1990 to 2004.
However, emissions for Annex I countries are projected to rise by a total of 4.2%
between 1990 and 2010. This prediction is due to the fact that the reduction in the
1990‟s was driven largely by the restructuring of economies-in-transition, rather than
from policy changes. For example the collapse of the Soviet Union caused record
reductions of greenhouse gas emissions in Ukraine, Latvia, Estonia, Lithuania, Bulgaria,
Romania, Hungary, Slovakia, Poland and the Czech Republic. Further “Germany and
Britain have reduced their emissions, but most of those reductions were due to the
collapse of the British coal-mining industry in the 1980s and the collapse of East
German heavy industry and power generation after the reunification of Germany”
(Nordhaus and Shellenberger, 2007). Little of the reduction in Britain or Germany is
attributable to regulatory actions taken by the European Union or national governments
in the effort to reduce greenhouse gas emissions. These restructuring processes were
mostly finished by 1999. Emissions from the USA were up 16%, those from Australia
were up 25%, and emissions from China rose 110% and India 89% over the same
period.
Overall, the Kyoto Protocol has been far from successful. Many countries that have
accepted the Protocol have not shown a strong commitment to it and the non-
compliance penalties are feeble at best, offering little motivation. The World Bank noted
in a report that the Kyoto Protocol has only had a slight effect on reducing global

47
emissions, and that from 1997 (the time the treaty was negotiated) to 2005, energy
related emissions had grown globally by 24%.
8.1.3 Asia Pacific Partnership (APP)
The Asia-Pacific Partnership on Clean Development and Climate (APP) is a non-treaty
partnership established by Australia, India, Japan, China, South Korea and the United
States in July 2005. The Partnership involves countries that account for about half of the
world‟s population and more than half of the world‟s economy, energy use, and
greenhouse gas emissions. In October 2007, Canada joined the APP. The primary
objective of the Partnership is “to work together and with private companies to expand
markets for investment and trade in cleaner, more efficient energy technologies, goods,
and services in key sectors”.
When the APP was first announced, some parties expressed suspicions that the APP
was being established as a rival to the United Nations process (especially as it has
been spearheaded by the US, who did not ratify the Kyoto Protocol). However, efforts
have been made by members to portray the APP as acting complementary to the
UNFCCC, rather than as a competitor.
Critics of the APP point to the fact that participating countries have made no
commitments in terms of emissions targets, suggesting that the Partnership is futile.
However, with only seven countries participating (compared with hundreds under the
UN system), and without the bureaucracy that the UNFCCC negotiations have
established, it is possible that the APP is in a good position to help develop the
technology solutions that will help reduce greenhouse gas emissions.
8.1.4 Group of 8 (G8)
The G8 (Canada, France, Germany, Italy, Japan, the Russian Federation, the United
Kingdom and the USA) hold annual economic and political summit meetings of the
heads of government and international officials. Since 2005, the G8 have held meetings
focusing on energy and the environment, including diversifying energy supply and
increasing the transparency, predictability and stability of global energy markets. The
meeting in St Petersburg, Russia in 2006 focused on global energy security and climate
change. Included in the details of how to address these key areas was a strong
endorsement of nuclear energy as a solution: “Those of us who have or are considering
plans relating to the use and/or development of safe and secure nuclear energy believe
that its development will contribute to global energy security, while simultaneously
reducing harmful air pollution and addressing the climate change challenge.”

48
Global energy security and climate change have been further discussed in following
meetings, along with the G20, but no specific plans or commitments have been
developed.
8.1.5 European Union
On a global scale, the European Union has emerged as a leader in promoting actions
on global warming. In March 2007, the European Council endorsed the European
Commission‟s Strategic Energy Review and agreed on an overall cut of 20% in EU
greenhouse gas emissions by 2020, relative to 1990 levels. The previous commitment
was an 8% reduction by 2012. The European Council also endorsed the objective of
making a 30% reduction in greenhouse gas emissions by 2020. They said they would
commit to this 30% target if other developed countries committed to comparable
reductions in emissions and if the more advanced developing countries (e.g. India,
Brazil, China) “contributed adequately according to their responsibilities and respective
capabilities”.
The European Council also set a target of meeting 20% of EU energy needs from
renewable energy sources, allowing nuclear power to be included in the renewable
energy category. The Council noted that “the European Commission‟s assessment of
the contribution of nuclear energy in meeting the growing concerns about safety of
energy supply and carbon dioxide emission reductions” and it acknowledged the role of
nuclear energy “as a low carbon dioxide-emitting energy source.”
8.1.6 Alliance of Small Island States (AOSIS)
AOSIS is an intergovernmental organization of low-lying coastal and small island
countries. Established in 1990 and consisting of 42 countries, it functions primarily as a
negotiating voice on the issues of global warming and greenhouse gas emissions for
small island nations within the UN. Due to the adverse effects of rising sea levels, low-
lying coastal and island nations are particularly vulnerable to potential global warming.
AOSIS has been a strong voice since its foundation, having put forth the first draft of
text in the Kyoto Protocol negotiations in 1994. It is interesting to note that some of the
most vulnerable nations to climate change impacts are some of the only nations taking
a strong stance against greenhouse gas emissions.
8.1.7 Future International Plans
Attention now is turning to the strengthening of the international framework on climate
change for the years following the Kyoto Protocol‟s commitment period (December 31,
2012). After a lack of progress at the climate talks in Copenhagen, there are a series of
talks beginning in Mexico in late 2010, South Africa in 2011 and either Qatar or South

49
Korea in 2012. Because a new treaty (or a modified treaty) will require ratification by
participating countries, it is likely that it is already too late to prevent a gap between
treaty commitment periods.
Overall, aside from the European Union (EU) and AOSIS, there has not been much
progress made (or enthusiasm for), reducing greenhouse gas emissions on the
international stage. However, as the EU further develops its plans and commitments to
reducing greenhouse gas emissions, it is bound to influence other nations to follow suit.
At the moment, the overriding challenge on the international stage is to forge an
agreement that includes all major greenhouse gas emitting countries, both developed
and developing, and begin significant long-term reductions in global emissions.
8.2 Canadian Response to Climate Change
Canada was an original signatory of the Kyoto Protocol in 1998. Under this protocol
Canada was mandated to cut its overall greenhouse gas emissions by a total of 6
percent below 1990 levels by 2012. As of 2007, Canada‟s attempt at meeting Kyoto
Protocol targets can be described as nothing short of disastrous, with greenhouse gas
emissions actually increasing by over 30% over 1990 emission levels. This increase
was attributed to increased production in the oil and gas sector as well as increased use
of motor vehicles. According to a report by Environment Canada to the United Nations
this increase puts Canada first among G8 countries in terms of increases in GHG
emissions. Table 8.2 shows that Canada is the second greatest greenhouse gas
emitter per capita, only exceeded marginally by the United States. According to some
observers, the explanation for Canada‟s difficulties is not complicated. The world‟s
principal source of man-made greenhouse gases has always been prosperity (Owen,
2009). Former Soviet bloc countries with shuttered factories and high unemployment,
do not have the economic engine to produce greenhouse gases similar to Canada,
which was not impacted by the 2008 recession to the extent as other countries.
There are six major gases that make up the commonly recognized suite of greenhouse
gases: carbon dioxide (CO2); methane (CH4); nitrous oxide (N2O); perfluorocarbons
(PFC‟s); hydrofluorocarbons (HFC‟s); sulphur hexafluoride (SF6). Out of 163 countries,
Canada is the second greatest producer of greenhouse gas emissions per capita
(IPCC, 2007).
The Canadian government has maintained that it is currently impossible to meet the
targets set under the Kyoto Protocol and has stated that any greenhouse gas reduction
target must be in line with the United States in order to be successful. However the
United States is no longer a signatory to the agreement. The Canadian government
has argued that domestic reduction policies must be aligned with the United States due
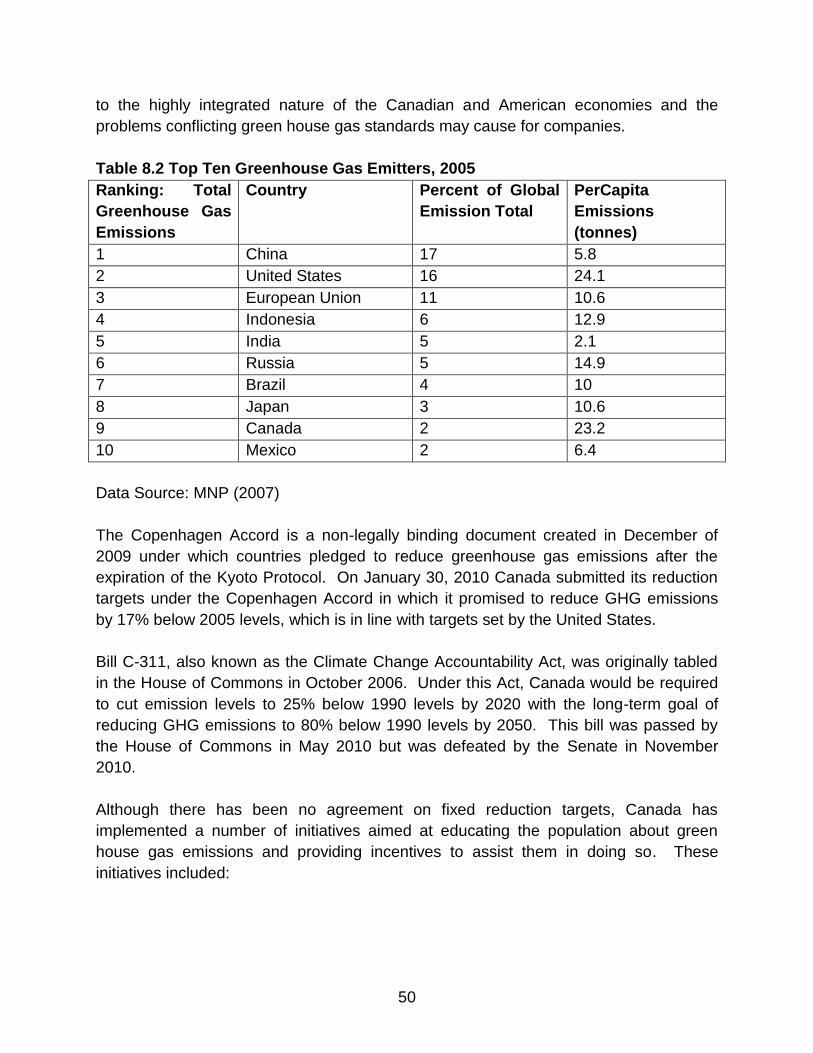
50
to the highly integrated nature of the Canadian and American economies and the
problems conflicting green house gas standards may cause for companies.
Table 8.2 Top Ten Greenhouse Gas Emitters, 2005
Ranking: Total
Greenhouse Gas
Emissions
Country Percent of Global
Emission Total
PerCapita
Emissions
(tonnes)
1 China 17 5.8
2 United States 16 24.1
3 European Union 11 10.6
4 Indonesia 6 12.9
5 India 5 2.1
6 Russia 5 14.9
7 Brazil 4 10
8 Japan 3 10.6
9 Canada 2 23.2
10 Mexico 2 6.4
Data Source: MNP (2007)
The Copenhagen Accord is a non-legally binding document created in December of
2009 under which countries pledged to reduce greenhouse gas emissions after the
expiration of the Kyoto Protocol. On January 30, 2010 Canada submitted its reduction
targets under the Copenhagen Accord in which it promised to reduce GHG emissions
by 17% below 2005 levels, which is in line with targets set by the United States.
Bill C-311, also known as the Climate Change Accountability Act, was originally tabled
in the House of Commons in October 2006. Under this Act, Canada would be required
to cut emission levels to 25% below 1990 levels by 2020 with the long-term goal of
reducing GHG emissions to 80% below 1990 levels by 2050. This bill was passed by
the House of Commons in May 2010 but was defeated by the Senate in November
2010.
Although there has been no agreement on fixed reduction targets, Canada has
implemented a number of initiatives aimed at educating the population about green
house gas emissions and providing incentives to assist them in doing so. These
initiatives included:

51
Cash for Clunkers Program
Under this program the Government of Canada hoped to reduce the number of
“clunkers” from Canadian roads by offering $300 in bus passes, bicycles or cash to
individuals who bring in vehicles manufactured prior to 1996.
Home Renovation Tax Credit
This program ran from January 2009 to February 2010 and allowed homeowners to
claim tax credits of up to $1350 for home renovations.
ecoENERGY Program
The Home Renovation Tax Credit allows homeowners to apply for up to $10,000 in
Federal and Provincial grants to help improve the energy efficiency of their homes.
Items that are covered under this plan range from high efficiency furnaces and wall
insulation to renewable energy retrofits such as solar energy systems and heat pumps.
This program is scheduled to last until March 31, 2011.
One Tonne Challenge
The One Tonne Challenge was created by the Government of Canada in 2004 to
challenge Canadians to reduce their GHG emissions by one tonne per year. This
program sought to educate Canadians on how they can reduce their own GHG
emissions with techniques such as taking public transit, composting kitchen waste,
using renewable energy sources etc.
The Government of Canada has received tremendous criticism from both environmental
groups as well as international governments for its stance on greenhouse gas reduction.
Although progress is being made on Canadian policies on climate change it is markedly
passive compared to other nations.
8.3 Provincial Response to Climate Change
British Columbia is a leader in reducing greenhouse gas emissions and becoming more
energy sufficient. For example Bill 44, The Greenhouse Gas Reduction Targets Act,
was adopted in November of 2007. The Bill commits B.C. to a 33% reduction in
greenhouse gases by 2020, from a 2007 baseline, and an 80% reduction by 2050. The
Bill also requires that all public service organizations (including health, universities, and
some crown corporations) be carbon neutral by 2010.
British Columbia‟s climate plan is the forefront strategy in making the province more
“green” and cutting carbon emissions. In 2008, the Provincial Air Action Plan provided

52
$15 million to the BC Scrap-It program, helping take 12,000 ageing, polluting vehicles
off the road and reducing greenhouse gases from vehicles by 77,000 tonnes.
In 2008, the Province also implemented North America‟s first revenue neutral carbon
tax. This tax will reduce greenhouse gas emissions and will fund over $2.5 billion in tax
cuts and assistance for low-income families through revenue gained from the tax. B.C.
has the world‟s largest fleet of hydrogen fuel-cell transit buses. By the end of 2012, BC
Hydro will have replaced 1.8 million electric meters with Smart Meters in homes and
businesses. Smart Meters provide real-time information to customers on how and
when they‟re using electricity. Customers can then easily make electrical demand
changes to shift their usage to off-peak hours when energy costs are lower. A
Climate Action Revenue Incentive that offsets the carbon tax for local governments and
School Districts that pledge to become carbon neutral by 2012 has also been provided.
The greenhouse gas response for Alberta has been markedly different from British
Columbia. Alberta is the largest provincial emitter of greenhouse gases in Canada.
Alberta implemented a climate change strategy in January 2008. This plan is
comprised of three main strategies: implementing carbon capture and storage, greening
energy production and conserving and using energy efficiently.
In regards to reducing greenhouse gas associated with energy production, Alberta
targets facilities that emit more than 100,000 tonnes of greenhouse gases a year to
reduce their emissions by 12 percent. The regulations apply to about 100 large facilities
and account for about 70 per cent of Alberta‟s industrial greenhouse gas emissions.
Facilities have three options for meeting the reduction in carbon emissions: improve the
energy efficiency of their operations, buy carbon credits in the Alberta-based offset
system or pay $15 into the Climate Change and Emissions Management Fund for every
tonne over their reduction target. To date the Climate Change and Emissions
Management Fund, established as a compliance option for regulated emitters has
received $122.4 million. Potential areas for investment by the Fund include energy
conservation and efficiency, demonstration and use of new technologies that reduce
greenhouse gas emissions (eg. carbon capture and storage), development of carbon
offset projects and climate change adaptation programs and measures.
The annual cost of compliance is estimated to be $177 million or less than one tenth of
one per cent of Alberta‟s nominal GDP ($242 billion in 2006).
Targets for provincial greenhouse gas reduction for Alberta are:
20 mega tonnes reduction below business-as-usual by 2010
50 mega tonnes reduction below business-as-usual (equivalent to about 58% above

53
1990) by 2020 (year in which emissions are to stop increasing and start
declining)
200 mega tonnes (or 50%) reduction below business-as-usual by 2050, also stated
a 14% below 2005 (equivalent to 16% above 1990)
These targets have not been put into legislation. Currently proposed measures fall
short of being able to achieve the 2020 target of 50 mega tonnes of greenhouse gas
emissions. The climate change strategy is credited with 70% of the reductions, but in
the absence of a much higher carbon price or regulated absolute reductions, it is very
unlikely to be implemented on this scale. The $2 billion pledged by the Alberta
government for climate change strategies is anticipated to result in a reduction of at
most 5 mega tonnes starting in 2015, one tenth of the targeted reduction for 2020.
(Pembina Institute, August 2009)
Alberta has declared significant funding measures to this climate change strategy.
Subsequently, the budget included included $100 million for 2009 and $800 million over
the next three years for climate change projects, as well as $520 million over three
years for GreenTRIP (a proposal supporting better and easier access to public transit).
Overall, the province is committed to providing $2 billion in support of large-scale CCS
projects and $2 billion for public transit under GreenTRIP.
In Alberta, Canada‟s Climate Change and Emissions Management Corporation is
awarding more than $37.5 million to Alberta-based renewable energy projects including
waste to biofuels and energy, solar power, biogas and home generation.
Western Climate Initiative
The Western Climate Initiative (WCI) is an international initiative that was started by the
State of California as a way to reduce greenhouse gas emissions independently from
federal policies. Initially the WCI consisted of 5 western states but now includes 7
states, as well as the provinces of British Columbia, Manitoba, Ontario and Quebec.
The members of the Western Climate Initiative have pledged to reduce greenhouse gas
emissions by 15% of 2005 levels by 2020. The members of this initiative will primarily
use a cap and trade system to meet this target.
8.4 Local Government
Local Government responses to climate change have been fairly straightforward among
most municipalities. Emission inventories and emission audits are a widespread starting
point to assessing the impact corporate emissions have on the surrounding
environment. This requires awareness in city hall, as well as widespread knowledge of
the issue among city council members.

54
After an inventory has been completed, many local governments have looked to
establish a set of emission reduction targets, using a base year (1990 for example) as a
reference point for gauging the effectiveness of their policies. Along with emission
targets, a list of reduction actions is usually created as well. This can include actions
such as retrofitting old streetlights with newer and more efficient types or reducing
vehicle trips by 25% for example.
Once these reduction actions are outlined and implemented, a supplementary inventory
is usually required. This allows local governments to assess their progress and make
changes should they require it. Once these assessments are made, the government
can attempt to make new policy changes and establish more climate conscious
operations. In a successful case, this develops a snowball effect, with more and more
actions being undertaken to improve the emission quantity put forth through government
operations.
With this snowballing effect also comes increased awareness of climate change both in
government and in the public. This city-wide awareness makes policy changes easier to
implement. This has become very evident in well-known “green” cities such as
Vancouver or Stockholm. In these cities, the public is supportive of emission reduction
actions and their climate conscious mentality makes decision-making much easier for
government officials.
The City of Lethbridge was previously involved with the Government of Canada in the
One-Tonne Challenge. This program sought to reduce greenhouse gas emissions by
helping Canadians reduce their annual greenhouse gas emissions by one-tonne. After
the One-Tonne Challenge was discontinued in 2006 the City of Lethbridge has
continued with a community challenge program to help Lethbridge residents reduce
their greenhouse gas emissions.
This program concentrated on two initiatives:
- Reducing Your Footprint
The aim of this initiative is to help Lethbridge residents determine their ecological
footprint and to find ways to reduce this footprint.
- Moving More Sustainably
This initiative seeks to educate Lethbridge residents on good driving habits and
alternative methods of transportation, ie. carpooling, to reduce vehicle greenhouse gas
emission.

55
Besides this challenge program the City of Lethbridge also has several other education
programs dealing with recycling, energy and water conservation, and vehicle idling.
8.4.1 Local Government Benchmarks
With unanimous acknowledgment of climate change across the world, many
municipalities and regions have taken initiatives to reduce their greenhouse gas
production over the next century. For most of these municipalities, reductions are being
achieved through planning and goal setting within specified timelines. For the purposes
of this project, a number of communities from western Canada and three international
communities with similar climate characteristics were chosen for review. The review is
intended to provide a sample of activities being taken at the local government level to
reduce greenhouse gas generation.
In order to properly assess the current state of climate action within the City of
Lethbridge, it is crucial to research and analyze the actions of other municipalities
across North America and the world. A municipality cannot fully assess the quality of
their own situation without adequate knowledge of how other cities of similar size,
climate and geographical location are handling greenhouse gas emissions.
8.4.1.2 Christchurch, New Zealand
Christchurch is the largest city on the South Island of New Zealand and the country‟s
second largest urban area. It has a population of approximately 390,300 from their last
municipal census in 2010. Christchurch has a relatively dry, temperate climate, with
temperatures dropping below 0˚C in their winter (June-September), with snow being
received. Its climate is somewhat similar to the climate in Lethbridge; however, it is
slightly warmer and wetter.
The City of Christchurch first adopted a climate change policy in 1995. It did not contain
any specific actions, but acted as recognition that climate change was happening, and
its impacts were considered by the City of Christchurch in some of their subsequent city
developments. This original policy was fleshed out and made into specific goals and
policies in 2010 with the development of the Christchurch Climate Smart Strategy.
The Christchurch Climate Smart Strategy has been implemented to respond to New
Zealand government advice about climate change, and to meet New Zealand
government obligations on Christchurch‟s City Council in considering climate change

56
and its effects on the city‟s development. The Climate Smart Strategy was also
developed to replace the aforementioned 1995 climate change policy.
The New Zealand government has given specific advice about anticipated climate
change for New Zealand cities and has obligated City Councils to act based on this
advice. Following recommendations from the New Zealand government, Christchurch
City Council is planning for (relative to 1990 levels): a 50 cm sea-level rise by 2100, with
the possibility of at least an 80 cm sea-level rise by 2100; an average temperature
increase of around 1°C by 2040 and 2°C by 2100; changes beyond these levels in case
of a “business as usual” attitude by the rest of the world; and changes in rainfall and
extreme weather events. The goal of the City of Christchurch is to minimize their
contribution to global greenhouse gas production, while simultaneously developing their
city in a manner that will make it resilient to the impacts of climate change. The City of
Christchurch has further attempted to predict the specific positive and negative effects
in their immediate area by commissioning scientific reports to study the effects of
climate change. This has allowed the City of Christchurch to develop responses that
specifically address areas of concern, such as placing restrictions on new construction
projects within a specified distance of rising waterways.
The City of Christchurch performed a corporate and community greenhouse gas survey
in 2008, finding that approximately 3.6 million tonnes of greenhouse gases
(approximately 10 tonnes per person per year) were emitted from Christchurch. As of
2008, the City of Christchurch‟s corporate operations have already reduced their total
greenhouse gas emissions by 57% of their total emissions in 1994. They plan to
continue to reduce their corporate emissions in the future, and intend to also focus on
the reduction of community emissions. The Climate Smart Strategy identifies specific
targets in five areas:
1) Greenhouse gas emissions
• 20% reduction in net greenhouse gas emissions from Christchurch by 2020
from a 2008 base year (e.g. no more than 8 tonnes per person per year)
• 50% reduction in net greenhouse gas emissions from Christchurch by 2050
from a 2008 base year (e.g. no more than 5 tonnes per person per year)
2) Transport
• 50% reduction of greenhouse gas emissions from domestic transport by 2040
from a 2008 baseline
• Increase coastal shipping‟s share of interregional freight
• Increase rail‟s share of freight.

57
3) Energy
• At least 25% of total energy used (including transport) is from renewable
sources by 2018
• Reduce total energy consumption to no more than 107 Gigajoules per person
per year by 2018
4) Waste
• 65% reduction of waste landfilled by 2020 (no more than 320 kg per person
per year) from 1994 levels
• Zero hazardous waste by 2020
5) Agriculture
• Eliminate net rise in greenhouse gas emissions from agricultural activities
from 2008
• 15% increase in land area covered in woody vegetation by 2030 from a 2008
baseline
The City of Christchurch has taken these goals outlined above and transferred each one
to specific initiatives and multiple projects throughout the city. Some of these projects
are outlined below:
Water Body Management
As Christchurch is a coastal city, with two rivers within city limits, developing with these
bodies of water in mind is crucial. Many parts of low-lying Christchurch and coastal
areas are already vulnerable to extreme weather events such as floods, storms and
high tides. These impacts are expected to worsen with the impacts of climate change.
The Council is making changes to the City Plan with respect to climate change and is
considering changes that will identify and manage development in vulnerable areas.
Some examples of these changes include requiring new properties to be located further
away from rivers and the ocean, raising the floor level of new buildings, and reducing
the density of development in vulnerable areas in order to reduce risks to people and
property. Monitoring stations have also been developed along waterways to assess and
predict changes in water levels. The City of Christchurch will amend their plans based
on projections from the monitoring stations.
Energy Efficiency
The Christchurch City Council constructed a new Civic Office; a leading example of an
energy efficient, low carbon building. Innovations in the building include a tri-generator
to heat and power the building using bio-gas piped from a local landfill, passive
ventilation systems, use of efficient and natural lighting, and the collection of rainwater

58
for flushing toilets. The City Council has also begun to minimize redundant employee
travel and provide alternative travel options, resulting in 40% of City staff regularly
cycling, walking, and taking the bus to work. The City has also taken initiatives to heat
select recreational centres throughout the city with landfill gas, reducing emissions of
major energy users.
To reduce greenhouse gas emissions and improve air quality in downtown
Christchurch, the City funds hybrid-electric public buses, which are manufactured
locally. Every 10 minutes, between 7.30 am and 10.30 pm, the buses follow a circuit of
the downtown shops and sights, providing locals with a free, alternative mode of transit
which reduces traffic congestion and promotes tourism.
Another energy reduction alternative is being tested at the Christchurch Wastewater
Treatment Plant. Through a partnership the New Zealand government, Solray Energy
grows algae on wastewater nutrients, which is then harvested and converted into bio-oil,
in an effort to develop a fossil fuel alternative.
Community Initiatives
The City of Christchurch is trying to encourage a community-wide reduction in
greenhouse gas emissions through various public awareness campaigns. These
campaigns aim to help students and community members address real life challenges
and explore ideas that reduce waste, save energy, conserve water, and help make
more sustainable transport choices.
A further community action by City Council has been to provide eco-design advisors to
offer free, independent advice to designers, builders, and home renovators about
sustainable design and restoration. The eco-design advisors provide assistance over
the phone or in their office, offer site visits, and conduct public and professional
presentations. The object of this initiative is to provide safer, more energy-efficient
homes that can be operated at a reduced cost: for both the consumer, and the
environment.
Christchurch also has, and is sponsoring, a growing number of community gardens.
With the growth of community gardens, the City is aiming to reduce reliance on fossil
fuels in the food market and encourage social cohesion among city residents.
In conclusion, the City of Christchurch has gone beyond the initial planning stages in
reducing its carbon footprint and continues to implement changes to support this effort.
However, Christchurch is not stopping here, as the City plans for a full evaluation of its
progress in 2016. In acquiring knowledge gained from its future evaluation, the City of

59
Christchurch then plans to take its climate change initiatives even further. Considering
the progress being made, and its ambitions for the future, Christchurch remains poised
in its preparation for the uncertainty of a changing climate.
8.4.1.3 Helsinki, Finland
Helsinki is a city of 588,941, located in southern Finland along the coast of the Gulf of
Finland. Due to its northern location it has an intermediate continental climate similar to
Lethbridge with temperatures ranging from 30C during the summer to below -30o C in
the winter.
The City of Helsinki is one of the world leaders in sustainable development having
signed the Aalborg Charter, which was a document for the sustainable development of
European cities. In 2002 Helsinki adopted a Sustainability Action Plan. The city‟s
sustainability plan is focused on four key areas; district heating, public transportation,
waste management and energy production.
The Helsinki district heating network was first conceptualized in 1913 but development
only began in the 1950s. The network spans almost 3000 km and services 95% of all
buildings within the city. The system is powered by a variety of fuel sources from
natural gas and coal to wood and peat. The city of Helsinki also has a district cooling
system for use in the summer months.
Besides the district heating and cooling systems Helsinki also utilizes cogeneration to
produce its electricity, which greatly reduces the amount of fuel required to generate
electricity. Using these cogeneration plants Helsinki has been able to achieve
production efficiency as high as 90% helping the city save the equivalent of heating
270,000 homes. The City of Helsinki is currently working to reduce its dependence on
fossil fuels by investing in renewable energy sources, which it hopes to increase to 20%
by 2020 from the 6% that it currently uses. An example of the innovations being utilized
by Helsinki to increase renewable energy use can be found at the Kalliomaki power
plant which utilizes the water flow from Lake Paijanne to generate electricity. This is
achieved because the lake loses elevation as it flows downstream through a water
tunnel, where the power plant then harnesses the gravitational energy of the water flow
to generate electricity.
Over the years public transportation has also become a major priority in Helsinki. In
1991 the City of Helsinki adopted a transportation policy that emphasized development
of public transportation, particularly rail systems such as trams and trains. Helsinki has
also worked to make its bus fleet more environmentally friendly by using natural gas
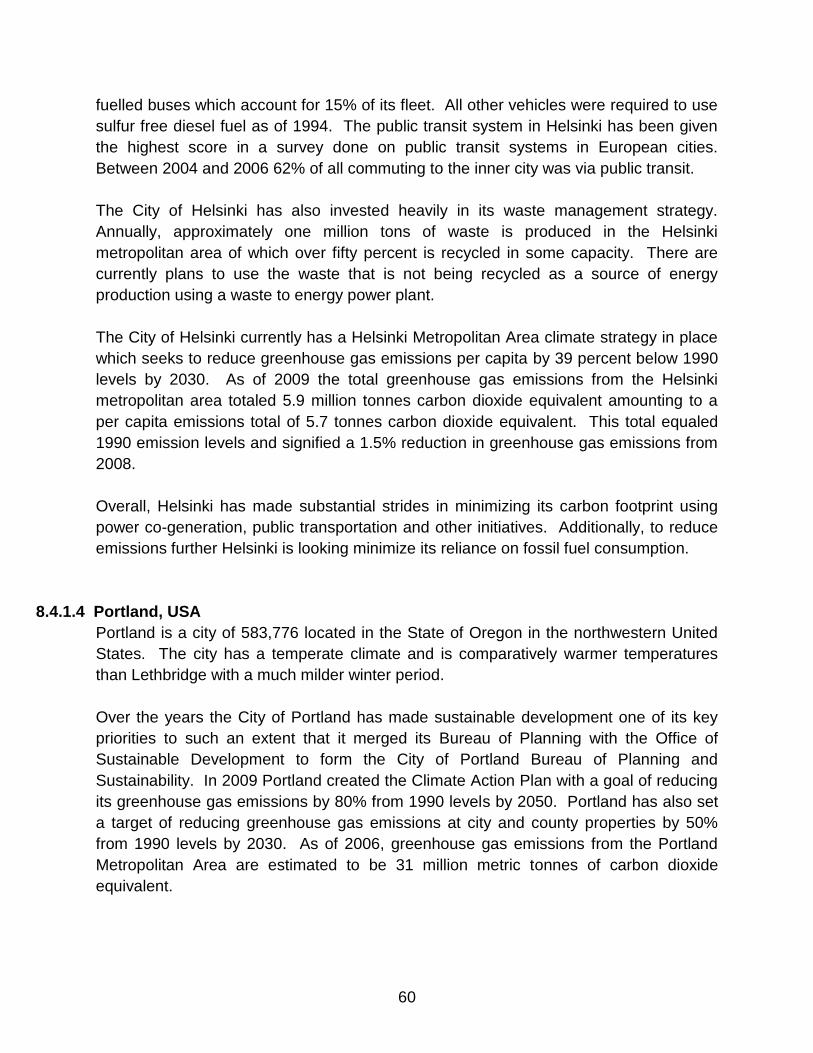
60
fuelled buses which account for 15% of its fleet. All other vehicles were required to use
sulfur free diesel fuel as of 1994. The public transit system in Helsinki has been given
the highest score in a survey done on public transit systems in European cities.
Between 2004 and 2006 62% of all commuting to the inner city was via public transit.
The City of Helsinki has also invested heavily in its waste management strategy.
Annually, approximately one million tons of waste is produced in the Helsinki
metropolitan area of which over fifty percent is recycled in some capacity. There are
currently plans to use the waste that is not being recycled as a source of energy
production using a waste to energy power plant.
The City of Helsinki currently has a Helsinki Metropolitan Area climate strategy in place
which seeks to reduce greenhouse gas emissions per capita by 39 percent below 1990
levels by 2030. As of 2009 the total greenhouse gas emissions from the Helsinki
metropolitan area totaled 5.9 million tonnes carbon dioxide equivalent amounting to a
per capita emissions total of 5.7 tonnes carbon dioxide equivalent. This total equaled
1990 emission levels and signified a 1.5% reduction in greenhouse gas emissions from
2008.
Overall, Helsinki has made substantial strides in minimizing its carbon footprint using
power co-generation, public transportation and other initiatives. Additionally, to reduce
emissions further Helsinki is looking minimize its reliance on fossil fuel consumption.
8.4.1.4 Portland, USA
Portland is a city of 583,776 located in the State of Oregon in the northwestern United
States. The city has a temperate climate and is comparatively warmer temperatures
than Lethbridge with a much milder winter period.
Over the years the City of Portland has made sustainable development one of its key
priorities to such an extent that it merged its Bureau of Planning with the Office of
Sustainable Development to form the City of Portland Bureau of Planning and
Sustainability. In 2009 Portland created the Climate Action Plan with a goal of reducing
its greenhouse gas emissions by 80% from 1990 levels by 2050. Portland has also set
a target of reducing greenhouse gas emissions at city and county properties by 50%
from 1990 levels by 2030. As of 2006, greenhouse gas emissions from the Portland
Metropolitan Area are estimated to be 31 million metric tonnes of carbon dioxide
equivalent.

61
In order to achieve its goals to reduce greenhouse gas emissions and increase
sustainable development the City of Portland has created a number of plans and
initiatives. These include:
Sustainable City Government Partnership
This partnership was formed with the intent of implementing sustainable practices on
City properties. This has led to initiatives such as the installation of solar powered
parking meters to the recycling of concrete and asphalt, which saves the city
approximately $3 million annually.
Energy Policy
The City of Portland developed an energy policy in 1990 with 89 objectives in increasing
energy efficiency in areas ranging from City operations to waste reduction and
recycling. By 2000 over 90% of the objectives had been met. Some of the objectives
met include reducing per capita household energy use by 9%, installing a waste
methane fuel cell, and reducing city energy expenditures by $1.1 million annually.
Small Grant Program
This policy was developed by the City of Portland to help communities with their waste
prevention and recycling programs by offering grants ranging from $500-$2500 in value.
An example of these community projects include a grant to an urban co-housing
community to help it develop a large scale composting system to handle food waste.
The City of Portland has made a firm commitment to becoming a more environmentally
sustainable community as reflected by its creation of a Climate Action Plan as well as
various programs to help residents become more environmentally friendly. Through
these initiatives Portland is well on its way to becoming a North American leader in
urban sustainability. However, Portland‟s greenhouse gas emissions are still far higher
than comparative cities in Europe.
8.4.1.5 Spokane, USA
Spokane is the second largest city in the US state of Washington and is an economic
hub for Eastern Washington. According to the last municipal census in 2010, it has a
population of 208,916. Spokane has a semi-arid continental climate, quite similar to
Lethbridge, although slightly warmer and wetter.
In formulating their plan to reduce greenhouse gas production, Spokane looked to the
actions of leading cities in the reduction of greenhouse gases, such as Vancouver. The
City decided to focus their efforts in three broad areas: climate mitigation, climate
62
adaptation, and energy security. To this end, the City of Spokane completed a
community and corporate greenhouse gas inventory in 2009 for the years 1990 and
2005. This would allow them to set goals and gauge their future progress. In addition to
the greenhouse gas inventory they created a Sustainability Action Plan in 2009 to guide
the development of Spokane in the future.
In the Sustainability Action Plan, the City of Spokane outlined several specific goals and
actions that would help them to effectively adapt to an uncertain future. As Spokane‟s
Sustainability Action Plan is relatively new, many of the goals are overarching themes
that will help to guide the City in the future as it develops more specific actions to take.
For the purposes of this report, only the more specific actions and goals will be
mentioned for a concise overview of Spokane‟s actions to reduce greenhouse gas.
Renewable Energy
The City of Spokane intends to increase the percentage of renewable energy it acquires
each year, targeting 100% by 2030. They plan to begin by installing small-scale
renewable power technologies (solar thermal, solar voltaic, wind, etc.) in City facilities
wherever feasible. The City of Spokane further plans to encourage renewable energy
use through land use policy and incentives (renewable energy zones, fee waivers) that
will encourage city residents to develop small-scale renewable energy sources.
Transportation
As transportation is a significant source of greenhouse gas, the City of Spokane plans
to remove barriers restricting expansion, safety, and use of pedestrian pathways and
bikeways, and to encourage the use of electric cars via designated parking spaces.
They also plan to expand the public transportation system and secure right-of-way for
rapid transit.
Optimize Operations
The City of Spokane plans to optimize its corporate operations in order to reduce their
production of greenhouse gases. One way they plan to do this is by reducing the
number and size of vehicles in the City fleet, and by increasing their fuel efficiency.
They also plan to amend procurement policies by using a “total cost accounting” method
of purchasing, factoring in energy and environmental criteria into procurement
decisions. This will allow for more environmentally conscious products to be purchased
(including locally-produced goods), as the cost of transportation and greenhouse gas
emissions will be considered. The City also plans to appoint a sustainability advisor that
can educate staff and give input on procurement policies.
In conclusion, the City of Spokane has many good ideas and general plans in respect to

63
climate change and reducing the city‟s greenhouse gas emissions. In addition to the
initiatives outlined above, the City of Spokane has some very general goals in the areas
of water conservation, land-use and promotion of electric cars. However, specific
actions and goals to reduce greenhouse gases for most of these topics have yet to be
outlined. Spokane‟s Sustainability Action Plan is a good first step to addressing climate
change and reducing greenhouse gas emissions, but more specific action needs to be
taken if any substantial emission reductions are to be accomplished.
8.4.1.6 Stockholm, Sweden
As one of the most climate conscious cities in the world, Stockholm has recently been
acknowledged for their dedication to the planet‟s wellbeing by being awarded the
European Green Capital for 2010. This award was based upon several criteria and
included competition from 35 other European cities. Climate change, local
transportation, green space, air quality, noise pollution, waste, water access &
wastewater treatment, sustainable land use and biodiversity measurements were all
taken into consideration.
Located along a mesh of islands in the southeast region of Sweden, Stockholm has
incorporated a new administrative system which has guaranteed that environmental
issues are incorporated into any budgetary and operational planning meetings among
City officials. This consistent environmental consideration has allowed the city to reduce
their carbon emissions by 25% per capita, since 1990. Furthermore, Stockholm has set
the bar high, striving to be fossil fuel free by 2050.
This long-term goal has become realistic due to the city‟s policies on district heating,
their effective and expansive public transportation system that operates on strictly
renewable fuel and their investment in electric vehicles and alternative fuels. This
district heating and cooling system operates through 4 major production plants, which
serves the whole city and is 80% renewable. Their public transportation system
contains a far-reaching metro line, with buses, boats, trams and light rail systems.
These systems account for nearly half of all journeys within Stockholm County.
Additionally, all new housing districts and commercial buildings are all designed with
environmental profiles, based on efficiency in location, transportation, water, waste and
energy. Stockholm‟s preference for bio-fuels over coal and oil has been another
positive action towards being fossil fuel free in the future.
Another positive factor in Stockholm‟s green focus is the congestion tax. This tax is
responsible for a 20% decline in inner city traffic and a 30-50% decline in travel times.

64
The tax is in effect Monday to Friday from 6am to 6pm and costs 1 or 2 Euros
depending on the time. Before its implementation, a majority of citizens were opposed
to it, but since its adoption the city has experienced nothing but positive outcomes.
These positives have instilled an increasingly climate conscious population, both in
individual homes and within businesses. It is becoming a point of pride for the city and
people are eager to improve the conditions in the region not just for today but for the
future as well. Nearly all households have received tips on ways to reduce their impact
and lower their personal carbon dioxide emissions.
It is actions of this nature that have allowed Stockhom to stand out as one of the
„greenest‟ cities in the world. In fact, it is so clean that it is safe to swim within the inner
harbor, something that is uncommon among many coastal cities.
8.4.1.7 Kelowna, British Columbia
Kelowna is a growing city, with a similar population profile to that of Lethbridge. In order
to meet with the provincial greenhouse gas reduction levels of 80% by 2050 as outlined
in Bill 44, Kelowna has been forced to take aggressive action towards reducing
greenhouse gas production in their operations. They have acknowledged the sources of
their emissions, with transportation, buildings and solid waste being responsible for
65%, 28% and 7%, of their overall greenhouse gas emissions respectively.
In order to reduce these emissions, the City has teamed up with senior governments,
local residents, businesses utility providers and external agencies to achieve a 33%
reduction of 2007 levels by 2020. The city is taking this on through a massive municipal
plan, which calls for mixed-use urbanist designs, multi-modal transportation and efficient
location selections.
Aside from the municipal planning side of emission reduction, Kelowna has also signed
on with several climate change initiatives including the Partners for Climate Protection
Program in 2001 and the Climate Action Charter in 2007. By participating in these
programs, Kelowna is showing a commitment to their environment, which is going to be
crucial for a city that has the second highest emissions per capita among British
Columbia‟s mid-sized cities.
Furthermore, due to a steadily growing population, it will be a challenge to maintain
emission reductions while expanding the city. The current population stood around
110,000 in 2007 and predictions have the 2020 population at over 140,000 people. With
these strains, Kelowna has produced a document of reduction strategies, with focus on

65
the three sectors of transportation, buildings and community solid waste. They are
currently emitting 243,643 tonnes of carbon dioxide equivalent due to natural gas and
an additional 7,590 tonnes of carbon dioxide equivalent as a result of electricity use.
Kelowna outlines reduction strategies, degree of implementation and estimated carbon
dioxide equivalent reductions. Some of these strategies include the introduction of
hybrid car models to replace older and more polluting vehicles, and the reduction in use
of SUVs, vans and light trucks (which stand as 44% of total passenger trips in the city).
Other more intense strategies call for the retrofitting and weatherproofing of homes.
Additional strategies include the implementation of district heating in the downtown core
as well as the collection of commercial food waste and the collection of methane gases
from landfills for electricity production. Another unique strategy for Kelowna is carbon
sequestration through the planting of mature and young trees in strategic locations,
which is estimated to reduce carbon emissions by nearly 7,000 tonnes.
8.4.1.8 Calgary, Alberta
Calgary, Alberta is located 200km north of Lethbridge and provides an effective local
comparison, with a similar geographic location, climate and provincial policies between
the two cities. In 2004, corporate greenhouse gas emissions were totaled at 442,300
tonnes. Calgary‟s corporate inventory in 2003 declared the goal of 50% below 1990
levels by 2012. This goal is being attempted with the help of a unique environmental
management system called EnviroSystem-ISO14001. This system allows a municipality
to implement, maintain, monitor and improve their environmental management. This
allows flexibility for municipalities based upon their specific goals, and it can operate
within the constraints of local policies and regulations.
Calgary has used this in addition to an automated computer data collection system
developed by their IT sector called Greenhouse Gas Emissions and Abatement
Tracking to track and report their corporate emissions. Calgary‟s emission reduction
framework focuses on buildings, fleet, streetlights, water and sewer operations and
unique areas such as employee travel. They have taken these focuses and highlighted
three major program initiatives: Energy Performance Contracting, EnviroSmart
Streetlight Retrofitting and LED Traffic Signal Replacement.
Energy Performance Contracting is a system for building renewal that uses utility
savings from new energy reducing installations to pay for the cost of the original
installation. They also have a guaranteed energy savings contract which obligates the
contractor to pay any differences if the energy savings do not equal original projections
made to the City. The Streetlight Retrofitting program aims to replace streetlights with

66
new energy efficient lighting systems. The City hopes that this program, along with the
LED Traffic Signal Replacements will reduce electricity consumption within the city.
These programs seem like small activities for such a large city, but the reductions will
become substantial as larger portions of the City‟s infrastructure are retrofitted
Other strategies proposed by the City include massive redevelopment and infill projects
near the city core. These planning projects have sprung up numerous condominiums
and new mixed-use developments as well as a current expansion of light rail train. The
hope is to change the suburban nature of Calgary and move to a denser, more compact
city center. This will hopefully result in less vehicle dependency and an increased
reliance on public transportation, bicycles and walking.
The City is also pushing for more community initiatives, bringing residents, businesses,
government and institutions together in order to tackle the problem on a city-wide scale.
Their philosophy is that the government can only do a limited amount as it requires a
holistic approach with many participants in order to achieve the desired goal. This will
include attempts by the City to spread knowledge and information to the public, with the
hope of changing mindsets toward emission reductions and to develop a climate
conscious public, similar to Stockholm.
In their actions over the years, Calgary has managed to receive several awards
including the 2006 Sustainable Community Award in the renewable energy category for
fromthe Federation of Canadian Municipalities. They also became the first city in
Canada to achieve the highest milestone in the Partners for Climate Protection
program, which is aimed at helping municipalities reduce greenhouse gas emissions.
They were declared a gold level reporter by the Voluntary Challenge Registry, which
attempts to recognize actions toward emission monitoring and reduction efforts. Calgary
was also the winner of the Alberta Emerald Foundations climate change award for their
demonstration of “outstanding environmental initiatives and leadership”.
Despite the declining corporate emissions within the City, it is the community emissions
that should become a focus now as they have been steadily increasing as the city
continues to grow. It is estimated that 54% of Calgary‟s fossil fuel use is for building
heating and vehicle use. Coal and natural gas are being used, and account for nearly
half of the city‟s emissions. Due to these numbers, the City is aiming to reduce
community emissions 20% below 2005 levels by 2020 and 50% below 2005 levels by
2050. These are important areas for Calgary in the future, as massive urban sprawl and
vehicle dependency has become a serious issue.

67
8.4.1.9 Halifax, Nova Scotia
Halifax is taking dramatic action to reduce greenhouse gas emissions. Within municipal
plans they have committed to emission reductions of twenty percent below 2002 levels
by 2012. They are aiming to achieve these goals through the use of the milestone
framework put forward by the Partners for Climate Protection. This includes five
achievements that help guide a municipality to reduce their emissions. These
“milestones” are as follows:
Create a greenhouse gas emissions inventory and forecast
Set a reduction target
Develop a local action plan for residents and businesses
Implement the local action plan
Measure progress and report results
Halifax is looking to achieve their reduction target through several techniques. Some
notable methods outlined in the corporate action plan include building audits, retrofits,
district energy systems, natural gas conversions, LED traffic lights, fleet downsizing,
anti-idling campaigns as well as water conservation measures. The majority of the City‟s
emissions are attributed to building heating & cooling (56%), water & sewage (26%),
streetlights (10%) and vehicle fleet (8%).
As Halifax has a steadily growing population, the reduction targets are expected to be a
challenging task due to growing residential, commercial and infrastructure needs but
City officials are confident they can be attained. As the City will be able to implement
new technologies for future infrastructure development and by using rational planning
techniques, they have the potential to become a well-recognized „green‟ community.
8.4.1.10 Kamloops, British Columbia
Kamloops is a city of 92,882 (2006) located in south central British Columbia along the
Trans Canada highway. Kamloops has a semi-arid continental climate. It experiences a
rain shadow effect, making its climate similar to that of Lethbridge, albeit slightly warmer
and drier. The City of Kamloops has recently developed a long-term sustainability plan
focused on balancing three aspects of a sustainable community: social, economic and
environmental sustainability. The City has completed its respective social and economic
sustainability plans, but as of the writing of this report, it has not yet completed its
environmental sustainability plan. Presently, the City of Kamloops has some general
ideas and a few specific targets on environmental sustainability and the reduction of
greenhouse gas emissions for its city, but a comprehensive plan has yet to be outlined.
However, the City of Kamloops has already completed a corporate and community
greenhouse gas inventory that, as a first step, will aid in the creation of a plan to reduce

68
greenhouse gas production. Some of the targets that Kamloops has outlined in order to
reduce its greenhouse gas production are summarized below.
Land
The City of Kamloops has made a number of targets in addressing land use throughout
the city, so as to reduce greenhouse gas emissions. Some of these targets include:
• Increase density of development (as measured by population density) by 25%
by 2050
• Manage overall growth of the urban area to achieve a rate of growth that is 50%
of the rate of population growth (i.e.- if population is growing by 10%, the urban
area should grow by a maximum of 5%)
• Allow a minimum overall density of residential developments in new
neighbourhoods of 25 units per hectare
• Increase the area contained in community gardens in Kamloops by 100% by
2020
• Increase the number of active farms in the Kamloops area
By increasing Kamloops‟ population density, the distance people have to drive (and
therefore greenhouse gas production) is reduced. Also, by increasing community
gardens and active farms in the Kamloops area, local food supply is increased, thus
decreasing the greenhouse gas emissions created by transport of food from other
locations.
Energy
Energy goals set by the City of Kamloops both for City operations and for the
community as a whole are listed below:
City Operations
• Use energy at City facilities that produces no greenhouse gas emissions by
2035
• Produce the equivalent of 10% of City energy needs through alternative energy
systems
(i.e.- solar, wind, etc.) by 2020
• Reduce consumption of fossil fuels for transportation by 25% by 2020
• Construct all new municipal buildings to equivalent of LEED gold standard
Community-Wide
• Decrease community energy use by 20% by 2020, and 50% by 2050 (using
2010 as the base year)

69
• Increase the number of LEED equivalent buildings in Kamloops to 30 by 2020
• Decrease summer-time per capita water consumption by 20% by 2020 and
50% by 2050 to reduce water pumping
The reduction of fossil fuel use is a target by the City of Kamloops to not only reduce
greenhouse gas production, but also to reduce the city‟s dependence on outside energy
sources, instead focusing on local energy production.
Solid Waste
Solid waste produces a considerable amount of greenhouse gas to the atmosphere
through methane production. Kamloops‟ targets for reduction of landfill waste are listed
below:
• Reduce solid waste landfilled to 0.3 tonnes per capita by 2020 (50% reduction)
• Reduce solid waste landfilled to 0.1 tonnes per capita by 2050 (85% reduction)
Transport
By encouraging alternative forms of transportation (i.e.- forms other than the single
occupant vehicle), the City of Kamloops plans to substantially reduce its total production
of greenhouse gases. The targets are outlined below:
• Increase to 30% the number of people using other modes of travel to
employment (including carpooling, transit, walking, cycling and other modes) by
2020
• Increase transit ridership by 50% (compared to base year of 2008) by 2020
• Reduce vehicle ownership to 0.6 vehicles per capita by 2020
• Increase spending on active transportation facilities and programs directed to
alternative modes of transportation (primarily cycling and walking) by 50%
• Increase the share of alternate fuelled motor vehicles by 200% by 2020 and
400% by 2050
Overall, the City of Kamloops has a relatively clear idea of what it wants to accomplish
with respect to reducing its greenhouse gas emissions. With a corporate and community
greenhouse gas inventory already accomplished and fairly specific targets set, much of
the groundwork towards greenhouse gas reduction has already been completed. The
City of Kamloops next step is to create a comprehensive plan to reduce greenhouse
gas emissions and appoint staff to carry out the plan.

70
8.4.1.11 Vancouver, British Columbia
Vancouver is a city of 578,041 with a metropolitan population of over 2.1 million. The
city is located in the lower mainland of British Columbia along the Pacific coast.
Vancouver has a moderate oceanic climate that results in much warmer weather than
Lethbridge, especially during the winter months, which are usually mild with relatively
little snowfall.
Over the past decade Vancouver has moved forward with a number of initiatives to help
it meet its ambitious greenhouse gas reduction targets. Vancouver has made
substantial progress in areas such as transportation, waste management, and energy
efficiency.
Vancouver‟s transportation plan is centered on the reduction of private vehicle travel
leading to an emphasis in improving other modes of transportation such as walking,
biking and public transit. Since the 1990‟s the City of Vancouver has aggressively
increased its pedestrian network and improved its cycling network with separated bike
lanes to ensure the safety of pedestrians and cyclists. Vancouver also has an extensive
public transit system that covers the metropolitan area 18-20 hours per day. This transit
system utilizes multiple modes of transport which include, the SeaBus, SkyTrain, and
buses.
Vancouver has also instituted an employee-commuting program to encourage City
employees to utilize more environmentally friendly modes of transportation. This
program involves incentives such as transit pass rebates, reserved parking for car-pools
and a guaranteed ride home program.
Besides its transportation plan, Vancouver is also attempting to reduce the amount of
solid waste being landfilled, via recycling and composting programs with the goal of
diverting 70% of its waste through these initiatives by 2015. Vancouver also has an
extensive composting program in which food waste and yard waste are collected from
households bi-weekly. Much of the City‟s emission reductions have come through the
landfill operations, where they have begun using methane gas to produce electricity.
Vancouver has also achieved a 20% emission reduction within municipal operations.
Future goals include achieving carbon neutrality by 2012, reducing community
emissions by 6% by 2012, 33% by 2020, and 80% by 2050. They are also hoping to
have carbon neutral buildings by 2030.
Another key area of Vancouver‟s strategy is increasing energy efficiency in buildings as
well as street lighting and signals. Over the years Vancouver has replaced almost
30,000 street lights with high pressure sodium bulbs which has reduced usage by 12.2

71
million kilowatt hours and generated savings of $700,000 annually. Vancouver has also
replaced 700 traffic signals with high efficiency LED diodes allowing the city to save
another $200,000 annually.
Vancouver is currently retrofitting all City-owned properties to become more energy
efficient and environmentally friendly. These retrofits include upgrading building
lighting, heating, cooling and ventilation systems as well as taking steps to reduce water
usage. These upgrades are expected to reduce electricity and natural gas use yielding
savings of $950,000 in electricity use while reducing greenhouse gas emissions by
3,290 tonnes. There is also a mandate that all new City facilities larger than 500 square
meters meet LEED gold standard.
In the past decade the city of Vancouver has established itself as a green leader not
only in Canada but in North America as well. In the Fall of 2009 Vancouver created the
“Greenest City Initiative” with the goal of becoming the greenest city in the world by
2020. To this end the City commissioned a climate action plan called “Vancouver 2020:
A Bright Green Future Action Plan”. This action plan outlined three major objectives: a
green economy, greener communities, and human health.
Through its Action Plan, the City of Vancouver has a greenhouse gas reduction target of
33% below 2007 levels by 2020 and 80% by 2050 as well as committing to becoming
fossil fuel free by 2040. Vancouver has already reduced its greenhouse gas emissions
to 1990 levels and is on track to meeting the Kyoto Protocol target of 12% below 1990
levels by 2012. As of 2009 Vancouver has a per capita emissions total of 4.6 tonnes
per person ranking third in the world for lowest emissions per capita behind
Copenhagen and Stockholm.
The City of Vancouver has shown its commitment to becoming more environmentally
friendly by reducing greenhouse gas emissions through a number of initiatives ranging
from transportation to waste management. If it continues on its current course
Vancouver may very well meet its target of becoming the greenest city in the world by
2020.
8.5 Barriers to GHG Reduction
The link between greenhouse gas emissions and climate change is well accepted in the
scientific community. Much of the prominent research that has been prepared for public
distribution from organizations such as the Inter-governmental Panel on Climate
Change has provided evidence that the planet and all life on the planet may eventually
be radically altered as a result of anthropogenic caused climate change. In some

72
political arenas, climate change has been taken as a serious threat to human wellbeing
and a corresponding level of effort is being directed at addressing the issue in a
constructive manner. Yet in other regions, greenhouse gas emissions appear to be
largely ignored. It is as if there are either barriers to understanding climate change
science, or alternatively, viable methods of addressing the issue for certain regions
have not been discovered.
One of the purposes of this report is to raise the awareness of climate change issues
and greenhouse gas emissions within the City of Lethbridge corporation as a catalyst to
formulating both a corporate and community response. However, it is acknowledged
that knowledge and awareness alone may not be sufficient to initiate a viable public
policy response. Many public sector programs aimed at reducing greenhouse gas
emissions have been information intensive. Programs have been developed to promote
awareness and attitude change; however these programs do not always result in
behavioural change. Garrett Hardin provides an example of human behaviour that
rewards individual conduct at the expense of society as a whole in his article „Tragedy
of the Commons‟ (JAPA 1960). Hardin uses the example of a common pasture that is
being overgrazed. Clearly, from a community perspective it is not beneficial to add
additional cattle to an overgrazed common pasture, but it is viewed as a benefit to each
individual farmer to release another cow into the pasture. Hardin‟s article explains why
in many instances, individual behaviour results in the exploitation of other commons,
such as air, water or natural resources.
Current individual behaviour and weak public policy regarding anthropogenic
greenhouse gas emissions at times mirrors the insights provided by Hardin.
Anthropogenic greenhouse gas is a byproduct for which there is no economic value.
Byproducts with no economic value are commonly viewed as waste. Waste in most
cases is an economic liability. For example, sawdust from sawmills or intestines from
packing plants when considered as waste, become an economic cost, as operators
must pay for their disposal. Greenhouse gases however, escape easily into the
atmosphere, therefore there is little if any direct economic costs associated with their
disposal. Both sawdust and cattle intestines however can have economic value as
others utilize the byproducts to produce particleboard and pet food respectively.
Unfortunately, there is little value associated with greenhouse gases as a byproduct,
therefore inexpensive atmospheric disposal is preferred by many individuals and
businesses.
Unfortunately, the full economic costs associated with greenhouse emissions to not
accrue directly to the individual emitter. For example, rising sea levels in the Maldives,
which may be totally submerged, are not likely to be absorbed as a production cost by

73
electrical producers in Alberta or as a gas surcharge on a commuter in Lethbridge. The
costs associated with climate change are also not solely economic. The impending
submergence of the Maldives provides an example of the social and environmental
costs associated with greenhouse gas emissions as an entire culture and ecosystem
will be damaged.
The United Nations has developed a full-cost accounting method for including all costs
associated with human activity. The Triple Bottom Line attempts to provide a
framework in which the social, environmental and economic costs are included in
decision making in both the private and public sectors. For example, in the local
context, the economic costs associated with alternative electricity from solar or wind
generation often outweighs consideration of the social and environmental costs.
Economic costs are often easier to measure than environmental and social costs.
Direct and immediate budgetary decisions commonly trump long-term social and
environmental impacts that may occur in a distant region. Negative externalities that
accrue immediately to the originator are more likely to be noticed and acted upon.
Potential solutions to climate change issues are often presented as a lose-lose
discussion; either catastrophic environmental damage is about to occur (coastal city
inundation) or alternatively, humans must downsize their quality of life (driving less or
living in smaller homes). In abstract discussion, there is general agreement that long-
term environmental damage to life support systems is unacceptable. But for most, it
appears that reductions in short-term quality of life are equally, if not more, undesirable.
Recently the Federal Government‟s Roundtable on the Environment and Economy
released educational material to assist in the explanation of climate change implications
for Canada. Canada, may actually receive some benefits from climate change, in terms
of warmer temperature and longer growing seasons. Ironically, the title of the Canadian
webpage is Climate Prosperity. Although there may appear to be some benefits to
Canada (such as extended growing seasons), the overall costs to the planet are not
positive.
The issue of climate change has recently garnered popular public attention with such
productions as “An Inconvenient Truth”. Climate change has also become a cause for
concern among countries around the world, especially underdeveloped southern
countries that are expected to bear many of the negative issues associated with climate
change. Ironically, these highly populated and under-developed nations are being
asked by developed countries to curtail their standard of living increases more than
developed nations as a means to slow global climate change.

74
In recent times, scientists have become interested in global warming, due to mankind‟s
impact on the climatic system, through the enhancement of the natural greenhouse
effect. As scientific reports have been published, the notion of possible human-induced
climate change has broadly penetrated the public realm and has vastly increased public
awareness of the possibility of climate change. Throughout the years, national
governments have attempted to deal with this issue by signing international agreements
such as the Kyoto Accord to try and reduce the production of greenhouse gases.
However, such efforts have so far been largely ineffective. Even as governments enact
policies to deal with this threat, the average individual is still largely ignorant of the
effects of global warming and even less willing to participate in solutions. Despite this
publicity, methods to reverse or slow climate change have been largely ignored by the
general public. Further, haphazard implementation by policy makers has allowed the
concentration of greenhouse gases in the Earth‟s atmosphere to continue to increase.

75
PART 3: CITY OF LETHBRIDGE – GREENHOUSE GAS
EMISSION ANALYSIS
9.0 Study Methodology
As part of the initial data collection process for this project, it was decided to collect
information from 1990 and 2009. We chose to gather information from 1990 because
the Kyoto Accord targets reduction goals against 1990 greenhouse gas emission levels
therefore, this would give Lethbridge a relevant benchmark to assess its greenhouse
gas emissions. The year 1990 has been utilized as a benchmark for most international
initiatives and is a common benchmark at the local level. Although 1990 was targeted
as one of the data dates, it was discovered that the required information for this period
would be difficult to access. Most of the 1990 data was not in digital form and required
a significant amount of effort in both searching and aggregation. The only 1990 data
that was easily available was for natural gas, fleet fuel consumption and employee
travel. Resource and time limitations for this report led to a decision to focus only on
2009 data.
As previously mentioned, the Inter-governmental Panel on Climate Change (IPCC) is an
international body set up for the sole purpose of studying climate change. One of tasks
of the IPCC is to produce assessment reports on the state of climate change. Before
being published, these assessment reports are reviewed extensively by experts and
governments, making these reports highly credible sources. The global warming
potential coefficients used in this greenhouse gas inventory were obtained from the
2007 IPCC Fourth Assessment Report. See Figure 7.0.
9.1 Data Identification and Organization
The organization of data for this report is in accordance with the Greenhouse Gas
Protocol. The Greenhouse Gas Protocol (GHG Protocol) is the most widely used
international emissions accounting tool for government and business and is used to;
quantify and manage greenhouse gas emissions. A partnership between the World
Resources Institute and the World Business Council for Sustainable Development has
facilitated the use of the Greenhouse Gas Protocol with businesses, governments, and
environmental groups around the world.
The Greenhouse Gas Protocol serves as the foundation for most greenhouse gas
inventory standards and programs in the world, such as the International Standards
Organization and The Climate Registry.
The Greenhouse Gas Protocol initiative was developed when the World Resources

76
Institute and World Business Council for Sustainable Development recognized that an
international standard for corporate GHG accounting and reporting would be necessary
in light of evolving climate change policy.
The Greenhouse Gas Protocol identifies 3 levels of data collection for inventory
purposes. Scope 1 data includes greenhouse gases generated directly by the City of
Lethbridge operations and as a result are largely related to energy demands such as
natural fossil fuel combustion for building heat and vehicle mobility. However, the City
also uses hydrofluorocarbons in building cooling equipment and sulfur hexafluoride, for
cooling high-voltage electrical equipment. Both of these chemicals can be released to
the atmosphere as a result of equipment malfunctioning. Scope 2 data includes
greenhouse gases that are produced by a third party who supply energy to the City,
such as electricity. The final section, Scope 3, identifies greenhouse gases produced
by a third party who supplies products and services to the City. For example, capital
assets such as computers, vehicles and buildings all release greenhouse gases during
their production and delivery to the City. Scope 3 sources also includes employee
commuting as the employer can influence commuting distances through work site
location. The greenhouse gases associated with Scope 3 products and services are
much more difficult to identify than Scope 1 and 2 sources.
9.2 Greenhouse Gas Emission Calculation Method
Most of the emission factors used to calculate greenhouse gas production in this report
were acquired from Environment Canada. Environment Canada derived the emission
factors out of data obtained from Statistics Canada (2007). See Appendix 1. The
emission factors are quite detailed. For example, emission factors for the year 2008
were used to calculate greenhouse gas emissions from electricity purchases and
natural gas combustion. Factors were obtained that explicitly calculated the amount of
greenhouse gases produced by Alberta through its methods of electricity and natural
gas generation, versus a province like British Columbia, which relies heavily on hydro-
electricity.
To calculate greenhouse gas production with respect to employee transportation and
City-provided public transportation, vehicles were placed into categories as defined by
Environment Canada: light-duty gasoline vehicles, light-duty gasoline trucks, heavy-duty
gasoline vehicles, gasoline motorcycles, light-duty diesel vehicles, light-duty diesel
trucks and heavy-duty diesel trucks, etc. “Tier 1” or “moderate control” emission
categories (as defined by Environment Canada) were used, as they represent vehicle
model years from 1995 and newer. In this case, it was assumed that the majority of
vehicles driven by City employees would fall into this model year range. The average
electricity consumption of electric automobiles and electric motorcycles was acquired

77
from Transport Canada. This electricity production was then converted to greenhouse
gas emissions via coefficients obtained from Environment Canada.
Limitations of this method of emissions calculation are present in employee
transportation. As was mentioned, it was assumed that employee vehicles would
encompass the model years of 1995 to present. However, it would be reasonable to
assume that a minority of employee vehicles would be older than a 1995 model year.
Also, as time and resources did not allow for the collection and analysis of specific
details about vehicles, vehicles were separated into the aforementioned groups (as
defined by Environment Canada).
10.0 Sources of Lethbridge Corporate Greenhouse Gas Emissions
The following inventory of greenhouse gas production by the City of Lethbridge is
presented in three phases. Scope 1 identifies greenhouse gases that are directly
generated on-site by City of Lethbridge operations. On-site generation includes fuel
sources such as natural gas that are combusted for building heat. Scope 2 identifies
indirect greenhouse gas that is produced by a third party who supplies energy to the
City. For example, the purchase of electricity for lighting buildings releases greenhouse
gases through the combustion of coal at electrical generating plants. Finally, Scope 3
attempts to identify less obvious sources of greenhouse gas that is created indirectly by
the City through the purchase of products, supplies and employee commuting.
10.1 Scope 1 Direct Greenhouse Gas Emissions
In accordance with the Greenhouse Gas Protocol, Scope 1 greenhouse gas sources
are defined as those greenhouse gases directly created by the City of Lethbridge
through activities such as burning fossil fuels to heat buildings, operate machinery and
vehicles or the release of refrigerants during the maintenance of air conditioners.
10.1.1 Building Space Heating
The City of Lethbridge is responsible for the operation of over 300 buildings. These
buildings have significant variation in size and type. They are organized based on their
classification. These divisions are as follows:
Administration
These buildings include the core office structures, (City Hall and the Stafford Center)
which have a combined size of nearly 13,000 square meters.

78
Electric Operations
These are buildings that are central to the electrical production for the city, which are
composed of several substations and storage buildings. Their combined total is
approximately 2,000 square meters.
Environmental Treatment Facilities
These comprise numerous protection facilities including wastewater treatment
plants, sewage facilities and other maintenance buildings. Electrical demand for
running pumps is included in the calculations. The combined size of these buildings
is nearly 15,000 square meters.
Fire Department
These are all buildings involved with fire services in Lethbridge. They have a total
size of roughly 7,500 square meters.
Waste & Recycling Services
These facilities largely revolve around landfill services for the city, with a total size of
just over 2,000 square meters.
Police Services
Includes police headquarters and rifle range, with a size of nearly 7,000 square feet.
Public Operations/Miscellaneous
These buildings include vehicle storage, mechanical shops andmiscellaneous
buildings that don‟t have a clear classification. These have significant size with a
total of roughly 25,000 square meters.
Storm Water Facilities
Buildings involved in storm water services. These are small size pumping stations,
with a total of 43 square meters.
Transit
Transportation fleet storage facilities for public transportation. Total size of 8,000
square meters.
Water Treatment
Facilities involved in the water treatment services for Lethbridge. Buildings include
pump houses, water treatment centers and reservoirs. Electrical demand for
running pumps is included in the calculations. Total size is near 15,000 square
meters.
79
Other
Remaining buildings include aquatic centers, cemeteries, the Japanese gardens,
cultural facilities and galleries, parks, and Henderson golf club.
In total, the City purchased 204,710 gigajoules of natural gas for use in buildings and
plant equipment. It is calculated that the combustion of natural gas created 10,523
tonnes of carbon dioxide, 0.203 tonnes of methane and 0.192 tonnes of nitrous oxide.
10.1.2 Building Space Cooling
The City cools the air in a number of buildings or portions of buildings during warm
weather. It is assumed that the refrigerant used for building cooling contains
hydrofluorocarbon. The total amount of refrigerant used is unknown, as this data is not
collected by the City. During maintenance activities and as a result of leaking seals,
Hydrofluorocarbon can be released into the atmosphere. Again, data is unavailable
however the Greenhouse Gas Protocol suggests that fugitive emissions may be in the
order of 1-5% per year (2005)
The City operates six artificial ice sheets. The ice sheets utilize an ammonia system for
cooling and are not a direct source of greenhouse gas, however, the production of
ammonia does create greenhouse gases, and would be included in the Scope 3 section
of this report.
10.1.3 Vehicle Fleet (excluding Transit)
The City of Lethbridge operates a varied vehicle fleet that includes, cars, trucks, heavy
equipment and miscellaneous hand equipment such as lawn mowers and leaf blowers.
In 2009, the City of Lethbridge used a total of 1,563,616 liters of fuel, of which 635,316
liters were gasoline and 928,300 liters were diesel. The gasoline fuel emitted 1,454
tonnes of carbon dioxide, 0.083 tonnes of methane, and 0.159 tonnes of nitrous oxide.
The diesel emitted 2,472 tonnes of carbon dioxide, 0.130 tonnes of methane and 0.076
tonnes of nitrous oxide.
10.1.4 Transit
The City has 42 buses in the public transit fleet. The City also operates a yellow school
bus fleet, and a handi-bus system (20 vehicles). In 2009, the transit fleet recorded over
3,000,000 km of travel for the 42 public transit buses and consumed just over 1,500,000

80
liters of diesel fuel. In addition, transit consumed 246,000 litres of gasoline. The
combustion of gasoline fuel created 563 tonnes of carbon dioxide, 0.031 tonnes of
methane and 0.061 tonnes of nitrous oxide. The diesel fuel emitted 4129 tonnes of
carbon dioxide, 0.21 tonnes of methane and 0.127 tonnes of nitrous oxide. Table
10.1.4 provides a summary of the fuel used by both fleet and transit in 2009.
Table 10.1.4 Gasoline and Diesel Consumption, 2009
Gasoline (litres) Diesel (litres)
Fleet 635,316 928,300
Transit 246,022 1,550,515
Total 881,338 2,478,818
10.1.5 Wastewater Treatment Plant
The City of Lethbridge owns and operates a state-of-the-art wastewater treatment plant.
The plant provides a secondary treatment system, incorporating biological nutrient
From Boning, 2006
removal into an activated sludge treatment process. Wastewater effluent is also
disinfected with ultraviolet light. This entire process exceeds Alberta Environment
guidelines for the reduction of nutrients that could impact downstream water quality. The
plant has the capacity to treat 49,000 cubic metres of sewage per day and currently

81
treats approximately 14 million cubic metres per year (approximately 75% of capacity).
The wastewater treatment plant in Lethbridge also has a cogeneration system built into
the process to increase the self-sufficiency of the plant and decrease methane and
carbon dioxide emissions from flared digester gas.
City of Lethbridge wastewater treatment plant data for 2009, shows that the plant used
a total of 11,014,319 kW of electricity. Of this total, 5,587,572 kW of the electricity used
was imported from the power grid but almost half, or 5,426,746 kW, of the total was
generated on site via the plant‟s cogeneration system. The wastewater treatment plant
produced 4,864 tonnes of digester gas in 2009. Data indicates that 1,811 tonnes of the
digester gas produced in 2009 was flared (i.e. burned and directly released into the
atmosphere). However, through the wastewater treatment plant‟s cogeneration system,
1,436 tonnes of the digester gas produced was used for on-site power generation and
1,617 tonnes for boiler fuel. The wastewater treatment plant imported a total of 379
tonnes of natural gas in order to fuel the boilers when there was not enough digester
gas present to do so. See Table 10.1.5.1.
Table 10.1.5.1 Wastewater Energy Sources, 2009
The calculation of greenhouse gas global warming potential for the wastewater plant
has been estimated for this report, based on annual average digester gas composition.
Digester gas is either flared to the atmosphere, used as boiler fuel or combusted in an
internal combustion engine to produce electricity. Theoretically, the combustion of
methane produces 2.74 kg of carbon dioxide for each kilogram of methane that is
burned. However the amount of greenhouse house gas emissions released to the
atmosphere is not self-evident for several reasons.
Total
Imported
Power (kW)
Total Power
Generated
(kW)
5,587,572 5,426,745
Total
Digester
Gas
Generated
(tonnes)
Total Digester
Gas Flared
(tonnes)
Total Digester
Gas Cogenerated
(tonnes)
Digester Gas
Boiler Flow
(tonnes)
Total Natural
Gas Used
(tonnes)
4,864 1,811 1,436 1,617 379

82
First, the digester gas produced at the wastewater plant is not 100% methane. Digester
gas is typically composed of methane, carbon dioxide and traces of nitrogen, oxygen,
hydrocarbons, ammonia and hydrogen sulphide. The composition of digester gas can
vary based upon the composition of the input sewage. An annual average methane
proportion of 58% is estimated to be within the digester gas produced at the City of
Lethbridge wastewater plant. Secondly, complete combustion of methane rarely occurs
by simple flaring or as fuel in an internal combustion engine. Finally, during the
decomposition process, fugitive methane releases to the atmosphere occur at the plant
from vents, valves, outdoor processing tanks, and other potential sources.
Table 10.1.5.2 Estimated Greenhouse Gas Emissions from Wastewater Treatment
Digester Gas
Digester Gas
(tonnes)
Carbon Dioxide
(tonnes)
Methane (tonnes) Nitrous Oxide
(tonnes)
Carbon Dioxide
Release during
Purification &
Combustion
1,653 -
Carbon Dioxide
Release from
Methane
Combustion
7,730 Trace
Fugitive Emissions Unknown Unknown Trace
Total* 9,383 Unknown Trace
*Total emissions may be greater than shown since the amount of unburned methane
released during the combustion process is unknown
As a benchmark, methane is the primary combustion component in natural gas. On
average, methane constitutes 85% of natural gas composition. Biogas, which is created
by decomposition of organic material through anaerobic digestion in landfills or
wastewater plants, can contain methane quantities of 50-75%. Digester gas from
wastewater treatment plants typically contains 60-70% methane and 30-40% carbon
dioxide. Trace substances from 0-3% are found in digester gas and include nitrogen,
oxygen, hydrocarbons, ammonia and hydrogen sulphide (Boning, 2006). Purification
techniques are required before the digester gas from a wastewater plant can be
combusted in an engine.

83
For the purposes of this report, it is calculated that 58% of the Lethbridge wastewater
treatment plant digester gas is methane and 34% is carbon dioxide. Other non-
greenhouse gas substances represent 8%. The identification of composition of the
wastewater gas are data from digester gas scrubbers. The resultant greenhouse gas
emissions are presented in Table 10.1.5.2
10.1.6 Solid Waste
The City of Lethbridge offers municipal solid waste disposal to all of its residents and
businesses at the Lethbridge Waste and Recycling Centre. Since 1985 over two
million tonnes of waste has been disposed of at the site, making it one of the largest
landfill sites in Southern Alberta. In addition to receiving all of the municipal solid waste
from the City of Lethbridge, waste from the County of Lethbridge is also deposited at the
landfill. The landfill is currently accumulating waste at an approximate rate of 120,000
tonnes per year, which equates to a yearly amount of 1,237kg per citizen. With a
national average of 971kg per person, the Lethbridge area (City and County) appears to
be disposing of solid waste at a very high rate.
The landfill offers a recycling program, solid waste bailing (to reduce the damaging
effects of local winds), a citizen‟s drop-off area, and a hazardous waste disposal
system. Currently there is no methane capturing system in place; however there has
been money allocated in the Capital Improvement Plan for 2014/2015 to install a gas
management infrastructure.
In addition to the City of Lethbridge Landfill, there are two closed landfill sites (Northside
landfill and Centerside landfill) that are owned by the City. These closed landfills are
still producing greenhouse gas emissions as the waste decomposes. All three of these
sites will be included in the inventory for City of Lethbridge solid waste greenhouse gas
emissions.
Operating Site Emissions – Lethbridge Waste and Recycling Centre
The Lethbridge Waste & Recycling Centre is located on 28th Street North approximately
7km north of 26th Avenue North. The greenhouse gas emission data for this open site
were provided by the City of Lethbridge directly from a report that was prepared in 2009
for Environment Canada.
The total greenhouse gas emissions from the open site are primarily carbon dioxide and
methane, with a small amount of nitrous oxide. The actual sources of greenhouse gas
are decomposition of landfill material, decomposing biomass from yard waste material
and the combustion of fossil fuel associated with on-site equipment. Data provided by

84
the City indicates that the greenhouse gases created by all activities on the landfill total
8176 tonnes of carbon dioxide, 2725 tonnes of methane and 0.28 tonnes of nitrous
oxide.
Closed Site Emissions
The Northside Landfill was operated prior to 1972 and is located west of Stafford
Avenue between Stafford Road and 26th Ave North. Based on a landfill characterization
study conducted in October 2000, it is estimated that 2.5g of methane/m2 a day, and
27.3g carbon dioxide/m2 a day are being generated at this landfill daily. (personal
correspondence with City of Lethbridge) This equates to 4,515 tonnes of carbon
dioxide equivalent emitted per year.
The Centersite landfill was operated from 1961-1970 and is located west of 7th Street
North, between 4th Ave North and Crowsnest Trail. Based on a landfill characterization
study conducted in October 2000, 0.12g of methane/m2 a day and 24.3g of carbon
dioxide/m2 a day are being generated daily, (personal correspondence with City of
Lethbridge). This equates to 183 tonnes of carbon dioxide equivalent per year.
Table 10.1.6 Landfill Generated Greenhouse Gas
Carbon
Dioxide
(tonnes)
Methane
(tonnes)
Nitrous Oxide
(tonnes)
Carbon
Dioxide
Equivalent
(tonnes)
Lethbridge
Waste &
Recycling
Centre
8,176 2,725 0.28 76,384
Northside 1,365 126 0 4,515
CentreSite 163 0.8 0 183
Total 9,704 2,852 0.28 81,082
10.1.7 Wood Combustion
The City provides wood for campfires in selected parks. In 2009, 30 cords of wood
were purchased for campfire use. The combustion of campfire wood is estimated to
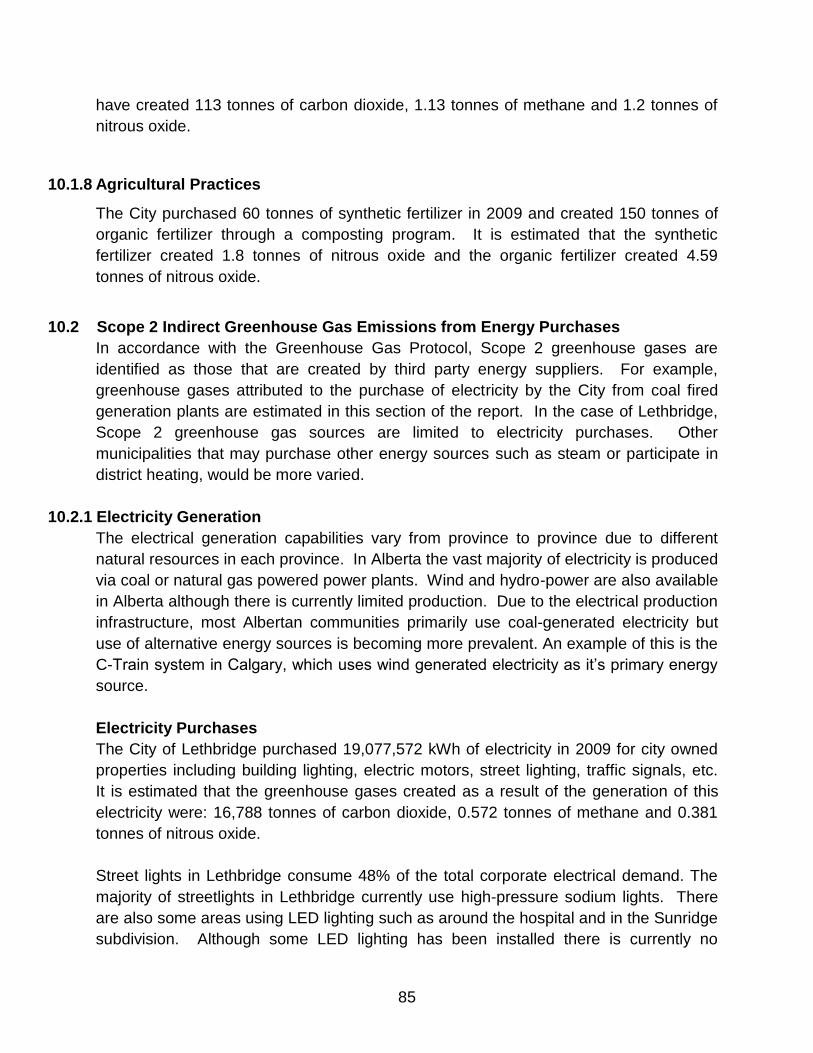
85
have created 113 tonnes of carbon dioxide, 1.13 tonnes of methane and 1.2 tonnes of
nitrous oxide.
10.1.8 Agricultural Practices
The City purchased 60 tonnes of synthetic fertilizer in 2009 and created 150 tonnes of
organic fertilizer through a composting program. It is estimated that the synthetic
fertilizer created 1.8 tonnes of nitrous oxide and the organic fertilizer created 4.59
tonnes of nitrous oxide.
10.2 Scope 2 Indirect Greenhouse Gas Emissions from Energy Purchases
In accordance with the Greenhouse Gas Protocol, Scope 2 greenhouse gases are
identified as those that are created by third party energy suppliers. For example,
greenhouse gases attributed to the purchase of electricity by the City from coal fired
generation plants are estimated in this section of the report. In the case of Lethbridge,
Scope 2 greenhouse gas sources are limited to electricity purchases. Other
municipalities that may purchase other energy sources such as steam or participate in
district heating, would be more varied.
10.2.1 Electricity Generation
The electrical generation capabilities vary from province to province due to different
natural resources in each province. In Alberta the vast majority of electricity is produced
via coal or natural gas powered power plants. Wind and hydro-power are also available
in Alberta although there is currently limited production. Due to the electrical production
infrastructure, most Albertan communities primarily use coal-generated electricity but
use of alternative energy sources is becoming more prevalent. An example of this is the
C-Train system in Calgary, which uses wind generated electricity as it‟s primary energy
source.
Electricity Purchases
The City of Lethbridge purchased 19,077,572 kWh of electricity in 2009 for city owned
properties including building lighting, electric motors, street lighting, traffic signals, etc.
It is estimated that the greenhouse gases created as a result of the generation of this
electricity were: 16,788 tonnes of carbon dioxide, 0.572 tonnes of methane and 0.381
tonnes of nitrous oxide.
Street lights in Lethbridge consume 48% of the total corporate electrical demand. The
majority of streetlights in Lethbridge currently use high-pressure sodium lights. There
are also some areas using LED lighting such as around the hospital and in the Sunridge
subdivision. Although some LED lighting has been installed there is currently no

86
program in place to convert high-pressure sodium lights to the more energy efficient
LED lighting.
There are 12,489 street lights in the City of Lethbridge with wattage ranging from 70 to
1000 watts. It was calculated that the annual demand for street light electricity is
9,150,249 kWh. See Table 10.2.1
Table 10.2.1 Street Light Electricity Demand
Number of Streetlights Streetlight Wattage Streetlight kWh Annual
Demand
620 70 244,404
6,413 100 3,286,405
655 150 464,761
2,851 200 2,584,887
1,440 250 1,589,414
461 400 781,422
49 1,000 198,952
TOTAL 12,489 9,150,249
The annual demand for street light electricity has been estimated by calculating the
number of hours associated with the dusk to dawn lighting program employed by the
City. This program utilizes light sensitive sensors to turn streetlight circuits on and off
based upon ambient light conditions.
The City of Lethbridge currently uses 9,150,249 kWh of electricity for their street lights,
which equals 48% of all electricity purchased by the city. Street lighting is therefore
responsible for generating 8,052 tonnes of carbon dioxide, 0.275 tonnes of methane
and 0.183 tonnes of nitrous oxide.
In addition to street lights the City of Lethbridge also possesses a number of street
signals. The City recently converted street signals from incandescent bulbs to light
emitting diodes (LED). This has resulted in a decrease from 4 amps to 0.5 amps per
light bulb.

87
10.3.0 Scope 3 Indirect Greenhouse Gas Emissions from Product and Service
Purchases
Scope 1 data includes greenhouse gases generated by the City of Lethbridge
operations on-site and as a result are largely related to energy demands. Scope 2 data
includes greenhouse gases that are produced by a third party who supply energy to the
City. The final section, Scope 3, identifies greenhouse gases produced by third parties
who supply products and services to the City. For example, capital assets such as
computers, vehicles and buildings all release greenhouse gases during their production
and delivery to the City. Scope 3 protocol also allows for the inclusion of employee
commuting as the location of the workplace in relation to workforce and alternative
modes of transport impacts the generation of greenhouse gas. The greenhouse gases
associated with Scope 3 products and services are much more difficult to identify than
Scope 1 and 2 sources.
10.3.1 Equipment, Product and Supply Purchases
Product and Service Purchases
Time limitations for this report and the considerable energy required to identify all
product and services purchases made by the City, limited the discussion of Scope 3
emissions. In the event that all product and service purchases can be identified,
considerable resources will be required to determine the emissions associated with
each purchase. For example, product purchases would include emissions associated
with the production of vehicle fuels, office supplies, pavement and concrete, building
construction, etc.
Electronic Equipment
Through the production of telephones, cell phones, computers and personal electronics,
there are quantities of greenhouse gases being produced. Fossil fuel energy sources
used for the production of these goods generate carbon dioxide, methane and nitrous
oxide. However, sulfur hexafluoride is also produced, usually from semi-conductor
production and the practices of aluminum industries. Despite the fact that these
products create a substantial amount of greenhouse gases, they cannot be included
within this study. This is due to time limitations that prevented data collection and the
fact that these product types were produced external to the City of Lethbridge, making it
difficult to trace the associated greenhouse gas generation.

88
Solvents and Cleaners
Due to insufficient information from Canadian sources, the information for this section
came from greenhouse gas inventories conducted by the United States and the
Netherlands for the period from 1990 - 2008. In both of these documents it was
reported that the amount of greenhouse gas emissions produced by cleaners and
solvents represented only 0.1% of total greenhouse gas emissions. The majority of
greenhouse gas emissions from this source consist of nitrous oxide, which is used as a
propellant in aerosol products. The City of Lethbridge does not currently keep track of
possible emissions of greenhouse gases from the use of solvents and cleaners. Due to
the relatively low contributions from this source, it should not be considered a priority.
10.3.2 Business Travel
The City of Lethbridge generates greenhouse gases through employee travel
associated with transportation modes not owned by the City. These transportation
modes can include: employee vehicles used for work trips, air travel, cabs, rental cars
etc.
Business travel data for 2009 was obtained from the City of Lethbridge. However, only
business travel associated with City employees using personal vehicles for work trips
within the city was obtained. The source for these data was mileage expense claim
forms submitted by employees. In 2009, employee personal vehicle travel totaled
355,543 kilometers. Based upon an average fuel consumption of 10.64 liters/100km, it
is estimated that 37,830 liters of gasoline were used (Clean Air – Cool Planet
Calculator). The combustion of this fuel created 86 tonnes of carbon dioxide, 0.006
tonnes of methane and 0.006 tonnes of nitrous oxide.
Table 10.3.2 Business Travel by Personal Vehicle
Total (l/100km)
Kilometres 355,543 10.64
Gasoline
(L) 37,830
Data for business travel using airplanes, taxis rental cars and public transit outside of
Lethbridge would normally be included in the Scope 3 analysis. However, this data was
not available.

89
10.3.3 Employee Commuting
The City of Lethbridge corporate work activities operate from a number of locations
throughout the city. The majority of employees are based in central locations such as
City Hall, the Regional Police Station and the Public Operations area. A smaller
number of employees are based in dispersed locations such as fire halls and ice areas.
To determine the greenhouse gas generated by City employees, a survey was sent to
all City employees with email addresses in February 2010 with specific questions about
their commuting distances and mode of transportation. Those employees who did not
have email addresses were provided with a hardcopy of the questionnaire by their
supervisor.
The survey results provided information on the commuting behaviour of 343
respondents. The results from the survey were then extrapolated to represent the
commuting behaviour of 1,235 employees. See Table 10.3.3.1
The total number of employees was calculated to be: full time and part time employees
as represented in the commuting survey response, plus an allowance for seasonal
employment over the summer months. Seasonal employees were included at 0.33 of
full time equivalent.
Table 10.3.3.1 Employee Commuting Distances and Transportation Mode
Transportation
Mode
Commuting
Kilometers
% of
Commuting
Kilometer
Fuel
Consumption
Factor
litres/100km
Total Fuel
Consumption
(litres)
Gasoline Car 2,152,081 70.86 9.2 197,191
Gasoline Truck 648,722 21.36 12.8 83,036
Diesel Car 53,452 1.76 7.4 3,955
Diesel Truck 86,253 2.84 12.0 10,350
Hybrid Car 1,518 0.05 1.4 21
Gasoline
Motorcycle
26,118 0.86 5.5 1,436
Electric Scooter 911 0.03 0.8 7
Transit, Walk,
Bike or Carpool
Passenger
2.24 0.0 0
Total 3,037,090 100 - -

90
The dominant form of commuting transport for city employees is the gasoline powered
car. The second most popular form of commuting is via gasoline powered truck. The
third most popular choice is by diesel truck. The top three modes of transport are
responsible for over 90% of all km‟s travelled during employee commutes.
Total use of alternative transportation modes such as transit, walking, bicycling or
carpooling represent a modest number, accounting for less than 3% of commuting
distance. Of the 343 survey respondents, only 30 respondents reported walking as part
of their commute and only 46 respondents used a bicycle for some portion of their
commute.
Based on this information, it is clear that gasoline and diesel powered cars and trucks
are the dominant transport methods for employees, with a very small portion using
walking, bicycles, public transportation or other “greener” methods. The average
distance traveled by a city employee based on our results is 13km one way. This means
that on average employee is commuting a total of 26km per day to and from work with
most trips are being done via fossil fuel powered vehicles. With these types of distances
being traveled, emissions from fuel consuming vehicles are significant as most
employees commute via greenhouse gas emitting vehicles.
Table 10.3.3.2 Greenhouse Gas Generation from Employee Commuting
Transportation
Mode
Total Fuel
Consumption
(litres)
Carbon
Dioxide
Methane Nitrous Oxide
Gasoline Car 197,191 451 0.024 0.031
Gasoline Truck 83,036 190 0.011 0.021
Diesel Car 3,955 10 0.000 0.001
Diesel Truck 10,350 27 0.001 0.002
Hybrid Car 21 0 0.000 0.000
Gasoline
Motorcycle
1,436 3 0.002 0.001
Electric Scooter 7 0 0 0
Transit, Walk,
Bike or Carpool
Passenger
0 0 0 0
Total - 681 0.038 0.056

91
10.4 Summary of Total Corporate Greenhouse Gas Emissions
Table 10.4.1 Summary of City of Lethbridge Greenhouse Gas Emissions 2009
(tonnes)
Carbon
Dioxide
Methane Nitrous
Oxide
Purfluoro-
carbon
Hydrofluoro-
carbon
Sulfur
Hexafluoride
CO2e
Scope 1 Direct Greenhouse Gas Emissions
Natural Gas 10,523 0.203 0.192 Not
Applicable
Not Applicable Not Applicable 10,585
Fleet Gasoline
Equipment
1,454 0.083 0.159 Not
Applicable
Not Applicable Not Applicable 1,503
Fleet Diesel Equipment 2,472 0.130 0.076 Not
Applicable
Not Applicable Not Applicable 2,497
Transit Gasoline 563 0.031 0.061 Not
Applicable
Not Applicable Not Applicable 582
Transit Diesel 4,129 0.21 0.127 Not
Applicable
Not Applicable Not Applicable 4,172
Building Refrigerant Not
Applicable
Not
Applicable
Not
Applicable
Unknown Unknown Unknown
Solid Waste 9,704 2,852 0.28 Not
Applicable
Not Applicable Not Applicable 81,082
Firewood Burning 113 1.130 1.20 Not
Applicable
Not Applicable Not Applicable 498
Wastewater Treatment
(flared digester gas)
3,490 Unknown Trace Not
Applicable
Not Applicable Not Applicable 3,490
Wastewater Treatment
(cogeneration gas)
5,893 5,893
Scope 2 Indirect Greenhouse Gas Emissions from Energy Purchases
Electricity For All Uses
Except Street Lights
8,736 0.298 0.199 Not
Applicable
Not Applicable Not Applicable 8,802
Electricity For Street
Lights
8,052 0.275 0.183 Not
Applicable
Not Applicable Not Applicable 8,113
Scope 3 Indirect Greenhouse Gas Emissions from Product and Service Purchases
Buildings, Equipment,
Products & Supplies
(capital & operating)
Unknown Unknown Unknown Unknown Unknown Unknown
Organic Fertilizer Not
Applicable
Not
Applicable
4.596
Not
Applicable
Not Applicable Not Applicable 1,361
Synthetic Fertilizer Not
Applicable
Not
Applicable
1.860
Not
Applicable
Not Applicable Not Applicable 554
Personal Cars Used
for Work
86 0.006 0.0061 Not
Applicable
Not Applicable Not Applicable 88
Business Air Travel Unknown Unknown Unknown Not
Applicable
Not
Applicable
Not Applicable
Employee Commuting 681 0.038 0.056 Not
Applicable
Not Applicable Not Applicable 698
Total 55,896 2,854 9 - - - 129,928

92
Table 10.4.1, presented above, provides a summary of the total greenhouse gas
emissions that were identified as being associated with the corporate operations of the
City of Lethbridge. The inventory is complete for Scope 1 and Scope 2 emissions, but
incomplete for Scope 3 emissions.
Table 10.4.1 provides an account of the sources of greenhouse gas emission produced
by the City. In 2009, the City created 55,896 tonnes of carbon dioxide, 2,854 tonnes of
methane and 9 tonnes of nitrous oxide. The global warming potential of each
greenhouse gas was applied to the data using IPCC coefficients and is presented as
carbon dioxide equivalents (CO2e). The carbon dioxide equivalent of the total
emissions from the City is 129,928 tonnes. Table 10.4.2 provides a summary of the
quantities of each greenhouse gases and their carbon dioxide equivalents.
Table 10.4.2 Carbon Dioxide Equivalent of Greenhouse Gases Generated by City
of Lethbridge (tonnes)
Greenhouse Gas Carbon Dioxide
Equivalency
Factor
City of Lethbridge
Greenhouse Gas
Generation
(tonnes)
Carbon Dioxide
Equivalent
(tonnes)
Carbon Dioxide 1 55,896 55,896
Methane 25 2,854 71,350
Nitrous Oxide 298 9 2,682
Perfluorocarbon 7,390-9,300 - -
Hydrofluorocarbon 124-14,800 - -
Sulfur Hexafluoride 22,800 - -
Total 58,759 129,928

93
Figure 10.4.1 Lethbridge Corporate Greenhouse Gas by Source (tonnes of CO2e)
Figure 10.4.1 provides a summary of the sources of greenhouse gas emissions. The
largest generators of greenhouse gas emissions are the three landfills controlled by the
City. Electricity and natural gas are the next highest emitters, but produce considerably
less greenhouse gas than the land fills. In fact, the three landfills are responsible for
62% of the carbon dioxide equivalency in greenhouse gas emissions for the
corporation.
Figure 10.4.2 Lethbridge Corporate Greenhouse Gas Emissions by Volume
Carbon Dioxide
Methane
Nitrous Oxide95.14%
0.015% 4.85%
0
1000
0
2000
0
3000
0
4000
0
5000
0
6000
0
7000
0
8000
0
9000
0
Natural Gas (Buildings & Equipment)
Fleet
Transit
Solid Waste
Firewood
Wastewater
Electricity
Fertilizer
Personal Cars
Employee Commuting
Greenhouse Gas CO2e tonnes

94
Figures 10.4.2 and 10.4.3 provide a graphic representation of the proportion of
greenhouse gases produced by the City of Lethbridge and the carbon dioxide
equivalency of those gases respectively.
Figure 10.4.3 Lethbridge Corporate Greenhouse Gas Emissions by CO2e
Carbon Dioxide
Methane
Nitrous Oxide
43%
2%
55%
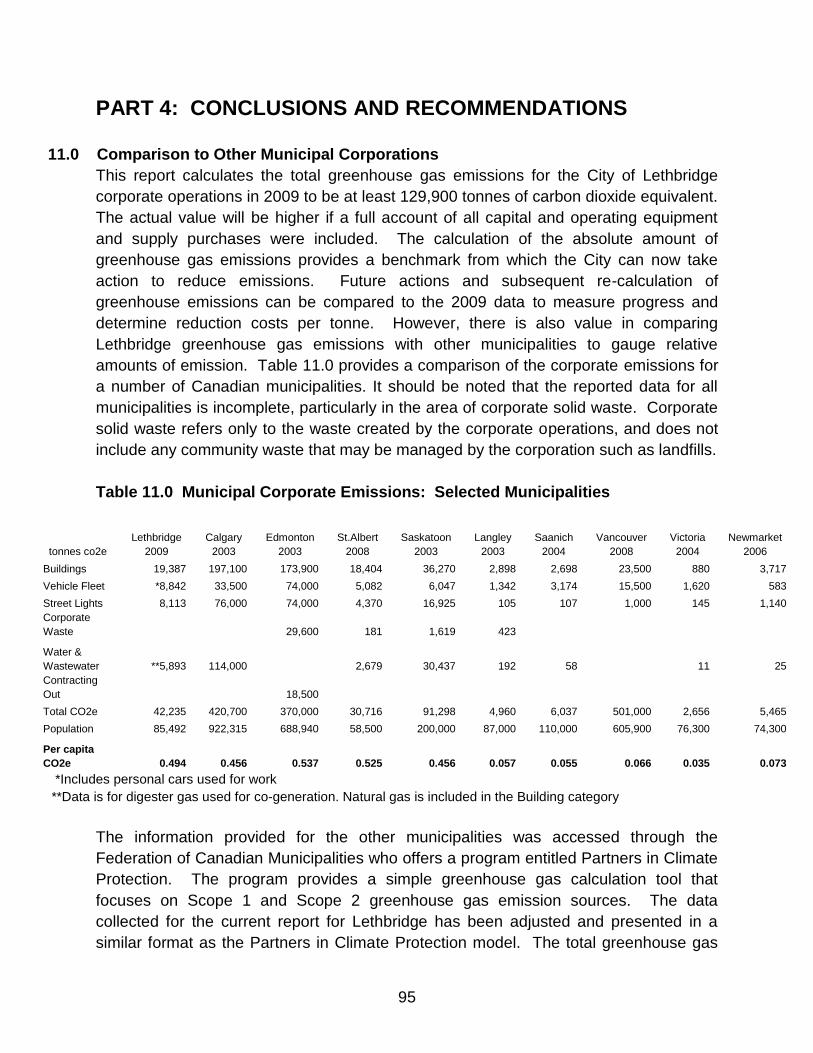
95
PART 4: CONCLUSIONS AND RECOMMENDATIONS
11.0 Comparison to Other Municipal Corporations
This report calculates the total greenhouse gas emissions for the City of Lethbridge
corporate operations in 2009 to be at least 129,900 tonnes of carbon dioxide equivalent.
The actual value will be higher if a full account of all capital and operating equipment
and supply purchases were included. The calculation of the absolute amount of
greenhouse gas emissions provides a benchmark from which the City can now take
action to reduce emissions. Future actions and subsequent re-calculation of
greenhouse emissions can be compared to the 2009 data to measure progress and
determine reduction costs per tonne. However, there is also value in comparing
Lethbridge greenhouse gas emissions with other municipalities to gauge relative
amounts of emission. Table 11.0 provides a comparison of the corporate emissions for
a number of Canadian municipalities. It should be noted that the reported data for all
municipalities is incomplete, particularly in the area of corporate solid waste. Corporate
solid waste refers only to the waste created by the corporate operations, and does not
include any community waste that may be managed by the corporation such as landfills.
Table 11.0 Municipal Corporate Emissions: Selected Municipalities
tonnes co2e
Lethbridge
2009
Calgary
2003
Edmonton
2003
St.Albert
2008
Saskatoon
2003
Langley
2003
Saanich
2004
Vancouver
2008
Victoria
2004
Newmarket
2006
Buildings 19,387 197,100 173,900 18,404 36,270 2,898 2,698 23,500 880 3,717
Vehicle Fleet *8,842 33,500 74,000 5,082 6,047 1,342 3,174 15,500 1,620 583
Street Lights 8,113 76,000 74,000 4,370 16,925 105 107 1,000 145 1,140
Corporate
Waste 29,600 181 1,619 423
Water &
Wastewater **5,893 114,000 2,679 30,437 192 58 11 25
Contracting
Out 18,500
Total CO2e 42,235 420,700 370,000 30,716 91,298 4,960 6,037 501,000 2,656 5,465
Population 85,492 922,315 688,940 58,500 200,000 87,000 110,000 605,900 76,300 74,300
Per capita
CO2e 0.494 0.456 0.537 0.525 0.456 0.057 0.055 0.066 0.035 0.073
*Includes personal cars used for work
**Data is for digester gas used for co-generation. Natural gas is included in the Building category
The information provided for the other municipalities was accessed through the
Federation of Canadian Municipalities who offers a program entitled Partners in Climate
Protection. The program provides a simple greenhouse gas calculation tool that
focuses on Scope 1 and Scope 2 greenhouse gas emission sources. The data
collected for the current report for Lethbridge has been adjusted and presented in a
similar format as the Partners in Climate Protection model. The total greenhouse gas

96
emissions for each municipality have been presented as tonnes per capita for
comparison purposes. In Figure 11.0
Figure 11.0 Municipal Corporate Carbon Dioxide Equivalent Greenhouse Gas
Emissions Per Capita
Lethbridge creates 0.494 tonnes of municipal corporate greenhouse gas per capita as
compared to Victoria, British Columbia, which produces only 0.035 tonnes per capita.
Edmonton creates the greatest amount of greenhouse gas per capita, at 0.537. There
is a considerable difference in the amount of greenhouse gas generated by Alberta and
Saskatchewan municipalities compared to those in British Columbia and Ontario. The
use of coal to produce the majority of Alberta‟s and Saskatchewan‟s electricity is likely
responsible for most of the difference. British Columbia largely uses hydro-electricity for
lighting, while Ontario largely uses hydro-electricity and nuclear power, both of which do
not create greenhouse gases. British Columbia also uses electricity for some building
heating, while Alberta largely uses natural gas.
The greenhouse gas accounting system used by the Partners in Climate Protection
program does not allow for complete analysis of the differences between municipalities.
Other differences can be attributed to the provincial public transit system in British
Columbia, which would not be included in municipal greenhouse gas inventories.
0 0.1 0.2 0.3 0.4 0.5 0.6
Lethbridge
Calgary
Edmonton
St Albert
Saskatoon
Langley
Saanich
Vancouver
Victoria
Newmarket
Per Capita CO2e

97
Victoria does not have a wastewater treatment plant; therefore it will not have the same
energy demands as municipalities with wastewater treatment plants. Vancouver relies
on a regional water provider, and again, water treatment energy demands will not be
comparable. Nevertheless, the data in Table 10.0 provides a relative indication of the
performance of Lethbridge compared to other municipalities in Canada. In comparison
to other prairie cities, Lethbridge currently has relatively lower amounts of greenhouse
gas emissions.
12.0 Conclusions
The production of greenhouse gases from anthropogenic sources is causing climate
change, which in turn will have environmental, economic and social implications.
Climate change is expected to directly impact Lethbridge with warmer summers,
rainstorms that are more intense, and earlier spring thaws. Reduced snowpack in the
winter is anticipated to reduce river water levels.
A reduction in greenhouse gas emissions will have global benefits beyond climate
change, such as reducing ocean acidification.
Climate change resulting from greenhouse gas emissions has been recently identified
as a policy area in the City of Lethbridge Municipal Development Plan/Integrated
Sustainability Plan.
In comparison to other Canadian prairie cities, Lethbridge does not produce an
unusually high amount of corporate greenhouse gases, however, Canada is the second
largest producer of greenhouse gases in the world (per capita), and Alberta is the
largest greenhouse gas-producing province in Canada (per capita).
The City does not yet have a formal program for tracking greenhouse gas emissions at
the corporate or community level.
A community greenhouse gas inventory will be relatively easy to conduct as standard
methodologies have been developed by organizations such as the Federation of
Canadian Municipalities.
The largest sources of corporate greenhouse gas emissions within the City of
Lethbridge are three municipal landfills.

98
13.0 Recommendations
In view of the information and findings provided in this report, it is recommended that
the City:
Implement a staff awareness program of greenhouse gas sources and implications of
climate change.
Develop a formal database for tracking greenhouse gas emissions from corporate
sources.
Incorporate the external costs of greenhouse gas emissions into decision-making.
Develop a formal plan for reducing greenhouse gas emissions.
Conduct a community greenhouse gas inventory as the first step in developing a
community greenhouse gas reduction plan.

99
14.0 References
B.H. Levelton & Associates Ltd., An Inventory and Analysis of Control Measures for
Methane for British Columbia. Ministry of Environment, Victoria, BC, April 1992.
Boning, R., www.erftverband.de/digester-gas,pdf , retrieved April 18, 2011.
Clean Water Action Council – CWAC, “Ozone - Issues from Clean Water Action
Council.”. N.p., n.d. Web. 24 Sept. 2010. http://www.cwac.net/air_pollution
Department of Environmental Services, New Hampshire. . “Smog and Ground-Level
Ozone Challenges for Protecting New Hampshire‟s Air Quality.” Environmental Fact
Sheet ARD-13 (2008): 1-2.
Diamond, J., Collapse. New York: Penguin Books, 2005.
Environment Canada, The National Inventory Report 1990-2008: Greenhouse Gas
Sources and Sinks in Canada, 2010
Greenhouse Gas Protocol, Calculating HfC and PFC Emissions from the Manufacturing,
Installation, Operation and Disposal of Refrigeration and Air-conditioning Equiprment,
2005.
El-Fadel, M. and Massoud, M., Methane emissions from wastewater management,
Environmental Pollution, 114 (2001) (2), p. 177.
England, Richard W.. “Three reasons for investing now in fossil fuel conservation.”
Journal of Economic Issues 1 (1994).
Henfeveld, Henry, Bob Whitewood, and Angus Fergusson, An Introduction to Climate
Change, Environment Canada, 2005
Intergovernmental Panel on Climate Change, 2007 Assessment, Cambridge Publishers, Canada 2007
Jaques, A., F. Neitzert, P. Boileau, Trends in Canada’s Greenhouse Gas Emissions
(1990-1995). Pollution Data Branch, Air Pollution Prevention Directorate, Environment
Canada, April 1997.
Jaques, A.P., Canada‟s Greenhouse Gas Emissions: Estimates for 1990. Report EPS
5/AP/4, Environmental Protection, Conservation and Protection, Environment Canada,
December 1992.

100
Janzen, H.H., R.L. Desjardins, J.M.R. Asselin and B. Grace. 1998. The Health of Our
Air: Towards Sustainable Agriculture in Canada. No. 1981/E. Research Branch,
Agriculture and Agri-Food Canada.
Pembina Institute, Highlights of Provincial Greenhouse Gas Reduction Plans. August
2009.
Ponting, C., A New Green History of the World. Toronto, Penguin Group, 2007
Riebesell U., Fabry V. J., Hansson L. & Gattuso J.-P. (Eds.), 2010. Guide to best
practices for ocean acidification research and data reporting, 260 p. Luxembourg:
Publications Office of the European Union.
Sabine, C.L., et al. (2004), The Oceanic Sink for Anthropogenic CO2, Science, v305,
367-371.
US Energy Information Administration (E.I.A.), Emissions of Greenhouse Gases in the
United States 1996. Report DOE/EIA-0573(96), Office of Integrated Analysis and
Forecasting, U.S. Department of Energy, Washington, DC, October 1997.
Weaver, A., Keeping Our Cool – Canada In A Warming World, Toronto: Penquin Group.
2008
World Wildlife Fund, The Coral Triangle and Climate Change, The University of
Queensland, 2008

101
Appendix 1: Environment Canada Greenhouse Gas Emission Factors
Table 1: Carbon Dioxide (CO2) Emission Factors for Natural Gas
Province
Emission Factor
(g/m3)
Marketable Non-
marketa
ble
Newfoundland and Labrador NO 2 482
Nova Scotia NO 2 482
Quebec 1 878 NO
Ontario 1 879 NO
Manitoba 1 877 NO
Saskatchewan 1 820 2 429
Alberta 1 918 2 380
British Columbia 1 916 2 151
Northwest Territories 2 454 2 454
Table 2: Methane (CH4) and Nitrous Oxide (N2O) Emission Factors for Natural Gas
Source
Emission Factor
(g/m3)
CH4 N2O
Electric Utilities 0.49 0.049
Industrial 0.037 0.033
Producer Consumption (Non-
marketable) 6.5 0.06
Pipelines 1.9 0.05
Cement 0.037 0.034
Manufacturing Industries 0.037 0.033
Residential, Construction,
Commercial/Institutional, Agriculture 0.037 0.035
Alberta
Greenhouse Gas Intensity
(g GHG/kWh electricity generated)
1990 2007 2008
CO2 Intensity 980 860 880

102
CH4 Intensity 0.02 0.03 0.03
N2O Intensity 0.02 0.02 0.02
Overall Intensity
(g CO2 eq/kWh) 960 860 880
Table 12: Emission Factors for Energy Mobile Combustion Sources
Mode
Emission Factor
(g/L fuel)
CO2 CH4 N2O
Road Transport
Gasoline Vehicles
Light-duty Gasoline Vehicles (LDGVs)
Tier 1* 2 289 0.12 0.16
Tier 0 2 289 0.32 0.66
Oxidation Catalyst 2 289 0.52 0.20
Non-catalytic Controlled 2 289 0.46 0.028
Light-duty Gasoline Trucks (LDGTs)
Tier 1* 2 289 0.13 0.25
Tier 0 2 289 0.21 0.66
Oxidation Catalyst 2 289 0.43 0.20
Non-catalytic Controlled 2 289 0.56 0.028
Heavy-duty Gasoline Vehicles (HDGVs)
Three-way Catalyst 2 289 0.068 0.20
Non-catalytic Controlled 2 289 0.29 0.047
Uncontrolled 2 289 0.49 0.084
Motorcycles
Non-catalytic Controlled 2 289 1.4 0.045
Uncontrolled 2 289 2.3 0.048
Diesel Vehicles
Light-duty Diesel Vehicles (LDDVs)
Advance Control* 2 663 0.051 0.22
Moderate Control 2 663 0.068 0.21
Uncontrolled 2 663 0.10 0.16
Light-duty Diesel Trucks (LDDTs)
Advance Control* 2 663 0.068 0.22
Moderate Control 2 663 0.068 0.21

103
Uncontrolled 2 663 0.085 0.16
Heavy-duty Diesel Vehicles (HDDVs)
Advance Control 2 663 0.12 0.082
Moderate Control 2 663 0.14 0.082
Uncontrolled 2 663 0.15 0.075
Natural Gas Vehicles 1.89 9 x 10⁻³ 6 x 10⁻⁵
Propane Vehicles 1 510 0.64 0.028
Off-road
Off-road Gasoline 2 289 2.7 0.050
Off-road Diesel 2 663 0.15 1.1
Railways
Diesel Train 2 663 0.15 1.1
Marine
Gasoline Boats 2 289 1.3 0.066
Diesel Ships 2 663 0.15 1.1
Light Fuel Oil Ships 2 725 0.26 0.073
Heavy Fuel Oil Ships 3 124 0.28 0.079
Aviation
Aviation Gasoline 2 342 2.2 0.23
Aviation Turbo Fuel 2 534 0.080 0.23
Renewable Fuels
Biodiesel 2 449 ** **
Ethanol 1 494 *** ***
Table 1: Emission Factors for Biomass
Source Description
Emission Factor
(g/kg fuel)
Carbon
Dioxide
(CO2)
Methan
e (CH4)
Nitrous
Oxide
(N2O)
Wood Fuel/Wood
Waste
Industrial
Combustion 950 0.05 0.02
Forest Wildfires Open Combustion NA NA NA
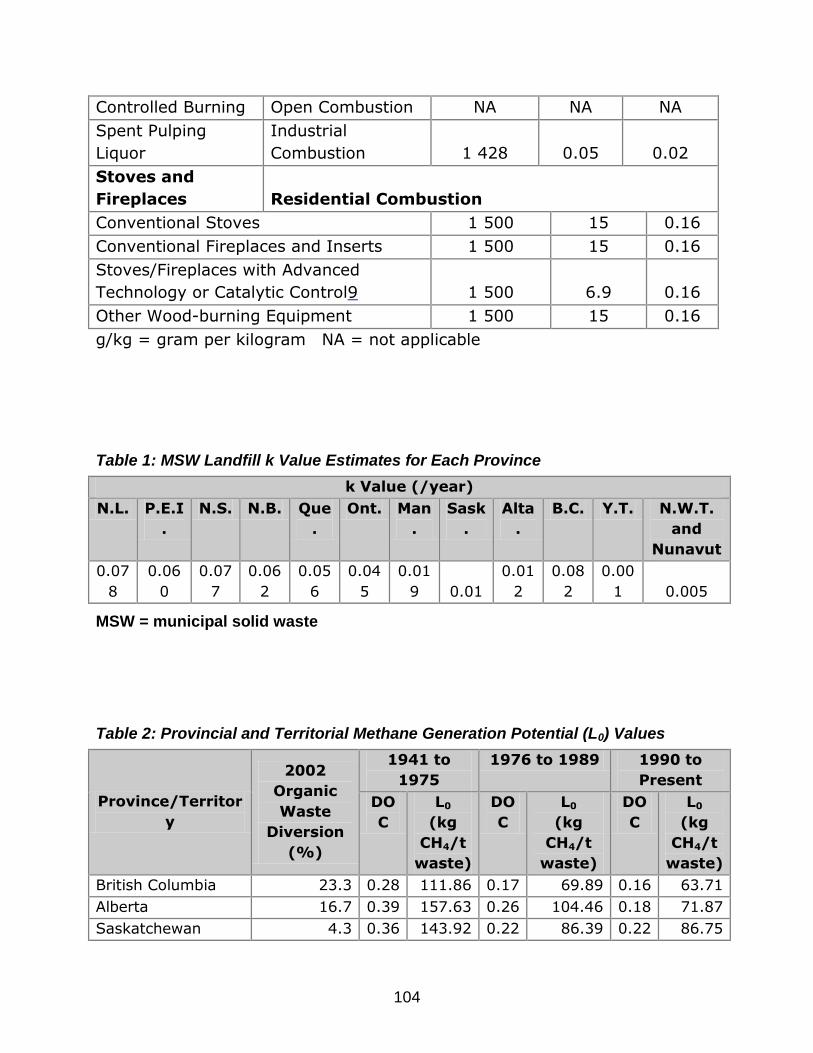
104
Controlled Burning Open Combustion NA NA NA
Spent Pulping
Liquor
Industrial
Combustion 1 428 0.05 0.02
Stoves and
Fireplaces Residential Combustion
Conventional Stoves 1 500 15 0.16
Conventional Fireplaces and Inserts 1 500 15 0.16
Stoves/Fireplaces with Advanced
Technology or Catalytic Control9 1 500 6.9 0.16
Other Wood-burning Equipment 1 500 15 0.16
g/kg = gram per kilogram NA = not applicable
Table 1: MSW Landfill k Value Estimates for Each Province
k Value (/year)
N.L. P.E.I
.
N.S. N.B. Que
.
Ont. Man
.
Sask
.
Alta
.
B.C. Y.T. N.W.T.
and
Nunavut
0.07
8
0.06
0
0.07
7
0.06
2
0.05
6
0.04
5
0.01
9 0.01
0.01
2
0.08
2
0.00
1 0.005
MSW = municipal solid waste
Table 2: Provincial and Territorial Methane Generation Potential (L0) Values
Province/Territor
y
2002
Organic
Waste
Diversion
(%)
1941 to
1975
1976 to 1989 1990 to
Present
DO
C
L0
(kg
CH4/t
waste)
DO
C
L0
(kg
CH4/t
waste)
DO
C
L0
(kg
CH4/t
waste)
British Columbia 23.3 0.28 111.86 0.17 69.89 0.16 63.71
Alberta 16.7 0.39 157.63 0.26 104.46 0.18 71.87
Saskatchewan 4.3 0.36 143.92 0.22 86.39 0.22 86.75

105
Manitoba 4.9 0.33 131.37 0.19 76.82 0.19 76.59
Ontario 16.4 0.36 143.74 0.21 82.75 0.21 83.00
Quebec 13.7 0.36 144.45 0.21 82.52 0.20 81.23
New Brunswick 19.8 0.23 93.91 0.16 65.91 0.16 63.22
Nova Scotia 29.7 0.25 100.89 0.16 62.35 0.16 64.10
Prince Edward
Island N/A 0.27 108.74 0.17 67.19 0.16 64.63
Newfoundland N/A 0.28 112.62 0.18 73.28 0.18 73.35
Territories
(Yukon, Northwest
Territories, and
Nunavut) N/A 0.22 87.59 0.15 58.54 0.16 65.13
DOC = degradable organic carbon kg CH4/t = kilogram of methane per tonne N/A =
not available Sources: Derived from data obtained from NRCan (2006), Statistics
Canada (2007), and CRC Press (1973)

106

107
Appendix 2: Commuting Survey
City of Lethbridge Employee Commute Survey – City Hall
1.) Approximately how many days did you work in 2010? There are approximately 248 weekdays per year, excluding statutory holidays.
____________________________________________
2.) What was the total distance travelled to and from work (round trip) during your commute per day? If you are unsure of this distance, please use Google Maps to find the approximate distance: http://maps.google.com/ Approximate distances from City Hall (for reference): University of Lethbridge - 5.0 km Paradise Canyon - 8.8 km Superstore - 6.4 km Henderson Lake - 3.0 km North Side Walmart - 7.7 km Winston Churchill High School - 3.6 km Please state answer in kilometres.
____________________________________________
3.) How did you get to work in 2010? Please enter your best estimate of the percentage of days during the year you commuted to work (left column) and from work (right column) by the following travel methods (each column should add to 100):
Type of Commute Travel To Work (%)
Travel From Work (%)
Gasoline-powered car ___ ___
Diesel-powered car ___ ___
Electric car ___ ___
Gasoline-powered light-duty truck/suv/van
___ ___
Diesel-powered light-duty truck/suv/van
___ ___
Public transit ___ ___
Gasoline-powered motorcycle/scooter
___ ___

108
Electric motorcycle/scooter ___ ___
Bicycle ___ ___
Walking ___ ___
No commute (worked at home)
___ ___
Other non-fuel activity (please describe activity in "Comments" section below)
___ ___
Other fuel activity (please describe activity in
"Comments" section below) ___ ___
4.) If you took part in a carpool, approximately how many days was this your commute method in 2010?
____________________________________________
5.) Comments:
Thank You!
Thank you for taking the time to fill out our survey. We really appreciate your support in our project!