city of jacksonville operating portfolio finance committee update as of march 31, 2011
TRANSCRIPT
City of Jacksonville Operating Portfolio
Finance Committee UpdateAs of March 31, 2011
2
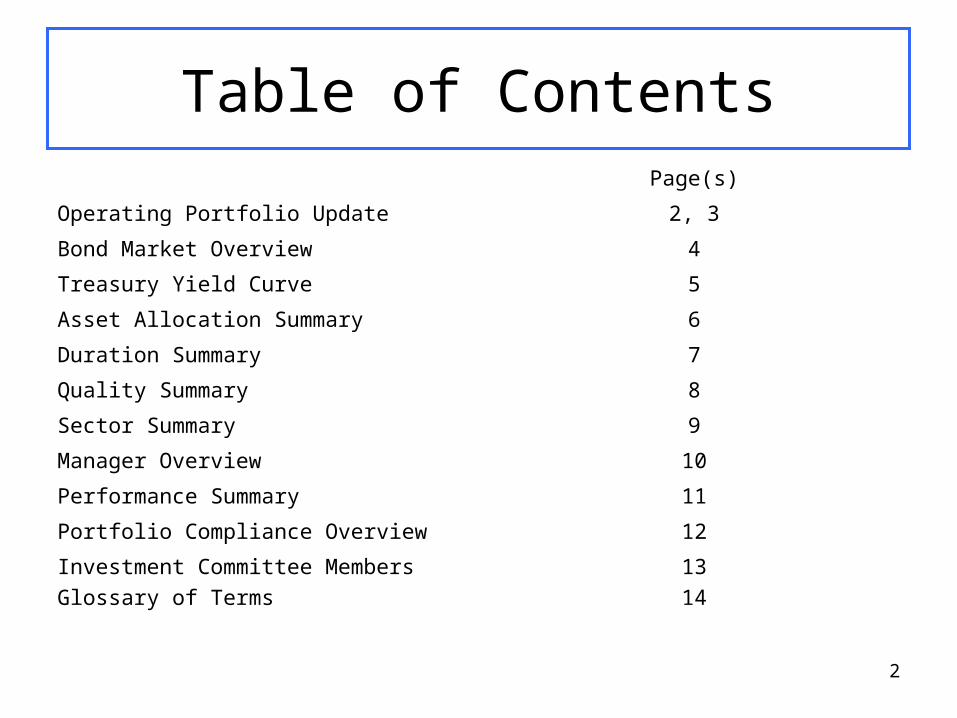
Table of ContentsPage(s)
Operating Portfolio Update 2, 3
Bond Market Overview 4
Treasury Yield Curve 5
Asset Allocation Summary 6
Duration Summary 7
Quality Summary 8
Sector Summary 9
Manager Overview 10
Performance Summary 11
Portfolio Compliance Overview 12
Investment Committee Members
Glossary of Terms
13
14

3
Operating Portfolio Update• Bond markets, in general, experienced a relatively flat quarter as future
inflation concerns, budget troubles, nuclear crisis, and Middle East unrest placed various pressures on the market.
• While short-term bond yields remain low, we’ve seen yields on those with maturities greater than one year increase as investors demand a higher return for holding against all of the above mentioned challenges.
• The City’s Aggregate Cash Balance fluctuates over the course of the year due to seasonal property tax receipts and subsequent spend-down; balances reached their high point last quarter and are now beginning their natural drawdown to fund operations. The portfolio is considered to be postured in a moderate risk stance by the Investment Committee (p. 6).
• Duration is a measure of how much a portfolio changes in value (volatility) when interest rates change. Shorter durations are less volatile while longer durations are more volatile. The current duration measure is 2.56, down from 3.19 at September 30th, 2010. This means that the portfolio is more defensive against a general increase in rates (p. 7).

4
Operating Portfolio Update (cont’d)
• Quality is a measure of the creditworthiness of a bond as recognized by the major rating services (i.e. Moody’s, Standard & Poors), with Treasuries the safest. The portfolio’s average credit quality is of investment grade (p. 8).
• Sectors are the means by which bonds are classified (i.e. Governments, Corporates, Mortgage Backed Securities) (p. 9).
• Manager Overview provides the category in which each money manager is included as well as information about the firm (p. 10).
• Portfolio performance compares individual manager performance relative to a benchmark; active returns have dominated respective benchmarks since program inception (p. 11).
• The portfolio is structured according to guidelines provided in the Investment Policy Statement; each month the portfolio is measured to ensure compliance. You can see that the portfolio was in compliance in all categories at the end of the most recent quarter (p. 12).
• Investment Committee members (p. 13).• Glossary of terms (p. 14).

5
Bond Market Overview
Despite a relatively flat market in bonds over the last two quarters, the portfolio has benefitted from broad gains in bonds over the past one year period.
Source: BNY Mellon
0.0%
20.0%
1 Year
BC Agg Bond Index BC Treasury BC Muni BC US Credit
BC MBS BC HY BC Emerging Market BC Intermediate G/C

6
We’ve seen a shift higher in rates recently as bond markets sold off with improvements in the economy. Changes were felt most in government bonds and in those with maturities greater than one year. This made for some slight downward pressure, but the portfolio’s shortened duration,
helps shield against such environments.
Treasury Yield CurveSource: US Treasury
0%
1%
2%
3%
4%
5%
1 mo 3 mo 6 mo 1 yr 2 yr 3 yr 5 yr 7 yr 10 yr 20 yr 30 yr
3/31/2010 6/30/2010 9/30/2010 12/31/2010 3/31/2011
7
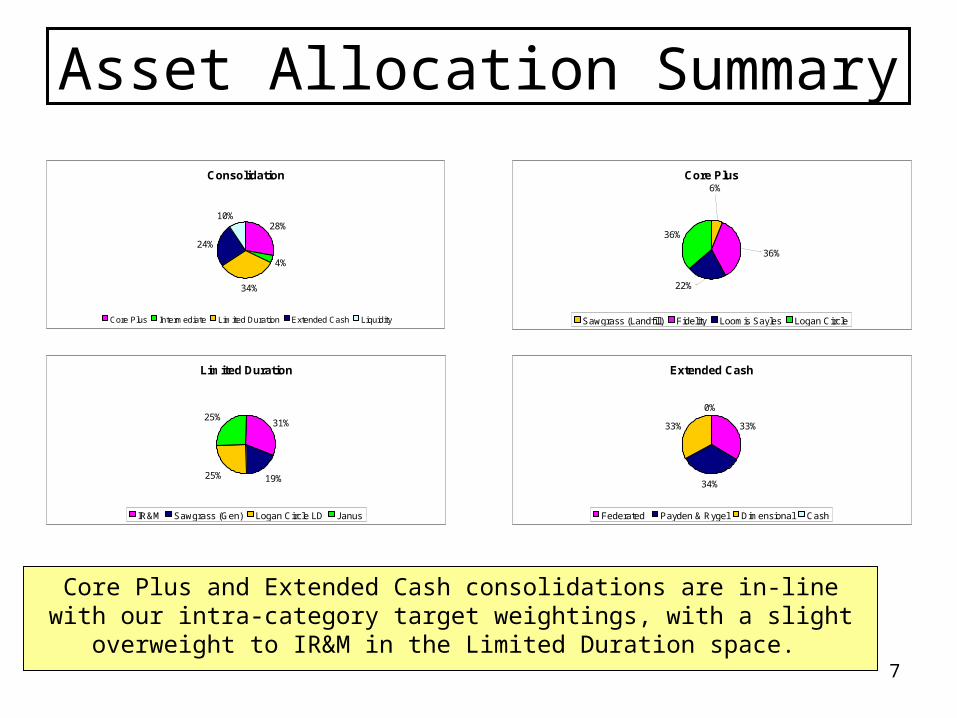
Asset Allocation Summary
Core Plus and Extended Cash consolidations are in-line with our intra-category target weightings, with a slight overweight to IR&M in the Limited Duration
space.
Consolidation
28%
4%
34%
24%
10%
Core Plus Intermediate Limited Duration Extended Cash Liquidity
Core Plus
36%
22%
36%
6%
Sawgrass (Landfill) Fidelity Loomis Sayles Logan Circle
Limited Duration
31%
19%25%
25%
IR&M Sawgrass (Gen) Logan Circle LD Janus
Extended Cash
33%
34%
33%
0%
Federated Payden & Rygel Dimensional Cash

8
Duration Summary
Managers maintain a more ‘laddered’ structure in contrast to the more ‘bullet’-like benchmarks.
Consolidation
0%
50%
100%
< 1 1 - 3 3 - 5 5 - 7 7 - 10 10 - 15 15 - 20 > 20 Comgld
Years
Consolidation Blended Benchmark
Limited Duration
0%
50%
100%
< 1 1 - 3 3 - 5 5 - 7 7 - 10 10 - 15 15 - 20 > 20 Comgld
Years
IR&M Janus Sawgrass (Gen) ML Corp & Govt 1-3 Yr Logan Circle LD
Core Plus
0%
50%
100%
< 1 1 - 3 3 - 5 5 - 7 7 - 10 10 - 15 15 - 20 > 20 Comgld
Years
Sawgrass (Landfill) Logan Circle Fidelity
Loomis Sayles BC Agg Bond Index IRM Int
Extended Cash
0%
50%
100%
< 1 1 - 3 3 - 5 5 - 7 7 - 10 10 - 15 15 - 20 > 20 Comgld
Years
Federated Payden & Rygel Dimensional ML US Treasury 1-Yr

9
Quality Summary
In search for yield, managers tend to diversify from Treasuries and Agencies to include several other quality levels.
Consolidation
0%
25%
50%
75%
100%
UST AGY AAA AA1-AA3 A1-A3 BAA1-BAA3
Other Comgld
Consolidation Blended Benchmark
Limited Duration
0%
25%
50%
75%
100%
UST AGY AAA AA1-AA3 A1-A3 BAA1-BAA3
Other Comgld
IR&M Janus Sawgrass (Gen) ML Corp & Govt 1-3 Yr
Core Plus
0%25%50%75%
100%
UST AGY AAA AA1-AA3 A1-A3 BAA1-BAA3
Other Comgld
Sawgrass (Landfill) Logan Circle Fidelity
Loomis Sayles BC Agg Bond Index
Extended Cash
0%
25%
50%
75%
100%
UST AGY AAA AA1-AA3 A1-A3 BAA1-BAA3
Other Comgld
Federated Payden & Rygel Dimensional ML 1-Year Treasury Index

10
Sector Summary
Similar to Quality, the benchmarks are heavily weighted in Government bonds, and manager’s Sector characteristics exhibit significant diversification.
Consolidation
0%
25%
50%
75%
100%
Govt Corp Govt Mrtg ABS CMO's US FI Futrs Pvt Pl. Comgld
Consolidation Blended Benchmark
Core Plus
0%
25%
50%
75%
100%
Govt Corp Govt Mrtg ABS CMO's US FI Futrs Pvt Pl. Comgld
Sawgrass (Landfill) Logan Circle Fidelity
Loomis Sayles BC Agg Bond Index IRM Int
Limited Duration
0%
25%
50%
75%
100%
Govt Corp Govt Mrtg ABS CMO's US FI Futrs Pvt Pl. Comgld
IR&M Janus Sawgrass (Gen) ML Corp & Govt 1-3 Yr Logan Circle LD
Extended Cash
0%
25%
50%
75%
100%
Govt Corp Govt Mrtg ABS CMO's US FI Futrs Pvt Pl. Comgld
Federated Payden & Rygel Dimensional ML 1-Year Treasury Index

11
Manager OverviewCategory Manager Website Firm Assets Under
Management (AUM) (millions)
City of Jacksonville AUM (millions)
Core Fidelity (Pyramis) www.pyramis.com $176,422 $ 95.2
Logan Circle www.lcpim.com $ 12,484.0 $ 94.9
Loomis Sayles www.loomissayles.com $ 156,280.7 $ 57.6
Sawgrass (Landfill) www.saw-grass.com $ 2,906.0 $ 16.0
Intermediate Income Research & Management
www.incomeresearch.com $ 26,866.8 $ 37.4
Limited Duration Income Research & Management
www.incomeresearch.com $ 26,866.8 $ 97.8
Sawgrass (Gen) www.saw-grass.com $ 2,906 $ 59.7
Janus http://www.janus.com $107,955.3 $ 80.2
Logan Circle www.lcpim.com $ 12,484 $ 79.3
Extended Cash Federated www.federatedinvestors.com $ 354,265.4 $ 75.6
Payden & Rygel www.payden.com $ 56,442.0 $ 77.3
Dimensional Funds www.dfaus.com $227,415 $ 74.0
BNY Mellon (custodial cash)
http://www.bnymellon.com/ $ 128,822.7 $ 0.4
Bank Deposits Wachovia www.wachovia.com N/A $ 92.5

12
Performance Summary
March investment performance came in at 0.09% vs. 0.02% on the benchmark. This brings the portfolio to positive 0.63% for the quarter and 0.35% for the Fiscal Year, while the benchmark is
0.22% positive and negative 0.22% respectively. The Core Plus segment has contributed most as allocations to higher-yield and corporate bonds outpaced the broad market averages that tend to
have more Treasury exposure. Credit spreads held steady for the month, and remain slightly elevated against longer-term averages.
Portfolio Value % of Plan % of Category Month Quarter Fiscal YTD 1 Year 3 YearSince
InceptionInception
Date
Logan Circle 94,901,265$ 10% 36% 0.17% 1.44% 0.59% 6.90% 6.83% 6.72% 11/30/2007Fidelity 95,173,997$ 10% 36% 0.15% 1.34% 0.78% 7.36% 9.03% 8.42% 10/31/2007Loomis Sayles 57,570,334$ 6% 22% 0.44% 2.43% 2.53% 10.62% 9.08% 8.30% 10/31/2007Sawgrass (Landfill) 15,977,038$ 2% 6% 0.03% 0.35% -0.64% 5.23% 6.01% 5.63% 3/31/2005Core Plus 263,622,634$ 28% 100% 0.21% 1.53% 1.01% 7.85% 7.90% 7.32% 10/31/2007BC Aggregate Bond Index 0.06% 0.42% -0.88% 5.12% 5.30% 6.06% 10/31/2007
IR&M Intermediate G/C 37,394,866$ 4% 100% -0.08% - - - - -0.08% 2/28/2011
Intermediate G/C 37,394,866$ 4% 100% -0.08% - - - - -0.08% 2/28/2011
BC Intermediate G/C -0.05% -0.05% 2/28/2011
Logan Circle LD 79,270,038$ 8% 25% 0.12% - - - - 0.22% 2/28/2011IR&M 97,972,226$ 10% 31% -0.01% 0.41% 0.16% 2.47% 4.46% 4.89% 10/31/2007Sawgrass (Gen) 59,715,731$ 6% 19% -0.01% 0.17% 0.21% 1.87% 2.84% 3.76% 3/31/2004Janus 80,234,634$ 9% 25% 0.05% 0.44% - - - 0.09% 11/30/2010Limited Duration 317,192,629$ 34% 100% 0.04% 0.42% 0.23% 2.37% 3.98% 4.72% 10/31/2007ML 1-3 Year Corp/Gov 0.00% 0.20% 0.14% 2.08% 2.94% 3.92% 10/31/2007
Federated 75,591,960$ 8% 33% 0.06% 0.24% 0.31% 0.86% 2.20% 2.69% 11/30/2007Payden & Rygel 77,274,705$ 8% 34% 0.08% 0.47% 0.43% 1.49% 2.17% 2.30% 11/30/2007Dimensional 73,971,755$ 8% 33% 0.06% 0.18% - - - 0.07% 11/30/2010Extended Cash 227,228,942$ 24% 100% 0.06% 0.30% 0.24% 0.83% 1.83% 2.12% 10/31/2007ML 0-1-Year Treasury 0.02% 0.09% 0.15% 0.37% 0.95% 1.62% 10/31/2007
Active Composite $ 845,439,071 90% 100% 0.09% 0.65% 0.36% 5.01% 5.90% 5.88% 10/31/2007
Wachovia 92,455,513$ 10% 100% 0.04% 0.11% 0.23% 0.45% 1.01% 2.06% 10/31/2006Liquidity 92,455,513$ 10% 100% 0.04% 0.11% 0.23% 0.45% 1.01% 2.06% 10/31/2006Citigroup Treasury 3-Month 0.01% 0.04% 0.07% 0.15% 0.47% 1.79% 10/31/2006
Operating Portfolio 937,894,584$ 100% N/A 0.09% 0.63% 0.35% 4.67% 5.57% 5.70% 10/31/2007Blended Benchmark 0.02% 0.22% -0.22% 2.84% 3.40% 4.41% 10/31/2007

13
Portfolio Compliance Overview
The Operating Portfolio is in compliance in all above referenced categories.
Compliance Category
Com Normal %
IPS Minimum%
IPS Maximum% IPS Minimum $ IPS Maximum $ Current Exposure
Duration 2.55 0.75 5.00 2.55
Cash Equivalents 24 + Wachovia EOM balance43% 15% 100% 111,863,395.80$ 745,755,972.00$ 319,996,672.00$
Requirements
US Govt (USG) 19% 10% 100% 74,575,597.20$ 745,755,972.00$ 139,895,358.00$
USG + Agencies* #16 + #15 + #230% 25% 100% 186,438,993.00$ 745,755,972.00$ 224,644,573.00$
Constraints
Agencies #15+#2 11% 0% 45% -$ 335,590,187.40$ 84,749,215.00$
MBS #34 + #2 11% 0% 35% -$ 261,014,590.20$ 82,460,630.00$
Agency MBS 6% 0% 35% -$ 261,014,590.20$ 43,409,667.00$
Non-Agency MBS 5% 0% 15% -$ 111,863,395.80$ 39,050,963.00$
Corporates 45% 0% 60% -$ 447,453,583.20$ 332,379,569.00$
Corporates > 1 Year 24% 0% 40% -$ 298,302,388.80$ 175,876,287.00$
Munis 1% 0% 10% -$ 74,575,597.20$ 5,338,012.00$
Bond Funds 7 (pyramis+payden+dimensional)32% 0% 85% -$ 633,892,576.20$ 239,709,545.00$
Money Market Funds 5% 0% 40% -$ 298,302,388.80$ 34,748,715.00$
CDs 0% 0% 20% -$ 149,151,194.40$ -$
Repos 0% 0% 20% -$ 149,151,194.40$ -$
Specialty Risk
High Yield 4% 0% 7.5% -$ 55,931,697.90$ 30,913,822.00$
International 2% 0% 7.5% -$ 55,931,697.90$ 13,263,257.00$
Emerging Market 1% 0% 7.5% -$ 55,931,697.90$ 6,448,562.00$
Duration > 8.5 5% 0% 7.5% -$ 55,931,697.90$ 33,629,416.00$
Monthly Compliance: 3/31/2011

14
Investment Committee Members
• Voting Members:– Mickey Miller – Chief Financial Officer and Committee
Chair– Kerri Stewart – Chief Administrative Officer– Michael Givens – Treasurer– Kevin Stork – Comptroller– Kent Olson – Budget Officer– Joey Greive – Chief Investment Officer
• Non-Voting Members:– Kirk Sherman – Council Auditor– Thomas Carter – Council Auditor Staff
Committee members are specified in the Investment Policy Statement.

15
Glossary of Terms• Benchmark – An index used to compare the relative performance of a portfolio; it
should share many of the characteristics of the portfolio itself (credit quality, duration, sector allocation, etc.) and represent a feasible alternative to active management.
• Duration – A measure of how much a security will fluctuate in value when interest rates change. For example, a bond with a duration of 5.0 could be expected to decline in value by 5% for a 1% increase in interest rates. Lehman Aggregate Bond Index – A high quality index that is representative of the overall bond market. It is comprised of government, mortgage-backed, corporate, and asset-backed securities with a maturity of more than one year.
• Emerging Market – Bonds issued by countries whose economies are growing rapidly and modernizing, but not considered fully developed. They include Brazil, Russia, India, China, and Mexico, and while considered more risky than developed market bonds compensate investors with higher yields and often increased credit worthiness.
• High Yield – Bonds with a credit rating below Baa3 (Moody’s) or BBB- (Standard & Poors) that carry higher yields than investment grade bonds to compensate investors for the greater risk of default (failure to pay principal and/or interest when promised).
• MBS – Mortgage Backed Securities are mortgages that are bundled together and sold to investors, with cash flows representing homeowners’ monthly mortgage payments.
• Yield Curve – A graph that plots the yields of U.S. Treasury bond across the maturity spectrum. A ‘normal’ yield curve is upward sloping; that is, yields that increase as maturities lengthen.