city of laredo and webb county, texas · city of laredo and webb county, texas ... laredo and the...
TRANSCRIPT

City of Laredo and Webb County, Texas
CHACON CREEK WATERSHED
Flood Insurance Study Update Volume 1 of 2
November 1999
Prepared For: City of Laredo Webb County
RECEIVED
MAR 1 72000
Webb County Drainage District No.1 The Texas Water Development Board
Brown & Root
,.-.
-
Chacon Creek Watershed Flood Insurance Study Update
City of Laredo, Webb County, TX November 1999
Prepared For: City of Laredo Webb County
Webb County Drainage District No. 1 The Texas Water Development Board
Brown & Root Services Engineered by Halliburton Tech. Services, Inc.
A1 ------- -~. --.. -~.----
........ "", _-"I:. OF 11:. '\ ;~~! .. " ...... :r"f " , c;;, ••• '* .. ~ . , .. .. ,
". .. .. * I , .. .. ~.I .... . ~ ., ~.':"""""".'."""."""'j l SHASHI KRISHNAPPA .. ~ ................................. .. . , . : ~
'.~.. 83948 .•. ~ '" •or... <) 0 '<; ~ ,O;:."~ Ie E NS<i;.···~ ... ..;" "~$si· .. · .. · ''c.~c.''.;' \\~ ONAL .... _... " .... , ... " J~M 1U Ie 0/13/ 2~

TABLE OF CONTENTS
1.0 EXECUTIVE SUMMARY
2.0 INTRODUCTION
2.1 Purpose of Study
2.2 Authority and Acknowledgments
2.3 Coordination
3.0 AREA STUDIED
3.1 Scope of Study
3.2 Community Description
3.3 Principal Flood Problems
3.4 Flood Protection Measures
4.0 ENGINEERING METHODS
4.1 Hydrologic Analyses
4.2 Hydraulic Analyses
5.0 FLOOD PLAIN MANAGEMENT APPLICATIONS
5.1 Flood Boundaries
5.2 Floodways
6.0 BIBLIOGRAPHY AND REFERENCES
I

Figure 1 - Vicinity Map
Figure 2 - Watershed Key
Figure 3 - HEC-I Model Nodes
Figure 4 - HEC-I Schematic
Table 1 - Summary of Discharges
FIGURES
TABLES
Table 2 - Flow Frequency Data for the Rio Grande
Table 3 - Water Surface Elevations for Chacon Creek
Table 4 - Chacon Creek Floodway Data
Table 5 - Water Surface Elevations for Tributary 3 and 3A
Table 6 - Tributary 3 and 3A Floodway Data
Table 7 - Water Surface Elevations for Tributary 2
Table 8 - Tributary 2 Floodway Data
Table 9 - Water Surface Elevations for Tributary 1
Table 10- Tributary 1 Floodway Data
Table 11 - Water Surface Elevations for Tinaja Creek
Table 12- Tinaja Creek Floodway Data
II
Exhibit 1 - Flood Profiles
Exhibit 2 - Flood Hazard Maps
EXHIBITS
APPENDICES
Appendix A - Summary of HydrologiclHydraulic Analyses for Upper Chacon
Appendix B - Summary of HydrologiclHydraulic Analyses for Tributary 3 and 3A
Appendix C - Summary ofHydrologiclHydraulic Analyses for Lower Chacon
Appendix D - Summary of HydrologiclHydraulic Analyses for Tributary 2
Appendix E - Summary of HydrologiclHydraulic Analyses for Tributary 1
Appendix F - Summary of HydrologiclHydraulic Analyses for Tinaja Creek
III

FLOOD INSURANCE STUDY UPDATE FOR THE CHACON CREEK WATERSHED CITY OF LAREDO AND WEBB COUNTY, TEXAS
1.0 EXECUTIVE SUMMARY
The Chacon Creek Watershed Flood Insurance Study Update ("restudy") was prepared for the City of Laredo as part of the Flood Protection Plan for the Chacon Watershed. Brown & Root, Inc. was contracted by the City of Laredo on March 17, 1997 to develop a flood protection plan for the Chacon Creek Watershed. This Flood Insurance "restudy" was prepared for submission to FEMA for technical review, processing, and for updating the 1981 Flood Insurance Study reports and floodway maps.
For this study, basic data was obtained form the hydrologic and hydraulic models used in the 1981 FIS study. A new hydrologic model was developed for this restudy due to changed physical conditions in the watershed since 1981. This restudy also included the four major tributaries to the Chacon Creek. Only two tributaries were studied in detail in the 1981 FIS. In general, there was an increase in the 100-year peak discharge to the Chacon Creek based on the results of this restudy.
Hydraulic model for the Chacon Creek and its tributaries were developed based on new cross sectional data obtained from the "Digital Terrain Model" (DTM). A DTM was developed for the entire watershed with 2-foot interval contours. Cross sections for the HEC-2 backwater model were obtained from the DTM using the BOSS-RMS computer program. The elevation of bridges and other hydraulic structures were obtained through field topographic survey. Water Surface Elevations (WSEL) were determined for all the drainage channels for the 10-, 50-, 100-, and 500-yearfloods and were referenced to 1988 NAVD.
Floodways were determined for the Chacon Creek and tributaries using guidelines and specifications identified by FEMA. The Flood Hazard boundaries for the 100-year and 500-year floods were mapped digitally using the 2-foot contour interval DTM using BOSS-RMS. The Floodway boundary was also identified on the same map. Water surface profiles were plotted for all the modeled channels showing new WSEL's at key locations, such as bridge and culvert crossings.
Based on the results of this restudy, new areas that were originally outside the floodplain are now being included within the 100-year and 500-year floodplain. In general, the WSEL has increased for the Chacon Creek channel when compared to the results of the previous study. Most of the major drainage channels in the watershed are not capable of conveying the peak 100-year discharge without causing localized flooding.
1
2.0 INTRODUCTION
2.1 Purpose of Study
The City of Laredo and Webb County are experiencing rapid urbanization as a result of the North American Free Trade Agreement (NAFTA) and changes in the General Agreement on Tariffs and Trade (GATI). The U.S. Census Bureau has identified the City of Laredo as the second fastest growing municipality in the nation.
The previous study (In 1981) by the Federal Emergency Management Agency (FEMA) and the U.S. Army Corps of Engineers (CO E) developed the Flood Insurance Rate Map (FIRM) for the city, at a time when the city had over 3,800 blocks of unpaved streets and relatively little topographic data. Detailed flood calculations were limited to the relatively small urbanized portions of the watershed located within the city limits. Today, the streets have been paved, but topographic data remains limited and increased storm water runoff may be impacting the existing downstream developments.
This Flood Insurance Study Update investigates the existence and severity of flood hazards in the City of Laredo and Webb County, Texas, and aids In the administration of the National Flood Insurance Act of 1968 and the Flood Disaster Protection Act of 1973.
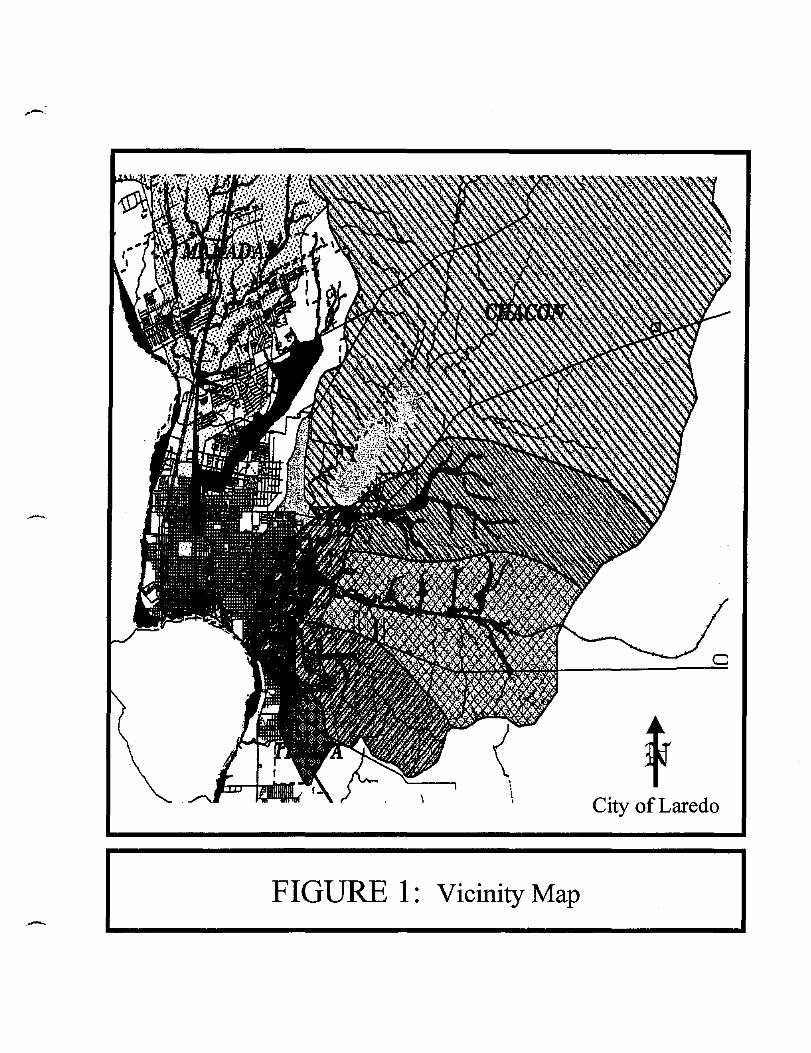
The study area is located in the Chacon Creek Watershed within the City of Laredo and the county of Webb, please refer to vicinity map, Figure 1. It also encompasses a portion of the Webb County Drainage District No.1, a participant in the project. The study area includes (to limited detail) all areas of the Chacon Creek watershed.
This study will be used to update and enhance the effective Flood Insurance Study information dated May 17, 1982 for portions of Chacon Creek and five tributaries.
2.2 Authority and Acknowledgments
The hydrologic and hydraulic analyses for this study were performed by Brown & Root Services, Houston, Texas, for the joint sponsors consisting of the City of Laredo, Webb County, Webb County Drainage Dristrict No.1, and the Texas Water Development Board (TWDB) under contract Resolution No. 96-R-155. The lead agency was the City of Laredo and the study was completed in March 1999.
2

2.3 Coordination
An initial coordination meeting, attended by representatives of the City of Laredo, the Texas Water Development Board, and representatives of Brown & Root, was held on May 20, 1997, to explain the nature and geographic limits of the study and review the administrative process for the study. A legal advertisement notice of beginning the study and stating its objectives was placed in a local newspaper in December 1996. During the course of the study, preliminary results of the hydrologic analyses have been discussed with the International Boundary and Water Commission (IBWC), the U.S. Army Corps of Engineers (COE), the United States Soil Conservation Survey (SCS), the Federal Emergency Management Agency (FEMA), and Michael Baker, Jr., Inc. (the Technical Consultant for FEMA) for their comments and concurrence. In addition, officials of the City of Laredo, Webb County, and Webb County Drainage District No.1., and the TWDB were periodically advised of the progress of the study.
3.0 AREA STUDIED
3.1 Scope of Study
Chacon Creek is one of the major drainage systems in Laredo and Webb County, Texas. Chacon Creek hasa drainage area of approximately 155 square miles that drain south and southwesterly into the Rio Grande. Within the Chacon Creek watershed there are five (5) distinct drainage systems. The channels studied by detailed methods were selected with priority given to all known flood hazard areas, and areas of projected development or proposed construction through January 1994. All development of hydrologic and hydraulic models for the various channels were developed and adjusted to the 1988 North American Vertical Datum, (NAVD).
This study will provide updated detailed topographic information for the drainage channels of the Chacon Creek watershed and provide critical base flood elevations, delineation of floodplains and floodways, hydrologic and hydraulic calculations necessary to evaluate the stormwater Infrastructure requirements.
This study will be used to update and enhance the existing Flood Insurance Study information dated November 17, 1981 for portions of Chacon Creek and five (5) tributaries within the City and County jurisdictional boundaries. The detailed studied streams consist of:
1.) Chacon Creek, from the Rio Grande upstream to Lake Casablanca, for a total length of 34,421 linear feet, and
2.) Tinaja Creek, Tributary to Chacon Creek at River Mile 0.20 for a total length of 7,315 linear feet, and
3

3.) Tributary No.1, Tributary to Chacon Creek at River Mile 1.84 for a total length of 14,607 linear feet, and
4.) Tributary No.2, Tributary to Chacon Creek at River Mile 3.28, for a total length of 31 ,348 linear feet, and
5.) Tributary No.3, Tributary to Chacon Creek at River Mile 6.12, for a total length of 18,012 linear feet, and
6.) Tributary No. 3A, Tributary to Tributary No.3 at River Mile 1.43, for a total length of 7,679 linear feet.
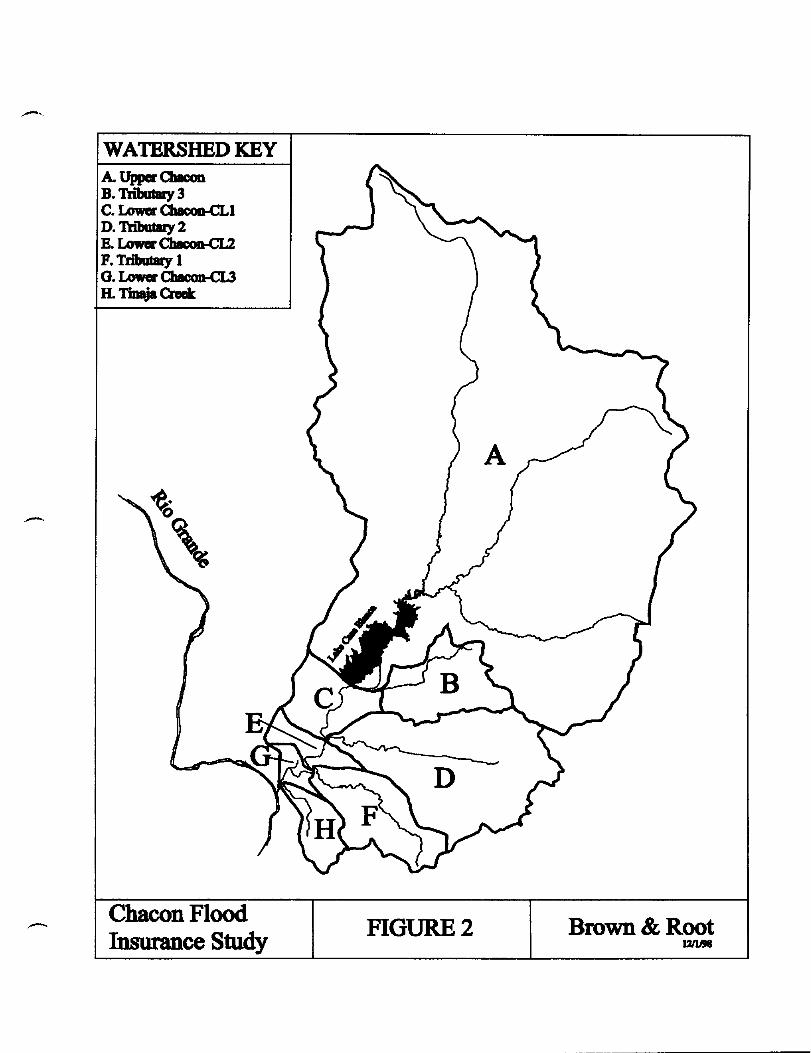
The limit of detail study for the streams can be seen on Figure 2.
3.2 Community Description
The City of Laredo was founded in 1755 by the Spanish Crown, at the confluence of the Rio Grande and the ChaconfTinaja arroyos. The City of Laredc;> is located on the U.S. border (with Mexico) approximately 150 miles southwest of San Antonio, Texas. Laredo is the principal city and population center of Webb County with an estimated 1995 population of 155,877 (Reference 1). The economy is based largely on agriculture, international commerce. tourism and retail sales. Approximately 60 percent of the total import-export trade between Texas and Mexico crosses at Laredo, and more than half of the total international tourist traffic leaving Texas through its seventeen ports of entry passes through Laredo.
The climate of the area is semi-arid the average annual temperature is 74.3 degrees Fahrenheit. The rural area consists of desert vegetation, experiencing an average of 19.85 inches of rain per year, but subject to intermittent downpours and flash flooding. On the average, between five and six days per year, one inch of rain will fall within a twenty four hour period, while two inches will fall during at least one day per year. Over the last several years, the rainiest day per year was 2.56 inches, although a five-inch rainfall occurs once every ten years on the average.
The topography of the Laredo area ranges from approximately 390 feet at the Rio Grande to 460 feet at Lake Casablanca and then extends up to an elevation of nearly 700 feet at the upper part of the Chacon Creek watershed limits. The average elevation of the City is approximately 438 feet nearly level to slightly rolling plains. Soils in the area are largely alluvial consisting of sands, clay, and gravel and combinations thereof. There are also outcrops of gray to light brown, well cemented sandstone (Reference 2).
4
3.3 Principal Flood Problems
The City of Laredo experiences flooding from several sources. The major source of flooding is the Rio Grande. In 1954, rainfall associated with Hurricane Alice produced the largest flood on the middle Rio Grande since 1865. Rises of 50 to 60 feet, or 30 to 40 feet above flood stage, occurred at Laredo within 48 hours (Reference 2). Construction of Amistad Dam and Reservoir, completed in 1969, significantly reduced the probability of severe flooding from the Rio Grande; however, flooding problems may still be experienced in low-lying areas.
There is limited documentation on flooding from Chacon Creek and its tributaries. Flooding problems are aggravated by inadequate channel capacity, flat topography in some areas, and constrictive bridge structures. Development is presently concentrated at the outfall locations of these drainage systems and is most sensitive to increased rates of run-off from upstream development. The rate of growth within the city and county makes the development an important concern. According to local residents, recent floods occurred in 1954, 1959, 1962, 1963, 1967, 1971 and 1972 (Reference 2).
The most recent flooding occurred during August 27 and 28, 1998 as a result of Tropical Storm Charley that dropped up to 18 inches of rain on the area around Del Rio, Texas. Del Rio is situated along the Rio Grande and is approximately 200 miles northwest of Laredo. The storm's rain caused a flood wave to accumulate in the Rio Grande and proceed downstream. It caused localized flooding in the Laredo area as a result of the backwater effect from the River. The highest gage reading at the International Bridge No.2 was 35.0 feet and the gage height is 351.44 feet and therefore the flood level was 386.44 feet above mean sea level. Brown & Root's staff engineers were present and recorded approximate high water marks such as: Chacon Creek at Meadows Street, (elevation 380,0 ft) the water level was up to the bottom of the bridge; Chacon Creek at Hwy 83, (elevation 385.5 ft) the water level was approximately 7.5 feet below the low chord of the bridge; Chacon Creek at Hwy 359, (elevation 381.5 ft) the water level was approximately 2.5 feet below the low chord of the bridge. Fortunately there were traces of light rain in Laredo and did not have to suffer through the combined effect of the flood wave and the additional local rainfall runoff.
3.4 Flood Protection Measures
As previously mentioned, potential flood problems created by the Rio Grande have been significantly reduced by the construction of Amistad Dam and Reservoir on the Rio Grande approximately twelve miles northwest of Del Rio, Texas. The dam was completed in 1969, and has a flood control storage capacity of 5,249,700 acre-feet (Reference 2).
5

Construction of Country Club Dam on Chacon Creek just upstream of U.S. Highway 59 was completed in 1951. The reservoir, Lake Casablanca, is owned by the County and was created primarily for recreational purposes. However, the dam and reservoir do offer some degree of flood protection downstream. Outlet works provided in the structure consist of an uncontrolled earth-cut spillway. Additional improvements were constructed in the mid-70's. Under Phase I Modifications which were completed by June 1976, the crest of the dam was raised to elevation 465.4 feet mean sea level. Under Phase II Modifications the crest of the dam was raised to 467.0 feet (Reference 4). At the top of the dam elevation (467 feet), the lake has an impoundment capacity of 77,800 acre-feet. Casa Blanca Dam is classified as a high hazard structure. In the event of failure, loss of downstream life and property could be extensive. The elevation of the service spillway crest is 446.4 feet and that of the emergency spillway is 458.6 feet, means sea level. The combined service and emergency discharge capacity at elevation 467 feet is 177,000 cubic feet per second (cfs) (Reference 4).
Recent flood protection measures have been constructed for Tinaja Creek. Since 1981, approximately 1600 linear feet of the Tinaja Creek channel has been concrete lined from Louisiana Street to Pine Street. Two new detention basins have been constructed within the watershed. One detention basin constructed in 1996 is located east of Ejido Street and the other basin constructed in 1988 is located south of Chacota Street, adjacent to the Zachery Elementary School. No other major flood control improvements have been constructed in the Chacon Creek watershed.
4.0 ENGINEERING METHODS
For the flooding sources studied in detail in the community, standard hydrologic and hydraulic study methods were used to determine the flood hazard data required for this study. Flood events of a magnitude which are expected to be equaled or exceeded once on the average during any 10-, 50-, 100-, and 500-year period (recurrence intervals) have been selected as having special significance for flood plain management and for flood insurance premium rates. These events, commonly termed the 10-, 50-, 100-, and 500-year floods, have a 10, 2, 1, and 0.2 percent chance, respectively, of being equaled or exceeded during any year. Although the recurrence interval represents the long-term average period between floods of a specific magnitude, rare floods could occur at short intervals or even within the same year. The risk of experiencing a rare flood increases when periods greater than one year are considered. For example, the risk of having a flood which equals or exceeds the 1 DO-year flood (one percent chance of annual occurrence) in any 50 year period is about 40 percent (four in ten), and for any 90 year period, the risk increases to about 60 percent (six in ten). This analyses reflects the flooding potentials based on conditions existing in the community as of January 1994 when aerial photographs were taken and input into a GIS database.
6

4.1 Hydrologic Analyses
Hydrologic analyses to compute peak discharges for the Chacon Creek Watershed were determined using the HEC-1 program for storms of selected recurrence intervals.
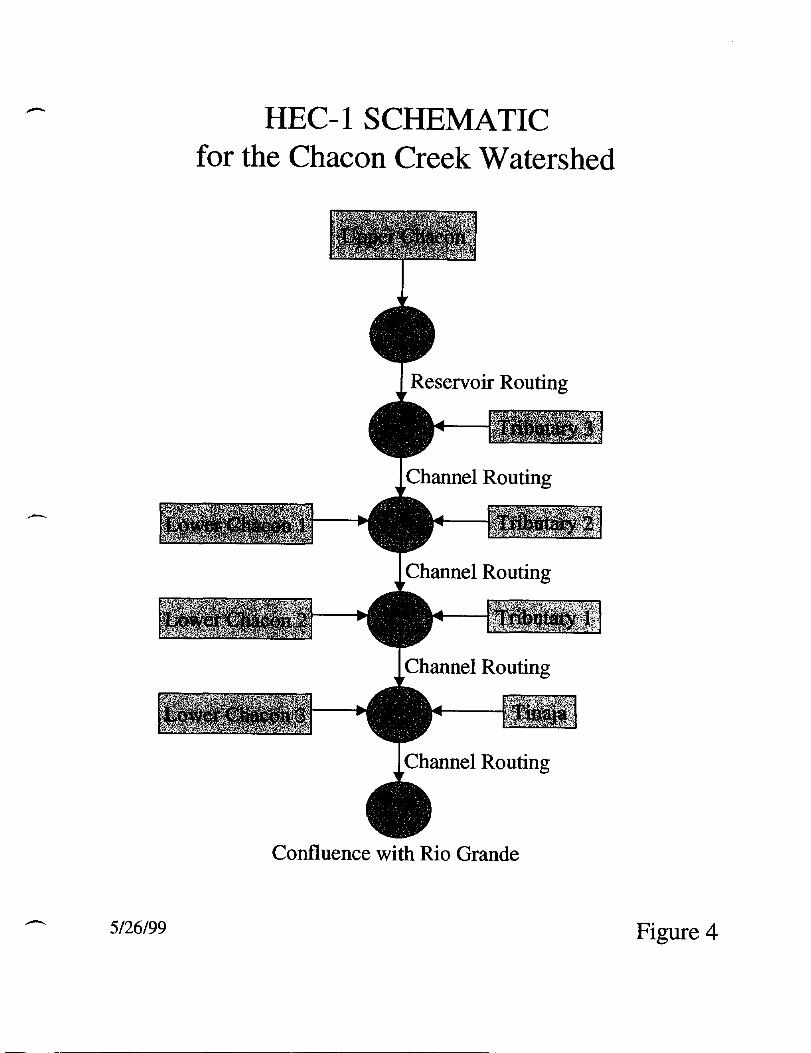
The Chacon Creek watershed has an approximate drainage area of 155 square miles and discharges into the Rio Grande. For this study, the watershed was divided into eight subbasins. The sizes of the subbasins ranged from 1 square mile to 117 square miles. The subdivision was necessary to obtain the information needed in terms of level of detail and location as dictated by the objectives of the study. A Schematic of the Chacon Creek watershed identifying the subbasins and tributaries is presented in Figure 2.
Previous hydrologic studies for this watershed were performed by the Federal Emergency Management Agency (FEMA). The first part of the study (Reference 2) was completed in November 1981 and covered the entire incorporated area of the City of Laredo. In this study, the Chacon Creek was studied from Laredo's southern City Limit (Node 4) to the northern City Limit (Node 2). Figure 2 identifies the model nodes that were used in this study. Tributary 1 was studied from the confluence of Chacon Creek to a station 8,580 linear feet upstream (near Vicente Street). In this FIS Update, Tributary 1 is referred to as Tinaja Creek.
The second part of the study (Reference 3) also completed in November 1981 included unincorporated areas of Webb County, Texas. In that study, Chacon Creek was studied (in detail) from its intersection with the Laredo northern City Limit (Node 2) to Lake Casa Blanca (Node 1). The limits of detailed study for Tributary 2 extended from its confluence with Chacon Creek (Node 2) to station 11,780 feet upstream. In this FIS Update, Tributary 2 is referred to as Tributary 1.
Copies of all information including the computer printout of the HEC-1 and HEC-2 models were obtained from the FEMA library. The study information submitted by URS/Forrest and Cotton, Inc., as part of the 1981 Flood Insurance Study was also obtained. This information was reviewed for methodology and approach. The Dam Safety Report for Lake Casa Blanca Dam (Reference 4) prepared by the Fort Worth District, U.S. Army Corps of Engineers (COE) was also reviewed. In accordance with FEMA guidelines, the results of these previous studies were adopted as a starting point for the present study.
For the purpose of these detailed hydrologic analyses, flood frequency data was developed using the rainfall data from TP-40 (Technical Paper No. 40- Rainfall Frequency Atlas of the United States), published by the National Weather Service (Reference 5). Peak discharge-frequency relationships were determined by performing hydrologic analyses for floods of the selected recurrence intervals for
7
each sub-basin studied in the watershed. The COE HEC-1 program (Reference 6) was used to simulate the precipitation-runoff process and compute flood hydrographs at appropriate locations in the watershed.
The peak discharges (0) for Chacon Creek and its tributaries were calculated using the methodology developed by the Soil Conservation Service (SCS). The SCS method of estimating direct runoff from the storm rainfall (Reference 7) is based on procedures developed by SCS hydrologists over the last five decades. The hydrologic parameters used to determine peak flows included rainfall data, watershed data, and soil properties. Soils in the Chacon Creek study area were divided into three groups based on the minimum rate of infiltration of each soil subject to various saturation levels. The physical parameters of each soil type and group classification was determined following a field reconnaissance of the watershed and the use of the Soil Survey of Webb County, Texas, published by the Department of Agriculture in October 1985 (Reference 8). Each hydrologic basin in the watershed was divided into the percentage of contributing soil group classification and land use cover. A composite SCS curve number was determined. This curve number described the physical parameters of each hydrologic subbasin for development conditions existing in January 1994 (the date of the aerial orthophotos from the City of Laredo and Webb County). The additional parameters were determined from the available aerial photographs and the digital terrain model (DTM) of the drainage basins (Reference 9).
The SCS curve numbers were used in the computation of the initial and uniform loss rate parameters for each subbasin in the HEC-1 input data set. These loss parameters account for rainfall losses due to surface interception, depression storage and infiltration. The loss rates for the existing conditions were calculated using the SCS soil loss methodology and were consistent with the previous Flood Insurance Study. The rainfall excess for each subbasin was transformed into surface runoff using the Snyder Unit Hydrograph routine in the United States Army Corps of Engineers (COE) HEC-1 program. The SCS equation was used to estimate the watershed lag time (TL) for each subbasin.
The Snyder's coefficients utilized in the 1981 FIS study for the determination of the synthetic unit hydrographs were taken from the COE Detailed Project Report for Flood Control of Zacate Creek (Reference 10). Using the 1981 HEC-1 model parameters (unit hydrograph and losses), it was possible to reproduce the results of the 1981 FIS. However, these parameters were not used in the FIS study update HEC-1 models due to change in the hydrologic conditions.
In the 1981 FIS, the effects of reservoir routing on peak discharges upstream of the Lake Casa Blanca dam was determined using the HEC-1 program with 24-hour rainfall depths. However, for the drainage basins below the Lake, peak flows were determined based on 6-hour rainfall depths using the SCS method. In this study, the peak discharges for all the hydrologic basins in the Chacon Creek
8

watershed were determined using the HEC-1 program with 6-hour rainfall depths taken from the U.S. Weather Bureau Technical Paper TP-40 (Reference 5). The basins were subdivided to delineate the watershed and to accurately model the rainfall runoff process. Due to this subdivision and the increased urbanization between 1981 and January 1994, the unit hydrograph parameters were recalculated based on the SCS methodology. These computations are presented for each stream studied in their respective appendices.
The parameter calibration option of the HEC-1 program was not used to estimate the unit hydrograph parameters because of the absence of gauged basins in the region. An additional step (the use of regional regressional equations suggested by. FEMA) was incorporated in an attempt to verify tabulated flows generated in these studies. The U.S. Geological Survey (USGS) Report 94-4002 (Reference 11), defining the regional regression equations for estimating peak discharges for ungaged sites was reviewed. However, due to inadequate data for this region, the USGS did not provide a regional regression equation for estimating peak discharges.
Rainfall depths used in the computation of· runoff from each subbasin were modified using depth-area curves developed by the SCS (Reference 12). A precipitation hyetograph was used as input in the HEC-1 model for all runoff calculations. The time distribution of rainfall was based on the pattern that was used in the 1981 FIS. The time distribution of rainfall in this pattern is such that the maximum 1-hour rainfall depth is contained within the maximum 6-hour rainfall depth. Because all of the critical storm depths are contained within the storm distributions, the distributions were appropriate for designs on both small and large watersheds (Reference 13).
The HEC-1 model for the Chacon Creek watershed was developed to analyze the effects of increased urbanization and other changes in runoff response associated with items such as channelization or changes to the watershed in general. The components of this model include subbasin runoff, reservoir routing, channel routing, and hydrograph combination. A schematic of the Chacon Creek watershed HEC-1 model showing the computational sequence is shown in Figure 4 The 10-, 50-, 100-, and 500-year frequency HEC-1 models were developed for the Chacon Creek watershed and represent the existing January 1994 Land-Use conditions. The results from the HEC-1 models are summarized in Table 1, "Summary of Discharges". This table lists the peak flow for the 10-, 50-, 100-, and 500-year frequencies for the existing conditions at appropriate locations in the watershed.
The results of the Updated Study (1994) conditions model were compared with the results of the 1981 Flood Insurance Study (FIS). A comparison of these results is also presented in Table 1, "Comparison of Discharges Based on Existing
9
Condition (1981 vs 1994)". A description of each of the eight hydrologic basins are presented below:
A. Upper Chacon Creek Watershed
The Upper Chacon (CU) subbasin has a total drainage area of approximately 116.9 square miles. The Upper Chacon Creek watershed includes the Tios and the San Ygnacio Creeks. The approximate drainage areas of these two basins are 22.11 and 34.21 square miles respectively. The runoff from this hydrologic basin drains into Lake Casa Blanca. This basin falls under The SCS hydrologic soil Group "C", has a SCS curve number of 79, and approximately 94 % of this basin area is undeveloped. There has been no significant urbanization in the basin between 1981 and 1994. The updated 100-year peak discharge for this basin is 36,918 cfs, as compared to a peak discharge of 33,821 cfs in the 1981 FIS HEC-1 Model. This represents a 10 % increase in peak discharge between 1981 and this study. .
A detailed investigation of the 1981 FIS revealed some modeling inconsistencies for the CU subbasin. An incorrect application of the Depth Area Reduction Factor (DARF) in the 1981 FIS resulted in lower peak discharges. In this update, the DARF was applied based on depth area curves developed by the SCS. This factor attributed to the increases in peak discharge between 1981 and 1994. The results of the Hydrologic analyses for Upper Chacon are presented in Appendix A. No detailed hydraulic analyses were performed for this area in compliance with the City's contract and identified scope of work.
The reservoir routing option of HEC-1 was used to calculate the storage within the lake for the different return frequencies. The storage versus discharge relationship for the Lake Casa Blanca spillway was obtained from the spillway rating curve in the Phase 1 Inspection Report for the lake (Reference 4). The stage-storage relationship for the lake was determined using volume calculations derived from the 2-feet interval Digital Terrain Mode/. For the 100-year return frequency, Lake Casa Blanca attenuates 39 % of the peak discharge from the Upper Chacon basin. The 100-year peak flow discharging downstream to the Chacon Creek is 22,535 cfs
B. Tributary 3 and 3A
The Tributary 3 and 3A channels have a total drainage area of approximately 5.96 square miles. These tributaries drain into Chacon Creek just downstream of the Lake Casa Blanca Spillway (Node 1). For the HEC-1 model, Tributary 3 was divided into five subbasins. The size of these subbasins varied from 0.67 square miles to 2.1 square miles. Tributary 3 and 3A fall under the SCS hydrologic soil Group C. The SCS curve numbers for these subbasins range from 79 to 82, and approximately 95 % of this basin area is undeveloped.
10
--_._-----------------
The Tributary 3 and 3A channels were not studied or modeled in the 1981 FIS. However, under the scope of this study, the Tributary 3 and 3A subbasins were included in the HEC-1 model. The results of the Hydrologic analyses for Tributary 3 and 3A are presented in Appendix B. From the HEC-1 model, the 100-year peak discharge for Tributary 3 channel at the confluence of Chacon Creek is 5,550 cfs.
C. Lower Chacon (Area CL 1)
The CL 1 subbasin has a total drainage area of approximately 4.06 square miles. The runoff from the CL 1 basin drains directly into Chacon Creek. In the HEC-1 model, the runoff from CL 1 is combined with Tributary 2 and Chacon Creek at Node 2. CL 1 is classified under the SCS hydrologic soil Group B, and the SCS curve number for this basin is 81. This basin is within the City Limits of Laredo, and the land use is predominantly industrial/commercial with approximately 37 % undeveloped.
The peak discharges for the CL 1 basin were not computed separately in the 1981 FIS. The result of the hydrologic analyses for CL 1 is presented in Appendix C. From the HEC-1 model, the 100-year peak discharge for the CL1 subbasin is 3,810 cfs.
D. Tributary 2
The Tributary 2 channel has a total drainage area of approximately 15.98 square miles. This tributary drains to Chacon Creek just south of the Texas Mexican Railroad Bridge (Node 2). For the HEC-1 model, Tributary 2 was divided into eight subbasins. The sizes of these subbasins vary from 1.37 square miles to 3.74 square miles. Tributary 2 falls under the SCS hydrologic soil Group B and the SCS curve numbers for these basins range from 69 to 72. Approximately 80 % of this basin area is undeveloped.
Tributary 2 was not studied and modeled in the 1981 FIS. However, under the scope of this study, the Tributary 2 subbasin is included in the HEC-1 model. The results of the Hydrologic analyses for Tributary 2 is presented in Appendix D. From the HEC-1 model, the 100-year peak discharge for Tributary 2 is 8,982 cfs.
E. Lower Chacon (Area CL2)
The CL2 subbasin has a total drainage area of approximately 1.88 square miles. The runoff from the CL2 basin drains directly into Chacon Creek. In the HEC-1 model, the runoff from CL2 is combined with Tributary 1 and Chacon Creek at Node 3. The CL2 basin is classified under SCS hydrologic soil Group B and the SCS curve number for this basin is 81. Approximately 37 % of this basin area is undeveloped.
11

The peak discharges for the CL2 basin were not computed separately in the 1981 FIS. The result of the hydrologic analysis for the CL2 basin is presented in Appendix C. From the HEC-1 model, the 100-year peak discharge for the CL2 subbasin is 2,889 cfs.
F. Tributary 1
The Tributary 1 channel has a total drainage area of approximately 6.20 square miles. The Tributary 1 channel joins Chacon Creek just south of US Highway 359 (Node 3). For the HEC-1 model, the Tributary 1 basin was divided into five subbasins. The sizes of these basins vary from 1.0 square mile to 1.54 square miles. Tributary 1 falls under the SCS hydrologic soil Group B and the SCS curve numbers for these basins range from 69 to 78. Approximately 87 % of this basin area is undeveloped.
This Tributary 1 channel (formerly known as Tributary 2) was not studied in detail during the 1981 FIS. We were unable to verify the hydrologic data for Tributary 2. For this study. approximately 13 % this basin has been urbanized. A major portion of this development is residential. One regional detention pond has been constructed in this basin for flood mitigation. This detention pond is located in the Los Presidentes area and is designed to handle a peak discharge of 239-cfs (Reference 14). The storage from the detention basin was incorporated in the HEC-1 model when computing the runoff for the Tributary 1 channel. The results of the Hydrologic analyses for the Tributary 1 channel are presented in Appendix E.
From the HEC-1 model, the 100-year peak discharge for Tributary '1 at the confluence with Chacon Creek is 5,143 cfs. From the 1981 FIS report for Tributary 2, the computed peak discharge at the same location is 5,740 cfs. This represents approximately a 10 % reduction in peak discharge. Hard copies of the 1981 FIS HEC-1 report were reviewed to verify the previously computed discharge. Based on this update, the computed 100-year peak discharge for a 24-hr storm was 4,058 cfs. Similarly, the corresponding peak discharge for the 6-hr storm was 5,172 cfs. There is a discrepancy between the computed and reported discharge for this basin in the 1981 FIS. The lower peak discharge may also be attributed to the detailed analyses conducted in this study, which accounted for the storage and attenuation of the peak discharges within the channel. This factor was not considered in the 1981 FIS.
G. lower Chacon (Area Cl3)
The CL3 subbasin has a total drainage area of approximately 1.0 square mile. The runoff from the CL3 basin drains directly into Chacon Creek. In the HEC-1 model, the runoff from the CL3 basin is combined with Tinaja Creek and Chacon
12
Creek at Node 4. The CL3 basin is classified under the SCS hydrologic soil Group B and the SCS curve number for this basin is 81. Approximately 37 % of this basin area is undeveloped.
The peak discharges for this CL3 basin were not computed separately in the 1981 FIS. The result of the hydrologic analyses for the CL3 basin is presented in Appendix C The 100-year peak discharge from the CL3 basin is 1,549 cfs.
H. Tinaja Creek
The Tinaja Creek channel has a total drainage area of approximately 2.50 square miles. Tinaja Creek drains into Chacon Creek at Meadow Avenue (Node 4). For the HEC-1 model Tinaja Creek was divided into three basins. The sizes of these subbasins vary from 0.64 square mile to 1.12 square miles. The Tinaja Creek basin falls under the SCS hydrologic soil Group B and the SCS curve numbers for these basins range from 74 to 85. Approximately 52 % of this basin area is undeveloped.
The Tinaja Creek channel (formerly known as Tributary 1) was studied in detail during the 1981 FIS. For this study, approximately 48 % this basin has been urbanized. A major portion of this urbanization is residential in nature. Two new regional detention facilities have been constructed in this basin to mitigate the existing flooding problems. The first detention basin was constructed in 1988 and is located south of Chacota Street. adjacent to the Zachery Elementary School. The second detention basin was constructed in 1996 and is located east of Ejido Street. Approximately 1,600 linear feet of earthen channel located between Louisiana Street and Pine Street has been concrete lined to improve the hydraulic capacity and conveyance of the channel.
The design storage within the two detention basins was incorporated into the HEC-1 model. From this study, it has been determined that the construction of two detention basins has reduced the 100-year peak discharge for the Tinaja watershed by 638 cfs. The 100-year peak discharge for Tinaja Creek subbasin at the confluence of Chacon Creek is 2,108 cfs. In the 1981 FIS report, the computed peak discharge at the same location was 2,920 cfs. This represents a 28 % reduction in peak discharge. The Tinaja Creek basin was not modeled using HEC-1 in the 1981 FIS. Peak flows were determined based on 6-hour rainfall depths using the SCS method. Hard copies of the hydrologic calculations for the Tinaja Creek basin, that were submitted as part of the 1981 FIS were reviewed to verify the previously computed discharge. Based on these calculations, the 100-year peak discharge for Tinaja Creek at the same location is 2,110 cfs. There is a discrepancy between the computed and reported peak discharge for this basin in the 1981 FIS.
13
However, for this study, the Tinaja Creek basin was modeled using HEC-1 to incorporate the storage in the channel and the detention basins. The results of the Hydrologic analyses for Tinaja Creek are presented in Appendix F.
4.2 Hydraulic Analyses
Detailed analyses of the hydraulic characteristics of the Chacon Creek channel and its tributaries were carried out to compute water surface profiles for various flood frequencies. Water surface profiles for these channels were computed for the 10-, 50-, 100- and 500-year return frequencies. The U.S Army Corps of Engineers (CO E) Hydrologic Engineering Center's (HEC-2) water surface profile computer program (Reference 15) was used for the analyses. The HEC-2 program has been revised and upgraded several times since the HEC-2 modeling in the 1981 FIS. These revisions typically make corrections to the program and usually result in higher WSEL's for the same HEC-2 data set executed with the old and the newer versions of the HEC·2 program. The HEC-2 program calculates the water surface profiles for varied flow in natural or constructed channels. The effect of obstructions to flow such as bridges and culverts, and the energy losses in the channel associated with these structures can be modeled using the HEC-2 program. The computational procedure is generally known as the "Standard Step Method" This program was also used to evaluate floodway encroachments and to designate flood hazard zones. These computations are presented for each studied stream in their respective appendices. Included are the results of the flood hazard and the floodway HEC-2 models.
In addition, the River Modeling System (BOSS-RMS) computer program developed by Boss International (Reference 16) was used. BOSS RMS is a highly advanced AutoCAD based computer program. It has been developed to automate most of the engineering tasks required to model and analyze water surface profiles using HEC-2 and HEC-RAS. The analysis engines used by BOSS RMS are the HEC-2 and the HEC -RAS (Reference 17) computer programs.
Cross sections for the drainage channels modeled in HEC-2 were obtained from the Digital Terrain Model (DTM). The 2-foot contour interval DTM was developed for this study by Tobin International, Ltd., (Reference 8) using aerial photogrammetry and Global Positioning System (GPS) technology. Field surveying using 3rd order accuracy established the horizontal and vertical ground control. All elevations are referenced to the National Geodetic Vertical Datum (NGVD) of 1929, formerly referred to as Sea Level Datum of 1929 and were updated to the North American Vertical Datum of 1988 (NAVD). BOSS-RMS was used to generate cross sections across the channels and input details at bridge and culvert crossings. The cross section data of the channel was exported into an HEC-2 model for computing water surface profiles and floodways. All bridges and cUlverts were field checked and surveyed to obtain elevation data. This geometric elevation data at bridges and culverts were verified by using construction
14

plans/drawings obtained from the City of Laredo, the COE, and the Laredo District, State Department of Highways and Public Transportation (TxDOT).
Channel roughness coefficient factors (Manning's "n") used in the hydraulic computations were chosen by engineering judgment and based on field observations for the streams and flood plain areas. The "n" values used for various channels in the watershed have been listed below. These values were modified at locations where sections of channel were concrete lined. These concrete lined reaches, bridges etc were modified to use a 0.015 Manning's "n" value.
Roughness Values (Manning's n)
Stream Channel Flood Plain
Chacon Creek 0.032-0.085 0.040-0.080
Tinaja Creek 0.025-0.085 0.040-0.090
Tributary 1 0.025-0.085 0.040-0.090
Tributary 2 0.025-0.085 0.040-0.090
Tributary 3 0.025-0.085 0.040-0.090
Tributary 3A 0.025-0.085 0.040-0.090
It was determined from the hydrologic analyses that the tributaries studied within the Chacon Creek watershed would not peak at the same time as the Chacon Creek channel. Therefore, the starting water surface profiles elevations for all tributaries to the Chacon Creek channel was calculated using the slope-area method. Historically most of the flooding damages in the lower reach of the Chacon Creek channel were due to the backwater effect of the Rio Grande. Therefore, for the Chacon Creek channel HEC-2 model, the 100-year backwater elevation of the Rio-Grande at the confluence of Chacon Creek was used as the starting water surface elevation. Peak discharges calculated using the HEC-1 model were used as input in the HEC-2 model to calculate the water surface profiles. The multiple profile option of HEC-2 was used to compute water surface profiles for various return frequencies for Chacon Creek and five tributaries. A brief description of the HEC-2 models for the various channels are presented below:
15

Rio Grande
The Rio Grande was not studied in detail as part of this project. As described in the 1981 FIS report, the Rio Grande was studied in detail during the 1981 FIS for the unincorporated areas of the Webb County. The backwater effect from the Rio Grande was used in projecting the starting water surface profiles for the Chacon Creek and mapping the flood boundaries. As part of this study, the IBWC was contacted to verify these WSEL's and discharges. Based on the discussion with the IBWC, the WSEL's at this location (close to International Bridge No.2) had significantly increased from the 1981 levels. The WSEL for the 100-year return frequency storm at the confluence with Chacon Creek has increased by 3.6 feet. This updated information for the Rio Grande was used in projecting the backwater effect on the Chacon Creek Watershed Flood Hazard Boundary Map. A tabulation of WSEL's for the Rio Grande for various return frequencies are presented in Table 2 "Flow Frequency Data for the Rio Grande (at Laredo)". .
Chacon Creek
The Chacon Creek channel begins at the Rio Grande, just south of Meadows Avenue and extends upstream to Lake Casablanca, The total length of the Chacon Creek channel is approximately 6.52 miles, The downstream end of Chacon Creek channel runs through the City limits of Laredo, and the upstream end runs through the Webb County limits. In the previous study, Chacon Creek was modeled from a station located at a distance of 1,380 feet from the confluence of the Rio Grande, and extending upstream for a distance of 30,075 linear feet (the limit of detail study), In this study, Chacon Creek is modeled from the confluence of the Rio Grande on the downstream end and extending for a distance of 34,421 linear feet (the limit of detail study) south of the Lake Casablanca spillway. The average slope of this channel is 14.5 feet per mile. The Chacon Creek channel is not maintained leading to the growth of vegetation and brush at many locations in 'the channel.
The results of the HEC-2 model for the Chacon Creek channel are presented in Table 3 'Water Surface Elevations for Chacon Creek". The WSEL's are tabulated at key locations along the channel, such as the location of bridges. The computed WSEL's are compared with the WSEL's that were computed using the HEC-2 model in the 1981 FIS, Elevation of hydraulic structures (bridges) located across the Chacon Creek channel is also presented in Table 3.
From this analysis, the 1 O-year WSEL would exceed the elevation of the top of the roadway at four locations, Highway 359, the Texas Mexican Railroad, Clark Blvd., and Highway 59. The critical bridge section is at the Texas-Mexican Railroad Bridge, The constriction to the flow area of the channel at this bridge Significantly raises the WSEL at all upstream locations. This bridge opening is hydraulically
16
inadequate to accommodate the 1 DO-year peak discharge, resulting in an increase of 9 feet in WSEL between the downstream and the upstream bridge locations.
The WSEL's for the 1 ~O-year storm in the 1981 FIS also exceeded the top of the road elevations at the above locations. In general, the computed WSEL's in this analysis were higher than the WSEL's that were obtained from the 1981 FIS. The increase in the WSEL for the 1 DO-year storm ranged from 1.5 to 5.8 feet. The increase in peak discharges (2,939 cfs at the Tex-Mex Railroad Bridge) between 1981 and this study has resulted in higher WSEL's. This increase was the result of the DARF (Depth Area Reduction Factor) previously mentioned in the hydrologic methodology and the newer versions of the HEC-2 program. The results of the hydraulic analyses for Chacon Creek are presented in Appendix A.
Tributary 3 and 3A
Tributary 3 of Chacon Creek begins at river mile 6.12 of Chacon Creek, just downstream of the Lake Casablanca spillway, and extends upstream for a distance of approximately 3.4 miles (the limit of detail study). The average slope of this channel is 35 feet per mile. The only major hydraulic structure located across Tributary 3 is a culvert at U.S. Highway 59. Tributary 3 was not studied in the 1981 FIS. In this study, Tributary 3 is modeled from the confluence of the Chacon Creek and extends upstream for a total distance of 18.032 linear feet (the limit of detail study). Tributary 3A begins at river mile 1.43 of Tributary 3 and extends upstream for a distance of 1.45 miles (the limit of detail study). Tributary 3A is modeled from the confluence of Tributary 3 and extends upstream for a total distance of 7,679 linear feet (the limit of detail study). No major hydraulic structures are located across Tributary 3A.
The results of the HEC-2 model for Tributary 3 and 3A are presented in Table 5 "Water Surface Elevations for Tributary 3 and 3A". The WSEL's at different crosssections, including the elevations at the Highway 59 culvert is presented in Table 5. It can be seen from these analyses that the 10-year and the 50-year WSEL's will not exceed the roadway elevation at the U.S. 59 crossing. However. the 100-year WSEL will exceed the roadway elevation at thiS location. The results of the hydraulic analyses for Tributary 3 and 3A are presented in Appendix B.
Tributary 2
Tributary 2 of Chacon Creek begins at river mile 3.28 of Chacon Creek and extends upstream for a distance of approximately 5.9 miles (the limit of detail study). Most of this channel extends outside the City limits of Laredo. Tributary 2 is a well-defined channel downstream of the Texas-Mexican Railroad Bridge, which is located approximately 6,500 linear feet from the downstream end. Upstream of this bridge, the channel is not well defined and is covered with vegetation and brush. Upstream of the Railroad Bridge the channel splits into two
17
separate channels with a ridge (embankment) located at the center of the section. The railroad is located on this embankment with channels on either side covered with vegetation and thick brush. The average slopes of these channels are 23 feet per mile. There are hydraulic structures located across Tributary 2, which are the Loop 20 bridge, and the Texas-Mexican Railroad Bridge. Tributary 2 was not studied in the 1981 FIS. In this study, Tributary 2 is modeled from the confluence of Chacon, and extending upstream for a total distance of 31,348 linear feet (the limit of detail study).
The results of the HEC-2 model for the Tributary 2 channel are presented in Table 7 "Water Surface Elevations for Tributary 2". This table also provides the WSEL's at the two bridges. Elevation of hydraulic structures (bridges) located across Tributary 2 are also presented in Table 7.
From these analyses, it can be observed that the two bridges located across Tributary 2 are safe against overtopping from a 1 ~O-year frequency storm. However, based on the modeled results, the 1 ~O-year storm will flood the railroad in the upstream reaches of the study area. The results of the hydraulic analyses for Tributary 2 are presented in Appendix D .
. Tributary 1
Tributary 1 of Chacon Creek (formerly Tributary 2) begins at river mile 1.87 of Chacon Creek and extends upstream for a distance of approximately 14,607 linear feet. Most of this channel extends outside the City limits of Laredo. Tributary 1 is a natural (earthen) grass lined channel with thick vegetation and brush. The average slope of this channel is 32 feet per mile. The lower reach of the channel runs through the city limits of Laredo.
The major hydraulic structures located across Tributary 1 are at Loop 20, Century City Blvd., and just east of Century City Street. These are all culvert crossings of various sizes. In the 1981 FIS, Tributary 2 (now Tributary 1) was modeled from the confluence of Chacon Creek and extended upstream for a total distance of 11,780 linear feet. In this study, Tributary 1 is modeled from the confluence of Chacon Creek and extends upstream for a total distance of 14,607 linear feet (the limit of detail study).
The results of the HEC-2 model for Tributary 1 IS presented in Table 9 "Water Surface Elevations for Tributary 1". The WSEL's are tabulated at key locations along the channel such as culvert crossings. The computed WSEL's were compared with the water surface profile elevations that were included in the 1981 FIS report. Elevations of the hydraulic structures (culverts) located across the Tributary 1 channel are presented in Table 9.
18

The WSEL resulting from a 10-year frequency storm would exceed the roadway crown elevations at all the three culvert crossings (Loop 20, Century City Blvd., and just east of Century City). The computed WSEL's at Loop 20 and Century City Blvd were lower than the WSEL's that were reported in the 1981 FIS, ranging from 0.5 to 4.6 feet.
The 100-year peak discharge (from this analysis) of 5,143 cfs was lower than the peak discharge of 5,740 cfs that was in the 1981 FIS. It was also reported by the Texas Department of Transportation (TxDOT), Laredo, that the downstream reach of Tributary 1 channel is subjected to severe scouring. This problem was noticed
. at the Loop 20 culvert, and has resulted in structural modifications to the culvert. The scouring problem has also resulted in lowering the flowline elevation of the channel and thus resulted in lower WSEL's along the channel. The results of the hydraulic analyses for Tributary 1 are presented in Appendix E.
Tinaja Creek
The Tinaja Creek channel begins at river mile 0.20 of Chacon Creek, just south of Meadows Avenue. This channel was modeled for approximately 7,400 linear feet and extends to Pine Street (the limit of detail study). The average slope of this channel is 45 feet per mile. The downstream and upstream end of this channel has steep slopes, whereas the middle section of the channel is relatively flat. The Tinaja Creek channel and the surrounding subdivision (Santo Nino) have been subjected to severe flooding in the past. The City of Laredo has completed several projects to help with the flooding problems along the Tinaja Creek channel. Approximately 1,600 linear feet of earthen channel between Louisiana Street and Pine Street (that was prone to flooding) has been concrete lined. The flowline. (invert) of the channel has also been lowered. New culverts have been built at Louisiana Avenue, San Salvador Street, Pine Street and Chesnut Street. The unlined (earthen) channel extends between Meadows Avenue and Louisiana Street for approximately 5,800 linear feet. This reach of the channel is not well maintained leading to the growth of brushes and trees at some locations. At the downstream end of the channel at Meadows Avenue, debris and heavy brush in the channel are constricting flow in the channel and reducing the channel conveyance of the drainage system.
In the 1981 FIS, the Tinaja Creek HEC-2 model extended from the confluence of Chacon Creek (at the downstream end) to its study limits at Chestnut Street (on the upstream end). The total length of the modeled channel was 8,580 linear feet. However, an underground box culvert was constructed in 1988 to replace the natural Tinaja Creek channel from Pine Street to Chesnut Street. Thus the length of the detail study was reduced from 8,580 linear feet to approximately 7,315 linear feet. The upstream end of this box culvert is connected to a "catch basin", which is located just south of Chacota Street. Discharge from the upstream portion of the Tinaja basin is routed through the two-detention basins, and
19
conveyed to the "catch basin" via underground conduits. In this study, the Tinaja Creek channel was modeled from the confluence of Chacon Creek (at the downstream end) and extending to Pine Street (on the upstream end). The total length of the modeled channel was 7,315 linear feet.
The results of the HEC-2 backwater model for the Tinaja Creek channel are presented in Table 11 'Water Surface Elevations for Tinaja Creek". Tinaja Creek was modeled with the HEC-2 and HEC-RAS programs. The results were compared and the difference in WSEL's were insignificant. The WSEL's are tabulated at key locations along the channel such as bridge and culvert crossings. The computed WSEL's are compared with the WSEL's that were computed using the HEC-2 model in the 1981 FIS. Elevation of hydraulic structures (bridges and culverts) located across the Tinaja Creek channel is also presented on Table 11.
From this analysis, for the 100-year return frequency, the WSEL's equaled or exceeded the top of the road elevation at one culvert location (Santa Barbara and New York Ave.). In the 1981 FIS model, the WSEL's computed at hydraulic structures were higher than those computed WSEL's in this study, ranging from 0.6 feet to 8.3 feet. The structural improvements to the channel, combined with lower peak discharges as a result of detention within the basin have contributed to lower WSEL's. However, even with these improvements, Tinaja Creek channel will not be able to convey the 1 DO-year flow in certain reaches of the channel. The results of the hydraulic analyses for Tinaja Creek are presented in Appendix F.
5.0 FLOOD PLAIN MANAGEMENT APPLICATIONS
The National Flood Insurance Program encourages state and local governments to adopt sound flood plain management programs. Therefore, each Flood Insurance Study includes a flood boundary map designed to assist communities In
developing sound flood plain management measures.
5.1 Flood Boundaries
In order to provide a national standard without regional discrimination, the 100-year flood has been adopted by FEMA as the base flood for purposes of flood plain management measures. The 500-year flood is employed to indicate additional areas of flood risk in the community. For each stream (studied in detail), the boundaries of the 100- and the 500-year floods have been delineated using the flood elevations determined at each cross section. The Floodplain Mapping Module of the BOSS RMS software was used to map the flood plain. This advanced water surface module will interpolate the edge of water between cross sections. It does this by building a Digital Terrain Model (DTM) of the ground topography and of the computed water surface elevation, and then intersecting these two surfaces with each other to determine a precise edge of water. This
20

allows the user to see in precise detail which areas of the topo map are flooded. In cases where the 100- and the 500-year flood boundaries are close together, only the 100-year boundary has been shown.
The backwater elevations from the 100-year and 500-year peak discharges of the Rio Grande were projected in mapping the flood boundaries for the Chacon Creek watershed. A set of flood hazard maps with and without the influence from the Rio Grande has been plotted for the Chacon Creek and its tributaries are enclosed in Exhibit 2. The flood profiles for the 10-, 25-, 50-, 100-, and 500-year frequencies have been plotted and are presented in Exhibit 1 for all studied streams.
To assist users (of this Updated Flood Insurance Study) in locating the base flood boundaries on the ground, and to help users in determining the elevation of specific sites or structures, an elevation reference benchmark system has been established and can be obtained from the City Engineer. These reference marks include previously existing Coastal and geodetic benchmarks as well as reference marks established during the current study by Brown & Root.
5.2 Floodways
Encroachment on flood plains, such as artificial fill, reduces the flood carrying capacity, increases the flood heights of streams, and increases flood hazards in areas beyond the encroachment itself. One aspect of flood plain management involves balancing the economic gain from flood plain development against the resulting increase in flood hazard. For purposes of the National Flood Insurance Program, the concept of a floodway is used as a tool to assist local communities in this aspect of flood plain management. Under this concept, the area of the 100-year flood is divided into a floodway and a floodway fringe. The floodway is the channel of a stream plus any adjacent flood plain areas that must be kept free of encroachment in order that the 100-year flood may be carried without substantial increases in flood heights. Minimum standards of FEMA limit such increases in flood heights to I .0 foot, provided that hazardous velocities are not produced. The floodways in this report area presented to local agencies as minimum standards that can be adopted or that can be used as a basis for additional studies
Floodway determination evaluates the effect of lost conveyance in a river reach and assesses the impact this has on the water surface profile. It is assumed in floodway modeling that development along the floodway fringe essentially eliminates the flow carrying capacity of the fringe area. Therefore, floodway modeling assumes that there is no conveyance-associated wit the floodway fringe.
The floodways printed in this study were computed on the basis of equal conveyance reduction from each side of the flood plain. Initially, encroachment method 4 was used to compute the encroachment stations. With this method the HEC-2 program computes encroachment stations on the basis of a target
21

incremental increase in the natural water surface elevation while maintaining the same conveyance. This encroachment method was repeated at all subsequent upstream cross-sections. Once the encroachment stations were determined, encroachment method 1 was used to refine the HEC-2 floodway model. In this method the encroachment stations obtained from method 4 are sepecified in the HEC-2 model encroachment card. These encroachments are essentially vertical walls extending upward above any possible water surface elevation. The stream flow will reside between the two encroachment stations. In method 4 encroachments are not repeated and are to be specified for all cross sections. This will allow for selectively turning of the encroachment at special bridges and special culverts. It is typical practice not to consider floodway encroachments at or near a bridge structure, since the incremental rise caused by the encroachments can invalidate previous bridge design calculations. In this study the encroachments were turned off at bridges and culverts.
The method 1 output from the HEC-2 model provided water surface elevations and locations for encroachment limits at the defined cross sections. The results of these computations were tabulated for the Chacon Creek and its Tributaries, and are shown in the Floodway Data Tables (Tables 4, 6, 8, 10, and 12). The floodway hydraulic models for each studied stream have been provided in their respective appendix. These results were transferred to a map and the resulting floodway region identified. For delineation of floodway between cross sections, the natural ground contours and floodplain shape was followed. The floodway for the modeled channels are shown in Exhibit 2. In ca5es where the boundaries of the floodway and the 1 DO-year flood plain are either close together or collinear. only the flood way boundary has been shown.
The area between the floodway and the boundary of the 1 ~O-year flood is termed the floodway fringe. The floodway fringe thus encompasses the portion of the flood plain that could be completely obstructed without increasing the watersurface elevation of the 100-year flood more than 1.0 foot at any point
22
6.0 BIBLIOGRAPHY AND REFERENCES
1. WWW.CityofLaredo.com. Internet Web Site for the City of Laredo.
2. Federal Emergency Management Agency, Flood Insurance Study, City ofI.aredo, Webb County, Texas, Community Number - 480651, November 17, 1981.
3. Federal Emergency Management Agency, Flood Insurance Study, Webb County, Texas, Community Number - 481059, November 17, 1981.
4. National Dam Safety Program, Texas Department of Water Resources, Austin, Texas. Phase I Inspection Report for Casa Blanca Dam, Webb County, Texas, June 1978.
5. U.S. Department of Commerce, Weather Bureau, Rainfall Frequency Atlas of the United States, Technical Paper No. 40, May 196 1.
6. The Dodson Professional HEC-l System (ProHECl), An Enhanced Version of the Standard Corp's of Engineer's Watershed Modeling Computer PrograIl!, Version 4.0.1E, May 1991.
7. Richard H. McCuen, A Guide to Hydrologic Analysis Using SCS Me!hod~, Pn::nticeHall, Inc., Englewood Cliffs, New Jersey, 1982.
8. U.S. Department of Agriculture, Soil Conservation Servict:, ~oil_.sl!!:Y~l: of _~~Q~ County, Texas, October 1985.
9. Tobin International, Ltd., San Antonio, Texas, Aeri~LPhotography of the Citx. of Laredo, Texas; Jlme 1997.
10. U.S. Anny Corps of Engineers, Detailed Project R~rt for Flood Control, Zacate Creek, Laredo, l:t:xas, August 1973.
I L U.S. Geological Survey, Nationwide Summary of U.S. Geological Survey Regional Regression Equations for Estimating Magnitude and Frequency of Floods for Ungaged Sites, Wate~-Resources Investigations Report 94-4002, 1993.
12. Richard H. McCuen, Hydrologic Analysis and Design, Second Edition, Prentice-Hall, Inc., Upper Saddle River, New Jersey, 1989. Pages 178 to 186.
13. Richard H. McCuen, Hydrologic Analysis and Design, Second Edition, Prentice-Hall, Inc., Upper Saddle River, New Jersey, 1989. Pages 203 to 209.
14. Foster Engineering Company, Hydraulic Calculations on Chacon Watershed (Pond No. 2) - Los Presidentes Area, Laredo, Texas, February 1992.
23
15. The Dodson Professional HEC-2 System (ProHEC2), An Enhanced Version of the Standard Corp's of Engineer's Stream Channel Analysis Computer Program, Version 4.6.2, May 1991.
16. BOSS International, USA. River Modeling System for AutoCAD (BOSS RMS) using the U.S. Army Corps of Engineers Hydrologic Engineering Center water-surface profile computation model HEC-2.
17. The Dodson HEC-RAS, River Analysis System, A New Windows Program from the US Army Corp's of Engineer's HEC, Version 1.01.
18. FedeIal Emergency Management Agency, Flood Insurance Study, Guidelines and Specifications for Study Contractors (FEMA 37), January 1995.
24

Figures
,.-.
c
City of Laredo
FIGURE 1: Vicinity Map -
--
-
WATERSHED KEY A Upper Cbac:on B. TribuIary 3 C. Lower Chec:on-CLI D. TribuIary 2 E. Lower ChIcon-CL2 F. TribuIary 1 o. Lower Chacon-CL3 R Tinaja Creak
Chacon Flood Insurance Study FIGURE 2 Brown & Root
I2I1IlII

- HEC-l Model Nodes
Chacon Flood Insurance Study
FIGURE 3 Brown & Root 1211198
-- HEC-l SCHEMATIC for the Chacon Creek Watershed
-
Confluence with Rio Grande
- 5/26/99 Figure 4

Tables

TABLE 1· SUMMARY OF DISCHARGES
FlOODING SOURCE DRAINAGE AREA AND LOCATION (square miles)
Rio Grande at Laredo 151,800
Chacon Creek at Node 0 (Upstream of Lake Casa Blanca) 116.90
Chacon Creek at Node 1 (confluence with Tributary 3 and after 116.90 routing through Lake Casa Blanca)
Chacon Creek at Node 2 143.00 (confluence with Tributary 2 )
Chacon Creek at Node 3 151.00 (confluence with Tributary 1)
Chacon Creek at Node 4 154.50 (confluence with Tinaja Creek)
Chacon Creek at Node 5 155.00 (confluence with Rio·Grande)
Tinaja Creek. tributary to Chacon Creek 2.50
Tributary 1. tributary to Chacon Creek 6.20
Tributary 2. tributary to Chacon Creek 15.98
Tributary 3. tributary to Chacon Creek 5.96
Tributary 3A. tributary to Tributary 3 1.22
Notes: • Provided by the International Boundary and Water Commission (IBWC) '. Not included in the 1981 Flood Insurance Study (FIS)
10·YR FIS update 1981 FIS
69914' 90,000
22,857 ..
13,105 ..
15,485 10,310
15.971 12.400
16.463 ..
16.463 ..
1,189 1,710
2.948 3.340
5.282 ••
3.207 ••
861 ••
The 1981 flows were obtained from the FIS reports (1981) for Ihe City of Laredo and Webb County
PEAK DISCHARGES (cfs) 50·YR 100·YR
FIS update 1981 FIS FIS update 1981 FIS
155011' 159,000 210095' 195,000
31,900 ., 36,918 ..
19,160 .. 22,535 ,.
22.660 20.680 26.742 24,520
23.130 21.500 27.232 25,510
23.619 .. 27.722 ..
23.619 •• 27.722 ..
1,777 2,490 2,108 2.920
4.387 4,870 5,143 5,740
7,033 .. 8.982 "
4.739 " 5.550 "
1.196 .. 1.393 .. --- ---_. _.- --
(~:
500·YR FIS update 1981 FIS
389822' 291,000
46.262 ..
29,916 ..
34,902 31 ,170
35,323 32,450
35.802 ..
35,802 "
2,709 3,730
6,627 7,320
10,909 .. 7,954 .. 1,735 ..
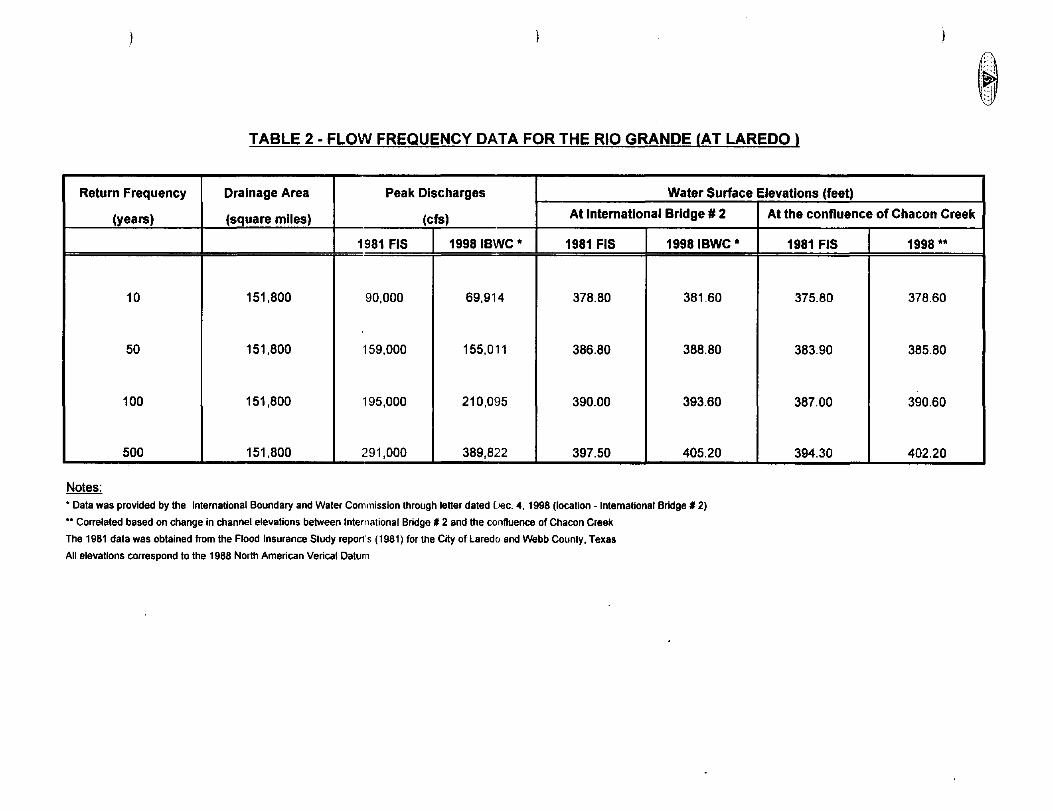
TABLE 2 - FLOW FREQUENCY DATA FOR THE RIO GRANDE (AT LAREDO)
Return Frequency Drainage Area Peak Discharges Water Surface Elevations (feet)
(years) (square miles) (cts) At International Bridge # 2 At the confluence of Chacon Creek
1981 FIS 19981BWC • 1981 FIS 19981BWC·
10 151,800 90,000 69,914 378.80 381.60
50 151,800 159,000 155,011 386.80 388.80
100 151,800 195,000 210,095 390.00 393.60
500 151,800 291,000 389,822 397.50 405.20
Noles: • Data was provided by the International Boundary and Water Commission through letter dated Dec. ", 1998 (location - International Bridge' 2)
•• Correlated based on change in channel elevations between International Bridge' 2 and the confluence of Chacon Creek
The 1981 data was obtained from the Flood Insurance Study report's (1981) for the City of Laredo and Webb County, Texas
All elevations correspond to the 1988 North American Verical Datum
1981 FIS 1998··
375.80 378.60
383.90 385.80
387.00 390.60
394.30 402.20
, .. !~::l
iT
I
I

I:;:, ~ , i ' ; ./
;~j
TABLE 3·: WATER SURFACE ELEVATIONS FOR CHACON CREEK
10-YR CWSEL (It) 50-YR CWSEL (It) 100-YR CWSEL (It) 500-YR CWSEL (It) Hydraulic FlowLine Low Chord Top of Road i Location Station (It)
FIS Update 1981 FIS FIS Update 1981 FIS FIS Update 1981 FIS FIS Update 1981 FIS Structura Elev. (It) Elev. (It) Elev. (It) I
Meadow Street OS 1160 368.00 372.83 369.69 37702 370.41 378.61 371.56 380.95
Bridge 352.00 380.48 383.78 I
US 1208 368.20 37288 370.08 37711 370.95 378.72 372.51 381.09
Highway 83 OS 6235 381.30 376.57 384.11 380.95 385.31 382.55 387.17 384.98
Bridge 362.00 396.00 400.23
US 6318 381.37 376.73 384.21 381.17 385.42 382.55 387.32 384.98
Highway 359 OS 12030 388.37 385.29 390.47 38875 391.53 389.90 393.42 391.70
Bridge 372.67 383.09 385.91 I
US 12096 388.74 385.41 390.72 388.98 391.82 390.03 393.76 391.77
T exes Mexican Railroad OS 17848 39929 397.98 403.71 40073 404.01 407.31 404.43 407.60
Bridge 383.00 396.00 402.00
US 17860 406.74 398.01 411.80 401.08 413.74 408.05 417.51 408.50
OS 20829 406.92 .. 411.84 .. 413.78 .. 417.55 .. Clark Boutevard Bridge 39058 404.18 409.51
US 20903 407.61 .. 412.95 .. 414.82 .. 41839 . . Highway 59
OS 26537 412.00 408.28 415.12 414.36 416.50 414.81 4t9.38 41625 Bridge 398.00 410.00 4t2.00
US 26588 412.51 408.42 4t5.41 414.89 4t6.71 415.36 419.58 416.59
OS 28240 417.71 .. 419.23 .. 419.77 .. 421.02 .. Loop 20 Bridge 402.50 416.23 422.00
US 28332 417.95 .. 419.92 .. 420.80 .. 42292 . . -
Notes:
•• Not induded in the 1981 Flood Insurance Study (FIS)
All elevations correspond to the 1988 North American Vertical Datum
The 1981 flows were obtained from the FtS reports (1981) for the City 'Jf Laredo and Webb County

Table 4: Chacon Creek Floodway Data - City of Laredo, TX
------- FLOODWAY -------oTATION
100.000 1073.000 1160.000 1208.000 1799.000 2376.000 3213.000 4240.000 5065.000 6065.000 6235.000 6318.000 6706.000 7868.000 8728.000 9180.000 9730.000
10909.000 11629.000 12030.000 12096.000 12759.000 13683.000 14450.000 15230.000 15916.000 17336.000 17848.000 17860.000
18372.000 19664.000 20686.000 20829.000 20903.000 21387.000 22464.000 24443.000 25387.000 26114.000 26537.000 26588.000 27124.000
27815.000 28240.000 28332.000 28673.000 30238.000 31626.000 32354.000 32760.000 33425.000 34421.000
WIDTH
659. 451. 167. 182. 479. 397. 573. 624. 689. 224. 244. 242. 434. 701. 684.
1060. 1200.
821. 701. 666. 666. 623. 391. 507. 6~7.
612. 564.
1272. 1272 .
1192 .
1516. 762.
1103. 1103.
809. 715.
1687. 1198. 1072 .
918. 918.
1505.
1452. 1508. 1501.
314. 875. 333. 257. 472. 565. 474.
SECTION AREA
5116. 4855. 2387. 2548. 4519. 4788. 6210. 6242. 5428. 3428. 3365. 3294. 6134. 9086. 7066.
11537. 15194.
7742. 6244. 6120. 6122. 6830. 4181. 5848. 5758. 6973. 7866. 3896. 8818.
25236. 25354. 12005. 10755. 10319. 14697. 10981. 15376.
9180. 9468. 6764. 6743. 6098.
6857. 6949. 8518. 3733. 8956. 2462. 2611. 4848. 2675. 3001.
--WATER SURFACE ELEVATION MEAN WITH WITHOUT DIFFERENCE VELOCITY FLOODWAY FLOODWAY
5.4 5.7
11.6 10.9 6.1 5.8 4.5 4.4 5.1 8.1 8.2 8.4 4.5 3.1 3.9 2.4 1.8 3.5 4.4 4.4 4.4 4.0 6.5 4.7
3.9 3.4 6.9 3.0
1.1 1.1 2.:2
2.5 2.6 1.8 2.4 1.7 2.9 2.8 4.0 4.0 4.4
3.9 3.8 3.1 7.2 3.0
10.9 8.6 4.6 8.4 7.3
368.0 371.0 370.6 371.1 375.5 377.3 379.1 380.8 382.3 384.4 385.0 385.1 387.0 388.1 388.8 389.3 389.6 390.0 391.0 391. 6 391.9 392.8 394.3 396.4 397.9 399.2 400.4 403.1 413.2
413 .4 413.5 413.5 413.6 414.7 414.8 415.0 415.6 415.9 416.3 416.6 416.7 417.3
419.2 419.9 421.3 421.3 424.3 426.0 434.1 436.2 437.8 448.8
367.0 370.5 370.1 370.7 375.3 377.2 379.0 380.7 381.9 383.8 384.5 384.6 386.6 387.8 388.5 389.0 389.3 389.7 390.5 391.2 391.6 392.4 393.7 395.5 397.0 398.2 399.4 402.3 413.2
413 .2 413.3 413.3 413.3 414.6 414.6 414.7 415.2 415.4 415.8 416.0 416.3 417.0
419.0 419.6 421.1 421.0 423.9 425.2 434.5 436.3 437.5 447.8
1.0 .5 .5
.4
.2
.1
.1
.1
.4
.6
.5
.5
.4
.3
.3
.3
.3
.3
.5
.4
.3
.4
.6
.9
.9
1.0 1.0
.8
.0
.2
.2
.2
.3
.1
.2
.3
.4
.5
.5
.6
.4
.3
.2
.3
.2
.3
.4
.8 -.4 -.1
.3 1.0

~.' ,',
d."
I; ~ ~
TABLE 5 - WATER SURFACE ELEVATIONS FOR TRIBUTARY 3 AND 3A
Tributary 3
Location Station (ftl 10-YR WSEL (ftl 50-YR WSEL (ftl 100-YR WSEL (ftl SOO-YR WSEL (ftl Hydraulic Invert Top of culvert Top of road
FIS update FIS update FIS update FIS update Structura Elev. (ftl Elev. (ftl Elev. (ftl
0 422.96 423.60 423.92 424.73
509 428.02 428.90 43039 432.65
U.S. Highway 59 1019 433.94 434.84 435.28 436.25 Culvert 424,57 433,71 436.18
2006 438.27 438.93 439.22 439.92
3427 443.34 443.87 444.04 444.50
5312 452.14 452.64 452.86 453.43
7236 458.94 459.32 459.52 459.92
10034 479.99 480.46 480,72 481.09
12079 494.63 495.09 495.36 495.79
13954 508.77 509.32 509.62 510.05
16166 525.65 526.40 526.57 526.81
18032 542.36 542.73 542.90 543.17 - - - - _._----- ~-----~ ~~. -
Tributary 3A
Location Station (ftl 10-YR WSEL (ftl 5O-YR WSEL (ftl 100-YR WSEL (ftl 500-YR WSEL (ftl Hydraulic 'nvert Top of culvert Top of road
FIS update FIS update FIS update FIS update Structure Elev. (ftl Elev. (ftl Elev. (ftl
7560 463.52 463.81 463,98 464.25
9527 472.11 472.32 472.42 472.57
11329 485.50 485.72 485.84 486.00 NONE
12722 492.20 492.49 492.63 492.85
13532 496.07 496.27 496.36 496.52
15239 512.28 512.72 512.95 513.30
Note:
All elevations correspond to the 1988 North American Vertical Datum

Table 6: (;::!1¥~ ~ _" r· ~ Tributary 3 Floodway Data - City of Laredo, TX
------- FLOODWAY ------- --WATER SURFACE ELEVATION----STATION WIDTH SECTION MEAN WITH WITHOUT DIFFERENCE
AREA VELOCITY FLOODWAY FLOODWAY
.000 254. 1074. 5.2 424.9 423.9 1.0 56.000 138. 508. 10.9 425.0 425.0 .0
178.000 127. 699. 7.9 428.4 428.4 .0 281. 000 324. 1391. 4.0 429.9 429.9 .0 420.000 175. 1024. 5.4 430.3 430.3 .0 509.000 138. 514. 10.8 430.4 430.4 .0 661.000 261. 1117. 5.0 433.9 433.9 .0 814.000 245. 1159. 4.8 434.9 434.9 .0 957.000 139. 1153. 4.8 435.5 435.5 .0
---DIS Face of Highway 59 Culvert 1019.000 52. 564. 9.8 435.0 435.3 -.3 1114.000 52. 621. 8.9 436.1 437.1 -1. 0 1253.000 496. 1862. 3.0 437.5 437.4 .1 1578.000 287. 1302. 4.3 438.6 438.3 .3 2006.000 328. 1779. 3.1 439.9 439.2 .7 2697.000 715. 2046. 2.7 441. 7 440.7 1.0 3427.000 607. 1866. 3.0 444.2 444.0 .2 4058.000 1040. 2002. 2.8 447.3 447.2 .1 5312.000 810. 2185. 2.5 452.9 452.9 .0 6097.000 580. 2052. 2.7 455.1 455.0 .1 6770.000 796. 2063. 2.7 457.3 457.1 .2 7236.000 929. 1398. 2.9 459.5 459.5 .0 8426.000 984. 1553. 2.6 468.2 468.2 .0 9293.000 606. 1130. 3.6 475.5 475.4 .1
10034.000 580. 1393. 2.9 480.7 480.7 .0 10527.000 448. 1001. 4.0 484.1 484.1 .0 112 63. GOO .J05. 1175. 3.4 489.6 489.6 .0 12079.000 325. 897. 4.5 495.5 495.4 .1 12495.000 469. 1172. 3.4 498.9 498.9 .0 13112.000 511. 1178. 3.4 503.3 503.2 .1 13954.000 346. 981. 4.1 509.6 509.6 .0 14591.000 340. 857. 4.7 515.9 515.9 .0 15336.000 292. 605. 1.9 521.9 521. 9 .0 16166.000 170. 273. 4.3 526.6 526.6 .0 16715.000 218. 451. 2.6 531. 5 531.5 .0 11279.0UO 184. 312. 3.8 535.7 535.7 .. 0 18032.000 235. 417. 2.8 542.9 542.9 .0
Tributary 3A Floodway Data - City of Laredo, TX
------- FLOODWAY ------- WATER SURFACE ELEVATION STATION WIDTH SECTION MEAN WITH WITHOUT DIFFERENCE
AREA VELOCITY FLOODWAY FLOODWAY
7560.000 666. 1520. .9 465.4 464.4 1.0 8595.400 530. 401. 3.5 467.4 468.1 -.7 9526.700 347. 749. 1.9 473.1 472.6 .5
10514.000 446. 334. 4.2 479.3 479.8 -.5 11329.000 694. 905. 1.5 486.2 486.0 .2 11963.000 520. 539. 2.6 489.6 489.8 -.2 12722.000 496. 917. 1.5 492.8 492.7 .1 13532.000 183. 289. 4.8 496.3 496.3 .0 14505.000 317. 569. 2.4 506.3 506.1 .2 15239.000 194. 320. 4.4 512.7 512.9 -.2

~.'
I',
'
",1>1 .-"1
;;:;' '.'
TABLE 7 - WATER SURFACE ELEVATIONS FOR TRIBUTARY 2
Location Station (tt) 10-YR WSEL (tt) 50· YR WSEL (tt) 100·YR WSEL (tt) 500· YR WSEL (tt) Hydrullc FlowLine Low Chord Top of Road I
FIS update FIS update FIS update FIS update Structure Elev. (tt) Elev. (tt) Elev. (tt)
0 390.6 391.2 391.5 392.2
Loop 20 Bridge US 2993 407.4 408.7 409.2 410.2
Bridge 396 440 4430
OS 3051 407.4 408.7 409.2 4102 I
Texas·Mexican Railroad Bridge US 6500 418.8 419.8 420.2 421.0
Bridge 412 420 423.0 i
OS 6550 418.9 4201 420.7 4225
9484 427.6 428.7 429.1 4300 nla
12000 433.2 433.9 434.1 434.8 nla
15090 445.6 446.1 446.3 446.8 nla
18323 458.2 458.6 458.8 4592 nla
21695 473.3 473.7 474.0 474.3 nla
25436 492.9 493.4 493.5 4938 nla
28422 503.1 503.5 503.7 504.3 nla
31348 519.8 5201 520.2 _.-
5205 L. ___ nla
'--- - -._- ------ --_ .. - -- --
Note:
All elevations correspond to the 1988 North American Vertical Datum

~D
Tabl.e 8: Tributary 2 Fl.oodway Data - City of Laredo, TX
------- FLOODWAY ------- --WATER SURFACE ELEVATION----STATION WIDTH SECTION MEAN WITH WITHOUT DIFFERENCE
AREA VELOCITY FLOODWAY FLOODWAY
.000 573. 2735. 3.2 392.5 391. 5 1.0 836.000 357. 1562. 5.7 395.8 396.1 -.3
1201. 000 267. 1097. 8.0 400.0 399.7 .3 1850.000 266. 1894. 4.7 405.1 404.9 .2 2039.000 151. 1148. 7.7 405.4 405.2 .2 2679.000 257. 1876. 4.7 409.1 408.6 .5
---DIS Face of Loop 20 Bridge 2993.000 173. 1504. 5.9 409.6 409.2 .4 3051.000 173. 1508. 5.9 409.6 409.2 .4 3441. 000 153. 1009. 8.7 410.4 410.3 .1 4144.000 346. 2518. 3.5 414.0 413.6 .4 4727.000 375. 2094. 4.2 415.3 415.0 .3 5298.000 287. 1849. 4.8 417.3 416.9 .4 5891.000 543. 2643. 3.2 419.3 418.8 .5
---DIS Face of Texas Mexican Railroad Bridge 6500.000 204. 1433. 6.0 420.4 420.2 .2 6550.000 204. 1533. 5.6 420.8 420.7 .1 7000.000 472. 2382. 3.6 422.9 422.7 .2 7904.000 822. 2401. 3.6 424.2 424.1 .1 8639.000 574. 2445. 3.5 426.8 426.8 .0 9484.000 445. 2486. 3.4 429.1 429.1 .0 9810.000 590. 2993. 2.9 429.9 429.8 .1
10296.000 601. 2981. 2.9 430.7 430.7 .0 11400.000 ~488. 3490. 2.4 432.8 432.8 .0 12000.000 1584. 4225. 2.0 434.1 434.1 .0 13028.000 1312. 3113. 2.7 436.7 436.7 .0 13821.000 1174. 2504. 3.1 440.1 440.1 .0 15090.000 993. 2580. 3.0 446.3 446.3 .0 15668.000 846. 2649. 2.9 448.7 448.7 .0 16335.000 777. 2309. 3.3 451.1 451.1 .0 16774.000 934. 2003. 3.9 452.7 452.7 .0 17468.000 :218. 2807. 2.8 455.9 455.9 .0 18323.000 2069. 4129. 1.9 458.8 458.8 .0 19350.000 1473. 2339. 3.3 463.4 463.4 .0 20198.000 1944. 3429. 2.3 469.1 469.1 .0 2l000.000 2139. 4345. 1.8 471. 8 471. 8 .0 21695.000 1533. 2568. 3.0 474.0 474.0 .0 23010.000 956. 2195. 2.6 480.6 480.6 .0 24360.000 1351. 2211. 2.6 486.4 486.4 .0 25436.000 1101. 1909. 3.0 493.5 493.5 .0 27641. 000 915. 1861. 1.2 501.5 501. 5 .0 28422.000 1091. 293. 7.9 503.7 503.7 .0 29403.000 569. 1087. 2.1 513.7 513.7 .0 30485.000 777. 1209. 1.9 517.8 517 .8 .0 31348.000 1008. 1607. 1.4 520.2 520.2 .0
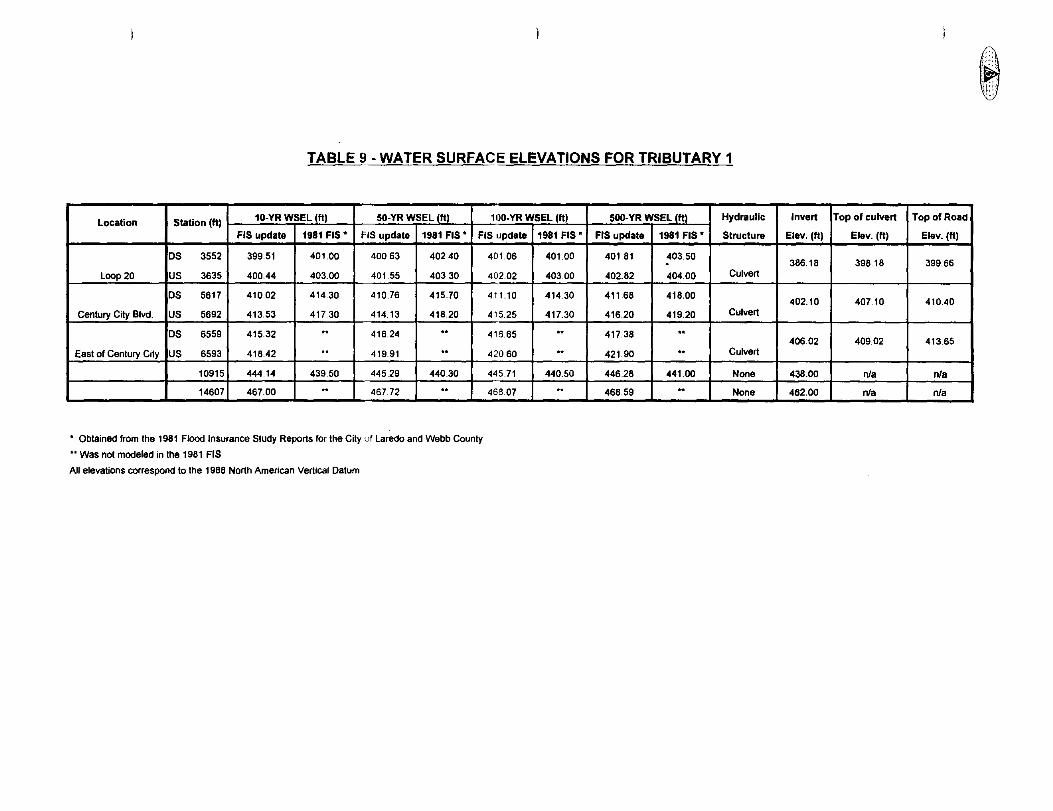
TABLE 9 - WATER SURFACE ELEVATIONS FOR TRIBUTARY 1
Location Station (It) 10·YR WSEL (It) 50·YR WSEL (It) 100· YR WSEL (It)
FIS update 1981 FIS· FiS update 1981 FIS· FIS update
DS 3552 399.51 401.00 400.63 402.40 401.06
Loop 20 US 3635 400.44 403.00 401.55 40330 402.02
DS 5617 410.02 414.30 410.76 415.70 411.10
Cenlury City Blvd. US 5692 413.53 417.30 414.13 418.20 415.25
DS 6559 415.32 .. 416.24 .. 416.65
East 01 Century Cily US 6593 418.42 .. 419.91 .. 42060
10915 444.14 439.50 445.29 440.30 445.71
14607 467.00 .. 467.72 .. 468.07 ---- --- .-'- - -.- --- ----
• Obtained Irom the 1981 Flood Insurance Study Reports lor the Cily of Laredo and Webb County
•• Was not modeled in the 1981 FIS
All elevations correspond to the 1988 North American Vertical Datum
1981 FIS·
401.00
403.00
414.30
417.30
..
.. 440.50 ..
- -
500· YR WSEL (It I Hydraulic
FIS update 1981 FIS· Structure
401.81 403.50 . 402.82 404.00 Culvert
411.68 418.00
416.20 419.20 Culvert
417.38 .. 421.90 .. Culvert
446.28 441.00 None
468.59 .. None ---- - - . - -- --
~.'
1 i:: ~ ; l:;; q,
Invert Top of culvert Top of Road
Elev, (It) Elev, (It) Elev, (It)
386.18 398.18 399.66
402.10 407.10 410.40
40602 409.02 413.65
438.00 nia nia
462.00 nia nia I -
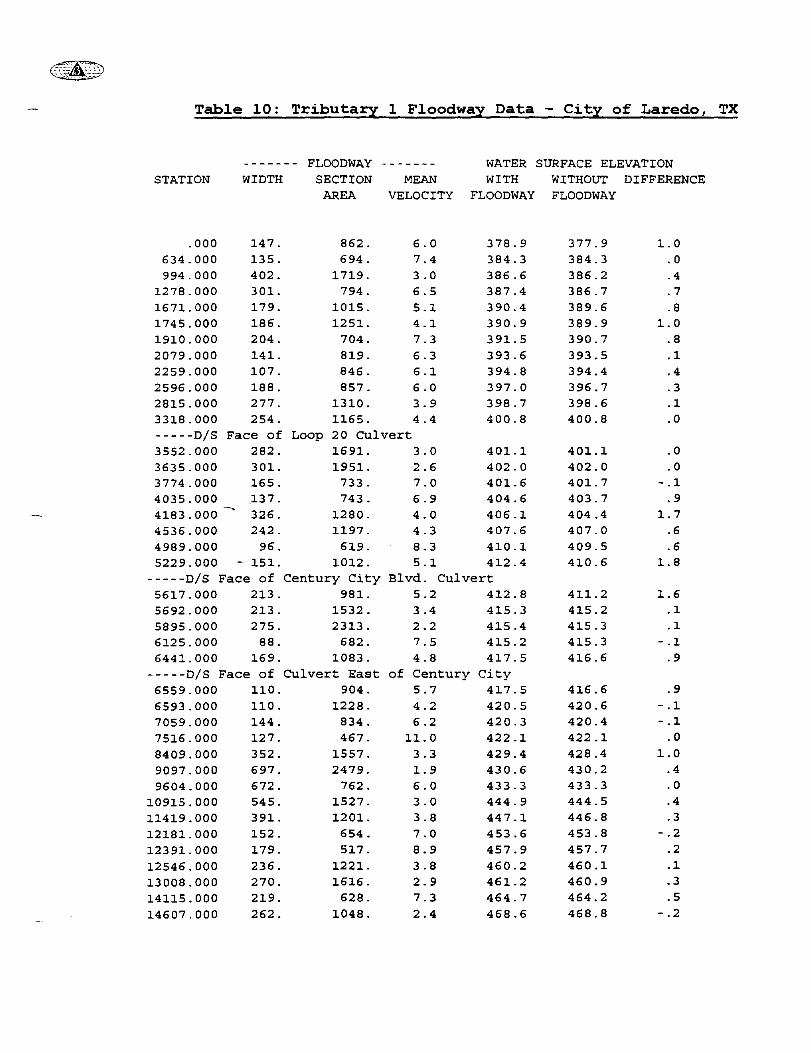
Table 10: Tributary 1 Floodway Data - City of Laredo, TX
------- FLOODWAY -------STATION
.000 634.000 994.000
1278.000 1671.000 1745.000 1910.000 2079.000 2259.000
WIDTH
147. 135. 402. 301. 179. 186. 204. 141. 107.
2596.000 188. 2815.000 277. 3318.000 254. -----D/S Face of 3552.000 282. 3635.000 301. 3774.000 165. 4035.000 137. 4183.000 326. 4536.000 242. 4989.000 96. 5229.000 - 151.
SECTION MEAN AREA VELOCITY
862. 6.0 694. 7.4
1719. 3.0 794. 6.5
1015. 5.1 1251. 4.1
704. 7.3 819. 6.3 846. 6.1 857. 6.0
1310. 3.9 1165. 4.4
Loop 20 Culvert 1691. 3.0 1951.
733. 743.
1280. 1197.
619. 1012.
2.6 7.0 6.9 4.0 4.3 8.3 5.1
WATER SURFACE ELEVATION WITH WITHOUT DIFFERENCE
FLOODWAY FLOODWAY
378.9 377.9 1.0 384.3 384.3 .0 386.6 386.2 .4 387.4 386.7 .7 390.4 389.6 .8 390.9 389.9 1.0 391.5 390.7 .8 393.6 393.5 .1 394.8 394.4 .4 397.0 398.7 400.8
401.1 402.0 401.6 404.6 406.1 407.6 410.1 412.4
396.7 398.6 400.8
401.1 402.0 401.7 403.7 404.4 407.0 409.5 410.6
.3
.1
.0
.0
.0
- .1 .9
1.7 .6 .6
1.8 -----D/S Face of Century City Blvd. Culvert
5617.000 213. 981. 5.2 412.8 5692.000 5895.000 6125.000 6441.000
213. 275.
88. 169.
1532. 2313.
682. 1083.
3.4 2.2 7.5 4.8
415.3 415.4 415.2 417.5
-----D/S Face of Culvert East of Century City 6559.000 110. 904. 5.7 417.5 6593.000 110. 1228. 4.2 420.5 7059.000 144. 834. 6.2 420.3 7516.000 8409.000 9097.000 9604.000
10915.000 11419.000 12181.000 12391.000 12546.000 13008.000 14115.000 14607.000
127. 352. 697. 672. 545. 391. 152. 179. 236. 270. 219. 262.
467. 1557. 2479.
762. 1527. 1201.
654. 517.
1221. 1616.
628. 1048.
11.0 3.3 1.9 6.0 3.0 3.8 7.0 8.9 3.8 2.9 7.3 2.4
422.1 429.4 430.6 433.3 444.9 447.1 453.6 457.9 460.2 461.2 464.7 468.6
411.2 415.2 415.3 415.3 416.6
416.6 420.6 420.4 422.1 428.4 430.2 433.3 444.5 446.8 453.8 457.7 460.1 460.9 464.2 468.8
1.6 .1
.1 -.1
.9
.9 -.1 -.1
.0 1.0
.4
.0
.4
.3 -.2
.2
.1
.3
.5 -.2

TABLE 11 - WATER SURFACE ELEVATIONS FOR TINAJA CREEK
Location Station (It) 10-YR CWSEL (It) 50-YR CWSEL (It) 100-YR CWSEL (It)
FIS update 1981 FIS' FIS update 1981 FIS' FIS update 1981 FIS'
OS 10 359.15 358.77 359.79 360.16 360,12 360,73 Meadow Street
US 38 359,17 358.80 359.82 360.21 360.16 360,79
OS 3874 392,88 393,99 394,05 395,79 394.65 397,93 Highway 83
US 4105 394,76 395.86 397.16 402.53 399.05 40507
Santa Barbara & Louisiana OS 5115 401.84 410.32 402,82 411,27 403,35 411,68
US 5144 403,23 410.46 404.73 411.41 405.58 411.81
Santa Barbara & New York OS 5807 405.98 412.93 406.61 413,54 406,96 413,62
US 5840 408,23 414.55 409.48 414.95 410.28 415.13
Santa Clara Street OS 6127 408,96 416,11 409,56 416.69 409.88 416,92
US 6150 410.95 416.12 412.13 416.70 412.78 416,93
Pecan Street OS 6535 411.27 418.30 412.39 418,72 413,01 418,90
US 6598 411.70 418.50 412.91 418,94 413,89 419,14
San Salvador Street OS 6902 411,75 421,24 412.95 421.72 413,90 421,94
US 6930 413,01 421.30 414.23 421.77 415.37 421,99
Pine Street OS 7315 418.65 425.81 419.46 426,10 419.88 426,23
••• Flow Routed ThrolJ!lll. Undergrou~'U::uJverts •••
Notes:
• Obtained from the HEC-l model used in the 1981 FIS
•• In case of culverts, the low chord elevation is the elevation of the top of the culvert
All elevations correspond to the 1988 North American Vertical Datum
500-YR CWSEL (It) Hydraulic
FIS updata 1981 FIS' Structure
360,62 361,35 Bridge
360.66 361.42
395,88 397,34 Culvert
403.90 405.51
404.82 405.49 Culvert
407.75 412.12
407.82 412.77 Culvert
411.65 415.56
411,33 415,48 Culvert
415,11 417,03
415,19 417.00 Culvert
416,21 418.13
416,19 418.20 Culvert
418.40 419,13
421,11 422.68 Culvert
--
'" I"~
'::.i
lH ",
Flowline LowChord- Top of road
Elev. (It) EIev. (It) EIev. (It)
352.00 381.90 384.00
386,60 394.60 404.30
396,95 405,95 409.95
403.47 408,80 410.28
406.58 411.66 414,73
407.50 412,60 414.55
408.61 413.72 416.84
414.29 419.32 421.77
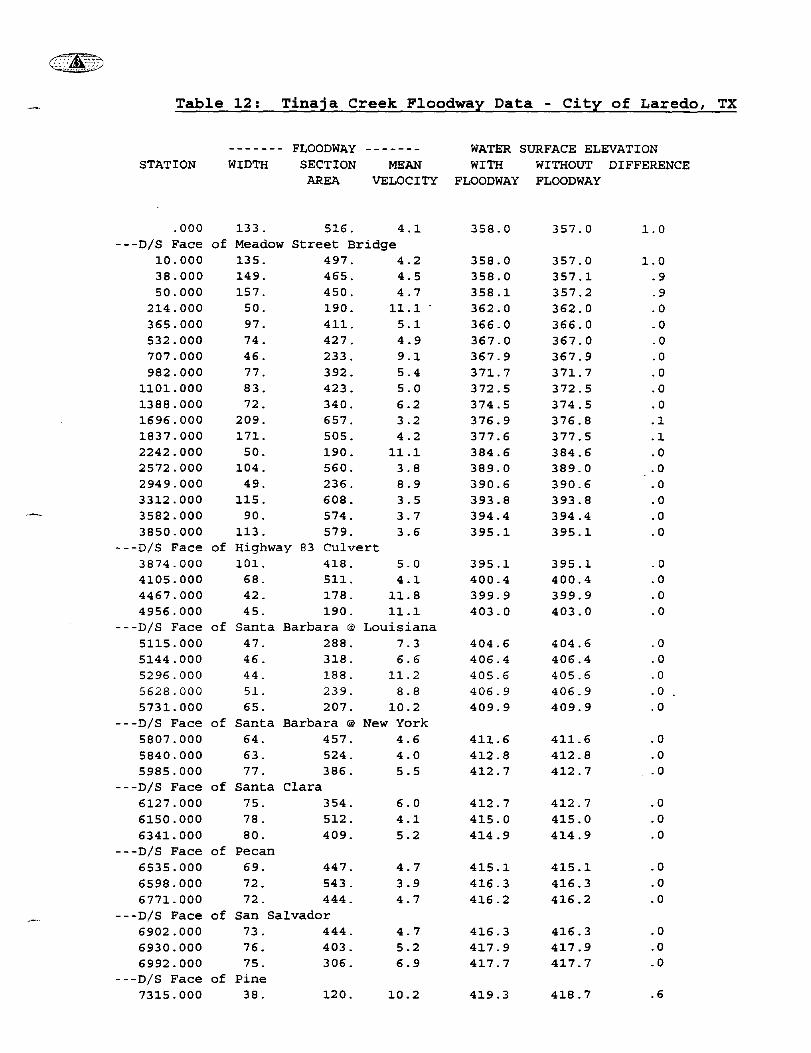
Table 12: Tinaja Creek Floodway Data - City of Laredo, TX
WATER SURFACE ELEVATION STATION WIDTH MEAN WITH WITHOUT DIFFERENCE
FLOODWAY SECTION
AREA VELOCITY FLOODWAY FLOODWAY
. 000 133 . 516. 4.1 ---DIS Face of Meadow Street Bridge
10.000 135. 497. 4.2 38.000 149. 465. 4.5 50.000 157. 450. 4.7
214.000 50. 190. 11.1 365.000 97. 411. 5.1 532.000 74. 427. 4.9 707.000 46. 233. 9.1 982.000 77. 392. 5.4
1101.000 83. 423. 5.0 1388.000 72. 340. 6.2 1696.000 209. 657. 3.2 1837.000 17l. 505. 4.2 2242.000 50. 190. 11.1 2572.000 104. 560. 3.8 2949.000 49. 236. 8.9 3312.000 115. 608. 3.5 3582.000 90. 574. 3.7 3850.000 113. 579. 3.6
---DIS Face of Highway 83 Culvert 3874.000 101. 4105.000 68. 4467.000 42. 4956.000 45.
---DIS Face of 5115.000 5144.000 5296.000 5628.000 5731.000
---DIS Face of 5807.000 5840.000 5985.000
Santa 47. 46. 44. 5l. 65.
Santa 64. 63. 77.
418. 5.0 51l. 4.1 178. 11.8 190. 11.1
Barbara @ Louisiana 288. 7.3 318. 6.6 188. 11. 2 239. 8.8 207. 10.2
Barbara @ New York 457. 4.6 524. 4.0 386. 5.5
---DIS Face of Santa Clara 6127.000 75. 354. 6150.000 6341.000
78. 80.
---DIS Face of Pecan 6535.000 69. 6598.000 72. 6771.000 72.
512. 409.
447. 543. 444.
---DIS Face of 6902.000 6930.000 6992.000
San Salvador 73. 444. 76. 403. 75. 306.
---DIS Face of Pine 7315.000 38. 120.
6.0 4.1 5.2
4.7 3.9 4.7
4.7 5.2 6.9
10.2
358.0
358.0 358.0 358.1 362.0 366.0 367.0 367.9 371.7 372.5 374.5 376.9 377.6 384.6 389.0 390.6 393.8 394.4 395.1
395.1 400.4 399.9 403.0
404.6 406.4 405.6 406.9 409.9
411.6 412.8 412.7
412.7 415.0 414.9
415.1 416.3 416.2
416.3 417.9 417.7
419.3
357.0
357.0 357.1 357.2 362.0 366.0 367.0 367.9 37l. 7 372.5 374.5 376.8 377.5 384.6 389.0 390.6 393.8 394.4 395.1
395.1 400.4 399.9 403.0
404.6 406.4 405.6 406.9 409.9
411.6 412.8 412.7
412.7 415.0 414.9
415.1 416.3 416.2
416.3 417.9 417.7
418.7
l.0
l.0 .9 .9 .0 .0 .0 .0 .0
.0
.0
.1
.1
.0
.0
.0
.0
.0
.0
.0
.0
.0
.0
.0
.0
.0
.0
.0
.0
.0
.0
.0
.0
.0
.0
.0
.0
.0
.0
.0
.6

Exhibit 1 (Flood Profiles)
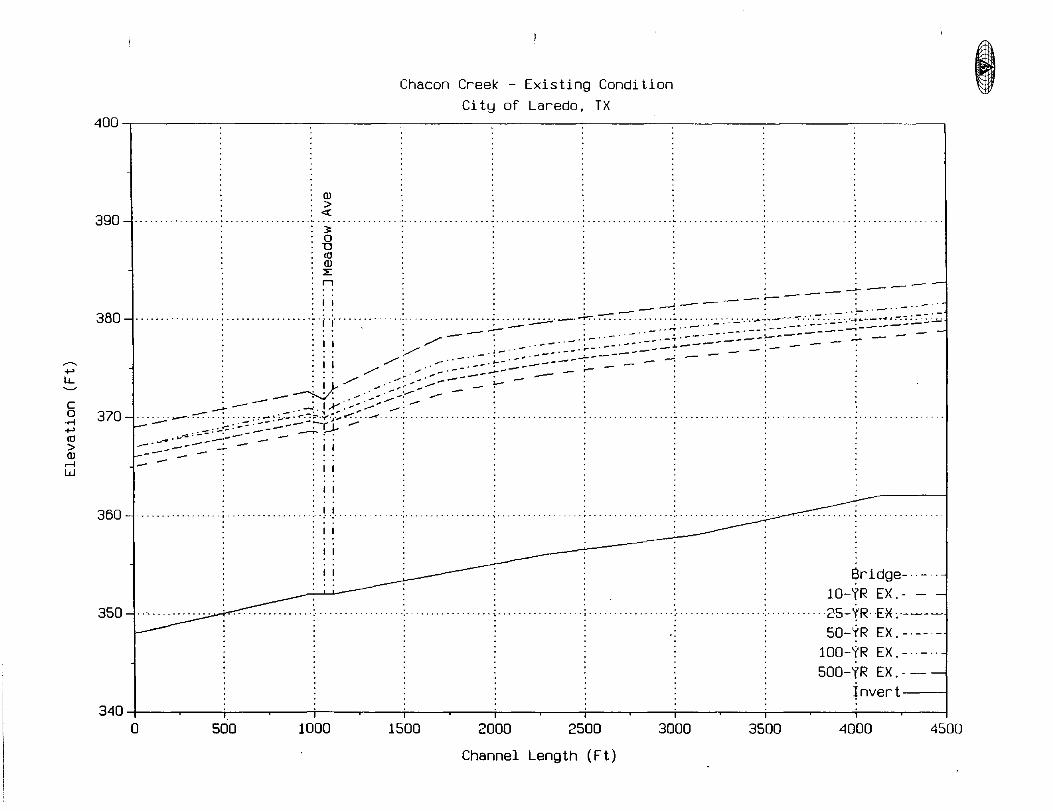
+-' lJ...
c o
• ..-1 +-' <0 > OJ
.--f W
Chacon Creek - Existing Condition City of Laredo, TX
400.---------~------~--------~--------~--------~------~--------~--------~------_,
390~··········
OJ > « ........ ......................... 3: o LJ <0 OJ ::;: n
I I
380 -J. .... . . . . . . . . ...... . .. · .. :·f·j ........ · . . .... ,; ,/_~i:-=-~.- ~---------~ " 0/ . .---
370 ~ _~:;;§:~~~~0~~:-';~~:~:£~~c:::t~C::C::c::'=}~·'~~~~~S~.-:'::>':{=::.'-;;'~~ .... .
I I ......
I I
I I
I I 350 .......... '.' .--,
I I
I I
I I
350
~ridge- . lO-YR EX. - -2S-YR EX ;.----
50-YR EX.-·--100-YR EX.-·-500-YR EX.-
~nvert---I
340~1----~--+---~---r--~---;----~--T---~---r--~--~----~--T---~---+--~--~ o 500 1000 1500 2000 2500 3000 3500 4000 4500
Channel Length (Ft)
I
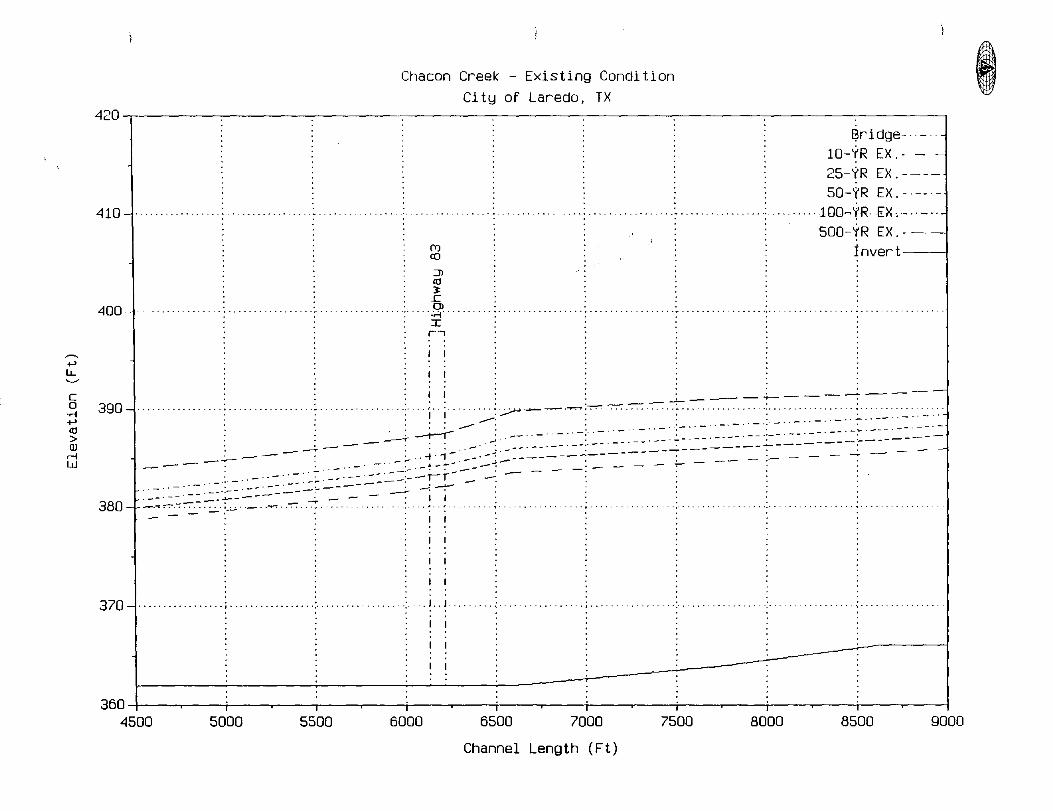
~
+' LL
c o ...... +' ttl > OJ rl W
Chacon Creek - Existing Condition City of Laredo, TX
420 I--:--:--:------=---=-=---=~~-~--_:___--_,____-~ ~ridge-·· - .. -
lO-YR EX. - - -
25-YR EX.----50-'j'R EX.----
41u~·
400-
(Y) co ::Jl ttl ): .c Ol .... :..:t' ... I r'o
100~'fR. EX.-·· _ .. -500-YR EX. - - -
1nvert----J
__ _ ~ ~ 2-.-~ >~---. ......,....:-:-:-: .. -:-:-.-380 _f:::::::::{E:.::::]~4-=:C:: :::c:i-=}I ;:~j c:::;:--:j;:------- ~:~::: ... --. -:.~:. -:.~: •. --,------
- ~
...... . ",".
390~······
370 -1 .............. _. - . . l. . j .. , ,_. ., ....
360~1----~--+---~---r--~--~----~--+---~---r--~--~----~--T---~---r--~--~
4500 5000 5500 6000 6500 7000 7500 8000 8500 9000
Channel Length (Ft)
I
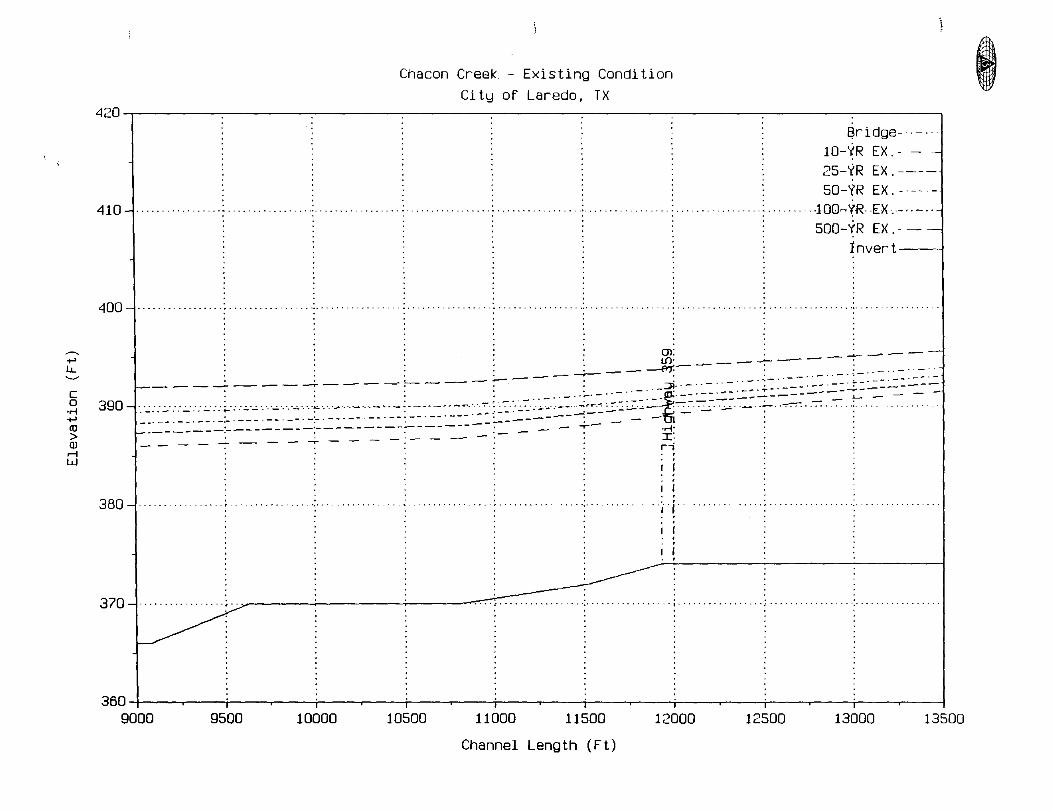
~
+' LL
----c o .,-j
+' <0 > OJ rl W
Chacon Creek. - Existing Condition City of Laredo, TX
420 ~ridge
410-··········
-
400-1················:·······
lO-~R EX.· 25-YR EX. ----50-'(R EX. - ---
.... ·100- 'W EX.-·· - .. -
500-~R EX. - - -1nvert--.
r----:----~-- . ~: 390-l.~......... -:---- ---~ _-f'i.-----:----"7"" ---
e::~:. ~~] -=£ ~~~ ~~~: ::E:~:~: ~ -=-~ -=-,=:::: -: ~ :.::~ :C:~=:l::c:'::: =::.'4,,::,:,::::, 0:'::i f:'::~ ::,e:::. ~~:f:': ~~~:.::: ~
380-····
370 .... , ............ .
:r;: r;
··IT
360~1----~--+---~---r--~---;----~--T---~---r--~--~----~--+---~---r--~---1
9000 9500 10000 10500 11000 11500 12000 12500 13000 13500
Channel Length (Ft)
,

~
+' lJ..
c o • ..-t +' IU > Q) rl W
Chacon Creek - EXisting Condition City of Laredo. TX
420 ~
r" '+
410~········································ cr~-~"
400-1 - . . . . . . . . . ......... .......... . 0~~00:':O: ~::::::O.3:':O:",:':O,4"c".3,,~d ::o~i~"~,,,~i,::c':l{~~~~", ~0~0404 390~··
380 -< ....... ...• ....... .
36C 13500
, 14000
, 14500
I I
15000 15500 16000
Channel Length (Ft)
I I
16500 17000
8ridge-··lO-YR EX.· - -25-~R EX.----50-YR EX.""""-
100-'(R EX. --500-YR EX.---
~nvert I I
17500 18000
I
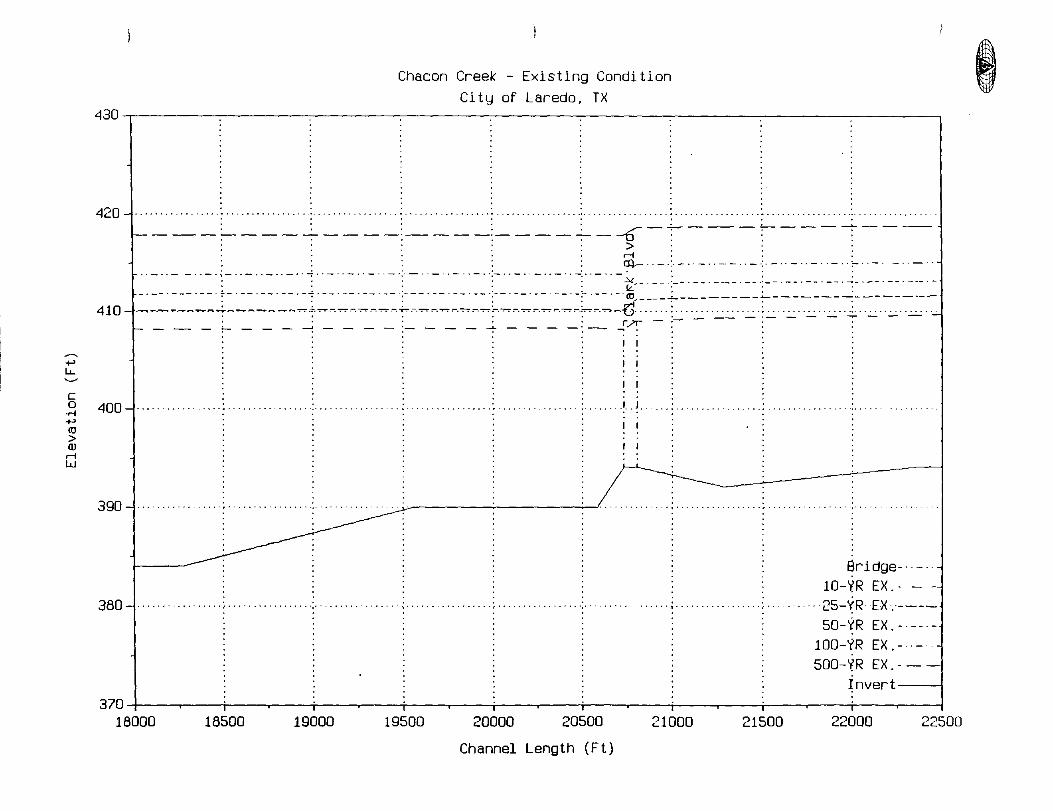
~
+-' lL. '-'
c o
. ,.j
+-' ro > Ql rl W
Chacon Creek - Existing Condition City of Laredo, TX
430~------~------~------~--------~------~------~----------------------~
420 .................................. ............... .......... .................. ............... . ....... . _________ _._ ___ -b-~---~-- -7 --
> . rl
.. _ .. __ .. _ . . . _ .. _ .. _ .. -; .. _ .. _ .. _ .. _ .' . _ ..:_ .. _ .. _ .. _ .. _:- . _ .. _ Ill- .. _.' _ .. - .. _. - . . - .' - .. - .. - .. :-.
410 t~·::~~f=~.:~;J.:~;~~~E~~~~~~i~·~~=-~~L:.J-;f~~;·:=-~E~;E~;EE~:~
400+ .. · .... ·.· .. ···..· ... · .. ·. 1 ! .
390~·
380~·············
Bridge- . lO-YR EX.- - -
.. '2S-~R EX.·----50-YR EX. - _ .. -
100-'(R EX.-·-
500-YR EX. - - -
~nvert---l
370,1----~--+_--~---r--~--~----~--+---~---r--~---T--~~--r_--~--_r--~--_1
18000 18500 19000 19500 20000 20500 21000 21500 22000 22500
Channel Length (Ft)
I

~
+' u..
c o ·rl +' 10 > Q) rl W
Chacon Creek - Existing Condition City of Laredo, TX
440.-------~--------~----------------~------~------------------~--------------~
4du~"""" .......... -.-
. en: 420 -I '':'':''': '':'':''':':'':''': '':'':'''::':'':''':'~'~'~'~ '':'':''':' '':'':''':' _:~' ': ... :,:: ': .. : .. :: ': .. : .. :: :;: .. ::.:..:..:.'" "" '':'':'': '..:..:..:'..:..;.,:"" ''':'':';'':'':' _-'-'-"~ - - - ~
~ . . :n
c~~~~~~~:~~~~~~~:~~~~~~~:~:~:~:~~~~:~~~~~~~:~:~:~=:~~~~~~~~~~~~~:~]f~~:c:c:~ n:
410 -k ~ .. ~ .. - ,-: ,-.. - .. ~ ,..,-: .. !:":' .. -:-7, 'IT'
J:
J:
400- ;)C-f------------------------------------~, Bridge ... , -, ...
390~",'""
lO-'(R EX." - -25-¥R EX.----50-YR EX ... ,- .. -
100-YR EX.... _ ..
500-'(R EX." - -
~nvert---1
380~1----~--+---~---r--~--~----~--+---~---r--~---T--~----r---~--~--~---1
22500 23000 23500 24000 24500 25000 25500 26000 26500 27000
Channel Length (Ft)
I
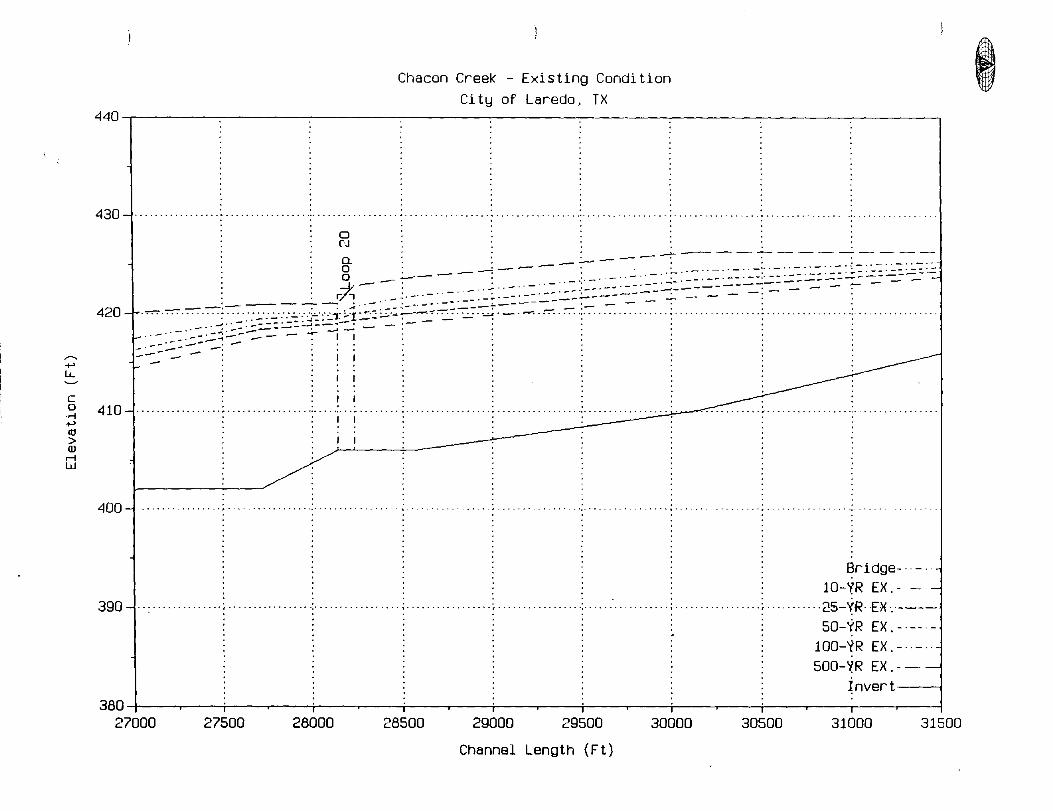
~
+' lJ...
c o
. ,-i +' <tl > W rl W
Chacon Creek - Existing Condition CitU of Laredo, TX
440._------~--------~------~--------~------~--------~------~~------~------~
430~········
o fJ
a. o o 420+~.==~'- 07;-- ~- -~~:o: -,0 0:';j ~ ~ ';'¥~~ co,, ~ .~. ~;:~.~.: i:'::::::: :::00 :.::~:.:: ~::.:4 :::.:.::::::. :}:' ~ "'," -' t" ~co ~ co ~" .- .. -.-
410 -/.. . ..... j' .. - .
400~····
390 --< ................. , .. .
........ ~. ~~-----~ . ...... ":'_ ... .
• "r 0-
1"' •
8ridge-·· - .. -lO-YR EX. - - -
. ·2S-YR EX.·----50-YR EX.----
100-YR EX.-·-··-500-YR EX.--
~nvert-~
380;1----~--+_--~--~--~--~--~~--+_--~--~--~--_+--~----r_--~--._--~--_1
27000 27500 28000 28500 29000 29500 30000 30500 31000 31500
Channel Length (Ft)
I

c 0 . ...; ...., . ...; lJ C 0 x U I-
OJ C 0 . ...; ...., lJ CI) Gl . ...; L X <U
W ...J
"-0
.::.: ::n Gl Gl
...., L
. ...; U U
C 0 U <U .c U
8 r---------~--------~---------------------------r~-----,--~r-~a
<D (Y)
\ '.\' \ ... \ \
1" \ :'.'.\
\ '-\\\ .
I Gl ...., OJXX:XXXL lJWWWWWGl . ...;. > a
. L a:: a:: a:: a:: a:: c a . ... . . . . . .. .. . . . .. . ................. .- ......... -co . ,.. .. ,;.. .. ;>- .. >- . ,... ....... .. Lf)
. I I I I I Lf) aliJaaa (Y) ..... CJ Lf) a a
..... Lf)
a a ..................................... a Lf) (Y)
o o
.. , .. ' ... " . . . .. .. .....................................•.................. If) '<T (Y)
o o
.................. :.\\\\ ........... : .... . .................. ; .................. : ................... 0 '<T (Y)
\ '" \ '.'.\
\ '" \ '.'\ · \ I~\\ .
.................. ~ ....... \\:~\ ...... : .................. : . o o ..•.••• - ~ • • • • • . • • • • • • • • • . . ... • • . • • • • • • • • • • • • • • • U")
(Y) (Y)
\"'~ .'~
\ I~~~
\
\\\ I :
'.'\' : \
,":, .1\'
......................... _ ..... -\\" ... - ... - ....... " ....... .
\ :\\\ :. \ : \" \
: '. '.\ \. \" \
'. \\
o o
.. .. " ................. 0 (Y) (Y)
.\ \', \ : '. '. \ 0
.................. ; .................. ;.\ .. ~."\\ ...... ; ..................................... : ................... ~ · . \'1'" \ . . . C'J
~\\ (Y)
\
\ " I \ \ ,\ \ '\.\ .
· . \ '->\\ 0 .................. ~ .................. : ........... \:~ .. ~.'\\ ................ : ................. , .................. ~
\~~\ (Y) .. \
\. ,,' : '.'\\
\ '" \ .~\ o ~ ____ ~ __ ~ ____ ~ ____ -T ____ -r ____ -r __ ~~L-__ ;-__ ~,-____ ~ ____ ,-____ +~
..... o <D '<T
o Lf) '<T
o '<T '<T
o (Y) '<T
a C'J '<T
o ..... '<T
D(Y) o '<T
.c ...., OJ c Q)
...J
r-4 Gl C C <U .c u

~
+-' lI... '-'
C 0 . '; +-' <0 > Q) .-I w
Tributary 3 - Existing Conditions City of Laredo, TX
450.---------~------~--------~--------~--------~------~--------~--------~------_,
445
OJ : .....
lJ)
.. / ... ,~.~.~;~~~8~~~:0~~~~~:;;~~ij;~l;~~~.~. / ".;>< -:- / ..... .
/' :1.1,,. /'" ' / ,_ ___ ,/,;1" .. ..
440~·············
435
430
425
./.:~::.,:<,l. /
/ / :_--' . .;,'. . .... 1'/' r. '''J: .// /: - ----... ,/1 :
/ 1:/'/· ...: . ,I.
/ /" il; .;1, .. . /'1... .; . // . /"/ ....
8ridge- . lO-YR EX.- -
. ·2S-YR· EX ;----
50-YR EX. -.--100-YR EX.-·-500-YR EX. --
4206r~~~~~--~~~~t-~--~~~~--~--~--~~--~--r:~==J o
lnvert---l
300 600 900 1200 1500 1800 2100 2400 2700
Channel Length (Ft)
,

UJ C 0 ...... ~
...... -0 C X 0
U I-
Ol 0 C -0 ...... ~ aJ UJ L
...... <tI
X -l W "-
0
(T) :::Jl ~
:::Jl ......
L U <tI ~
:J .Q ...... L I-
o ,-________ ~--~~----r_--------~----------------~~------~~~-rO .'1 ~
\ ;\\ \ ~ , \
"'\ OJ +' ~ OlXXXXXL
"
"\ -oWWWWWOJ 'I ...... > :. L~~~~~C .......................... Tt:~\x"';"""""'''''''' ················· .. ·········m· ~.~ .. ~ .. ~. ~.-...
\ I" \ . ~ ~ 55 8 8
o o
~ . -~ , ," I '.'.\ , ," \:
'.'.\ : ............................... \.'~,\i ....... . o
.................................. 0 co \
I" I ·1\ , '", I ".'.1
, : 1" \ : '.'.\
""
,. I" \ · ~\ 0 .................. ........... - ...... ! .. 'it ....... - ...................... -:- ............. - ... -;................... a : \ .1.\\ ~ · ,"'I "" '.'.\
\ "'1 '.'.1 \ "'\ '.'.\ ............................. : ...... : ..... ,.\'>\\ ....... ~ ....................................................... §
· \ ',"', . "" .1.\
\,.\1, ,.\ .1.1
\ "'1 . 1.1 .................................... : .......... \.,.;\\ .. : .................................................... . o
o Ol (T) · \ "'1 : . '\ :
\'i" ,:
'.'.1 I
\"':1 '.'.\
... ...... .. ................. " .............. \';,\\. .... . \'", \ : '.'.\ \ '.\\ \ . \\\\ \ : . .'\
o ....................... 0
<D (T)
.................. : .................. ; .................. : .. \'::\\ .. . . . . ".\\ \ . ................................... 8
(T) (T)
\1" I '.'.\ \ '" I .,.\ , '.\' I .. I . 0 .................. ; .................. ~ .................. ~ ........ \.I::\\ .... : .................. ~ .................. 8
"
"l (T) .1.\ , '.\\ \ : , 1\\ I:
'.\' \ 0 ~ __ -. ____ ;-____ r-__ -T ____ ,-____ r-__ -.~~~ ____ r--L-T ____ -r ____ ~R
o(\J (T) o
<D
"" o ~
"" ""
.c +' Ol C aJ -l
...... OJ C C <tI .c u

VJ C 0 ..... +' ..... LJ C x 0 U >-
Ol 0 C LJ ..... OJ +'
VJ L ..... <U X ...J
W "-0
(Y) :Jl +'
:Jl .....
L U <U +' :l .0 ..... L >-
o r-------~~--~-----------------------------------,-,----~~~~-r~
~: 00
\ '''~ \ .~~ \'~~~ I \.;\ Q) ~ : \ "'~ Ol X X X X x L
\~ ~~~~~~~ 0 ................. : .. \'~~~ ...................................................... m.:>-.>-.. :>-.>-.:>- ......... 0
\"" I I I I I 00 ru O~OOo ~
.. ~ ~NmOO
\"'~ ~ m .~~
\"'~ .~~
· \'~~~. .............. : ........... \~;~ .. : .... .
\"'~: .~~ :
\'~~~ .~ · \\~~~
o ...................................... 0
m ~
o .............. ; .................. ;\':.,.~ .................................................................... 0
· .\~'\ ~ .. '\ \ "', .,.\
\ '" \ . ~.\
\ '" \ .. '.\ .................. : .................. : ...... \"i~~\\ ....... : ..... . · . \ ·i,' \ .
.'.\ \ '· .... i \ \ ",' \ . . . \
.................. ; .................. ; .......... \.~\\\ .. ; ........... .
\ ,,' \ : :'. \ :
\ ' .... \ \ : \ ,,' \: .. : \ :
\ '. ~ , \ .. \ . ........................ . ......... , ............. \" ·'~":';i············· \ ,.~ \
: '. \ \ \" \ :: \ \ \" \
· . ::\ .................. ; .................. ~ ................ ~·~\~i\··············
· . \: .,., , \ : : '. \ \ ':~.\\ :\ 1" I
· . : : ' I
o ..................................... 0
Ol <0
o . ..................................... 0
<0 <0
o o (Y) <0
o ................................. 0 o
<0
: : : \ 1"\1 8 ..................................... ; ................ ····\·\\\i··········· ..................................... [?;
\ ,1\ \ .. '. \
\ ,,' \ . .'. \
\ ,,' \ : ~ \ o ~ ____ ~ ____ ~ __ -, ____ ~ ____ -, ____ -T __ ~~ ____ ~ ____ -r ____ -r ____ ,-____ 4-~
o <0 -.r
om -.r -.r
.c ...... Ol C OJ ...J
.-I OJ C C <U .c u

C/) c 0 .....
..... ..... D C x 0 U I-
OJ 0 C ..... D ..... OJ C/) L
..... <1l X ....J
W "-0
("Y) :n ..... :n ..... L U <1l ..... :J .0 ..... L I-
o
r-----~'7~----~----~--------~-----------------.-,------r-~~-r~ "X: 0
\1' '"\ ., \ \i~,~~ ill .....
.....
\
. I", OJ X X X X X L '.~ DWWWWWOJ ...... > 0
....... i· \\'.{\'- ........... : .............................................. ~. g:. .,?: .. ~ .. ~. g: .. 5... 55 \1
'" I I I I I 0
\ 0Lf)000 .....
". .....ruLf)OO
\"" ..... Lf) '.'\
\'" \ '.'\ ..... : ........ .\' . .'~\\.
· \"" '.'\
\"'\ : '.'\ : \ \'.\\ \ '.'.\'
\ Ii', \ :.'\'
o o
.................... " ............... ', .................. (\J o .....
.................. : ................. ·\i~.~~········ o o OJ OJ
· . \1'" \ .,\'
\ "" \ '.'~ \ I"~ \ .~~
........ ; .................. ; ...... y~ ....... ; .... . · . \~~.
\ .~~ \ I"~ \ .~~
\1'" \ .~~
.................. : .................. : .............. ~~;~: ..... . · . '\~~
\I'\~ \.~ . \1'\ \'~
\1'" \'~
..................................... : .................. : ..... \'~~ ..
\1"1 \.~~
\I"~ \.~~
\1'" \'~
.: ................... : .................. . o o <0 OJ
o ............. .- .................. 0
("Y) OJ
o . ........... " .................. 0 o
OJ
............. , .................. , .................. , ............. .'\~W ...................................... 8 ~, ~ \~~ co
~~~~ : \I~~~ . \s .
.................. : ..................................... : ....................... ~~~ ........ : .................. ~ II'" co \.,').,
\1" , \"~\' \ I~~\ \ . '\ .
~-----r------T-----~------;-------r------r------,------;-------r--~'~~~\~:--~--,-----~~ o OJ "V
If) co "V
o co "V
If) <0 "V
OCO <0 "V
.>=. ..... OJ C QJ
....J
.-I OJ C C <1l
.>=. u

C/) c 0 . .-;
...... ..... D C x 0
U >-
OJ 0 C . .-; D ...... aJ C/) L . .-; ro x -l W "-
0
(t) ::Jl ...... ::Jl
. .-; L U ro ...... :J .0 . .-; '->-
o
r-----~~~--------~~--------~----------~-----,-.~--~.-~~-r~ .,\; . (t)
\~'~ ~ .~~
\\'~~ '\:~~
I Q)., ~
OJXXXXXL DWWWWWaJ ...... > 0
.................. :. \'.'~~ ......... . L Ck: Ck: Ck: Ck: Ck: C 0 ............. ················· .. ··········m·:>o-· .> .. >- .. >-.:>0-. .......... C'J
I I I I I (t) · \ "':-.. \ .,~
\(\~ , I'" \.~~
\ ":~:\ · \ . \
0Lf)000 ~ ~r:.JLf)OO
~Lf)
o o
.................. : .......... \'~~~ ... : ................. . . .. :................. ••.......•........... OJ ("".J ~ \ \\ .
\.~~ : \ "":\ \ .. '~ \"" · .~:-'"
.................. : .................. ~.'.~~ .............. : o o ...•.•..........•.....•..•. ,............. <D (""J ~ : \"~~\,
'\~~~ \'" :\ .\~ .
..................................... ~ ...... \~:~~ ...... ~ . . . . . . . . . . . . . . . 8 . \'?~ ... ...................•................... §
\"" .,\'
\'" ,: .'\~
\"\\\, · . .~\\ ···········:··················:·················\t~~·· ...
· . :\.~~, : .. '\
\ '" \ .~\
\ '" \ .\\ .................................................... -\ '.~\\.
\ "11 \ .. ' .\ \ "" \ .,.\
o o ·································0
N ~
o o
.•...........•...............•..••••... f'o,
\ "" \ .. '\ .
.................. ; .................. ; .................. ; ............ y~): .................................... ~ : : : \ .\\' ::
\~.~-\\ \\~\,
\ '\' \ . . .\ ............ : .................. : ..................................... ~ ... \\~~.\\ ......... :
\""\ .. '.\ \"" , .. '.\'
o o ..... ..... .....
\'~\\ ~ ____ -r ______ T-____ -, ______ -r ______ r-____ -T ______ ~ ____ -; ______ ~~\~:,~'~\-T ______ ~ ____ ~~~
o o ~
Lf)
Lf) o Lf)
o o Lf)
o OJ "f"
Lf) co "f"
0 ..... co "f"
.c ...... OJ C aJ -l
.....; aJ C C ro .c u

(f)
c 0
. .-i +" . .-i '0 C X 0
U I-
OJ 0 C '0 . .-i III +"
(f) L . .-i <0 X ....J
W "-0
CD ::Jl +"
::Jl . .-i
L U <0
+" :::J .0 . .-i L I-
o r-----~~~----~~--~----------~----------~----_,--r_--~_r~_,--r~
t\\ ~ ". \ .-<
\" '\' ". \: \
11 '\ '. \ \":', .~ \ ............. ~\\\ ......................................... .
:\11 '\ : .~. \
· \" '\ : ". \
I aJ +" OJXXXXXL 'OwwwwWaJ ,.-i > 0 L~~~~~C 0 ........... o:l . :>-.. ,... .. :>-- .. >, . :>-.. ,....,.. . OJ
I I I I I LD OLDOOO ...... ...... r'J LD 0 0
..... LD
. \"', ~, 0 .................. : .... \'\\\ ......... : .......................................................................... g
\"', ~ '.'.\
\'" , '.'.\
\'" \ .1.\
............... : .......... ~'~~ .......... . ~~~~ .
\'" \. .,\:
\ ':~ \ \,,\
o o CD LD ......
· \'~~~ .. 8 .................. , .......... : ....... , .. ,,, ....................................................................... 0
• .• \.\\\ . LD
\ '" \ '.'.\
\ '" \ '.'\
\'~~ \ ,,\ . ............. ; .................. ~ ......... \\~\\ .. ; ...... .
\\~\\: , "''\ , .\\ ,~~\ ,,, .\
......
o o
............................................. f',.
'T
................. . ................. , .................. \~~-~;: .. . ,\11.\ , .1.\
,\ II \ , .1.\ ,\1' .\ , .,\
.' ~~~ o o ..... 'T .....
.............. ; ..................•.................. ; ............ \'.~~~ ............. .
,\" .\ , .~\ \\'~,\ \'.\.\\
\ "'\ 0 .. '.\ 0 ..................................................................... ~ .. '\':~\\""""';""""""""" ~
. \'" \' ...... '.'\ \ ,,' \ , .1\
\ "'\ ".'\ 0
~-----r------T-----~------;-----~r------r------~----~-------r~'~~,~'~\-r------~--~~-~ CD
0 ...... o o
CD LD
LD C'J LD
o C'J LD
LD ..... LD
o ...... LD
LD o LD LD
.c +" Ol C aJ
....J
...... III C C <0 .c u

~
+' LL
c o ·rl +' to > Q) .-l W
Tributary 3 - Existing Conditions City of Laredo, TX
550.-----------------~----------------------------------------------~--------~------_.
545-···········
540-·············
..« ~y:/ . ~»:
: ~~/ . :~?/
.... ~.:~ ...... .
~~..J': ~;.P/ .
. ~» .---% y:~ .".
0~
535~············· ~~
530
525
......... ./.~.;d. .... ~::.-:-;v/
/.:,..;::..;...c/ / .. ..:;:z·
: /' .,--:.;:;~ ,... .--'"". ... , ,
~::,..:::.;...--/ ~::..~:...-;..-
.....-::.: :.-:;'/........-: .~::...:::// .
.... ;;;:' ., :; ~.-7 ......-;::,..~'l
....-::;./// ~:/-:.~ .
/.::,..:~ '...-: ~ /' Bridge
lO-'(R EX.-... 2S-¥R EX ... ----
50-YR EX.-·--100-'(R EX. -.-500-'(R EX. - -
Invert----l 520~1----~--r_--~--+_--~--~--~--_r--~--_+--~--~--~----r_--~--+_--~~
16200 16500 16800 17100 17400 17700 18000 18300 18600 18900
Channel Length (Ft)
I

~
+' LL '-'
C 0
• ..-j
+' <0 > Q) .-i w
Tributary 3A - Existing Conditions City of Laredo, TX
490.-----------------------------------------------------------------------------------~
485
480
475
470
465
A~ A;.P h~ . /",~
~;P ""~ (,if" ..
~;..v .
. A1f ~vr
4'· (ji74W:
('~j . .. ~ ...... .
d
(1f' .. /.. ..... /.jjw ~ 4:
-&'.Y : . -&9' :
." ..... :-&9 2/"" . (ftr?: ....
:4' .A~
~d/;;P .... ~<J-?/ . . ~~~ ...
~~;.P""", ~-?; ':""" . ~.iV' '
~~»~ ---;:;.~:§.,..,.....
~:~~~;::;..' :
....... -.~:;..~~~ ....-::~- .. :,...,;:..~ . . ,,; . .if~""-""'" .. : .....
8ridgelO-YR EX.' 2S-YR E}C----50-YR EX. - ---
100-'i'R EX.-·-500-YR EX.·
~nvert---f
460i6~--~~~--~~~~~--~~--~-=~--~--~--~--~,---~--~--~---t~~===J 500 1000 2000 1500 2500 3000 3500 4000 4500
Channel Length (Ft)
I

~
+' LL
c o ·rl +' <0 > OJ r-l W
Tributary 3A - Existing Conditions City of Laredo, TX
515-r--------~--------~--------~--------~------------------------------------~--------_.
51O~ .. · ........ ·
505
A : A}) : -%}} , //~
'":,0"'1/ .. ".,.,.. ...... . • '.1. .
Ail} .t"P: A .
: ~"J/ : : ~7 •
: (.;JY : ":;(f'P.. ..' .aW
.. hi;'
~ry: ,,{f~ :
.a'fP : .: (J1 . ;j ... ..i. .. 500~ .. · .. ·
495
490
Iff : I: :A::# .
........ ~?7 . /.~~: ..... . . A~~v/ . ~.A~V/ :
. ~ ."",W- '
. ,.,.:. . ~~~ ~~»:// :
~ ...... ~~........ .
&~.:,...-::.~....... .
.. . . ",.""'" . . ;."&"P-.~' • :~r/ ...... ;.... . roW , ....... ~ - : .......... . " .'
~ridge
lO-YR EX.-2S-yREX;----
50-YR EX.-·--100-YR EX. --500-YR EX. -
~ nver t------j
485~1~~~~~--~~~~~~~~~~~--~--~--~~--~--r:~==J 4500 5000 7000 8000 5500 6000 6500 7500 8500 9000
Channel Length (Ft)
I

~
+-' LL
c o
,,-t +-' <0 > Q) r-i W
Tributary 2 - Existing Conditions City of Laredo, TX
465.---------~------~-------~-------~-----~-----~------~--------~-----_.
450~"·"",,,··
435~"""·,·,,,,··,
42o~·"""···,,,
o RA, e. o o .;.J 17'
I: 1
I: 1
I'
I'
. I:J,
I: 1
U ----" '
..... '" .... .. ---... -,.., .. -.-~-, ~
_",,~,;.c:<",,~~ ·;'i 390 , ... -=-, -- , ;' ; , ..... i i
" '
405~
8ridge- ' lO-YR EX.- - -
·2S-YR EX,.----50-YR EX.----,-
lOo-YR EX, --5oo-YR EX.---
rnvert---f 37511----~--+_--~--_r--~--_;----~--+_--~--_r--~--~r_--~--~--~--_T--~--~
o 500 1000 1500 2000 2500 3000 3500 4000 4500
Channel Length (Ft)
I

~
.p LL
c o . .-i .p
<0 > Q) .-i W
Tributary 2 - Existing Conditions City of Laredo, TX
465,-------~--------~------~------~--------~------~------~~------~------~
450~··············· -, ... .......... .. ....... . ............ -....... " ............. " ......... .
.. ~
435~··············· ...... '0:
x ~ I:
420 ' ' 4 ...... ~ >-'
"''''' ",5"'3 '."' 0' ,,;;~:';':;;'';'" '¥"" ".'!' c~ ~"" 0".J~"''''''')'''' "'Y"'~ c:i.@""",,0"""""""'.PC> ' :: II ....... " ....... .
~" ' """
405~···
390 ...................... .
37~
4500 5000 ,
5500
. . . . . . . . .
, , 6000 6500 7000
Channel Length (Ft)
. .
, 7500 8000
..... "
~ridge-··
lO-YR EX.- - -·····25-yREX,----
50-YR EX. _.---100-'(R EX.-··-500-YR EX. - - -
~nvert---j
8500 9000
I

+' LL
c o
• ,.-i
+' <0 > QJ rl W
Tributary 2 - Existing Conditions City of Laredo, TX
465.---------~--------~--------~--------~--------~------~--------~------------------~
450~·········
435+······ .... ;..... . ..... . ~ C§ C§"~~ ~,,~ "',"' =~,,~ "'''' ~~~~ ~,~>,,~ ::..~;;,~;;,.:; ~ ""@"""""""""""""' ... "";;>"' ...... ""''''
~. :~ · .
~
· . · . · . · . ... '." ...: : ~-----.:..---~ ................. : 420~·······
405~··
390~············· . . , . . . . . . . . . . . . . . . .
.. '" ... .... ,,'
..... ","
BridgelO-YR EX.,
·25-~R EX.----50-YR EX.-·--·-
100-'(R EX. -._. 500-YR EX.---
~nvert I 375~1r---~--;---~---;----~--;---~---;----~--;---~---;----~--;---~---;----~~
9000 9500 10000 10500 11000 11500 12000 12500 13000 13500
Channel Length (Ft)
I

~
+-' LL
c o • ..-i +-' <0 > OJ r-I W
Tributary 2 - Existing Conditions City of Laredo, TX
490.-------~--------~------~--------~------~--------~------~~------~------_.
475~····························'················
460+ ...... · . ; . . . . . . : :'" .:. .' . .' ..... .' . " .•....
. . . .
445~....: : ~~$~~~. : ...., .
430 -I ................•............
415~ .. ·
--
Bridge- .. -lO-'{R EX. - - -
.. '25-~R EX.----50-YR EX.-----
100-YR EX.--· 500-'{R EX. - - -
~nvert---l
400,1----~--T_--~--_r--~--~----~--T_--~--_r--~--~--~----r_--~--~--~--~
13500 14000 14500 15000 15500 16000 16500 17000 17500 18000
Channel Length (Ft)
I

~
+' lL.
C 0 . .-1 +' <0 > QJ rl w
Tributary 2 - Existing Conditions City of Laredo, TX
505.---------~----------------~--------~------~--------~--------~--------~------_.
490~···········
475
460
..... . ' ' .......... ' -- . -.--"",." . ' -' ~ ..... "" ... "'''''_''''_===' =.a;=="""'''''=~=''''~ . - """"~ . . -",,- -- ......... . --... """"---""~' ' ' ' ' ., .
...... . .' .' ...... ~ ...... . .. .... ........ ' .... -
445
430
8ridge- . 10-YR EX.
..... ·25-¥R EX.----50-YR EX. -' -_.-
100-YR EX.-··-500-YR EX. - -
~nvert---1
41511----~--+---~--_r--~--_;----~--r_--~--_r--~--_+--~~--r_--~--_r--~--_;
18000 18500 19000 19500 20000 20500 21000 21500 22000 22500
Channel Length (Ft)
I

+-' lL.
c o • .-1 +-' co > Q) rl W
Tributary 2 - Existing Conditions City of Laredo, TX
520~----------~----~--~~~~~----:-----~----~--~
505
490 . .... . -----_.--_.--------
· . . .. ~"".......... . . . · -=-~"".~~~....... · -~~~ .. -«.-_. ... . .. ... """"""""""""""""""""=-- . .. . . . : . . .. . ..... . L .. ~.
475 .....
460
445~·······
.. ~ ------.: ..... .
8ridge-·· - .. 10-YR EX. - -
....... 2S-~R· EX.----
50-~R EX.-·--·-100-YR EX. --500-YR EX. - -
~nvert---l
430,1--~--_T--~---r--~--_r--~--~--~--+_--~--~--~_,~~--~--~--~ 22500 23000 23500 24000 24500 25000 25500 26000 26500 27000
Channel Length (Ft)
,
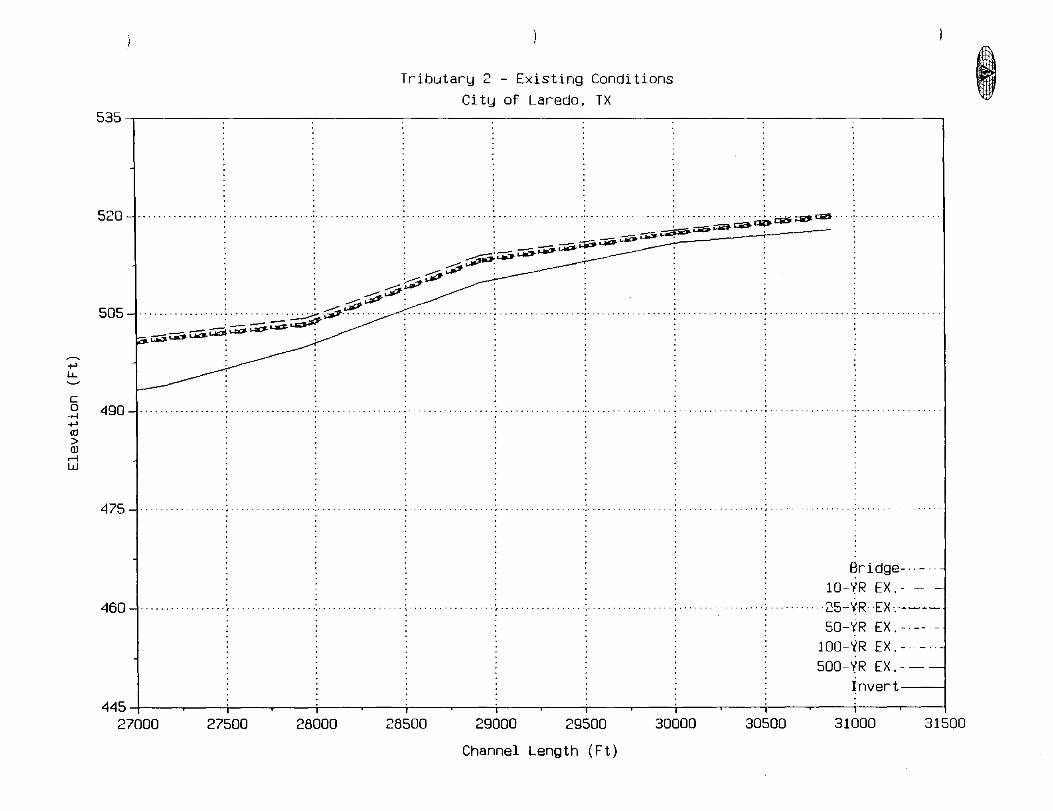
~
+-' LL
c o • .-1 +-' <0 :> OJ rl W
Tributary 2 - Existing Conditions City of Laredo, TX
535~----------------------------------------------------------------------~------~
.. . - .............. ...... . 520~····· . .. - ... ...... -
. ~~""' ... ==.;.. ... =_~=.;;;;;.>Oi>""--..... ---_.. - '
505 .. :...... . --~~. ~~_,.,.-.:; __ .: .. : .. : .. ~.~.;:io? . ~~....a. ........ ..-.-.....a-~........ . ... . .
490~··············
475
460 ..... .......
6ridge- .. -lO-YR EX." -2S-YR EX.----50-«R EX.-·---
100-YR EX.--, 500-YR EX. -
~nvert---l
445~1----~--r---~--+---~--;---~---r--~---T--~---;----~--r---~--+---~--~
27000 27500 28000 28500 29000 29500 30000 30500 31000 31500
Channel Length (Ft)
I

~
+' LL '-'
C 0 ·rl +' <t1 > OJ rl w
Tributary 1 - Existing Conditions City of Laredo, TX
420~----------------------------~----------~--------~
410
400
390
380
370
--
~'
Bridge- - - -lO-YR EX. - - - -25",YR EX. -,~------50-YR EX. -.---- ---
100-YR EX. -- --500-YR EX. ---
Invert~-j
350~1--~~~~--~~~-=~~--,,--~-,--~--,---~~--~--t:~==J o 600 1500 900 1200 300 1800 2100 2400 2700
Channel Length (Ft)
I

~
+' LL -....-C 0
.,-i +' <U > OJ
.--l w
Tributary 1 - Existing Conditions City of Laredo, TX
430,------------------------------------------------------------------------------------,
420
410
400
390
380
:..:>;- ---
o r-J
--------
Bridge - --lO-YR EX. - - - -
.25-YR EX. 50-YR EX. ---. _. - -
100-YR EX. -- --500-YR EX. ---
Inver t------j 37041----~--T_--~--_r--~--_.----~--T_--~--_r--~--~----~--._--~--_.--~--~
2700 3000 3300 3600 3900 4200 4500 4800 5100 5400
Channel Length (Ft)
I

~
+-' lJ...
C 0
.,-i
+-' <0 > W rl W
Tribut,ry 1 - Existing Conditions Itt Cit~ of Laredo, TX
440,---------~----------------~--------~----------------~--------~----------------_,
430
420
410
400
390
> rl cD
I r '.-
lot :~~~~~0°
u u +-' -
Bridge· .. lO-YR EX. - - - -25"YR EX. 50-YR EX ... -..... -
100-YR EX.· - - . 500-YR EX. ---
Invert----j 38011----~--T---~--_r--~--_,----~--._--~--_r--~--_.----~--._--~--_r--~--~
5400 5700 6000 6300 6600 6900 7200 7500 7800 8100
Channel Length (Ft)

~
+' 1L.. ........
C 0 ''; +' <0 > OJ rl w
Tributary 1 - Existing Conditions Itt City of Laredo, TX
460-,,---------------------------------------------------------~--------------------------_,
450
440
430 "',,~00000"'g"00000@0~04~~"""~'0'~00~0000' •• ~"~.::~~~~0~~~;;00;p~~J0~~c
420
410
Bridge ~ . ~~ lO-YR EX. - - - -
.25-YR EX. -~~---~--I
50-YR EX.·· - ---. -
100-YR EX. - ---
500-YR EX. ---
Invert------1
8400 8700 9000 9300 9600 400~1--~--~--~--._~--_.--~--._--~~--~--_r--~~~--~~~~~
8100 9900 10200 10500 10800
Channel Length (Ft)

~
+' LL "-'
C 0
.r-! +' OJ > W r-I w
Tributary 1 - Existing Conditions City of Laredo, TX
480~--------------------------------------~------------------~
470
450
450
440
430
""00t000@~~~~~~~;'~~~~""~~0~.;pjC:~~:O~~"
Bridge- - - -lO-YR EX. - - - -25-YR EX 50-VR EX ....... .
100-YR EX. --- . 500-YR EX. ----
Invert---j 420~1----~--'---~---'--~---'----~--T---~---r--~--~----~--.---~--~--~--~
10800 11100 11400 11700 12000 12300 12600 12900 13200 13500
Channel Length (Ft)
,

~
+' LL
C 0 ·rl +' <0 > QJ rl w
Tributary 1 - Existing Conditions City of Laredo, TX
490~-------------------------
480
470
460
occcC,:,,":i~~C"~~~~~~::::
450
440
Bridge -- - -10-YR EX.----25-YR EX. 50-YR EX.··
100-YR EX. - . 500-YR EX.---
Invert----l 430~1--~--~--~--_.--~--_.--~--_.--~--_.--~--_.--~--~--~--~--~--~
13500 13800 14100 14400 14700 15000 15300 15600 15900 16200
Channel Length (Ft)

452
432
~
+-' 412
LL
C 0
• .-j
+-' (tJ
> OJ .-f 392 w
372
TINAJA CREEK - EXISTING CONDITIONS CITY OF LAREDO, TEXAS
~~~~~~~~6~ ~ : .. :::::-.<-.. --;:.
/(J"/ /
;;,;"J':;'// ~ /~
('I) co
-'_.-l._, ___ ,_,_,_,_,~, ___ '_'_'
(tJ c (tJ
• .-j C/)
• .-j :J o -.J
«
L (tJ .-f U
(tJ +-' C (tJ
(f)
u (tJ
> .-f
+-' (tJ (f) (f)
c c (tJ (tJ u U) OJ ! 0.-.-·"-·-
.;~ ,;
3S2~'~!/~--~~--.-~--~~--,-~--~~-.--~-+--~-,--r-~~--'-~--~~--r-~--~~-''-~~--~~
o
---BBridge ----500-YR EX.
1000 2000
10-YR EX. ----Invert
3000 4000
Channel Length (Ft)
--------2S-YR EX.
SOOO 6000 7000 8000
SO-YR EX. . ··100-YR EXISTING

TINAJA CREEK - EXISTING CONDITIONS CITY OF LAREDO, TEXAS
420 -,------------------
"'"' +-' u.. "-'
c o
.,-i
+-' ro
410
400
~ 380 r-l w
370
360
3S0 0
Bridge -SOO-YR EX.
SOD 1000 lS00 2000 2S00 3000
Channel Length (Ft)
lO-YR EX. -------··2S-YR EX. SO-YR EX. Invert
3S00
(Y)
co
:n ]: :I:
/
4000 4S00
100-YR EXISTING

TINAJA CREEK - EXISTING CONDITIONS CITY OF LAREDO, TEXAS
440,,---------------------------------------------------------------------------------,
~
+-' LL
c o
0.., +-' co > W .-i W
430
420
410
400
co C ttl 0.., (J)
0.., ::J o
...J
.0_" . .. :::: .~'~~-
« ~ L o
:>-
L ttl .-i U
+-' (() .
"0 co > .-i co (f)
C
~ i ~--c u ; ~_._. ________ . ____ __________________ If. .. --.-.------ -... -----.-----.. ' f
;,[----~:~:::~;-:;1f ·
390 I I ~~-~--~-
4500
---ABridge
---------500-YR EX °
5000
lO-YR EX. ---.Invert
5500 6000
Channel Length (Ft)
-------25-YR EX.
6500
50-YR EX.
7000 7500
100-YR EXISTING _..1

Exhibit 2 (Flood Hazard Maps-provided in separate 2'x3'sheets)

Appendices (Provided in a separate folder)
Appendices (provided in a separate folder)