city of lincoln · city of lincoln . presentation and review of the water shortage options ....
TRANSCRIPT
May 13, 2013
City of Lincoln Presentation and
Review of the Water Shortage Options
Presented by: Tom Gould and Erin Hunt HDR Engineering, Inc.

Overview of the Presentation
• Discuss the resource planning and financial/rate issues associated with water shortages
• Review the development of the City’s water shortage rates
• Summarize the study’s key findings, conclusions and recommendations
2

Water Shortages/Droughts
“Drought is unique among natural hazards because it is not a clear event, like a flood, earthquake,
hurricane or tornado. These events strike, leave their mark, and are gone. A drought, however,
sneaks up on us quietly disguised as lovely, sunny weather. Unlike a hurricane, we cannot follow its
course on a map. We are never sure when a drought began until after it is already well
underway, and we are often unsure when it ends. Any day when it doesn’t rain or snow . . . could be
the beginning of the next drought.”
3
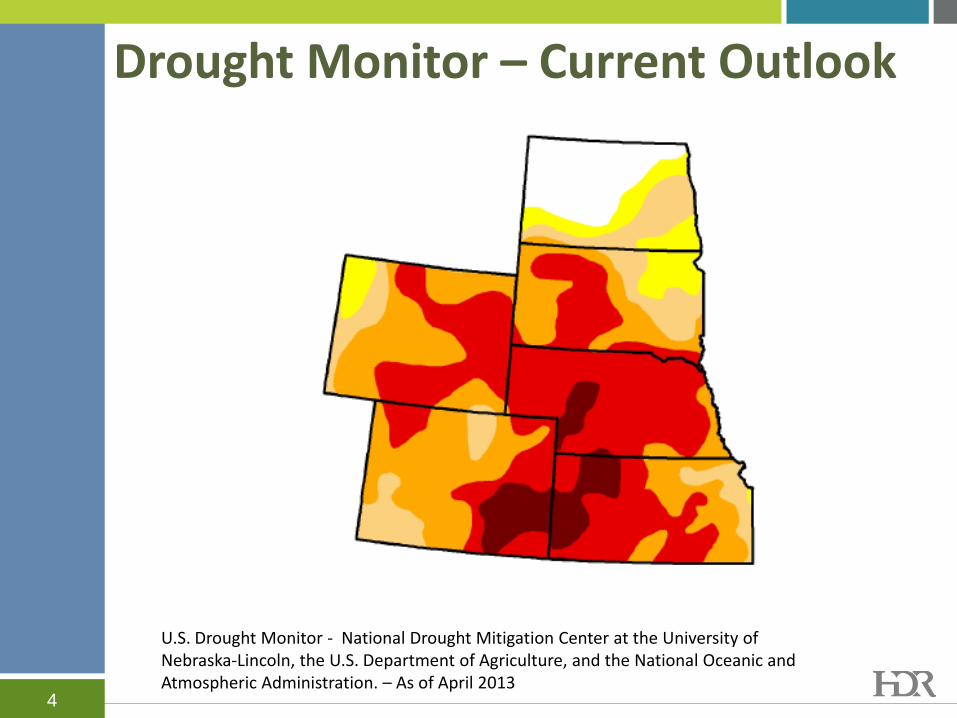
Drought Monitor – Current Outlook
U.S. Drought Monitor - National Drought Mitigation Center at the University of Nebraska-Lincoln, the U.S. Department of Agriculture, and the National Oceanic and Atmospheric Administration. – As of April 2013
4
Key Issues/Objectives for This Study
• During water shortages or drought conditions, customers will need to reduce their consumption to meet the available water supply conditions
• How should the City best achieve the following objectives? – Encouraging conservation and efficient use through
voluntary and mandatory means – Keep the utility financially whole (i.e. a 20% reduction
in use and revenues will create significant financial issues for the utility)
– For those customers that conserve and use water efficiently, have little or no bill impacts
5
Proactively Addressing Water Shortages and Droughts • Develop a water management plan
– Proactive management/“best management practice” – Clearly defines the various levels of drought/water
management • Defines the specific trigger events (availability of
water or catastrophic event) to declare a water shortage
• Specifies the desired level of savings • Specifies voluntary and mandatory actions to be
taken to achieve needed savings • The Department’s Water Management Plan was
the basis for the development of the water shortage rates developed here in.
6

Achieving the Needed Savings
• Needed savings (reductions) can be achieved via: – Economic Incentives – Pricing of the water to
provide direct economic incentives for efficient use – Command and Control – Direct regulation of an
activity by legislation that states what is permitted and what is illegal
• Some combination of these methods is often used and needed to achieve the needed savings – Using pricing (economic incentives) to reduce
demand has been found to be the more cost effective than non-price methods
7

Objectives of Water Shortage Rates
• Create a “price signal” to encourage efficient use and conservation – For customers that do not conserve, bills should be
higher than normal and, in extreme shortages, the rate (bill) should penalize their failure to reduce use
• Customers that do conserve should have bills at or near their “normal” level
• At the same time, as much as possible, be revenue neutral
8
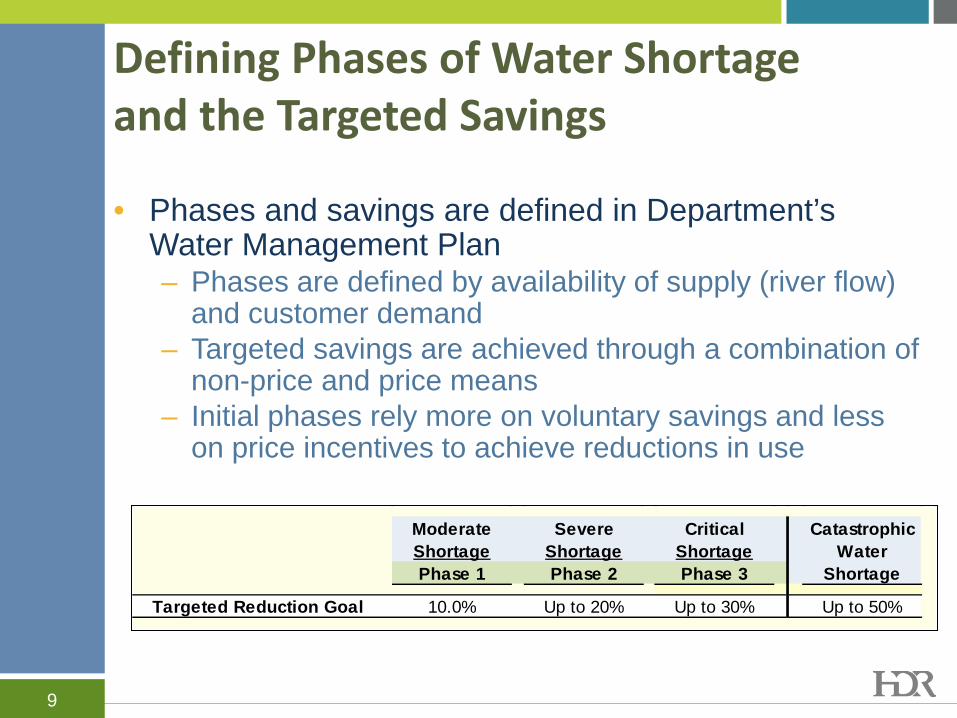
Defining Phases of Water Shortage and the Targeted Savings
• Phases and savings are defined in Department’s Water Management Plan – Phases are defined by availability of supply (river flow)
and customer demand – Targeted savings are achieved through a combination of
non-price and price means – Initial phases rely more on voluntary savings and less
on price incentives to achieve reductions in use
Moderate Severe Critical CatastrophicShortage Shortage Shortage WaterPhase 1 Phase 2 Phase 3 Shortage
Targeted Reduction Goal 10.0% Up to 20% Up to 30% Up to 50%
9

Key Objective – Revenue Neutrality
• Water shortage rates are designed (intended) to be revenue neutral – i.e., Achieve the same level of revenue as derived
under “normal” water conditions – Fixed and variable (consumption) charges
• The City’s rates lean heavily toward variable (consumption) charges – low revenue stability
• Additional (extraordinary) expenses incurred during water shortages
10
Water Consumption and Reductions
• Where possible, the water shortage plan and rates target different segments of consumption – Non-discretionary versus discretionary usage – Residential indoor versus outdoor use – Efficient versus inefficient and/or wasteful usage
11
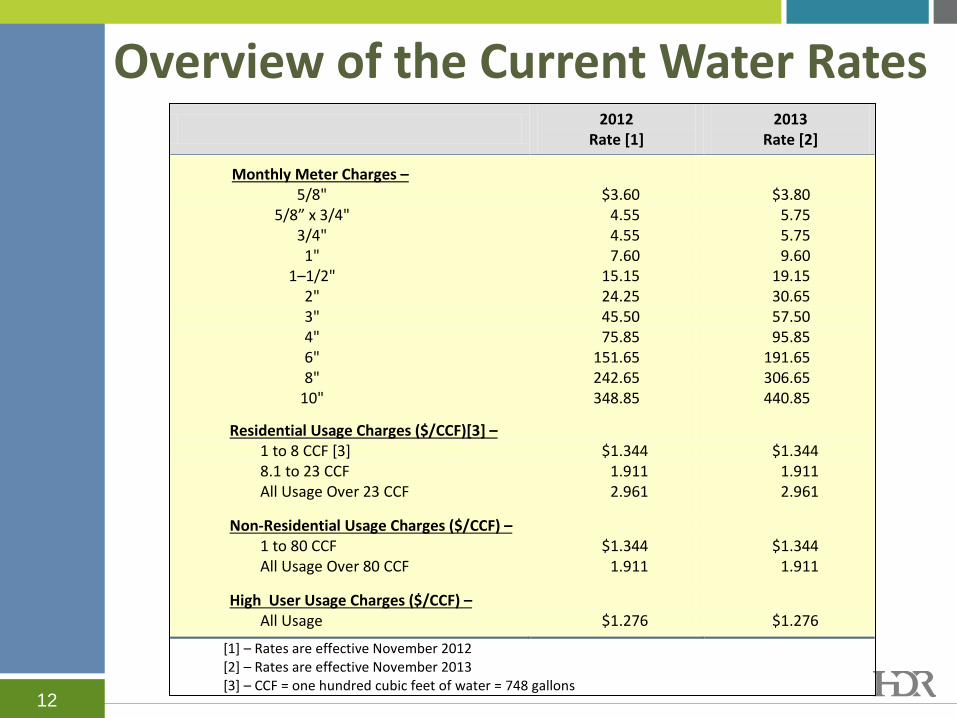
Overview of the Current Water Rates
2012 Rate [1]
2013 Rate [2]
Monthly Meter Charges – 5/8" $3.60 $3.80 5/8” x 3/4" 4.55 5.75 3/4" 4.55 5.75 1" 7.60 9.60 1–1/2" 15.15 19.15 2" 24.25 30.65 3" 45.50 57.50 4" 75.85 95.85 6" 151.65 191.65 8" 242.65 306.65 10" 348.85 440.85
Residential Usage Charges ($/CCF)[3] –
1 to 8 CCF [3] $1.344 $1.344 8.1 to 23 CCF 1.911 1.911 All Usage Over 23 CCF 2.961 2.961
Non-Residential Usage Charges ($/CCF) – 1 to 80 CCF $1.344 $1.344 All Usage Over 80 CCF 1.911 1.911
High User Usage Charges ($/CCF) – All Usage $1.276 $1.276
[1] – Rates are effective November 2012 [2] – Rates are effective November 2013 [3] – CCF = one hundred cubic feet of water = 748 gallons
12

Residential Water Shortage Options
• Reviewed three different options for residential – Options focused on efficient
“outdoor” use and some “indoor” use
– “Outdoor” use (i.e. 2nd and 3rd block usage) is considered more discretionary
– To achieve savings and desired financial stability, options will need to include, at some level, block 1 consumption
• The option selected maintains existing the rate structure, and in Phase 1, does not change the first block of use
72%
22%
6%
0
1,000,000
2,000,000
3,000,000
4,000,000
5,000,000
6,000,000
7,000,000
8,000,000
1 2 3
CCF
Residential Tier Block
City of Lincoln Residential Consumption by Block
13

Proposed Residential Water Shortage Rate[1]
CatastrophicWater Shortage
Up to 10% 10% to 20% 20% to 30% 30% to 50%Phase 1 Phase 2 Phase 3
% Change from Normal Water Rates Block 1: 0 - 8 CCF 0.0% 16.0% 38.0% 113.8% Block 2: 8 - 23 CCF 37.3% 45.0% 95.0% 185.0% Block 3: Over 23 CCF 54.9% 90.3% 144.8% 251.0%
Drought Conditions - % Change from Normal
Normal Moderate Severe CriticalWater Shortage Shortage Shortage Catastrophic
Conditions Phase 1 Phase 2 Phase 3 Water Shortage Demand Reduction Goal 0% Up to 10% 10% to 20% 20% to 30% 30% to 50%
Adjust All Blocks and Tiers, Except Block 1, Phase 1 Block 1: 0 - 8 CCF $1.344 $1.344 $1.559 $1.855 $2.873 Block 2: 8 - 23 CCF $1.911 $2.624 $2.771 $3.726 $5.446 Block 3: Over 23 CCF $2.961 $4.587 $5.635 $7.249 $10.393
Residential Water Shortage Rate - $/CCF
Note: 1 CCF of water = 748 gallons
[1] – The fixed monthly meter charges remain in effect during each water shortage phase – no change to the level of the charges
14
. .

Residential Bill Comparison
Normal CatastrophicWater Moderate Severe Critical Water
Conditions Shortage Shortage Shortage ShortageTargeted Reduction Goal 0.0% 10.0% 20.0% 30.0% 50.0%
Tier 1 Customer Using 8 CCFAssuming No Change in Use - 8 CCF $15.30 $15.30 $17.02 $19.39 $27.53Assuming Reduced Usage -
Revised CCF Usage 8 CCF 7 CCF 6 CCF 5 CCF 4 CCFTotal Monthly Bill $15.30 $13.96 $13.90 $13.83 $16.04
Tier 2 Customer Using 23 CCFAssuming No Change in Use - 23 CCF $43.97 $54.66 $58.59 $75.28 $109.22Assuming Reduced Usage -
Revised CCF Usage 23 CCF 21 CCF 18 CCF 16 CCF 12 CCFTotal Monthly Bill $43.97 $49.41 $44.73 $49.20 $49.32
Tier 3 Customer Using 40 CCFAssuming No Change in Use - 40 CCF $94.30 $132.64 $154.38 $198.51 $285.91Assuming Reduced Usage -
Revised CCF Usage 40 CCF 36 CCF 32 CCF 28 CCF 20 CCFTotal Monthly Bill $94.30 $114.29 $109.30 $111.53 $92.89
Total Monthly Bill
15
. .
. .

Non-Residential Water Shortage Rate
• Non-Residential rate is a two-block structure; – 0 – 80 CCF (approx. 60,000 gallons) – Over 80 CCF
• Usage blocks are not predicated on “indoor” and “outdoor” usage – Diverse customer types – There can be some significant outdoor usage in this
class of service • Assumed targeted savings equal across both
consumption blocks – Size of the adjustments moderated to reflect limited
ability to manage/reduce certain usage 16

Non-Residential Proposed Water Shortage Rate
Normal Moderate Severe CriticalWater Shortage Shortage Shortage Catastrophic
Conditions Phase 1 Phase 2 Phase 3 Water Shortage Demand Reduction Goal 0% Up to 10% 10% to 20% 20% to 30% 30% to 50%
Block 1: 0 - 80 CCF $1.344 $1.496 $1.688 $1.934 $2.714Block 2: OVER 80+ CCF $1.911 $2.128 $2.400 $2.750 $3.858
Non-Residential Shortage Conditions - $/CCF
CatastrophicWater Shortage
Up to 10% 10% to 20% 20% to 30% 30% to 50%
Block 1: 0 - 80 CCF 11.3% 25.6% 43.9% 101.9%Block 2: OVER 80+ CCF 11.4% 25.6% 43.9% 101.9%
Shortage Conditions - % Change from Normal
17
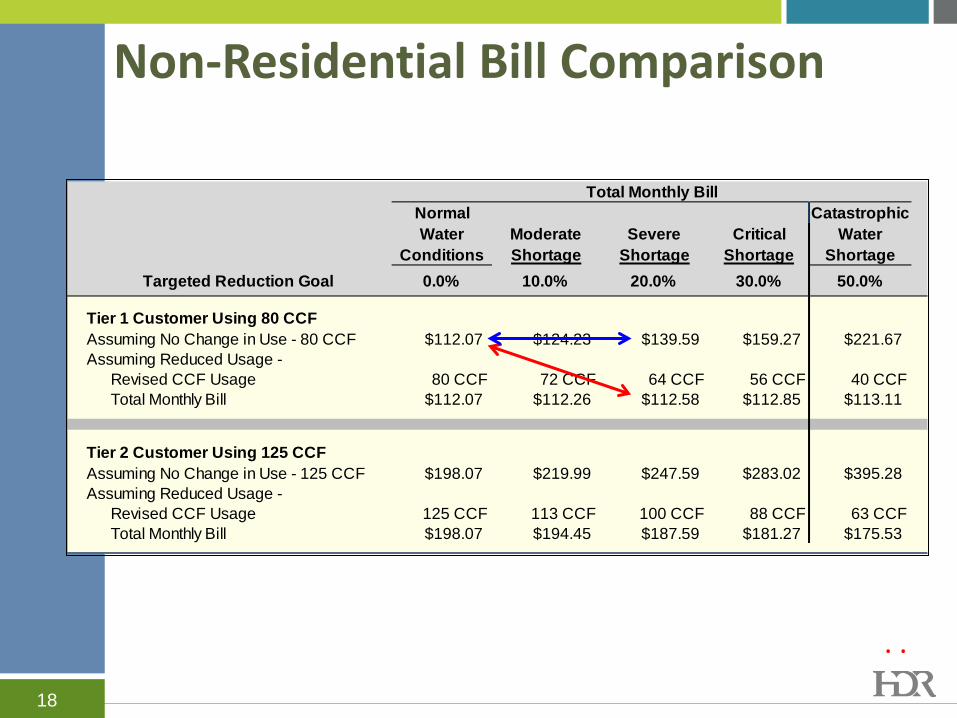
Non-Residential Bill Comparison
Normal CatastrophicWater Moderate Severe Critical Water
Conditions Shortage Shortage Shortage ShortageTargeted Reduction Goal 0.0% 10.0% 20.0% 30.0% 50.0%
Tier 1 Customer Using 80 CCFAssuming No Change in Use - 80 CCF $112.07 $124.23 $139.59 $159.27 $221.67Assuming Reduced Usage -
Revised CCF Usage 80 CCF 72 CCF 64 CCF 56 CCF 40 CCFTotal Monthly Bill $112.07 $112.26 $112.58 $112.85 $113.11
Tier 2 Customer Using 125 CCFAssuming No Change in Use - 125 CCF $198.07 $219.99 $247.59 $283.02 $395.28Assuming Reduced Usage -
Revised CCF Usage 125 CCF 113 CCF 100 CCF 88 CCF 63 CCFTotal Monthly Bill $198.07 $194.45 $187.59 $181.27 $175.53
Total Monthly Bill
. .
18
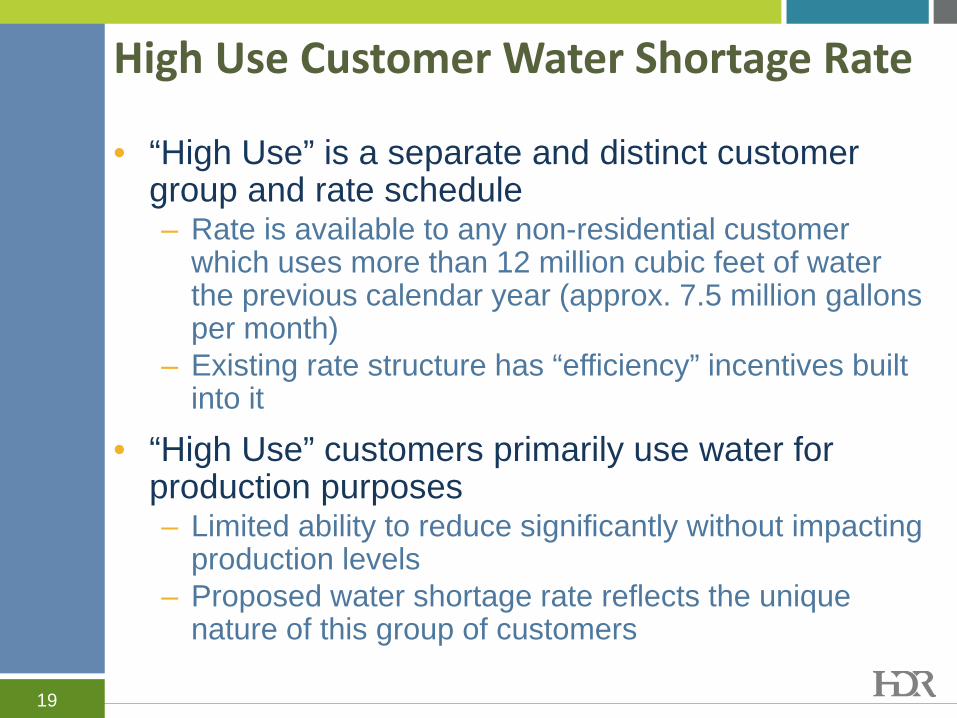
High Use Customer Water Shortage Rate
• “High Use” is a separate and distinct customer group and rate schedule – Rate is available to any non-residential customer
which uses more than 12 million cubic feet of water the previous calendar year (approx. 7.5 million gallons per month)
– Existing rate structure has “efficiency” incentives built into it
• “High Use” customers primarily use water for production purposes – Limited ability to reduce significantly without impacting
production levels – Proposed water shortage rate reflects the unique
nature of this group of customers
19

High Use Proposed Water Shortage Rate
Normal Moderate Severe CriticalWater Shortage Shortage Shortage Catastrophic
Conditions Phase 1 Phase 2 Phase 3 Water Shortage Demand Reduction Goal 0% Up to 10% 10% to 20% 20% to 30% 30% to 50%
Rate 1: Base or Below $1.276 $1.276 $1.289 $1.302 $1.340Rate 2: Usage 5%-15% above base $1.323 $1.323 $1.349 $1.376 $1.402Rate 3: Usage 15%-25% above base $1.365 $1.365 $1.420 $1.447 $1.474Rate 4: Usage 25% above base $1.407 $1.407 $1.491 $1.520 $1.548
High User Shortage Conditions - $/CCF
CatastrophicWater Shortage
Up to 10% 10% to 20% 20% to 30% 30% to 50%
Rate 1: Base or Below 0.0% 1.0% 2.0% 5.0%Rate 2: Usage 5%-15% above base 0.0% 2.0% 4.0% 6.0%Rate 3: Usage 15%-25% above base 0.0% 4.0% 6.0% 8.0%Rate 4: Usage 25% above base 0.0% 6.0% 8.0% 10.0%
Drought Conditions - % Change from Normal
.
20
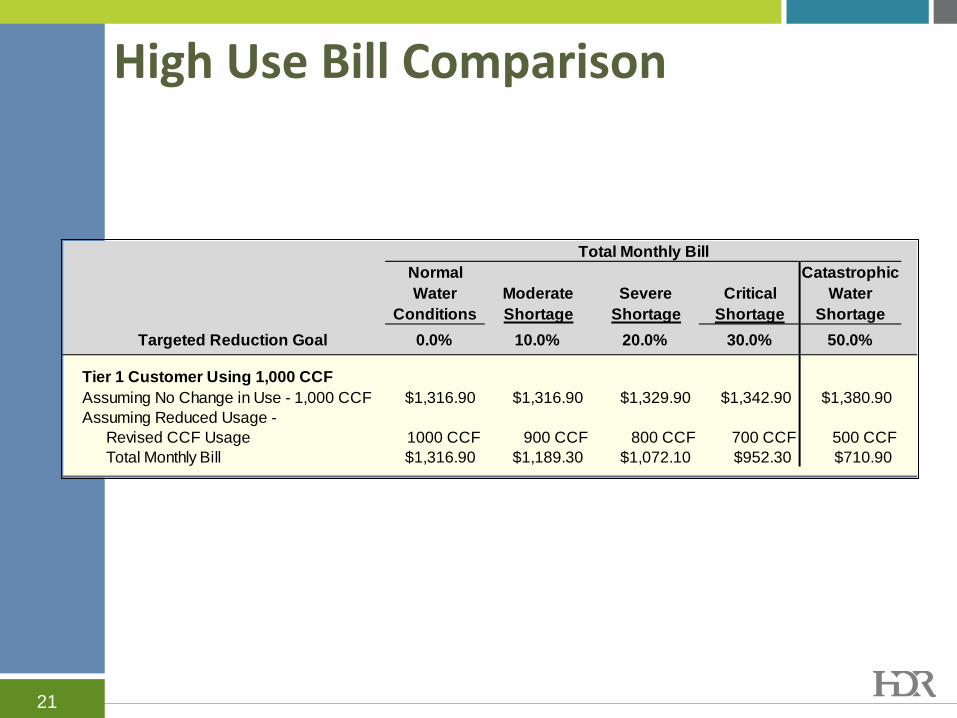
High Use Bill Comparison
Normal CatastrophicWater Moderate Severe Critical Water
Conditions Shortage Shortage Shortage ShortageTargeted Reduction Goal 0.0% 10.0% 20.0% 30.0% 50.0%
Tier 1 Customer Using 1,000 CCFAssuming No Change in Use - 1,000 CCF $1,316.90 $1,316.90 $1,329.90 $1,342.90 $1,380.90Assuming Reduced Usage -
Revised CCF Usage 1000 CCF 900 CCF 800 CCF 700 CCF 500 CCFTotal Monthly Bill $1,316.90 $1,189.30 $1,072.10 $952.30 $710.90
Total Monthly Bill
21
Summary
• Development of the water shortage rates is the culmination of many months of analysis and review – Adoption of water shortage rates is a
proactive/prudent management and policy decision – Designed to provide economic/price incentives for
efficient use during times of water shortage – Attempted to craft a proposal that is equitable to all
customers, recognizes each customer group’s unique characteristics and primarily targets the least efficient usage on the water system
22