city of london air quality strategy 2015 final · range of action in recent years to reduce levels...
TRANSCRIPT

City of London
Air Quality Strategy
2015 – 2020
June 2015

For further information contact:
Ruth Calderwood, Environmental Policy Officer
Dept of Markets and Consumer Protection
City of London Corporation
PO Box 270
Guildhall
London, EC2P 2EJ
Tel: 020 7332 1162
www.cityoflondon.gov.uk
This report will be available on the City of London web site http://www.cityoflondon.gov.uk/air

2
Foreword
The quality of air that we breathe in the Square Mile is at a level
that is considered to be harmful to health. This is despite a wide
range of action in recent years to reduce levels of pollution. It is
estimated that across London around 4,000 people each year
have their lives cut short by being exposed to London’s air. It is a
complex urban problem and air quality targets, particularly for
the pollutant nitrogen dioxide, are not being met.
This air quality strategy outlines steps that we will take at the
City of London Corporation between 2015 and 2020 to improve
air quality in the Square Mile. It builds on actions contained within the City of London
Air Quality Strategy 2011.
This document details how we will continue to fulfil our obligations for air quality
management and how we will monitor the effectiveness of policies and measures
that are introduced to reduce levels pollution. Since the original strategy was
published, the City Corporation has taken on new responsibilities for public health,
and the City Health and Wellbeing Board has taken an active interest in improving air
quality. One of its key priorities is ensuring that City air is healthier to breathe. This
strategy outlines how, in addition to implementing policies to improve local air quality,
we will also take steps to reduce the impact of current levels of air pollution on public
health.
Being at the heart of London we do suffer from some of the worst air quality in the
country, which is why much of this document outlines how we will work with
neighbouring authorities and the Greater London Authority to make our air healthier
to breathe. This strategy also details how we will reduce emissions from transport,
ensure that new developments are clean and how we will continue to reduce
emissions from our own activities.
Many residents and businesses share our concerns about air pollution. They are
taking steps themselves to help to improve air quality, and to reduce their own
exposure to pollution, through our Citizen Science and CityAir business engagement
programmes.
We have a proud history of taking action to improve air quality at the City of London.
In 1954 we were the first local authority to introduce a smokeless zone and in 1971
the first to obtain powers to stop the burning of sulphurous fuel. Improving air quality
remains a very important issue for us and I hope that we can work together to
achieve better air quality for residents, workers and visitors in the Square Mile.
Wendy Mead CC, Chairman of Port Health and Environmental Services
Committee

3
Contents
1. Introduction .......................................................................................................... 4
1.1 List of policies and actions ............................................................................ 5
2. Background ....................................................................................................... 12
2.1 Legal position .............................................................................................. 12
2.2 Source of pollution ...................................................................................... 13
2.3 Health impacts of air pollution ..................................................................... 13
3. What is the air quality like in the City? ............................................................... 15
3.1 Nitrogen dioxide .......................................................................................... 15
3.2 Small particles (PM10) ................................................................................. 17
3.3 Fine particles PM2.5 ....................................................................................... 19
4. What is being done to improve air quality in the Square Mile? .......................... 21
4.1 Political influence and commitment ............................................................... 21
4.2 Working with the Mayor of London ................................................................ 24
4.3 Working with other external organisations .................................................... 28
4.4 Reducing emissions from transport ............................................................... 31
4.5 Reducing emissions from new developments ............................................... 38
4.6 Leading by example ...................................................................................... 42
4.7 Recognising and rewarding good practice .................................................... 43
4.8 Raising awareness ........................................................................................ 45
5. Air Quality and Public Health ............................................................................. 48
Appendix 1: Further detail on the delivery of actions ................................................ 51
Appendix 2: Sources of Air Pollution ........................................................................ 64
Appendix 3: Citizen Science Air Quality Monitoring Results ..................................... 68

4
1. Introduction
In March 2011, the City of London Corporation (City Corporation) published its Air
Quality Strategy1 outlining action that would be taken to improve local air quality until
2015. This Strategy supplements the 2011 Strategy, detailing further measures that
will be taken by the City Corporation from 2015 up to 2020.
The 2011 Air Quality Strategy focused on measures to reduce levels of air pollution
and help the UK government and Mayor of London meet air quality limit values,
which is a statutory requirement. However, since 2011, the City Corporation has
taken on new responsibilities for public health and has placed air quality at the heart
of improving the health and wellbeing of residents and workers. So in addition to
measures to improve local air quality, this strategy also focuses on increasing public
awareness and helping people to reduce their exposure to air pollution, thereby
improving public health. It also provides an overview of some of the measures that
have already been, and will continue to be implemented to improve air quality and
raise public awareness in the Square Mile.
The aims of this strategy are:
To build upon actions already taken and continue to reduce the impact of poor
air quality on the health of City residents, workers and visitors, particularly
those that are most vulnerable
To ensure that the City of London’s key policies reflect the aims of improving
air quality and reducing exposure to air pollution in the Square Mile
To fulfil statutory obligations for Local Air Quality Management and public
health, and assist the UK Government and Mayor of London in meeting air
quality Limit Values as soon as possible
To encourage and implement cost effective measures to reduce emissions of
air pollutants in the Square Mile
To build public awareness and understanding of air quality through the
provision of accurate and timely information
To recognise, reward and disseminate good practice and support air quality
research and development
To work in partnership with other organisations, to take a lead and help to
shape national and regional air quality policy
1 City of London Air Quality Strategy 2011 – 2015 available at www.cityoflondon.gov.uk/air

5
1.1 List of policies and actions
Key policies and actions that the City Corporation intends to progress are detailed
below. Further information on each policy is included in the body of the document.
Additional details on specific measures, timelines and anticipated outcomes are
listed in Appendix 1. An annual progress report will be placed on the City
Corporation website detailing progress with actions.
Policy 1: Air quality monitoring
The City Corporation will monitor air pollutants to assess compliance with air
quality objectives, to evaluate the effectiveness of policies and to provide
alerts when pollution levels are high.
Actions:
1. An annual report of air quality data will be published and placed on the City
Corporation web site.
2. Current data from air quality monitors will be made available to the public on the
London Air Quality Network web site.
3. Air quality data will be used to generate pollution alerts and messages via the
CityAir Smart Phone App and the CityAir App web site.
4. A background PM2.5 monitor will be installed during 2015 to further assist in
assessing the impact of fine particles on public health.
5. The air quality monitoring requirements of the City will be reviewed annually.
Policy 2: Political influence and commitment
The City Corporation will seek opportunities to influence air quality policy
across London to secure lower levels of air pollution in the Square Mile.
Actions:
6. The City Corporation will explore further options for joint action with politicians in
neighbouring authorities.
7. The City Corporation will continue to place air quality as an important political
priority and support local and London-wide action through its Supporting London
Group, Port Health and Environmental Service Committee and Health and Wellbeing
Board.

6
8. The City Corporation will consider options for using local legislation to help
improve local air quality.
9. The City Corporation will make resources available through Community
Infrastructure Levy, Section 106 and Local Implementation Plan funding to improve
local air quality.
10. The City Corporation will ensure that all relevant Corporate strategies and
polices will reflect the importance of improving local air quality and reducing
exposure.
Policy 3: Working with the Mayor of London
The City Corporation will work with the Mayor of London on air quality policy
and action in order to improve air quality in both the Square Mile and across
London.
Actions:
11. The City Corporation will continue to liaise with Greater London Authority and
Transport for London over additional action to reduce emissions from buses and
taxis.
12. The City Corporation will consider options for supporting the adoption of zero
emission capable taxis across London.
13. The City Corporation will apply for further funding from the Mayor’s Air Quality
Fund as the opportunity arises.
14. The City Corporation will support the GLA with the introduction of the Ultra Low
Emission Zone.
15. The City Corporation will define local air quality focus areas, to complement the
GLA air quality focus areas, and develop specific plans to improve air quality and
reduce exposure in these areas.
16. Once the implications on air quality of the Mayor of London’s key proposals are
known, the City Corporation will model air quality to 2020 to establish what additional
action is required to meet the air quality limit values across the Square Mile.
17. The City Corporation will work with the Greater London Authority on a review of
Local Air Quality Management (the local government air quality regulatory
framework) for London.
18. The City Corporation will aim to become a Mayor of London designated Clean Air
Borough as soon as possible.

7
Policy 4: Working with other external organisations
The City Corporation will work with a range of external organisations to
encourage action to reduce emissions across the Square Mile and raise
awareness of air quality and its potential impact on health.
Actions:
19. The City Corporation will continue to engage with businesses in the Square Mile
under the CityAir programme. This will commence with businesses in the Barbican
area with the support of local residents involved in the Citizen Science air quality
monitoring programme.
20. The City Corporation will work with businesses in the Cheapside Business
Improvement District to raise the profile of air quality and obtain support for action to
reduce emissions associated with their activities.
21. The City Corporation will work with major City businesses to consider options for
phasing out standby generators that run solely on diesel.
22. The City Corporation will work with Change London on their AirSensa project as
a way of raising public awareness.
23. The City Corporation will continue to provide the Chair for the London Air Quality
Steering Group and work with neighbouring boroughs as part of the Central London
Air Quality Cluster Group.
24. The City Corporation will look for opportunities to support research into solutions
for improving air quality and reducing exposure.
25. The City Corporation will further develop work with Bart’s Health NHS Trust to
reduce the impact of the trust on local air quality and raise awareness among
vulnerable patients.
8
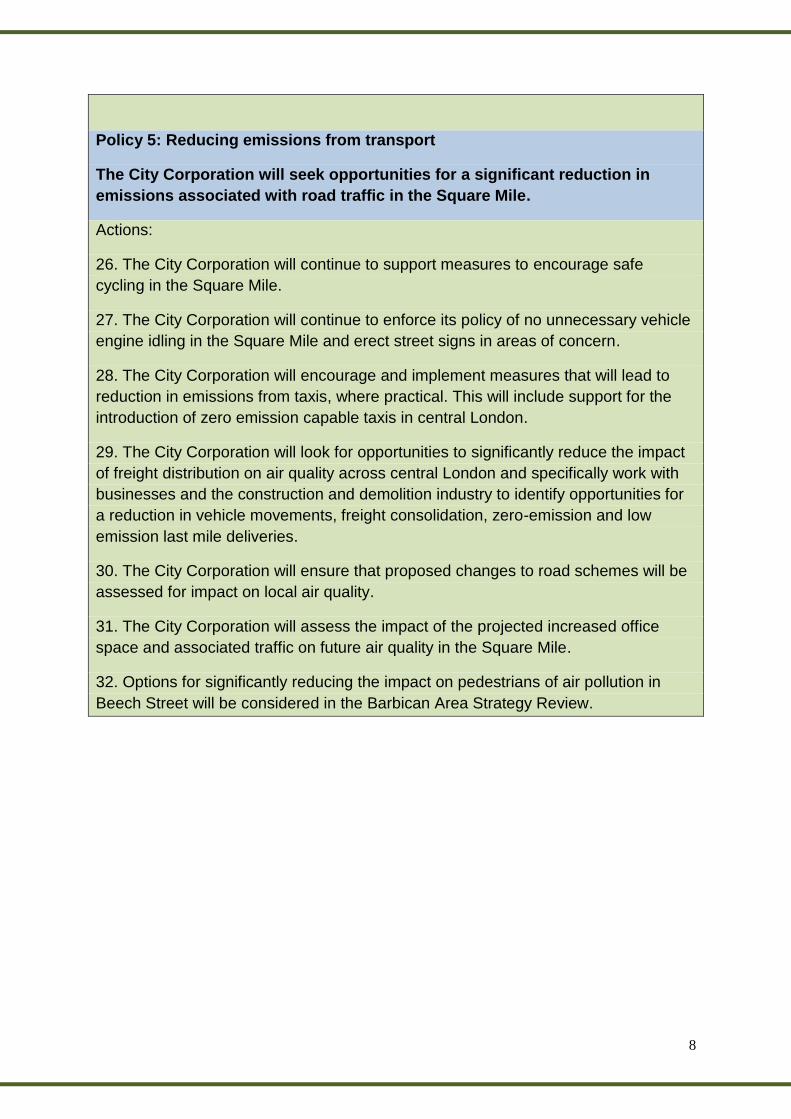
Policy 5: Reducing emissions from transport
The City Corporation will seek opportunities for a significant reduction in
emissions associated with road traffic in the Square Mile.
Actions:
26. The City Corporation will continue to support measures to encourage safe
cycling in the Square Mile.
27. The City Corporation will continue to enforce its policy of no unnecessary vehicle
engine idling in the Square Mile and erect street signs in areas of concern.
28. The City Corporation will encourage and implement measures that will lead to
reduction in emissions from taxis, where practical. This will include support for the
introduction of zero emission capable taxis in central London.
29. The City Corporation will look for opportunities to significantly reduce the impact
of freight distribution on air quality across central London and specifically work with
businesses and the construction and demolition industry to identify opportunities for
a reduction in vehicle movements, freight consolidation, zero-emission and low
emission last mile deliveries.
30. The City Corporation will ensure that proposed changes to road schemes will be
assessed for impact on local air quality.
31. The City Corporation will assess the impact of the projected increased office
space and associated traffic on future air quality in the Square Mile.
32. Options for significantly reducing the impact on pedestrians of air pollution in
Beech Street will be considered in the Barbican Area Strategy Review.

9
Policy 6: Reducing emissions from new developments
The City Corporation will ensure that new developments have a minimal
impact on local air quality both during the development phase and when
occupied.
Actions:
33. Through the City of London Local Plan, developments that would result in
deterioration of the City’s nitrogen dioxide or PM10 levels will be resisted.
34. The City Corporation will require an air quality assessment for developments
adjacent to sensitive premises such as residential properties, Doctors’ surgeries,
schools and St. Bartholomew’s Hospital.
35. The City Corporation will discourage the use of biomass and biofuels as a form
of energy in new developments.
36. All gas boilers in commercial developments are required to have a NOx rating of
<40mgNOx/kWh.
37. NOx emissions from combined heat and power (CHP) plant will be required to
meet the emission limits in the GLA document ‘Biomass and CHP emission
standards’ March 2013.
38. All new developments with > 1000m2 floor space or >10 residential units will
need to demonstrate that they are air quality neutral in line with the requirements of
London Plan Policy 7.14. If the development is not air quality neutral, off-setting will
be required. Guidance will be produced outlining suitable options for offsetting in the
Square Mile.
39. The City Corporation will ensure that all boilers, generators and CHP plant are
installed to ensure minimal impact on local air quality.
40. The City Corporation will develop a policy on the use of standby generators for
generating energy other than when electricity supplies are interrupted.
41. The City Corporation will work with the construction and demolition industry to
identify further opportunities of reducing emissions associated with building
development.
42. The City Corporation will update its best practice guide on minimising emissions
from construction and demolition regularly in order to reflect best practice. All
companies employed in demolition, construction and street works that work in the
Square Mile will be required to adhere to it.
10
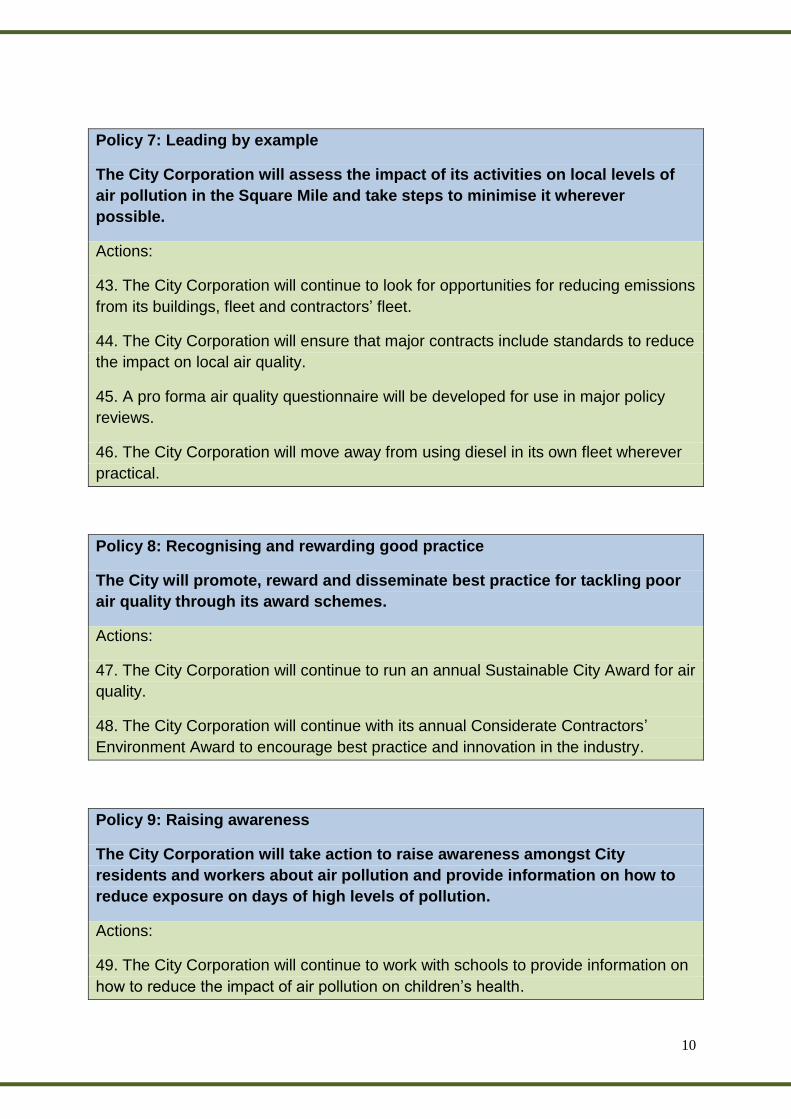
Policy 7: Leading by example
The City Corporation will assess the impact of its activities on local levels of
air pollution in the Square Mile and take steps to minimise it wherever
possible.
Actions:
43. The City Corporation will continue to look for opportunities for reducing emissions
from its buildings, fleet and contractors’ fleet.
44. The City Corporation will ensure that major contracts include standards to reduce
the impact on local air quality.
45. A pro forma air quality questionnaire will be developed for use in major policy
reviews.
46. The City Corporation will move away from using diesel in its own fleet wherever
practical.
Policy 8: Recognising and rewarding good practice
The City will promote, reward and disseminate best practice for tackling poor
air quality through its award schemes.
Actions:
47. The City Corporation will continue to run an annual Sustainable City Award for air
quality.
48. The City Corporation will continue with its annual Considerate Contractors’
Environment Award to encourage best practice and innovation in the industry.
Policy 9: Raising awareness
The City Corporation will take action to raise awareness amongst City
residents and workers about air pollution and provide information on how to
reduce exposure on days of high levels of pollution.
Actions:
49. The City Corporation will continue to work with schools to provide information on
how to reduce the impact of air pollution on children’s health.

11
50. The City Corporation will source funding for further greening at Sir John Cass
primary school.
51. The City Corporation will continue to work with residents in the Square Mile to
raise awareness of air quality.
52. The City Corporation will develop a general communications strategy to inform
people of action they can take to reduce exposure to air pollution.
53. The City Corporation will continue to support City businesses at events to raise
the profile of air quality and provide information for reducing exposure.
54. The City Corporation will continue to promote and develop the CityAir Smart
Phone App with and CityAirApp.com web site.
Policy 10: Air quality and public health
Improving air quality and reducing public exposure will remain a key public
health priority for the City Corporation until concentrations are at a level not
considered to be harmful to health.
Actions:
55. The City of London will install a PM2.5 monitor at Sir John Cass School during
2015 and assess the data for its impact on health.
56. The City Corporation will identify exposure hotspots with high footfall and high
concentrations.
57. The City of London will ensure that measures implemented to reduce emissions
of NO2 and PM10 will also lead to a reduction in emissions of PM2.5.
58. The City of London will continue to explore ways to reduce exposure of the
population to air pollution.
59. The City will look at ways to extend the message about poor air quality on days
of high pollution.
60. As City Corporation Area Strategies are reviewed they will be assessed for public
exposure to air pollution and measures taken to reduce exposure where practical.

12
2. Background
Despite the implementation of a wide range of action by the City Corporation, and
the Greater London Authority (GLA), to improve air quality, the health based limits for
nitrogen dioxide are not being met in the Square Mile. The limit for fine particles
(PM10) is generally met in the City, except along Upper and Lower Thames Street.
This road carries a lot of though traffic and is a street canyon so pollution can get
trapped at street level and is not rapidly dispersed. Section 3 of this document
presents data from air quality monitoring stations in the Square Mile from 1999 to
2014 and demonstrates how the data compares to the health based limits. The City
of London was declared an Air Quality Management Area (AQMA) in January 2001
for nitrogen dioxide and small particles (PM10) and remains an AQMA for these two
pollutants today.
2.1 Legal position
The European Union sets what it calls ‘limit values’ for a range of pollutants that are
considered to be harmful to health and the environment. The European Commission
can take action against any Member State if the air quality does not meet the limit
values throughout its territory by a specified date. The UK government is responsible
for meeting the European Union limit values across the UK, with the Mayor of
London being responsible for meeting them in London. The City Corporation has a
statutory obligation to support this through local action.
The annual average limit value for nitrogen dioxide is 40g/m3. It is not being met
across London. It is also not being met in a number of other large cities across the
UK. As a result, in February 2014, the European Commission launched legal
proceedings against the UK for its failure to meet this limit value, and submit a
credible plan outlining how the limit value would be met by the extended date of 1
January 20152. There is also an hourly-average limit value for nitrogen dioxide. This
hourly average value is not being met in central London adjacent to busy roads,
including some roads in the City of London.
The annual average limit value for PM10 has been set at 40g/m3. This is largely met
everywhere across the United Kingdom. However, small particles have health
impacts even at very low concentrations and a threshold has not been identified
below which no damage to health is observed. Consequently, the World Health
Organisation has set a guideline level for annual average PM10 of 20 μg/m3.
2 http://europa.eu/rapid/press-release_IP-14-154_en.htm

13
Similarly, the European Union has set the annual average limit value for PM2.5 at
25g/m3, but the World Health Organisation has set a guideline level of 10g/m3.
2.2 Source of pollution
The quality of the air in the Square Mile is affected by a number of factors. Being at
the heart of London, it is heavily influenced by emissions generated across Greater
London and further afield. Up to 80% of the particulate pollution measured away
from busy roads has come from outside of the City. This highlights the importance of
London-wide action to support the local action being taken by the City Corporation.
Under certain weather conditions small particles can be brought to London from the
European continent, and even from as far afield as Africa. This occurred in April
2014 during what was referred to as the ‘Saharan dust’ pollution episode, when very
high levels of tiny particles affected the whole of London and the south-east. A
similar pollution incident occurred in March 2015.
Looking at sources generated within the City itself, the main contributor to local air
pollution is road traffic. Diesel vehicles, in particular taxis, buses and vans contribute
the largest proportion. Offices make up over 70% of all buildings in the Square Mile
and many of the vehicles in the City are servicing business needs. Pollution from
heating buildings and from demolition and construction sites also impacts on local air
quality. Further detail on sources of air pollution can be found in Appendix 2.
2.3 Health impacts of air pollution
Exposure to air pollution has a range of impacts on health. Short term exposure
mainly affects people who are already classed as ‘vulnerable’. It can exacerbate
asthma, affect lung function and lead to an increase in hospital admissions for
people with respiratory and cardio-vascular conditions. Long-term exposure on the
other hand affects the whole population, particularly the long-term exposure to fine
particles, PM10 and PM2.5.
Exposure to PM2.5 is considered to be a significant cause of disease in London.
Public Health England (PHE) published a report in 2014 ‘Estimating Local Mortality
Burdens Associated with Particulate Air Pollution’. The report states that:
‘current levels of particulate air pollution have a significant impact on health.
Measures to reduce levels of particulate air pollution, or reduce exposure of
the population to such pollution, are regarded as an important public health
initiative. ‘
In addition to the above, the World Health Organisation has classified diesel exhaust
specifically as a Group 1 carcinogen.
14
There has been a great deal of research into the health impacts of air pollution. An
independent investigation, commissioned by the Greater London Authority, into the
mortality impacts of particulate air pollution, suggests that over 4,000 people in
London have their lives cut short each year due to poor air quality3. The City
Corporation published a report in 2014 summarising the most recent research
papers on the health impacts of different pollutants. The report is available on the
City Corporation web site4.
Since April 2013, the City Corporation, like other local authorities across the UK, has
had a responsibility for improving public health. This was introduced by the Health
and Social Care Act 2012. The City Corporation has recognised that reducing the
impact of poor air quality on the health of residents, workers and visitors is important
and as a consequence has placed this as a high priority in its public health work
plan. Section 5 of this strategy details how the City Corporation is taking this forward.
3 Dr Brian G Miller Institute of Occupational Medicine. Report on estimation of mortality impacts of particulate
air pollution. Consulting report P951-001. June 2010 4 www.cityoflondon.gov.uk/air

15
3. What is the air quality like in the City?
The City Corporation has been monitoring air quality for a number of years at a
range of roadside and background locations across the Square Mile. The focus is on
nitrogen dioxide, PM10 and PM2.5 as these are the pollutants of concern.
Monitoring is an important part of air quality management and fulfils the following
roles:
To check compliance against air quality objectives and limit values
To assess long term trends and the effectiveness of policies to improve air
quality and public health
To raise awareness and provide alerts to the public when pollution levels are
high.
Figure 3.1 shows the location of monitoring stations and pollutants monitored.
3.1 Nitrogen dioxide
3.1.1 Monitoring data
Data from City monitoring stations reveals that background concentrations of
nitrogen dioxide (Senator House and Sir John Cass School) have reduced very
slightly since the 2011 strategy was published. However, roadside concentrations
(Upper Thames Street and Beech Street) have remained high. This is likely to be

16
due to the failure of vehicle Euro Standards to meet the required reduction in
emissions of oxides of nitrogen (NOx) in diesel vehicles. There has also been an
increase in the use of use of diesel in the overall fleet partly due to national policy to
encourage lower carbon fuels. The annual variation in concentrations is also
influenced by the weather.
Figure 3.2: Annual Average Nitrogen Dioxide 1999 to 2014
3.1.2 Modelled concentrations
Air quality monitoring only provides data for specific locations so the data is
supplemented by computer modelling. Modelling is also used to predict what air
quality may be like in the future.
Figure 3.3 shows modelled concentrations across the City for 2015 using data from
the 2008 London Atmospheric Emissions Inventory. This is administered by the
Greater London Authority. The limit value for annual average nitrogen dioxide is
40g/m3 and the computer model predicts that this is not being met anywhere.
Concentrations of nitrogen dioxide adjacent to busy roads and junctions can be three
times that experienced in the City away from such roads.

17
Figure 3.3: Modelled concentrations of annual average nitrogen dioxide, 2015
3.2 Small particles (PM10)
3.2.1 Monitoring data
Annual average concentrations of PM10 tend to meet the 40 g/m3 objective
everywhere. However the City Corporation monitoring station on Upper Thames
Street recorded a breach in 2013 due to a number of ‘pollution incidents’ caused by
air from outside the capital adding to locally generated pollution. In 2013 there were
eight ‘pollution incidents’ of high PM10 totalling 31 days. These had an impact on
both the 24-hour average objective, and the annual average, as can be seen in
figures 3.4 and 3.5.
Figure 3.4 Annual Average PM10 Concentrations 2006 to 2014

18
Figure 3.5: Number of days the 24-hour limit was breached 2006 to 2014
3.2.1 Modelled concentrations
There is less variation in modelled concentrations of small particles across the City
as there are a number of different sources that contribute to the problem, not just
road traffic.
Figure 3.6 shows the modelled number of days that the PM10 daily average level is
likely to be exceeded in 2015. The limit is set at 35 days and the map reveals that
this could be breached in just a small area along Victoria Embankment.
Figure 3.6: Modelled concentrations of daily average PM10 exceedences, 2015

19
3.3 Fine particles PM2.5
3.3.1 Monitored data
PM2.5 is measured in Farringdon Street. Table 1 shows the annual average PM2.5 in
this area for 2011 - 2014.
Annual Mean Concentration of PM2.5 (µg/m3)
2011 2012 2013 2014
29 30 27 26 Table 1: Annual Average PM2.5
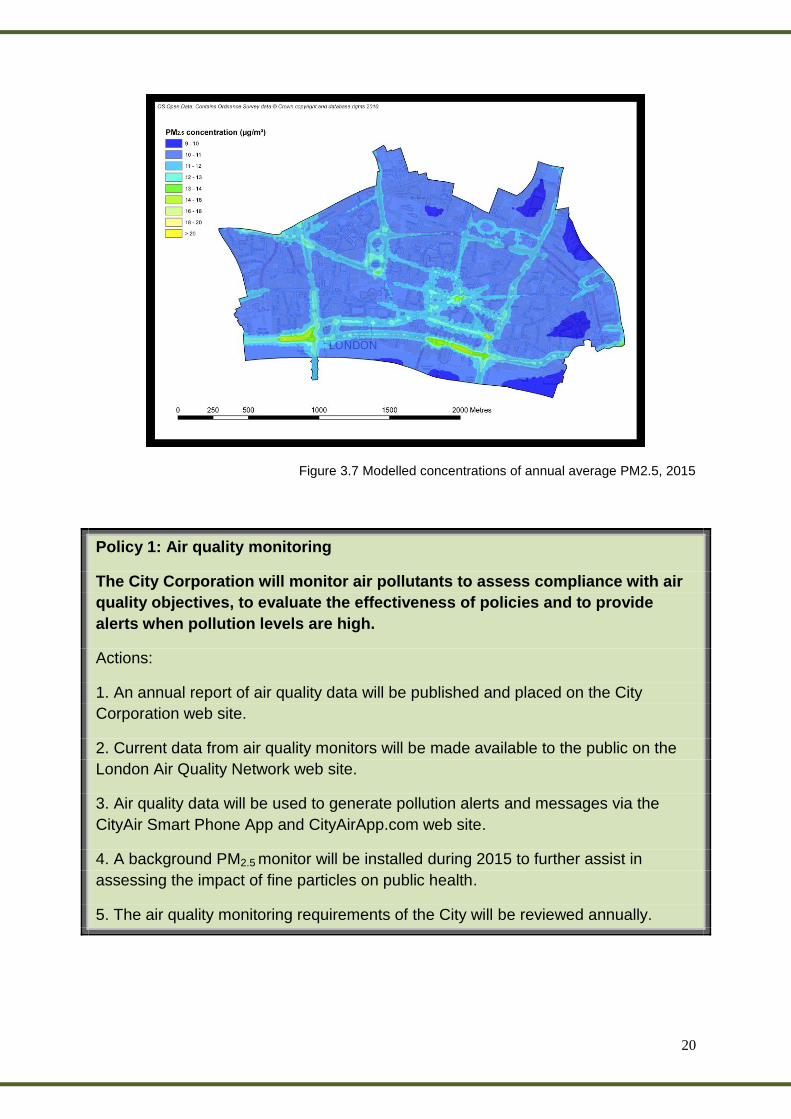
3.3.2 Modelled concentrations
Modelled concentrations of annual average PM2.5 reveal that levels across the City in
2015 should be below the annual average limit value of 25µg/m3 with the possible
exception of the City’s busiest road Victoria Embankment / Upper and Lower
Thames Street, see figure 3.7. However, the monitored data suggests that
concentrations may be higher than the computer modelling data so the City
Corporation will be installing an additional PM2.5 analyser during 2015 to check
concentrations in an alternative location in the City. The analyser will be installed in
the playground of Sir John Cass Primary school as children are particularly
susceptible to the effects of poor air quality and the site offers a good background
location with an existing PM10 monitor.
20
Figure 3.7 Modelled concentrations of annual average PM2.5, 2015
Policy 1: Air quality monitoring
The City Corporation will monitor air pollutants to assess compliance with air
quality objectives, to evaluate the effectiveness of policies and to provide
alerts when pollution levels are high.
Actions:
1. An annual report of air quality data will be published and placed on the City
Corporation web site.
2. Current data from air quality monitors will be made available to the public on the
London Air Quality Network web site.
3. Air quality data will be used to generate pollution alerts and messages via the
CityAir Smart Phone App and CityAirApp.com web site.
4. A background PM2.5 monitor will be installed during 2015 to further assist in
assessing the impact of fine particles on public health.
5. The air quality monitoring requirements of the City will be reviewed annually.
21
4. What is being done to improve air quality in the Square Mile?
The City Corporation has been taking a wide range of action to both improve local air quality and to help people to reduce their exposure to pollution. This section highlights some of the action that has been, and continues to be taken, as well as outlining further measures that will be implemented up to 2020.
4.1 Political influence and commitment
4.1.1 Corporate Plan Improving local air quality is an important political priority and is contained in the City's Corporate Plan as a Key Policy Priority KPP3: Engaging with London and national government on key issues of concern to our communities (which includes air quality). This aim is being managed at a strategic level at three forums:
A. Supporting London Group This Senior and Chief Officer Committee, chaired by the Town Clerk, has received presentations and reports concerning the need for the City Corporation to lead on improving air quality in the capital. It has endorsed reports containing actions that have subsequently been approved by elected Members and receives regular updates on progress. B. Port Health and Environmental Services Committee This Committee, which comprises elected representatives from all wards in the City, oversees the work of the Port Health and Public Protection Service. This includes the Environmental Health function, and consequently air quality. The Committee approved the original Air Quality Strategy in 2011, and its Members, particularly the Chairman and Deputy Chairman, have a keen interest in the issue. C. Health and Wellbeing Board Public Health responsibilities were returned to local authorities in April 2013 and this led to the creation of Health and Wellbeing Boards (HWB). The Board recognises that air quality in the City is important to residents and workers, so has included this as its third most important priority in the Action Plan approved in September 2014.
4.1.2 Corporate Strategies and Policies The City Corporation has many policies and strategies outlining how key functions are to be delivered. Measures to improve air quality and reduce exposure are incorporated where appropriate. Examples of key policy areas that include air quality policy are: the Core Strategy; Local Implementation Plan; City Tree Strategy; Open Spaces Strategy; Health and Wellbeing Strategy and a number of Environmental

22
Enhancement Strategies. All current strategies are available on the City of London web site. 4.1.3 Other action The City Corporation has been taking action to try and influence air quality policy across London: In March 2012 the City Corporation hosted a breakfast meeting for City of London, London Borough of Camden and City of Westminster officers and politicians to advance closer working between the authorities and develop an improved dialogue with the Greater London Authority and Transport for London.
In June 2012, the Leaders of the City Corporation, Westminster City Council
and London Borough of Camden sent as joint letter to the Mayor of London to ask him to take additional action to reduce emissions from buses and taxis.
In April 2013, the then Chairman of Port Health and Environmental Services wrote to the Mayor of London to confirm the City Corporation’s commitment to taking action to improve air quality by signing up to the Mayor of London ‘Cleaner Air Borough’ criteria.
In June 2014 the City of London Remembrancer’s Department submitted a written response to the House of Commons Environmental Audit Committee inquiry into air quality.
In July 2014, the Lord Mayor hosted an air quality reception at Mansion House with the Mayor of London and London Councils. The event highlighted the need for coordinated action from all levels of government to improve air quality across London.
The current Mayor of London, Boris Johnson, the previous Lord Mayor, Alderman Fiona
Woolf and the current Chairman of London Councils Transport and Environment Committee Julian Bell at the Air Quality Reception at Mansion House.

23
In November 2014, the City Corporation hosted an air quality breakfast seminar for London borough politicians to determine whether there is common ground between London boroughs and the City Corporation on some areas of air quality policy.
In June 2015 the City Corporation, together with Westminster City Council, wrote to the Secretary of State for the Environment Food and Rural Affairs urging focused action and support for robust air quality plans to meet air quality limit values across London as soon as possible.
Policy 2: Political influence and commitment The City Corporation will seek opportunities to influence air quality policy across London to secure lower levels of air pollution in the Square Mile. Actions: 6. The City Corporation will explore further options for joint action with politicians in neighbouring authorities. 7. The City Corporation will continue to place air quality as an important political priority and support local and London-wide action through its Supporting London Group, Port Health and Environmental Service Committee and Health and Wellbeing Board. 8. The City Corporation will consider options for using local legislation to help improve local air quality. 9. The City Corporation will make resources available through CIL, S106 and LIP funding to improve local air quality. 10. The City Corporation will ensure that all relevant Corporate strategies and polices will reflect the importance of improving local air quality and reducing exposure.

24
4.2 Working with the Mayor of London
4.2.1 Mayor’s Air Quality Strategy
As part of his legal obligation to meet air quality Limit Values
across London, the Mayor of London published an Air
Quality Strategy in 2010 ‘Clearing the Air’ and has taken a
wide range of action to reduce levels of air pollution across
the Capital.
A great deal of action has been focussed on road traffic such
as the London-wide Low Emission Zone, a 15 year age limit
for black taxi cabs, a 10 year age limit for Private Hire
Vehicles and the roll out of a cleaner bus fleet. Non-traffic
measures include the requirement for new developments to
be ‘air quality neutral’ as detailed in the London Plan, emission standards for boiler
systems and construction plant and the improving the energy efficiency of London
homes.
4.2.2 Transport Emissions Roadmap
The Mayor published a Transport Emissions Roadmap in September 20145. The
document outlines all the measures being taken by the Mayor to reduce emissions
from transport across London. It also lists ten areas that will be considered to help
London achieve compliance with the EU limit values for nitrogen dioxide by 2020 and
2025. The document highlights that the measures will need to be developed to
understand their feasibility, impact and funding requirements:
1. Ultra Low Emission Zone (ULEZ)
2. The future of the (London) Low Emission Zone
3. Making traffic management and regulation smarter
4. Helping Londoners tackle air pollution
5. Driving the uptake of low emission vehicles
6. Cleaner electricity for London’s transport
7. Transforming London’s fleet
8. Delivering a zero emission taxi and Private Hire Vehicle fleet
9. Transforming London’s public and commercial fleets
10. Low emission neighbourhoods
5 www.tfl.gov.uk/cdn/static/cms/documents/transport-emissions-roadmap.pdf

25
11. 4.2.2.1 Ultra Low Emission Zone
An Ultra-Low Emission Zone will be introduced in central London in September
2020. Vehicles travelling in the existing Congestion Charge Zone will be required to
meet new emission standards 24 hours a day, seven days a week, or pay a daily
charge. In addition, from January 2018, all new taxis and all private hire vehicles less
than eighteen months old presented for licensing in the capital for the first time will
need to be ‘zero emission capable’. The full ULEZ package is expected to halve
emissions of nitrogen oxides (NOx) and particulate matter (PM10) from vehicle
exhausts in central London. The City Corporation is within the zone and will consider
the impact of the scheme on air quality in the Square Mile.
4.2.3 The Mayor’s Vision for Cycling in London
The Mayor of London has proposed several measures for increasing the amount of
journeys made by bike in London in his vision for cycling in London6. The aim is to
have a network of high capacity joined up cycle routes. The North-South and East-
West cycle superhighways will run directly through the City. The highways will result
in a significant reduction in the amount of traffic on key City routes: Farringdon
Street, New Bridge Street to Blackfriars Junction and Tower Hill, Byward Street,
Lower and Upper and Thames Street to Victoria Embankment. Air quality is
monitored on these routes by the City Corporation which will enable a detailed
assessment to be made of the impact on local air quality.
4.2.4 Air Quality Focus Areas
The Mayor of London has identified 187 ‘Air Quality Focus Areas’ across London. These are areas where the Greater London Authority and Transport for London will focus action to improve air quality. In the Square Mile, the TfL Air Quality Focus Areas are on TfL roads: Farringdon Road to New Bridge Street at Blackfriars and from Monument, Gracechurch Street and Bishopsgate to Houndsditch.
The criteria used by TfL to determine air quality focus areas are available on the
Greater London Authority web site7.
6 The Mayors Vision for Cycling in London, an Olympic Legacy for all Londoners March 2013
7 https://www.london.gov.uk/sites/default/files/Cleaner%20Air%20for%20London%20-
%20AQ%20Focus%20Area%20methodology.pdf

26
4.2.5 Mayor’s Air Quality Fund In February 2013 the Mayor of London announced the new Mayor’s Air Quality Fund (MAQF). The fund has provided match-funding for London local authorities and partners for innovative schemes and projects designed to improve air quality. Six million pounds of funding was made available from 2013/14 to 2015/16, with a further £6 million, plus £2 million for Low Emission Neighbourhoods, for the following three years. The City Corporation was awarded £280,000 from the Mayor’s Air Quality Fund for air quality improvement work in the City for 2013/14 to 2015/16. A further £100,000, over the three years, was awarded as part of a joint project with Bart’s Health NHS Trust and the London Boroughs of Newham, Tower Hamlets and Waltham Forest. London local authorities are required to work towards achieving a set of criteria in order to be eligible for funding from the MAQF. Meeting these criteria will lead to London Boroughs being designated a ‘Clean Air Borough’ by the GLA.
4.2.5 Local Air Quality Management Review The framework for measuring air quality, and working towards air quality objectives in local government is known as Local Air Quality Management. The process is under review nationally and the review of a London specific scheme is being led by the Greater London Authority. The City of London is part of the review board.
Policy 3: Working with the Mayor of London The City Corporation will work with the Mayor of London on air quality policy and action in order to improve air quality in both the Square Mile and across London. Actions: 11. The City Corporation will continue to liaise with Greater London Authority and Transport for London over additional action to reduce emissions from buses and taxis. 12. The City Corporation will consider options for supporting the adoption of zero emission capable taxis across London. 13. The City Corporation will apply for further funding from the Mayor’s Air Quality Fund as the opportunity arises. 14. The City Corporation will support the GLA with the introduction of the Ultra Low Emission Zone.

27
15. The City Corporation will define local air quality focus areas, to complement the GLA air quality focus areas, and develop specific plans to improve air quality and reduce exposure in these areas. 16. Once the implications on air quality of the Mayor of London’s key proposals are known the City Corporation will model air quality to 2020 to establish what additional action is required to meet the air quality limit values across the Square Mile. 17. The City Corporation will work with the Greater London Authority on a review of Local Air Quality Management (the local government air quality regulatory framework) for London. 18. The City Corporation will aim to become a Mayor of London designated Clean Air Borough as soon as possible.
28
4.3 Working with other external organisations
In addition to working closely with the GLA, the City Corporation also works with a range of other organisations on actions and policy development to improve air quality.
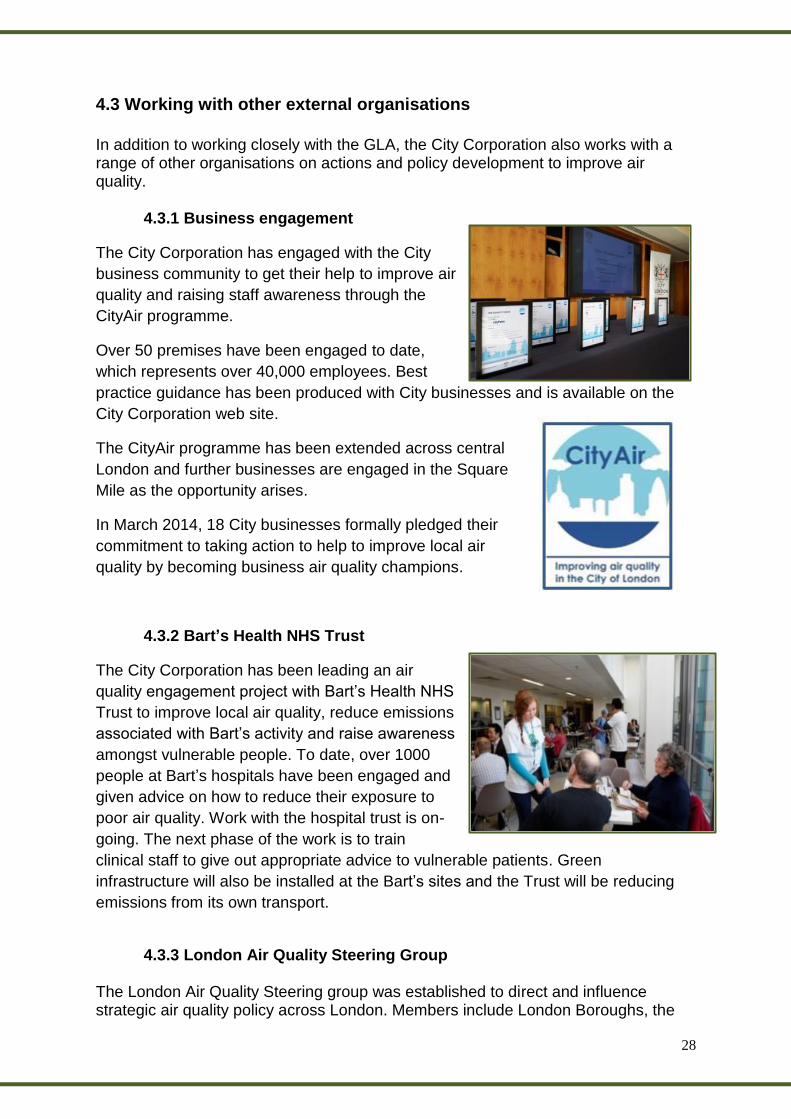
4.3.1 Business engagement
The City Corporation has engaged with the City
business community to get their help to improve air
quality and raising staff awareness through the
CityAir programme.
Over 50 premises have been engaged to date,
which represents over 40,000 employees. Best
practice guidance has been produced with City businesses and is available on the
City Corporation web site.
The CityAir programme has been extended across central
London and further businesses are engaged in the Square
Mile as the opportunity arises.
In March 2014, 18 City businesses formally pledged their
commitment to taking action to help to improve local air
quality by becoming business air quality champions.
4.3.2 Bart’s Health NHS Trust
The City Corporation has been leading an air
quality engagement project with Bart’s Health NHS
Trust to improve local air quality, reduce emissions
associated with Bart’s activity and raise awareness
amongst vulnerable people. To date, over 1000
people at Bart’s hospitals have been engaged and
given advice on how to reduce their exposure to
poor air quality. Work with the hospital trust is on-
going. The next phase of the work is to train
clinical staff to give out appropriate advice to vulnerable patients. Green
infrastructure will also be installed at the Bart’s sites and the Trust will be reducing
emissions from its own transport.
4.3.3 London Air Quality Steering Group
The London Air Quality Steering group was established to direct and influence strategic air quality policy across London. Members include London Boroughs, the
29
Environment Agency, Greater London Authority, Transport for London and London Councils. The City Corporation provides the Chairman for this group. The City Corporation also works with seven neighbouring authorities as part of the Central London Air Quality Cluster Group.
4.3.4 London Universities The City Corporation has worked with the Environment Research Group at King’s College London on a range of projects such as real world vehicle emission testing and the development of the CityAir Smart Phone App. King’s College London is also one of the partners for the Sustainable City Award for air quality. The City Corporation has worked with Imperial College London on research into the potential impact of a 20mph speed limit on air quality and is currently working with University College London on a Citizen Science air quality monitoring programme for residents.
4.3.5 Change London
The City Corporation is on the advisory board of Change London for their air quality
monitoring project http://www.airsensa.org/ which aims to create a UK-wide network
of urban air quality monitors, starting in Greater London, to monitor and visualise air
pollution at an individual street level. The City Corporation provides advice on
monitoring and engagement from a local government perspective.
Policy 4: Working with other external organisations The City Corporation will work with a range of external organisations to encourage action to reduce emissions across the Square Mile and raise awareness of air quality and its potential impact on health. Actions: 19. The City Corporation will continue to engage with businesses in the Square Mile under the CityAir programme. This will commence with businesses in the Barbican area with the support of local residents involved in the Citizen Science air quality monitoring programme. 20. The City Corporation will work with businesses in the Cheapside Business Improvement District to raise the profile of air quality and obtain support for action to reduce emissions associated with their activities. 21. The City Corporation will work with major City businesses to consider options for phasing out standby generators that run solely on diesel.
30
22. The City Corporation will work with Change London on their AirSensa project as a way of raising public awareness. 23. The City Corporation will continue to provide the Chair for the London Air Quality Steering Group and work with neighbouring boroughs as part of the Central London Air Quality Cluster Group. 24. The City Corporation will look for opportunities to support research into solutions for improving air quality and reducing exposure. 25. The City Corporation will further develop work with Bart’s Health NHS Trust to reduce the impact of the Trust on local air quality and raise awareness among vulnerable patients.

31
4.4 Reducing emissions from transport
The City of London Air Quality Strategy 2011 details that over 75% of local
emissions of PM10, and 67% of local emissions of NOx, comes from road vehicles.
There is a high level of pedestrian movement in the City. Many business journeys
are made on foot, and journeys to the City using other forms of transport completed
on foot.
Approximately 400,000 people commute to the Square Mile during the working
week, nearly 90% of these by public transport, with only 6% by private car. Car
ownership among City residents (38%) is the lowest of any local authority area in the
United Kingdom. There has been a significant increase in cycling as a mode of travel
in central London, including the City. The City
Corporation is implementing appropriate changes to
road layouts and public realm enhancement
schemes to create safe and efficient cycling routes
and greater space for pedestrians.
The road network is used intensively; particularly
during the working week as vehicles support the
needs of City businesses. The Square Mile is
located within the Congestion Charge Zone and
over 290,000 vehicles enter the zone every day.
There are now 23,000 licensed taxis in Greater
London with the majority of activity concentrated in
central London. The City is served by 54 bus routes.
The busiest roads in the Square Mile are managed and controlled by Transport for
London (TfL) which is one of the GLA group of organisations accountable to the
Mayor of London. These are:
o Mansell Street / Goodmans Yard / Minories
o Victoria Embankment / Blackfriars Underpass/ Upper Thames Street/
Lower Thames Street/ Byward Street/ Tower Hill
o Farringdon street/ Ludgate Circus/ New Bridge Street/ Blackfriars
Bridge
The mix of vehicles in the City is quite different to most other London Boroughs with
taxis and goods vehicles dominant. Due to the amount of development in the Square
Mile there are also a lot of construction vehicles. Nearly all of these vehicles are
diesel.
City Corporation transport policy is outlined in the Local Implementation Plan, which
was published in December 2011. It contains eight key transport objectives. Two are
relevant to improving air quality:
32
LIP 2011.1: To reduce the pollution of air, water and soils and excessive noise and
vibration caused by transport in the City.
LIP 2011.4: To reduce the adverse effects of transport in the City on health, particularly health impacts related to poor air quality and excessive noise and the contribution that travel choices can make to sedentary lifestyles.
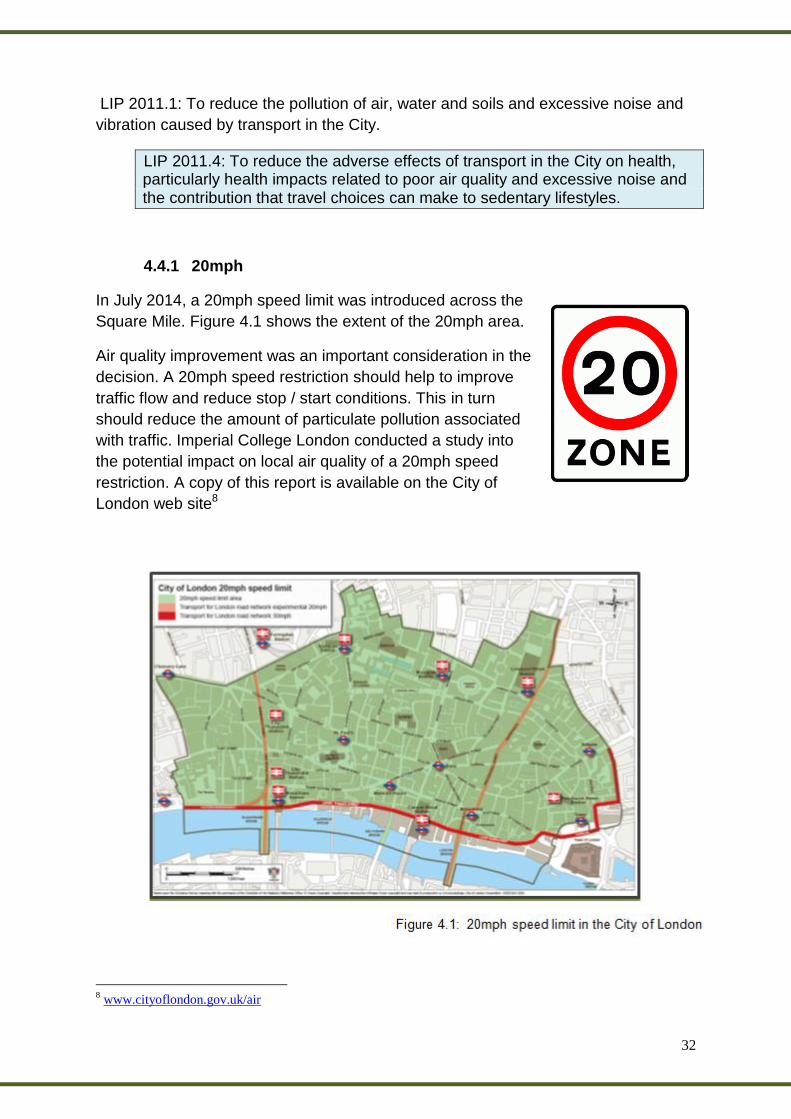
4.4.1 20mph
In July 2014, a 20mph speed limit was introduced across the
Square Mile. Figure 4.1 shows the extent of the 20mph area.
Air quality improvement was an important consideration in the
decision. A 20mph speed restriction should help to improve
traffic flow and reduce stop / start conditions. This in turn
should reduce the amount of particulate pollution associated
with traffic. Imperial College London conducted a study into
the potential impact on local air quality of a 20mph speed
restriction. A copy of this report is available on the City of
London web site8
8 www.cityoflondon.gov.uk/air

33
4.4.2 Cyclists
An estimated 10,000 people commute to the City by bike on a regular basis. The City
Corporation supports cycling and the aim is to for at least 10% of people who
commute to the City to travel by. Cycling is encouraged by the provision of:
Free public cycle parking in all off-street public car parks.
Free public cycle parking at on-street cycle parking racks throughout the
City.
Regular free cycle training and maintenance training
4.4.3 Pedestrians
Most people move around the City by foot. In the working week there is a great deal
of demand for pedestrian space. 400,000 people commute into the City daily and this
is expected to increase to 428,000 by 2026. This is due to the introduction of more
office space and also Crossrail, which is anticipated to bring more people into the
Square Mile. The City Corporation is introducing a number of schemes designed to
improve conditions for pedestrians.
The City has developed 16 Area Enhancement Strategies which are designed to
improve the streets and public spaces in the Square Mile. Environmental
improvements are also delivered around individual buildings through s106 planning
agreements, which include tree planting and urban greening.
In addition to this, greater provision for pedestrians is being made by improving
access routes and the streetscape around stations, with particular focus on Bank
and the Crossrail station entrances at Farringdon, Lindsey Street, Moorgate and
Liverpool Street.
4.4.4 Taxis
Hackney carriages (black taxi cabs) make up 25.8% of the traffic flow in the City of
London between 0700 and 1900 hours9. The 2011 Air Quality Strategy10 reveals that
they contribute around 50% of local vehicle related PM10 and 24% oxides of nitrogen
(NOx)11.
Transport for London is the regulatory authority for the appointment and regulation of
Taxi drivers. TfL is also responsible for the authorisation of all taxi ranks and taxi
9 2010 Traffic Composition Survey, JMP Consultants Ltd for the City of London
10 www.cityoflondon.gov.uk/air
11
The proportion of emissions from taxis should be lower than these figures suggest due to the Mayor of
London’s taxi age limit. However, updated data is not available at the time of writing this document

34
rest bays in London excluding the City of London, where it is the responsibility of the
Commissioner of Police for the City of London. There are 32 taxi ranks in the City of
London, providing 128 spaces.
In 2006, a taxi availability survey was conducted in the City of London. The study
revealed that approximately 34% of the taxis on the roads are available for hire
around the main railway stations. On other City roads the proportion is around 22%.
While taxis are running (plying for hire) they are wasting fuel, adding to local
congestion and increasing local levels of pollution.
The City Corporation, in line with the guidance issued by TfL, would like to reduce
the amount of time that taxis spend running by encouraging taxi drivers to make
better use of ranks and encourage the public to use ranks wherever possible. As a
consequence, the City Corporation is installing new and improved taxi ranks, in
consultation with the taxi trade, to help to reduce the amount of plying for hire by
taxis in the Square Mile. The ranks will be publicised locally and taxi drivers
encouraged to use them. If this is successful the City Corporation will consider
further measures to encourage taxi drivers and the public to use ranks.
In addition to installing new taxi ranks and
publicising their location, the City Corporation has appointed Living Streets to run a
project called Fare Mile aimed at encouraging workers in the City to walk short
journeys rather than use a taxi12 The project is a pilot and if it is deemed to be
successful it will be extended, subject to funding.
4.4.5 Freight
Freight vehicles i.e. those involved in the
delivery of goods and services, account for
around 20% of the traffic in the Square Mile.
Around 24% of PM10 and 33% of NOx
emissions associated with traffic is from the
movement of freight in the City. The City
12
http://www.faremile.org.uk/

35
Corporation is developing a sustainable City Freight Strategy which will complement
and sit within the context of the Transport for London forthcoming London wide
Freight Plan. The City Freight Strategy will include opportunities for reducing
emissions associated with delivering goods.
4.4.6 Road schemes
Changes are currently being made to Aldgate Gyratory, which includes the
installation of a public space. The road design with the most positive benefit on
improving air quality at Sir John Cass Primary School is being implemented. Bank
junction is also being redesigned and a key objective is to reduce local levels of
pollution by reducing the number of motorised vehicles using the area.
4.4.7 Enforcement
In January 2012, the City Corporation announced that it
would issue Fixed Penalty Notices to drivers who refuse to turn their vehicle engines
off when asked to do so by authorised officers. The City undertook a widespread
publicity campaign to reduce the amount of vehicle idling and has produced a set of
posters aimed at specific vehicle types. Letters were sent to coach companies, taxi
operators and key delivery companies to outline the requirement to turn vehicle
engines off when parked. The City Corporation has been working closely with
construction sites to ensure drivers do not leave engines running. Construction sites
display City of London ‘no idling’ posters and give leaflets out to drivers. Areas that
have a problem with delivery vehicles leaving engines on have been targeted by
delivering letters by hand to all businesses in the area asking them to ensure drivers
of delivery vehicles turn their engines off. Other drivers are approached as officers
see them as they walk around the City.
Signs asking drivers to turn engines off have been erected in areas of concern in the
City. These have proved to be effective in most locations. Civil Enforcement Officers

36
speak to drivers who leave their engines running unnecessarily and ask them to turn
them off. The City Corporation has also commenced Cleaner Air Action Days where
a team of Air Quality Wardens speak to drivers who leave engines running
unnecessarily with a view to changing behaviour over the long term.
4.4.8 Beech Street
Beech Street is an enclosed road (tunnel) near the
Barbican centre. It is used by over 8,000 pedestrians
during the working week day (7am – 7pm) and a similar
number of motorised vehicles. Taxis are the most
common motorised vehicle type using the road. As the
road is enclosed, levels of pollution emitted by vehicles
can build up as they take longer to be dispersed. The
road is washed to keep it clean and a programme of
additional street washing was introduced to see if it had an impact on level of fine
particles in the tunnel. It was found to be effective, so has been continued.
Policy 5: Reducing emissions from transport
The City Corporation will seek opportunities for a significant reduction in
emissions associated with road traffic in the Square Mile
Actions:
26. The City Corporation will continue to support measures to encourage safe
cycling in the Square Mile.
27. The City Corporation will continue to enforce its policy of no unnecessary vehicle
engine idling in the Square Mile and erect street signs in areas of concern.
28. The City Corporation will encourage and implement measures that will lead to
reduction in emissions from taxis, where practical. This will include support for the
introduction of zero emission capable taxis in central London.
29. The City Corporation will look for opportunities to significantly reduce the impact
of freight distribution on air quality across central London and specifically work with
businesses and the construction and demolition industry to identify opportunities for
a reduction in vehicle movements, freight consolidation, zero-emission and low
emission last mile deliveries.
30. The City Corporation will ensure that proposed changes to road schemes will be
assessed for impact on local air quality.

37
31. The City Corporation will assess the impact of the projected increased office
space and associated traffic on future air quality in the Square Mile.
32. Options for significantly reducing the impact on pedestrians of air pollution in
Beech Street will be considered in the Barbican Area Strategy Review.
38
4.5 Reducing emissions from new developments
The Square Mile is in a constant state of redevelopment. Spatial planning is
important for improving air quality in the long term and the City Corporation has been
taking a range of action through planning policy to reduce the impact of new
developments on local air quality.
4.5.1 Planning policy
The City of London Local Plan Policy CS15 Sustainable development and climate
change requires new developments to:
‘positively address local air quality’, particularly nitrogen dioxide and
particulates PM10 (the City’s Air Quality Management Area Pollutants)
Local Plan development management policy DM 15.6: Air Quality provides further
detail on this, and details the following:
Developers must consider the impact their proposals have on air quality and
where appropriate provide an air quality impact assessment. Air quality impact
assessments will be required for developments adjacent to sensitive premises
such as schools, hospitals and residential areas. Assessments will also be
required if there is a proposal to use biomass or biofuel as a source of energy.
Development that would result in deterioration of the City’s nitrogen dioxide or
PM10 levels will be resisted. The City Corporation discourages the use of
biomass as a source of fuel due to the level of particulates emitted compared
to gas. It also requires low NOx emission gas boilers and low NOx combined
heat and power (CHP) technology. The City Corporation has developed a
short guide for minimising emissions from combined heat and power plant and
standby generators.
Construction and deconstruction, and the transport of construction materials
and waste, must be carried out in such a way as to minimise air quality
impacts.
Further policies that promote air quality improvement include Local Plan Policy
CS16: Public Transport, Streets and Walkways. This policy:
Encourages the use of public transport and active transport such as walking &
cycling and river transport.
Promotes a reduction in vehicle emissions through the use of traffic
management, electric charging points and transport assessments associated
with development.

39
Associated development management policies provide further guidance on the
implementation of these strategic aims including:
Policy DM 16.2 Pedestrian movement, this policy ensures a suitable
environment to encourage walking.
Policy DM 16.3 The provision of on-site cycle parking supports people who
cycle into the City.
Policy DM 16.4 Facilities to encourage active travel, such as walking, cycling
and running must be provided in new developments.
Policy DM 16.5 Parking and servicing standards allows for minimal car
parking space associated with all new developments. This discourages
people from driving into the City.
Policy DM 16.8 River transport encourages the use of the river in order to
reduce road transport of people and goods.
Policy CS19 Open Spaces and Recreation encourages greening on new
developments, particularly green roofs. A case study detailing some of the green
roofs in the City is available on the City Corporation web site13.The City is also home
to some substantial green walls for example New Street Square and 20 Fenchurch
Street. The City’s requirements for sustainable drainage to reduce rainwater runoff
can also help with local air quality through enhanced greening.
The City Corporation has published Supplementary Planning Documents for Open
Spaces14 and Trees15 in the City and these take into account the local impact on air
quality.
4.5.2 Construction and demolition
At any given time there are many active demolition,
construction and refurbishment sites in the Square Mile.
There are also a large number of street works supporting the
new developments. The development is essential in order for
the City to maintain itself as a world class business and
financial centre. The City Corporation has a code of practice
for construction and demolition detailing the environmental
standards that it expects the industry to work to. The Code is
enforced through development management.
13
http://www.cityoflondon.gov.uk/services/environment-and-planning/planning/heritage-and-
design/Documents/Green-roof-case-studies-28Nov11.pdf
14
http://www.cityoflondon.gov.uk/services/environment-and-planning/planning/heritage-and-
design/Documents/open-space-strategy-spd-2015.pdf
15
http://www.cityoflondon.gov.uk/services/environment-and-planning/planning/heritage-and-
design/Documents/Tree-Strat-Part-1-Complete.pdf

40
Minimising emissions to air is integral to the City Corporation code of practice. The
guidance, which is available on the City Corporation web site, reflects the best
practice guidance issued by the Mayor of London: The
Control of Dust and Emissions from Demolition and
Construction16. The City of London Code of Practice is
updated regularly to reflect best practice in the industry
and is now in its 7th edition. There are regular checks
on all large construction sites to ensure that they
adhere to the code.
Despite this, there are still significant emissions
associated with the construction industry, particularly
the use of non-road mobile machinery on site. The City
Corporation has started to look at ways that emissions from non-road mobile
machinery can be reduced.
4.5.3 Chimneys
The City Corporation ensures that all chimneys on new developments are installed to
ensure adequate dispersion of pollutants and issues authorisations for this under the
Clean Air Act 1993.
Policy 6: Reducing emissions from new developments
The City Corporation will ensure that new developments have a minimal
impact on local air quality both during the development phase and when
occupied.
Actions:
33. Through the City of London Local Plan, developments that would result in
deterioration of the City’s nitrogen dioxide or PM10 levels will be resisted.
34. The City Corporation will require an air quality assessment for developments
adjacent to sensitive premises such as residential properties, Doctors’ surgeries,
schools and St. Bartholomew’s Hospital.
35. The City Corporation will discourage the use of biomass and biofuels as a form
of energy in new developments.
36. All gas boilers in commercial developments are required to have a NOx rating of
<40mgNOx/kWh.
16
https://www.london.gov.uk/priorities/environment/clearing-londons-air/useful-documents

41
37. NOx emissions from combined heat and power (CHP) plant will be required to
meet the emission limits in the GLA document ‘Biomass and CHP emission
standards’ March 2013.
38. All new developments with > 1000m2 floor space or >10 residential units will
need to demonstrate that they are air quality neutral in line with the requirements of
London Plan Policy 7.14. If the development is not air quality neutral, off-setting will
be required. Guidance will be produced outlining suitable options for offsetting in the
Square Mile.
39. The City Corporation will ensure that all boilers, generators and CHP plant are
installed to ensure minimal impact on local air quality.
40. The City Corporation will develop a policy on the use of standby generators for
generating energy other than when electricity supplies are interrupted.
41. The City Corporation will work with the construction and demolition industry to
identify further opportunities of reducing emissions associated with building
development.
42. The City Corporation will update its best practice guide on minimising emissions
from construction and demolition regularly in order to reflect best practice. All
companies employed in demolition, construction and street works that work in the
Square Mile will be required to adhere to it.

42
4.6 Leading by example
4.6.1 Own buildings and fleet
The City Corporation has been reducing emissions from its buildings and fleet for a number of years. Since 2008, PM10 emissions from the City Corporation’s own fleet have reduced by over 50% and NOx by over 40%. This has been achieved by improved management, a reduction in size of the fleet and the purchase of newer, cleaner vehicles. Similarly emissions of PM10 and NOx from City buildings have reduced over the same time period by over 15%.
4.6.2 Procurement The City Corporation Responsible Procurement Strategy requires that, for large contracts over £250k, at least 10% of the qualitative contract award evaluation criteria must address responsible procurement. This includes the use of zero emission vehicles. The potential use of zero emissions vehicles and the principles enshrined in the Zero and Low Emission Procurement Directory, commissioned by the City Corporation in 201217, are factored into contract award criteria and specifications each time the City conducts sourcing projects.
Policy 7: Leading by example
The City Corporation will assess the impact of its activities on local levels of
air pollution in the Square Mile and take steps to minimise it wherever
possible.
Action:
43. The City Corporation will continue to look for opportunities for reducing emissions
from its buildings, fleet and contractors’ fleet.
44. The City Corporation will ensure that major contracts include standards to reduce
the impact on local air quality.
45. A pro forma air quality questionnaire will be developed for use in major policy
reviews.
46. The City Corporation will move away from using diesel in its own fleet wherever
practical.
17
www.cityoflondon.gov.uk/air

43
4.7 Recognising and rewarding good practice
4.7.1 Sustainable City Awards
The City Corporation runs the national Sustainable City
Award’s scheme. The awards are given to organisations that
demonstrate excellence in sustainable development. There
are 12 categories, one of which is air quality.
The Sustainable City Award for air quality has been popular.
Previous winners include a campaign organisation, an
organisation that works with artists and scientists to produce
contemporary art, a government organisation, a City bank and
a Business Improvement District.
4.7.2 Considerate Contractors’ Environment Award
The Considerate Contractors’ Scheme was pioneered by the City Corporation in
1987. It aims to encourage building and civil engineering contractors working in the
City to carry out their operations in a safe and considerate manner.
Building sites and street works are judged annually on the basis of their overall
performance during that year. A wide range of awards are given including a
Environment Award, which rewards best practice and encourages innovation in
minimising the impact on the local environment, including air quality.
4.7.3 Clean City Award
In 2013, to celebrate European Year of Air, there
was a Clean City Award for air quality awarded to
a City business that has taken positive action to
reduce emissions of air pollutants. Impact on local
air quality is now part of the judging criteria for
future awards.
N
Nomura International receiving the
2013 Clean City Award for air quality
from the Lord Mayor

44
Policy 8: Recognising and rewarding good practice
The City will continue to promote, reward and disseminate best practice for
tackling poor air quality through its award schemes.
Actions:
47. The City Corporation will continue to run an annual Sustainable City Award for
Air Quality.
48. The City Corporation will continue with its annual Considerate Contractors’
Environment Award to encourage best practice and innovation in the industry.

45
4.8 Raising awareness
In addition to taking action to reduce emissions and improve local air quality the City Corporation also takes action to increase public understanding about air pollution, its causes, effects, and how concentrations vary both spatially and from day to day. Armed with the right information people can take any necessary steps to avoid high levels of air pollution to reduce the impact on health. The City Corporation has been working with different communities in order to do this.
4.8.1 Working with residents
In October 2013, residents in the Barbican Estate began to monitor local levels of air pollution under a Citizen Science programme with Mapping for Change, University College London. One of the key aims was to enable residents to understand how pollution varies in an urban environment, both spatially and under different weather conditions.
Over 70 households monitored nitrogen dioxide on the balconies of their flats, at street level and at podium level in the Barbican Estate. Figure 4.2 shows the location of nitrogen dioxide monitoring that took place over a year. Appendix 3 contains further data from the Citizen Science monitoring programme. A similar Citizen Science monitoring scheme has commenced with the residents in Mansell Street in the east of the City. Further information is available on the City Corporation web site.18
Figure 4.2 Air quality monitoring locations around the Barbican Estate
18
www.cityoflondon.gov.uk/air

46
4.8.2 Working with schools
During 2013/2014, the City Corporation worked with Sir John Cass Primary school to both improve local air quality and work with the school children to raise awareness. Friends of City Gardens, a local community group, helped to install over 170 plants designed to improve air quality, in addition to several ivy screens. Detailed air quality monitoring is underway around the school and an entire school engagement programme has been undertaken. Energy saving measures were implemented at the school, which will help reduce the schools own emissions of air pollutants. When pollution levels are high the school receives a notification so children that are susceptible to poor air quality can be protected. The work was implemented as part of the Greater London Authority Schools Clean Air Zones Programme.
4.8.3 Working with businesses
Through the CityAir business engagement programme, the City Corporation has been raising awareness of air pollution with City workers. A number of business events have been supported such as the one pictured at 99 Bishopsgate. A wide range of City businesses have been taking action to reduce their impact on local air pollution and raise awareness amongst their staff. Businesses have been improving the management of their buildings, incorporating air quality into procurement decisions and encouraging staff to move around the City either by foot or by bike. In March 2014, eighteen businesses were awarded Air Quality Champion status for their efforts in taking action to improve local air quality.
4.8.4 Providing information via CityAir Smart phone App
The City Corporation promotes airTEXT, a free message service to alert users when pollution levels are high in London.

47
The City Corporation also has its own Smart Phone App ‘CityAir’, which provides advice to users when pollution levels are high. People who do not own a Smart Phone can use the web site http://cityairapp.com/
Users can sign up as a different user e.g. a pedestrian, jogger or vulnerable person and receive tailored messages. The App recommends action to reduce personal exposure, contains a map of current pollution levels and has a function to guide users along low pollution routes. There have been almost 10,000 downloads to date.
CityAir also has an active Twitter account @_CityAir to help raise awareness about air pollution and support campaigns such as anti vehicle idling Cleaner Air Action days.
Policy 9: Raising awareness
The City Corporation will take action to raise awareness amongst City residents and workers about air pollution and provide information on how to reduce exposure on days of high levels of pollution.
Actions:
49. The City Corporation will continue to work with schools to provide information onhow to reduce the impact of air pollution on children’s health.
50. The City Corporation will source funding for further greening at Sir John Cassprimary school.
51. The City Corporation will continue to work with residents in the Square Mile toraise awareness of air quality.
52. The City Corporation will develop a general communications strategy to informpeople of action they can take to reduce exposure to air pollution.
53. The City Corporation will continue to support City businesses at events to raisethe profile of air quality and provide information for reducing exposure.
54. The City Corporation will continue to promote and develop the CityAir SmartPhone App with and CityAirApp.com web site.

48
5. Air Quality and Public Health
One of the key changes since the publication of the 2011 Air Quality Strategy is the
requirement for local government to undertake health improvement functions from
April 2013. This was introduced by Health and Social Care Act 2012.
A Public Health Outcomes Framework (PHOF) has been introduced and consists of
a set of indicators compiled by Public Health England. These measure how
effectively the activities of each local authority are at addressing the determinants of
health. One of these indicators is Air Pollution and this is measured against levels of
tiny particles (PM2.5). PM2.5 is the mass concentration of particles less than 2.5
micrometers in diameter. This size of particle can penetrate deep into the lungs.
Nitrogen dioxide is not an indicator in the PHOF but it does have impacts on health
independently of PM2.5.
Public Health England has allocated statistics to each local authority area to
demonstrate the impact of long term exposure to PM2.5 on the health of the
population19. For the purposes of this data, the City of London is grouped with
Hackney because of the small residential population and corresponding small
number of deaths in any one year. The data shows that 7.9% of deaths in the two
local authority areas in a year can be attributed to exposure to PM2.5, with a result of
1,397 life years lost in any given year.
Short term exposure to high levels of air pollution can cause a range of adverse
effects: exacerbation of asthma, effect on lung function, an increase in hospital
admissions for respiratory and cardio-vascular conditions and increases in mortality.
Long-term exposure to air pollution increases mortality risk. The relative risks
associated with long-term exposure are higher than short term exposure. Public
Health England has stated that exposure to PM2.5 is a significant cause of disease in
London, and at least as important as road accidents, communicable disease, liver
disease and suicide.
Measures to improve air quality can have significant positive impacts on a range of
Public Health Outcome Framework measures e.g. increased walking and cycling can
also help to tackle obesity, inactivity, social isolation and sickness absence rate. In
addition measures which restrict motor traffic also help to tackle transport-related
noise, road traffic injuries and death.
What action has the City Corporation taken?
Air pollution is a concern for City residents and during a public consultation
event held by the City Corporation to identify issues which would form the
priorities in the Joint Health and Wellbeing Strategy (JHWS), air quality was 19
Estimating local mortality burdens associated with particulate pollution, Public health England 2014

49
ranked as the third highest public health concern for City residents. As a
consequence, the City of London JHWS has identified improving air quality as
a key priority to improve the health and wellbeing of City residents and
workers.
The City’s Health and Wellbeing Board has been advised of the health
impacts of air quality in the Square Mile and an analysis has been undertaken
of how the Health and Wellbeing Board can assist in improving air quality and
reducing public exposure. A report was presented to the Board in January
2014 and recommendations are being implemented. The report can be
viewed at www.cityoflondon.gov.uk/air
A report has been produced bringing together the latest papers on the health
impacts of air pollution. This report confirms that of all the pollutants,
particulate matter has the greatest impact on health. However, particulate
matter (PM), nitrogen dioxide, (NO2) and ozone (O3) have been found to be
‘certain’ causes of death and disease, rather than ‘probable’ causes as
previously understood. The report is available at www.cityoflondon.gov.uk/air .
The City Corporation has been, and will continue to, monitor PM2.5 in
Farringdon Street and add an additional PM2.5 monitor at Sir John Cass
Primary School.
Air quality information sheets are produced for different City communities as required.
Policy 10: Air quality and public health
Improving air quality and reducing public exposure will remain a key public
health priority for the City Corporation until concentrations are at a level not
considered to be harmful to health.
Actions:
55. The City of London will install a PM2.5 monitor at Sir John Cass School during
2015 and the data will be assessed for its impact on health.
56. The City Corporation will identify exposure hotspots with high footfall and high
concentrations.
57. The City of London will ensure that measures implemented to reduce emissions
of NO2 and PM10 will also lead to a reduction in emissions of PM2.5.
58. The City of London will continue to explore ways to reduce exposure of the
population to air pollution.

50
59. The City will look at ways to extend the message about poor air quality on days
of high pollution.
60. As City Corporation Area Strategies are reviewed they will be assessed for public
exposure to air pollution and measures taken to reduce exposure where practical.

51
Appendix 1
Further details on the delivery of actions
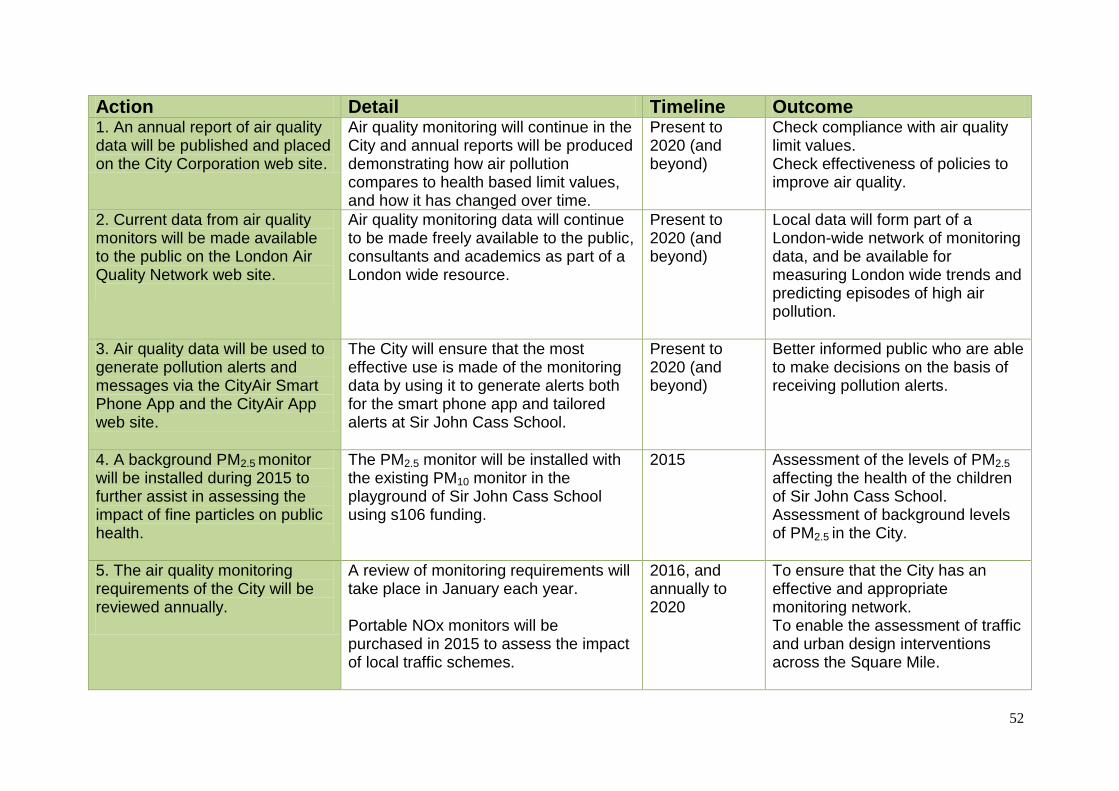
52
Action Detail Timeline Outcome 1. An annual report of air quality data will be published and placed on the City Corporation web site.
Air quality monitoring will continue in the City and annual reports will be produced demonstrating how air pollution compares to health based limit values, and how it has changed over time.
Present to 2020 (and beyond)
Check compliance with air quality limit values. Check effectiveness of policies to improve air quality.
2. Current data from air quality monitors will be made available to the public on the London Air Quality Network web site.
Air quality monitoring data will continue to be made freely available to the public, consultants and academics as part of a London wide resource.
Present to 2020 (and beyond)
Local data will form part of a London-wide network of monitoring data, and be available for measuring London wide trends and predicting episodes of high air pollution.
3. Air quality data will be used to generate pollution alerts and messages via the CityAir Smart Phone App and the CityAir App web site.
The City will ensure that the most effective use is made of the monitoring data by using it to generate alerts both for the smart phone app and tailored alerts at Sir John Cass School.
Present to 2020 (and beyond)
Better informed public who are able to make decisions on the basis of receiving pollution alerts.
4. A background PM2.5 monitor will be installed during 2015 to further assist in assessing the impact of fine particles on public health.
The PM2.5 monitor will be installed with the existing PM10 monitor in the playground of Sir John Cass School using s106 funding.
2015 Assessment of the levels of PM2.5
affecting the health of the children of Sir John Cass School. Assessment of background levels of PM2.5 in the City.
5. The air quality monitoring requirements of the City will be reviewed annually.
A review of monitoring requirements will take place in January each year. Portable NOx monitors will be purchased in 2015 to assess the impact of local traffic schemes.
2016, and annually to 2020
To ensure that the City has an effective and appropriate monitoring network. To enable the assessment of traffic and urban design interventions across the Square Mile.

53
Action Detail Timeline Outcome 6. The City Corporation will explore further options for joint action with politicians in neighbouring authorities.
An air quality presentation will be delivered to Central London Forward. Options for joint action with neighbouring boroughs and London Councils will be explored
2015 - 2020 The development of, and support for, policies that will help to improve air quality across central London.
7. The City Corporation will continue to place air quality as an important political priority and support local and London-wide action through its Supporting London Group, Port Health and Environmental Service Committee and Health and Wellbeing Board.
Regular updates will be provided to the City of London Strategic London Group. Regular presentations will be given to the Port Health and Environmental Services Committee and Health and Wellbeing Board on air quality.
2015 - 2020 Fully informed chief officers and members leading to support for action to improve air quality. Improved health of residents and workers in the City.
8. The City Corporation will consider options for using local legislation to help improve local air quality.
Consider options for using the City of London Various Powers Act, and other powers, for local action to improve air quality.
2017 Improved regulatory powers to improve local air quality.
9. The City Corporation will make resources available through CIL, S106 and LIP funding to improve local air quality.
Meetings will be held with planning officers to progress options for using CIL for local air quality improvement. Applications for S106 and LIP contributions will be made as the opportunity arises.
2015 - 2020 Further funding to support local measures and provide match funding to improve air quality in the City of London.
10. The City Corporation will ensure that all relevant Corporate strategies and polices will reflect the importance of improving local air quality.
All existing strategies will be assessed for actions to assist in improving air quality and reducing exposure. Further measures will be included in Corporate strategies when they are reviewed.
2015 - 2020 Corporate wide action to improve air quality and reduce exposure. Staff across the organisation with an improved understanding of issues surrounding air quality.

54
Action Detail Timeline Outcome 11. The City Corporation will continue to liaise with Greater London Authority and Transport for London over additional action to reduce emissions from buses and taxis.
Further communication will be held with the GLA and TfL over the taxi age limit and options for cleaner buses in the City of London.
2015 Reduced emissions from buses and taxis in the Square Mile.
12. The City Corporation will consider options for supporting the adoption of zero emission capable taxis across London.
Options for supporting and rolling out rapid charging infrastructure will be explored with Transport for London.
2015 - 2016 Reduced emissions from taxis, and other vehicles, in the Square Mile.
14. The City Corporation will support the GLA with the introduction of the Ultra Low Emission Zone.
Information will be provided locally to ensure residents and businesses are aware of the requirements of the ULEZ. Full compliance with the Corporate fleet.
2018 - 2020 Full support for the ULEZ scheme.
15. The City Corporation will define local air quality focus areas, to complement the GLA air quality focus areas, and develop specific plans to improve air quality and reduce exposure in these areas.
The City of London will be assessed for Air Quality Focus Areas The focus areas will be designated and plans developed to improve local air quality at the focus areas.
2015 - 2016 Improved air quality in designated hot spot areas.
16. Once the implications on air quality of the Mayor of London’s key proposals are known, for example the ULEZ, the City Corporation will model air quality to 2020 to establish what additional action is required to meet the air quality Limit Values across the Square Mile.
The City Corporation will work with external organisations to model options for achieving full compliance with the limit values for nitrogen dioxide by 2020 and 2025. The outcomes will be publicised.
2015 - 2016 A report detailing what is required to meet limit values.

55
Action Detail Timeline Outcome 17. The City Corporation will work with the Greater London Authority on a review of Local Air Quality Management (the local government air quality regulatory framework) for London.
Officers from the City will attend meetings about the Local Air Quality Management (LAQM) review and comment fully on the consultation.
2015 An improved system of LAQM for London.
18. The City Corporation will aim to become a Mayor of London designated Clean Air Borough as soon as possible.
The criteria to become a Clean Air Borough will be adhered to and the City will report on how the criteria are being met.
2015 - 2016 Compliance with the requirements of the Mayor of London to improve air quality and reduce exposure which will secure access to the Mayor’s Air Quality Fund.
19. The City Corporation will continue to engage with businesses in the Square Mile under the CityAir programme. This will commence with businesses in the Barbican area with the support of local residents involved in the Citizen Science air quality monitoring programme.
Work with existing air quality champions to further encourage local action to improve air quality. Support events, particularly around Environment Week Source and apply for external funding to support business engagement. Engage with additional businesses as funding allows.
2015 - 2020 Greater awareness of air quality amongst City workers and action by businesses to help improve local air quality. Increased awareness within companies with a national and international influence.
20. The City Corporation will work with businesses in the Cheapside Business Improvement District to raise the profile of air quality and obtain support for action to reduce emissions associated with their activities.
Meet with BID representatives to explore options for local action to improve air quality and reduce exposure. Source and apply for funding to support any local action in the area.
2015 - 2018 Focussed local action to improve air quality in an area of the City with high exposure.
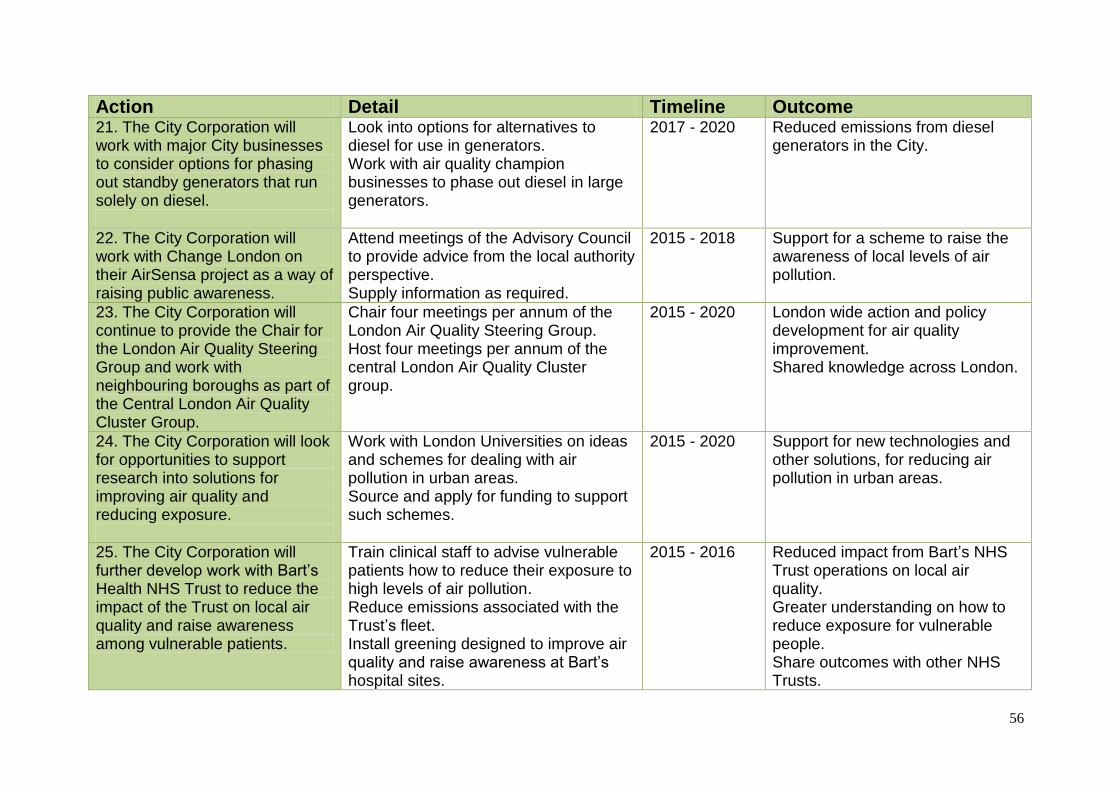
56
Action Detail Timeline Outcome 21. The City Corporation will work with major City businesses to consider options for phasing out standby generators that run solely on diesel.
Look into options for alternatives to diesel for use in generators. Work with air quality champion businesses to phase out diesel in large generators.
2017 - 2020 Reduced emissions from diesel generators in the City.
22. The City Corporation will work with Change London on their AirSensa project as a way of raising public awareness.
Attend meetings of the Advisory Council to provide advice from the local authority perspective. Supply information as required.
2015 - 2018 Support for a scheme to raise the awareness of local levels of air pollution.
23. The City Corporation will continue to provide the Chair for the London Air Quality Steering Group and work with neighbouring boroughs as part of the Central London Air Quality Cluster Group.
Chair four meetings per annum of the London Air Quality Steering Group. Host four meetings per annum of the central London Air Quality Cluster group.
2015 - 2020 London wide action and policy development for air quality improvement. Shared knowledge across London.
24. The City Corporation will look for opportunities to support research into solutions for improving air quality and reducing exposure.
Work with London Universities on ideas and schemes for dealing with air pollution in urban areas. Source and apply for funding to support such schemes.
2015 - 2020 Support for new technologies and other solutions, for reducing air pollution in urban areas.
25. The City Corporation will further develop work with Bart’s Health NHS Trust to reduce the impact of the Trust on local air quality and raise awareness among vulnerable patients.
Train clinical staff to advise vulnerable patients how to reduce their exposure to high levels of air pollution. Reduce emissions associated with the Trust’s fleet. Install greening designed to improve air quality and raise awareness at Bart’s hospital sites.
2015 - 2016 Reduced impact from Bart’s NHS Trust operations on local air quality. Greater understanding on how to reduce exposure for vulnerable people. Share outcomes with other NHS Trusts.

57
Action Detail Timeline Outcome 27. The City Corporation will continue to enforce its policy of no unnecessary vehicle engine idling in the Square Mile and erect street signs in areas of concern.
Liaise with City businesses and construction sites over engine idling. Directly contact any companies whose drivers leave engines running. Erect signs in areas of concern. Run Cleaner Air Action Days throughout the year.
2015 - 2020 Reduced emissions from unnecessary engine idling in the Square Mile. Raised awareness amongst drivers.
28. The City Corporation will encourage and implement measures that will lead to reduction in emissions from taxis, where practical. This will include support for the introduction of zero emission capable taxis in central London.
Improve and signpost ranks to encourage their use by drivers and the public. Investigate options for financially supporting rapid charging infrastructure in central London.
2015 - 2017 Reduced emissions from taxis in the Square Mile.
29. The City Corporation will look for opportunities to significantly reduce the impact of freight distribution on air quality across central London and specifically work with businesses and the construction and demolition industry to identify opportunities for a reduction in vehicle movements, freight consolidation, zero-emission and low emission last mile deliveries.
Develop and publish a Freight Strategy. Investigate options for using space in CoL car parks for consolidation / distribution centres. Issue revised delivery and service plan guidelines. Investigate opportunities for and implications of introducing ‘timed delivery zones’, ‘low emission delivery zones’ and ‘small vehicle delivery zones’ in areas of high pedestrian and cycle activity.
2016
Reduced emissions from freight in the Square Mile.

58
Action Detail Timeline Outcome 30. The City Corporation will ensure that proposed changes to road schemes will be assessed for impact on local air quality.
Road schemes will be assessed for local air quality impact when there are proposed changes.
2015 - 2020 Ensure that road schemes do not have a negative impact, and wherever possible have a positive impact, on local air quality.
31. The City Corporation will assess the impact of the projected increased office space and associated traffic on future air quality in the Square Mile.
Undertake a modelling assessment to predict likely impact of an increase in office space and associated traffic on local air quality.
2017 Ensure that the growth of the City doesn’t have a negative impact on local air quality.
32. Options for significantly reducing the impact on pedestrians of air pollution in Beech Street will be considered in the Barbican Area Strategy review.
The impact of air pollution on users of Beech Street tunnel will be taken into account with any new designs for the area.
2015 - 2016 A reduction in the impact of air quality on the health of people who use Beech Street.
33. Through the City of London Local Plan, developments that would result in deterioration of the City’s nitrogen dioxide or PM10 levels will be resisted.
Ensure that this policy is adhered to in all planning applications. Ensure air quality neutral assessments are carried out for all developments that have >1000m2 floor space or consist of >10 residential units.
2015 - 2020 New developments that do not have a negative impact on local air quality.
34. The City Corporation will require an air quality assessment for developments adjacent to sensitive premises such as residential properties, Doctors’ surgeries, schools and St. Bartholomew’s Hospital.
Ensure this requirement is enforced through the planning process. Develop a Supplementary Planning Document for air quality.
2015 – 2020 2016
Vulnerable people will not be adversely affected by emissions associated with new developments.
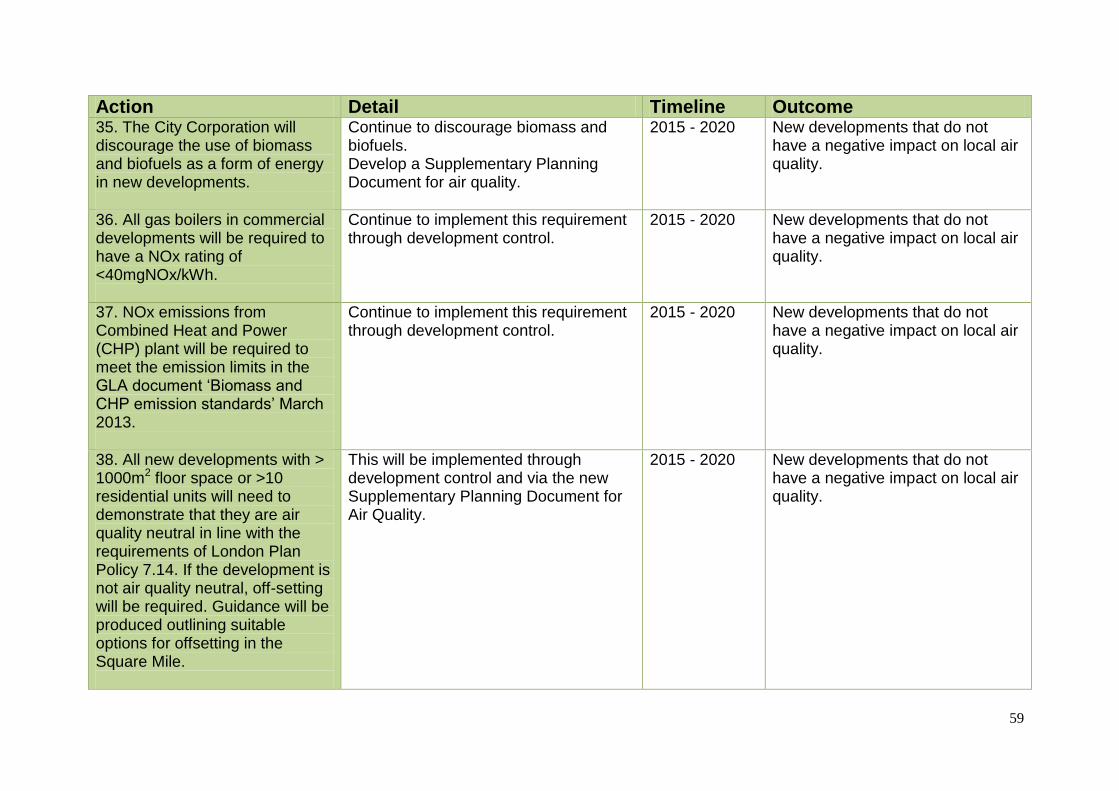
59
Action Detail Timeline Outcome 35. The City Corporation will discourage the use of biomass and biofuels as a form of energy in new developments.
Continue to discourage biomass and biofuels. Develop a Supplementary Planning Document for air quality.
2015 - 2020 New developments that do not have a negative impact on local air quality.
36. All gas boilers in commercial developments will be required to have a NOx rating of <40mgNOx/kWh.
Continue to implement this requirement through development control.
2015 - 2020 New developments that do not have a negative impact on local air quality.
37. NOx emissions from Combined Heat and Power (CHP) plant will be required to meet the emission limits in the GLA document ‘Biomass and CHP emission standards’ March 2013.
Continue to implement this requirement through development control.
2015 - 2020 New developments that do not have a negative impact on local air quality.
38. All new developments with > 1000m2 floor space or >10 residential units will need to demonstrate that they are air quality neutral in line with the requirements of London Plan Policy 7.14. If the development is not air quality neutral, off-setting will be required. Guidance will be produced outlining suitable options for offsetting in the Square Mile.
This will be implemented through development control and via the new Supplementary Planning Document for Air Quality.
2015 - 2020 New developments that do not have a negative impact on local air quality.
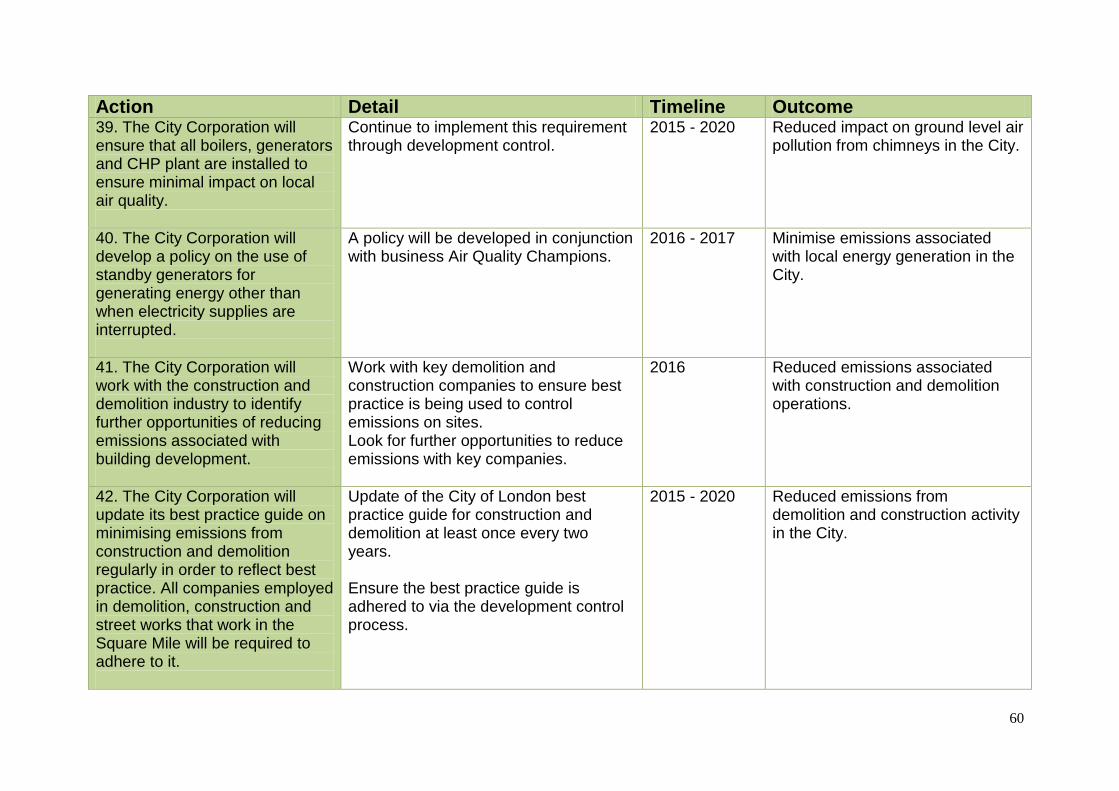
60
Action Detail Timeline Outcome 39. The City Corporation will ensure that all boilers, generators and CHP plant are installed to ensure minimal impact on local air quality.
Continue to implement this requirement through development control.
2015 - 2020 Reduced impact on ground level air pollution from chimneys in the City.
40. The City Corporation will develop a policy on the use of standby generators for generating energy other than when electricity supplies are interrupted.
A policy will be developed in conjunction with business Air Quality Champions.
2016 - 2017 Minimise emissions associated with local energy generation in the City.
41. The City Corporation will work with the construction and demolition industry to identify further opportunities of reducing emissions associated with building development.
Work with key demolition and construction companies to ensure best practice is being used to control emissions on sites. Look for further opportunities to reduce emissions with key companies.
2016 Reduced emissions associated with construction and demolition operations.
42. The City Corporation will update its best practice guide on minimising emissions from construction and demolition regularly in order to reflect best practice. All companies employed in demolition, construction and street works that work in the Square Mile will be required to adhere to it.
Update of the City of London best practice guide for construction and demolition at least once every two years. Ensure the best practice guide is adhered to via the development control process.
2015 - 2020 Reduced emissions from demolition and construction activity in the City.

61
Action Detail Timeline Outcome 43. The City Corporation will continue to look for opportunities for reducing emissions from its buildings, fleet and contractors’ fleet.
Continue to provide advice on the best vehicle option for new fleet purchases. Use contracts to push for cleaner vehicles in contractor’s fleet. Manage buildings to reduce emissions of air pollutants, alongside carbon.
2015 -2020 Reduced impact of City Corporation activities on local air pollution.
44. The City Corporation will ensure that major contracts include standards to reduce impact on air quality.
Continue to ensure that all contracts require air quality targets. Integrate air quality into the new Responsible Procurement Strategy.
2015 - 2020 Reduced impact of City Corporation activities on local air pollution.
45. A pro forma air quality questionnaire will be developed for use in major policy reviews.
Develop the pro forma. Work with other departments to ensure it is embedded into their policies.
2016 - 2017 Corporate policies that assist in improving air quality and reducing exposure.
46. The City Corporation will move away from using diesel in its own fleet wherever practical.
All new purchases will be assessed and alternatives to diesel will be encouraged where available.
2015 - 2020 Reduced impact of City Corporation fleet on local air quality.
47. The City Corporation will continue to run an annual Sustainable City Award for air quality.
Work with award partners to advertise and promote the awards. Assess the applications with partner judges.
2015 - 2020 Promotion and recognition for organisations taking action to improve air quality.
48. The City Corporation will continue with its annual Considerate Contractors’ Environment Award to encourage best practice and innovation in the industry.
Encourage companies to apply for the awards. Judge applications. Encourage innovation throughout the year.
2015 - 2020 Reduced impact on air quality form demolition and construction in the City.

62
Action Detail Timeline Outcome 49. The City Corporation will continue to work with schools to provide information on how to reduce the impact of air pollution on children’s health.
Alerts will continue to be provided direct to Sir John Cass School. Opportunities will be sought to do further work with schools in the City. Source funding to support the work.
2015 - 2020 Reduced impact of air pollution on the health of children in the Square Mile.
50. The City Corporation will source funding for further greening at Sir John Cass primary school.
Source funding opportunities Install greening if funding obtained.
2016 - 2017 Additional greening at the school to help reduce local levels of air pollution.
51. The City Corporation will continue to work with residents in the Square Mile to raise awareness of air quality.
Continue with the Citizen Science monitoring project at the Mansell Street Estate.
2015 Better informed residents able to take action to reduce exposure to poor air quality.
52. The City Corporation will develop a general communications strategy to inform people of action they can take to reduce exposure to air pollution.
Develop a protocol for issuing notifications across the Square Mile when pollution levels are high. Link in with the Mayor of London Breathe Better Together programme.
2015 - 2016 Better informed residents and City workers able to take action to reduce exposure to poor air quality.
53. The City Corporation will continue to support City businesses at events to raise profile of air quality and provide information for reducing exposure.
Support events as and when requested. 2015 - 2020 Raise the profile of air quality amongst City workers and provide advice on how to reduce exposure.
54. The City Corporation will continue to promote and develop the CityAir Smart Phone App with and CityAirApp.com web site.
The CityAir App will be promoted in the media, at local events and on social media.
2015 - 2020 Better informed public about air pollution with advice on how to reduce exposure.

63
Action Detail Timeline Outcome 55. The City of London will install a PM2.5 monitor at Sir John Cass School during 2015 and assess the data for its impact on health.
A PM2.5 analyser will be installed along- side the existing PM10 analyser in the school playground.
2015 Assess the impact of PM2.5 on the health of children at the school. Measure background concentrations of PM2.5 in central London.
56. The City Corporation will identify exposure hotspots with high footfall and high concentrations.
Hot spot areas will be identified using footfall data and local monitoring data and a report produced detailing these locations.
2016 Focus areas for local action to reduce exposure and improve local air quality.
57. The City of London will ensure that measures implemented to reduce emissions of NO2 and PM10 will also lead to a reduction in emissions of PM2.5.
All measures will be assessed for their impact on reducing all three pollutants.
2015 - 2020 Implementation of measures that will lead to an improvement in health of workers and residents in the City.
58. The City of London will continue to explore ways to reduce exposure of the population to air pollution.
An assessment will be made of the most effective ways to reduce the exposure of the City population, to include residents, workers and visitors, to high levels of air pollution.
2016 - 2020 Reduced impact of air pollution on the health of people in the Square Mile.
59. The City will look at ways to extend the message about poor air quality on days of high pollution.
Work with the Greater London Authority Breathe Better Together programme. Work with the Public Relations dept. to develop an effective communication strategy.
2015 Provision of accurate and timely advice to enable people to reduce their exposure to high levels of pollution.
60. As City Corporation Area Strategies are reviewed they will be assessed for public exposure to air pollution and measures taken to reduce exposure where practical.
Designs for reducing exposure will be incorporated into are strategies where possible.
2015 - 2020 Street designs that assist in reducing the exposure of workers and residents to high levels of air pollution.

64
Appendix 2: Sources of Air Pollution
Small particles PM10
Particles of varying sizes and sources exist in the air. However, it is generally
considered that small and fine particles are most hazardous to health due to their
ability to penetrate deep into the lungs and do the most damage.
Small particles are defined by their size. They are any particles that are under 10
micrometers in diameter which are represented as PM10. Fine particles are 2.5
micrometers or less in diameter and they are generally formed by combustion. They
are represented as PM2.5 and are the main cause of the harmful effects of particulate
matter. Small and fine particles are not visible to the naked eye.
Where do fine particles come from?
Concentrations of PM10 consist of primary particles that are emitted directly into the
atmosphere from sources such as fuel combustion, and secondary particles which
are formed by chemical reactions in the air. Particle matter can be human-made or
occur naturally. Natural particles found in the City include sea salt and dust from the
Sahara desert.
In the UK, the biggest man-made sources of PM10 are stationary fuel combustion
and transport. Road transport gives rise to primary particles from engine emissions
and tyre and brake wear. The Greater London Authority holds a database of all
emissions across London. It is called the London Atmospheric Emissions Inventory
(LAEI) . The 2008 LAEI, released in August 2010, details pollution emitted in 2008
and projects emissions across London for 2011 and 201520. The 2008 LAEI
indicates that approximately 37 % of PM10 generated by road vehicles in the City is
caused by the general wear of tyres and brakes. Secondary PM10 is created from
emissions of ammonia, sulphur dioxide and oxides of nitrogen, as well as from
emissions of organic compounds from fuel combustion.
Particles can travel long distances and on any given day it is likely that the following
particles are in the air in the City:
Black carbon from fuel combustion, particularly diesel
Trace metals from e.g. from vehicle brake wear
Minerals from construction
Sulphates from industrial fuel burning outside London
Nitrates from fuel burning, industry and traffic
Sea salt
Desert dust
20
A later version of the LAEI has been issued, but there are errors in the database. It is being amended at the
time of writing this document.

65
Primary particles emitted in the City
Figure A1 shows the anticipated relative proportion of emissions from each source in
2011. The LAEI indicates that the main source of PM10 is road transport. This
equated to 82% of all emissions in 2011.
This 82% from road vehicles is further broken down into vehicle type in figure A2.
When comparing vehicle types, taxis are the biggest emitters of PM10 in the City.
Figure A1 . : Source of PM 10 Emissions in the City
Major Roads 70 %
Minor Roads 12 %
Domestic Gas 1 %
Commercial Gas 11 %
Other 6 %
Figure A2 . : Source of PM 10 Emissions from Vehicle Types in
the City
Buses and Coaches 8 %
Rigid HGVs 10 %
Articulated HGVs 2 %
Motorcycles 3 %
Cars 17 %
Taxis 34 %
LGVs 26 %

66
Nitrogen dioxide
Nitrogen dioxide is an irritant gas, which at high concentrations causes inflammation
of the airways.
Where does nitrogen dioxide come from?
When nitrogen is released during fuel combustion it combines with oxygen atoms to
create nitric oxide (NO). This further combines with oxygen to create nitrogen dioxide
(NO2). Nitric oxide is not considered to be hazardous to health at typical ambient
concentrations, but nitrogen dioxide can be. Nitrogen dioxide and nitric oxide are
referred to together as oxides of nitrogen (NOx).
NOx emitted in the City
The 2008 LAEI details the approximate proportion of emissions of NOx from vehicles
and gas boilers in the City during 2011. This is shown in Figure A3. Emissions from
roads are expected to make up 58% of the total and gas boilers 41%.
Figure A4 shows the relative emissions from different vehicles in the City. Buses and
coaches make up almost half of total emissions of NOx.
Figure A . 3 : Source of NO x Emissions in the City
Major Roads 54 %
Minor Roads 4 %
Domestic Gas 6 %
Commercial Gas 35 %
Other 1 %
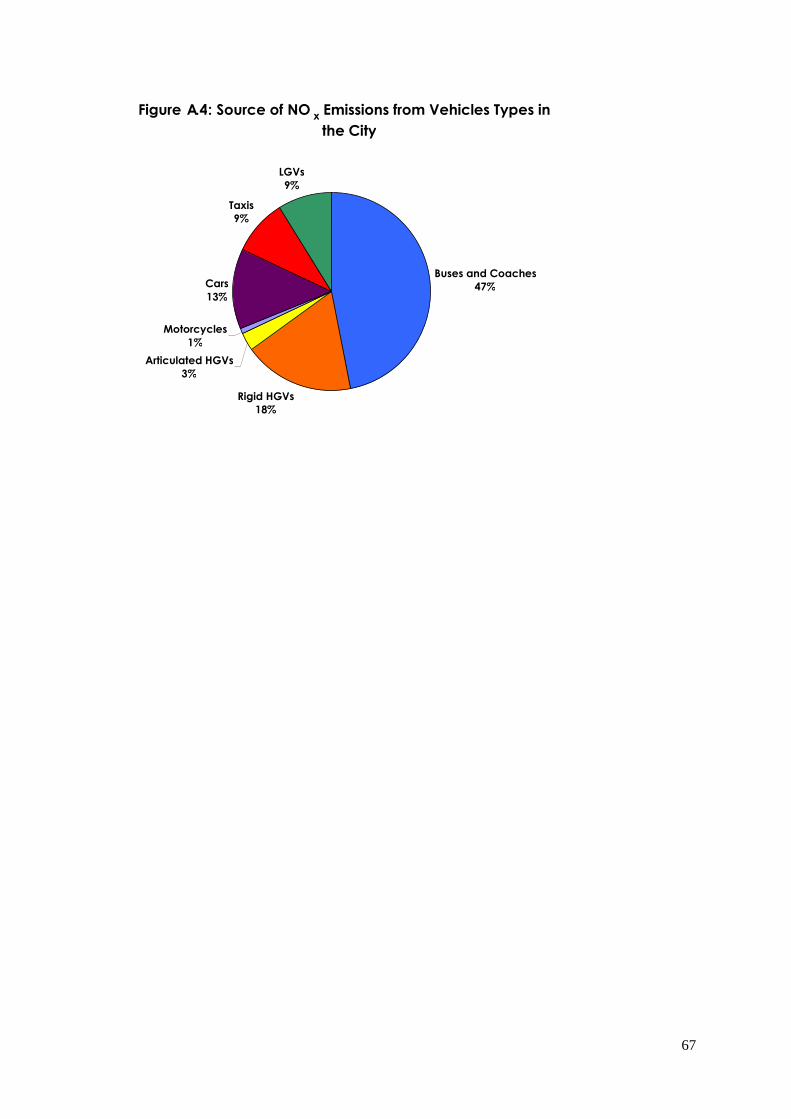
67
Figure A . 4 : Source of NO x Emissions from Vehicles Types in
the City
Buses and Coaches 47 %
Rigid HGVs 18 %
Articulated HGVs 3 %
Motorcycles 1 %
Cars 13 %
Taxis 9 %
LGVs 9 %

68
Appendix 3
Citizen Science Air Quality Monitoring Results

69
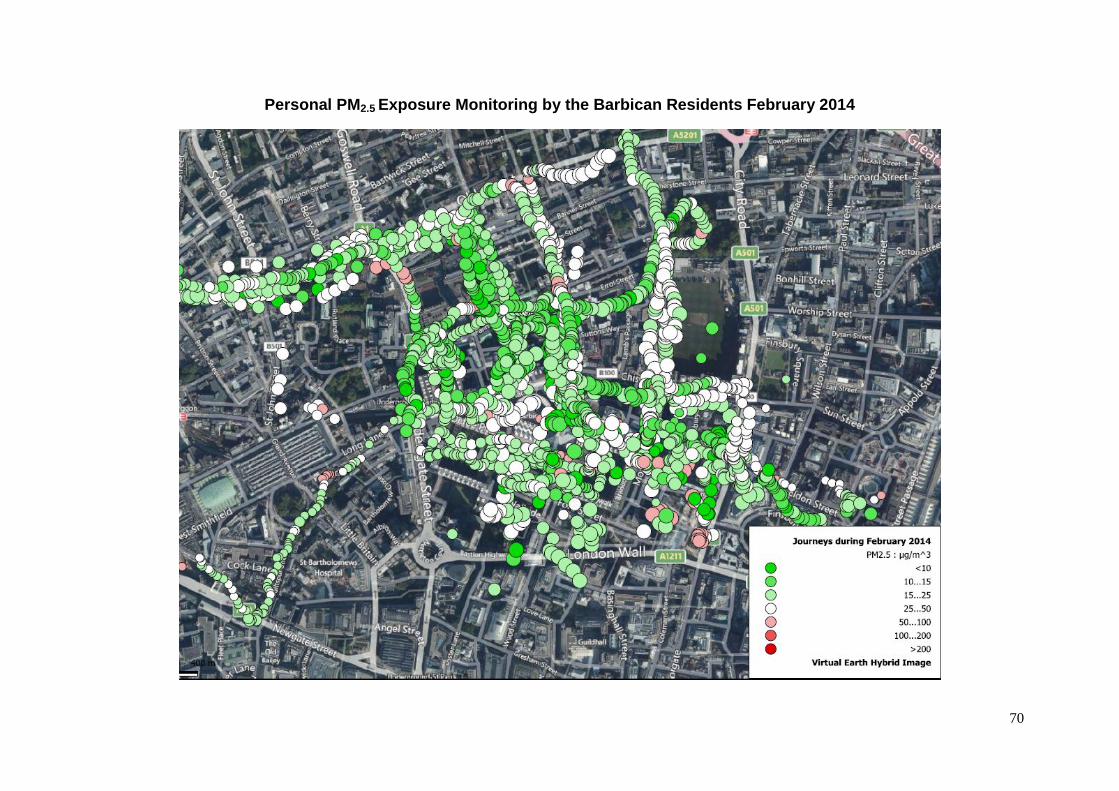
70
Personal PM2.5 Exposure Monitoring by the Barbican Residents February 2014

71
Personal Exposure PM2.5 Monitoring by the Barbican Residents, including during the 3 days of the April 2014 particle
pollution episode

72