city of miami general employees’ and sanitation employees ... · historical consistent...
TRANSCRIPT

FOR INSTITUTIONAL USE ONLYMFS Institutional Advisors, Inc.
24949.1
Before investing, consider the fund’s investment objectives, risks, charges, and expenses. For a prospectus, or summary prospectus, containing this and otherinformation, contact your investment professional or view online at mfs.com. Please read it carefully.MFS® investment products are offered through, MFS Fund Distributors, Inc., 500 Boylston Street, Boston, MA 02116
Presented to
City of Miami General Employees’ andSanitation Employees’ Retirement TrustMFS® Institutional International Equity Fund18 April 2012
3572
-City
ofM
iam
i-I-M
T-18
April
12.1
4483
7.qx
p
D
RAFT
Apr
5 2
012
11:4
8:27
MFS® Institutional International Equity Fund3572-I-MT-18April12.2
Presenters
Sean M. Kenney, CFA - Director, Institutional Sales - Joined MFS in 2004; previous positions include Senior Regional Manager; Senior Retirement Sales
Specialist; Inbound Sales and Marketing Representative. - Affiliations include National Conference of Public Employee Retirement Systems (NCPERS),
National Association of State Retirement Administrators (NASRA), National Association of GovernmentalDefined Contribution Administrators (NAGDCA), Boston Security Analysts Society, Inc., NationalConference on Teachers Retirement (NCTR), CFA Institute, American Society of Pension Professionals& Actuaries (ASPPA).
- Assumption College, BA, magna cum laude
Peter D. Loncto, CFA - Director, Institutional Product Management - As an Institutional Product Manager, communicates investment policy, strategy and tactics, performs
portfolio analysis and leads institutional product development. - Joined MFS in 2007. - Previous experience includes 5 years as Senior Marketing Manager at Nicholas-Applegate Capital
Management; 3 years as Performance Analyst at State Street Bank and Trust Company. - Originally joined MFS in 1997 and departed the firm in 1999 to attend graduate school.
Rejoined MFS in 2007. - Affiliations include CFA Institute, Boston Security Analysts Society, Inc. - Cornell University, MBA - Boston College, BA
1MFS® Institutional International Equity Fund3572-I-MT-18April12.1
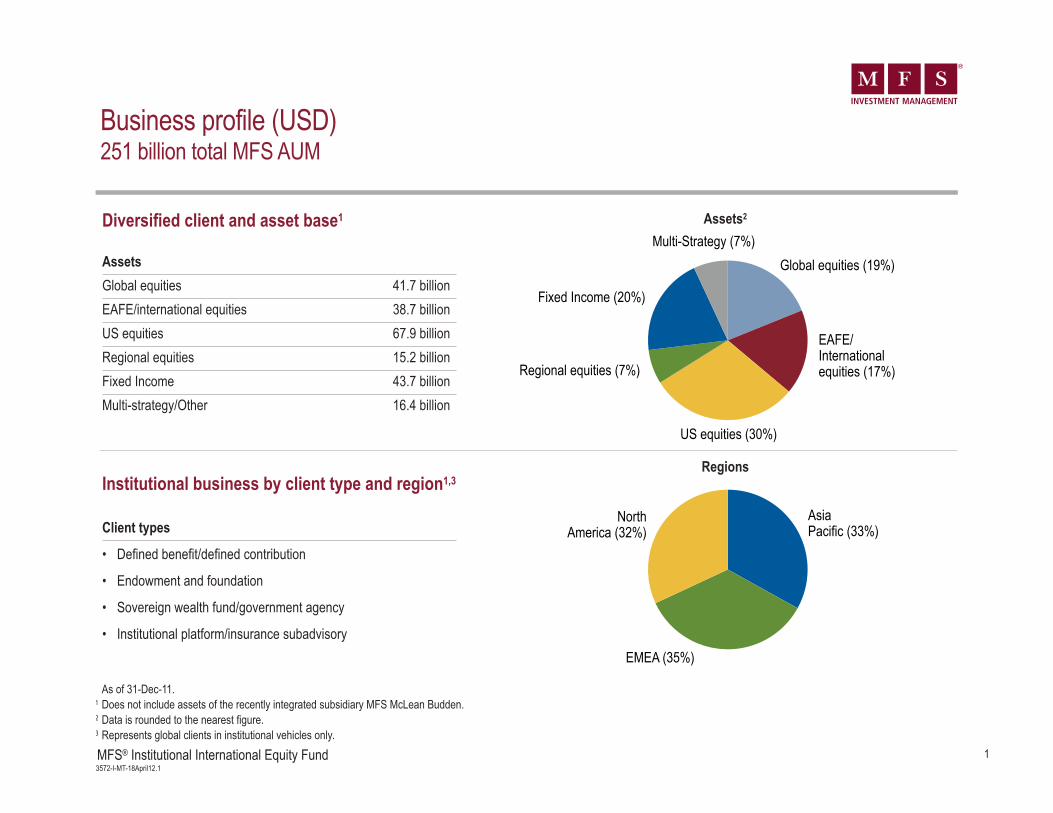
As of 31-Dec-11.1 Does not include assets of the recently integrated subsidiary MFS McLean Budden.2 Data is rounded to the nearest figure. 3 Represents global clients in institutional vehicles only.
Business profile (USD)251 billion total MFS AUM
Global equities (19%)
EAFE/International equities (17%)
US equities (30%)
Regional equities (7%)
Fixed Income (20%)
Multi-Strategy (7%)
Asia Pacific (33%)
EMEA (35%)
North America (32%)
Assets2
Regions
Diversified client and asset base1
AssetsGlobal equities 41.7 billionEAFE/international equities 38.7 billionUS equities 67.9 billionRegional equities 15.2 billionFixed Income 43.7 billionMulti-strategy/Other 16.4 billion
Institutional business by client type and region1,3
Client types
• Defined benefit/defined contribution
• Endowment and foundation
• Sovereign wealth fund/government agency
• Institutional platform/insurance subadvisory

2MFS® Institutional International Equity Fund3572-I-MT-18April12.2
Distinguishing characteristics
Experience, teamwork, and long-term focus
What makes us different from other international equity managers?
Experienced investment team • Consistent strategy and approach • Strong track record of managing assets in diverse markets
Integrated global research• Unique, collaborative culture• Fully integrated approach to researching companies combining equity, fixed income and quantitative analysis• Fundamental, bottom-up stock selection drives alpha
Multi-year investment horizon• Seeks companies with above-average sustainable growth and returns, with below-average risk• Aims for low turnover, low volatility

Experienced MFS Institutional International Equity Fund team
Marcus SmithPortfolio Manager
21 years industry experience
Michael Cantara, CFAInstitutional Portfolio Manager
23 years industry experience
Additional resources
Brett FleishmanInstitutional Portfolio Manager
15 years industry experience
Daniel Ling, CFAPortfolio Manager
13 years industry experience
David MannheimPortfolio Manager
26 years industry experience
Roger MorleyPortfolio Manager
14 years industry experience
Ben Kottler, CFAInstitutional Portfolio Manager
22 years industry experience
Sanjay NatarajanInstitutional Portfolio Manager
15 years industry experience
Kevin BeattyPortfolio Manager
25 years industry experience
Ann Marie CostelloInstitutional Product Manager
23 years industry experience
Victoria HigleyInstitutional Portfolio Manager
17 years industry experience
Ted MaloneyPortfolio Manager
11 years industry experience
Experienced team, deep resources3MFS® Institutional International Equity Fund
3572-I-MT-18April12.3
Peter Loncto, CFAInstitutional Product Manager
16 years industry experience

4MFS® Institutional International Equity Fund3572-I-MT-18April12.4
Risks: The fund may not achieve its objective and/or you could lose money on your investment in the fund. Stock markets and investments in individual stocks arevolatile and can decline significantly in response to issuer, market, economic, political, regulatory, geopolitical and other conditions. Investments in foreign marketsthrough issuers or currencies, can involve greater risk and volatility than U.S. investments due to adverse market, economic, political, regulatory, geopolitical orother conditions.Emerging markets can have less market structure, depth, and regulatory oversight and greater political, social, and economic instability thandeveloped markets. Please see the prospectus for further information on these and other risk considerations.
Investment approach
Goal Construct a diversified, high conviction portfolio of companies with a global footprint that outperforms the MSCI EAFE Index over full market cycles
Philosophy • Companies with above-average returns over the long term have the potential for compounded
growth irrespective of economic conditions • Stocks trading at a discount to their projected value have the potential for multiple expansion• A long-term focus capitalizes on opportunities created by investors with shorter investment horizons
Strategy
• Typically 60 to 80 holdings offering above-average growth potential• Seeks stocks with earnings growth rate of at least 2 times global GDP growth• Price discount to projected long-term growth• Seeks to outperform in a variety of market environments
Seeks to outperform the market through a diversified portfolio of high conviction ideas

5MFS® Institutional International Equity Fund3572-I-MT-18April12.5
Historical consistent performance in diverse markets (USD)
Market return less than -5%
Market return -5% to 0%
Market return 0% to 5%
Market return greater than 5%
Total0
10
20
30
40
Num
ber o
f qua
rters
abo
ve/b
elow
ben
chm
ark
Number of outperforming quarters
Number of underperforming quarters
1 MSCI EAFE with net dividends reinvested. Source: benchmark performance from SPAR, FactSet Research Systems Inc. Based on quarterly returns.
MFS Institutional International Equity Fund (NAV) vs MSCI EAFE1, April 1996 – March 2012
Strategy has added value in a variety of market environments
Average quarterly +2.13% +1.33% +0.95% -0.38% +0.87%relative performance

6MFS® Institutional International Equity Fund3572-I-MT-18April12.6
Investment process overview
Portfolio constructionFundamental researchIdea generation
Identify companies by qualitycharacteristics to determineinvestable universe.
Narrow the universe by looking at names against buy criteria.
Analyst-managed strategies
Research analysts
Global sector teams
Portfolio managers
Free cash flow
Sustainable growth
Risk/return
Relative valuation
Focus on high quality andvaluation.
Evaluate growth/return potential
Determine appropriate valuation
Assess business risks
750 – 850 stocks rated by non-U.Sanalyst team
300 to 400 buy candidates
150 to 200 stocks that fit investment approach
Quantitative analysis
High conviction ideaswith sustainable
growth and returnprospects
60 to 80 holdings
Risk management at all stages
Evaluate long-term risk/reward trade off through a rigorous investment process
MFS InstitutionalInternational Equity Fund

7MFS® Institutional International Equity Fund3572-I-MT-18April12.7
Portfolio constructionFundamental researchIdea generation
Global research platform
Depth and collaboration provide competitive advantages
Tokyo
Sydney
London
Mexico City
BostonToronto
Singapore
As of 31-Dec-11.
84 research analysts25 U.S. equity; 33 non-U.S. equity; 26 fixed-income; backed by 20research/investmentassociates
8 global sector teamsorganized by region and sectors; cross-bordercollaboration
11 analyst-managedstrategiesUSD 23.9 billion inassets undermanagement
59 portfolio managerswith significant industryexperience in value,core, growth, and fixedincome
Quantitative screens11 quantitative analystsprovide proprietaryresearch models, stockrankings, and scenariotesting; backed by 11quantitative researchassociates
MFS InstitutionalInternational Equity Fund

8MFS® Institutional International Equity Fund3572-I-MT-18April12.8
Portfolio constructionFundamental researchIdea generation
• Sustainability of business model• Market share/pricing power• Industry growth rates/barriers to entry• Management strength• Free cash flow
• Change in supply/demand• Competitive pressure• Relative strength vs. competition• Potential for loss of competitive
advantage• Scale of risk• Political and macroeconomic factors
• Examine a broad range of outcomes• Reflect future growth and returns• Consider multiple metrics of valuation• Assess value relative to history,
peers, market
Evaluate growth and return potential Assess business risks Determine appropriate valuation
Stock analysis
Seek sustainable business models with valuations that reflect risks
MFS InstitutionalInternational Equity Fund

9MFS® Institutional International Equity Fund3572-I-MT-18April12.9
Portfolio construction
Portfolio constructionFundamental researchIdea generation
Buy criteria
• Earnings growth rate of at least 2times global GDP growth
• Return on capital exceeds cost of capital
• Strong free cash flow generation
Sell discipline
• Target price reached• Better alternative available• Change in company fundamentals
Portfolio
• 60 to 80 holdings• Typical portfolio exposures have been:
- Average position size = 1% to 2% of portfolio- Maximum position size = 5% of portfolio- Emerging markets < 15% of portfolio- Unconstrained country/sector weights
• Senior management semiannual risk review- Portfolio vs. objectives
Employ multi-year investment horizon to exploit market inefficiencies 24464.1
MFS InstitutionalInternational Equity Fund

10MFS® Institutional International Equity Fund3572-I-MT-18April12.10
Highconviction
ideas
Idea generation
Fundamental research
Portfo
lio construction
MFS International Equity
Outcome: diversified mix of high conviction ideas
• 60 to 80 holdings offeringabove-average growth potential
• Seeks stocks with earningsgrowth rate of at least 2 timesglobal GDP growth
• Price discount to projectedlong-term growth
• Seeks to outperform in a varietyof market environments
Portfolio constructionFundamental researchIdea generation
Seeks to generate above-market returns over the long term
MFS InstitutionalInternational Equity Fund

11MFS® Institutional International Equity Fund3572-I-MT-18April12.11
0.7% cash and other assets are less liabilities.
As of 29-Feb-12 Portfolio (%) Underweight/overweight (%) Largest holdingsMSCI EAFE Index (%)
Consumer Staples 15.9 9.0 Nestle SA, Heineken NV, Danone
Technology 10.4 5.2 SAP AG, Samsung Electronics Co Ltd, Canon
Special Products & Services 6.5 3.3 Compass, Randstad Holding, Amadeus Holding
Retailing 7.6 4.6 Moet Hennessy Louis Vuitton, Lawson, Li & Fung
Basic Materials 11.2 10.0 Linde AG, Shin-Etsu Chemical Co, Air Liquide
Leisure 2.2 2.2 WPP PLC
Transportation 2.2 2.3 Canadian National Railway Co
Industrial Goods & Services 5.1 7.0 Schneider Electric SA, FANUC, Legrand SA
Autos & Housing 3.1 5.9 Denso Corp, Honda Motor Co Ltd
Financial Services 19.7 22.6 HSBC Holdings, Standard Chartered, Julius Baer
Health Care 6.2 9.3 Bayer AG, Roche Holding AG, Merck KGaA
Energy 5.5 8.8 Inpex Corp, Royal Dutch Shell PLC Class A
Utilities & Communications 3.7 9.9 China Unicom Hong Kong Ltd
6.9
5.2
3.2
3.0
1.2
0.0
-0.1
-1.9
-2.8
-2.9
-3.1
-3.3
-6.2
Sector weights

12MFS® Institutional International Equity Fund3572-I-MT-18April12.12
Portfolio (%)
Underweight/overweight (%)
Region and country weights
0.7% cash and other assets are less liabilities.1 Portfolio does not own securities in the following countries: Italy 2.4%; Denmark 1.1%; Norway 1.0%; Belgium 1.0%; and 7 other countries with weights less than 1.0% totaling 2.5%.
Underweight/overweightas of 29-Feb-12 (%) MSCI EAFE Index (%)
~ Europe ex-U.K. 47.1 41.9 5.2^ Netherlands 8.3 2.4 5.9^ France 13.0 9.2 3.8^ Switzerland 11.2 8.3 2.9^ Germany 11.2 8.4 2.8^ Spain 2.8 3.0 -0.2^ Sweden 0.6 3.3 -2.7^ Other 1 0.0 7.3 -7.3~ United Kingdom 19.7 22.6 -2.9~ Japan 13.7 21.4 -7.7~ Asia/Pacific ex-Japan 4.9 13.5 -8.6^ Hong Kong 2.1 3.0 -0.9^ Singapore 0.4 1.8 -1.4^ Australia 2.3 8.6 -6.3^ Other 1 0.0 0.1 -0.1~ Developed - Middle East/Africa 0.0 0.6 -0.6^ Other 1 0.0 0.6 -0.6~ Emerging Markets 11.6 0.0 11.6^ Taiwan 3.1 0.0 3.1^ India 1.9 0.0 1.9^ South Korea 1.8 0.0 1.8^ Brazil 1.8 0.0 1.8^ China 1.5 0.0 1.5^ Czech Republic 0.8 0.0 0.8^ South Africa 0.7 0.0 0.7~ North America 2.3 0.0 2.3^ Canada 2.2 0.0 2.2^ United States 0.1 0.0 0.1
5.2
-2.9
-7.7
-8.6
-0.6
11.6
2.3
Europeex-U.K.
UnitedKingdom
Japan
Asia/Pacificex-Japan
Developed -MiddleEast/Africa
EmergingMarkets
North America

13MFS® Institutional International Equity Fund3572-I-MT-18April12.13
Top 10 portfolio holdings
As of 29-Feb-12 Country Sector Portfolio (%)
Linde AG Germany Basic Materials 3.4 0.3
Nestle SA Switzerland Consumer Staples 3.2 1.9
Heineken NV Netherlands Consumer Staples 3.2 0.1
HSBC Holdings PLC United Kingdom Financial Services 3.0 1.5
LVMH France Retailing 2.6 0.4
Schneider Electric SA France Industrial Goods & Services 2.5 0.3
Shin-Etsu Chemical Co Ltd Japan Basic Materials 2.3 0.2
Canadian National Railway Co Canada Transportation 2.2 .–
Danone France Consumer Staples 2.1 0.4
Air Liquide SA France Basic Materials 2.1 0.4
MSCI EAFE Index (%)

14MFS® Institutional International Equity Fund3572-I-MT-18April12.14
Characteristics
No forecasts can be guaranteed.1 Weighted average.2 Source: Thomson Reuters.3 (Lesser of purchase or sales)/average market value.
As of 29-Feb-12 Portfolio MSCI EAFE
Fundamentals1 IBES long-term earnings per share growth2 10.1% 8.7%
Price/earnings (12 months forward) 12.7x 11.5x
Return on equity (3 year average) 16.1% 14.3%
Market capitalization (USD) 52.3 bn 54.9 bn
Diversification Top 10 holdings 27% 13%
Number of holdings 75 924
Number of countries 20 22
Turnover3 Trailing 1 year turnover 24% –
Risk profile Historical tracking error (10 years) 4.5% –
Information ratio (10 years) 0.51 –

15MFS® Institutional International Equity Fund3572-I-MT-18April12.15
Annual performance (%), as of 31-Mar-12 YTD 2011 2010 2009 2008 2007 2006 2005 2004 2003 2002 MFS Institutional International Equity Fund 14.32 -9.55 10.97 33.12 -34.95 9.11 27.94 12.92 18.86 31.02 -6.57 MSCI EAFE1 10.86 -12.14 7.75 31.78 -43.38 11.17 26.34 13.54 20.25 38.59 -15.94
Excess return 3.46 2.59 3.22 1.34 8.43 -2.06 1.60 -0.62 -1.39 -7.57 9.37
Excess return (%) vs. MSCI EAFE1 3.46 6.09 3.36 4.43 2.67
1Q12 1 Year 3 Years 5 Years 10 Years
14.3210.86
0.32
-5.77
20.4917.13
0.92
-3.51
8.375.70
MFS Institutional International Equity Fund
MSCI EAFE1
Periods greater than 1 year are annualized returns (%), as of 31-Mar-12
Performance at NAV (USD)
Performance data shown represents past performance and is no guarantee of future results. Investment return and principal value fluctuate so yourshares, when sold, may be worth more or less than the original cost; current performance may be lower or higher than quoted. For most recentmonth-end performance, please visit mfs.com.
MFS Institutional Trust Funds are not subject to a sales charge. Source: benchmark performance from SPAR, FactSet Research Systems Inc. Performance results reflect any applicable expense subsidies and waivers in effect during the period shown. Without such subsidies and waivers the fund’s performance results would be less
favorable. All results assume the reinvestment of dividends and capital gains. The performance is as of the date shown; it may not include the fund’s entire investment portfolio and is subjectto change.
1 Performance for MSCI EAFE (net dividend) reflects the deduction of withholding taxes on dividends reinvested.
A proven history of strong relative performance
16MFS® Institutional International Equity Fund3572-I-MT-18April12.16
Distinguishing characteristics
Experience, teamwork, and long-term focus
What makes us different from other international equity managers?
Experienced investment team • Consistent strategy and approach • Strong track record of managing assets in diverse markets
Integrated global research• Unique, collaborative culture• Fully integrated approach to researching companies combining equity, fixed income and quantitative analysis• Fundamental, bottom-up stock selection drives alpha
Multi-year investment horizon• Seeks companies with above-average sustainable growth and returns, with below-average risk• Aims for low turnover, low volatility

17MFS® Institutional International Equity Fund3572-I-MT-18April12.17
Appendix
Contents Tab
Fee schedule (USD) 18
References 19
Portfolio holdings 20
MFS Institutional International Equity Fund team 22
Market review 28
Market capitalization (USD) 30
Historical portfolio weights 31
Quarterly and annual performance summary – at NAV (USD) 33

18MFS® Institutional International Equity Fund3572-I-MT-18April12.18
Vehicle Net expenses
MFS Institutional International Equity Fund1 75 basis points
Fee schedule
1 $3 million minimum. The MFS Institutional Trust net expenses reflect partial fee waivers subsidized by MFS which are subject to annual renewal. In addition, fees reflect an expense offsetarrangement for certain funds which reduce the fund’s custodian fee based upon the amount of cash maintained by the fund with the custodian and dividend disbursing agent. In addition tomanagement fees, other expenses are deducted from fund assets. Please refer to the MFS Institutional Trust prospectus for a complete summary of total expenses.

19MFS® Institutional International Equity Fund3572-I-MT-18April12.19
References
MFS references for the City of Miami General Employees' & Sanitation Employees' Retirement Trust
CLIENT NAME CONTACT PERSON, TITLE PHONE NUMBER EMAIL
City of Pittsburgh Tony Pokura, Assistant Director of Finance (412) 255-2899 [email protected]
City of Los Angeles Department of Water & Power Carlo Manjikian, Investment Officer (213) 367-2324 [email protected]
Hampshire County Retirement System Patrick Brock, Chairman of the Board (413) 584-9100 [email protected]

20MFS® Institutional International Equity Fund3572-I-MT-18April12.20
Portfolio holdings
Cash and other assets are less liabilities.
MarketAs of 29-Feb-12 Country Value (%)
MarketAs of 29-Feb-12 Country Value (%)
Autos & Housing 3.1Denso Corp Japan 1.6Honda Motor Co Ltd Japan 1.4Delphi Automotive PLC United States 0.1Basic Materials 11.2Linde AG Germany 3.4Shin-Etsu Chemical Co Ltd Japan 2.3Air Liquide SA France 2.1Akzo Nobel NV Netherlands 1.6Rio Tinto PLC United Kingdom 1.4Givaudan SA Switzerland 0.4Cash & Other 0.7Consumer Staples 15.9Heineken NV Netherlands 3.2Nestle SA Switzerland 3.2Danone France 2.1Diageo PLC United Kingdom 2.1Pernod-Ricard SA France 1.9Beiersdorf AG Germany 1.8Reckitt Benckiser Group PLC United Kingdom 1.6Energy 5.5Inpex Corp Japan 2.0Royal Dutch ShellPLC Class A United Kingdom 2.0BG Group PLC United Kingdom 0.9CNOOC Ltd China 0.6
Financial Services 19.7HSBC Holdings PLC United Kingdom 3.0Standard Chartered PLC United Kingdom 2.0Julius Baer Group Ltd Switzerland 1.9ING Groep NV Dutch Cert Netherlands 1.7UBS AG Switzerland 1.5ICICI Bank Ltd India 1.3QBE Insurance Group Ltd Australia 1.3Westpac Banking Corp Australia 1.1Banco Santander SA Spain 1.1AIA Group Ltd Hong Kong 1.0BM&FBovespa SA Brazil 0.9Deutsche Boerse AG Germany 0.9Komercni Banka AS Czech Republic 0.8Swiss Re Ltd Switzerland 0.7Barclays PLC United Kingdom 0.7Health Care 6.2Bayer AG Germany 2.0Roche Holding AG Switzerland 1.9Merck KGaA Germany 1.1Sonova Holding AG Switzerland 0.7Synthes Inc Switzerland 0.5Industrial Goods & Services 5.1Schneider Electric SA France 2.5FANUC Corp Japan 1.5Legrand SA France 1.2Keppel Corp Ltd Singapore 0.0

21MFS® Institutional International Equity Fund3572-I-MT-18April12.21
Portfolio holdings (continued)
Cash and other assets are less liabilities.
Leisure 2.2WPP PLC United Kingdom 1.8Wolters Kluwer NV Netherlands 0.4Retailing 7.6LVMH Moet HennessyLouis Vuitton SA France 2.6Lawson Inc Japan 1.5Li & Fung Ltd Hong Kong 1.2Hennes & Mauritz AB Sweden 0.6Cie Financiere Richemont SA Switzerland 0.5Tesco PLC United Kingdom 0.5Burberry Group PLC United Kingdom 0.5Special Products & Services 6.5Compass Group PLC United Kingdom 1.8Amadeus IT Holding SA Spain 1.3Randstad Holding NV Netherlands 1.3Smiths Group PLC United Kingdom 1.0Infosys Ltd India 0.7Hays PLC United Kingdom 0.4Technology 10.4SAP AG Germany 2.0Samsung Electronics Co Ltd South Korea 1.8Canon Inc Japan 1.7Taiwan SemiconductorManufacturingCo Ltd ADR Taiwan 1.5Hoya Corp Japan 1.2Hon Hai PrecisionIndustry Co Ltd Taiwan 1.0
Dassault Systemes SA France 0.6HTC Corp Taiwan 0.6Transportation 2.2Canadian National Railway Co Canada 2.2Utilities & Communications 3.7China Unicom Hong Kong Ltd China 0.8Tim Participacoes SA ADR Brazil 0.8MTN Group Ltd South Africa 0.7NTT DoCoMo Inc Japan 0.5Red Electrica Corp SA Spain 0.5SingaporeTelecommunications Ltd Singapore 0.4
MarketAs of 29-Feb-12 Country Value (%)
MarketAs of 29-Feb-12 Country Value (%)

22MFS® Institutional International Equity Fund3572-I-MT-18April12.22
MFS Institutional International Equity Fund team
Marcus L. Smith - Investment Officer- Director of Equity – Asia, Equity Portfolio Manager- Serves on MFS Global Equity Management Committee.- As a Non-U.S. Equity Portfolio Manager, responsible for final buy and sell decisions, portfolio
construction, risk and cash management. Participates in the research process and strategy discussions.- Joined MFS in 1994; previous positions include Director of Asian Research.- Previous experience includes 4 years as Senior Consultant, Financial Services Group at
Andersen Consulting.- University of Pennsylvania, MBA- University of Mount Union, BS, cum laude
Daniel T. Ling, CFA - Investment Officer- Equity Portfolio Manager- As a Non-U.S. Equity Portfolio Manager, responsible for final buy and sell decisions, portfolio
construction, risk and cash management. Participates in the research process and strategy discussions.- Joined MFS in 2006.- Previous experience includes 6 years as Investment Manager at Lion Global Investors; 1 year as
Process Analyst at Accenture.- Affiliations include CFA Institute.- Nanyang Technological University, BA

Michael T. Cantara, CFA - Investment Officer- Institutional Equity Portfolio Manager- As an Institutional Portfolio Manager, participates in the research process and strategy discussions.
Assesses portfolio risk, customizes portfolios to client objectives and guidelines, and manages dailycash flows. Communicates investment policy, strategy, and positioning.
- Joined MFS in 2000; previous positions include Investment Product Manager.- Previous experience includes 3 years as International Portfolio Analyst and 5 years as Director, Stable
Value Investments at Fidelity Management Trust Company; 2 years as Business Analyst at FidelityInstitutional Retirement Services Co.
- Co-Chairman of the MFS Responsible Investing Committee- Affiliations include Boston Security Analysts Society, Inc., CFA Institute.- Tufts University, The Fletcher School of Law and Diplomacy, MA- Colby College, BA
Brett A. Fleishman - Investment Officer- Institutional Equity Portfolio Manager- As an Institutional Portfolio Manager, participates in the research process and strategy discussions.
Assesses portfolio risk, customizes portfolios to client objectives and guidelines, and manages dailycash flows. Communicates investment policy, strategy, and positioning.
- Joined MFS in 2001; previous positions include Investment Specialist; Senior Associate InvestmentSpecialist; Equity Research Analyst.
- Previous experience includes 2 years as Senior Consultant at Ernst & Young LLP, EconomicsConsulting Group; 2 years as Research Analyst at Industrial Economics, Inc.
- University of Pennsylvania, MBA- Brandeis University, BA, Phi Beta Kappa, magna cum laude
MFS Institutional International Equity Fund team (continued)
23MFS® Institutional International Equity Fund3572-I-MT-18April12.23

24MFS® Institutional International Equity Fund3572-I-MT-18April12.24
David R. Mannheim - Investment Officer- Equity Portfolio Manager- Serves on MFS Global Equity Management Committee.- As a Global Equity Portfolio Manager, responsible for final buy and sell decisions, portfolio construction,
risk and cash management. Participates in the research process and strategy discussions.- Joined MFS in 1988; previous positions include Equity Research Analyst.- Previous experience includes 4 years as Lending Officer at Mid Atlantic National Bank.- Massachusetts Institute of Technology, MSM- Amherst College, BA
Kevin Beatty - Investment Officer- Director of Equity – North America, Equity Portfolio Manager- Serves on MFS Equity Management Committee.- As a Core Equity Portfolio Manager, responsible for final buy and sell decisions, portfolio construction,
risk and cash management. Participates in research process and strategy discussions.- Joined MFS in 2002; previous positions include Director of U.S. Research; Equity Research Analyst.- Previous experience includes 3 years as Equity Analyst/Sector Head at State Street Research &
Management; 1 year as Investment Research Analyst at Fleet Investment Advisors.- Babson College, MBA- St. Bonaventure University, BA
MFS Institutional International Equity Fund team additional resources
25MFS® Institutional International Equity Fund3572-I-MT-18April12.25
Roger M. Morley - Investment Officer- Equity Portfolio Manager- As an Equity Portfolio Manager responsible for final buy and sell decisions, portfolio construction,
risk and cash management. Participates in the research process and strategy discussions.- Joined MFS in 2002; previous positions include Global Equity Research Analyst.- Previous experience includes 3 years as Associate – Healthcare Group at Deutsche Bank AG –
Global Investment Banking; 2 years as Financial Analyst – Technology and Media Group at Alex. Brown& Sons.
- INSEAD, MBA, with distinction- University of Cambridge, MA
Ted Maloney - Investment Officer- Equity Portfolio Manager, Director of Research - US- Serves on MFS Equity Management Committee.- As an Equity Portfolio Manager responsible for final buy and sell decisions, portfolio construction, risk
and cash management. Participates in the research process and strategy discussions.- Joined MFS in 2005; previous positions include Equity Research Analyst.- Previous experience includes 2 years as Analyst, Founding Partner at Lyceum Capital, LP; 2 years as
Research Associate at Fidelity Management & Research Company.- Bowdoin College, AB, magna cum laude
MFS Institutional International Equity Fund team additional resources (continued)

26MFS® Institutional International Equity Fund3572-I-MT-18April12.26
Ben Kottler, CFA - Investment Officer- Institutional Equity Portfolio Manager- As an Institutional Portfolio Manager, participates in the research process and strategy discussions.
Assesses portfolio risk, customizes portfolios to client objectives and guidelines, and manages dailycash flows. Communicates investment policy, strategy, and positioning.
- Joined MFS in 2005; positions include Investment Specialist.- Previous experience includes 4 years as Senior International Portfolio Manager at State Street Global
Advisors; 4 years as European Portfolio Manager & Analyst at Brown Brothers Harriman; 7 years as UKPortfolio Manager & Analyst at NatWest Investment Management.
- Affiliations include CFA Institute, CFA Society of the U.K.- Durham University, BA
Victoria Higley, ASIP - Investment Officer- Institutional Equity Portfolio Manager- As an Institutional Portfolio Manager, participates in the research process and strategy discussions.
Assesses portfolio risk, customizes portfolios to client objectives and guidelines, and manages dailycash flows. Communicates investment policy, strategy, and positioning.
- Joined MFS in 2011.- Previous experience includes 3 years as UK Institutional Client Director at Fidelity International;
14 years as a UK Institutional Client Director, Pan European Equity Analyst, and UK Portfolio Managerat UBS Asset Management ( formerly Phillips & Drew).
- Affiliations include regular member of the CFA Institute, CFA Society of the UK.- Durham University, BA
MFS Institutional International Equity Fund team additional resources (continued)

27MFS® Institutional International Equity Fund3572-I-MT-18April12.27
MFS Institutional International Equity Fund team additional resources (continued)
Sanjay Natarajan - Investment Officer- Institutional Equity Portfolio Manager- As an Institutional Portfolio Manager, participates in the research process and strategy discussions.
Assesses portfolio risk, customizes portfolios to client objectives and guidelines, and manages dailycash flows. Communicates investment policy, strategy, and positioning.
- Joined MFS in 2007.- Previous experience includes 5 years as Chief Operating Officer, Corporate and Investment Banking at
DBS Bank Ltd; 4 years as Senior Engagement Manager at McKinsey & Co. Inc.; 1 year as ExecutiveDirector at K1 Ventures Limited; 2 years as Senior Officer, Strategic Planning at SingaporeGovernment.
- Harvard University, AM- Dartmouth College, BA, Phi Beta Kappa, magna cum laude
Ann Marie Costello - Director, Institutional Product Management- As an Institutional Product Manager, communicates investment policy, strategy and tactics, performs
portfolio analysis and leads institutional product development.- Joined MFS in 2001.- Previous experience includes 13 years as Senior Product Manager, Investment Specialist,
Senior Statistical Analyst – Performance and Analytics, and Supervisor – Institutional Accounting atPutnam Investments.
- Suffolk University, MBA- University of Massachusetts, BS
Peter D. Loncto, CFA - Director, Institutional Product Management - As an Institutional Product Manager, communicates investment policy, strategy and tactics, performs
portfolio analysis and leads institutional product development. - Joined MFS in 2007. - Previous experience includes 5 years as Senior Marketing Manager at Nicholas-Applegate Capital
Management; 3 years as Performance Analyst at State Street Bank and Trust Company. - Originally joined MFS in 1997 and departed the firm in 1999 to attend graduate school. Rejoined MFS
in 2007. - Affiliations include CFA Institute, Boston Security Analysts Society, Inc. - Cornell University, MBA - Boston College, BA

28MFS® Institutional International Equity Fund3572-I-MT-18April12.28
MFS International Equity strategy emerging market exposure
Feb-
2005
Apr-2
005
Jun-
2005
Aug-
2005
Oct
-200
5D
ec-2
005
Feb-
2006
Apr-2
006
Jun-
2006
Aug-
2006
Oct
-200
6D
ec-2
006
Feb-
2007
Apr-2
007
Jun-
2007
Aug-
2007
Oct
-200
7D
ec-2
007
Feb-
2008
Apr-2
008
Jun-
2008
Aug-
2008
Oct
-200
8D
ec-2
008
Feb-
2009
Apr-2
009
Jun-
2009
Aug-
2009
Oct
-200
9D
ec-2
009
Feb-
2010
Apr-2
010
June
-201
0Au
g-20
10O
ct-2
010
Dec
-201
0Fe
b-20
11Ap
r-201
1Ju
n-20
11Au
g-20
11O
ct-2
011
Dec
-201
1
0
2
4
6
8
10
12
5
10
15
20
25
% o
f por
tfolio
ass
ets
Trai
ling
P/E
ratio
Emerging markets exposure (left axis) Trailing P/E ratio (right axis)
Source: Bernstein Research December 2011.Data prior to 30-Jun-10 reflects market value, and is not based on equivalent exposure, which may differ.

29MFS® Institutional International Equity Fund3572-I-MT-18April12.29
Emerging market and developed markets valuation and growth
1989 1991 1993 1995 1997 1999 2001 2003 2005 2007 2009 20110.2
0.4
0.6
0.8
1.0
1.2
1.4
1989 1991 1993 1995 1997 1999 2001 2003 2005 2007 2009 20110
4
8
12
16
Perc
ent (
%)
EAFE MSCI Emerging Markets
Price-to-trailing earnings EM relative to EAFE, through 31-Dec-11
Implied 10-year earnings growth rate, through 31-Dec-11
Source: Bernstein Research December 2011.
EM more expensive then EAFE
EAFE more expensive then EM

30MFS® Institutional International Equity Fund3572-I-MT-18April12.30Cinprogress1Q
Market capitalization (USD)
As of 31-Dec-11
0 – 1 bn 1 – 5 bn 5 – 10 bn 10 – 50 bn 50 – 100 bn 100 bn +
% o
f por
tfolio
0.0 0.0 0.3
9.013.7 12.8
50.6
41.6
21.9 19.612.6
17.0
Portfolio
Benchmark
Small-cap Mid-cap Large-cap
Weighted average market cap (USD billions)Portfolio 47.5MSCI EAFE 51.9
31MFS® Institutional International Equity Fund3572-I-MT-18April12.31
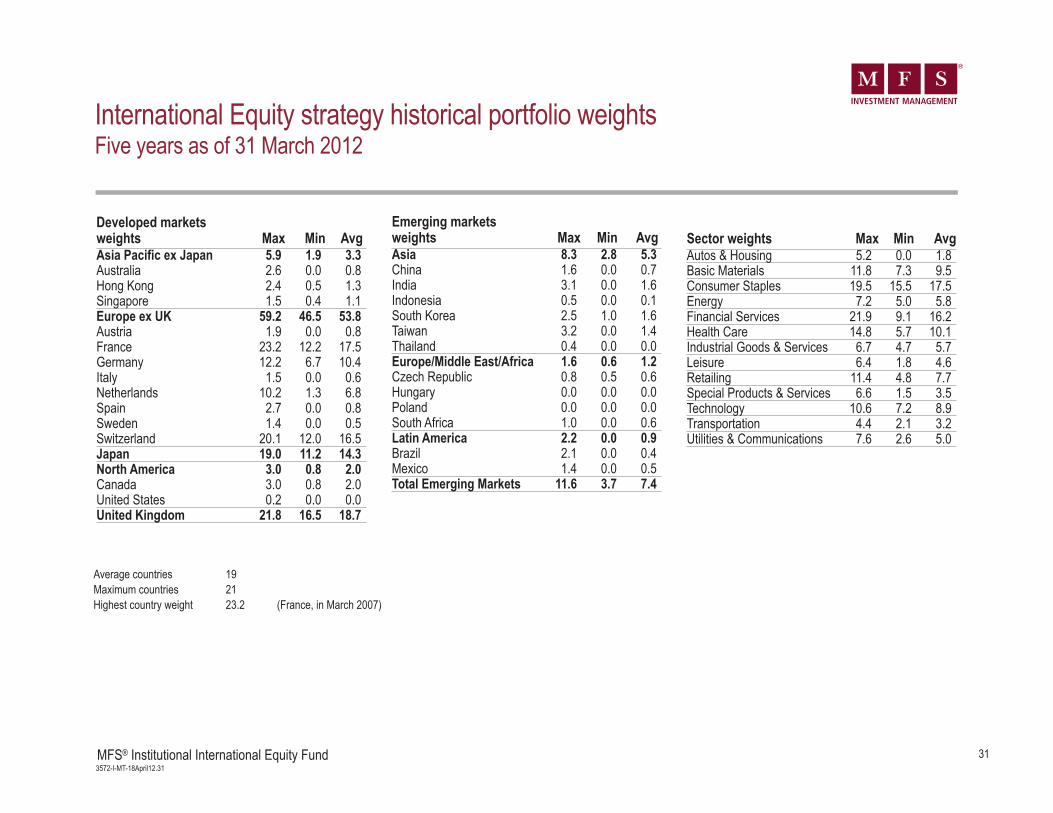
Average countries 19 Maximum countries 21 Highest country weight 23.2 (France, in March 2007)
International Equity strategy historical portfolio weightsFive years as of 31 March 2012
Sector weights Max Min AvgAutos & Housing 5.2 0.0 1.8Basic Materials 11.8 7.3 9.5Consumer Staples 19.5 15.5 17.5Energy 7.2 5.0 5.8Financial Services 21.9 9.1 16.2Health Care 14.8 5.7 10.1Industrial Goods & Services 6.7 4.7 5.7Leisure 6.4 1.8 4.6Retailing 11.4 4.8 7.7Special Products & Services 6.6 1.5 3.5Technology 10.6 7.2 8.9Transportation 4.4 2.1 3.2Utilities & Communications 7.6 2.6 5.0
Developed markets weights Max Min AvgAsia Pacific ex Japan 5.9 1.9 3.3Australia 2.6 0.0 0.8Hong Kong 2.4 0.5 1.3Singapore 1.5 0.4 1.1Europe ex UK 59.2 46.5 53.8Austria 1.9 0.0 0.8France 23.2 12.2 17.5Germany 12.2 6.7 10.4Italy 1.5 0.0 0.6Netherlands 10.2 1.3 6.8Spain 2.7 0.0 0.8Sweden 1.4 0.0 0.5Switzerland 20.1 12.0 16.5Japan 19.0 11.2 14.3North America 3.0 0.8 2.0Canada 3.0 0.8 2.0United States 0.2 0.0 0.0United Kingdom 21.8 16.5 18.7
Emerging markets weights Max Min AvgAsia 8.3 2.8 5.3China 1.6 0.0 0.7India 3.1 0.0 1.6Indonesia 0.5 0.0 0.1South Korea 2.5 1.0 1.6Taiwan 3.2 0.0 1.4Thailand 0.4 0.0 0.0Europe/Middle East/Africa 1.6 0.6 1.2Czech Republic 0.8 0.5 0.6Hungary 0.0 0.0 0.0Poland 0.0 0.0 0.0South Africa 1.0 0.0 0.6Latin America 2.2 0.0 0.9Brazil 2.1 0.0 0.4Mexico 1.4 0.0 0.5Total Emerging Markets 11.6 3.7 7.4

32MFS® Institutional International Equity Fund3572-I-MT-18April12.32
Relative annual historical sector allocations
MFS minus MSCI EAFE sector weights
ConsumerStaples
Leisure
HealthCare
Retailing
IndustrialGoods & Services
Tech-nology
BasicMaterials
Transpor-tation
Energy
Utilities &Communi-
cations
Autos &Housing
SpecialProducts
& Services
FinancialServices
-14
-12
-10
-8
-6
-4
-2
0
2
4
6
8
10
12
14
16
% o
f Por
tfolio
Dec-2003
Dec-2004
Dec-2005
Dec-2006
Dec-2007
Dec-2008
Dec2009
Dec2010
Dec2011
Overweight
Underweight
Data prior to 30-Jun-10 reflects market value, and is not based on equivalent exposure, which may differ.

33MFS® Institutional International Equity Fund3572-I-MT-18April12.33
Performance data shown represents past performance and is no guarantee of future results. Investment return and principal value fluctuate so yourshares, when sold, may be worth more or less than the original cost; current performance may be lower or higher than quoted. For most recentmonth-end performance, please visit mfs.com.
MFS Institutional Trust Funds are not subject to a sales charge. Source: benchmark performance from SPAR, FactSet Research Systems, Inc. Past performance is no guarantee of future results.1 Performance for MSCI EAFE (net dividend) reflects the deduction of withholding taxes on dividends reinvested.
Quarterly and annual performance summaryNet (NAV) (USD)
1Q 2Q 3Q 4Q Year2012 MFS Institutional International Equity Fund 14.32% 2012 MSCI EAFE1 10.862011 MFS Institutional International Equity Fund 3.07 3.89% -20.30% 5.98% -9.55%2011 MSCI EAFE1 3.36 1.56 -19.01 3.33 -12.142010 MFS Institutional International Equity Fund 0.92 -12.15 16.24 7.68 10.972010 MSCI EAFE1 0.87 -13.97 16.48 6.61 7.752009 MFS Institutional International Equity Fund -12.69 19.38 21.13 5.44 33.122009 MSCI EAFE1 -13.94 25.43 19.47 2.18 31.782008 MFS Institutional International Equity Fund -4.94 -2.57 -15.57 -16.81 -34.952008 MSCI EAFE1 -8.91 -2.25 -20.56 -19.95 -43.382007 MFS Institutional International Equity Fund 3.56 5.24 1.89 -1.74 9.112007 MSCI EAFE1 4.08 6.40 2.18 -1.75 11.172006 MFS Institutional International Equity Fund 9.92 1.48 6.09 8.12 27.942006 MSCI EAFE1 9.40 0.70 3.93 10.35 26.342005 MFS Institutional International Equity Fund -0.13 -2.15 11.18 3.93 12.922005 MSCI EAFE1 -0.17 -1.01 10.38 4.08 13.542004 MFS Institutional International Equity Fund 3.70 1.17 -0.14 13.45 18.862004 MSCI EAFE1 4.34 0.22 -0.28 15.32 20.252003 MFS Institutional International Equity Fund -7.34 16.45 4.57 16.12 31.022003 MSCI EAFE1 -8.21 19.27 8.13 17.08 38.592002 MFS Institutional International Equity Fund 1.99 -0.34 -14.10 7.01 -6.572002 MSCI EAFE1 0.51 -2.12 -19.73 6.45 -15.942001 MFS Institutional International Equity Fund -12.40 3.67 -10.28 6.92 -12.882001 MSCI EAFE1 -13.71 -1.04 -14.00 6.97 -21.44