city of newburyport joint budget meeting city council ... · city charter, section 6-2: annual...
TRANSCRIPT

City of Newburyport Joint Budget Meeting
City Council & School Committee
Mayor Donna D. Holaday
Superintendent Sean T. Gallagher
November 19, 2019

Purpose
City Charter, Section 6-2: Annual Budget Meeting
The mayor shall call a joint meeting of the city council and school committee, to include the superintendent of schools, before the commencement of the annual budget process to review the financial condition of the city, revenue and expenditure forecasts, and other relevant information prepared by the mayor in order to develop a coordinated budget.
2

City’s Fiscal Condition

$42.0MEducation
$4.8M Fire/Rescue
$5.2M Police
$4.0M Capital Investments
$4.0M Public Works
$3.3M City Government
$1.7M Library
$1.7M Solid Waste Collection
$733K
Planning/
Building
$444K
Parks$389K
Health
$376
COA
$360
NYS
$321K
Vets
Svcs
City of Newburyport’s FY2020 Budget

FY2020 Budgeted Spending
General Administration3.8%
Finance1.3%
Public Safety14.1%
Public Services4.5%
Planning & Development1.4%
Social Services3.3%
Benefits(Non-School)
9.6%
Capital/Debt(Non-School)
2.3%
School Budget43.8%
Vocational Schools1.1%Capital/Debt
4.0%Benefits
10.7%
Education59.7%
Total General Fund Budget: $70,434,393 5

FY2020 Estimated Revenue
Property Taxes84.0%
Local Receipts
8.0%
Net State Aid6.5%
Parking Fund1.5%
Total General Fund Revenue: $70,486,906 6
Reserves & Liabilities
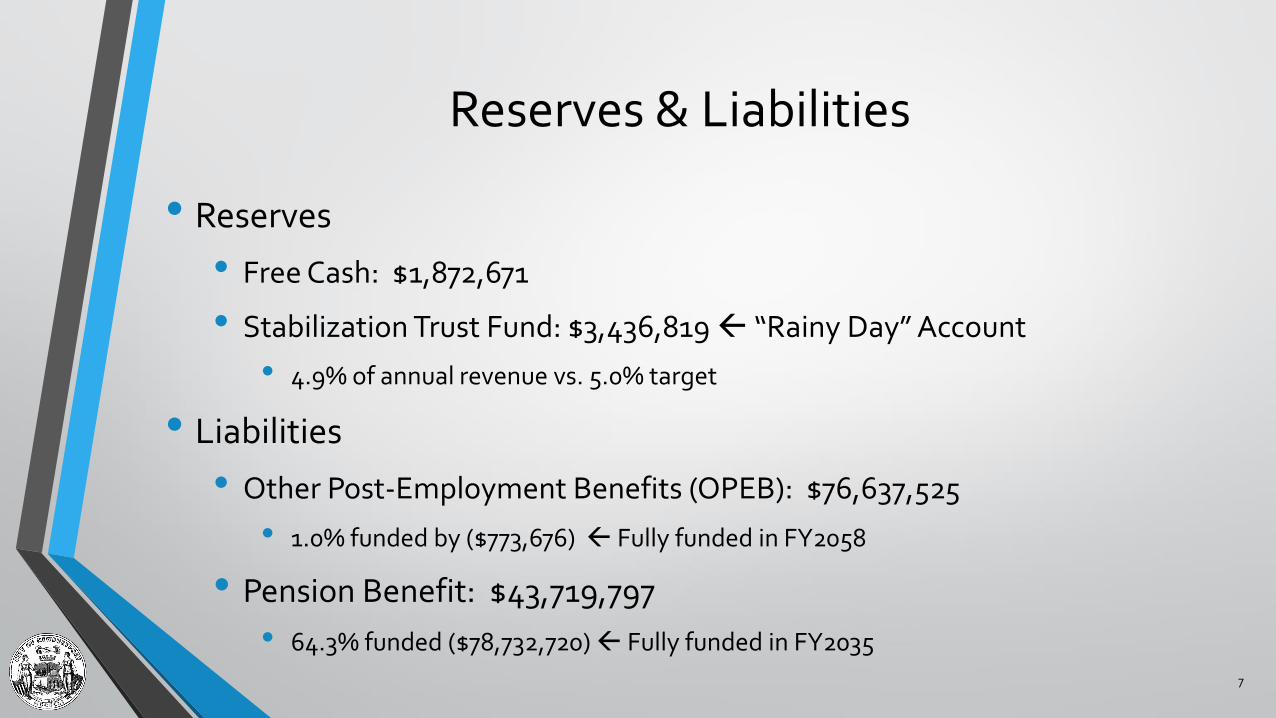
• Reserves
• Free Cash: $1,872,671
• Stabilization Trust Fund: $3,436,819 “Rainy Day” Account
• 4.9% of annual revenue vs. 5.0% target
• Liabilities
• Other Post-Employment Benefits (OPEB): $76,637,525
• 1.0% funded by ($773,676) Fully funded in FY2058
• Pension Benefit: $43,719,797
• 64.3% funded ($78,732,720) Fully funded in FY2035
7

Per Pupil Spending Analysis

Per Pupil Spending Analysis
• Using data from the Department of Elementary & Secondary Education (DESE)
• Looked at districts with high accountability scores (> 70) and lower per pupil spending compared to Newburyport (< $16,852)
14 Districts
9

Spending by Category
$562
$2,240
$515
$905
$346
$1,119
$119
$1,286$1,160
$535
$3,363
$494
$1,042
$367
$962
$187
$1,424
$1,091
$0
$500
$1,000
$1,500
$2,000
$2,500
$3,000
$3,500
Administration Insurance,Retirement
Programs andOther
Guidance,Counseling and
Testing
InstructionalLeadership
InstructionalMaterials,
Equipment andTechnology
Operations andMaintenance
ProfessionalDevelopment
Pupil Services Other TeachingServices
Sample Districts Newburyport
$6,202
$6,698
$5,000
$6,000
$7,000
Teachers
Newburyport
14 Sample Districts
Newburyport spends $2.51 million more on health insurance than the 14
sample districts and $1.72 million more than the statewide average
10

$0
$10,000
$20,000
$30,000
$40,000
$50,000
$60,000
$70,000
$80,000
$90,000
$100,000
$110,000 Salary Health Insurance
Teacher Compensation
Including health insurance costs covered by the employer, a Newburyport teacher’stotal compensation is $2,048 higher than the 14 sample districts
Newburyport+$2,048
11
$93,780

Teacher Take Home Pay
12(Before Withholdings/Taxes)
23% of Compensation
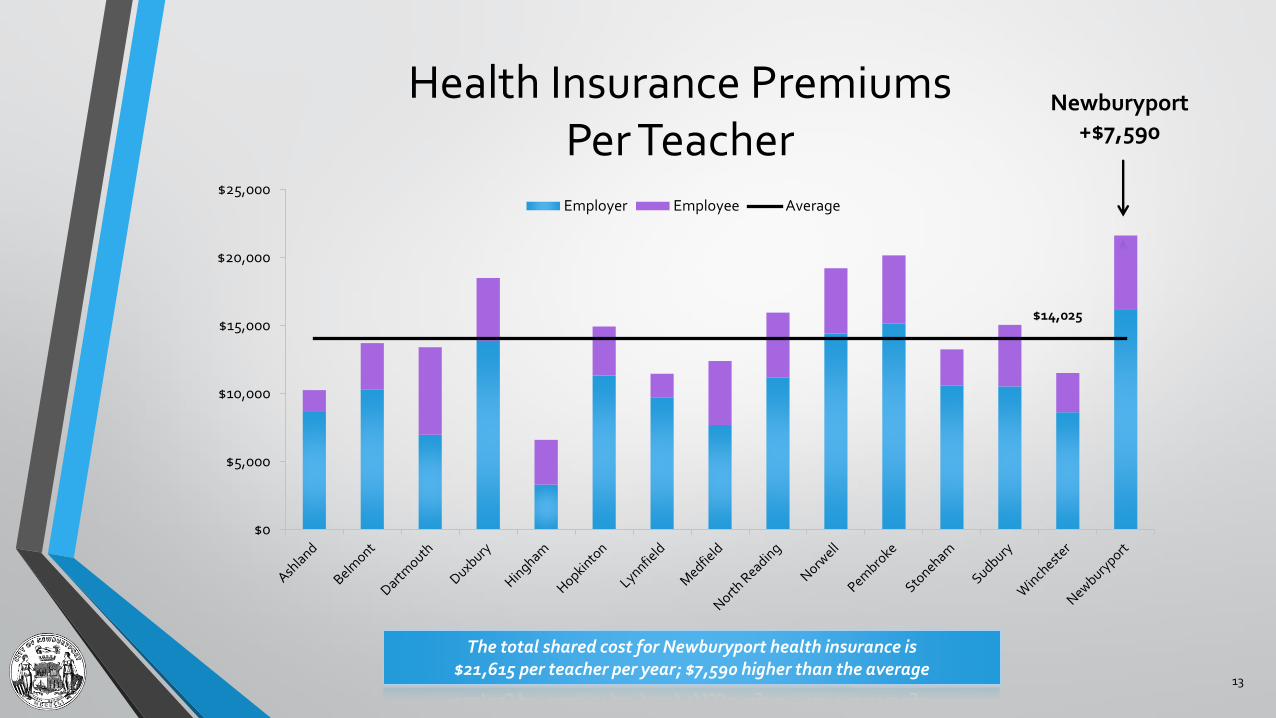
Health Insurance PremiumsPer Teacher
$0
$5,000
$10,000
$15,000
$20,000
$25,000Employer Employee Average
$14,025
The total shared cost for Newburyport health insurance is $21,615 per teacher per year; $7,590 higher than the average
Newburyport+$7,590
13

21%25%
48%
25%
50%
19%15%
38%
30%25% 25%
20%
30%25% 25%
12%
25%
0%
0%
0%
31%
11%
12%
20%
13%
25%
0%
15% 25%
0%
HMO Additional Contribution For PPO Average HMO Average PPO
Employee’s Share of Health Insurance Costs
42%
28%
Requiring an additional contribution for the PPO plan incentivizes employees to switch to the HMO; resulting in, on average, lower costs for the employee and employer
Newburyport
14

Summary of Analysis
• Adopting a health insurance plan similar to most other communities in MA will:
• Be mutually beneficial for employees and the employee by reducing the high premium that is paid by both parties
• Allow the district to put in place a more attractive compensation package (that increases teachers take home pay)
• Free up budget capacity to enhance programs
15

Newburyport Public Schools

Budgeted Expenditures FY20
Other Fixed Costs 1.6%
Employee Benefits 1.7%
Leadership & Administration 6%
Operations/Maintenance 6.6%
Pupil Services 10.4%
Out-of-District Education 10.7%
Instructional Services 63%
FY20 Budgeted Expenses
• Instructional Services; Instructional leadership, classroom and specialist teachers, professional development, guidance, counseling & testing, instructional materials, equipment and technology.
• Out-of-District Education; Payment for out-of-district student tuition and transportation (special education).
• Pupil Services; Transportation (in-district), food services, athletics and other student activities, school security, medical and health services.
• Operations & Maintenance; Maintenance of building & grounds, heating, utilities, custodial services, technology maintenance and building security systems.
• Leadership & Administration; School committees, superintendent, assistant, business & finance, human resources, legal services and settlements, district-wide information management & technology, other district-wide administration.
• Employee Benefits; Retirement contributions, insurance for current and retired employees, employment separation costs.
• Other Fixed Costs; Crossing guards, non-employee insurance & other fixed charges
(data based on FY20 budgeted expenses)
17

FY20 Salary / Expense Allocation
Budget $34,369,718
Salaries Fixed Costs Sped Non-Salary Maintenance Remaining
* Misc. Expenses - Textbooks, supplies & materials, equipment….
Salaries 74.1%
18

Revenue SourcesFY17
BudgetedFY17 Actual
Rec’dFY18
BudgetedFY18 Actual
Rec’dFY19
BudgetedFY19
Actual Rec’dFY20
Budgeted
City Allocations
$27,402,232 $27,402,232 $28,651,701 $28,651,701 $29,850,374 $29,850,374 $30,875,762
Choice Tuition $546,341 $508,545.84 $94,453 $95,866 $131,507 $169,676 $122,747
Choice FB $494,379 -$306,764 (returned to
DESE)
$618,802 0 $350,000 0 $580,170
ChoiceEducatius
0 0 0 0 0 $123,750 0
Circuit Breaker $527,000 $674,529 $641,505 $610,132 $834,400 $937,691 $902,299
Circuit Breaker Extra Relief
0 0 0 $253,495 0 0 0
Athletics $275,000 $305,884 $275,000 $324,680 $275,000 $324,518 $296,500
Transportation $200,000 $197,126 $200,000 $196,704 $200,000 $195,170 $200,000
Kindergarten $375,000 $386,203 $375,000 $306,485 $426,740 $355,492 $379,240
Pre-School $211,000 $236,771 $250,000 $280,080 $200,000 $248,497 $200,000
Title I $150,000 $150,000 $191,389 $191,389 $200,000 $200,000 $200,000
ABLE $500,000 $500,000 $500,000 $500,000 $500,000 $500,000 $500,000
Totals $30,680,952 $30,054,526 $31,797,850 $31,410,532 $32,968,021 $32,905,168 $34,256,718
19

Other Federal & State GrantsFY17 FY18 FY19 FY20 Projected
Youth Opioid Prev. Grant
0 $10,875 0 0
Early Childhood SPED $11,669 $11,083 $11,581 $11,894
SPED ProgramImprovement
$19,462 0 0 0
Improving EducatorQuality (Title IIA)
$39,388 $53,117 $67,027 $62,251
Enhanced SchoolHealth Services
$77,760 $75,333 $75,333 $75,000
EEC ProgramImprovement
$1,400 0 0 0
Title III Grant 0 $16,771 0 0
Title IV Grant 0 $5,327 $15,718 $19,810
Puerto Rico Hurricane Relief Fund
0 0 $4,111 0
Totals $149,679 $172,506 $173,770 $168,955
Private GrantsFY17 FY18 FY19 FY20 Projected
Swasey $92,758 $242,170 $276,661 $173,000
NEF $330,753 $295,931 $305,187 $331,233
Total Private $423,511 $538,101 $581,848 $504,233
20

School Choice Revenue
Revenue
FY03 $ 1,504,950
FY04 $ 1,471,452
FY05 $ 1,484,034
FY06 $ 1,445,073
FY07 $ 1,336,129
FY08 $ 1,036,983
FY09 $ 958,647
FY10 $ 809,729
FY11 $ 1,001,859
FY12 $ 1,067,833
FY13 $ 1,080,851
FY14 $ 900,327
FY15 $ 727,472
FY16 $ 641,809
FY17 $ 201,781
FY18 $ 94,453
FY19 $ 124,126
This report shows the revenue received from Choice over the past 15 years. We were continuing to show a significate decrease in revenue since FY13 due to enrollment, however in FY19 the revenue increased slightly due to added openings.
Our current Choice numbers are as follows; (17)
Grade 2 1Grade 4 3Grade 7 3Grade 9 1Grade 10 8Grade 11 1
21

Special Education Costs
$0
$2,000,000
$4,000,000
$6,000,000
$8,000,000
$10,000,000
$12,000,000
FY16 FY17 FY18 FY19 FY20 Budgeted
Tution Transportation Staffing Total Program Costs
TuitionFY16: $2,189,468FY17: $1,847,968FY18: $2,327,569FY19: $2,711,035FY20: $3,019,027 budgeted
TransportationFY16: $548,730FY17: $474,319FY18: $585,643FY19: $590,978FY20: $667,040 budgeted
StaffingFY16: $4,669,047FY17: $4,823,503FY18: $5,668,838FY19: $5,889,736FY20: $6,003,730 budgeted
Total Program CostsFY16: $7,914,445FY17: $7,769,048FY18: $8,582,050FY19: $9,191,749FY20: $9,689,797 budgeted
22

Student Enrollment 2015 -2019
• All Student Enrollment
• Economically Disadvantaged
• Students with Disabilities
• English Learners
2,3522,293 2,295
2,2692,232
2015 2016 2017 2018 2019
7.4% 8.0% 9.0% 9.9%8.2%
12.4% 13.6% 15.3% 16.2% 17.1%
0.9%1.1%
0.9%1.2% 1.7%
Enrollment 2015 2016 2017 2018 2019
Econ Disadv 174 183 206 225 182SWD 295 316 355 375 387EL 21 25 20 28 38
DESE SIMMS Reporting23

A Look Into The Future – Themes
• Safety / Facilities / School Culture
• Quality Teachers & Staff / Professional Development
• Rigorous Curriculum
• Special Education
• SEL & Acquisition of Soft Skills
• Community Support / Parent Involvement
24

A Look Into The Future – Priority Areas
• Newburyport Public Schools District Strategic Plan 2016-2021
• Enhancement of Student Leadership Trainings / Student Voice
• Expansion of World Languages (grades 7 & 8)
• Further development of new program TeachPoint, a more user-friendly evaluation process for educators / evaluators
• Billie Donegan’s skills-based competency professional development work enhancing teacher tools
• Continue to focus on balance literacy reading / writing strategies & programming (PreK-3) / development of early Dyslexia screening for students
• Technology Education Enhancement / 21st Century Tools
• STEM Expansion at all grade levels
• Dual Enrollment: Endicott College & Salem State University
• Enhance community partnerships – Place-Based Education: NEF, Rotary, Business Coalition, Chamber of Commerce, Newburyport Youth Services etc.
25

Priority Areas - continued
• Late Start Building;
• Equipment Support; Assessment of equipment needs, café needs due to increase in student lunch count at Middle/Molin. High School will have 2 lunches so modification will be needed to allow for additional seating
• Flexible Spacing; utilize areas in building for small workgroups to maximize space (Middle/Molin)
• Late Start: potential additional staff;
• Middle/Molin electives
26

• District budget development: maximizing operational resources, reallocation and restructuring
• Development of 21st Century classrooms and Global Learning
• Update Technology Plan with a focus on innovation & sustainability
• Overall district scheduling & review of later start times
• Comprehensive dual enrollment program
• College and career readiness: real world authentic learning / enhancement of internships
• Program development including but not limited to: dual enrollment, World Languages (K-6), Humanities, Special Education, increased extracurricular activities, clubs, and educational programs
• MSBA Proposal: expansion of high school Science labs & repair high school roof
A Look Into The Future…
27

Revenue & ExpenditureForecasts

Revenue & Expenditure Forecast
• Five year projection
• #s provided are preliminary
• Major assumptions:
• Labor and service costs in line with index (ECI, CPI)
• Health insurance costs +4.0% per year
• Pension assessment +5.0% per year
• Property taxes → Proposition 2½ max. levy limit
• School appropriation increases tied to City’s total annual revenue growth (e.g. 3.2% in FY21)
29
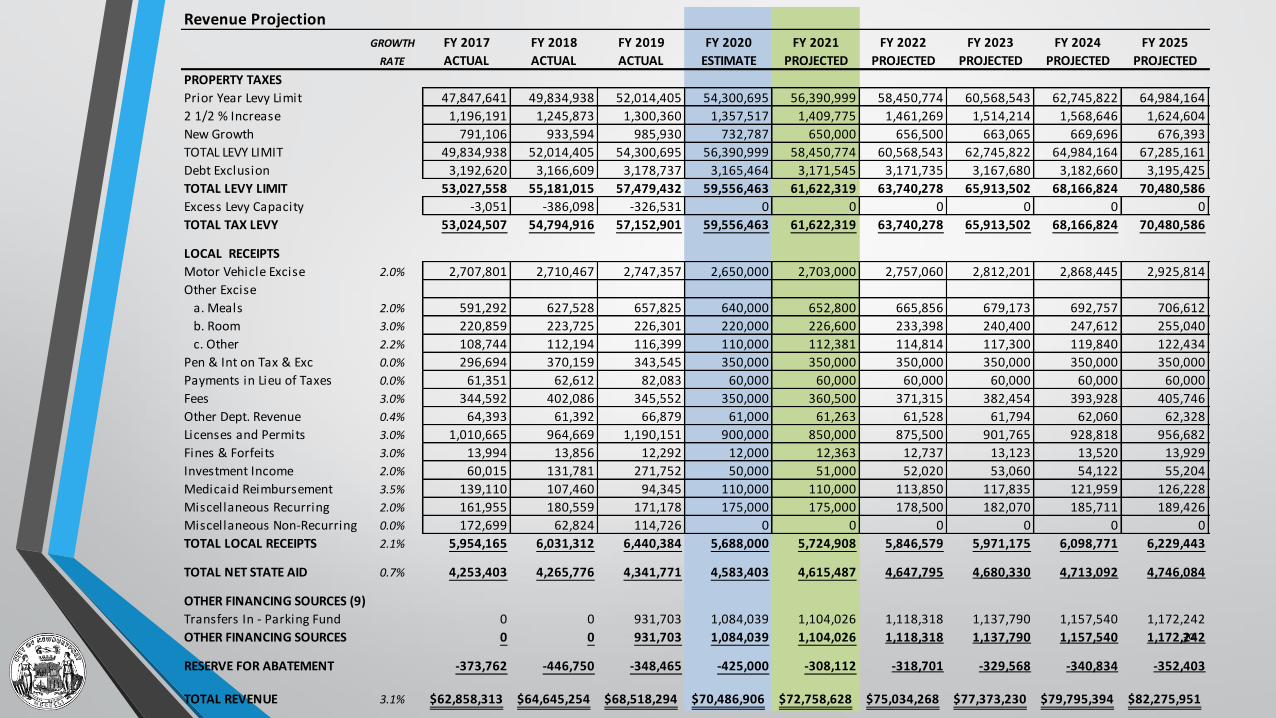
Revenue Projection
GROWTH FY 2017 FY 2018 FY 2019 FY 2020 FY 2021 FY 2022 FY 2023 FY 2024 FY 2025
RATE ACTUAL ACTUAL ACTUAL ESTIMATE PROJECTED PROJECTED PROJECTED PROJECTED PROJECTED
PROPERTY TAXES
Prior Year Levy Limit 47,847,641 49,834,938 52,014,405 54,300,695 56,390,999 58,450,774 60,568,543 62,745,822 64,984,164
2 1/2 % Increase 1,196,191 1,245,873 1,300,360 1,357,517 1,409,775 1,461,269 1,514,214 1,568,646 1,624,604
New Growth 791,106 933,594 985,930 732,787 650,000 656,500 663,065 669,696 676,393
TOTAL LEVY LIMIT 49,834,938 52,014,405 54,300,695 56,390,999 58,450,774 60,568,543 62,745,822 64,984,164 67,285,161
Debt Exclusion 3,192,620 3,166,609 3,178,737 3,165,464 3,171,545 3,171,735 3,167,680 3,182,660 3,195,425
TOTAL LEVY LIMIT 53,027,558 55,181,015 57,479,432 59,556,463 61,622,319 63,740,278 65,913,502 68,166,824 70,480,586
Excess Levy Capacity -3,051 -386,098 -326,531 0 0 0 0 0 0
TOTAL TAX LEVY 53,024,507 54,794,916 57,152,901 59,556,463 61,622,319 63,740,278 65,913,502 68,166,824 70,480,586
LOCAL RECEIPTS
Motor Vehicle Excise 2.0% 2,707,801 2,710,467 2,747,357 2,650,000 2,703,000 2,757,060 2,812,201 2,868,445 2,925,814
Other Excise
a. Meals 2.0% 591,292 627,528 657,825 640,000 652,800 665,856 679,173 692,757 706,612
b. Room 3.0% 220,859 223,725 226,301 220,000 226,600 233,398 240,400 247,612 255,040
c. Other 2.2% 108,744 112,194 116,399 110,000 112,381 114,814 117,300 119,840 122,434
Pen & Int on Tax & Exc 0.0% 296,694 370,159 343,545 350,000 350,000 350,000 350,000 350,000 350,000
Payments in Lieu of Taxes 0.0% 61,351 62,612 82,083 60,000 60,000 60,000 60,000 60,000 60,000
Fees 3.0% 344,592 402,086 345,552 350,000 360,500 371,315 382,454 393,928 405,746
Other Dept. Revenue 0.4% 64,393 61,392 66,879 61,000 61,263 61,528 61,794 62,060 62,328
Licenses and Permits 3.0% 1,010,665 964,669 1,190,151 900,000 850,000 875,500 901,765 928,818 956,682
Fines & Forfeits 3.0% 13,994 13,856 12,292 12,000 12,363 12,737 13,123 13,520 13,929
Investment Income 2.0% 60,015 131,781 271,752 50,000 51,000 52,020 53,060 54,122 55,204
Medicaid Reimbursement 3.5% 139,110 107,460 94,345 110,000 110,000 113,850 117,835 121,959 126,228
Miscellaneous Recurring 2.0% 161,955 180,559 171,178 175,000 175,000 178,500 182,070 185,711 189,426
Miscellaneous Non-Recurring 0.0% 172,699 62,824 114,726 0 0 0 0 0 0
TOTAL LOCAL RECEIPTS 2.1% 5,954,165 6,031,312 6,440,384 5,688,000 5,724,908 5,846,579 5,971,175 6,098,771 6,229,443
TOTAL NET STATE AID 0.7% 4,253,403 4,265,776 4,341,771 4,583,403 4,615,487 4,647,795 4,680,330 4,713,092 4,746,084
OTHER FINANCING SOURCES (9)
Transfers In - Parking Fund 0 0 931,703 1,084,039 1,104,026 1,118,318 1,137,790 1,157,540 1,172,242
OTHER FINANCING SOURCES 0 0 931,703 1,084,039 1,104,026 1,118,318 1,137,790 1,157,540 1,172,242
RESERVE FOR ABATEMENT -373,762 -446,750 -348,465 -425,000 -308,112 -318,701 -329,568 -340,834 -352,403
TOTAL REVENUE 3.1% 62,858,313$ 64,645,254$ 68,518,294$ 70,486,906$ 72,758,628$ 75,034,268$ 77,373,230$ 79,795,394$ 82,275,951$
30

Expenditure ProjectionGROWTH FY 2017 FY 2018 FY 2019 FY 2020 FY 2021 FY 2022 FY 2023 FY 2024 FY 2025
RATE ACTUAL ACTUAL ACTUAL APPROVED PROJECTED PROJECTED PROJECTED PROJECTED PROJECTED
General Administration 2.45% 1,662,253 1,737,285 2,329,498 2,633,070 2,697,647 2,763,807 2,831,590 2,901,036 2,972,185
Finance 2.45% 888,410 829,526 859,420 914,029 936,446 959,413 982,943 1,007,049 1,031,748
Public Safety 2.45% 8,518,912 8,874,977 9,580,413 9,950,969 10,195,020 10,445,056 10,701,224 10,963,674 11,232,562
Public Services 2.45% 2,840,011 2,927,285 3,040,206 3,191,771 3,270,050 3,350,249 3,432,414 3,516,595 3,602,841
Planning and Development 2.45% 694,644 705,436 767,710 958,207 981,707 1,005,784 1,030,451 1,055,723 1,081,615
Social Services 2.45% 2,172,535 2,186,591 2,208,831 2,317,902 2,374,750 2,432,991 2,492,661 2,553,794 2,616,427
Public Schools 3.10% 27,360,232 28,631,701 29,815,374 30,935,242 31,921,650 32,943,473 33,998,005 35,086,295 36,209,422
Vocational Schools 5.00% 463,868 623,967 676,084 789,812 829,303 870,768 914,306 960,021 1,008,022
Employee Benefits:
Health Insurance
City 4.00% 3,213,272 3,352,334 3,850,329 4,011,085 4,171,528 4,338,389 4,511,925 4,692,402 4,880,098
Schools 4.00% 5,580,111 5,775,472 5,619,245 5,853,856 6,088,010 6,331,530 6,584,791 6,848,183 7,122,110
Total 4.00% 8,793,383 9,127,806 9,469,573 9,864,940 10,259,538 10,669,920 11,096,716 11,540,585 12,002,208
Pension Assessment
City 5.00% 2,787,832 2,895,975 2,989,361 3,129,576 3,286,055 3,450,357 3,622,875 3,804,019 3,994,220
Schools 5.00% 991,958 1,028,766 1,143,054 1,210,982 1,271,531 1,335,107 1,401,863 1,471,956 1,545,554
Total 5.00% 3,779,790 3,924,742 4,132,415 4,340,558 4,557,586 4,785,465 5,024,738 5,275,975 5,539,774
OPEB Trust Fund 25,000 50,000 60,000 98,649 0 0 0 0 0
Total Employee Benefits 5.03% 12,598,173 13,102,548 13,661,988 14,304,148 14,817,124 15,455,384 16,121,454 16,816,560 17,541,982
Capital
Capital Outlay 2.5% 325,720 382,765 365,892 416,264 426,671 437,337 448,271 459,478 470,965
Debt Service 4,107,675 3,971,948 4,125,217 4,022,979 4,247,283 4,437,008 4,560,351 4,697,354 4,705,194
Total Capital Investments 4,433,396 4,354,712 4,491,109 4,439,243 4,673,954 4,874,345 5,008,622 5,156,832 5,176,159
TOTAL EXPENDITURES 61,632,433$ 63,974,028$ 67,430,633$ 70,434,393$ 72,697,649$ 75,101,269$ 77,513,671$ 80,017,580$ 82,472,962$
TOTAL REVENUE 62,858,313$ 64,645,254$ 68,518,294$ 70,486,906$ 72,758,628$ 75,034,268$ 77,373,230$ 79,795,394$ 82,275,951$
AVAILABLE BALANCE 1,225,880$ 671,226$ 1,087,661$ 52,513$ 60,980$ (67,001)$ (140,441)$ (222,187)$ (197,011)$
*
*Annual increase tied to revenue growth rate
31

FY21 School Appropriation Estimate
FY2020Approved
FY2021Estimated
Base Appropriation (+3.2%) $30,825,242 $31,811,650
Medicaid Reimbursement $110,000 $110,000
Total Estimated Appropriation $30,935,242 $31,921,650
32

Next Steps
• Budget process reviewed with leadership
• Budgetary goals/justifications prepared
• Meetings held w/ school administrators and City department heads
• Priorities reviewed with leadership teams → budget proposal developed
• Capital Improvement Program (CIP) submitted to CC by April 1st
• School Committee adopts school budget; sent onto Mayor by May 4th
• Budget proposal finalized and submitted to CC on May 11th
• City Council has 45 days to approve; new fiscal year begins July 1st
33