city of newport planning commission …ci.newport.mn.us/documents/p.c.workshoppacket06-08-17.pdf ·...
TRANSCRIPT

CITY OF NEWPORT PLANNING COMMISSION WORKSHOP MEETING
NEWPORT CITY HALL JUNE 8, 2017 – IMMEDIATELY FOLLOWING THE PLANNING COMMISSION MEETING
Chairperson: Kevin Haley City Administrator: Deb Hill Vice-Chair: Marvin Taylor Asst. to the City Admin: Renee Eisenbeisz Commissioner: Anthony Mahmood Planner: Sherri Buss Commissioner: David Tweeten Council Liaison: Bill Sumner Commissioner: Saengmany Ratsabout
AGENDA 1. ROLL CALL
2. COMP PLAN DISCUSSION - WASTEWATER CHAPTER 3. ADJOURNMENT

I. Public Facilities and Services
C. WASTEWATER AND COMPREHENSIVE SEWER PLAN
The City of Newport sanitary sewer collection system was initially constructed in 1963-64. The system was built with8-inch diameter clay sewer pipes. The natural topography adjacent to the Mississippi River presents many challenges to a sanitary sewer system, both for the initial construction of the system and the subsequent expansion of the facilities. Figure 6-1 shows the topography and natural features of the City of Newport.

Figure 6-1: Topographical & Natural Features

D. MUNICIPAL SANITARY SEWER SYSTEM
The City’s sanitary sewer system consists of 17.5 miles of gravity collector sewers, 1.6 miles of force mains, seven sewage pumping stations and a connection to a Metropolitan Council Lift Station. The sewer system collects wastewater from 1,055 residences and 78 businesses (CII) in the City of Newport and provides a conduit for a further 78 residences in the City of Woodbury. Wastewater is transported via gravity and forcemain to the Metropolitan Council Lift Station (7102-2) located in the southwest corner of the City of Newport, at 1st Street and 3rd Avenue.
On average from 2011-2016, the City contributes 101 million gallons of wastewater to the Metropolitan Council’s Metropolitan Wastewater Treatment Plant. As noted, there are seven lift stations on the City’s sanitary sewer system. These lift stations are needed as it is not cost-
effective to dig deep sewer trenches in the area bedrock. These lift stations also serve to minimize the length of sewer pipes that lie below the water table and level of the Mississippi River. Wastewater flows into the sewers in 2016, described in Table 6-1 averaged slightly more than 9.3 million gallons each month. During 2016, the monthly wastewater flows ranged
0.311.09
2.26
2.842.42
4.495.09
7.82
5.47
3.412.98
2.14
9.29
6.97
8.34
7.64
9.80
8.89 8.87
9.91
12.51
11.22
9.089.44
0
2
4
6
8
10
12
14
Jan Feb Mar Apr May Jun Jul Aug Sept Oct Nov Dec
Flow (MG)/
Precip (in)
Month
Table 6‐12016 Total Wastewater Flow vs. Precipitation
2016 Precipitation (in) ‐ Per MNClimatology Working Group2016 Total Flow (MG) ‐ Per MCES
Total Flow ‐ 111.96 MGTotal Precip ‐ 40.32 in

from a high of 12.5 gallons to a low of 7.0 million gallons. In comparison, during 2007, monthly wastewater flows ranged from a high of 9.1 million gallons to a low of 7.0 million gallons and averaged approximately 7.6 million gallons. The City of Newport has an inter-community agreement with the City of Woodbury to transport wastewater from 78 homes, into the Metropolitan Council’s interceptor.
As can be seen from the monthly Sewer Usage Table for 2016, there is no direct correlation between precipitation and wastewater pumped by the Metropolitan Council Lift Station, although there does seem to be an increase in flow in the months with high rainfall amounts. A review of the 10 Year Flow records, depicted in Table 6-2, shows that the volume of wastewater pumped has fluctuated between 90 MG and 116 MG during this period.
91.20 89.20
81.70
91.40
108.09
90.8395.26
116.15
95.32
111.96
0
20
40
60
80
100
120
140
2007 2008 2009 2010 2011 2012 2013 2014 2015 2016
Total Flow (MG)
Year
Table 6‐210‐Year Total Flow
Total Flow (MG)

Figure 6‐2: Sanitary Sewer System

E. INFILTRATION & INFLOW In order to ensure the most efficient use of the sewer system, the City implemented an I&I or “inflow” and “infiltration” reduction plan. Inflow is typically water from a single point, such as stormwater pouring into sewer access covers or discharges from a private sump pump. Infiltration refers to the seepage of groundwater into the sewer pipes, typically through cracks in the pipes or through the joints. Either infiltration or inflow will increase usage of the Newport’s sewer system and the Metropolitan wastewater treatment system as a sizable proportion of the wastewater pumped to the Metropolitan Council consists of clear water inflow and infiltration.
Several efforts to reduce sources inflow within Newport have been undertaken:
The City has identified and corrected cross connections and overflows between the sanitary and storm sewer systems. The cross connections were eliminated and the bypasses have been fitted with manually operated valves (the MPCA is advised if the valves are operated and wastewater discharged).
The City has also required that all homes located below the regulatory flood elevation be equipped with check valves. Sanitary sewer service to these homes is shut off by manually-operated valves on their service lines when the river level increases the amount of clear water infiltration to these service lines that is greater than acceptable limits.
Newport enacted an ordinance prohibiting the connection of any sump pumps, foundation drains, and/or rain leader to sanitary sewers (Sec. 34-16 – Newport City Code). The ordinance also includes enforcement provisions in the event of violations.
City Staff conducted an inspection of each home and commercial business to determine if the sump pump for the structure was connected to the sanitary sewer system. Numerous sump pump connections were eliminated as part of these inspections.
The final measure the City has implemented to reduce inflow is a program to replace all manhole covers with new seal “pickless” lids (manufactured without holes) on a retro-fit basis and on all new street construction projects.
To reduce infiltration and the potential for groundwater seepage into the sewer pipes, the City taken additional steps such as:
Requiring all new sewer construction to utilize water-tight PVC piping rather than clay tile.
Requiring all private service connections to the mainline to be made with a fitting rather than a “break-in” connection.
In 2011, the City commissioned a mainline sanitary sewer lining project that installed cured in place liners in the areas most susceptible to extended periods of high ground water. The project lined nearly 16,500 feet of clay-tile pipe and 38 manholes at a cost of over $540,000.

The City has also conducted sanitary sewer replacement work in conjunction with full street reconstruction projects to replace the main line pipe, manholes and private service connections to the property line. To date, the City has replaced over 6,000 feet of main line sewer, 3,000 feet of service pipe, 12 manholes and 30 manhole covers.
The mainline lining project did not result in the desired reduction in the I-I related flow through the sewer. The City suspects that the clean water is tracking behind the liner in the annular space between the host pipe and entering the system at the reinstated service connection and manholes. The City conducted a feasibility study to compare the cost of lining the remainder of the clay tile main line pipe, including the private service lines, (Option A) and the cost to replace the main line sewer and manholes including the surface restoration (Option B). The total cost of Option A was estimated at $9,500,000 and Option B is estimated at $27,700,000. The City is presently conducting a pilot study on a small lift station sub catchment area to determine the impact of service lining verses full replacement.
F. FUTURE WASTEWATER NEEDS AND SERVICES
1. Regional Estimates
The Metropolitan Council’s forecasts, in part, reflect the capacity of the region’s wastewater treatment plants. The Metropolitan Council’s growth forecasts, discussed in Chapter V Land Use, will result in Year 2040 wastewater flows in Newport as described as follows.
i. Table 6-3: City of Newport Sewer Usage Forecasts, 2020-2040
Forecast Year
Forecast Component
Population Households Employment
2010
MCES Sewered 2,667 1,049 1,605 Unsewered 768 305 0 Total 3,435 1,354 1,605
2020
MCES Sewered 2,830 1,220 1,990 Unsewered 770 310 0 Total 3,600 1,530 1,990
2030
MCES Sewered 3,280 1,530 2,070 Unsewered 770 310 0 Total 4,050 1,840 2,070
2040
MCES Sewered 3,680 1,790 2,100 Unsewered 770 310 0 Total 4,450 2,100 2,100
Source: Sewer Allocation Forecasts (Met.Council)

2. Expansions of Newport’s Sewer Service Area
The City of Newport’s Year 2040 growth forecasts result from consideration of the potential for redevelopment of existing land uses over the next twenty years. The actual sewage flow from these redevelopments is very dependent on the types of redevelopment. The State’s acquisition of $5 million dollars of taxable property in the City during the TH61/I494 reconstruction project resulted in a $500,000 reduction to the local economy per year. This loss severely hindered the community’s ability to accomplish the actions needed to foster and encourage any significant growth or improvement. Despite the setback, the City has begun to see modest growth and development in the corridor in recent years.
The scenarios developed in Chapter V provide a measure of the variance in this potential for growth. These scenarios take into account the impacts of TH61 reconstruction and provide for a range of philosophies in directing the future land use controls within the City.
The City’s projections of wastewater flows are described in Table 6-3. Locations of the areas that require extensions of the City’s sewer system service area are shown by Figure 6-4. These forecasts anticipate a range of growth; the “low projections” reflect a continuation of the rural low-density development that is presently ongoing in the remaining vacant lands of the community. Alternatively, the “high projections” of wastewater flow represent a denser and more planned approach to development of these vacant lands.
The proposed development areas will be connected to the existing sanitary sewer system and will involve expansion of the systems collection facilities. Additional wastewater flows will flow through sanitary sewer connected to the existing system from the following locations:
Area A: South East Business Park
Located in the southeastern quadrant of the City just east of TH-61 are several parcels of vacant land that have been acquired by a developer with the intent to construct two commercial warehouse buildings ranging in size from 83,000 SF to 144,000 SF. The developer is currently marketing these buildings with the intent to attract an anchor tenant during 2017. The developers plans includes a connection to the City’s municipal sewer system using a privately owned and construction lift station discharging to the existing gravity sewer approximately 150 feet from the site. The lift station is needed due to shallow bedrock (12”-36”) and a MnDOT storm sewer pipe dividing the property north to south. The site does not presently have municipal sewer or water utilities. A 10” trunk watermain stubs extended from the south end of 10th Avenue and across TH61 at 7th Street will provide adequate water service for the development.

Area B: Century Avenue Residential Development
Located atop the bluff line in the southeastern quadrant of the City these parcels contain approximately 99 acres, shown by Figure 6-4, and are presently managed agriculturally by Bailey Nurseries or are buffer lands for the St. Paul Park Refinery under the control of Northern Tier Energy. The City of Cottage Grove continues to expand its residential land uses immediately east of Century Avenue, which will eventually leave these properties surrounded by homes. The development of these lands could take the form of single family residential estates or a series of PUD developments that would respect the community’s need to protect its bluff line habitat area. Gravity sewer (City of Woodbury) is available 200 LF north of this area. Municipal water service is available a further 1200LF south on Glen Road. The offsite cost of extending connections to these properties is estimated to be $100,000for sanitary and $550,000for municipal water services. It is expected that these costs would accrue to the developers of the residential subdivisions.
Area C: Catherine Drive Residential Development
There is a prospective development aggressively pursuing the 69 acre area lying north of Catherine Drive between Ria and La Lakes. The proposed development would include a mix of high density to medium density residential housing. The area currently resides outside the City’s water and sewer utility boundaries but the Council is considering a utility extension to the area. Sanitary sewer service would likely be extended from the northern-most manhole on the Public Works driveway off of Bailey Road. The extension of water service would require additional storage and booster pump capacities in the existing high pressure zone. Then costs of these upgrades are estimated at $3,300,000 and it is expected that the developer will be responsible for cost of the extension.
Area D: Bailey/Military Road Residential and Business Park Developments
The ongoing pressure towards infilling the Bailey Road corridor in the metropolitan area will make this acreage prime developable property. Aside from a 40-acre parcel currently owned and maintained by Bailey Nursery as a potting field, the area surrounding the Bailey Road/Military Road intersection is primary comprised of large estate lots. It is unclear of the future use of these parcels but the City expects the Bailey parcel north of Bailey Road to be developed into commercial/light industrial and the area south of Bailey Road to be medium to low density residential. Further expansion of the Catherine Drive utility extension is expected to service this area.
Area E: Bailey Nursery Site
This area consists of a combination of 4 parcels totaling over 69 acres and serves as the Bailey Nursery corporate offices and greenhouse sites. Although a connection to City

water and sewer utilities is feasible, the subdivision of these lots are highly unlikely and are not included in the future flow projections.
Area F: Gerdau Steel General Industrial Site
The TH-61 and I494 improvements consisted of the construction of a northerly ring road at the intersection of these two freeways. This construction has improved access to the City of Saint Paul’s Gerdau Steel Industrial Park, which immediately abuts the northerly corporate boundary of Newport. Utility services are immediately available to the developable property and service could be extended at little cost to the City.
G. NEWPORT’S WASTEWATER FLOW PROJECTIONS The land use projections developed in Chapter V have been compared with the existing flows and water usage in the City of Newport to forecast the year 2010, 2020, 2030 and 2040 annual sewage usage in Table 6-4.
The existing MCES Interceptor will handle the flow generated by these developments.
Table 6-4 City of Newport Sewer Usage Based on City Forecasts 2020-2040
2010 2020 2030 2040
Sewered Population 2,667 2,830 3,280 3,680
Sewered Households 1,049 1,220 1,530 1,790
Sewered Employment 1,605 1,990 2,070 2,100
Projected Flow, MG 91 107 118 127
Flow Range, MG Low High Low High Low High Low High
NA NA 105 115 115 125 125 135
Source: 2040 Growth Forecasts by Metropoitan interceptor facility
The projected wastewater flows in Table 6-4 are based on the following assumptions:
Residential flows will average 60 gallons per day, per person (historic average).
Sewered Employment as per Metropolitan Council Estimates
CII flows will average 35 gallons per day per employee (historic average).
Inflow and Infiltration will average 20 MG/year.
The wastewater flows described in Table 6-4 are within the design capacities of the City sewage transportation system and are within the capacity of the Metropolitan Council’s interceptor # 7102-2.
H. ON-SITE SEWAGE SYSTEMS There are 78 on-site sewage systems in the City. The locations of onsite systems are marked on Figure 6-5. Most, but not all, of the septic tanks are in the bluffs in the eastern area of the City where the housing density is to low and the lot sizes so large. Because of

these factors, the installation of sewers for single-family housing has not been feasible due to high cost per resident of connecting these lots
Minnesota statutes require that each community with on-site sewage systems include in the comprehensive plan (a) a program for managing their operation and (b) standards for issuing permits for new on-site systems. Newport does not have a management program for its on-site systems. Newport has adopted Washington County’s standards for issuing permits for upgrading existing or for construction of new on site systems. The City contracts with Washington County, which conducts inspections and monitors pumping of septage from these systems.

Figure 6-3 Future Sewer Service Expansion Areas
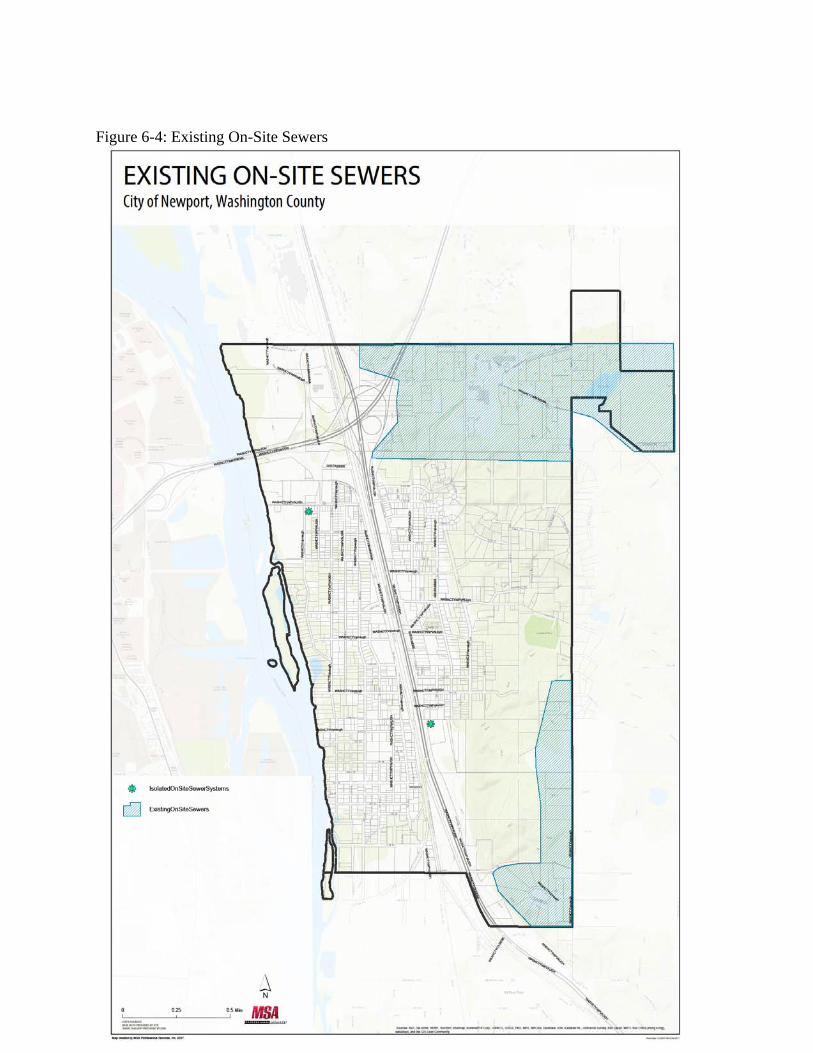
Figure 6-4: Existing On-Site Sewers

I. GOALS, OBJECTIVES & STRATEGIES Overarching Goal:
Promote efficient and effective maintenance and construction programs for sanitary sewer systems within the City of Newport.
Goal 1: Provide sewer service that will effectively meet the needs of current and future residents and businesses.
Objectives:
1. By ensuring sewer service is safe and reliable. 2. By requiring new development to support the efficiency and fiscal
sustainability of sewer system. 3. By becoming proactive, rather than reactive, in implementing changes
to the infrastructure to prevent I-I. 4. By continuing to enforce ordinances and codes.
Goal 2: Newport will continue to invest in upgrading older, outdated or poorly/under-performing infrastructure.
Objectives:
1. By implementing an asset management plan to prioritize areas based on deterioration and need.
2. By finding funding and revenue sources to make the necessary upgrades, changes, and maintenance to the infrastructure.
Goal 3: Coordinate the location of public utilities and facilities with projected growth and desired development patterns.
Objectives:
1. By coordinating the community facilities and services planning with land use and growth area planning.
2. By continuing to direct new development to areas that can be efficiently and economically served by existing or planned City facilities.
3. By encouraging efficient land use.
Strategies
1. Look for creative funding, such as grants or low interest loans, to help cover the cost of infrastructure.
2. Extend the sewer where necessary to meet current and future needs.

3. The City and developers will adhere to the Public Works Design Manual to promote effective water-tight connections to the sanitary sewer system.
4. The City will encourage infill development and other practices that efficiently and cost effectively utilize existing infrastructure.
5. The City will continue to make investments that allow for long-term cost control.
6. The City will conduct regular review of sewer capacities to serve future growth and development.