city of oceanside miscellaneous and safety plans
TRANSCRIPT
CITY OF OCEANSIDE
MISCELLANEOUS AND SAFETY PLANS
CalPERS Actuarial Issues – 6/30/09 Valuation JOHN E. BARTEL
February 22, 2011
Agenda
c:\documents and settings\jbartel\my documents\clients\city of oceanside\calpers\6-30-09\ba 11-02-22 oceansideci calpers misc safety t2 09.doc
Topic Page Definitions 1 Miscellaneous Plan:
Plan Funded Status 3 Demographic Information 5 Plan Assets & Actuarial Obligations 13 Contribution Rates,& Projections 19 2.7% @ 55 – Amendment 6/30/2007 25
Safety Plan Plan Funded Status 27 Demographic Information 29 Plan Assets & Actuarial Obligations 37 Contribution Rates & Projections 43 3.0% @ 50 – Amendment 6/30/1999 49
Contribution Policy 51 2nd Tier Options:
Benefit Factors 53 Current & Alternative Benefits & Projected Payroll 57 Estimated Savings 71 CalPERS Two Tier Options 83
CalPERS Smoothing 85

Definitions
February 22, 2011 1
Present Value of BenefitsJune 30, 2009
Actuarial Liability
Future Normal Costs
Current Normal Cost
PVB - Present Value of all Projected Benefits:
Discounted value (at valuation date - 6/30/09), of all future expected benefit payments based on various (actuarial) assumptions
Actuarial Liability: Discounted value (at valuation date) of benefits earned through valuation date
[value of past service benefit] Portion of PVB “earned” at measurement
Current Normal Cost: Portion of PVB allocated to (or “earned” during) current year Value of employee and employer current service benefit
Definitions
February 22, 2011 2
Present Value of BenefitsJune 30, 2009
Unfunded PVB
Excess Assets
Actuarial Liability
Target- Have money in the bank to cover Actuarial Liability (past service)
Unfunded Liability - Money short of target at valuation date
Excess Assets / Surplus: Money over and above target at that point in time. Doesn’t mean you’re done contributing.
Super Funded: Assets cover whole pie (PVB) If everything goes exactly like PERS calculated, you’ll never have to put another
(employer or employee) dime in.

Plan Funded Status Miscellaneous
February 22, 2011 3
Present Value of BenefitsJune 30, 2008
Unfunded PVB
(Unfunded Liability)
Actuarial Liability
Present Value of BenefitsJune 30, 2008
Unfunded PVB
(Unfunded Liability)
Actuarial Liability
June 30, 2008 June 30, 2009
86,600,000$ Unfunded PVB 103,100,000$ (25,200,000) (Unfunded Liability) (44,700,000)
232,500,000 Actuarial Liability 265,700,000
294,000,000 PVB 324,100,000
Plan Funded Status Miscellaneous
February 22, 2011 4
What happened between 6/30/08 and 6/30/09?
Asset gain/(loss): ≈ (4.2) million
Actuarial gain/(loss): ≈ (1.5) million
Average Salary $61,000 $64,300
Number of Actives 690 687
Number of Inactives 677 679
Number of Retirees 727 744
Contribution gain/(loss): ≈ 1.9 million
Expected ≈ (7.4)
Actual ≈ 9.3
Assumption Change gain/(loss) ≈ (12.7) million
Expected UAL Decrease/(Increase): ≈ (2.9) million
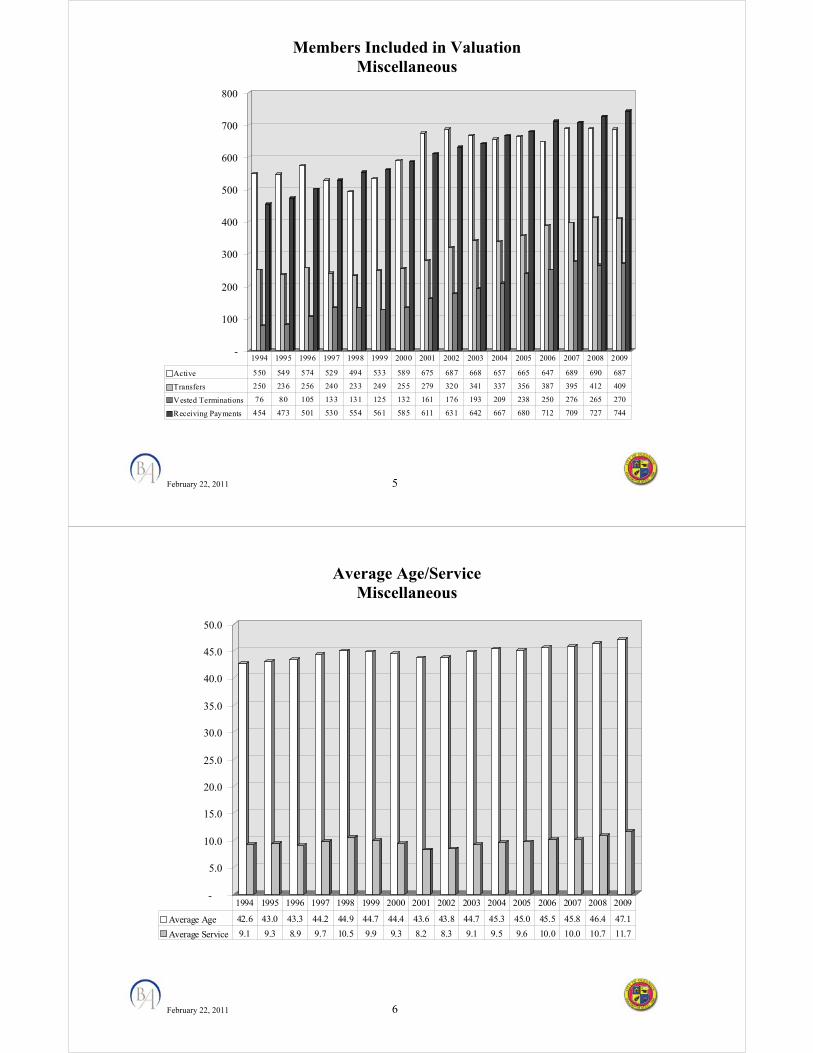
Members Included in Valuation Miscellaneous
February 22, 2011 5
-
100
200
300
400
500
600
700
800
Active 550 549 574 529 494 533 589 675 687 668 657 665 647 689 690 687
Transfers 250 236 256 240 233 249 255 279 320 341 337 356 387 395 412 409
Vested Terminations 76 80 105 133 131 125 132 161 176 193 209 238 250 276 265 270
Receiving Payments 454 473 501 530 554 561 585 611 631 642 667 680 712 709 727 744
1994 1995 1996 1997 1998 1999 2000 2001 2002 2003 2004 2005 2006 2007 2008 2009
Average Age/Service Miscellaneous
February 22, 2011 6
-
5.0
10.0
15.0
20.0
25.0
30.0
35.0
40.0
45.0
50.0
Average Age 42.6 43.0 43.3 44.2 44.9 44.7 44.4 43.6 43.8 44.7 45.3 45.0 45.5 45.8 46.4 47.1
Average Service 9.1 9.3 8.9 9.7 10.5 9.9 9.3 8.2 8.3 9.1 9.5 9.6 10.0 10.0 10.7 11.7
1994 1995 1996 1997 1998 1999 2000 2001 2002 2003 2004 2005 2006 2007 2008 2009
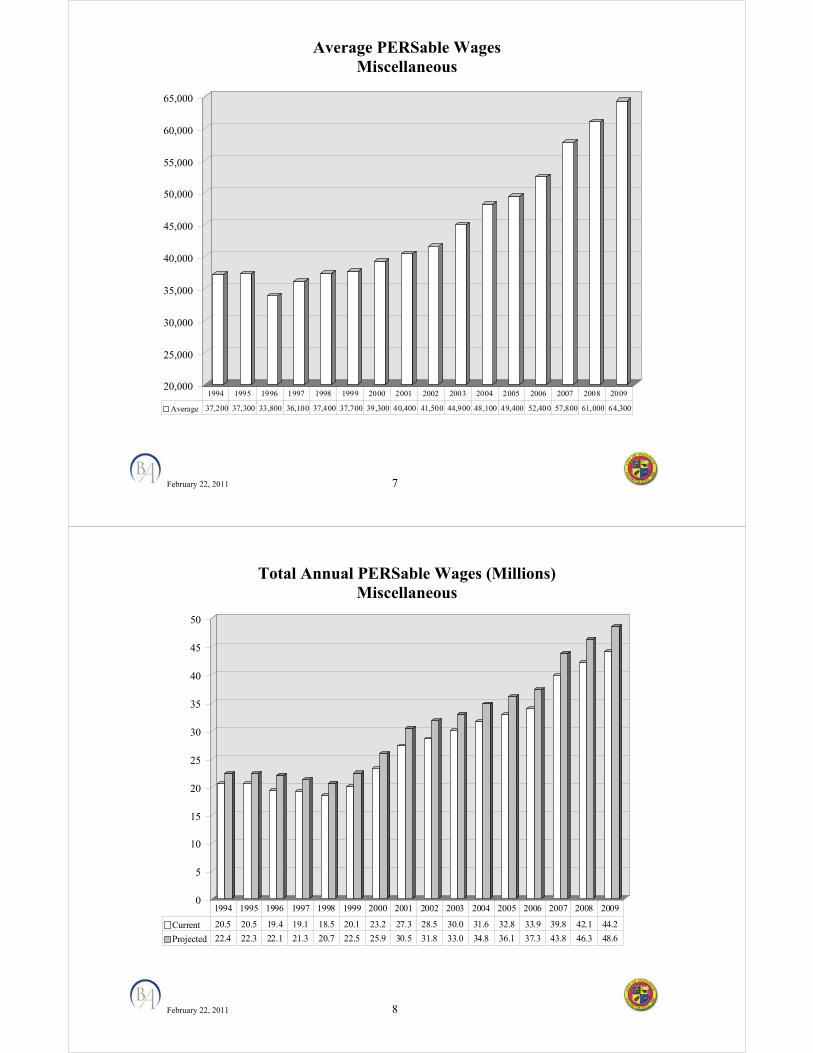
Average PERSable Wages Miscellaneous
February 22, 2011 7
20,000
25,000
30,000
35,000
40,000
45,000
50,000
55,000
60,000
65,000
Average 37,200 37,300 33,800 36,100 37,400 37,700 39,300 40,400 41,500 44,900 48,100 49,400 52,400 57,800 61,000 64,300
1994 1995 1996 1997 1998 1999 2000 2001 2002 2003 2004 2005 2006 2007 2008 2009
Total Annual PERSable Wages (Millions) Miscellaneous
February 22, 2011 8
0
5
10
15
20
25
30
35
40
45
50
Current 20.5 20.5 19.4 19.1 18.5 20.1 23.2 27.3 28.5 30.0 31.6 32.8 33.9 39.8 42.1 44.2
Projected 22.4 22.3 22.1 21.3 20.7 22.5 25.9 30.5 31.8 33.0 34.8 36.1 37.3 43.8 46.3 48.6
1994 1995 1996 1997 1998 1999 2000 2001 2002 2003 2004 2005 2006 2007 2008 2009

Members Receiving Payments Miscellaneous
February 22, 2011 9
-
100
200
300
400
500
600
700
800
Service Retirement 414 423 423 447 463 493 491 510 523
Disability Retirement 88 87 90 90 88 87 85 86 85
Beneficiaries 108 120 127 128 127 131 132 131 136
Total Retirements 610 630 640 665 678 711 708 727 744
2001 2002 2003 2004 2005 2006 2007 2008 2009
Average Annuity Miscellaneous
February 22, 2011 10
-
2,000
4,000
6,000
8,000
10,000
12,000
Average Service Ret 8,100 8,500 8,700 9,100 9,800 10,200 10,600 11,000 11,400
Average Disabled Ret 4,700 5,400 5,500 5,500 5,900 5,700 5,600 5,800 6,100
Average Ret Annuity 7,500 7,900 8,200 8,500 9,200 9,600 9,900 10,300 10,700
2001 2002 2003 2004 2005 2006 2007 2008 2009

Average Annuity Miscellaneous
February 22, 2011 11
Years
Retired 2001 2002 2003 2004 2005 2006 2007 2008 2009
Under 5 10,271$ 10,551$ 9,972$ 10,682$ 11,863$ 12,388$ 12,747$ 13,865$ 14,541$
5~9 9,492 10,175 11,056 11,427 12,172 12,328 11,590 11,116 11,651
10~14 8,004 8,302 9,456 10,060 9,355 9,446 10,624 11,112 11,451
15-19 4,978 5,052 5,147 5,339 7,278 7,476 9,325 10,410 11,187
20-24 4,639 4,701 5,428 5,185 5,748 6,020 5,527 5,818 6,478
25-29 4,263 4,694 3,560 3,758 4,820 4,678 6,233 6,003 5,463
Over 30 2,616 2,957 5,124 3,884 6,520 - 2,146 3,735 5,432
All Years 8,133 8,472 8,741 9,140 9,806 10,233 10,582 11,039 11,419
Service Retirement Retirees' Benefit
Average Annuity Miscellaneous
February 22, 2011 12
Attained
Age 2001 2002 2003 2004 2005 2006 2007 2008 2009
50-54 3,551$ 4,044$ 4,043$ 7,216$ 10,173$ 10,238$ 10,173$ 7,048$ 7,382$
55-59 10,611 7,598 7,818 9,042 9,473 8,614 10,822 11,374 10,796
60-64 10,204 13,887 12,473 11,487 11,991 13,191 11,387 12,699 13,282
65-69 8,417 8,429 10,625 11,226 12,446 12,712 14,104 12,916 13,543
70-74 8,727 9,564 9,297 9,455 9,623 10,801 10,162 12,042 12,851
75-79 6,291 6,246 7,301 8,044 8,709 8,830 10,266 10,350 11,022
80-84 6,738 6,245 6,151 5,939 7,126 7,689 6,483 7,127 7,546
85 & over 4,290 5,194 5,586 5,886 6,578 5,945 7,986 8,136 7,700
All Ages 8,133 8,472 8,741 9,140 9,806 10,233 10,582 11,039 11,419
Service Retirement Retirees' Benefit

Actuarial Investment Return Miscellaneous
February 22, 2011 13
-31.00%
-23.25%
-15.50%
-7.75%
0.00%
7.75%
15.50%
23.25%
AVA Modified 8.2% 8.9% 9.2% 9.4% 8.5% 8.6% 7.2% 5.7% 6.8% 7.6% 8.0% 8.2% 9.1% 8.2% 6.2% 6.1% 1.4%
MVA Rate 16.3% 15.3% 20.1% 19.5% 12.5% 10.5% -7.2% -6.0% 3.7% 16.6% 12.3% 11.9% 18.8% -5.1% -24.0 13.3% 7.8%
AVA Unmodified 8.2% 8.9% 9.2% 9.4% 8.5% 8.6% 7.2% 5.7% 6.8% 7.6% 8.0% 8.2% 9.1% 8.2% -6.9% 6.9% 6.9%
1995 1996 1997 1998 1999 2000 2001 2002 2003 2004 2005 2006 2007 2008 2009 2010 2011
Actuarial Investment Return Miscellaneous
February 22, 2011 14
Above assumes contributions, payments, etc. received evenly throughout year. 6/30/09:
Market Value return ≈ (24.0)% Actuarial Value return
Modified ≈ 6.2% Unmodified ≈ (6.9)%
6/30/10: Market Value return ≈ 13.3% 1 Actuarial Value return
Modified ≈ 6.1% Unmodified ≈ 6.9%
6/30/11: Market Value return through 11/30/10 ≈ 9.4 % Estimated Annualized MVA Return2 ≈ 7.75% Est. Annualized Modified AVA Return ≈ 1.4%
1 As reported by CalPERS press release. 2 CalPERS assumed investment return 7.75%

Asset Values (Millions) Miscellaneous
February 22, 2011 15
0
50
100
150
200
250
Actuarial 64 70 81 95 113 127 141 146 139 141 148 158 177 192 207 221 234 240
Market 64 74 87 105 125 140 152 138 126 128 145 162 187 222 211 162 183 200
1994 1995 1996 1997 1998 1999 2000 2001 2002 2003 2004 2005 2006 2007 2008 2009 2010 2011
6/30/10 & 6/30/11 asset values estimated.
Funded Status Miscellaneous
February 22, 2011 16
0%
20%
40%
60%
80%
100%
120%
140%
160%
Funded Ratio - AVA 100 97% 101 118 131 138 137 129 114 101 97% 97% 100 98% 89% 83% 82% 78%
Funded Ratio - MVA 100 103 108 131 145 153 148 122 104 92% 96% 100 105 113 91% 61% 64% 65%
1994 1995 1996 1997 1998 1999 2000 2001 2002 2003 2004 2005 2006 2007 2008 2009 2010 2011
6/30/10 & 6/30/11 funded status estimated
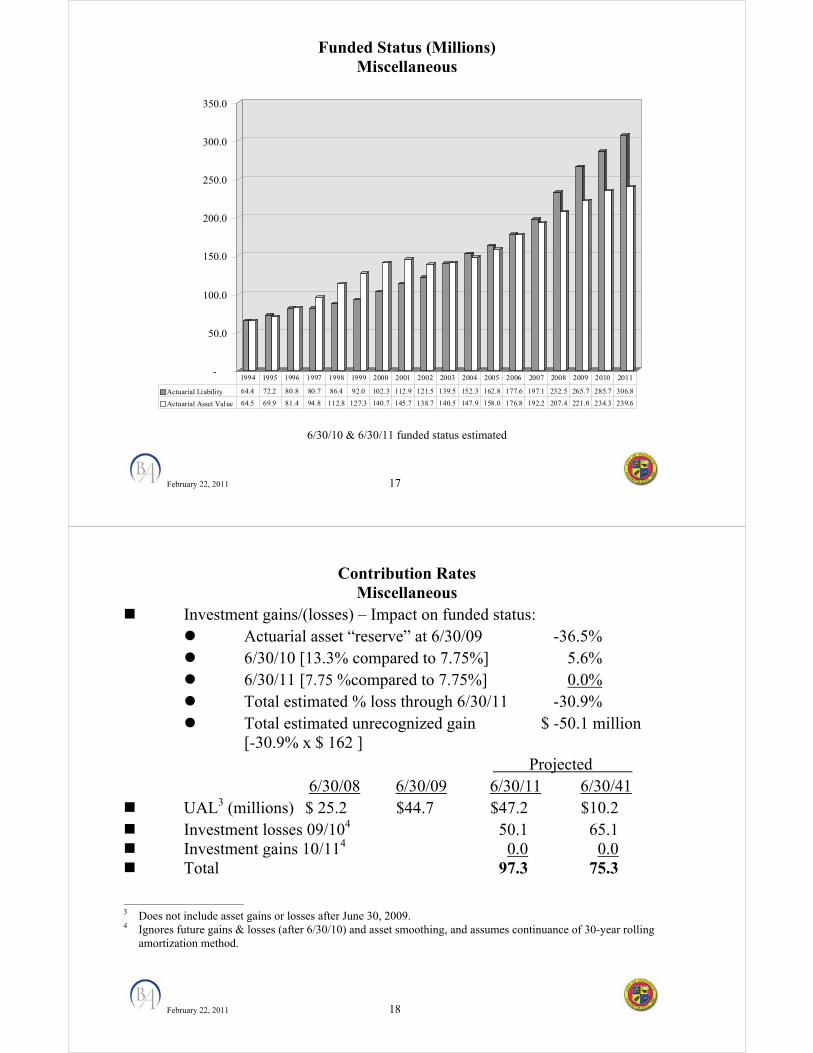
Funded Status (Millions) Miscellaneous
February 22, 2011 17
-
50.0
100.0
150.0
200.0
250.0
300.0
350.0
Actuarial Liability 64.4 72.2 80.8 80.7 86.4 92.0 102.3 112.9 121.5 139.5 152.3 162.8 177.6 197.1 232.5 265.7 285.7 306.8
Actuarial Asset Value 64.5 69.9 81.4 94.8 112.8 127.3 140.7 145.7 138.7 140.5 147.9 158.0 176.8 192.2 207.4 221.0 234.3 239.6
1994 1995 1996 1997 1998 1999 2000 2001 2002 2003 2004 2005 2006 2007 2008 2009 2010 2011
6/30/10 & 6/30/11 funded status estimated
Contribution Rates Miscellaneous
February 22, 2011 18
Investment gains/(losses) – Impact on funded status: Actuarial asset “reserve” at 6/30/09 -36.5% 6/30/10 [13.3% compared to 7.75%] 5.6% 6/30/11 [7.75 %compared to 7.75%] 0.0% Total estimated % loss through 6/30/11 -30.9% Total estimated unrecognized gain $ -50.1 million
[-30.9% x $ 162 ] Projected 6/30/08 6/30/09 6/30/11 6/30/41 UAL3 (millions) $ 25.2 $44.7 $47.2 $10.2 Investment losses 09/104 50.1 65.1 Investment gains 10/114 0.0 0.0 Total 97.3 75.3
3 Does not include asset gains or losses after June 30, 2009. 4 Ignores future gains & losses (after 6/30/10) and asset smoothing, and assumes continuance of 30-year rolling
amortization method.

Contribution Rates Miscellaneous
February 22, 2011 19
-10%
-5%
0%
5%
10%
15%
20%
Normal Cost 6.3% 9.0% 8.9% 7.7% 7.6% 7.8% 8.1% 8.3% 8.3% 8.4% 8.5% 8.4% 8.3% 8.4% 10.7% 10.4%
UAL Amort 0.0% 4.2% -0.7% -7.5% -7.6% -7.8% -8.1% -8.3% -3.5% 1.5% 0.0% -0.2% 0.2% 0.8% 4.5% 7.2%
Total 6.2% 13.2% 8.3% 0.1% 0.0% 0.0% 0.0% 0.0% 4.7% 9.9% 8.5% 8.1% 8.5% 9.2% 15.2% 17.6%
1994 1995 1996 1997 1998 1999 2000 2001 2002 2003 2004 2005 2006 2007 2008 2009
Contribution Rates Miscellaneous
February 22, 2011 20
6/30/08 6/30/09 2010/2011 2011/2012 Normal cost 10.7% 10.4% Amortization bases:
(Gain)/Loss 0.9% 0.9% Benefit Change 3.7% 3.6% Special (Gain)/Loss - 0.5% Assumption Change (6/30/09) 0.0% 2.3%
Sub-total 4.5% 7.2% Total: 15.2% 17.6% Amortization period Multiple
≈ 21 years Multiple ≈ 21 years
What Happened from 6/30/08 to 6/30/09: 2010/11 Rate 15.2% (Gains)/Losses 0.3 Assumption Changes 2.1 2011/12 Rate 17.6%

Contribution Projections Miscellaneous
February 22, 2011 21
Market Value Investment Return: June 30, 2010 13.3%5 June 30, 2011 - 2015 Poor Investment Return: ≈ 0.4% - 3.6% Expected Investment Ret: ≈ 7.75% Good Investment Return: ≈ 11.8% - 15.3%
Fresh Starts: No Fresh Starts for 11/12 15 Year 1.7% 20 Year 0.1% 30 Year -1.4%
No Other: Gains or Losses Method or Assumption Changes Benefit Improvements
5 As reported by CalPERS press release.
Contribution Projections Miscellaneous
February 22, 2011 22
Investment Return Varies(7.75%)
5%
10%
15%
20%
25%
30%
UnMod AVA, Poor IR 9.2% 15.2% 21.5% 21.6% 21.9% 23.3% 24.5% 25.4%
UnMod AVA, Exp IR 9.2% 15.2% 21.5% 21.6% 21.8% 21.9% 22.0% 22.1%
UnMod AVA, Good IR 9.2% 15.2% 21.5% 21.6% 21.6% 21.5% 21.3% 21.0%
Mod AVA, Poor IR 9.2% 15.2% 17.6% 18.1% 22.3% 23.9% 25.2% 26.3%
Mod AVA, Exp IR 9.2% 15.2% 17.6% 18.1% 20.1% 20.4% 20.8% 21.1%
Mod AVA, Good IR 9.2% 15.2% 17.6% 18.1% 18.5% 18.7% 18.8% 18.8%
09/10 10/11 11/12 12/13 13/14 14/15 15/16 16/17

Contribution Projections Miscellaneous
February 22, 2011 23
Market Value Investment Return: June 30, 2010 13.3%6 June 30, 2011 - 2015 Poor Investment Return: ≈ 0.4% - 3.6% Expected Investment Ret: ≈ 7.75%/7.5%7 Good Investment Return: ≈ 11.8% - 15.3%
Fresh Starts: No Fresh Starts for 11/12 15 Year 1.7% 20 Year 0.1% 30Year -1.4%
Estimated impact of: June 30, 2010 Anticipated 0.25% decrease in discount rate ≈2.3%
No Other: Gains or Losses Method or Assumption Changes Benefit Improvements
6 As reported by CalPERS press release. 7 Assumes investment return matches assumed return, 7.50% beginning with 2012/13 fiscal year
Contribution Projections Miscellaneous
February 22, 2011 24
Investment Return Varies(7.50%)
5%
10%
15%
20%
25%
30%
UnMod AVA, Poor IR 9.2% 15.2% 21.5% 23.9% 24.2% 25.6% 26.8% 27.7%
UnMod AVA, Exp IR 9.2% 15.2% 21.5% 23.9% 24.1% 24.2% 24.3% 24.4%
UnMod AVA, Good IR 9.2% 15.2% 21.5% 23.9% 23.9% 23.8% 23.6% 23.3%
Mod AVA, Poor IR 9.2% 15.2% 17.6% 20.4% 24.6% 26.2% 27.5% 28.5%
Mod AVA, Exp IR 9.2% 15.2% 17.6% 20.4% 22.4% 22.7% 23.1% 23.4%
Mod AVA, Good IR 9.2% 15.2% 17.6% 20.4% 20.8% 21.0% 21.1% 21.1%
09/10 10/11 11/12 12/13 13/14 14/15 15/16 16/17

2.7% @ 55 Amendment 6/30/2007
February 22, 2011 25
Present Value of BenefitsBefore 2.7% @ 55
Unfunded PVB
(Unfunded Liability)
Actuarial Liability
Present Value of BenefitsAfter 2.7% @ 55
Unfunded PVB
(Unfunded Liability)
Actuarial Liability
Before 2.7% @ 55 After 2.7% @ 5555,400,000$ Unfunded PVB 80,500,000
(4,900,000) (Unfunded Liability) (21,000,000)
197,100,000 Actuarial Liability 213,200,000
247,700,000 PVB 272,700,000
2.7% @ 55 Amendment 6/30/2007
February 22, 2011 26
Present Value of Benefits Increase ≈ $ 25.0 million
Actuarial Liability Increase ≈ $ 16.1 million
Employer contribution rate increase ≈ 6.1%
Normal Cost ≈ 2.3%
Prior Cost ≈ 3.7%
Asset Method ≈ 0.0%
Fresh Start ≈ 0.0%
Employee contribution rate increase 1.0%

Plan Funded Status Safety
February 22, 2011 27
Present Value of BenefitsJune 30, 2008
Actuarial Liability
(Unfunded Liability)
Unfunded PVB
Present Value of BenefitsJune 30, 2009
Unfunded PVB
(Unfunded Liability)
Actuarial Liability
June 30, 2008 June 30, 2009
97,800,000$ Unfunded PVB 122,200,000$ (22,000,000) (Unfunded Liability) (38,600,000)
287,400,000 Actuarial Liability 317,400,000
363,200,000 PVB 401,000,000
Plan Funded Status Safety
February 22, 2011 28
What happened between 6/30/08 and 6/30/09?
Asset gain/(loss): ≈ (5.4) million
Actuarial gain/(loss): ≈ (6.2) million
Average Salary $91,100 $100,000
Number of Actives 333 329
Number of Inactives 143 145
Number of Retirees 336 342
Contribution gain/(loss): ≈ 1.1 million
Expected ≈ (10.0)
Actual ≈ 11.1
Assumption Changes: ≈ (5.7) million
Expected UAL Decrease/(Increase): ≈ (0.5) million

Members Included in Valuation Safety
February 22, 2011 29
-
50
100
150
200
250
300
350
Active 259 265 272 266 272 262 279 286 274 270 278 292 309 319 333 329
Transfers 26 25 42 48 36 50 44 51 67 77 78 77 87 94 95 93
Vested Terminations 17 19 24 30 31 24 25 34 30 37 44 50 54 50 48 52
Receiving Payments 168 183 196 212 220 228 237 246 267 277 286 301 311 321 336 342
1994 1995 1996 1997 1998 1999 2000 2001 2002 2003 2004 2005 2006 2007 2008 2009
Average Age/Service Safety
February 22, 2011 30
-
5.0
10.0
15.0
20.0
25.0
30.0
35.0
40.0
45.0
Average Age 39.1 38.8 38.9 39.5 39.9 40.4 40.2 40.2 40.3 40.8 40.8 39.9 39.7 39.8 39.1 39.9
Average Service 12.6 12.3 11.1 11.6 11.5 11.9 11.7 11.5 11.1 11.6 11.5 10.8 10.8 11.1 10.4 11.1
1994 1995 1996 1997 1998 1999 2000 2001 2002 2003 2004 2005 2006 2007 2008 2009

Average PERSable Wages Safety
February 22, 2011 31
20,000
30,000
40,000
50,000
60,000
70,000
80,000
90,000
100,000
Average 50,600 50,300 48,800 50,500 51,500 55,400 58,900 60,400 62,100 64,800 68,200 75,100 82,400 90,200 91,100 100,00
1994 1995 1996 1997 1998 1999 2000 2001 2002 2003 2004 2005 2006 2007 2008 2009
Total Annual PERSable Wages (Millions) Safety
February 22, 2011 32
0
5
10
15
20
25
30
35
40
Current 13.1 13.3 13.3 13.4 14.0 14.5 16.4 17.3 17.0 17.5 19.0 21.9 25.4 28.5 30.3 32.9
Projected 14.3 14.6 15.2 15.0 15.6 16.2 18.3 19.3 19.0 19.2 20.9 24.1 28.0 31.4 33.4 36.2
1994 1995 1996 1997 1998 1999 2000 2001 2002 2003 2004 2005 2006 2007 2008 2009

Members Receiving Payments Safety
February 22, 2011 33
-
50
100
150
200
250
300
350
Service Retirement 48 65 70 74 82 94 96 109 113
Disability Retirement 180 184 185 188 191 188 193 164 193
Beneficiaries 18 18 21 23 27 28 31 33 36
Total Retirements 246 267 276 285 300 310 320 306 342
2001 2002 2003 2004 2005 2006 2007 2008 2009
Average Annuity Safety
February 22, 2011 34
-
5,000
10,000
15,000
20,000
25,000
30,000
35,000
40,000
45,000
50,000
55,000
60,000
Average Service Ret 29,700 34,000 37,400 39,700 43,900 44,100 45,700 49,700 52,100
Average Disabled Ret 22,300 23,500 24,400 25,000 27,700 28,600 29,500 30,700 31,700
Average Ret Annuity 23,900 26,200 27,900 29,100 32,500 33,800 34,900 37,500 39,200
2001 2002 2003 2004 2005 2006 2007 2008 2009
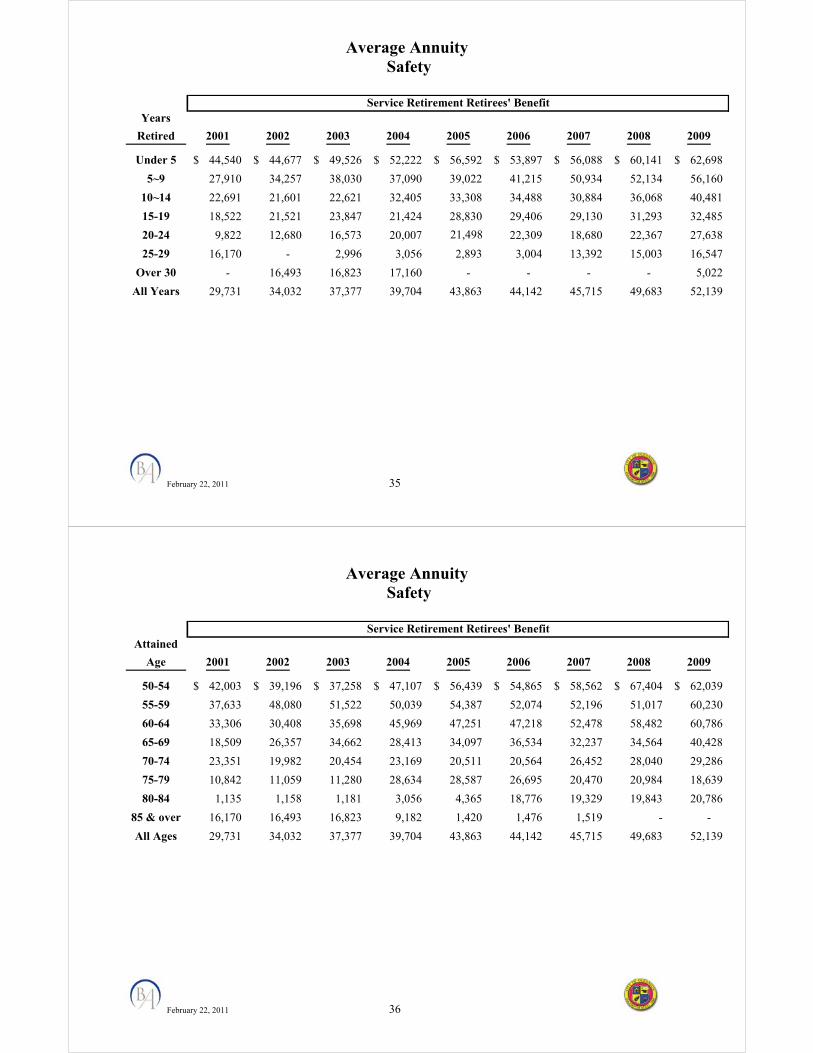
Average Annuity Safety
February 22, 2011 35
Years
Retired 2001 2002 2003 2004 2005 2006 2007 2008 2009
Under 5 44,540$ 44,677$ 49,526$ 52,222$ 56,592$ 53,897$ 56,088$ 60,141$ 62,698$
5~9 27,910 34,257 38,030 37,090 39,022 41,215 50,934 52,134 56,160
10~14 22,691 21,601 22,621 32,405 33,308 34,488 30,884 36,068 40,481
15-19 18,522 21,521 23,847 21,424 28,830 29,406 29,130 31,293 32,485
20-24 9,822 12,680 16,573 20,007 21,498 22,309 18,680 22,367 27,638
25-29 16,170 - 2,996 3,056 2,893 3,004 13,392 15,003 16,547
Over 30 - 16,493 16,823 17,160 - - - - 5,022
All Years 29,731 34,032 37,377 39,704 43,863 44,142 45,715 49,683 52,139
Service Retirement Retirees' Benefit
Average Annuity Safety
February 22, 2011 36
Attained
Age 2001 2002 2003 2004 2005 2006 2007 2008 2009
50-54 42,003$ 39,196$ 37,258$ 47,107$ 56,439$ 54,865$ 58,562$ 67,404$ 62,039$
55-59 37,633 48,080 51,522 50,039 54,387 52,074 52,196 51,017 60,230
60-64 33,306 30,408 35,698 45,969 47,251 47,218 52,478 58,482 60,786
65-69 18,509 26,357 34,662 28,413 34,097 36,534 32,237 34,564 40,428
70-74 23,351 19,982 20,454 23,169 20,511 20,564 26,452 28,040 29,286
75-79 10,842 11,059 11,280 28,634 28,587 26,695 20,470 20,984 18,639
80-84 1,135 1,158 1,181 3,056 4,365 18,776 19,329 19,843 20,786
85 & over 16,170 16,493 16,823 9,182 1,420 1,476 1,519 - -
All Ages 29,731 34,032 37,377 39,704 43,863 44,142 45,715 49,683 52,139
Service Retirement Retirees' Benefit

Actuarial Investment Return Safety
February 22, 2011 37
-31.00%
-23.25%
-15.50%
-7.75%
0.00%
7.75%
15.50%
23.25%
AVA Modified 8.3% 8.9% 9.1% 9.4% 8.9% 8.6% 7.0% 3.9% 6.8% 7.6% 8.0% 8.2% 9.2% 8.0% 5.8% 6.1% 0.3%
MVA Rate 16.3 15.3 20.1 19.5 12.5 10.5 -7.2%-6.0% 3.7% 16.6 12.3 11.9 18.8 -5.1% -24.0 13.3 7.8%
AVA Unmodified 8.3% 8.9% 9.1% 9.4% 8.9% 8.6% 7.0% 3.9% 6.8% 7.6% 8.0% 8.2% 9.2% 8.0% -6.9% 6.9% 6.9%
1995 1996 1997 1998 1999 2000 2001 2002 2003 2004 2005 2006 2007 2008 2009 2010 2011
Actuarial Investment Return Safety
February 22, 2011 38
Above assumes contributions, payments, etc. received evenly throughout year. 6/30/09:
Market Value return ≈ (24.0)% Actuarial Value return
Modified ≈ 5.8% Unmodified ≈ (6.9)%
6/30/10: Market Value return ≈ 13.3 % 8 Actuarial Value return
Modified ≈ 6.1 % Unmodified ≈ 6.9%
6/30/11: Market Value return through 11/30/10 ≈ 9.4 % Estimated Annualized MVA Return9 ≈ 7.8 % Est. Annualized Modified AVA Return ≈ 0.3 %
8 As reported by CalPERS press release. 9 CalPERS assumed investment return 7.75%

Asset Values (Millions) Safety
February 22, 2011 39
0
50
100
150
200
250
300
Actuarial 73 79 92 106 125 141 161 165 154 156 166 180 230 249 265 279 293 290
Market 73 84 99 117 139 155 168 153 140 142 163 186 244 289 271 204 228 242
1994 1995 1996 1997 1998 1999 2000 2001 2002 2003 2004 2005 2006 2007 2008 2009 2010 2011
6/30/10 & 6/30/11 asset values estimated
Funded Status Safety
February 22, 2011 40
0%
20%
40%
60%
80%
100%
120%
140%
Funded Ratio - AVA 100% 98% 98% 103% 110% 114% 106% 99% 87% 83% 82% 81% 94% 93% 92% 88% 87% 81%
Funded Ratio - MVA 99% 104% 105% 115% 122% 126% 111% 92% 79% 76% 81% 83% 100% 108% 94% 64% 67% 67%
1994 1995 1996 1997 1998 1999 2000 2001 2002 2003 2004 2005 2006 2007 2008 2009 2010 2011
6/30/10 & 6/30/11 funded status estimated

Funded Status (Millions) Safety
February 22, 2011 41
-
50.0
100.0
150.0
200.0
250.0
300.0
350.0
400.0
Actuarial Liability 73.7 80.9 94.0 102.4 113.4 123.2 151.7 166.2 176.8 187.7 202.1 222.7 244.6 268.9 287.4 317.4 337.5 358.3
Actuarial Asset Value 73.4 79.4 91.8 105.6 125.1 141.0 160.9 164.8 154.0 156.2 165.7 180.2 230.2 249.5 265.4 278.7 292.7 289.9
1994 1995 1996 1997 1998 1999 2000 2001 2002 2003 2004 2005 2006 2007 2008 2009 2010 2011
6/30/10 & 6/30/11 asset values estimated
Funded Status Safety
February 22, 2011 42
Investment gains/(losses) – Impact on funded status: Actuarial asset “reserve” at 6/30/09 -36.7% 6/30/10 [13.3% compared to 7.75%] 5.6% 6/30/11 [7.8% compared to 7.75%] 0.0% Total estimated % loss through 6/30/10 -31.2% Total estimated unrecognized gain $ -63.6 million
[ -31.2% x $ 204 ] Projected 6/30/08 6/30/09 6/30/11 6/30/41 UAL10 (millions) $ 22.0 $ 38.7 $42.8 $36.3 Investment losses 09/1011 63.6 82.7 Investment gains 10/114 0.0 0.0 Total 106.4 119.0 10 Does not include asset gains or losses after June 30, 2009. 11 Ignores future gains & losses (after 6/30/10) and asset smoothing, and assumes continuance of 30-year rolling
amortization method.

Contribution Rates Safety
February 22, 2011 43
-15%
-10%
-5%
0%
5%
10%
15%
20%
25%
30%
35%
Normal Cost 14.1%14.2%14.8%12.5%14.9%14.8%20.6%20.4%20.6%18.1% 18.2% 18.2% 18.2% 18.2% 18.1% 19.4%
UAL Amort 0.6% 2.5% 0.8% -3.8% -9.9% -12.9 -6.2% 1.5% 13.4% 0.0% 0.0% 0.6% 3.5% 4.1% 4.1% 7.4%
Total 14.6%16.7%15.7% 8.7% 5.0% 1.9% 14.4%21.8%33.9%18.1% 18.2% 18.8% 21.8% 22.2% 22.3% 26.8%
1994 1995 1996 1997 1998 1999 2000 2001 2002 2003 2004 2005 2006 2007 2008 2009
Contribution Rates Safety
February 22, 2011 44
6/30/08 6/30/09 2010/2011 2011/2012
Normal cost 18.1% 19.4%
Amortization bases: (Gain)/Loss 4.1% 3.8% Special (Gain)/Loss - 2.0% Assumptions Change 0.0% 1.6%
Sub-total 4.1% 7.4% Total: 22.2% 26.8% Amortization period 30 years
Multiple ≈ 27 years
What Happened from 6/30/08 to 6/30/09: 2010/11 Rate 22.2% (Gains)/Losses 1.7 Assumption Change 2.9 2011/12 Rate 26.8%

Contribution Projections Safety
February 22, 2011 45
Market Value Investment Return: June 30, 2010 13.3%12 June 30, 2011 - 2015 Poor Investment Return: ≈ 0.4% - 3.6% Expected Investment Ret: ≈ 7.75% Good Investment Return: ≈ 11.8% - 15.3%
Fresh Starts: No Fresh Starts for 11/12 15 Year 3.4% 20 Year 1.5% 30 Year -0.3%
No Other: Gains or Losses Method or Assumption Changes Benefit Improvements
12 As reported by CalPERS press release.
Contribution Projections Safety
February 22, 2011 46
Investment Return Varies(7.75%)
20%
25%
30%
35%
40%
45%
50%
UnMod AVA, Poor IR 22.2% 22.3% 33.6% 33.8% 34.4% 37.1% 39.2% 40.9%
UnMod AVA, Exp IR 22.2% 22.3% 33.6% 33.8% 34.0% 34.1% 34.3% 34.4%
UnMod AVA, Good IR 22.2% 22.3% 33.6% 33.8% 33.7% 33.5% 33.1% 32.6%
Mod AVA, Poor IR 22.2% 22.3% 26.8% 27.6% 35.0% 37.7% 40.0% 41.8%
Mod AVA, Exp IR 22.2% 22.3% 26.8% 27.6% 31.4% 31.9% 32.3% 32.8%
Mod AVA, Good IR 22.2% 22.3% 26.8% 27.6% 28.1% 28.4% 28.6% 28.6%
09/10 10/11 11/12 12/13 13/14 14/15 15/16 16/17
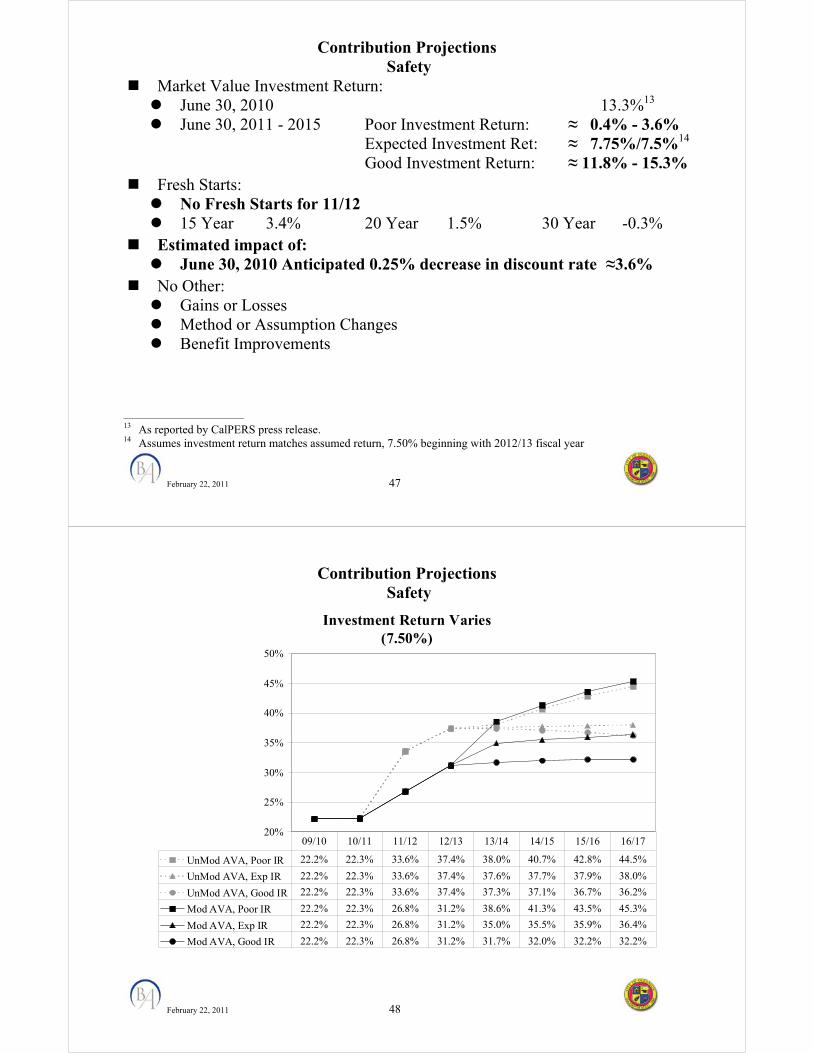
Contribution Projections Safety
February 22, 2011 47
Market Value Investment Return: June 30, 2010 13.3%13 June 30, 2011 - 2015 Poor Investment Return: ≈ 0.4% - 3.6% Expected Investment Ret: ≈ 7.75%/7.5%14 Good Investment Return: ≈ 11.8% - 15.3%
Fresh Starts: No Fresh Starts for 11/12 15 Year 3.4% 20 Year 1.5% 30 Year -0.3%
Estimated impact of: June 30, 2010 Anticipated 0.25% decrease in discount rate ≈3.6%
No Other: Gains or Losses Method or Assumption Changes Benefit Improvements
13 As reported by CalPERS press release. 14 Assumes investment return matches assumed return, 7.50% beginning with 2012/13 fiscal year
Contribution Projections Safety
February 22, 2011 48
Investment Return Varies(7.50%)
20%
25%
30%
35%
40%
45%
50%
UnMod AVA, Poor IR 22.2% 22.3% 33.6% 37.4% 38.0% 40.7% 42.8% 44.5%
UnMod AVA, Exp IR 22.2% 22.3% 33.6% 37.4% 37.6% 37.7% 37.9% 38.0%
UnMod AVA, Good IR 22.2% 22.3% 33.6% 37.4% 37.3% 37.1% 36.7% 36.2%
Mod AVA, Poor IR 22.2% 22.3% 26.8% 31.2% 38.6% 41.3% 43.5% 45.3%
Mod AVA, Exp IR 22.2% 22.3% 26.8% 31.2% 35.0% 35.5% 35.9% 36.4%
Mod AVA, Good IR 22.2% 22.3% 26.8% 31.2% 31.7% 32.0% 32.2% 32.2%
09/10 10/11 11/12 12/13 13/14 14/15 15/16 16/17

Safety 3% @ 50 Amendment 6/30/1999
February 22, 2011 49
Present Value of BenefitsBefore 3.0% @ 50
Unfunded PVB
Excess Assets
Actuarial Liability
Present Value of BenefitsAfter 3.0% @ 50
Unfunded PVB
Excess Assets
Actuarial Liability
Before3.0% @ 50
After3.0% @ 50
15,900,000$ Unfunded PVB 24,400,000$
17,800,000 Excess Assets 11,600,000
123,200,000 Actuarial Liability 135,900,000
156,900,000 PVB 171,900,000
Safety 3% @ 50 Amendment 6/30/1999
February 22, 2011 50
Present Value of Benefits Increase ≈ $ 14.9 million
Actuarial Liability Increase ≈ $ 12.7 million
Actuarial Asset Increase ≈ $ 6.5 million
Employer contribution rate increase ≈ 9.4%
Normal Cost ≈ 5.2%
Prior Cost ≈ 7.7%
Asset Method ≈ -3.5%
Fresh Start ≈ 0.0%
Employee contribution rate increase 0.0%

Contribution Policy
February 22, 2011 51
Consider policy implications of not increasing CalPERS contributions:
UAL not being paid off
Generational shift of Unfunded Liability
Similar to minimum payment on credit card balance
Contribution Policy
February 22, 2011 52
Consider one of the following: Adjust contribution to get rate close to rate prior to asset
smoothing modification Requires changing amortization period each year
Asking CalPERS to use “Fresh Start” Higher rates 2011/12 and beyond
Fresh start with declining period 2011/12 30 years 2012/13 29 years ↓ ↓ CalPERS will not automatically do this
Use fixed amortization schedule: CalPERS will not keep track of bases Requires:
Asking CalPERS to use “Fresh Start” Shorter amortization period

Benefit Factors Miscellaneous
February 22, 2011 53
Benefit Factor Comparison
1.0%
1.2%
1.4%
1.6%
1.8%
2.0%
2.2%
2.4%
2.6%
2.8%
3.0%
50 51 52 53 54 55 56 57 58 59 60 61 62 63 64 65
Retirement Age
Fac
tor
2%@60 2%@55 2.5%@55 2.7%@55 3%@60
Benefit Factors Miscellaneous
February 22, 2011 54
Age 1.5%@65 2%@60 2%@55 2.5%@55 2.7%@55 3%@60
50 0.500% 1.092% 1.426% 2.000% 2.000% 2.000% 51 0.567% 1.156% 1.522% 2.100% 2.140% 2.100% 52 0.633% 1.224% 1.628% 2.200% 2.280% 2.200% 53 0.700% 1.296% 1.742% 2.300% 2.420% 2.300% 54 0.767% 1.376% 1.866% 2.400% 2.560% 2.400%
55 0.833% 1.460% 2.000% 2.500% 2.700% 2.500% 56 0.900% 1.552% 2.052% 2.500% 2.700% 2.600% 57 0.967% 1.650% 2.104% 2.500% 2.700% 2.700% 58 1.033% 1.758% 2.156% 2.500% 2.700% 2.800% 59 1.100% 1.874% 2.210% 2.500% 2.700% 2.900%
60 1.167% 2.000% 2.262% 2.500% 2.700% 3.000% 61 1.233% 2.134% 2.314% 2.500% 2.700% 3.000% 62 1.300% 2.272% 2.366% 2.500% 2.700% 3.000% 63 1.367% 2.418% 2.418% 2.500% 2.700% 3.000% 64 1.433% 2.418% 2.418% 2.500% 2.700% 3.000% 65 1.500% 2.418% 2.418% 2.500% 2.700% 3.000%
Member Contribution Rate 2% 7% 7% 8% 8% 8%

Benefit Factors Safety
February 22, 2011 55
Benefit Factor Comparison
0.0%
0.5%
1.0%
1.5%
2.0%
2.5%
3.0%
3.5%
50 51 52 53 54 55 56 57 58 59 60
Retirement Age
Fac
tor
2% @ 55 2% @ 50 3% @ 55 3% @ 50
Benefit Factors Safety
February 22, 2011 56
Age 2% @ 55 2% @ 50 3% @ 55 3% @ 50
50 1.426% 2.00% 2.40% 3.00% 51 1.522% 2.14% 2.52% 3.00% 52 1.628% 2.28% 2.64% 3.00% 53 1.742% 2.42% 2.76% 3.00% 54 1.866% 2.56% 2.88% 3.00%
55 2.00% 2.70% 3.00% 3.00% 56 2.00% 2.70% 3.00% 3.00% 57 2.00% 2.70% 3.00% 3.00% 58 2.00% 2.70% 3.00% 3.00% 59 2.00% 2.70% 3.00% 3.00%
60 2.00% 2.70% 3.00% 3.00%
Member Contribution Rate
8% 9% 9% 9%

Current Benefits
February 22, 2011 57
Miscellaneous Safety Benefit Formula FAE PRSA COLA EPMC15
2.7% @ 55 One Year (FAE1)
Yes 2%
4.6%
3% @ 50 One Year (FAE1)
Yes 2%
2.1% 11/12 ER Contr.
Normal Cost
10.4%
19.4% Amortizations 7.2 7.4 Subtotal
EPMC PERS on PERS
Normal Cost Amortizations EPMC Subtotal
Total
17.6 4.6
0.5 0.3
0.2 1.0
23.2
26.8 2.1
0.4 0.2
0.0 0.6
29.5
15 Assumes City pays member contributions based on MOU. The EPMCs shown above are a weighted average. All
EPMC is reported as PERSable wages.
Alternative Benefits
February 22, 2011 58
Alternative Benefits – Employees Hired > 7/1/11 Miscellaneous: 2.5%@55, 2%@55, 2%@6016 Safety: 3%@55, 2%@50, 2%@55
Estimated ER Normal Cost Based on Pool Normal Cost from the 6/30/09 valuation Adjusted for demographic difference 1. Employer pays member contributions and included in PERSable wages
Miscellaneous Formula Current 2.5%@55 2%@55 2%@60
Normal Cost FAE 1 & PRSA Subtotal EPMC PERS on PERS Total
10.4 Included
10.4 4.6 0.7
15.6
7.9% 1.4 9.3 4.6
0.5 14.4
6.9% 1.2 8.1 3.6 0.4
12.1
6.0% 1.1 7.1 3.6 0.3
11.0 Saving from current
formula 1.2% 3.5% 4.6%
16 We did not include 1.5%@65 for Miscellaneous because no agency has contracted this formula.

Alternative Benefits
February 22, 2011 59
Safety Formula Current 3%@55 2%@50 2%@55
Normal Cost FAE 1 & PRSA Subtotal EPMC PERS on PERS Total
19.4 Included
19.4 2.1 0.4
21.9
15.3% 2.6 17.9
2.1 0.4 20.4
13.7% 2.2
15.9 2.1 0.4
18.3
12.8% 1.9
14.7 1.1 0.2
16.0 Saving from current
formula 1.5% 3.6% 5.9%
Alternative Benefits
February 22, 2011 60
2. Employer does not pay member contribution for Tier 2
Miscellaneous Formula Current 2.5%@55 2%@55 2%@60
Normal Cost FAE 1 & PRSA Subtotal EPMC PERS on PERS Total
10.4 Included
10.4 4.6 0.7
15.6
7.9% 1.4 9.3 0.0
0.0 9.3
6.9% 1.2 8.1 0.0 0.0 8.1
6.0% 1.1 7.1 0.0 0.0 7.1
Saving from current formula
6.3% 7.5% 8.5%
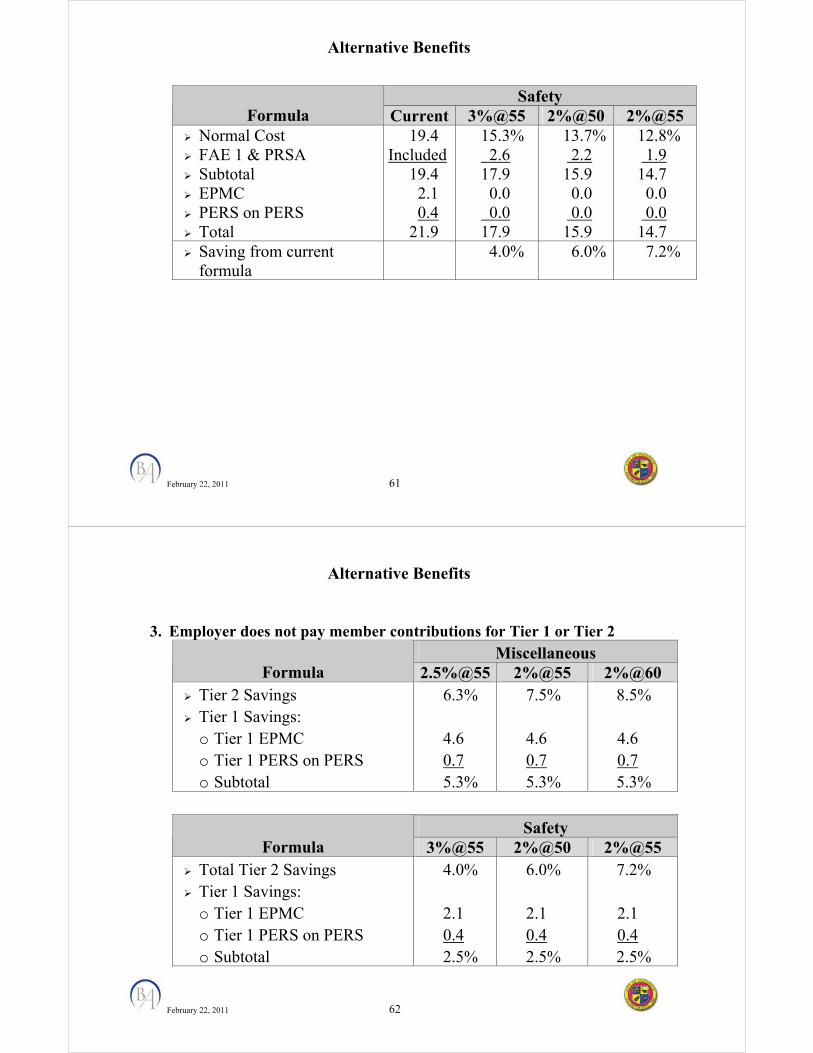
Alternative Benefits
February 22, 2011 61
Safety
Formula Current 3%@55 2%@50 2%@55 Normal Cost FAE 1 & PRSA Subtotal EPMC PERS on PERS Total
19.4 Included
19.4 2.1 0.4
21.9
15.3% 2.6 17.9
0.0 0.0 17.9
13.7% 2.2
15.9 0.0 0.0
15.9
12.8% 1.9
14.7 0.0 0.0
14.7 Saving from current
formula 4.0% 6.0% 7.2%
Alternative Benefits
February 22, 2011 62
3. Employer does not pay member contributions for Tier 1 or Tier 2 Miscellaneous
Formula 2.5%@55 2%@55 2%@60 Tier 2 Savings Tier 1 Savings:
o Tier 1 EPMC o Tier 1 PERS on PERS o Subtotal
6.3%
4.6 0.7 5.3%
7.5%
4.6 0.7 5.3%
8.5%
4.6 0.7 5.3%
Safety
Formula 3%@55 2%@50 2%@55 Total Tier 2 Savings Tier 1 Savings:
o Tier 1 EPMC o Tier 1 PERS on PERS o Subtotal
4.0%
2.1 0.4 2.5%
6.0%
2.1 0.4 2.5%
7.2%
2.1 0.4 2.5%

Alternative Benefits
February 22, 2011 63
Estimated Savings
Projection based on benefits earned, not benefits being paid out
Tier 1 savings % apply to Tier 1 payroll, Tier 2 savings % apply to Tier 2 payroll
Alternative Benefits
February 22, 2011 64
This page intentionally left blank.

Projected Payroll (000’s)
February 22, 2011 65
Miscellaneous 1. Tier 1 and Tier 2 with EPMC
Year Tier 1 Tier 2 Total
2011/12 $ 45,258 $ 3,344 $ 48,602
2012/13 43,823 6,359 50,182 2013/14 42,477 9,335 51,813 2014/15 41,041 12,456 53,497 2015/16 39,443 15,793 55,235 2016/17 37,787 19,243 57,031
2017/18 36,032 22,852 58,884 2018/19 34,407 26,391 60,798 2019/20 32,549 30,225 62,774 2020/21 30,855 33,959 64,814 2021/22 29,097 37,824 66,920
Projected Payroll (000’s)
February 22, 2011 66
Miscellaneous 2. Tier 1 with EPMC, Tier 2 without EPMC
Year Tier 1 Tier 2 Total
2011/12 $ 45,258 $ 3,199 $ 48,457
2012/13 43,823 6,082 49,905 2013/14 42,477 8,929 51,407 2014/15 41,041 11,914 52,955 2015/16 39,443 15,106 54,548 2016/17 37,787 18,406 56,193
2017/18 36,032 21,857 57,890 2018/19 34,407 25,242 59,649 2019/20 32,549 28,909 61,458 2020/21 30,855 32,481 63,336 2021/22 29,097 36,178 65,274

Projected Payroll (000’s)
February 22, 2011 67
Miscellaneous 3. Tier 1 and Tier 2 without EPMC
Year Tier 1 Tier 2 Total
2011/12 $ 43,289 $ 3,199 $ 46,487
2012/13 41,916 6,082 47,998 2013/14 40,629 8,929 49,558 2014/15 39,255 11,914 51,169 2015/16 37,726 15,106 52,832 2016/17 36,143 18,406 54,549
2017/18 34,464 21,857 56,322 2018/19 32,910 25,242 58,152 2019/20 31,133 28,909 60,042 2020/21 29,513 32,481 61,993 2021/22 27,830 36,178 64,008
Projected Payroll (000’s)
February 22, 2011 68
Safety 1. Tier 1 and Tier 2 with EPMC
Year Tier 1 Tier 2 Total
2011/12 $ 35,079 $ 1,140 $ 36,219
2012/13 34,801 2,595 37,396 2013/14 34,258 4,353 38,611 2014/15 33,817 6,049 39,866 2015/16 33,254 7,908 41,162 2016/17 32,641 9,859 42,499
2017/18 31,988 11,892 43,881 2018/19 31,372 13,935 45,307 2019/20 30,709 16,070 46,779 2020/21 30,115 18,185 48,300 2021/22 29,337 20,532 49,869
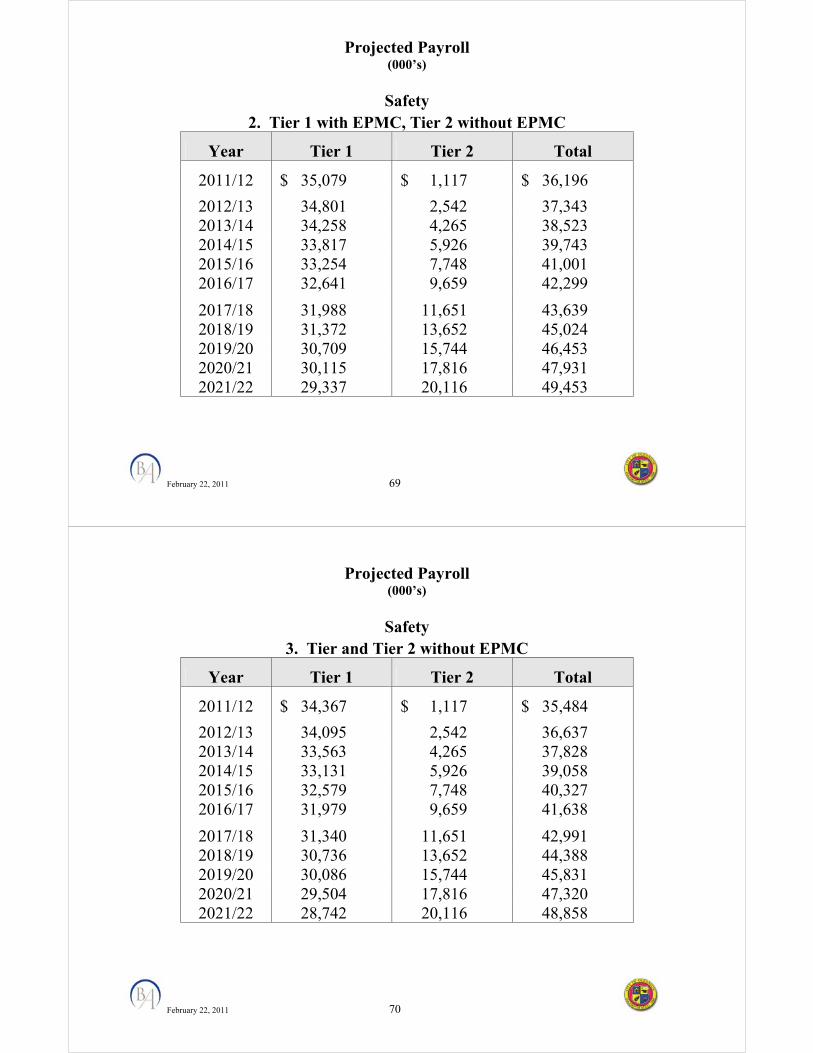
Projected Payroll (000’s)
February 22, 2011 69
Safety 2. Tier 1 with EPMC, Tier 2 without EPMC
Year Tier 1 Tier 2 Total
2011/12 $ 35,079 $ 1,117 $ 36,196
2012/13 34,801 2,542 37,343 2013/14 34,258 4,265 38,523 2014/15 33,817 5,926 39,743 2015/16 33,254 7,748 41,001 2016/17 32,641 9,659 42,299
2017/18 31,988 11,651 43,639 2018/19 31,372 13,652 45,024 2019/20 30,709 15,744 46,453 2020/21 30,115 17,816 47,931 2021/22 29,337 20,116 49,453
Projected Payroll (000’s)
February 22, 2011 70
Safety 3. Tier and Tier 2 without EPMC
Year Tier 1 Tier 2 Total
2011/12 $ 34,367 $ 1,117 $ 35,484
2012/13 34,095 2,542 36,637 2013/14 33,563 4,265 37,828 2014/15 33,131 5,926 39,058 2015/16 32,579 7,748 40,327 2016/17 31,979 9,659 41,638
2017/18 31,340 11,651 42,991 2018/19 30,736 13,652 44,388 2019/20 30,086 15,744 45,831 2020/21 29,504 17,816 47,320 2021/22 28,742 20,116 48,858

Estimated Savings (000’s)
February 22, 2011 71
Miscellaneous 1. Both Tier 1 and Tier 2 with EPMC
Savings 2.5% @ 55 Savings 2.0% @ 55
Year Employer
ContributionEmployee
Contribution
Total Employer
Contribution Employee
Contribution
Total
2011/12 $ 39 $ - $ 39 $ 78 $ 32 $ 110
2012/13 75 - 75 148 61 209 2013/14 110 - 110 217 89 306 2014/15 147 - 147 289 119 408 2015/16 186 - 186 367 151 518 2016/17 227 - 227 447 184 631
2017/18 270 - 270 531 219 750 2018/19 312 - 312 613 252 865 2019/20 357 - 357 702 289 991 2020/21 401 - 401 789 325 1,114 2021/22 446 - 446 878 362 1,240
Estimated Savings (000’s)
February 22, 2011 72
Miscellaneous 1. Both Tier 1 and Tier 2 with EPMC
Savings 2.0% @ 60
Year Employer
ContributionEmployee
Contribution
Total
2011/12 $ 114 $ 32 $ 146
2012/13 217 61 278 2013/14 319 89 408 2014/15 426 119 545 2015/16 540 151 691 2016/17 658 184 842
2017/18 781 219 1,000 2018/19 902 252 1,154 2019/20 1,033 289 1,322 2020/21 1,161 325 1,486 2021/22 1,293 362 1,655

Estimated Savings (000’s)
February 22, 2011 73
Miscellaneous 2. Tier 1 with EPMC, Tier 2 without EPMC
Savings 2.5%@55 Savings 2%@55
Year Employer
ContributionEmployee
Contribution
Total Employer
Contribution Employee
Contribution
Total
2011/12 $ 60 $ 146 $ 206 $ 95 $ 146 $ 241
2012/13 113 277 390 180 277 457 2013/14 166 406 572 264 406 670 2014/15 222 542 764 353 542 895 2015/16 281 687 968 447 687 1,134 2016/17 343 837 1,180 545 837 1,382
2017/18 407 994 1,401 647 994 1,641 2018/19 470 1,149 1,619 747 1,149 1,896 2019/20 538 1,315 1,853 856 1,315 2,171 2020/21 605 1,478 2,083 961 1,478 2,439 2021/22 673 1,646 2,319 1,071 1,646 2,717
Estimated Savings (000’s)
February 22, 2011 74
Miscellaneous 2. Tier 1 with EPMC, Tier 2 without EPMC
Savings 2%@60
Year Employer
ContributionEmployee
Contribution
Total
2011/12 $ 130 $ 146 $ 276
2012/13 247 277 524 2013/14 362 406 768 2014/15 483 542 1,025 2015/16 613 687 1,300 2016/17 747 837 1,584
2017/18 887 994 1,881 2018/19 1,024 1,149 2,173 2019/20 1,173 1,315 2,488 2020/21 1,318 1,478 2,796 2021/22 1,468 1,646 3,114

Estimated Savings (000’s)
February 22, 2011 75
Miscellaneous 3. Tier 1 and Tier 2 without EPMC
Savings 2.5%@55 Savings 2%@55
Year Employer
ContributionEmployee
Contribution
Total Employer
Contribution Employee
Contribution
Total
2011/12 $ 381 $ 2,115 $ 2,496 $ 419 $ 2,115 $ 2,534
2012/13 421 2,184 2,605 494 2,184 2,678 2013/14 461 2,255 2,716 568 2,255 2,823 2014/15 503 2,328 2,831 646 2,328 2,974 2015/16 547 2,404 2,951 729 2,404 3,133 2016/17 593 2,482 3,075 814 2,482 3,296
2017/18 641 2,563 3,204 903 2,563 3,466 2018/19 689 2,646 3,335 991 2,646 3,637 2019/20 739 2,732 3,471 1,086 2,732 3,818 2020/21 790 2,821 3,611 1,180 2,821 4,001 2021/22 842 2,912 3,754 1,276 2,912 4,188
Estimated Savings (000’s)
February 22, 2011 76
Miscellaneous 3. Tier 1 and Tier 2 without EPMC
Savings 2%@60
Year Employer
ContributionEmployee
Contribution
Total
2011/12 $ 451 $ 2,115 $ 2,566
2012/13 555 2,184 2,739 2013/14 657 2,255 2,912 2014/15 765 2,328 3,093 2015/16 880 2,404 3,284 2016/17 998 2,482 3,480
2017/18 1,122 2,563 3,685 2018/19 1,244 2,646 3,890 2019/20 1,375 2,732 4,107 2020/21 1,504 2,821 4,325 2021/22 1,638 2,912 4,550

Estimated Savings (000’s)
February 22, 2011 77
Safety 1. Both Tier 1 and Tier 2 with EPMC
Savings 3%@55 Savings 2%@50
Year Employer
ContributionEmployee
Contribution
Total Employer
Contribution Employee
Contribution
Total
2011/12 $ 16 $ - $ 16 $ 41 $ - $ 41
2012/13 37 - 37 93 - 93 2013/14 62 - 62 155 - 155 2014/15 87 - 87 216 - 216 2015/16 113 - 113 282 - 282 2016/17 141 - 141 352 - 352
2017/18 171 - 171 425 - 425 2018/19 200 - 200 498 - 498 2019/20 230 - 230 574 - 574 2020/21 261 - 261 649 - 649 2021/22 294 - 294 733 - 733
Estimated Savings (000’s)
February 22, 2011 78
Safety 1. Both Tier 1 and Tier 2 with EPMC
Savings 2%@55
Year Employer
Contribution Employee
Contribution
Total
2011/12 $ 54 $ 11 $ 65
2012/13 123 25 148 2013/14 207 43 250 2014/15 288 59 347 2015/16 376 77 453 2016/17 469 97 566
2017/18 566 117 683 2018/19 663 137 800 2019/20 764 157 921 2020/21 865 178 1,043 2021/22 976 201 1,177

Estimated Savings (000’s)
February 22, 2011 79
Safety 2. Tier 1 with EPMC, Tier 2 without EPMC
Savings 3% @ 55 Savings 2% @ 50
Year Employer
ContributionEmployee
Contribution
Total Employer
Contribution Employee
Contribution
Total
2011/12 $ 21 $ 23 $ 44 $ 45 $ 23 $ 68
2012/13 48 53 101 102 53 155 2013/14 80 88 168 171 88 259 2014/15 111 123 234 238 123 361 2015/16 146 160 306 311 160 471 2016/17 181 200 381 388 200 588
2017/18 219 241 460 468 241 709 2018/19 256 283 539 548 283 831 2019/20 296 326 622 632 326 958 2020/21 335 369 704 715 369 1,084 2021/22 378 416 794 808 416 1,224
Estimated Savings (000’s)
February 22, 2011 80
Safety 2. Tier 1 with EPMC, Tier 2 without EPMC
Savings 2%@55
Year Employer
Contribution Employee
Contribution
Total
2011/12 $ 58 $ 23 $ 81
2012/13 132 53 185 2013/14 221 88 309 2014/15 307 123 430 2015/16 401 160 561 2016/17 500 200 700
2017/18 603 241 844 2018/19 707 283 990 2019/20 816 326 1,142 2020/21 923 369 1,292 2021/22 1,042 416 1,458

Estimated Savings (000’s)
February 22, 2011 81
Safety 3. Both Tier 1 and Tier 2 without EPMC
Savings 3% @ 55 Savings 2% @ 50
Year Employer
ContributionEmployee
Contribution
Total Employer
Contribution Employee
Contribution
Total
2011/12 $ 174 $ 735 $ 909 $ 198 $ 735 $ 933
2012/13 199 758 957 254 758 1,012 2013/14 229 783 1,012 320 783 1,103 2014/15 259 809 1,068 385 809 1,194 2015/16 290 835 1,125 456 835 1,291 2016/17 324 862 1,186 530 862 1,392
2017/18 358 890 1,248 607 890 1,497 2018/19 393 919 1,312 685 919 1,604 2019/20 429 949 1,378 766 949 1,715 2020/21 466 980 1,446 846 980 1,826 2021/22 506 1,011 1,517 935 1,011 1,946
Estimated Savings (000’s)
February 22, 2011 82
Safety 3. Both Tier 1 and Tier 2 without EPMC
Savings 2%@55
Year Employer
Contribution Employee
Contribution
Total
2011/12 $ 205 $ 735 $ 940
2012/13 302 733 1,035 2013/14 406 740 1,146 2014/15 506 749 1,255 2015/16 615 757 1,372 2016/17 730 765 1,495
2017/18 849 773 1,622 2018/19 969 782 1,751 2019/20 1,094 791 1,885 2020/21 1,219 801 2,020 2021/22 1,357 810 2,167

CalPERS Two Tier Options Non Pooled Plan
February 22, 2011 83
Option One
Two separate plans, two separate rates
Tier 1 (Current Plan) Closed to new employees
Gains/Losses amortized over decreasing payroll
ER rate increases
Forced to pool once counts drop below 100 & set up side fund
Tier 2 (New Plan) New employees join Tier 2
Lower ER rate
Stays in pool until counts > 100
Actual saving less because Tier 2 has to pay for pool amortization
CalPERS Two Tier Options Non Pooled Plan
February 22, 2011 84
Option Two
Two formulas/tiers, one blended rate
No rate impact until 3 years later e.g. if Tier 2 effective 7/1/11, no rate impact until FY 2014/15
ER rate decreases gradually as employees hired
Actual saving less because no rate impact until FY 2014/15 (3 years after change)
Option Three
Combined Option One and Two
Two separate rates for first 3 years (as in Option One)
Then merged to one blended rate, similar to Option Two
Actual saving slightly less
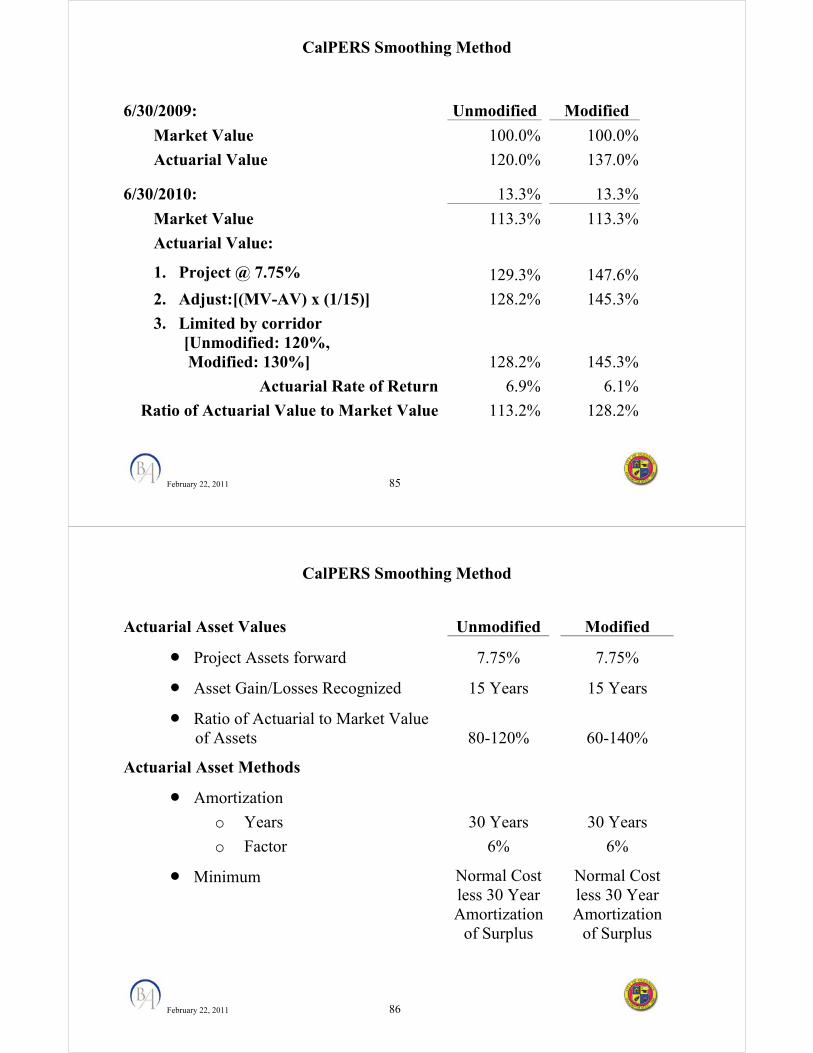
CalPERS Smoothing Method
February 22, 2011 85
6/30/2009: Unmodified Modified
Market Value 100.0% 100.0%
Actuarial Value 120.0% 137.0%
6/30/2010: 13.3% 13.3%
Market Value 113.3% 113.3%
Actuarial Value:
1. Project @ 7.75% 129.3% 147.6%
2. Adjust:[(MV-AV) x (1/15)] 128.2% 145.3%
3. Limited by corridor [Unmodified: 120%, Modified: 130%] 128.2% 145.3%
Actuarial Rate of Return 6.9% 6.1%
Ratio of Actuarial Value to Market Value 113.2% 128.2%
CalPERS Smoothing Method
February 22, 2011 86
Actuarial Asset Values Unmodified Modified
Project Assets forward 7.75% 7.75%
Asset Gain/Losses Recognized 15 Years 15 Years
Ratio of Actuarial to Market Value of Assets 80-120% 60-140%
Actuarial Asset Methods
Amortization
o Years 30 Years 30 Years
o Factor 6% 6%
Minimum Normal Cost less 30 Year Amortization
of Surplus
Normal Cost less 30 Year Amortization
of Surplus