city of portsmouth new hampshirefiles.cityofportsmouth.com/finance/cafr16.pdfcity of portsmouth new...
TRANSCRIPT
City of PortsmouthNew Hampshire
Comprehensive Annual Financial Report for Fiscal Year Ended June 30,2016
Planning Portsmouth
This year’s cover represents the next phase of development for the City and theimportance of civic involvement. The City has overcome hurdles in funding,especially over the past decade, yet Portsmouth is entering a vibrant era ofplanning that encompasses both City expansion and the conservation of ourcommunity values.
Throughout the past year, the City has hosted numerous charrettes andmeetings to give citizens a platform to be heard. This public input method hasbecome a core piece of the planning equation, and inspires ideas for the future.
Entering FY16, it is our hope that residents will continue to be key members ofplanning processes to empower the City to thrive.
CITY OF PORTSMOUTH, NEW HAMPSHIRE
Comprehensive Annual Financial Report
For the Year Ended June 30, 2016
Prepared by: The Finance Department
Judith Belanger Andrew Purgiel Finance Director Deputy Finance Director

City of Portsmouth, New Hampshire Comprehensive Annual Financial Report For the Fiscal Year Ended June 30, 2016
TABLE OF CONTENTS Page INTRODUCTORY SECTION: Transmittal Letter 1 Organizational Chart 17 Directory of Officials 18 GFOA Certificate of Achievement 19 FINANCIAL SECTION: Independent Auditors’ Report 21 Management’s Discussion and Analysis 24 Basic Financial Statements: Government-wide Financial Statements: Statement of Net Position 41 Statement of Activities 42 Fund Financial Statements: Governmental Funds: Balance Sheet 44 Reconciliation of Total Governmental Fund Balances to Net Position of Governmental Activities in the Statement of Net Position 45 Statement of Revenues, Expenditures, and Changes in Fund Balances 46 Reconciliation of the Statement of Revenues, Expenditures, and Changes in Fund Balances of Governmental Funds to the Statement of Activities 47
Page Statement of Revenues and Other Sources, and Expenditures and Other Uses - Budget and Actual - General Fund 48 Proprietary Funds: Statement of Net Position 49 Statement of Revenues, Expenses, and Changes in Fund Net Position 50 Statement of Cash Flows 51 Fiduciary Funds:
Statement of Fiduciary Net Position 52 Statement of Changes in Fiduciary Net Position 53 Notes to Financial Statements 55 Required Supplementary Information: Schedule of OPEB Funding Progress 91 Schedule of Proportionate Share of the Net Pension Liability 92 Schedule of Pension Contributions 93 Supplementary Statements and Schedules: Governmental Funds: Combining Financial Statements: Combining Balance Sheet - Nonmajor Governmental Funds 98 Combining Statement of Revenues, Expenditures, and Changes in Fund Equity - Nonmajor Governmental Funds 104 Fiduciary Funds: Combining Statement of Fiduciary Net Position - Private Purpose Trust Funds 110 Combining Statement of Changes in Fiduciary Net Position - Private Purpose Trust Funds 111 Combining Statement of Changes in Assets and Liabilities - Agency Funds 112
Page STATISTICAL SECTION: Financial Trends Net Position by Component 114 Changes in Net Position 115 Fund Balances, Governmental Funds 116 Changes in Fund Balances, Governmental Funds 117 Combined Enterprise Fund Revenue, Expenses, and Changes in Fund Net Position 118 Revenue Capacity General Government Tax Revenues by Source 119 Property Tax Levies and Collections 120 Assessed and Estimated Full Value of Real Property 121 Principal Taxpayers 122 Property Tax Rates per $1,000 of Assessed Value - Direct and Overlapping Governments 123 Utility Fund Net Budget, Billable Volumes and Rates 124 Portsmouth’s Share of the Rockingham County Tax Apportionment 125 Debt Capacity Ratios of Long Term Debt Outstanding and Legal Debt Limits 126 Ratios of Outstanding Debt by Debt Type 127 Direct and Overlapping Governmental Activities Debt 128 Ratios of General Bonded Debt Outstanding 129
Page Demographic and Economic Information Demographic Statistics 130 Principal Employers 131 Operating Information Operating Indicators by Function 132 Capital Asset Statistics by Function 133 City Government Employees by Function - Full Time Equivalents 134
1
CITY OF PORTSMOUTH Municipal Complex 1 Junkins Avenue Portsmouth, New Hampshire 03801 (603) 431-2000 December 21, 2016 Mayor and City Council City of Portsmouth One Junkins Avenue Portsmouth, NH 03801 To the Citizens, Mayor, and City Council of the City of Portsmouth: The Comprehensive Annual Financial Report of the City of Portsmouth for the Fiscal Year ended June 30, 2016, is hereby submitted. Responsibility for both the accuracy of the data, and the completeness and fairness of the presentation, including all dis-closures, rests with the City. To the best of our knowledge and belief, the following data, including financial statements, supporting schedules and statistical tables, is accurate in all material respects and is reported in a manner designed to present fairly the financial position and results of operations of the City. To provide a reasonable basis for making the representations, management has established a comprehensive internal control framework that is designed to both protect the government’s assets from loss, theft, or misuse and to compile sufficient reliable information for the prepa-ration of the financial statements in conformity with generally accepted accounting principles. Because the cost of internal control should not exceed anticipated benefits, the objective is to provide reasonable, rather than absolute, assurance that the financial statements are free of any material misstatements. City Charter, as well as State statutes, requires an annual audit by independent certi-fied public accountants. The City’s audit firm is Melanson Heath. The independent auditors’ report is located at the front of the financial section of this report. In addition, the City is required to undergo an annual audit in conformity with the provisions of the Title 2 U.S. Code of Federal Regulations (CFR) Part 200, Uniform Administrative Requirements, Cost Principles, and Audit Requirements for Federal Awards (Uniform Guidance). Information related to the Single Audit, including the Schedule of Expendi-tures of Federal Awards, findings and recommendations, and auditors’ reports on the internal control structure and compliance with applicable laws and regulations, is not included in this year’s CAFR but is available in a separate report. Management’s discussion and analysis (MD&A) immediately follows the independent auditors’ report and provides a narrative introduction, overview, and analysis of the

2
basic financial statements. The MD&A complements this letter of transmittal and should be read in conjunction with it for additional narrative overview and analysis of the City’s activities. This report includes all funds of the City. This report does not report on the Portsmouth Housing Authority or Rockingham County. These governmental units are independent of the City and do not meet the criteria for inclusion in the reporting entity, and accordingly are excluded from this report. PROFILE OF THE GOVERNMENT Originally settled in 1623, the City of Portsmouth was incorporated in 1849. It is located on New Hampshire’s seacoast on the Piscataqua River midway between Portland, Maine, 50 miles to the north, and Boston, Massachusetts, 49 miles to the south. Portsmouth is the New Hampshire seacoast’s trade and cultural center and a major distribution market for points in northern New England. Situated along Interstate 95, Portsmouth is served to the west by routes U.S. 4, N.H. 16 and 33 and to the north and south by the Spaulding Turnpike and U.S. Route 1.
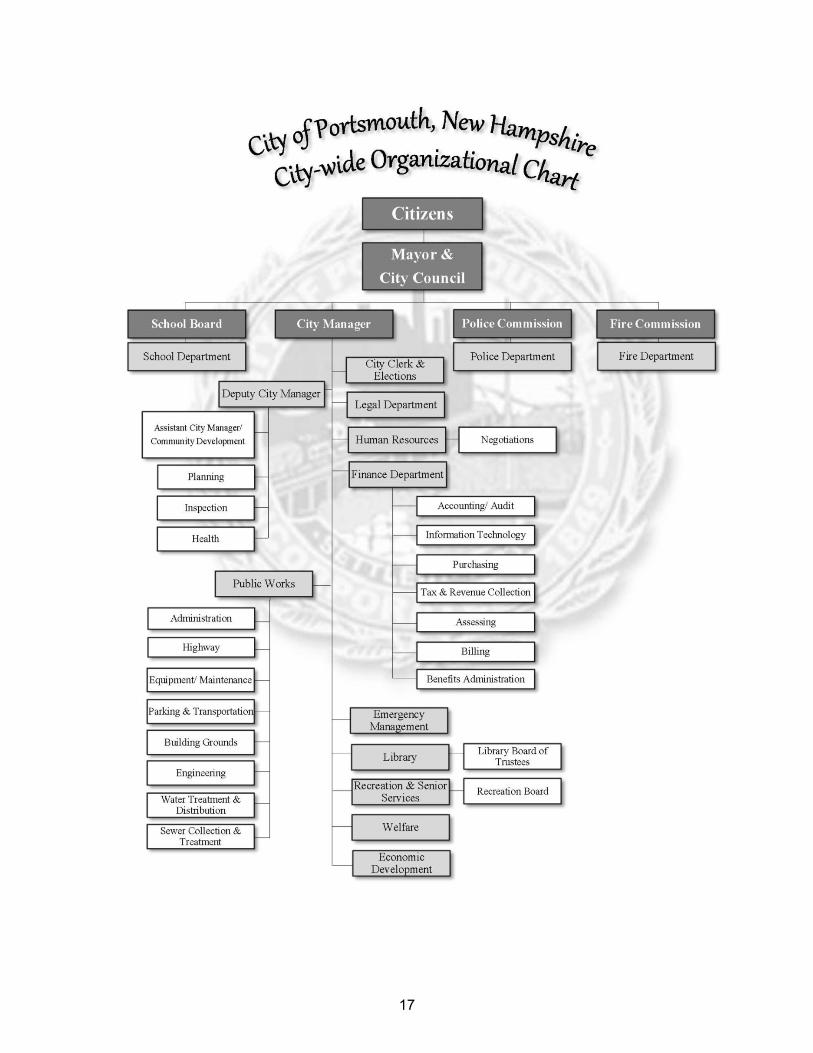
The Organization of the Government The City of Portsmouth has operated under the Council-Manager form of govern-ment since 1947. The City Council comprises the Mayor and 8 members, and is responsible for enacting ordinances, resolutions and regulations governing the City, as well as for appointing the members of various statutory and advisory boards. As Chief Administrative Officer, the City Manager is responsible for enforcement of laws and ordinances. The City Manager appoints and supervises the heads of the depart-ments of the City organization with the exception of the School, Police, and Fire Departments. The School Board consists of nine elected citizens of Portsmouth. The School Board sets policies and goals and has line item control over its annual budget; however, the City Council is responsible for the funding of the School Department. The Police Commission consists of three elected citizens of Portsmouth. The Commission sets policies and goals; however, the City Council is responsible for the funding of the Police Department. The Fire Commission consists of three elected citizens of Portsmouth. The Commis-sion sets policies and goals, however, the City Council is responsible for the funding of the Fire Department.
3
Services Provided The City of Portsmouth provides the full range of municipal services normally associ-ated with a municipality including police and fire protection, emergency medical services, public works operations, financial administration, planning and zoning, code enforcement, health and welfare services, parks operation and maintenance, recreation, senior services, library services, public education, parking and transpor-tation, community and economic development, solid waste collection and disposal, and general administrative services. Water and sewer services are reported as Enterprise Funds, with user charges set to ensure adequate coverage of operating expenses and payments on outstanding debt.
Budget Process The City’s fiscal year begins on July 1st of each year and ends the following June 30th. As required by the City of Portsmouth’s Charter, the City Manager submits a recom-mended six-year Capital Improvement Plan three months before the final submission date of the fiscal year recommended budget. The fiscal year recommended budget must be submitted to the City Council at least 45 days (May 15th) before the start of the fiscal year. The budget, which includes the General Fund and Enterprise Funds, is prepared and presented by department and functions, which each require an appropriation. The City ensures compliance with legal provisions embodied in the annual appro-priated budget approved by the City’s governing body by use of budgetary controls. Activities of the General Fund and Enterprise Funds are included in the annual appropriated budget. Project length financial plans are adopted for the Capital Project Funds. The City maintains an encumbrance accounting system as one technique of accomplishing budgetary control; encumbered amounts are carried over at year-end. The City Manager, with the approval of the Council, may transfer any unencumbered appropriation balance or any portion thereof from one depart-ment to another. The City Council, by charter, must adopt a budget by June 30th. If the City Council takes no action on or prior to June 30th, the budget submitted by the City Manager is deemed to have been adopted by the City Council per the City Charter. Once the budget is adopted, no appropriations shall be made for any purpose not included in the annual budget as adopted unless voted by a two-thirds majority of the City Council after a public hearing is held to discuss said appropriation.
4
FACTORS AFFECTING FINANCIAL CONDITIONS
Local Economy The City of Portsmouth saw economic growth in fiscal year 2016 over the previous year. The City realized gains in employment, development investment, property renovations, infrastructure improvements, and tax base. Contributing factors to these gains include sound fiscal management, business growth at Pease International Tradeport, and the relative location of the City to regional workforce. The City continues to lead the region in low unemployment rates. As of June 2016, the unemployment rate was 1.9%, compared to 2.7% in June 2015. The respective rates for the state, New England and the nation were 2.8%, 4.4%, and 4.9% in June 2016. Portsmouth has maintained a stable economy, due in part to the diversity of busi-nesses that make the City a major employment center. Many of working residents are employed locally, but the bulk of the workforce commutes into the City. According to the NH Employment Security Office, Portsmouth’s total public and private average quarterly employment at the end of 2015 was 32,220 compared to 30,689 at the end of 2014 indicating an increase of 1,531 jobs. The average weekly wage increased from $1,252 to $1,293 during the same time period. This year building permit activity increased in FY16 with the total number reaching 3,086 (a 23% increase over FY15) with a construction value of over $126 million. Accordingly, construction costs were up by 72% and permit fees increased 45% from the previous year. As expected, the total number of inspections performed was also up significantly from the previous year by 67%. As in previous years, commer-cial projects outpaced industrial projects. On the residential side, most permits issued in FY16 were for renovations versus new dwelling construction. Several notable commercial development projects were completed in the Central Business District (CBD) and several others broke ground. Construction continues on the mixed use project at 67-77 State Street. This building, along with a new waterfront park overlooking the Piscataqua River and the recently completed mixed use project at 143 Daniel Street (the former Connie Bean Center) will comprise the new Memorial Bridge gateway to the City. Also underway in the CBD is the 24,000 square foot, mixed-use development at 173-174 Market Street which includes first floor retail and residences on the two upper levels with associated parking. In the Islington Street Corridor, the project to redevelop the historic Frank Jones Brewery was initiated. When complete, this significant project will include mixed retail and 54 residential apartments to the long-vacant, historic brick structures adding new vitality to this part of Portsmouth’s West End.
5
South of downtown, at the intersection of Wentworth Road and Sagamore Avenue, the Bean Group completed an 8,000 square foot new office at 1150 Sagamore Avenue that considerably enhances this highly travelled intersection. Southgate Plaza at 2422 Lafayette Road continues expansion with the approval and groundbreaking of a 4-story, 94 unit residential building totaling 113,000 square feet plus a one-story, 2,000 square foot restaurant and 6,000 square feet of new retail space. In the Heritage/Constitution Industrial Park, Insurcomm has constructed a 40,000 square foot facility for storage and office use. The Portsmouth Business Park (formerly Commerce Way) received approval for a new four-story office building at 215-235 Commerce Way which will create 112,000 square feet of office space plus an on-site parking deck for new employers coming to the City. Finally, Liberty Mutual completed an $85 million phased renovation to its existing office on Borthwick Avenue. Pease International Tradeport is a major contributor to Portsmouth’s economic success and is an important regional economic driver. Since the Air Force Base closure in 1991, new development/redevelopment has created four million square feet of office and manufacturing space and has allowed many companies that outgrew their downtown location to remain and grow in the City. According to Applied Economic Research’s (AER) report on the first 25 years of the Tradeport, businesses at Pease employ 9,540 people at over 250 companies with a payroll of $583 million compared to $3.5 million in 1991. Combined Tradeport and indirect regional wages now exceed $700 million and the Tradeport contributes over $6 million to the City of Portsmouth for municipal infrastructure and life and safety services provided. Companies at Pease are recognized in the media for their work environment and culture. In 2016 Business NH Magazine published its annual edition of the “Best Companies to Work For” and six of the twenty companies selected statewide are Portsmouth-based businesses; four of the six are located at the Tradeport. The most significant development at Pease Tradeport in FY16 was the expansion at Lonza Biopharmaceuticals, a major employer at Pease. The contract pharmaceutical firm broke ground on the largest expansion at the Tradeport and which will double the size of the current facility. The addition will add over a million square feet of office/warehousing/and manufacturing space in two 4-story structures and a parking garage. The first phase is projected to add 150 new skilled jobs with an additional 400 jobs when complete. The Air National Guard 157th Air Refueling Wing which is located at Pease Tradeport was selected as the U.S. Air Force’s top choice to receive twelve new KC-46A refuel-ing tankers. When complete, the Air Force projects the project will add 100 new jobs with a payroll of $7 million and indirect economic benefits of $45 million in construc-tion contracts. A September 2015 groundbreaking ceremony kicked-off the hangar

6
expansion project for the new refuelers that are scheduled to begin refueling KC-46A Pegasus tankers starting in February 2018. Portsmouth real estate market continues to improve. For the second quarter ending June 30, 2106, Colliers International real estate advisory firm reported Portsmouth submarket average vacancy rate of 7.3% for office properties over 10,000 square feet and 2.2% for industrial property over 10,000 square feet. This compares to respective office and industrial vacancy rates of 8.5% and 3.16% for the fourth quarter 2015. The current average asking lease rate for Class A office space is $32.00 per square foot (gross) which is up from $27.00 per square foot in the fourth quarter of 2015. Class B office average asking lease rate remained the same as the fourth quarter of 2015 at $23.00 per square foot. For industrial properties in excess of 10,000 square feet, the average lease price is $7.32 (triple net). This rate com-pares to the rate of $5.50 -$7.50 during the fourth quarter of 2015. The Portsmouth Naval Shipyard (PNSY) located in Kittery, Maine is the U.S. gov-ernment’s oldest continuously operating naval shipyard and the largest regional employer. The PNSY regional economic impact report for calendar year 2015 (most recent data available) showed a total of 6,099 employees paid with a payroll of $482 million up from 5,585 employees and $432 million in calendar year 2014. The shipyard purchased $70 million of goods and services in 2015 versus $30 million in 2014 making it a significant source of indirect expenditures in the region. This sub-marine overhaul and refueling facility has a highly skilled technical workforce and is undergoing a period of intense job growth after receiving billions of dollars in long-term federal contracts to service and retool nuclear-powered attack submarines. The hiring will accommodate an increased workload consistent with the Navy’s scheduled maintenance plan for Los Angeles Class and Virginia Class nuclear submarines. Portsmouth’s creative economy continues to expand its reputation as New Hampshire’s premier cultural tourism and culinary destination. The concentration of theatres, historic homes, restaurants, museums, and galleries drive this sector of the economy and fuel a creative workforce of actors, writers, historians, musicians, and graphic design and architectural firms. Through a series of music, arts, seafood, beer and film festivals, these businesses attract visitors year-round which in turn support the growing hospitality and leisure industry. As in the past, Portsmouth has been the fortunate beneficiary of several positive articles and received several recognitions and accolades in a variety of media. A list of representative examples of this recognition follows:
Portsmouth included in USAToday.com article on best small town Christmas celebrations: December 2015
National online syndicated column the examiner.com includes Portsmouth in best family holiday places December 2015
Travel and Leisure.com lists Portsmouth as one of America’s 20 Top Holiday Towns: November 2015; Portsmouth highlighted in YankeeMagazine.com as great fall get away: November 2015
7
Huffingtonpost.com lists Portsmouth as one of four potential heirs to Portlandia, November 2015; Portsmouth included on BUZZfeed.com list of Nine US Cities to visit; October 2015 Portsmouth included in article, 19 Best Tthings To Do in Portsmouth, on NH Vacationidea.com website, October 12, 2015:
Portsmouth hailed for its architecture and new African Burying Ground, August 2015
Portsmouth praised as dog-friendly city in “13-reasons-your-dog-wants-you-to-vacation-in-Portsmouth,” July 2015
Major Initiatives and Accomplishments
In Fiscal Year 2016, the City continued working on a number of major financial, economic, and community development initiatives as well as citywide infrastructure upgrades and improvements funded through a variety of sources. Parks, Playgrounds and Historic Cemeteries
Harborwalk Park and Pier - In FY16, the City completed the second of two
phases of the Harborwalk Park and Pier project. This waterfront park provides public access and views of the new Memorial Bridge, the Piscataqua River and neighboring Kittery, Maine. The newest phase of this project includes a boardwalked pier that stretches over the river providing dramatic views of the swift currents, boating activity and the City’s waterfront. The new public space also features stone and brick walkways, historic lighting, landscaping and benches.
Bleacher Improvements - The City continued with its upgrade efforts of bleachers at a number of Portsmouth ballfields. Additional bleachers were installed at Central Little League Field off of Parrott Avenue, at Clough field off of South Street, and new bleachers were constructed at the Hislop Field in Atlantic Heights and at the Lister Academy.
Prescott Park Master Plan - In January 2016, the Mayor appointed a Blue Ribbon Committee on the Prescott Park Master Plan. Prescott Park, a ten-acre waterfront park, is a major public green space and primary waterfront resource. The Committee is charged with developing a Master Plan, which will assess the park’s current condition; determine desired uses and needs; and create a master plan addressing the identified improvements and up-grades. The Park was created in the mid-20th Century as a result of a chari-table gift of land and money from Josie F. Prescott, “to be used for park and recreational purposes.” The park is home to historic buildings, all listed on the State Register of Historic places, including the Shaw and Sheafe Warehouses and the Marine Railway Building. The park itself lies within the City’s Historic District; in addition, the Park is within the study area for an in-progress District Nomination being prepared by the State of New Hampshire for the National Register of Historic Places. While several significant maintenance and other improvement projects have been carried out in the park in recent years, many

8
features, systems, amenities, surfaces, and structures are in need of replacement, upgrade, or other improvements.
Haven School Playground - The Haven School Playground project was completed in FY16 marking the last major playground overhaul scheduled as part of a two decade program. Over that time, through consistent investment through the Capital Improvement Program, the City’s playgrounds have been dramatically renovated. The Haven School Playground project included the removal of decaying timber retaining walls, asphalt surfacing, and upgrades to the playground equipment. Significant regrading also took place at the site along with replacement of a wooden retaining wall and introduction of new park furnishings and plantings in green spaces.
Recreation Fields Initiative - The City made substantial progress in planning for the future of the City’s recreation fields and other recreation assets.
The City has had a long held goal of adding inventory to the City’s existing stock of outdoor recreation fields. In FY16, the City identified the city-owned property known as the former “stump dump” off Greenland Road for the creation of one rectangular multi-purpose field and funded the project with $1.75 million in bond proceeds. In addition, the City pursued the acquisition of a specific parcel of land off of Campus Drive to build three additional regula-tion-sized fields with associated amenities including lighting and parking.
Meanwhile, the City made investments to Leary Field by replacing the field lighting system. Further investment in the City’s recreation assets will take place in FY17 with the rebuilding of the City’s adjacent outdoor tennis and basketball court facility.
Sagamore Creek - The Mayoral-appointed Blue Ribbon Committee on the Sagamore Creek Land completed its work to develop a plan for public usage of the 66-acre City-owned parcel, which lies along Sagamore Creek. The plan, adopted by the City Council in December 2015, included a series of modest improvements that will enhance public access, protect sensitive habitat, preserve existing trails, and ensure the site is inviting and usable to all members of the Portsmouth community. With the plan adopted and as funding is made available through the City’s Capital Improvement Program, staff will work to introduce elements over time after regulatory approvals are in place for the portion of the property which includes a closed landfill.
Historic Cemetery Improvements - Building on restoration, stabilization, and other improvement projects in recent years, the City, in collaboration with volunteers and other partners, continued to focus on maintaining its 7 historic cemeteries. Following a 2013 assessment of the cemeteries, the Portsmouth City Council adopted an action plan to ensure ongoing improvements and created a Historic Cemetery Trust to serve as a repository for funds donated to the overall effort. In FY16 the City completed an upgrade of the Union Cemetery gate and wrought iron fence. In addition a historic crypt was upgraded and reworked to eliminate a hazardous condition. These efforts are part of a phased program identified in the Historic Cemetery Master Plan. Additional work is underway to repair a retaining wall along the Maplewood
9
Street side of the Cemetery. The City also began work on the restoration of the retaining wall in front of the North Cemetery, which fronts Maplewood Avenue. Planning work continues for improvements to the remaining “edges” of the North and Union cemeteries as well as the stabilization and preserva-tion of the Wendell Tomb in the Pleasant Street Cemetery.
City Cultural Plan - Art-Speak, d/b/a the City’s Cultural Commission continued efforts related to the City’s Cultural Plan including:
Launched the branding campaign for A Tiny Bit Huge, with the website atinybithuge.com which is a platform that showcases individual artists and an online marketplace.
Completed first half of the American For The Arts (AFTA) surveys.
Managed two public art referrals; the Music Hall arch and the Ronnie James Dio proposal.
Acted as a fiscal agent and producer for Blank Page Poetry; Words and Shadows with Jerome Meadows, Oct. 2015.
Hosted quarterly PACA (Portsmouth Arts and Cultural Alliance) member meetings with community topics such as shared resources, ongoing neighbor relations issues with Prescott Park Arts Festival, and giving away services for free.
Participated in a Pecha Kucha night.
Participated on search committee for the new Executive Director for 3S Artspace.
Public Outreach/Click N’ Fix -As part of the City’s on-going effort to improve public outreach, the Public Works Department (DPW) launched Portsmouth Click and Fix. This program is a convenient way for residents to communicate with the Department of Public Works. It allows residents to report issues and request Department ser-vices through online and mobile applications. It improves communication between citizens and the Department of Public Works, by serving as a direct link to our work order management system. In addition, the application provides added metrics for the Department to measure levels of service per various Public Works’ activities and provides immediate acknowledgement that a service request has been received and communicates when requests are resolved.
In addition to this new expanded public outreach tool the City continues its efforts to educate the citizens on continuing projects as well as inform them of news and vari-ous alerts in real time. This objective has been achieved through different channels of communication including continuous press releases and updates sent to the media, website reorganization, and ongoing outreach and insights shared on the Public Works’ Twitter page.
10
Adopt-a-Spot - The Adopt-A-Spot program continues to gain new participants with an additional thirty spots for a total of over ninety spots maintained by individuals and groups throughout the City. The City continues to partner with local garden clubs to better support gardeners in the program and assist in developing spots that support sustainable initiatives. State Bridges – The Department of Public Works, in cooperation with the New Hampshire Department of Transportation (NHDOT), has been working on replacing 7 State owned bridges in the City. These bridges have been “Red Listed” by the NHDOT and require near term replacement funded 100% by the State of NH. To date, 4 of these bridges have been completed and 1 eliminated. The replacement of the Maplewood Avenue Bridge was completed in FY16. Parking and Transportation
Wayfinding - The City continued implementation of its city-wide Wayfinding Plan which identified appropriate wayfinding types, messaging, locations, and a uniform and recognizable design menu that is unique to the City. The Plan documents are available online at www.planportsmouth.com/wayfinding.html. The signs and improvements included in this phase were for vehicular and pedestrian signage in and around the downtown core. In addition, the City began developing a comprehensive identity system and logo for the City’s Parking Division (ParkPortsmouth) and began to develop an interior wayfind-ing and signage system for the downtown Hanover Parking Garage.
Downtown Parking Shuttle - The City continued to operate a free downtown parking shuttle between the Connect Community Church (CCC) lot on Market Street to the Hanover Parking Garage. For the months of May, September, October, November, and December, the shuttle operated Friday, Saturday and Sunday from mid-day to late evening. For the months of July and August, the shuttle included services on Thursday evenings. Over 36 weeks and 121 days in service, the shuttle transported 16,859 total one-way riders. The average weekly ridership was 469 one-way riders, ranging from a low of 95 over Christmas weekend to a high of 1,403 for the Independence Day Fireworks.
Public Transit - The City of Portsmouth is a member community of the Cooperative Alliance for Seacoast Transportation (COAST) regional bus service. COAST operates both fixed-route bus service as well as on-demand service for ADA riders. As a member community, Portsmouth pays annual dues that support COAST’s operations. Two of COAST’s regional fixed-route buses provide service to Portsmouth – Route 2 (connecting to Rochester, Somersworth, Dover, and Newington) and the Clipper Connection (providing express commuter service between Portsmouth Naval Shipyard, Portsmouth Market Square, Pease Tradeport, and Rochester). In addition, COAST oper-ates two fixed-route buses within Portsmouth city-limits – Lafayette Rd Trolley (Route 41) and Pease Tradeport Trolley (Route 40). Region-wide COAST services continue to see an increase in ridership. City staff represents the City
11
on the COAST Board of Directors and continue to work closely with COAST to evaluate the routes in Portsmouth in order to improve efficiencies, overall ridership, and consider potential expansions of service.
During the month of December, the City collaborates with COAST to provide free weekend service around the Downtown on the Vintage Christmas Trolley. This service is provided to support Portsmouth’s annual Vintage Christmas event.
Planning & Design Review Tools - The Historic District Commission completed a Design Guidelines Manual for development and redevelopment in the Historic District. The Guidelines are intended as a tool to help manage change and protect the City’s architectural and historical resources. They will be presented to the City Council for approval in the fall of 2016 as part of a package of Zoning Ordinance amendments currently under review by the Planning Board. Character-based Zoning - The City completed the planned application of “character-based zoning” in the urban core. Character-based zoning places a greater emphasis on site and building design than the traditional zoning ordinances, and was devel-oped for the urban core to provide more certainty about how new buildings will relate to their surroundings. The City Council adopted new zoning districts and standards for the North End in August 2015 and for the West End/Islington Street Corridor in July 2016. New Parking Garage - In FY16, the City Council reaffirmed the vote to authorize the bonding for a new parking garage. That authorization came after a thorough review of all downtown properties by the Economic Development Commission (EDC). A preferred site, located in the North End, adjacent to the railroad tracks, was selected to support a 600-space garage. The project involves a public/private partnership to secure the land and to re-develop this underutilized area. The project will be designed in FY17 with the intent to start construction of the garage in the next fiscal year. Market Street Gateway Improvement Project - Market Street is a major artery from Interstate 95 into the City’s Central Business District. The Market Street Gateway Improvement Project is one of several City initiatives to improve major corridors and gateways. Project goals include traffic calming, safe pedestrian and bicycle travel, landscaping improvements and clear signage to direct visitors from I-95 to the Central Business District as well as the creation of two passive recreation parks along the waterfront. In FY16, City consultant RSG Associates, completed the design of the project, bid specifications, and cost estimates. The City anticipates bidding the project in winter 2016 with phased implementation of the gateway improvements with the first phase starting in late spring 2017. Master Plan - The Planning Department continued work on the City’s Master Plan throughout 2016. The planning process included a number of ways to get resident input, including two rounds of “Study Circles”, interactive workshops, the use of social media, and “voting” at a booth at Market Square Day and in an online survey. The new Master Plan takes an innovative approach, identifying key themes based
12
on extensive public involvement, and illustrating how these themes can be applied in various areas of the City. The Plan is distinguished by its extensive use of graphics to present concepts and options. The staff anticipates completing the final Master Plan in October 2016, for adoption by the Planning Board and presentation to the Council by the end of the year. Electric Charging Station - The City of Portsmouth received approval for a $5,000 reimbursement grant from NH Department of Environmental Services (NHDES) to install electric vehicle charging stations in the Downtown. The grant award was used to purchase and install a dual-connector Level 2 charging station in the Hanover Parking Garage. The City’s share was approximately $4,000. According to the criteria for this program, the location selected must be easily accessible to the public on a 24 hour/7 days a week basis and year-round, located in areas that support the tourism industry, and located in proximity to major transportation corridors. Water Efficiency - The City continues with its Water Efficiency Rebate Program which allows qualifying residential water and sewer customers a rebate for installing high efficiency toilets and washing machines. The rebates are $100 for qualifying toilets and $150 for qualifying washing machines. Portsmouth is the first water system in New Hampshire to offer rebates of this nature. The program is offered to all residential customers served by the Portsmouth Water and Sewer Divisions, including multi-family residents. The City’s website includes information as well as the criteria and forms for customers to apply for their rebates. Response to the program has been consistent, with an average of 15 toilet and 5 washing machine rebates issued each month. The initial data from customers who have received rebates shows the following improvement in water efficiency: Toilet Rebates: 30% reduction in water usage, Washing Machine Rebates: 19% reduction in water usage. The Portsmouth Housing Authority also participated in the program and one of their larger facilities is seeing a reduction of approximately 20% after their retrofit of toilets, saving the Authority approximately $2,000/month in water/sewer fees. Wastewater Treatment Upgrades
Peirce Island - In FY16, the City Council voted to fund the construction of the Peirce Island Wastewater Treatment Facility (WWTF) Upgrade. The design of this project was completed in late December 2015 and a schedule was nego-tiated as part of a modification to the City’s Consent Decree with the Environ-mental Protection Agency (EPA). The biological treatment system components will be completed by December 2019. The Division prepared for this major construction project and investigating alternatives to mitigate the impacts of construction. The EPA has been involved with the project because of its issuance of the National Pollutant Discharge Elimination System (NPDES) permit for the facility. The Department of Environmental Services (DES) has been involved and has approved the design. The treatment facility construction will kick off in September 2016 and last four years due to the extent and complexity of constructing new facility upgrades while keeping the existing treatment system operational extend through the fiscal year.

13
Additionally, to support its wastewater NPDES permits, the Sewer Division will continue to support scientific research of the receiving water bodies through studies including water quality monitoring in the Piscataqua River
Pease - The Pease Wastewater Treatment Facility will also begin upgrades in FY17. Portions of the Pease facility have not been upgraded since its original construction in the 1950s. It is anticipated that the City will complete the work in phases utilizing the recommendations of previous engineering evaluations. During FY17, the design of the first phase to upgrade the headworks (screen-ing, grit removal, and raw sewage pumping) will be complete and the project under construction.
Lincoln Area Sewer Separation Project - Work on the collection system continued with the implementation of the City’s Long-term Control Plan to reduce Combined Sewer Overflows (CSO). The primary focus of these projects is to separate the sanitary sewer system from the stormwater drainage system. This effort reduces the volume of CSO and localized flooding as well as provides improved water quality discharged to receiving waters from precipitation events. The City has completed the last of its sewer separation projects required by the current Consent Decree with the Environmental Protection Agency. In FY16 the City began the required evaluation of the sewer separation work, called a Post Construction Monitoring Plan, to determine the effectiveness of these sewer separation projects (Bartlett Street area, Lincoln Avenue area, and Cass Street area). The results of this evaluation will be used to determine what additional sewer separation work may be necessary in the future. The first phase of a City wide evaluation of the condition of the sewers was per-formed in FY16 and it continues. The City has an old sewer collection system with many pipes being over 100 years old. This work included measurements of the amount of extraneous groundwater and stormwater in the sewer collection system. The next phase of the work to be completed in FY17 includes a structural condition assessment of the sewers where extraneous flow was found to be excessive. Based on these studies, a prioritized list of projects will be developed for sewer replacement and rehabilitation and brought forward as part of the City's capital improvement pro-gram budgeting process. This list and the implementation schedule will be used for years to come as a roadmap for future sewer improvements. This project also includes a pilot study to identify and determine the best means to implement a sump pump removal program in the City. Additional outreach will be provided on this subject as the study moves forward. The Sewer Division continues to pursue initiatives to improve collection system operations which include the restaurant grease removal program and cleaning and inspections. The City will continue with its annual cleaning and inspection with the goal of the entire system (~115 miles) being cleaned and inspected every five years. Focused inspections will be performed as planned and the studies being performed this fiscal year will focus on historic problem areas and make recommendations for improvements. The City will continue its annual replacement of sewer pipes as needed in advance of annual paving areas and in locations of planned capital

14
projects such as the Maplewood Avenue (North Mill Pond to Woodbury Avenue) Reconstruction project and the Islington Street Corridor Improvements project Stormwater System Initiatives - City staff continued to track and assess the potential regulatory requirements related to the pending EPA Municipal Separate Storm Sewer System (MS4) stormwater requirements. One of the requirements of the current stormwater permit draft is an assessment of all City stormwater infra-structure. To accomplish this task, the Department of Public Works continued to employ two University of New Hampshire students to intern in the GIS department (for the third year). These interns use global positioning equipment, cameras and their own eyes to track down and inspect the City’s stormwater infrastructure.
Long-Term Financial Planning The City continues to address and monitor legislative issues while still maintaining strong and stable financial operations. Statewide Education Property Tax – The Statewide Education Property Tax assessment process remain essentially the same for FY16 and FY17. Each fall, the Department of Revenue Administration notifies each municipality of the amount it must raise through the Statewide Education Property Tax (SWEPT) for the following school year. Municipalities send the revenue raised by the Statewide Education Property Tax directly to their school district. Historically Portsmouth has raised tax revenue above the State determined cost of an adequate education and has been able to retain this revenue for local education costs. Prior to FY06, Portsmouth was a “Donor” community, forced to raise an additional $11,750,318 in SWEPT for the State to distribute to other communities. The City is mindful of the fact that as long as SWEPT exists, the Legislature could change the education funding formula and return to “Donor” communities. The New Hampshire Legislature failed to adopt a constitutional amendment to abolish the Statewide Education Property Tax (SWEPT) in FY16. There will be an increase on the cap for adequacy aid and a reduction in stabilization grants in FY17 but these changes will not have an impact on the City of Portsmouth. Also of note was the City of Dover's success in challenging the consti-tutionality of prior caps on adequacy aid funding. The issue of education funding will be the subject of proposed legislation next session and the City will continue to moni-tor the Legislature’s future education funding discussions through the City Council’s Legislative Subcommittee comprised of the Mayor and three City Councilors. The Legislative Subcommittee works with City Staff and the Portsmouth Delegates to monitor legislation on education funding. In addition, City Staff also monitors the Legislature’s activity on education funding on behalf of the Coalition Communities, a coalition of former “Donor” communities, through funding by the City and contribu-tions from Coalition-member communities. Bond Rating - In June 2016, Standard & Poor’s Rating Group (S&P) affirmed the City's bond rating to AAA citing its City’s very strong economy, very strong manage-ment conditions with strong policies, strong budgetary performance, very strong budgetary flexibility, and strong debt and contingent liabilities position as positive
15
factors. S&P also notes that the City’s strong reserves and policies will support long-term stability.
Relevant Financial Policies The following are financial policies and long-term financial guidelines which the City follows in managing its financial and budgetary affairs. The goal of these policies and guidelines is to ensure that financial resources are well managed and available to meet the present and future needs of the citizens of the City of Portsmouth. Leave at Termination – The City has addressed in two methods the significant liability owed to employees for accumulated sick leave pay when they leave munici-pal service.
1. The City eliminated future growth in this liability by negotiating in all 16 labor agreements that all employees hired after July 1996 can no longer accumu-late unlimited sick leave. Thus, the liability can be capped and it is now possi-ble to estimate reductions of this liability through attrition.
2. The Leave at Termination Fund created in fiscal year 1999 eliminated annual budget spikes which negatively impacted the operating budget associated with sick leave pay owed to employees upon termination. Each department annually budgets a fixed amount for each fiscal year determined by an actuarial study and periodic review, which is transferred into this fund where this liability is paid. Each department builds a fund balance, which is carried over from year to year to fund future liabilities, thus stabilizing the annual operating budget.
As of the close of the current fiscal year, citywide liability for accrued employee benefits was $6,708,109, a net decrease $252,928 as compared to prior year. Unassigned Fund Balance – City Council adopted in Fiscal Year 1998 A Fund Balance Ordinance which was amended in 2012 to comply with the fund balance model established by Governmental Accounting Standards Boards (GASB) Statement No. 54. The operational objective of the Ordinance was further amended in 2013 to recognize that the financial management goal of the City of Portsmouth is to annually maintain an Unassigned Fund Balance between 10% and 17% of total general fund appropriations. As of June 30, 2016, the Unassigned Fund Balance is 12.94% of appropriations. Debt Service Planning – It is the policy of the City to keep operational net debt costs at no more than 10% of annual general fund expenditures toward net debt service payments. Current and future debt service is projected out over a 10-year period along with projected annual appropriations and estimated revenues related directly to debt. The framework of this analysis assists with the planning of future capital projects that will be funded through debt issuances. For FY16, the amount of net annual debt remains within the policy limits at 8.24%.
16
AWARDS AND ACKNOWLEDGEMENTS The Government Finance Officers Association of the United States and Canada (GFOA) awarded a Certificate of Achievement for Excellence in Financial Reporting to the City of Portsmouth for its Comprehensive Annual Financial Report for the Fiscal Years ending June 30, 1988, 1989, and for twenty consecutive years from 1995 to 2015. In order to be awarded a Certificate of Achievement, a government unit must publish an easily readable and efficiently organized Comprehensive Annual Financial Report, whose contents conform to program standards. Such reports must satisfy both Generally Accepted Accounting Principles and applicable legal requirements. A Certificate of Achievement is valid for a period of one year only. The City believes that its current comprehensive annual financial report continues to meet the Certificate of Achievement Program’s requirements and will submit it to the GFOA to determine its eligibility for another certificate. This report reflects the City’s commitment to improve and maintain financial state-ments in conformity with the highest standards of accountability. The strong financial position and excellent financial results reflected in this report would not have been possible without the leadership, support, and fiscal policies established by the City Council and City Manager John P. Bohenko. In addition, the City of Portsmouth also received the GFOA’s Distinguished Budget Presentation Award for ten consecutive years; fiscal year beginning July 1, 2006, to 2015. In order to receive this award, a governmental unit must publish a budget document judged proficient as a policy document, a financial plan, an operations guide, and a communications device. This award is valid for one year only. For long-term planning, the City will continue to work to enhance the information provided in this document for its citizens, as well as continue to meet the national standard requirements established by GFOA. The preparation of the Comprehensive Annual Financial Report on a timely basis was would not have been possible without the dedication and professional efforts of the staff in the Finance Department and diligent efforts of department heads and other City staff. In particular, I would like to express my sincere appreciation to Deputy Finance Director, Andrew Purgiel, who assisted and contributed to the preparation of this report. Sincerely,
Judith A. Belanger Finance Director
17

18
19

20
(This page intentionally left blank.)
102 Perimeter RoadNashua, NH 03063(603)882-1111melansonheath.com
Additional Offices:Andover, MAGreenfield, MAManchester, NHEllsworth, ME
21
INDEPENDENT AUDITORS’ REPORT To the Honorable Mayor and City Council City of Portsmouth, New Hampshire Report on the Financial Statements We have audited the accompanying financial statements of the governmental activi-ties, the business-type activities, each major fund, and the aggregate remaining fund information of the City of Portsmouth, New Hampshire (the City), as of and for the year ended June 30, 2016, and the related notes to the financial statements, which collectively comprise the City’s basic financial statements as listed in the Table of Contents. Management’s Responsibility for the Financial Statements The City’s management is responsible for the preparation and fair presentation of these financial statements in accordance with accounting principles generally accepted in the United States of America; this includes the design, implementation, and maintenance of internal control relevant to the preparation and fair presentation of financial statements that are free from material misstatement, whether due to fraud or error. Auditors’ Responsibility Our responsibility is to express opinions on these financial statements based on our audit. We conducted our audit in accordance with auditing standards generally accepted in the United States of America and the standards applicable to financial audits contained in Government Auditing Standards, issued by the Comptroller General of the United States. Those standards require that we plan and perform the audit to obtain reasonable assurance about whether the financial statements are free from material misstatement. An audit involves performing procedures to obtain audit evidence about the amounts and disclosures in the financial statements. The procedures selected depend on the auditors’ judgment, including the assessment of the risks of material misstatement of the financial statements, whether due to fraud or error. In making those risk assess-ments, the auditor considers internal control relevant to the entity’s preparation and fair presentation of the financial statements in order to design audit procedures that
22
are appropriate in the circumstances, but not for the purpose of expressing an opinion on the effectiveness of the entity’s internal control. Accordingly, we express no such opinion. An audit also includes evaluating the appropriateness of accounting policies used and the reasonableness of significant accounting estimates made by manage-ment, as well as evaluating the overall presentation of the financial statements. We believe that the audit evidence we have obtained is sufficient and appropriate to provide a basis for our audit opinions. Opinions In our opinion, the financial statements referred to above present fairly, in all material respects, the respective financial position of the governmental activities, the business-type activities, each major fund, and the aggregate remaining fund information of the City of Portsmouth, New Hampshire, as of June 30, 2016, and the respective changes in financial position and, where applicable, cash flows thereof and the respective budgetary comparison for the general fund for the year then ended in accordance with accounting principles generally accepted in the United States of America. Other Matters Required Supplementary Information Accounting principles generally accepted in the United States of America require that Management’s Discussion and Analysis, the Schedule of OPEB Funding Progress, the Schedule of Proportionate Share of Net Pension Liability, and the Schedule of Pension Contributions be presented to supplement the basic financial statements. Such information, although not a part of the basic financial statements, is required by the Governmental Accounting Standards Board, who considers it to be an essential part of financial reporting for placing the basic financial statements in an appropriate operational, economic, or historical context. We have applied certain limited proce-dures to the required supplementary information in accordance with auditing stand-ards generally accepted in the United States of America, which consisted of inquiries of management about the methods of preparing the information and comparing the information for consistency with management’s responses to our inquiries, the basic financial statements, and other knowledge we obtained during our audit of the basic financial statements. We do not express an opinion or provide any assurance on the information because the limited procedures do not provide us with evidence sufficient to express an opinion or provide any assurance. Other Information Our audit was conducted for the purpose of forming opinions on the financial state-ments that collectively comprise the City’s basic financial statements. The combining and individual nonmajor fund financial statements are presented for purposes of
23
additional analysis and are not a required part of the basic financial statements. Such information is the responsibility of management and was derived from and relates directly to the underlying accounting and other records used to prepare the financial statements. The information has been subjected to the auditing procedures applied in the audit of the financial statements and certain additional procedures, including comparing and reconciling such information directly to the underlying accounting and other records used to prepare the financial statements or to the financial statements themselves, and other additional procedures in accordance with auditing standards generally accepted in the United States of America. In our opinion, the information is fairly stated in all material respects in relation to the financial statements as a whole. Our audit was conducted for the purpose of forming opinions on the financial state-ments that collectively comprise the City’s basic financial statements. The introduc-tory and statistical sections are presented for purposes of additional analysis and are not a required part of the basic financial statements. Such information has not been subjected to the auditing procedures applied in the audit of the basic financial state-ments and, accordingly, we do not express an opinion or provide any assurance on it. Other Reporting Required by Government Auditing Standards In accordance with Government Auditing Standards, we have also issued our report dated December 21, 2016 on our consideration of the City's internal control over financial reporting and on our tests of its compliance with certain provisions of laws, regulations, contracts, and grant agreements and other matters. The purpose of that report is to describe the scope of our testing of internal control over financial report-ing and compliance and the results of that testing, and not to provide an opinion on internal control over financial reporting or on compliance. That report is an integral part of an audit performed in accordance with Government Auditing Standards in considering the City’s internal control over financial reporting and compliance.
December 21, 2016

24
MANAGEMENT’S DISCUSSION AND ANALYSIS
The City of Portsmouth’s management offers readers this narrative overview and analysis of the financial activities of the City of Portsmouth for the fiscal year ended June 30, 2016. The City’s financial performance is discussed and analyzed within the context of the accompanying financial statements and disclosure following this section.
FINANCIAL HIGHLIGHTS
As of the close of the current fiscal year, total assets and deferred outflows
minus liabilities and deferred inflows for governmental and business activities exceeded liabilities by $201,003,708. This is an increase of $17,901,834 in comparison to the prior year.
As of the close of the current fiscal year, governmental funds reported com-bined ending fund balances of $85,119,611, an increase of $9,336,594 in comparison with the prior year.
At the end of the current fiscal year, unassigned fund balance for the general fund was $13,158,179, an increase of $648,433 in comparison with the prior year.
Total bonds and state revolving loans payable, including unamortized premi-ums, at the close of the current fiscal year was $175,248,514, an increase of $9,931,883 in comparison to the prior year.
OVERVIEW OF FINANCIAL STATEMENTS
This discussion and analysis is intended to serve as an introduction to the City of Portsmouth’s basic financial statements. The basic financial statements comprise of three components: (1) government-wide financial statements, (2) fund financial statements, and (3) notes to the financial statements. This report also contains other supplementary information in addition to the basic financial statements themselves. Government-Wide Financial Statements The government-wide financial statements which report the government’s govern-mental activities separately from its business-type activities are designed to provide readers with a broad overview of the City of Portsmouth’s finances. There are two basic governmental-wide financial statements: the statement of net position and the statement of activities. All activities included within the government-wide financial statements are measured and reported using the economic resources measurement focus and the accrual basis of accounting similar to a private-sector business.
The Statement of Net Position- presents information on all assets and deferred outflows and liabilities and deferred inflows, with the difference reported as “net position” instead of fund balances as shown on the Fund
25
Statements. Over time, increases or decreases in net position may serve as a useful indicator of whether the financial position is improving or deteriorating.
The Statement of Activities- presents information showing how the govern-ment’s net position changed during the most recent fiscal year. All changes in net position are reported as soon as the underlying event giving rise to the change occurs, regardless of the timing of related cash flows. Thus, revenues and expenses are reported in this statement for some items that will only result in cash flows in future fiscal periods (e.g., uncollected taxes and earned but unused vacation leave).
Both of the government-wide financial statements include two different types of City Activities and can be found on pages 41-43 of this report.
Governmental Activities: The activities in this section represent most of the City’s basic services and are principally supported by taxes, grants, and inter-governmental revenues. The governmental activities of the City of Portsmouth include general government, public safety, education, public works, health and human services, culture and recreation, and community development. Other governmental activities include special revenue and capital projects funds.
Business-Type Activities: These activities are normally intended to recover all or a significant portion of their costs through user fees and charges. These business-type activities of the City include the water and sewer activities.
Fund Financial Statements A fund is a grouping of related accounts that is used to maintain control over resources that have been segregated for specific activities or objectives. Fund accounting is used to ensure and demonstrate compliance with finance-related legal requirements. The City’s funds are divided into three categories: governmental funds, proprietary funds and fiduciary funds.
Governmental funds: Governmental funds are used to account for essen-tially the same functions reported as governmental activities in the government-wide financial statements. However, unlike the government-wide financial statements, governmental fund financial statements focus on near-term inflows and outflows of spendable resources, as well as on balances of spendable resources available at the end of the fiscal year. Such information may be useful in evaluating a government’s near-term financing requirements. Because the focus of governmental funds is narrower than that of the government-wide financial statements, it is useful to compare the information presented for governmental funds with similar information presented for gov-ernmental activities in the government-wide financial statements. By doing so, readers may better understand the long-term impact of the government’s near-term financing decisions. Both the governmental fund balance sheet and the governmental fund statement of revenues, expenditures and changes in fund

26
balances provide a reconciliation to facilitate this comparison between govern-mental funds and governmental activities. An annual appropriated budget is adopted for the general fund. A budgetary comparison statement has been provided for the general fund to demonstrate compliance with this budget. The basic governmental fund financial statements can be found on pages 44-48 of this report.
Proprietary funds: The City’s proprietary funds provide goods and services
to the general public and charge a user fee. These activities are reported in enterprise funds. Enterprise funds are used to report the same functions presented as business-type activities in the government-wide financial statements. The City of Portsmouth maintains two enterprise funds which are used to account for water and sewer operations. Proprietary funds provide the same type of information as the business-type activities reported in the government-wide financial statements, only in more detail. The proprietary fund financial statements provide separate information for the water and sewer operations, both of which are considered to be major funds of the City of Portsmouth. The basic proprietary funds financial statements can be found on pages 49-51 of this report.
Fiduciary Funds: These funds are used to account for resources held for the
benefit of parties outside the government. Fiduciary funds are not reflected in the government-wide financial statements because the resources of those funds are not available to support the City’s own programs. The accounting used for fiduciary funds is much like that used for proprietary funds.
The basic fiduciary fund financial statements can be found on pages 52-53 of this report.
Notes to the Financial Statements. The notes provide additional information that is essential to a full understanding of the data provided in the government-wide and fund financial statements. The notes to the financial statements can be found beginning on page 55 of this report. Supplementary Information. In addition to the basic financial statements and accompanying notes, this report also presents certain required supplementary information which is required to be disclosed by the accounting principles generally accepted in the United States of America.
27
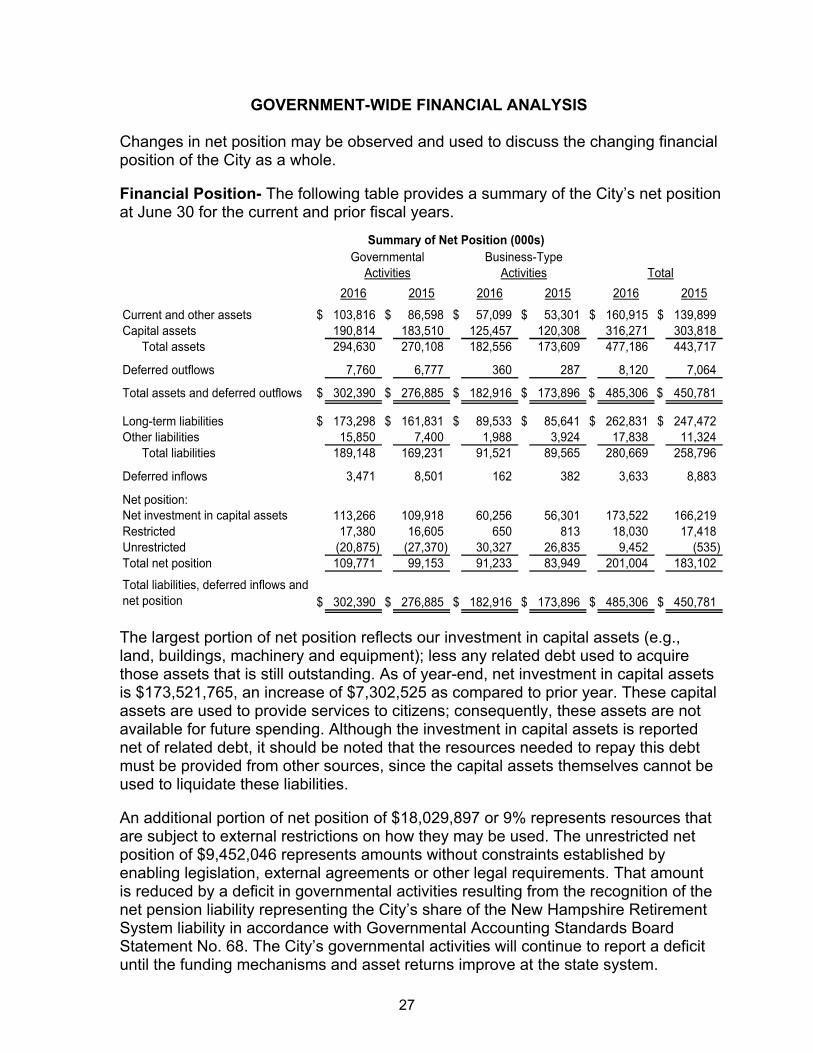
GOVERNMENT-WIDE FINANCIAL ANALYSIS Changes in net position may be observed and used to discuss the changing financial position of the City as a whole. Financial Position- The following table provides a summary of the City’s net position at June 30 for the current and prior fiscal years.
2016 2015 2016 2015 2016 2015
Current and other assets $ 103,816 $ 86,598 $ 57,099 $ 53,301 $ 160,915 $ 139,899 Capital assets 190,814 183,510 125,457 120,308 316,271 303,818
Total assets 294,630 270,108 182,556 173,609 477,186 443,717
Deferred outflows 7,760 6,777 360 287 8,120 7,064
Total assets and deferred outflows $ 302,390 $ 276,885 $ 182,916 $ 173,896 $ 485,306 $ 450,781
Long-term liabilities $ 173,298 $ 161,831 $ 89,533 $ 85,641 $ 262,831 $ 247,472 Other liabilities 15,850 7,400 1,988 3,924 17,838 11,324
Total liabilities 189,148 169,231 91,521 89,565 280,669 258,796
Deferred inflows 3,471 8,501 162 382 3,633 8,883
Net position:Net investment in capital assets 113,266 109,918 60,256 56,301 173,522 166,219 Restricted 17,380 16,605 650 813 18,030 17,418 Unrestricted (20,875) (27,370) 30,327 26,835 9,452 (535) Total net position 109,771 99,153 91,233 83,949 201,004 183,102
Total liabilities, deferred inflows and net position $ 302,390 $ 276,885 $ 182,916 $ 173,896 $ 485,306 $ 450,781
Summary of Net Position (000s)Governmental
ActivitiesBusiness-Type
Activities Total
The largest portion of net position reflects our investment in capital assets (e.g., land, buildings, machinery and equipment); less any related debt used to acquire those assets that is still outstanding. As of year-end, net investment in capital assets is $173,521,765, an increase of $7,302,525 as compared to prior year. These capital assets are used to provide services to citizens; consequently, these assets are not available for future spending. Although the investment in capital assets is reported net of related debt, it should be noted that the resources needed to repay this debt must be provided from other sources, since the capital assets themselves cannot be used to liquidate these liabilities. An additional portion of net position of $18,029,897 or 9% represents resources that are subject to external restrictions on how they may be used. The unrestricted net position of $9,452,046 represents amounts without constraints established by enabling legislation, external agreements or other legal requirements. That amount is reduced by a deficit in governmental activities resulting from the recognition of the net pension liability representing the City’s share of the New Hampshire Retirement System liability in accordance with Governmental Accounting Standards Board Statement No. 68. The City’s governmental activities will continue to report a deficit until the funding mechanisms and asset returns improve at the state system.
28
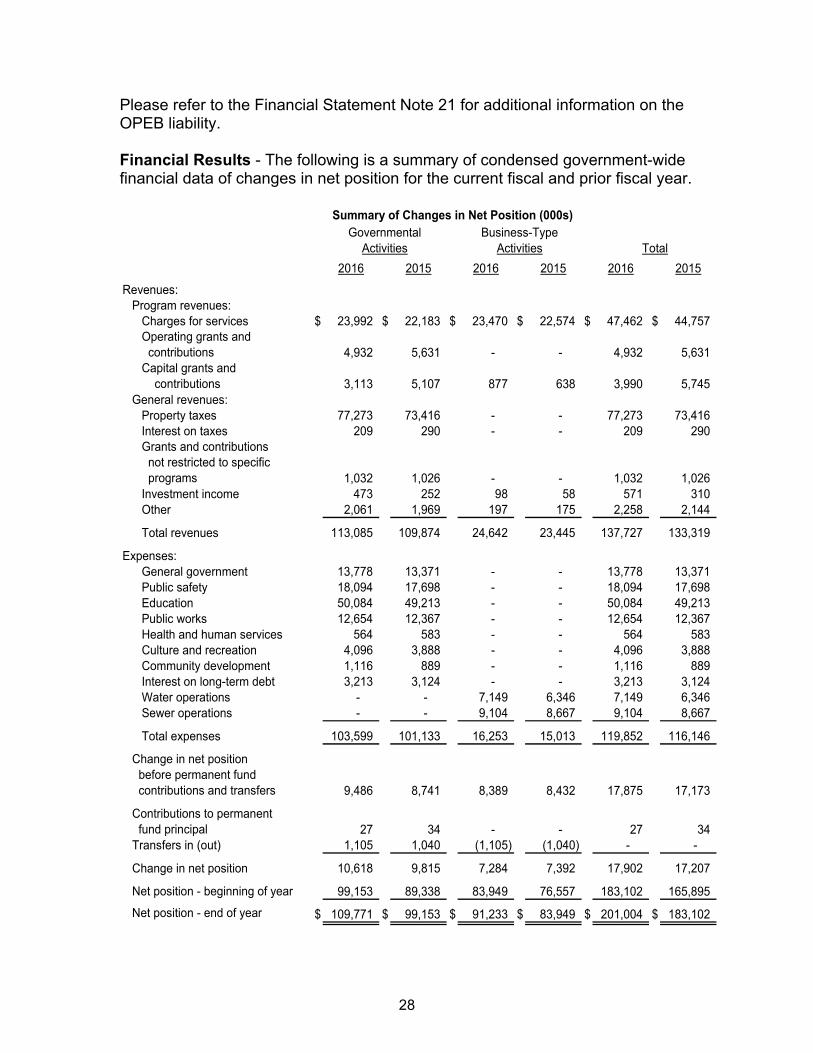
Please refer to the Financial Statement Note 21 for additional information on the OPEB liability. Financial Results - The following is a summary of condensed government-wide financial data of changes in net position for the current fiscal and prior fiscal year.
2016 2015 2016 2015 2016 2015
Revenues:Program revenues:
Charges for services $ 23,992 $ 22,183 $ 23,470 $ 22,574 $ 47,462 $ 44,757 Operating grants and contributions 4,932 5,631 - - 4,932 5,631 Capital grants and contributions 3,113 5,107 877 638 3,990 5,745
General revenues:Property taxes 77,273 73,416 - - 77,273 73,416 Interest on taxes 209 290 - - 209 290 Grants and contributions not restricted to specific programs 1,032 1,026 - - 1,032 1,026 Investment income 473 252 98 58 571 310 Other 2,061 1,969 197 175 2,258 2,144
Total revenues 113,085 109,874 24,642 23,445 137,727 133,319
Expenses:General government 13,778 13,371 - - 13,778 13,371 Public safety 18,094 17,698 - - 18,094 17,698 Education 50,084 49,213 - - 50,084 49,213 Public works 12,654 12,367 - - 12,654 12,367 Health and human services 564 583 - - 564 583 Culture and recreation 4,096 3,888 - - 4,096 3,888 Community development 1,116 889 - - 1,116 889 Interest on long-term debt 3,213 3,124 - - 3,213 3,124 Water operations - - 7,149 6,346 7,149 6,346 Sewer operations - - 9,104 8,667 9,104 8,667
Total expenses 103,599 101,133 16,253 15,013 119,852 116,146
Change in net position before permanent fund contributions and transfers 9,486 8,741 8,389 8,432 17,875 17,173
Contributions to permanent fund principal 27 34 - - 27 34 Transfers in (out) 1,105 1,040 (1,105) (1,040) - -
Change in net position 10,618 9,815 7,284 7,392 17,902 17,207
Net position - beginning of year 99,153 89,338 83,949 76,557 183,102 165,895
Net position - end of year $ 109,771 $ 99,153 $ 91,233 $ 83,949 $ 201,004 $ 183,102
Governmental Activities
Business-TypeActivities Total
Summary of Changes in Net Position (000s)
29
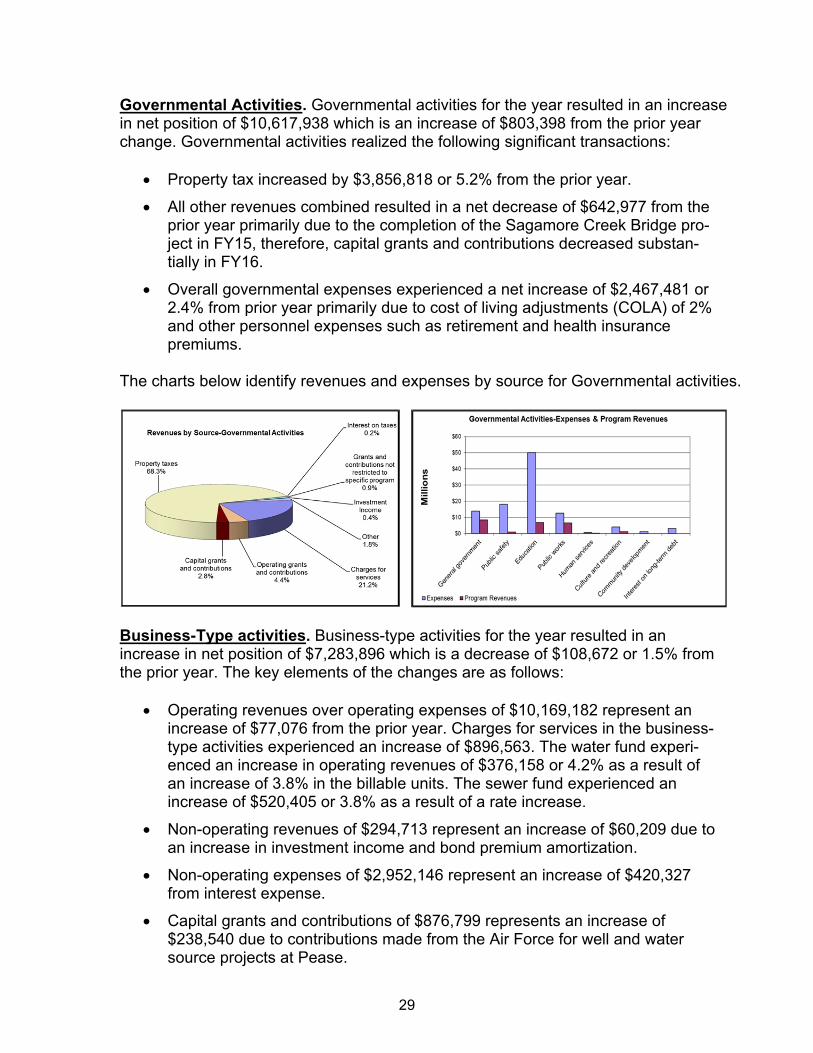
Governmental Activities. Governmental activities for the year resulted in an increase in net position of $10,617,938 which is an increase of $803,398 from the prior year change. Governmental activities realized the following significant transactions:
Property tax increased by $3,856,818 or 5.2% from the prior year.
All other revenues combined resulted in a net decrease of $642,977 from the prior year primarily due to the completion of the Sagamore Creek Bridge pro-ject in FY15, therefore, capital grants and contributions decreased substan-tially in FY16.
Overall governmental expenses experienced a net increase of $2,467,481 or 2.4% from prior year primarily due to cost of living adjustments (COLA) of 2% and other personnel expenses such as retirement and health insurance premiums.
The charts below identify revenues and expenses by source for Governmental activities.
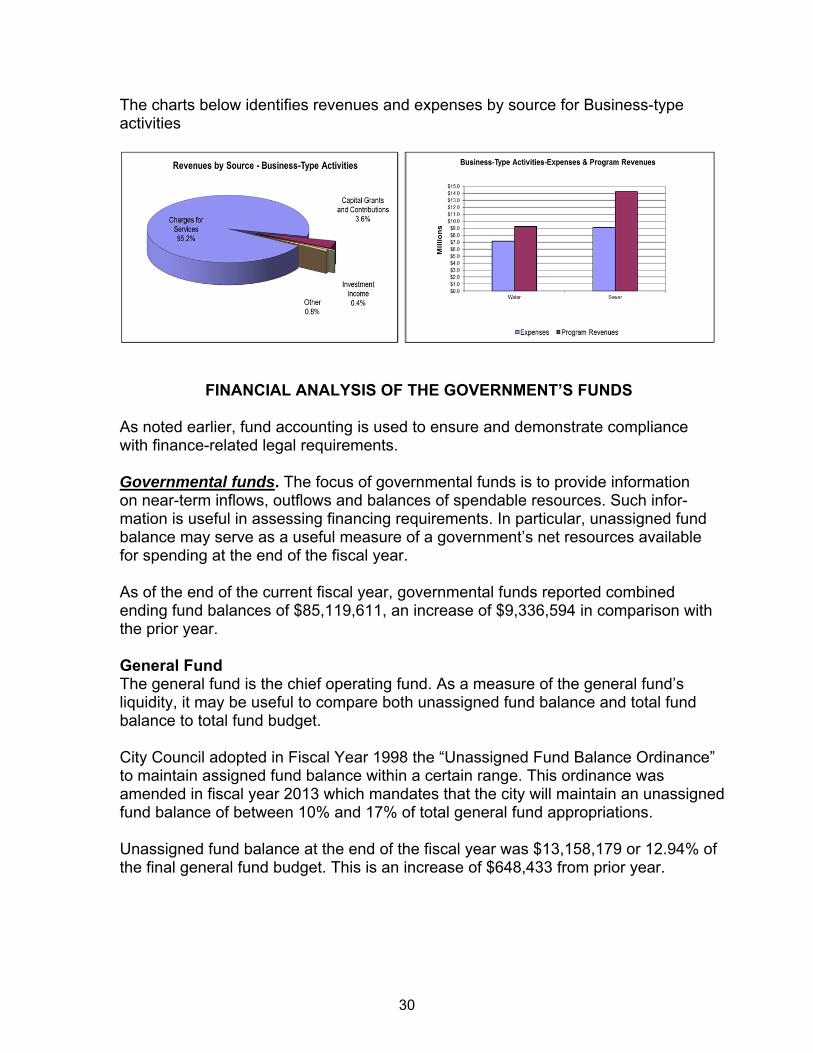
Business-Type activities. Business-type activities for the year resulted in an increase in net position of $7,283,896 which is a decrease of $108,672 or 1.5% from the prior year. The key elements of the changes are as follows:
Operating revenues over operating expenses of $10,169,182 represent an increase of $77,076 from the prior year. Charges for services in the business-type activities experienced an increase of $896,563. The water fund experi-enced an increase in operating revenues of $376,158 or 4.2% as a result of an increase of 3.8% in the billable units. The sewer fund experienced an increase of $520,405 or 3.8% as a result of a rate increase.
Non-operating revenues of $294,713 represent an increase of $60,209 due to an increase in investment income and bond premium amortization.
Non-operating expenses of $2,952,146 represent an increase of $420,327 from interest expense.
Capital grants and contributions of $876,799 represents an increase of $238,540 due to contributions made from the Air Force for well and water source projects at Pease.
30
The charts below identifies revenues and expenses by source for Business-type activities
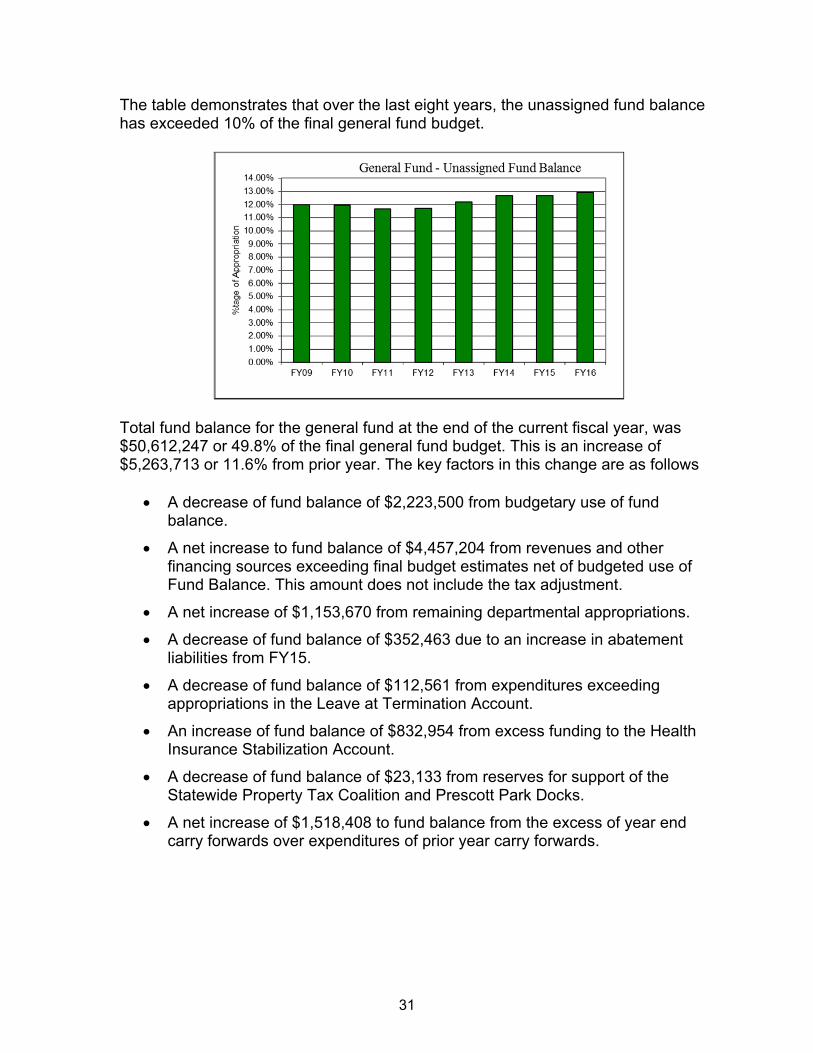
FINANCIAL ANALYSIS OF THE GOVERNMENT’S FUNDS As noted earlier, fund accounting is used to ensure and demonstrate compliance with finance-related legal requirements. Governmental funds. The focus of governmental funds is to provide information on near-term inflows, outflows and balances of spendable resources. Such infor-mation is useful in assessing financing requirements. In particular, unassigned fund balance may serve as a useful measure of a government’s net resources available for spending at the end of the fiscal year. As of the end of the current fiscal year, governmental funds reported combined ending fund balances of $85,119,611, an increase of $9,336,594 in comparison with the prior year. General Fund The general fund is the chief operating fund. As a measure of the general fund’s liquidity, it may be useful to compare both unassigned fund balance and total fund balance to total fund budget. City Council adopted in Fiscal Year 1998 the “Unassigned Fund Balance Ordinance” to maintain assigned fund balance within a certain range. This ordinance was amended in fiscal year 2013 which mandates that the city will maintain an unassigned fund balance of between 10% and 17% of total general fund appropriations. Unassigned fund balance at the end of the fiscal year was $13,158,179 or 12.94% of the final general fund budget. This is an increase of $648,433 from prior year.
31
The table demonstrates that over the last eight years, the unassigned fund balance has exceeded 10% of the final general fund budget.
Total fund balance for the general fund at the end of the current fiscal year, was $50,612,247 or 49.8% of the final general fund budget. This is an increase of $5,263,713 or 11.6% from prior year. The key factors in this change are as follows
A decrease of fund balance of $2,223,500 from budgetary use of fund balance.
A net increase to fund balance of $4,457,204 from revenues and other financing sources exceeding final budget estimates net of budgeted use of Fund Balance. This amount does not include the tax adjustment.
A net increase of $1,153,670 from remaining departmental appropriations.
A decrease of fund balance of $352,463 due to an increase in abatement liabilities from FY15.
A decrease of fund balance of $112,561 from expenditures exceeding appropriations in the Leave at Termination Account.
An increase of fund balance of $832,954 from excess funding to the Health Insurance Stabilization Account.
A decrease of fund balance of $23,133 from reserves for support of the Statewide Property Tax Coalition and Prescott Park Docks.
A net increase of $1,518,408 to fund balance from the excess of year end carry forwards over expenditures of prior year carry forwards.
32
At the end of the current fiscal year, total fund balance of other governmental funds was $34,507,364, which is a net increase of $4,072,881 or 13.4% from prior year. Key factors in this change are as follows:
An increase of $886,334 from surplus of parking related revenue reported in the Parking & Transportation Special Revenue Fund.
A net increase of $2,809,022 in the Transportation Management capital project fund from unspent bond proceeds.
Proprietary funds. Proprietary funds provide the same type of information found in the business-type activities reported in the government-wide financial statements, but in more detail. Proprietary fund financial statements use the accrual basis of accounting, like the government-wide financials. As such, there is no reconciliation needed between the government-wide financial statements for business type activities and the proprietary fund financial statements. Total net position for the water and sewer funds at the end of the year increased $7,283,896 to a total of $91,233,262. The water fund increased by $2,108,498 and the sewer fund increased $5,175,398. Unrestricted net position of the water and sewer funds at the end of the year increased by $3,491,716 to a total of $30,326,890. The water fund unrestricted net position is $8,394,905, while the sewer fund unrestricted net position is $21,931,985. Restricted for debt service of $650,192 is related to the Pease Wastewater Treatment Plant debt which is contributed from the Pease Development Authority. Net investment in capital assets increased by $3,954,728, of which the water fund capital assets increased by $1,165,865 and the sewer fund capital assets increased by $2,788,863. To provide adequate revenues to meet expenditures for operations, debt service, and capital improvements, the City’s rates are based on a two-step, inclining block rate structure for both water and sewer usage. For water consumption for FY16, the first ten units (one unit equals 100 cubic feet or 748 gallons) water consumed per month was billed at $4.15 per unit; all units over ten units per month was billed at a rate of $5.00 per unit. For sewer, which is measured by water consumption, which the first ten units was billed at $11.77 per unit; all units over ten units per month was billed at a rate of $12.95 per unit.
GENERAL FUND BUDGETARY HIGHLIGHTS There was one supplemental appropriation during FY16 of $650,000 to fund expend-itures related to the Middle School construction.

33
The difference between the final amended budget and actual results is a positive variance of $5,249,278 with revenues exceeding estimated budgets by $4,095,608 and expenditures were less than the estimated budget by $1,153,670. Significant variances include:
Positive variance in Licenses and Permits of $1,267,203 is mainly attributed to an excess of $628,012 as a result of an increase number of motor vehicle registrations and $579,103 in building, electrical and plumbing permits result-ing from renovations and new construction citywide.
Positive variance in Intergovernmental of $512,163 mainly attributed to school tuition.
Positive variance in Charges for Services of $649,009 primarily consists of an excess of $362,731 from the Pease Development Authority (PDA) and $202,710 from ambulance fees.
Positive variance in Other Financing Sources of $1,540,767 is attributed to bond premiums.
Current operating expenditures resulting in a positive variance of $791,160 is mainly due to, $55,000 surplus in street light electricity, $71,885 from welfare direct assistance, $191,000 in contingency as a result of unsettled contracts, and $128,091 surplus from other General Government departments, $98,752 surplus in the Police Department, $47,647 surplus in the Fire Department all primarily as a result of vacancies.
Non-operating expenditures resulting in a net positive variance of $362,510 is mainly attributed to $459,691 surplus in debt related expenditures and a negative variance of $98,128 from County Tax.
CAPITAL ASSET AND DEBT ADMINISTRATION Capital assets. Total investment in capital assets for governmental and business-type activities at year-end amounted to $316,271,016 (net of accumulated depreciation), an increase $12,452,359 from the prior year. This investment in capital assets includes land, buildings, system improvements, and machinery and equipment.
Amount %2016 2015 2016 2015 2016 2015 Change Change
Land $ 15,782 $ 15,650 $ 2,526 $ 2,526 $ 18,308 $ 18,176 $ 132 0.73%Building and improvement 100,170 103,180 21,789 22,592 121,959 125,772 (3,813) -3.03%Machinery and equipment 7,522 7,323 13,818 14,370 21,340 21,693 (353) -1.63%Infrastructure 57,083 45,658 70,505 64,053 127,588 109,711 17,877 16.29%Construction in Progress 10,257 11,699 16,819 16,767 27,076 28,466 (1,390) -4.88%
Total Assets $ 190,814 $ 183,510 $ 125,457 $ 120,308 $ 316,271 $ 303,818 $ 12,453 4.10%
Capital Assets (000s)(net of depreciation)
GovernmentalActivities
Business-typeActivities Totals
34
Major capital asset events during the current fiscal year included the following:
Construction in progress for governmental activities totaled $10,256,096 at year end which $5,942,411 is attributed to the Little Harbour School renova-tions, $623,857 to construct the Harborwalk Park Pier, $246,801 to construct the new parking facility on Deer St. and $3,443,027 to various streets, sidewalks, buildings, parks and playground projects.
Governmental funds capitalization of assets totaled $15,650,670 summarized as follows:
The Sagamore Creek Bridge was replaced and capitalized at $7,815,238.
Commerce Way transferred from a private road to a municipal road with the abutters paying for the improvements through a betterment assessment of $1,698,383.
West Road and Sagamore Avenue were rehabilitated for $1,103,262 and $856,043 respectively.
A variety of other sidewalk and street construction contributed to capital assets of $1,913,139.
The docks at Prescott Park were replaced for $717,215.
The Indoor Pool HVAC was upgraded for $403,314.
General government vehicles capitalized during the current year which included Public Works vehicles of $284,243, Police vehicles of $107,015, Fire vehicles of $455,314, and School vehicles of $28,118.
Construction in progress in the water fund totaled $4,925,915 at year end primarily due to $2,744,043 for the construction on the Hobb’s Hill water tower, $286,257 for Greenland Well, $619,239 for various waterline projects, $671,648 for water source augmentation and booster stations and $604,728 for various well and water source projects at the Pease Tradeport.
The water fund had increases to capital assets of $2,274,404 during the year which primarily consisted of $1,168,116 for the Lincoln 3c project, $346,512 for vehicles and equipment, and $759,776 for various other water system and quality improvements.
Construction in progress in the sewer fund totaled $11,893,160 at year end primarily due to $9,987,243 for the design of the Peirce Island wastewater treatment plant, $690,586 for upgrades to the Pease wastewater treatment plant, and $1,215,331 for various other sewer system improvements.
The sewer fund had increases to capital assets of $6,395,320 during the year which primarily consisted of $5,099,141 for Lincoln 3c sewer separation project, $915,612 for Sagamore Ave sewer upgrades, $46,178 for various other sewer system upgrades, and $334,389 in equipment and vehicle investments.
35
Additional information on the City of Portsmouth’s capital assets can be found in Note 9 on pages 71-72 of this report. Long-term debt. At the end of the current fiscal year, total bonded debt and State revolving fund loans outstanding, including business-type activities (water and sewer departments) was $175,248,514 as shown in the table below, all of which was backed by the full faith and credit of the government. State Revolving Fund Loan (SRF) program was created by the New Hampshire Legislature in 1987. This SRF program provides low-interest loans to help munici-palities with projects such as wastewater treatment projects, landfill closures, and public water supply improvements. The City of Portsmouth’s General Obligation bonds have an AAA rating from Standard and Poor’s Global rating services.
2016 2015 2016 2015 2016 2015
General obligation bonds $ 81,756 $ 76,665 $ 51,487 $ 46,600 $ 133,243 $ 123,265 State revolving fund loans 671 884 29,024 31,822 29,695 32,706 Unamortized premium 7,455 6,029 4,856 3,317 12,311 9,346
Total Debt $ 89,882 $ 83,578 $ 85,367 $ 81,739 $ 175,249 $ 165,317
Governmental Business-typeActivities Activities Totals
Outstanding Debt (000s)
The City of Portsmouth’s total debt increased by $9,931,883 or 6.01% during the current fiscal year. The key factors in this net increase are:
Reductions of outstanding debt principal in the amount of $14,143,419.
Reductions of $11,600,000 due to refunding.
The issuance of General Obligation bonds and loans of $32,710,000 for the following projects:
$523,290 for a Fire Apparatus.
$500,000 for School Facility improvements.
$5,000,000 for improvements to Little Harbour School.
$6,100,000 for Streets and Sidewalk Improvements.
$1,524,710 for the Commerce Way Betterment.
$2,332,000 for refunding a callable bond issue from 2008 for the land and construction of Fire Station 2.
$8,630,000 for refunding a callable bond issued from 2009 for continued construction of Fire Station 2 and the Madbury Water Treatment Plant.
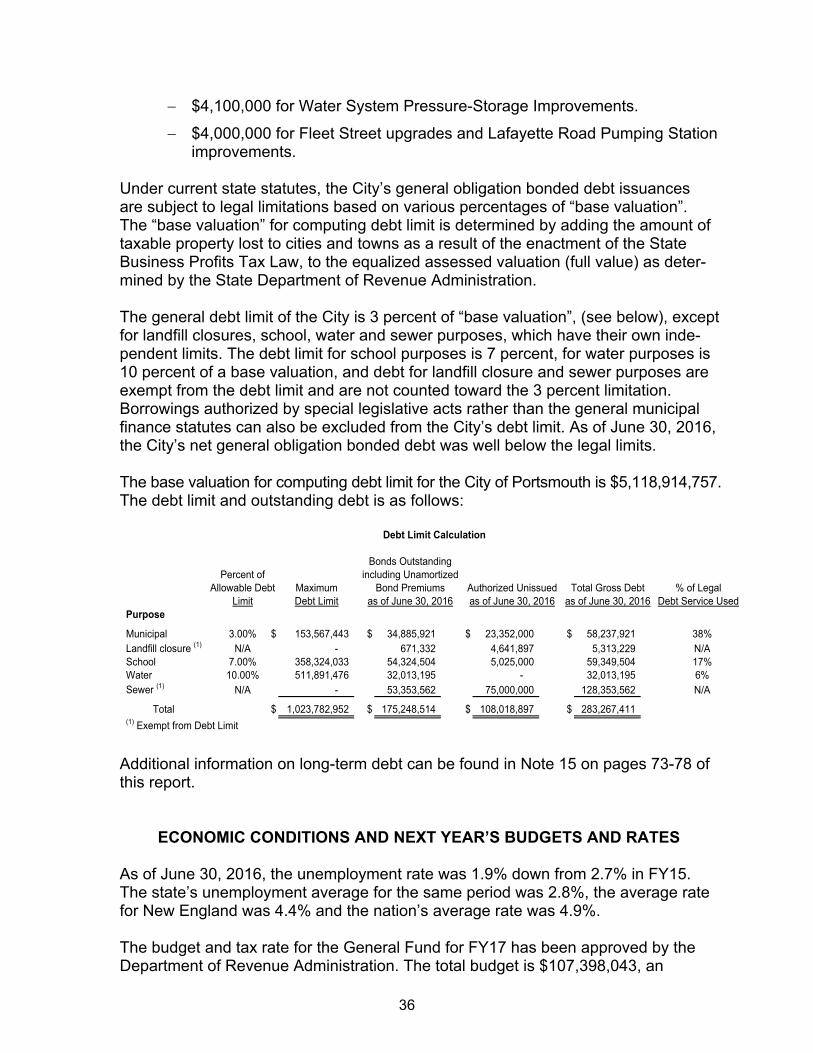
36
$4,100,000 for Water System Pressure-Storage Improvements.
$4,000,000 for Fleet Street upgrades and Lafayette Road Pumping Station improvements.
Under current state statutes, the City’s general obligation bonded debt issuances are subject to legal limitations based on various percentages of “base valuation”. The “base valuation” for computing debt limit is determined by adding the amount of taxable property lost to cities and towns as a result of the enactment of the State Business Profits Tax Law, to the equalized assessed valuation (full value) as deter-mined by the State Department of Revenue Administration. The general debt limit of the City is 3 percent of “base valuation”, (see below), except for landfill closures, school, water and sewer purposes, which have their own inde-pendent limits. The debt limit for school purposes is 7 percent, for water purposes is 10 percent of a base valuation, and debt for landfill closure and sewer purposes are exempt from the debt limit and are not counted toward the 3 percent limitation. Borrowings authorized by special legislative acts rather than the general municipal finance statutes can also be excluded from the City’s debt limit. As of June 30, 2016, the City’s net general obligation bonded debt was well below the legal limits. The base valuation for computing debt limit for the City of Portsmouth is $5,118,914,757. The debt limit and outstanding debt is as follows:
MaximumDebt Limit
Purpose
Municipal 3.00% $ 153,567,443 $ 34,885,921 $ 23,352,000 $ 58,237,921 38%Landfill closure (1) N/A - 671,332 4,641,897 5,313,229 N/ASchool 7.00% 358,324,033 54,324,504 5,025,000 59,349,504 17%Water 10.00% 511,891,476 32,013,195 - 32,013,195 6%Sewer (1) N/A - 53,353,562 75,000,000 128,353,562 N/A
Total $ 1,023,782,952 $ 175,248,514 $ 108,018,897 $ 283,267,411 (1) Exempt from Debt Limit
as of June 30, 2016Authorized Unissued Total Gross Debt
as of June 30, 2016
Debt Limit Calculation
Allowable DebtPercent of
Limit% of Legal
Debt Service UsedBond Premiums
including UnamortizedBonds Outstanding
as of June 30, 2016
Additional information on long-term debt can be found in Note 15 on pages 73-78 of this report.
ECONOMIC CONDITIONS AND NEXT YEAR’S BUDGETS AND RATES As of June 30, 2016, the unemployment rate was 1.9% down from 2.7% in FY15. The state’s unemployment average for the same period was 2.8%, the average rate for New England was 4.4% and the nation’s average rate was 4.9%. The budget and tax rate for the General Fund for FY17 has been approved by the Department of Revenue Administration. The total budget is $107,398,043, an
37
increase of $5,701,841 or 5.6% from the prior year final budget. The tax rate has been set at $17.04 per $1,000 of assessed value. This is an increase of $.25 or 1.5% from prior year. The City of Portsmouth has appropriated a total of $2,023,500 from committed fund balance of which $1,700,000 for debt service payments, $250,000 for capital outlay, and $73,500 for abatements in the fiscal year 2017 budget to maintain a moderate tax rate. Both the Water and Sewer Division user rates are based on a two-tier inclining rate block structure based on units of water consumed. One unit is equal to 100 cubic feet or 748 gallons of water. This two-tier inclining rate block structure provided an equitable method of financing of water treatment and wastewater operations. The large volume users have a greater impact on system operations.
The water rate did not increase in FY17 from FY16 and has not increased since FY11 remaining at $4.15 for the first 10 units of water consumed per month and $5.00 per unit for consumption over 10 units per month. The meter charge rate also remained the same and is based on the service meter size.
Sewer charges are based on water consumption. The sewer rate increased from $11.77 to $12.95 per unit for the first 10 units of water consumed per month. The rate for consumption over 10 units per month increased from $12.95 to $13.47 per unit.
REQUESTS FOR INFORMATION This financial report is designed to provide a general overview of the City of Portsmouth’s finances for all those with an interest in the government’s finances. Questions concerning any of the information provided in this report or requests for additional financial information can be found on the city’s web page at www.cityofportsmouth.com or should be addressed to:
Office of Finance Director City of Portsmouth 1 Junkins Avenue
Portsmouth, New Hampshire 03801

38
(This page intentionally left blank.)

39
Basic Financial Statements

40
(This page intentionally left blank.)

41
Governmental Business-TypeActivities Activities Total
ASSETSCurrent:
Cash and short-term investments $ 63,286,986 $ 50,711,419 $ 113,998,405 Investments 34,521,908 - 34,521,908 Receivables, net of allowance for uncollectibles:
Property taxes 1,597,081 - 1,597,081 User fees - 3,742,919 3,742,919 Departmental and other 735,436 910,979 1,646,415 Intergovernmental 976,043 84,625 1,060,668 Loans and interest 19,752 - 19,752
Inventory 28,610 238,100 266,710 Other assets 13,587 - 13,587
Total current assets 101,179,403 55,688,042 156,867,445
Noncurrent:Receivables, net of allowance for uncollectibles:
Property taxes 556,588 - 556,588 Departmental and other - 1,410,290 1,410,290
Loans 2,080,141 - 2,080,141 Capital assets:
Land and construction in progress 26,038,803 19,345,141 45,383,944 Other capital assets, net of
accumulated depreciation 164,774,896 106,112,176 270,887,072
Total non-current assets 193,450,428 126,867,607 320,318,035
DEFERRED OUTFLOWS OF RESOURCESPension related 7,759,884 360,166 8,120,050
OUTFLOWS OF RESOURCES 302,389,715 182,915,815 485,305,530
LIABILITIESCurrent:
Accounts payable 2,477,319 629,109 3,106,428 Accrued liabilities 1,629,908 633,316 2,263,224 Notes payable 7,000,000 - 7,000,000 Deposits held in custody - 31,160 31,160 Retainage payable 446,635 483,392 930,027 Unearned revenue 123,527 15,000 138,527 Tax refunds payable 3,364,005 - 3,364,005 Other current liabilities 809,520 195,986 1,005,506 Current portion of long-term liabilities: Bonds and loans payable 10,146,655 6,319,675 16,466,330 Other liabilities 733,883 47,634 781,517
Total current liabilities 26,731,452 8,355,272 35,086,724
Noncurrent:Bonds and loans payable, net of current portion 79,735,102 79,047,082 158,782,184 Net OPEB obligation 5,393,090 314,943 5,708,033 Net pension liability 70,467,778 3,255,579 73,723,357 Other liabilities, net of current portion 6,821,203 547,784 7,368,987
Total noncurrent liabilities 162,417,173 83,165,388 245,582,561
DEFERRED INFLOWS OF RESOURCESPension related 3,470,644 161,893 3,632,537
INFLOWS OF RESOURCES 192,619,269 91,682,553 284,301,822
NET POSITIONNet investment in capital assets 113,265,585 60,256,180 173,521,765 Restricted externally or constitutionally for:
Grants 5,436,802 - 5,436,802 Debt - 650,192 650,192 Permanent funds:
Nonspendable 1,633,062 - 1,633,062 Spendable 5,431,939 - 5,431,939
Restricted by enabling legislation 4,877,902 - 4,877,902 Unrestricted (20,874,844) 30,326,890 9,452,046
$ 109,770,446 $ 91,233,262 $ 201,003,708
The accompanying notes are an integral part of these financial statements.
TOTAL NET POSITION
CITY OF PORTSMOUTH, NEW HAMPSHIRE
STATEMENT OF NET POSITION
JUNE 30, 2016
TOTAL ASSETS AND DEFERRED
TOTAL LIABILITIES AND DEFERRED
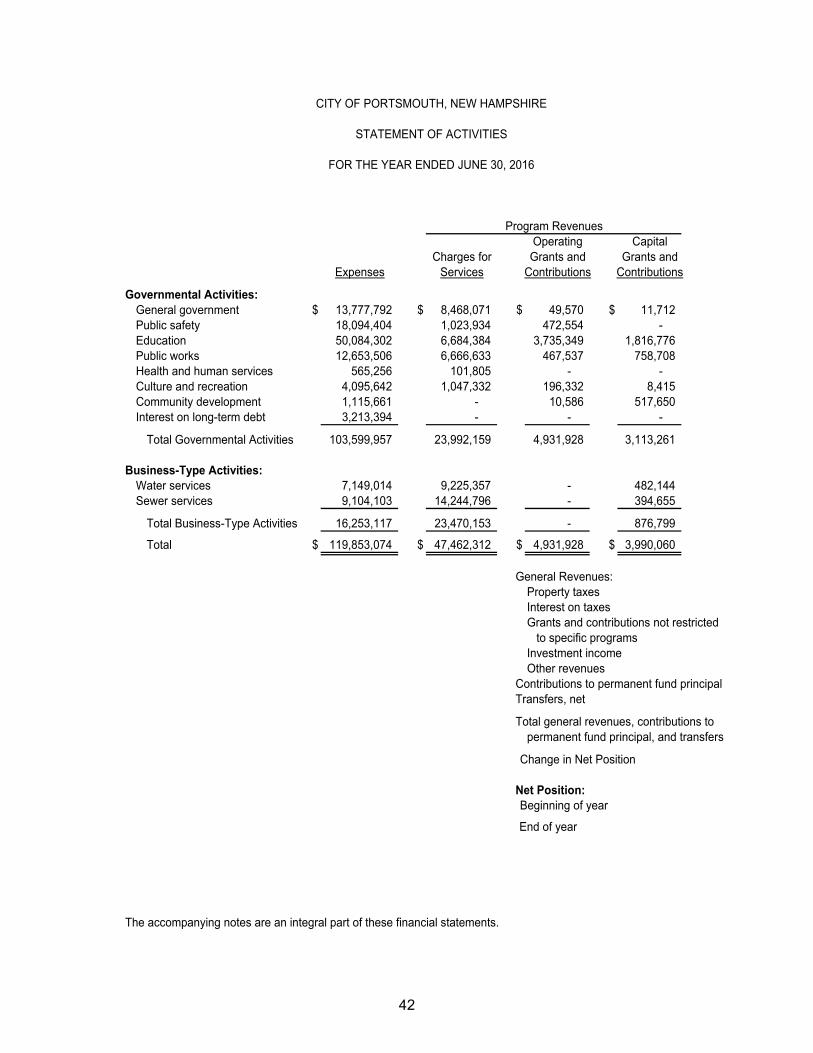
42
Operating CapitalCharges for Grants and Grants and
Expenses Services Contributions Contributions
Governmental Activities:General government $ 13,777,792 $ 8,468,071 $ 49,570 $ 11,712 Public safety 18,094,404 1,023,934 472,554 - Education 50,084,302 6,684,384 3,735,349 1,816,776 Public works 12,653,506 6,666,633 467,537 758,708 Health and human services 565,256 101,805 - - Culture and recreation 4,095,642 1,047,332 196,332 8,415 Community development 1,115,661 - 10,586 517,650 Interest on long-term debt 3,213,394 - - -
Total Governmental Activities 103,599,957 23,992,159 4,931,928 3,113,261
Business-Type Activities:Water services 7,149,014 9,225,357 - 482,144 Sewer services 9,104,103 14,244,796 - 394,655
Total Business-Type Activities 16,253,117 23,470,153 - 876,799
Total $ 119,853,074 $ 47,462,312 $ 4,931,928 $ 3,990,060
General Revenues:Property taxesInterest on taxesGrants and contributions not restricted to specific programsInvestment incomeOther revenues
Contributions to permanent fund principal Transfers, net
Total general revenues, contributions topermanent fund principal, and transfers
Change in Net Position
Net Position:Beginning of year
End of year
The accompanying notes are an integral part of these financial statements.
Program Revenues
CITY OF PORTSMOUTH, NEW HAMPSHIRE
STATEMENT OF ACTIVITIES
FOR THE YEAR ENDED JUNE 30, 2016
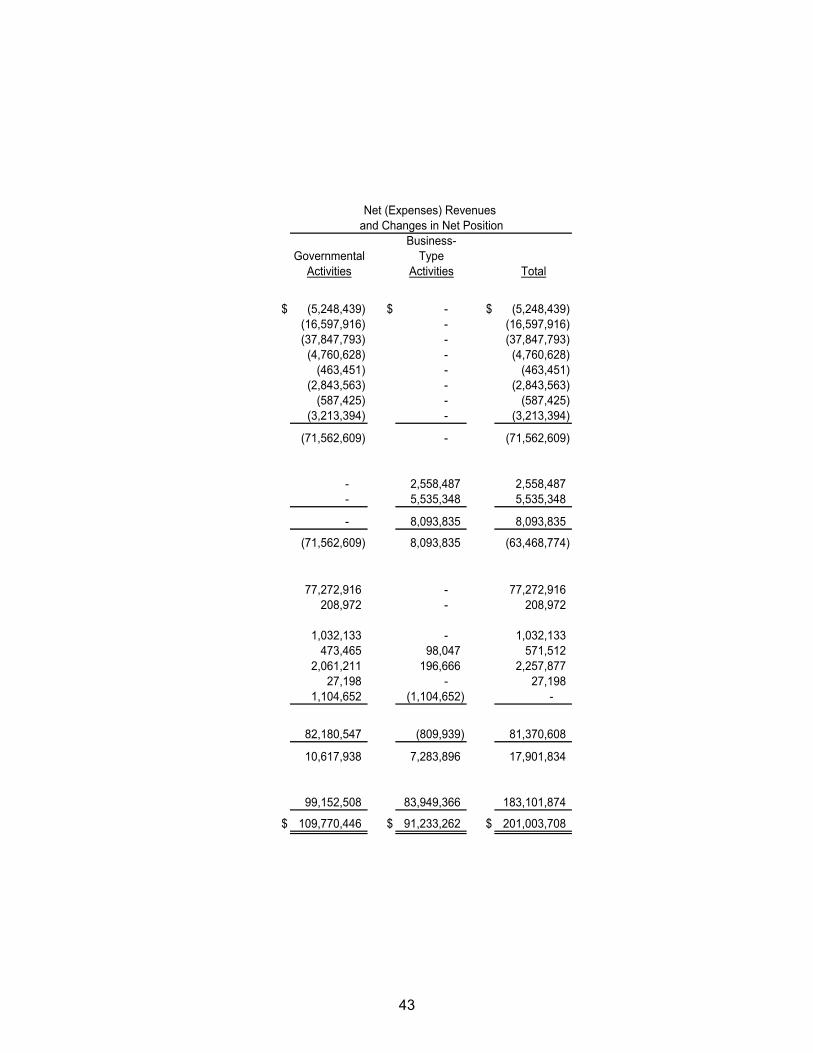
43
Business-Governmental Type
Activities Activities Total
$ (5,248,439) $ - $ (5,248,439) (16,597,916) - (16,597,916) (37,847,793) - (37,847,793)
(4,760,628) - (4,760,628) (463,451) - (463,451)
(2,843,563) - (2,843,563) (587,425) - (587,425)
(3,213,394) - (3,213,394)
(71,562,609) - (71,562,609)
- 2,558,487 2,558,487 - 5,535,348 5,535,348
- 8,093,835 8,093,835
(71,562,609) 8,093,835 (63,468,774)
77,272,916 - 77,272,916 208,972 - 208,972
1,032,133 - 1,032,133 473,465 98,047 571,512
2,061,211 196,666 2,257,877 27,198 - 27,198
1,104,652 (1,104,652) -
82,180,547 (809,939) 81,370,608
10,617,938 7,283,896 17,901,834
99,152,508 83,949,366 183,101,874
$ 109,770,446 $ 91,233,262 $ 201,003,708
and Changes in Net PositionNet (Expenses) Revenues
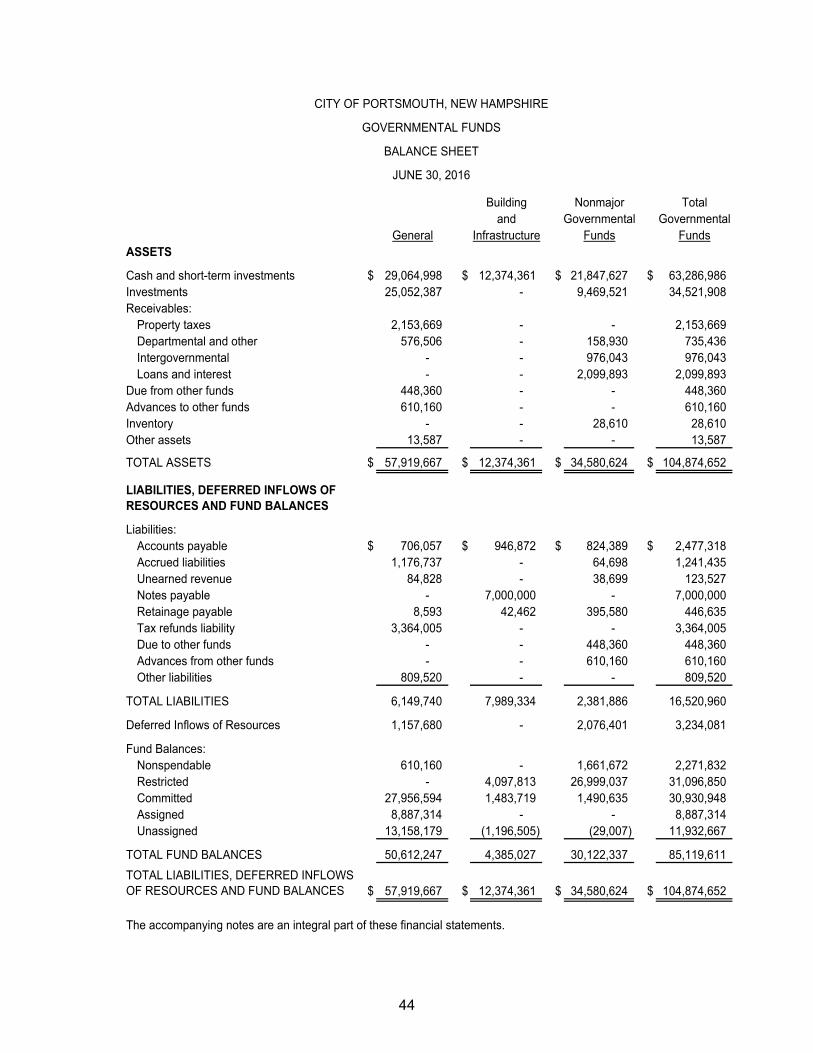
44
Building Nonmajor Totaland Governmental Governmental
General Infrastructure Funds Funds
Cash and short-term investments $ 29,064,998 $ 12,374,361 $ 21,847,627 $ 63,286,986 Investments 25,052,387 - 9,469,521 34,521,908 Receivables:
Property taxes 2,153,669 - - 2,153,669 Departmental and other 576,506 - 158,930 735,436 Intergovernmental - - 976,043 976,043 Loans and interest - - 2,099,893 2,099,893
Due from other funds 448,360 - - 448,360 Advances to other funds 610,160 - - 610,160 Inventory - - 28,610 28,610 Other assets 13,587 - - 13,587
TOTAL ASSETS $ 57,919,667 $ 12,374,361 $ 34,580,624 $ 104,874,652
Liabilities:Accounts payable $ 706,057 $ 946,872 $ 824,389 $ 2,477,318 Accrued liabilities 1,176,737 - 64,698 1,241,435 Unearned revenue 84,828 - 38,699 123,527 Notes payable - 7,000,000 - 7,000,000 Retainage payable 8,593 42,462 395,580 446,635 Tax refunds liability 3,364,005 - - 3,364,005 Due to other funds - - 448,360 448,360 Advances from other funds - - 610,160 610,160 Other liabilities 809,520 - - 809,520
TOTAL LIABILITIES 6,149,740 7,989,334 2,381,886 16,520,960
Deferred Inflows of Resources 1,157,680 - 2,076,401 3,234,081
Fund Balances:Nonspendable 610,160 - 1,661,672 2,271,832 Restricted - 4,097,813 26,999,037 31,096,850 Committed 27,956,594 1,483,719 1,490,635 30,930,948 Assigned 8,887,314 - - 8,887,314 Unassigned 13,158,179 (1,196,505) (29,007) 11,932,667
TOTAL FUND BALANCES 50,612,247 4,385,027 30,122,337 85,119,611
$ 57,919,667 $ 12,374,361 $ 34,580,624 $ 104,874,652
The accompanying notes are an integral part of these financial statements.
TOTAL LIABILITIES, DEFERRED INFLOWS OF RESOURCES AND FUND BALANCES
LIABILITIES, DEFERRED INFLOWS OF RESOURCES AND FUND BALANCES
ASSETS
CITY OF PORTSMOUTH, NEW HAMPSHIRE
BALANCE SHEET
JUNE 30, 2016
GOVERNMENTAL FUNDS
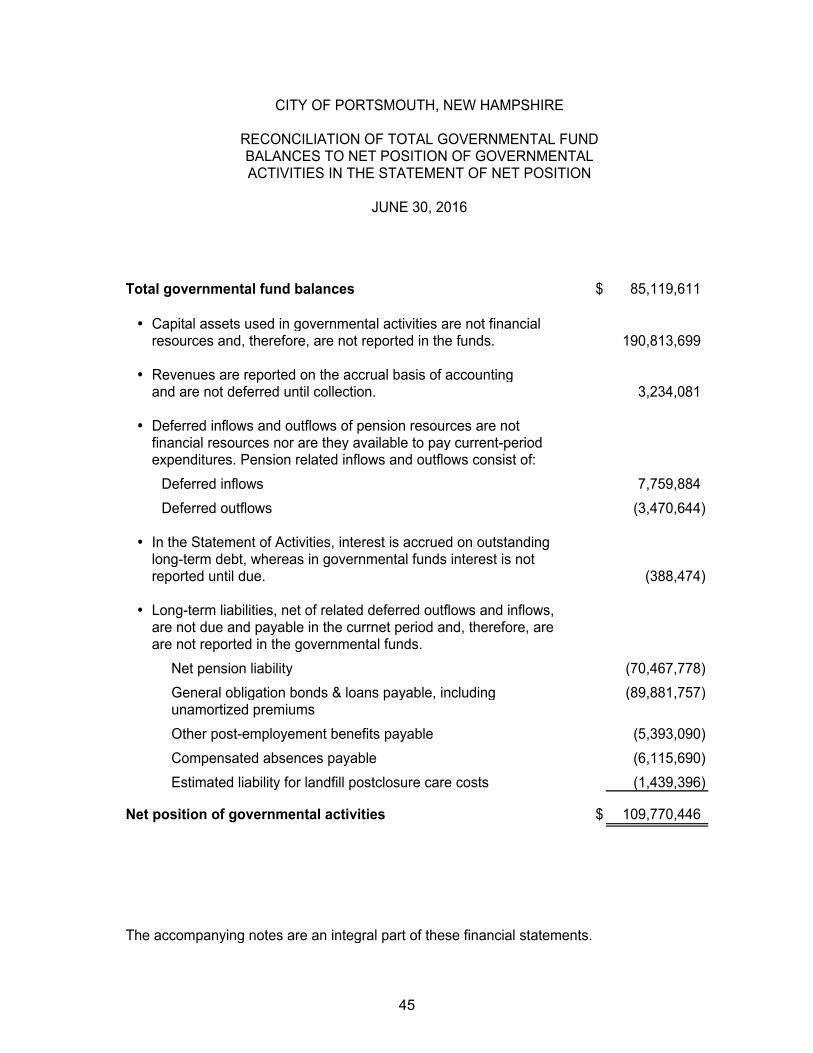
45
Total governmental fund balances $ 85,119,611
Capital assets used in governmental activities are not financialresources and, therefore, are not reported in the funds. 190,813,699
Revenues are reported on the accrual basis of accountingand are not deferred until collection. 3,234,081
Deferred inflows and outflows of pension resources are not financial resources nor are they available to pay current-periodexpenditures. Pension related inflows and outflows consist of:
Deferred inflows 7,759,884
Deferred outflows (3,470,644)
In the Statement of Activities, interest is accrued on outstandinglong-term debt, whereas in governmental funds interest is not reported until due. (388,474)
Long-term liabilities, net of related deferred outflows and inflows, are not due and payable in the currnet period and, therefore, areare not reported in the governmental funds.
Net pension liability (70,467,778)
General obligation bonds & loans payable, including (89,881,757) unamortized premiums
Other post-employement benefits payable (5,393,090)
Compensated absences payable (6,115,690)
Estimated liability for landfill postclosure care costs (1,439,396)
Net position of governmental activities $ 109,770,446
The accompanying notes are an integral part of these financial statements.
CITY OF PORTSMOUTH, NEW HAMPSHIRE
RECONCILIATION OF TOTAL GOVERNMENTAL FUND
JUNE 30, 2016
BALANCES TO NET POSITION OF GOVERNMENTALACTIVITIES IN THE STATEMENT OF NET POSITION
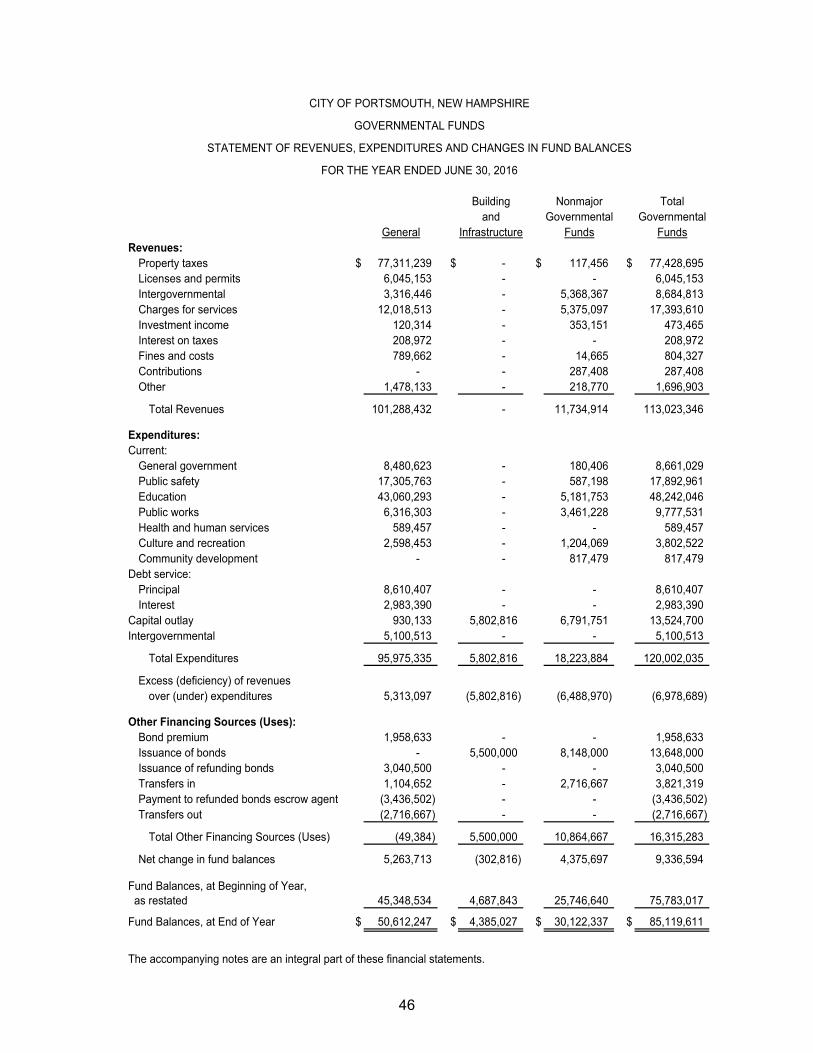
46
Building Nonmajor Totaland Governmental Governmental
General Infrastructure Funds FundsRevenues:
Property taxes $ 77,311,239 $ - $ 117,456 $ 77,428,695 Licenses and permits 6,045,153 - - 6,045,153 Intergovernmental 3,316,446 - 5,368,367 8,684,813 Charges for services 12,018,513 - 5,375,097 17,393,610 Investment income 120,314 - 353,151 473,465 Interest on taxes 208,972 - - 208,972 Fines and costs 789,662 - 14,665 804,327 Contributions - - 287,408 287,408 Other 1,478,133 - 218,770 1,696,903
Total Revenues 101,288,432 - 11,734,914 113,023,346
Expenditures:Current:
General government 8,480,623 - 180,406 8,661,029 Public safety 17,305,763 - 587,198 17,892,961 Education 43,060,293 - 5,181,753 48,242,046 Public works 6,316,303 - 3,461,228 9,777,531 Health and human services 589,457 - - 589,457 Culture and recreation 2,598,453 - 1,204,069 3,802,522 Community development - - 817,479 817,479
Debt service:Principal 8,610,407 - - 8,610,407 Interest 2,983,390 - - 2,983,390
Capital outlay 930,133 5,802,816 6,791,751 13,524,700 Intergovernmental 5,100,513 - - 5,100,513
Total Expenditures 95,975,335 5,802,816 18,223,884 120,002,035
Excess (deficiency) of revenuesover (under) expenditures 5,313,097 (5,802,816) (6,488,970) (6,978,689)
Other Financing Sources (Uses):Bond premium 1,958,633 - - 1,958,633 Issuance of bonds - 5,500,000 8,148,000 13,648,000 Issuance of refunding bonds 3,040,500 - - 3,040,500 Transfers in 1,104,652 - 2,716,667 3,821,319 Payment to refunded bonds escrow agent (3,436,502) - - (3,436,502) Transfers out (2,716,667) - - (2,716,667)
Total Other Financing Sources (Uses) (49,384) 5,500,000 10,864,667 16,315,283
Net change in fund balances 5,263,713 (302,816) 4,375,697 9,336,594
45,348,534 4,687,843 25,746,640 75,783,017
Fund Balances, at End of Year $ 50,612,247 $ 4,385,027 $ 30,122,337 $ 85,119,611
The accompanying notes are an integral part of these financial statements.
CITY OF PORTSMOUTH, NEW HAMPSHIRE
GOVERNMENTAL FUNDS
STATEMENT OF REVENUES, EXPENDITURES AND CHANGES IN FUND BALANCES
FOR THE YEAR ENDED JUNE 30, 2016
Fund Balances, at Beginning of Year, as restated
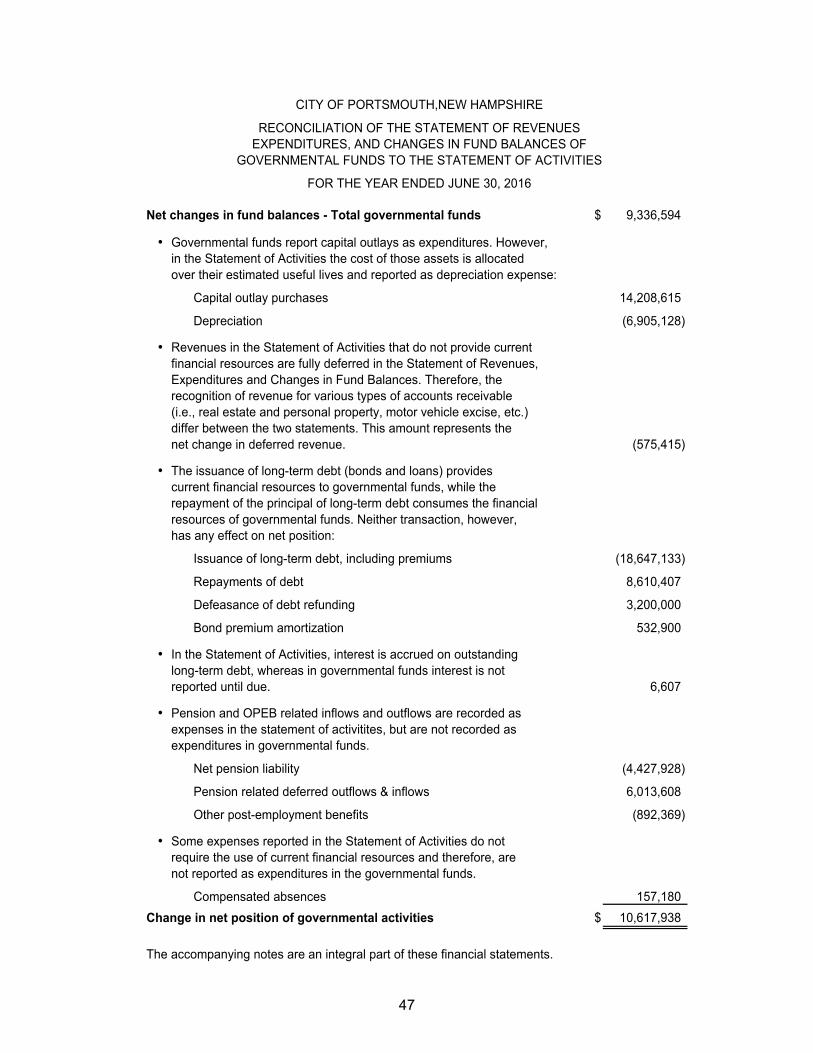
47
$ 9,336,594
Governmental funds report capital outlays as expenditures. However,in the Statement of Activities the cost of those assets is allocatedover their estimated useful lives and reported as depreciation expense:
Capital outlay purchases 14,208,615
Depreciation (6,905,128)
Revenues in the Statement of Activities that do not provide currentfinancial resources are fully deferred in the Statement of Revenues,Expenditures and Changes in Fund Balances. Therefore, therecognition of revenue for various types of accounts receivable (i.e., real estate and personal property, motor vehicle excise, etc.)differ between the two statements. This amount represents thenet change in deferred revenue. (575,415)
The issuance of long-term debt (bonds and loans) providescurrent financial resources to governmental funds, while therepayment of the principal of long-term debt consumes the financialresources of governmental funds. Neither transaction, however, has any effect on net position:
Issuance of long-term debt, including premiums (18,647,133)
Repayments of debt 8,610,407
Defeasance of debt refunding 3,200,000
Bond premium amortization 532,900
In the Statement of Activities, interest is accrued on outstanding long-term debt, whereas in governmental funds interest is not reported until due. 6,607
Pension and OPEB related inflows and outflows are recorded asexpenses in the statement of activitites, but are not recorded asexpenditures in governmental funds.
Net pension liability (4,427,928)
Pension related deferred outflows & inflows 6,013,608
Other post-employment benefits (892,369)
Some expenses reported in the Statement of Activities do not require the use of current financial resources and therefore, are
Compensated absences 157,180
$ 10,617,938
The accompanying notes are an integral part of these financial statements.
Change in net position of governmental activities
Net changes in fund balances - Total governmental funds
not reported as expenditures in the governmental funds.
CITY OF PORTSMOUTH,NEW HAMPSHIRE
RECONCILIATION OF THE STATEMENT OF REVENUES
FOR THE YEAR ENDED JUNE 30, 2016
EXPENDITURES, AND CHANGES IN FUND BALANCES OFGOVERNMENTAL FUNDS TO THE STATEMENT OF ACTIVITIES

48
Original Final ActualBudget Budget Amounts
Revenues and other sources:Taxes $ 78,220,980 $ 78,220,980 $ 78,252,105 $ 31,125 Licenses and permits 4,777,950 4,777,950 6,045,153 1,267,203 Intergovernmental 9,049,232 9,049,232 9,561,395 512,163 Charges for services 5,124,555 5,124,555 5,773,564 649,009 Investment income 50,000 50,000 120,314 70,314 Interest and penalties 250,000 250,000 208,972 (41,028) Fines and costs 717,000 717,000 789,662 72,662 Other revenues 178,333 178,333 171,726 (6,607) Other financing sources:
Bond premiums - - 1,540,767 1,540,767 Transfers in 1,104,652 1,104,652 1,104,652 - Use of fund balance 1,573,500 2,223,500 2,223,500 -
Total Revenues and Other Sources 101,046,202 101,696,202 105,791,810 4,095,608
Expenditures and other uses:Current:
General government 5,817,817 5,843,027 5,714,936 128,091 Other general government 1,698,453 1,466,553 1,184,906 281,647 Public works 6,237,275 6,237,609 6,136,264 101,345 Community services 3,168,274 3,191,783 3,061,409 130,374 Regulatory services 1,342,284 1,377,411 1,375,123 2,288 Emergency management 11,837 11,837 11,010 827 Police department 9,617,688 9,617,688 9,518,936 98,752 Fire department 7,995,247 7,997,067 7,949,420 47,647 School department 43,236,310 43,382,210 43,382,021 189
Non-operating 21,921,017 22,571,017 22,208,507 362,510
Total Expenditures and Other Uses 101,046,202 101,696,202 100,542,532 1,153,670
Excess of revenues and other sources over expenditures and other uses $ - $ - $ 5,249,278 $ 5,249,278
The accompanying notes are an integral part of these financial statements.
Final Budget
Budgeted Amounts
CITY OF PORTSMOUTH, NEW HAMPSHIRE
GENERAL FUND
STATEMENT OF REVENUES AND OTHER SOURCES,AND EXPENDITURES AND OTHER USES - BUDGET AND ACTUAL
FOR THE YEAR ENDED JUNE 30, 2016
Variance With
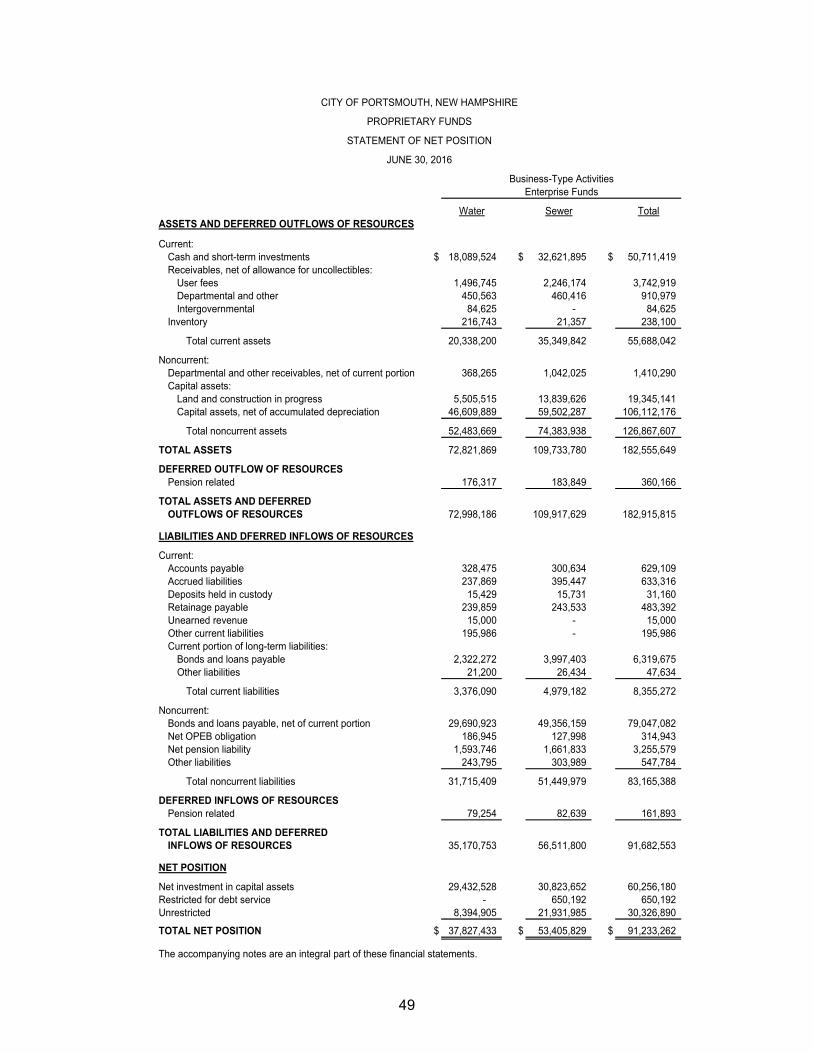
49
Business-Type ActivitiesEnterprise Funds
Water Sewer Total
Current:Cash and short-term investments $ 18,089,524 $ 32,621,895 $ 50,711,419 Receivables, net of allowance for uncollectibles:
User fees 1,496,745 2,246,174 3,742,919 Departmental and other 450,563 460,416 910,979 Intergovernmental 84,625 - 84,625
Inventory 216,743 21,357 238,100
Total current assets 20,338,200 35,349,842 55,688,042
Noncurrent:Departmental and other receivables, net of current portion 368,265 1,042,025 1,410,290 Capital assets:
Land and construction in progress 5,505,515 13,839,626 19,345,141 Capital assets, net of accumulated depreciation 46,609,889 59,502,287 106,112,176
Total noncurrent assets 52,483,669 74,383,938 126,867,607
72,821,869 109,733,780 182,555,649
Pension related 176,317 183,849 360,166
OUTFLOWS OF RESOURCES 72,998,186 109,917,629 182,915,815
Current:Accounts payable 328,475 300,634 629,109 Accrued liabilities 237,869 395,447 633,316 Deposits held in custody 15,429 15,731 31,160 Retainage payable 239,859 243,533 483,392 Unearned revenue 15,000 - 15,000 Other current liabilities 195,986 - 195,986 Current portion of long-term liabilities:
Bonds and loans payable 2,322,272 3,997,403 6,319,675 Other liabilities 21,200 26,434 47,634
Total current liabilities 3,376,090 4,979,182 8,355,272
Noncurrent:Bonds and loans payable, net of current portion 29,690,923 49,356,159 79,047,082 Net OPEB obligation 186,945 127,998 314,943 Net pension liability 1,593,746 1,661,833 3,255,579 Other liabilities 243,795 303,989 547,784
Total noncurrent liabilities 31,715,409 51,449,979 83,165,388
DEFERRED INFLOWS OF RESOURCESPension related 79,254 82,639 161,893
INFLOWS OF RESOURCES 35,170,753 56,511,800 91,682,553
Net investment in capital assets 29,432,528 30,823,652 60,256,180 Restricted for debt service - 650,192 650,192 Unrestricted 8,394,905 21,931,985 30,326,890
$ 37,827,433 $ 53,405,829 $ 91,233,262
The accompanying notes are an integral part of these financial statements.
CITY OF PORTSMOUTH, NEW HAMPSHIRE
PROPRIETARY FUNDS
STATEMENT OF NET POSITION
TOTAL NET POSITION
NET POSITION
ASSETS AND DEFERRED OUTFLOWS OF RESOURCES
LIABILITIES AND DFERRED INFLOWS OF RESOURCES
JUNE 30, 2016
TOTAL ASSETS
TOTAL LIABILITIES AND DEFERRED
DEFERRED OUTFLOW OF RESOURCES
TOTAL ASSETS AND DEFERRED
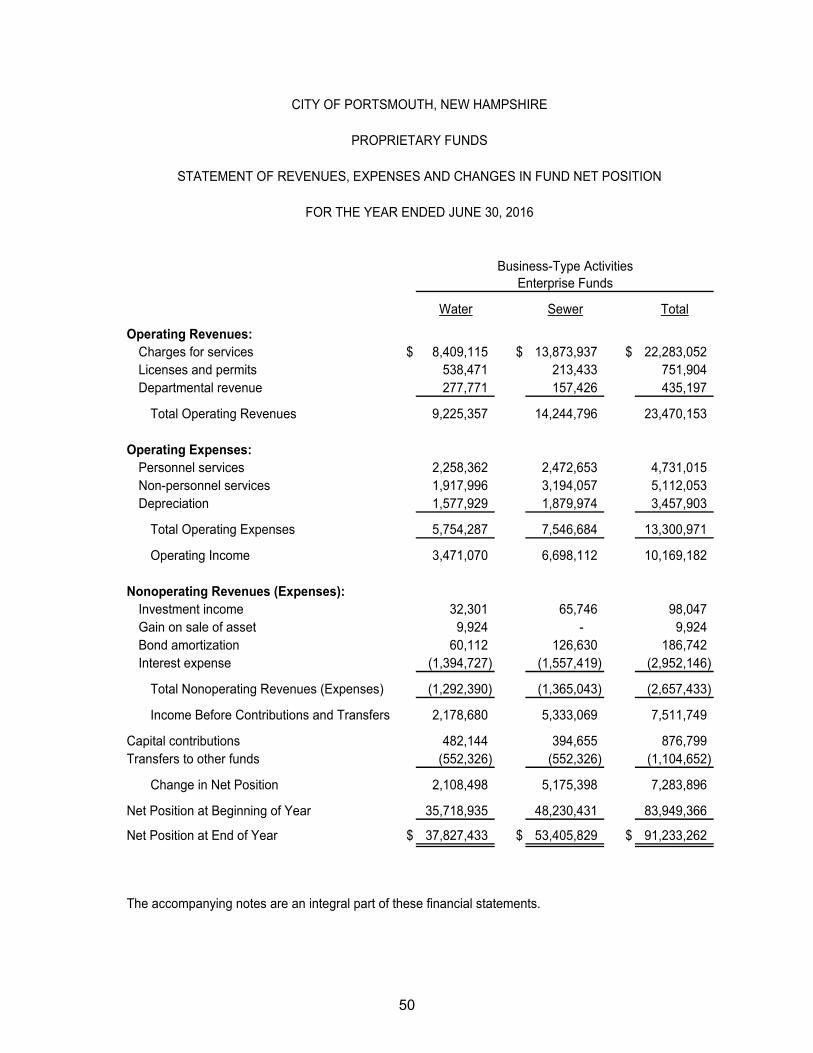
50
Water Sewer Total
Operating Revenues:Charges for services $ 8,409,115 $ 13,873,937 $ 22,283,052 Licenses and permits 538,471 213,433 751,904 Departmental revenue 277,771 157,426 435,197
Total Operating Revenues 9,225,357 14,244,796 23,470,153
Operating Expenses:Personnel services 2,258,362 2,472,653 4,731,015 Non-personnel services 1,917,996 3,194,057 5,112,053 Depreciation 1,577,929 1,879,974 3,457,903
Total Operating Expenses 5,754,287 7,546,684 13,300,971
Operating Income 3,471,070 6,698,112 10,169,182
Nonoperating Revenues (Expenses):Investment income 32,301 65,746 98,047 Gain on sale of asset 9,924 - 9,924 Bond amortization 60,112 126,630 186,742 Interest expense (1,394,727) (1,557,419) (2,952,146)
Total Nonoperating Revenues (Expenses) (1,292,390) (1,365,043) (2,657,433)
Income Before Contributions and Transfers 2,178,680 5,333,069 7,511,749
Capital contributions 482,144 394,655 876,799 Transfers to other funds (552,326) (552,326) (1,104,652)
Change in Net Position 2,108,498 5,175,398 7,283,896
Net Position at Beginning of Year 35,718,935 48,230,431 83,949,366
Net Position at End of Year $ 37,827,433 $ 53,405,829 $ 91,233,262
The accompanying notes are an integral part of these financial statements.
Business-Type ActivitiesEnterprise Funds
CITY OF PORTSMOUTH, NEW HAMPSHIRE
PROPRIETARY FUNDS
STATEMENT OF REVENUES, EXPENSES AND CHANGES IN FUND NET POSITION
FOR THE YEAR ENDED JUNE 30, 2016
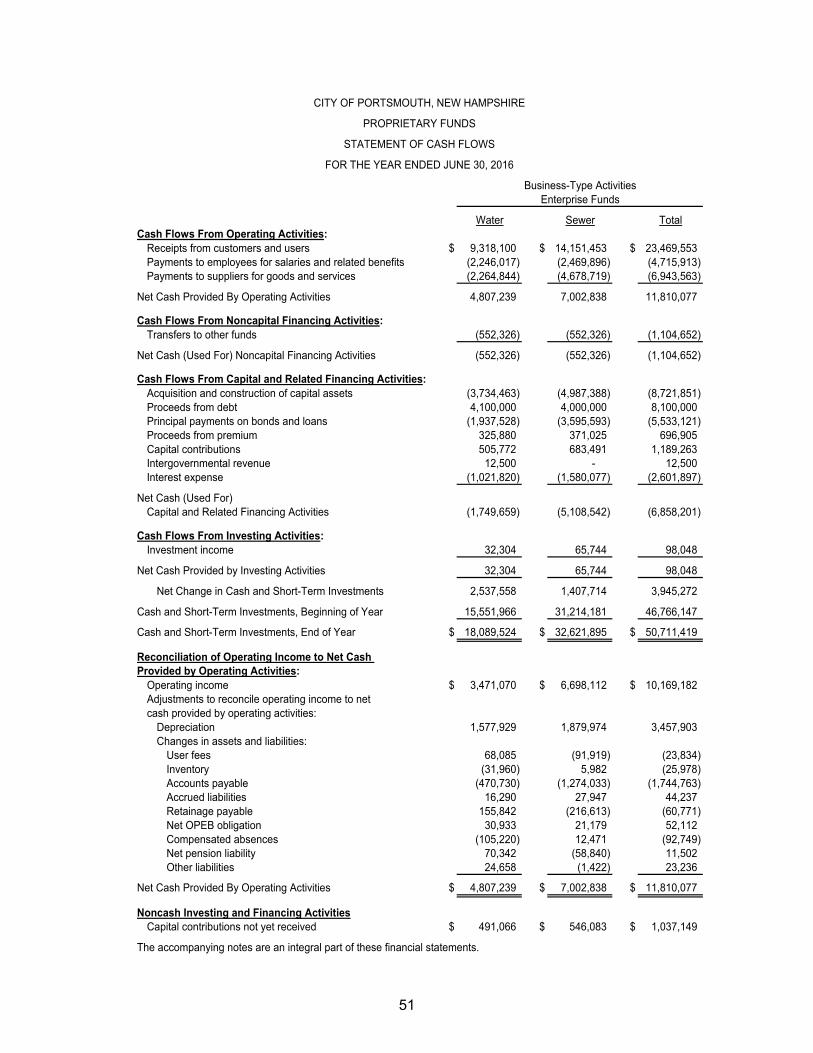
51
Water Sewer TotalCash Flows From Operating Activities:
Receipts from customers and users $ 9,318,100 $ 14,151,453 $ 23,469,553 Payments to employees for salaries and related benefits (2,246,017) (2,469,896) (4,715,913) Payments to suppliers for goods and services (2,264,844) (4,678,719) (6,943,563)
Net Cash Provided By Operating Activities 4,807,239 7,002,838 11,810,077
Cash Flows From Noncapital Financing Activities:Transfers to other funds (552,326) (552,326) (1,104,652)
Net Cash (Used For) Noncapital Financing Activities (552,326) (552,326) (1,104,652)
Cash Flows From Capital and Related Financing Activities:Acquisition and construction of capital assets (3,734,463) (4,987,388) (8,721,851) Proceeds from debt 4,100,000 4,000,000 8,100,000 Principal payments on bonds and loans (1,937,528) (3,595,593) (5,533,121) Proceeds from premium 325,880 371,025 696,905 Capital contributions 505,772 683,491 1,189,263 Intergovernmental revenue 12,500 - 12,500 Interest expense (1,021,820) (1,580,077) (2,601,897)
Net Cash (Used For) Capital and Related Financing Activities (1,749,659) (5,108,542) (6,858,201)
Cash Flows From Investing Activities:Investment income 32,304 65,744 98,048
Net Cash Provided by Investing Activities 32,304 65,744 98,048
Net Change in Cash and Short-Term Investments 2,537,558 1,407,714 3,945,272
Cash and Short-Term Investments, Beginning of Year 15,551,966 31,214,181 46,766,147
Cash and Short-Term Investments, End of Year $ 18,089,524 $ 32,621,895 $ 50,711,419
Reconciliation of Operating Income to Net Cash Provided by Operating Activities:
Operating income $ 3,471,070 $ 6,698,112 $ 10,169,182 Adjustments to reconcile operating income to netcash provided by operating activities:
Depreciation 1,577,929 1,879,974 3,457,903 Changes in assets and liabilities:
User fees 68,085 (91,919) (23,834) Inventory (31,960) 5,982 (25,978) Accounts payable (470,730) (1,274,033) (1,744,763) Accrued liabilities 16,290 27,947 44,237 Retainage payable 155,842 (216,613) (60,771) Net OPEB obligation 30,933 21,179 52,112 Compensated absences (105,220) 12,471 (92,749) Net pension liability 70,342 (58,840) 11,502 Other liabilities 24,658 (1,422) 23,236
Net Cash Provided By Operating Activities $ 4,807,239 $ 7,002,838 $ 11,810,077
Noncash Investing and Financing ActivitiesCapital contributions not yet received $ 491,066 $ 546,083 $ 1,037,149
The accompanying notes are an integral part of these financial statements.
Business-Type ActivitiesEnterprise Funds
CITY OF PORTSMOUTH, NEW HAMPSHIRE
PROPRIETARY FUNDS
STATEMENT OF CASH FLOWS
FOR THE YEAR ENDED JUNE 30, 2016
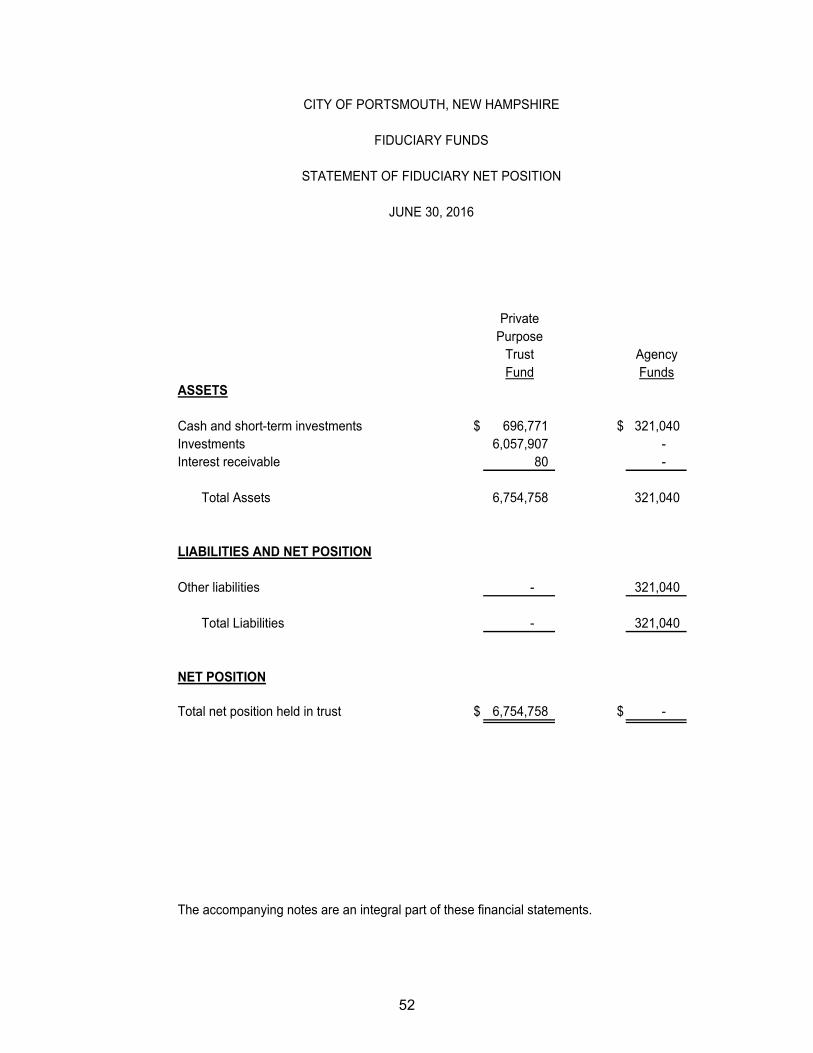
52
PrivatePurpose
Trust AgencyFund Funds
Cash and short-term investments $ 696,771 $ 321,040 Investments 6,057,907 - Interest receivable 80 -
Total Assets 6,754,758 321,040
Other liabilities - 321,040
Total Liabilities - 321,040
NET POSITION
Total net position held in trust $ 6,754,758 $ -
The accompanying notes are an integral part of these financial statements.
ASSETS
LIABILITIES AND NET POSITION
CITY OF PORTSMOUTH, NEW HAMPSHIRE
FIDUCIARY FUNDS
STATEMENT OF FIDUCIARY NET POSITION
JUNE 30, 2016
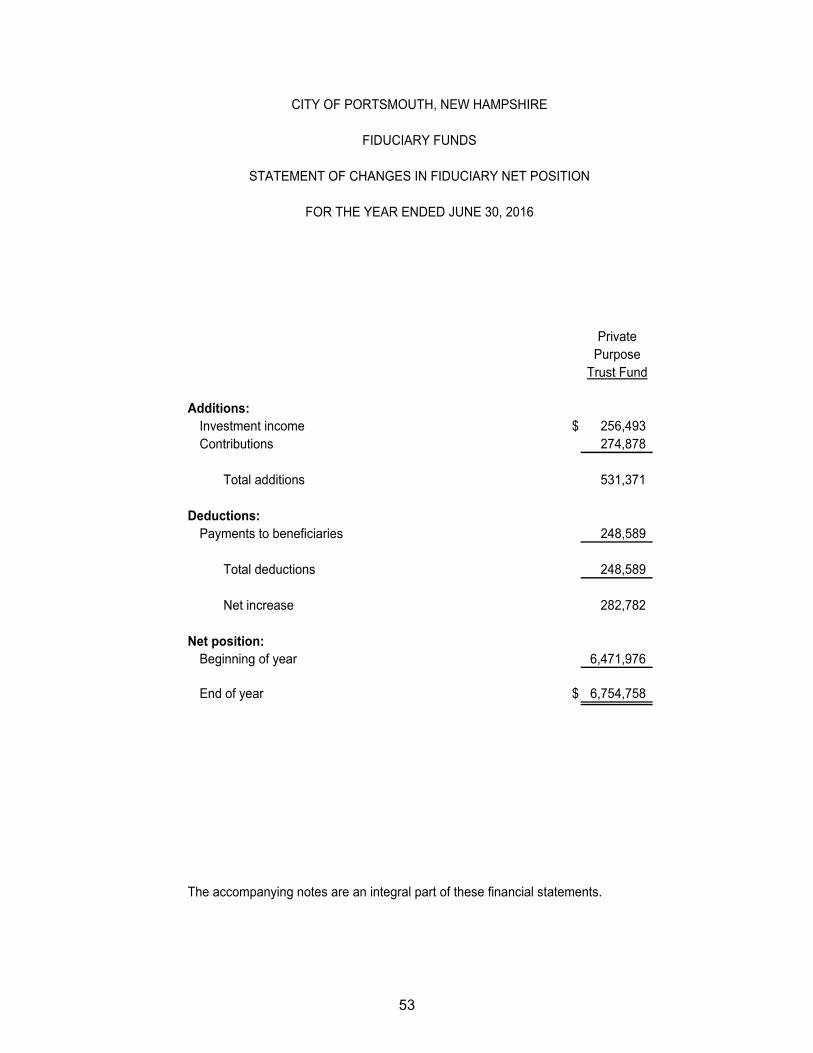
53
PrivatePurpose
Trust Fund
Additions:Investment income $ 256,493 Contributions 274,878
Total additions 531,371
Deductions:Payments to beneficiaries 248,589
Total deductions 248,589
Net increase 282,782
Net position:Beginning of year 6,471,976
End of year $ 6,754,758
The accompanying notes are an integral part of these financial statements.
CITY OF PORTSMOUTH, NEW HAMPSHIRE
FIDUCIARY FUNDS
STATEMENT OF CHANGES IN FIDUCIARY NET POSITION
FOR THE YEAR ENDED JUNE 30, 2016

54
(This page intentionally left blank.)
55
CITY OF PORTSMOUTH, NEW HAMPSHIRE
Notes to Financial Statements
1. Summary of Significant Accounting Policies
The accounting policies of the City of Portsmouth, New Hampshire (the City) conform to generally accepted accounting principles (GAAP) as applicable to governmental units. The following is a summary of the more significant policies:
A. Reporting Entity
The government is a municipal corporation governed by an elected City Council, including a Mayor, eight members, and an appointed City Manager. As required by generally accepted accounting principles, these financial statements present the government and applicable component units for which the government is considered to be financially accountable. In fiscal year 2016, it was determined that no entities met the required GASB 14 (as amended) criteria of component units.
B. Government-wide and Fund Financial Statements
Government-wide Financial Statements The government-wide financial statements (i.e., the Statement of Net Position and the Statement of Changes in Net Position) report information on all of the nonfiduciary activities of the primary government. For the most part, the effect of interfund activity has been removed from these statements. However, internal eliminations do not include services pro-vided to city departments. Governmental activities, which normally are supported by taxes and intergovernmental revenues, are reported sepa-rately from business-type activities, which rely to a significant extent on fees and charges for support. The Statement of Activities demonstrates the degree to which the direct expenses of a given function or segment are offset by program revenues. Direct expenses are those that are clearly identifiable with a specific func-tion or segment. Program revenues include (1) charges to customers or applicants who purchase, use, or directly benefit from goods, services, or privileges provided by a given function or segment and (2) grants and con-tributions that are restricted to meeting the operational or capital require-ments of a particular function or segment. Taxes and other items not properly included among program revenues are reported instead as general revenues.
56
Fund Financial Statements Separate financial statements are provided for governmental funds, pro-prietary funds and fiduciary funds, even though the latter are excluded from the government-wide financial statements. Major individual governmental funds and major individual enterprise funds are reported as separate columns in the fund financial statements.
C. Measurement Focus, Basis of Accounting, and Financial Statement Presentation
Government-wide Financial Statements The government-wide financial statements are reported using the eco-nomic resources measurement focus and the accrual basis of accounting, as is the proprietary fund and fiduciary fund financial statements. Reve-nues are recorded when earned and expenses are recorded when a lia-bility is incurred, regardless of the timing of related cash flows. Property taxes are recognized as revenues in the year for which they are levied. Grants and similar items are recognized as revenue as soon as all eligi-bility requirements imposed by the provider have been met. As a general rule, the effect of interfund activity has been eliminated from the govern-ment-wide financial statements. Amounts reported as program revenues include (1) charges to customers or applicants for goods, services, or privileges provided, (2) operating grants and contributions, and (3) capital grants and contributions, includ-ing special assessments. Internally dedicated resources are reported as general revenues rather than as program revenues. Likewise, general revenues include all taxes. Fund Financial Statements Governmental fund financial statements are reported using the current financial resources measurement focus and the modified accrual basis of accounting. Revenues are recognized as soon as they are both measur-able and available. Revenues are considered to be available when they are collectible within the current period or soon enough thereafter to pay liabil-ities of the current period. For this purpose, the government considers property tax revenues and loans to be available if they are collected within 60 days of the end of the current fiscal period. Expenditures generally are recorded when a liability is incurred, as under accrual accounting. However, debt service expenditures, as well as expenditures related to compensated absences and claims and judgments, are recorded only when payment is due. The government reports the following major governmental funds:
The General Fund is the government’s primary operating fund. It accounts for all financial resources of the general government, except those required to be accounted for in another fund.
57
The Building and Infrastructure Fund is used to account for building and infrastructure improvements.
Proprietary funds distinguish operating revenues and expenses from non-operating items. Operating revenues and expenses generally result from providing services and producing and delivering goods in connection with a proprietary fund’s principal ongoing operations. The principal operating revenues of the enterprise fund are charges to customers for sales and services. Operating expenses for enterprise funds include the cost of sales and services, administrative expenses and depreciation on capital assets. All revenues and expenses not meeting this definition are reported as nonoperating revenues and expenses. The government reports the following major proprietary funds:
Water Enterprise Fund is used to account for the operation of a water treatment plant, City Wells and water system.
Sewer Enterprise Fund is used to account for the operations of two sewer treatment plants, pumping stations and sewer lines.
Fiduciary Funds employ the same economic resources measurement focus and accrual basis of accounting as do proprietary funds. Agency Funds, however, only report assets and liabilities, and thus have no measurement focus. The government also reports the following fiduciary funds:
The Private-Purpose Trust Funds are used to account for trust arrangements, under which principal and investment income exclusively benefits individuals, private organizations, or other governments. Private Purpose Trust Funds held by the City include trust arrangements for the Parks, Scholarships, Worthy Poor, Memorials, and Commemorations.
Agency Funds account for fiduciary assets held by the City in a custodial capacity as an agent on behalf of others. Agency Funds held by the City include the Claremont Coalition Fund, Art Speak Fund, and School Fund.
D. Cash and Investments
Cash balances from all funds, except those required to be segregated by law, are combined to form a consolidation of cash. Each of those funds’ portions of consolidated cash is displayed on its respective balance sheet as “cash and short-term investments”. Cash balances are invested to the extent available, and interest earnings are recognized in the appropriate funds. Cash and short-term investments are separately held and reflected in proprietary, permanent, fiduciary, and certain special revenue funds.
58
Under New Hampshire RSA 48:16, whenever the city treasurer has in cus-tody an excess of funds which are not immediately needed for the purpose of expenditure, the city treasurer shall invest the same in accordance with the investment policy adopted by the mayor and board of aldermen or city council under RSA 47:6, II. The treasurer may invest in participation units in the public deposit investment pool established pursuant to RSA 383:22, in deposits, including money market accounts or certificates of deposit, of federally insured banks chartered under the laws of New Hampshire or the federal government with a branch within the state, or in obligations fully guaranteed as to principal and interest by the United States government. The obligations may be held directly or in the form of securities of or other interests in any open-end or closed-end management-type investment company or investment trust registered under 15 U. S. C. Section 80a-1 et seq., if the portfolio of the investment company or investment trust is limited to such obligations and repurchase agreements fully collateralized by such obligations. For purpose of the statement of cash flows, the proprietary funds consider investments with original maturities of three months or less to be short-term investments. Investments are considered holdings of greater than three months and are carried at fair value.
E. Interfund Receivables and Payables
Transactions between funds that are representative of lending/borrowing arrangements outstanding at the end of the fiscal year are referred to as either “due from/to other funds” (i.e., the current portion of interfund loans) or “advances to/from other funds” (i.e., the non-current portion of interfund loans). Advances between funds are offset by a fund balance reserve account in applicable governmental funds to indicate the portion not available for appropriation and not available as expendable financial resources. Any residual balances outstanding between the governmental activities and business-type activities are reported in the government-wide financial statements as “internal balances”. The government-wide Statement of Activities eliminates transfers as reported within the segregated governmental and business-type activities columns. Only transfers between the two columns appear in this statement.
F. Inventories
Inventories are valued at cost using the first-in/first-out (FIFO) method for business-type activities. The costs of governmental fund-type inventories
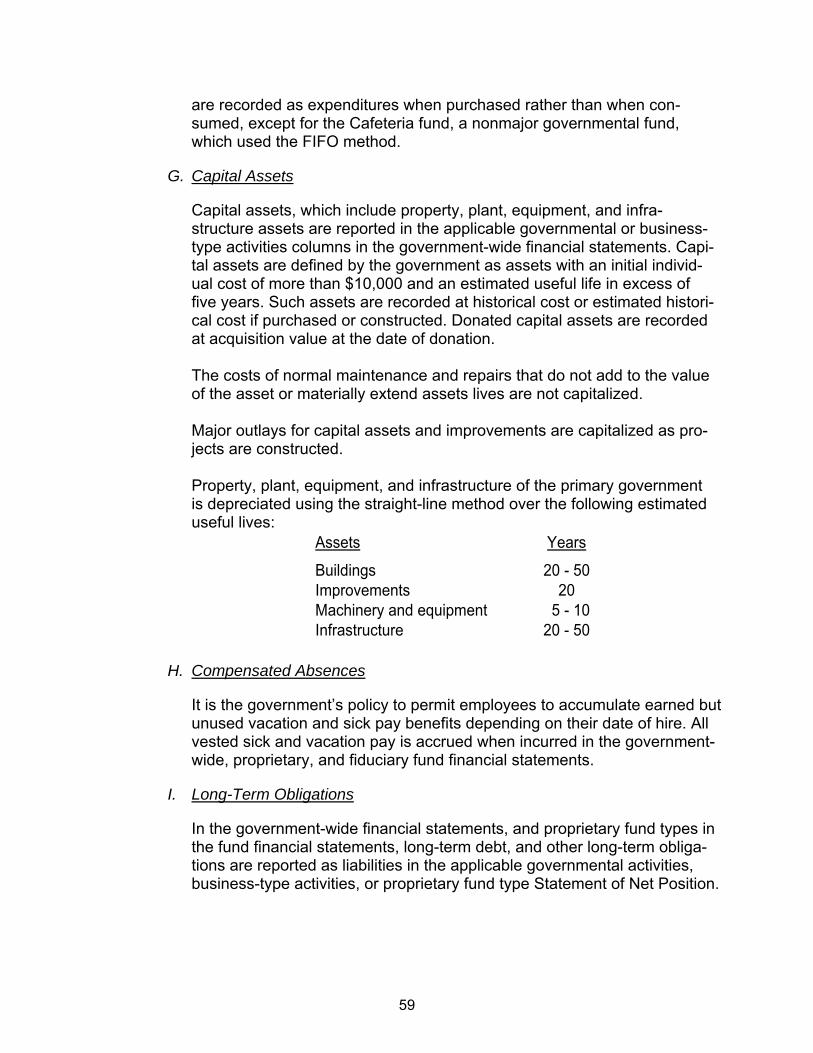
59
are recorded as expenditures when purchased rather than when con-sumed, except for the Cafeteria fund, a nonmajor governmental fund, which used the FIFO method.
G. Capital Assets
Capital assets, which include property, plant, equipment, and infra-structure assets are reported in the applicable governmental or business-type activities columns in the government-wide financial statements. Capi-tal assets are defined by the government as assets with an initial individ-ual cost of more than $10,000 and an estimated useful life in excess of five years. Such assets are recorded at historical cost or estimated histori-cal cost if purchased or constructed. Donated capital assets are recorded at acquisition value at the date of donation. The costs of normal maintenance and repairs that do not add to the value of the asset or materially extend assets lives are not capitalized. Major outlays for capital assets and improvements are capitalized as pro-jects are constructed. Property, plant, equipment, and infrastructure of the primary government is depreciated using the straight-line method over the following estimated useful lives:
Assets Years
Buildings 20 - 50Improvements 20Machinery and equipment 5 - 10Infrastructure 20 - 50
H. Compensated Absences
It is the government’s policy to permit employees to accumulate earned but unused vacation and sick pay benefits depending on their date of hire. All vested sick and vacation pay is accrued when incurred in the government-wide, proprietary, and fiduciary fund financial statements.
I. Long-Term Obligations
In the government-wide financial statements, and proprietary fund types in the fund financial statements, long-term debt, and other long-term obliga-tions are reported as liabilities in the applicable governmental activities, business-type activities, or proprietary fund type Statement of Net Position.

60
J. Fund Equity
Fund equity at the governmental fund financial reporting level is classified as “fund balance”. Fund equity for all other reporting is classified as “net position”.
Fund Balance - Generally, fund balance represents the difference between the current assets and current liabilities. The City reserves those portions of fund balance that are legally segregated for a specific future use or which do not represent available, spendable resources and therefore, are not available for appropriation or expenditure. Unassigned fund balance indicates that portion of fund balance that is available for appropriation in future periods. The City’s fund balance classification policies and procedures are as follows: 1) Nonspendable funds are either unspendable in the current form
(i.e., inventory) or can never be spent (i.e., nonspendable balances of permanent funds) because they are legally or contractually required to be maintained intact.
2) Restricted funds are used solely for the purpose in which the fund was established. They represent amounts that are restricted to specific purposes by constraints imposed by creditors, grantors, contributors, or laws or regulations of other governments, or con-straints imposed by law through constitutional provisions or ena-bling legislation. In the case of special revenue funds, these funds are created by statute or otherwise have external constraints on how the funds can be expended. In case of capital project funds, these funds are financed by issuance of bonds or transfers from General Fund authorized by City Council for specific projects. In the case of permanent funds, these funds represent the income portion of permanent trust funds.
3) Committed funds are reported and expended as a result of annual resolutions passed by the City Council, the highest decision making authority in the government. Subsequent City Council meeting is necessary to modify or rescind a fund balance commitment.
4) Assigned funds are used for specific purposes as established by management. These funds, which include general fund encum-brances, have been assigned for specific goods and services ordered but not yet paid for. The funds have been established by various City departments for the expenditure of current year budge-tary financial resources upon vendor performance in the subse-quent budgetary period. The City’s Charter authorizes the City Manager to approve assignments established by departments.

61
5) Unassigned funds represent the residual classification for the general fund and include all amounts not contained in the other classifications. Unassigned amounts are available for any purpose. Temporary fund balance deficits are reported as negative amounts in the unassigned classification in other governmental funds. Posi-tive unassigned amounts are reported only in the general fund.
When an expenditure is incurred that would qualify for payment from multi-ple fund balance types, the City uses the following order to liquidate liabili-ties: restricted, committed, assigned and unassigned. Net Position - Net position represents the difference between assets/ deferred outflows and liabilities/deferred inflows. Net investment in capital assets, consist of capital assets, net of accumulated depreciation, reduced by the outstanding balances of any borrowing used for the acquisition, construction or improvement of those assets. Net position is reported as restricted when there are limitations imposed on their use either through the enabling legislation adopted by the City or through external restrictions imposed by creditors, grantors, or laws or regulations of other govern-ments. All other net position is reported as unrestricted.
K. Use of Estimates
The preparation of basic financial statements in conformity with generally accepted accounting principles requires management to make estimates and assumptions that affect the reported amounts of assets and liabilities and disclosures for contingent assets and liabilities at the date of the basic financial statements, and the reported amounts of the revenues and expenditures/expenses during the fiscal year. Actual results could vary from estimates that were used.
L. Mandated Fund Balance
In August, 1997 (revised for GASB 54 terminology in fiscal year 2012), the City Council adopted ordinances Chapter I, Sections 1:1401 and 1:1402 that mandates the City’s Unassigned Fund Balance be maintained (amended in fiscal year 2013) between 10% and 17% of total current year appropriations. Specific City Council ordinances are as follows: Section 1:1401 - Mandated Fund Balance The General Fund Balance of the City, at the end of any fiscal year as recorded in accordance with generally accepted accounting principles (GAAP) and excluding any and all reserves, and any dedicated fund bal-ances of the General Fund (otherwise referred to as Unassigned Fund balance of the General Fund) shall be maintained at the prescribed
62
amount of not less than 10% of the actual Total General Fund appropria-tions for that fiscal year. Section 1:1402 - Operational Objective Notwithstanding the provision of Section 1:1401, it is recognized that the financial management goal of the City of Portsmouth is to annually main-tain an Unassigned Fund Balance between 10% and 17% of total actual General Fund appropriations.
2. Stewardship, Compliance, and Accountability
A. Budgetary Information
An annual appropriated budget is adopted for the City’s general fund. In January, the City Manager issues a directive requesting line-item budget proposals from each department. In accordance with the City ordinance, the departments must submit their budget to the City Manager no later than March 15. The City Manager schedules individual department reviews with supervisors. In accordance with the City Charter, the City Manager’s recommendations must be submitted to the City Council no later than 45 days prior to the first day of the fiscal year (May 15). The City Council, through the City Manager, schedules public work-sessions with the individual departments. The City Council then calls a public hearing to review budget requirements with the general public. After due consideration to the public, the Council makes a final decision. A resolution is required for acceptance for the final budget by a majority vote. Departments are legally limited to their total budget as voted. The final budget and resolution are then presented to the Department of Revenue Administration for their review and approval of the tax rate. Cer-tain limitations set by state statute must be adhered to before the rate is established. Any changes in the budget after the tax rate is set must be made within the revenues and reserves estimated as available by the City Manager and must be approved by an affirmative vote of a two-thirds majority of the City Council. After the budget has been adopted, no expenditure may be incurred, except pursuant to a budget appropriation unless there is a specific additional appropriation thereof. The head of any department, with the approval of the manager, may transfer any unencumbered balance or any portion thereof from one fund or agency within his/her department to another fund or agency within his/her department. The City Charter estab-lished that the legal level of control is at the department level.
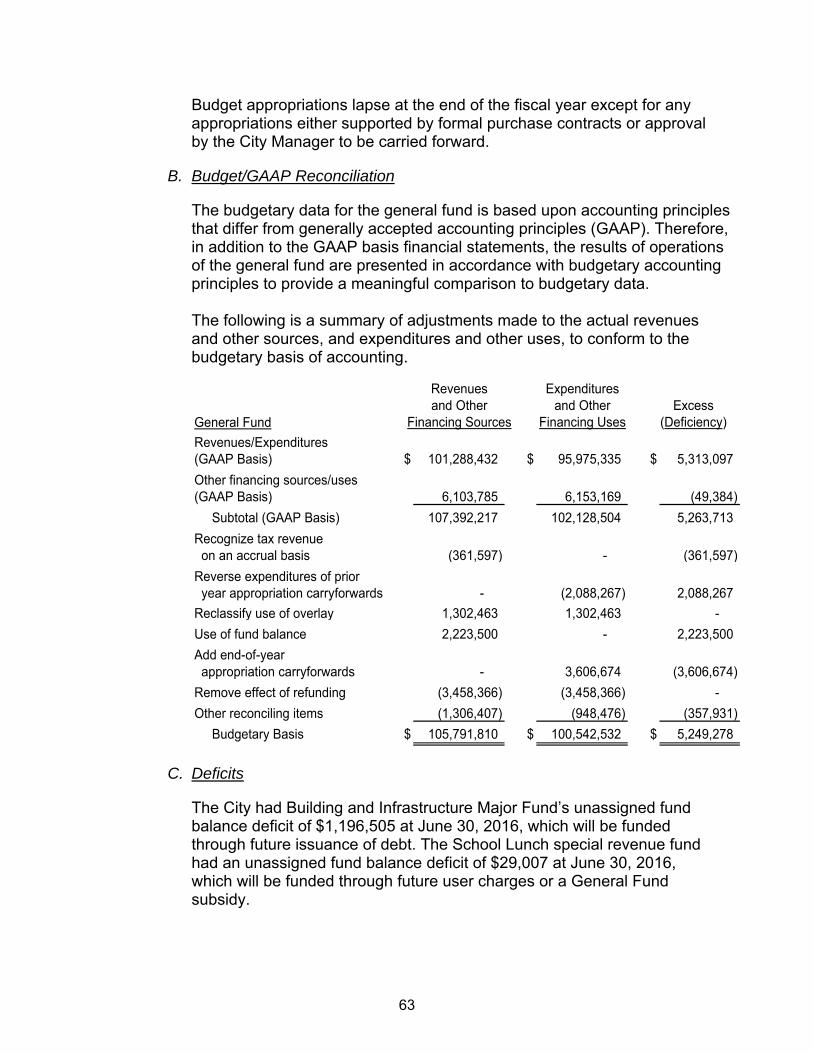
63
Budget appropriations lapse at the end of the fiscal year except for any appropriations either supported by formal purchase contracts or approval by the City Manager to be carried forward.
B. Budget/GAAP Reconciliation
The budgetary data for the general fund is based upon accounting principles that differ from generally accepted accounting principles (GAAP). Therefore, in addition to the GAAP basis financial statements, the results of operations of the general fund are presented in accordance with budgetary accounting principles to provide a meaningful comparison to budgetary data. The following is a summary of adjustments made to the actual revenues and other sources, and expenditures and other uses, to conform to the budgetary basis of accounting.
General Fund
Revenues/Expenditures(GAAP Basis) $ 101,288,432 $ 95,975,335 $ 5,313,097
Other financing sources/uses(GAAP Basis) 6,103,785 6,153,169 (49,384)
Subtotal (GAAP Basis) 107,392,217 102,128,504 5,263,713
Recognize tax revenue on an accrual basis (361,597) - (361,597)
Reverse expenditures of prior year appropriation carryforwards - (2,088,267) 2,088,267
Reclassify use of overlay 1,302,463 1,302,463 -
Use of fund balance 2,223,500 - 2,223,500 Add end-of-year appropriation carryforwards - 3,606,674 (3,606,674)
Remove effect of refunding (3,458,366) (3,458,366) -
Other reconciling items (1,306,407) (948,476) (357,931)
Budgetary Basis $ 105,791,810 $ 100,542,532 $ 5,249,278
Financing Sources Financing Uses (Deficiency)
Revenues Expendituresand Other and Other Excess
C. Deficits
The City had Building and Infrastructure Major Fund’s unassigned fund balance deficit of $1,196,505 at June 30, 2016, which will be funded through future issuance of debt. The School Lunch special revenue fund had an unassigned fund balance deficit of $29,007 at June 30, 2016, which will be funded through future user charges or a General Fund subsidy.
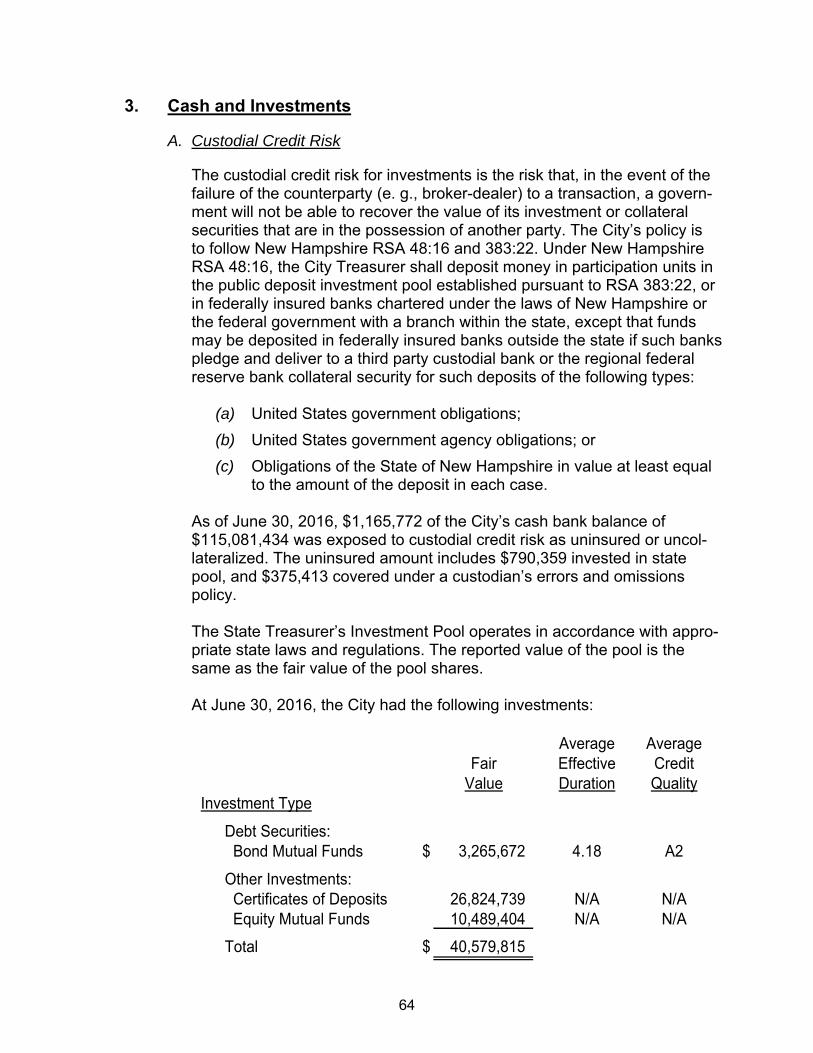
64
3. Cash and Investments
A. Custodial Credit Risk
The custodial credit risk for investments is the risk that, in the event of the failure of the counterparty (e. g., broker-dealer) to a transaction, a govern-ment will not be able to recover the value of its investment or collateral securities that are in the possession of another party. The City’s policy is to follow New Hampshire RSA 48:16 and 383:22. Under New Hampshire RSA 48:16, the City Treasurer shall deposit money in participation units in the public deposit investment pool established pursuant to RSA 383:22, or in federally insured banks chartered under the laws of New Hampshire or the federal government with a branch within the state, except that funds may be deposited in federally insured banks outside the state if such banks pledge and deliver to a third party custodial bank or the regional federal reserve bank collateral security for such deposits of the following types:
(a) United States government obligations;
(b) United States government agency obligations; or
(c) Obligations of the State of New Hampshire in value at least equal to the amount of the deposit in each case.
As of June 30, 2016, $1,165,772 of the City’s cash bank balance of $115,081,434 was exposed to custodial credit risk as uninsured or uncol-lateralized. The uninsured amount includes $790,359 invested in state pool, and $375,413 covered under a custodian’s errors and omissions policy. The State Treasurer’s Investment Pool operates in accordance with appro-priate state laws and regulations. The reported value of the pool is the same as the fair value of the pool shares. At June 30, 2016, the City had the following investments:
Average AverageFair Effective Credit
Value Duration QualityInvestment Type
Debt Securities: Bond Mutual Funds $ 3,265,672 4.18 A2
Other Investments: Certificates of Deposits 26,824,739 N/A N/A Equity Mutual Funds 10,489,404 N/A N/A
Total $ 40,579,815

65
The City’s investments are exposed to custodial credit risk because the related securities are uninsured, unregistered and held by the City’s brokerage firm, which is also the counterparty to these securities. This risk is managed by the custodian’s errors and omissions policy and securities are held in a separately identifiable trust accounts.
B. Credit Risk
Generally, credit risk is the risk that an issuer of an investment will not fulfill its obligation to the holder of the investment. State law employs the prudent person rule whereby investments are made as a prudent person would be expected to act, with discretion and intelligence, to seek reasonable income, preserve capital, and, in general, avoid speculative investments. Under New Hampshire RSA 31:27, the city trustees of trust funds may establish, maintain and operate one or more common trust funds, in which may be combined money and property belonging to the various trusts in their care, for the purpose of facilitating investments, providing diversifi-cation and obtaining reasonable income; provided however, that said common trust funds shall be limited to the investments authorized in RSA 31:25; provided further, that not more than $10,000, or more than 10 percent of the fund whichever is greater of any City or city common trust funds shall be invested under RSA 31:25 in the obligations of any one corporation or organization, excepting deposits in any federally or state-chartered bank or association authorized to engage in a banking business in this state, in credit unions in this state, or in obligations of the United States and of the State of New Hampshire and its subdivisions; or in participation units in the public deposit investment pool established pur-suant to RSA 383:22, or in shares of open-ended mutual funds selected by the trustees for investment under RSA 31:25. The trustees are also required to report annually to the State attorney general any securities retained under the provisions of the statute.
C. Concentration of Credit Risk
The trustees of trust fund policy on the concentration of credit risk is to limit the amount that may be invested in any one issue to $15,000 or 10% of the value of the account whichever is greater. The City does not have a formal policy on the concentration of credit risk. The City had the following investments in a single issuer which are greater than 5% of total investments: Citizens Bank Certificate of Deposit $15,015,269 Century Bank Certificate of Deposit $10,037,049 Vanguard High Dividend Yield ETF $ 4,279,787 Vanguard Dividend Appreciation ETF $ 4,225,542
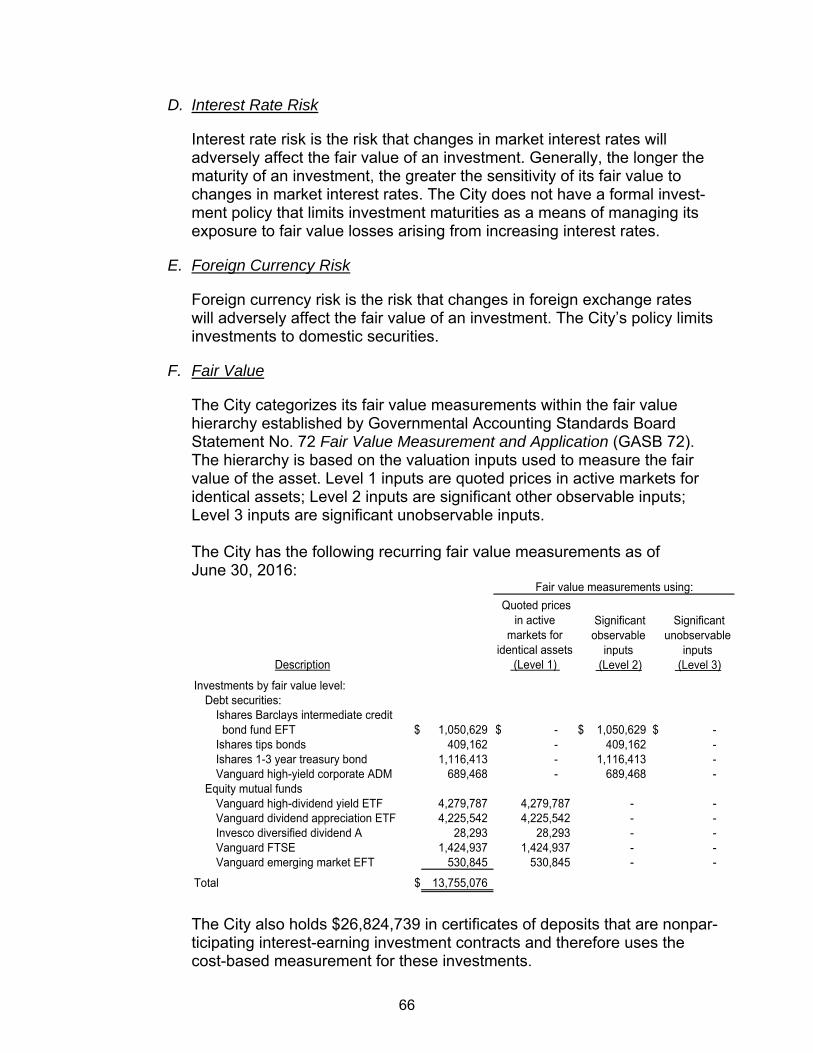
66
D. Interest Rate Risk
Interest rate risk is the risk that changes in market interest rates will adversely affect the fair value of an investment. Generally, the longer the maturity of an investment, the greater the sensitivity of its fair value to changes in market interest rates. The City does not have a formal invest-ment policy that limits investment maturities as a means of managing its exposure to fair value losses arising from increasing interest rates.
E. Foreign Currency Risk
Foreign currency risk is the risk that changes in foreign exchange rates will adversely affect the fair value of an investment. The City’s policy limits investments to domestic securities.
F. Fair Value
The City categorizes its fair value measurements within the fair value hierarchy established by Governmental Accounting Standards Board Statement No. 72 Fair Value Measurement and Application (GASB 72). The hierarchy is based on the valuation inputs used to measure the fair value of the asset. Level 1 inputs are quoted prices in active markets for identical assets; Level 2 inputs are significant other observable inputs; Level 3 inputs are significant unobservable inputs. The City has the following recurring fair value measurements as of June 30, 2016:
Significant observable
inputs
Significant unobservable
inputs (Level 2) (Level 3)
Investments by fair value level:Debt securities:
Ishares Barclays intermediate credit bond fund EFT $ 1,050,629 $ - $ 1,050,629 $ - Ishares tips bonds 409,162 - 409,162 - Ishares 1-3 year treasury bond 1,116,413 - 1,116,413 - Vanguard high-yield corporate ADM 689,468 - 689,468 -
Equity mutual fundsVanguard high-dividend yield ETF 4,279,787 4,279,787 - - Vanguard dividend appreciation ETF 4,225,542 4,225,542 - - Invesco diversified dividend A 28,293 28,293 - - Vanguard FTSE 1,424,937 1,424,937 - - Vanguard emerging market EFT 530,845 530,845 - -
Total $ 13,755,076
Fair value measurements using:
Quoted prices in active
markets for identical assets
(Level 1) Description
The City also holds $26,824,739 in certificates of deposits that are nonpar-ticipating interest-earning investment contracts and therefore uses the cost-based measurement for these investments.
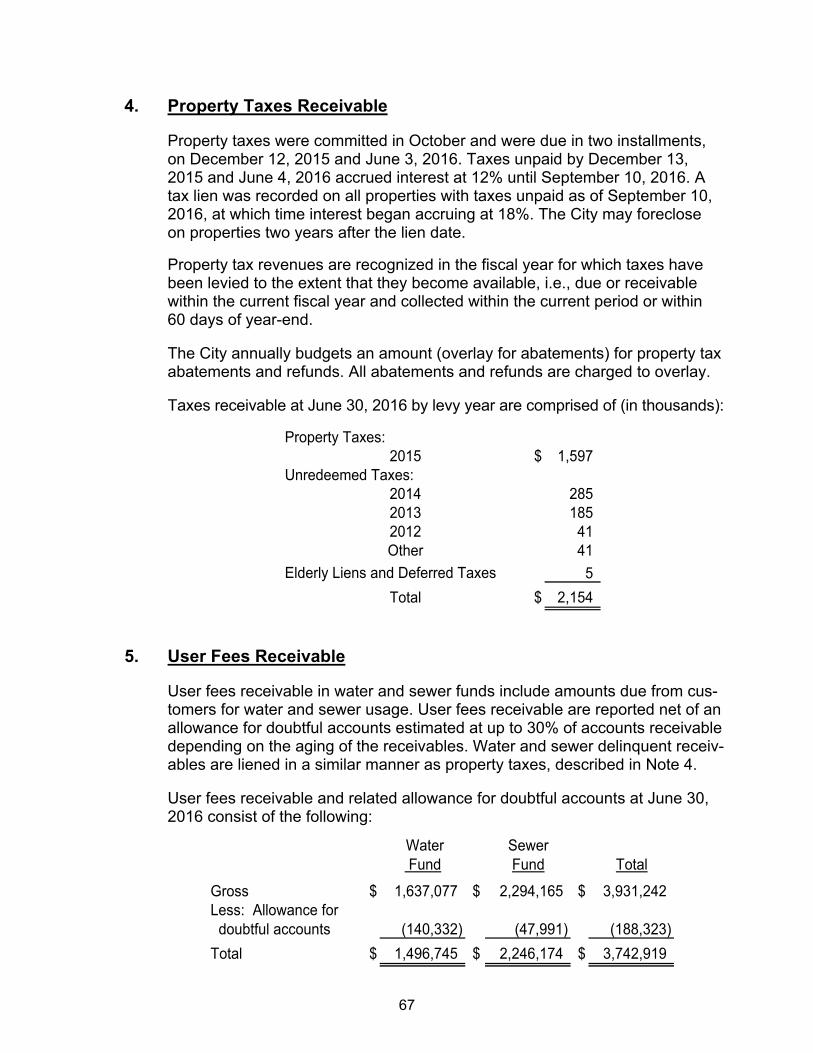
67
4. Property Taxes Receivable
Property taxes were committed in October and were due in two installments, on December 12, 2015 and June 3, 2016. Taxes unpaid by December 13, 2015 and June 4, 2016 accrued interest at 12% until September 10, 2016. A tax lien was recorded on all properties with taxes unpaid as of September 10, 2016, at which time interest began accruing at 18%. The City may foreclose on properties two years after the lien date.
Property tax revenues are recognized in the fiscal year for which taxes have been levied to the extent that they become available, i.e., due or receivable within the current fiscal year and collected within the current period or within 60 days of year-end. The City annually budgets an amount (overlay for abatements) for property tax abatements and refunds. All abatements and refunds are charged to overlay. Taxes receivable at June 30, 2016 by levy year are comprised of (in thousands):
Property Taxes:2015 $ 1,597
Unredeemed Taxes:2014 285 2013 185 2012 41 Other 41
5
Total $ 2,154
Elderly Liens and Deferred Taxes
5. User Fees Receivable
User fees receivable in water and sewer funds include amounts due from cus-tomers for water and sewer usage. User fees receivable are reported net of an allowance for doubtful accounts estimated at up to 30% of accounts receivable depending on the aging of the receivables. Water and sewer delinquent receiv-ables are liened in a similar manner as property taxes, described in Note 4. User fees receivable and related allowance for doubtful accounts at June 30, 2016 consist of the following:
Water Sewer Fund Fund Total
Gross $ 1,637,077 $ 2,294,165 $ 3,931,242 Less: Allowance for doubtful accounts (140,332) (47,991) (188,323)
Total $ 1,496,745 $ 2,246,174 $ 3,742,919
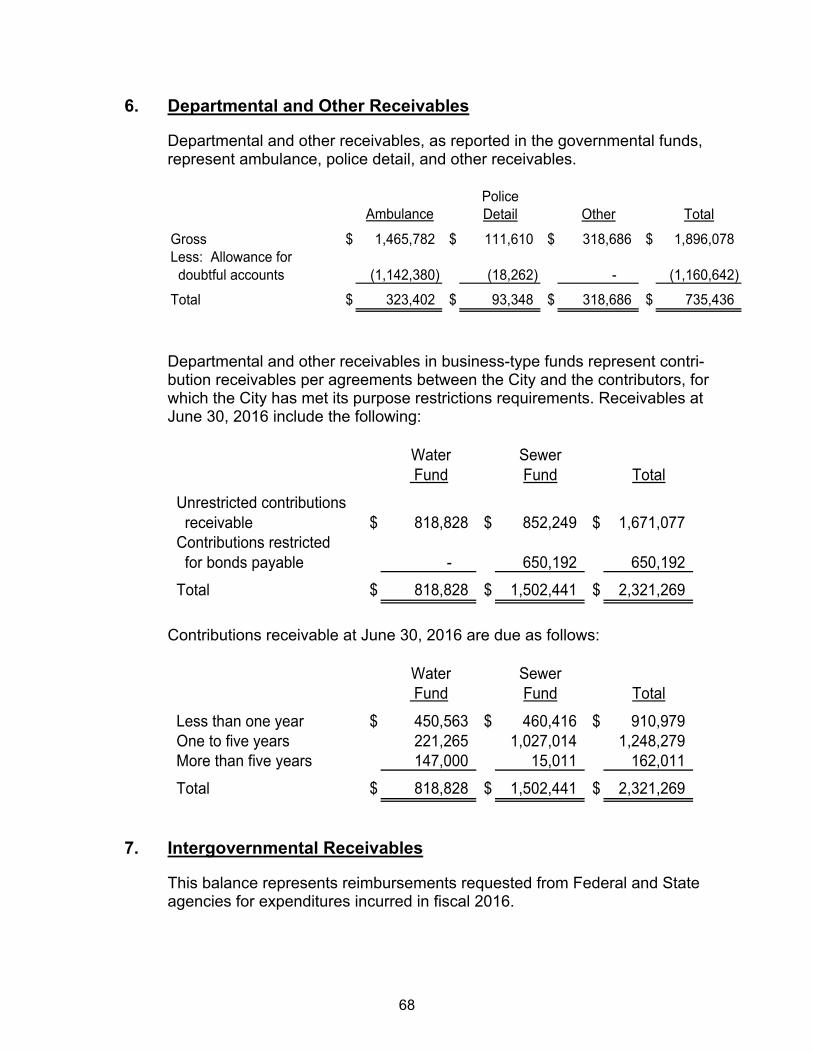
68
6. Departmental and Other Receivables
Departmental and other receivables, as reported in the governmental funds, represent ambulance, police detail, and other receivables.
PoliceDetail Other Total
Gross $ 1,465,782 $ 111,610 $ 318,686 $ 1,896,078 Less: Allowance for doubtful accounts (1,142,380) (18,262) - (1,160,642)
Total $ 323,402 $ 93,348 $ 318,686 $ 735,436
Ambulance
Departmental and other receivables in business-type funds represent contri-bution receivables per agreements between the City and the contributors, for which the City has met its purpose restrictions requirements. Receivables at June 30, 2016 include the following:
Water Sewer Fund Fund Total
Unrestricted contributions receivable $ 818,828 $ 852,249 $ 1,671,077 Contributions restricted for bonds payable - 650,192 650,192
Total $ 818,828 $ 1,502,441 $ 2,321,269
Contributions receivable at June 30, 2016 are due as follows:
Water Sewer Fund Fund Total
Less than one year $ 450,563 $ 460,416 $ 910,979 One to five years 221,265 1,027,014 1,248,279 More than five years 147,000 15,011 162,011
Total $ 818,828 $ 1,502,441 $ 2,321,269
7. Intergovernmental Receivables
This balance represents reimbursements requested from Federal and State agencies for expenditures incurred in fiscal 2016.
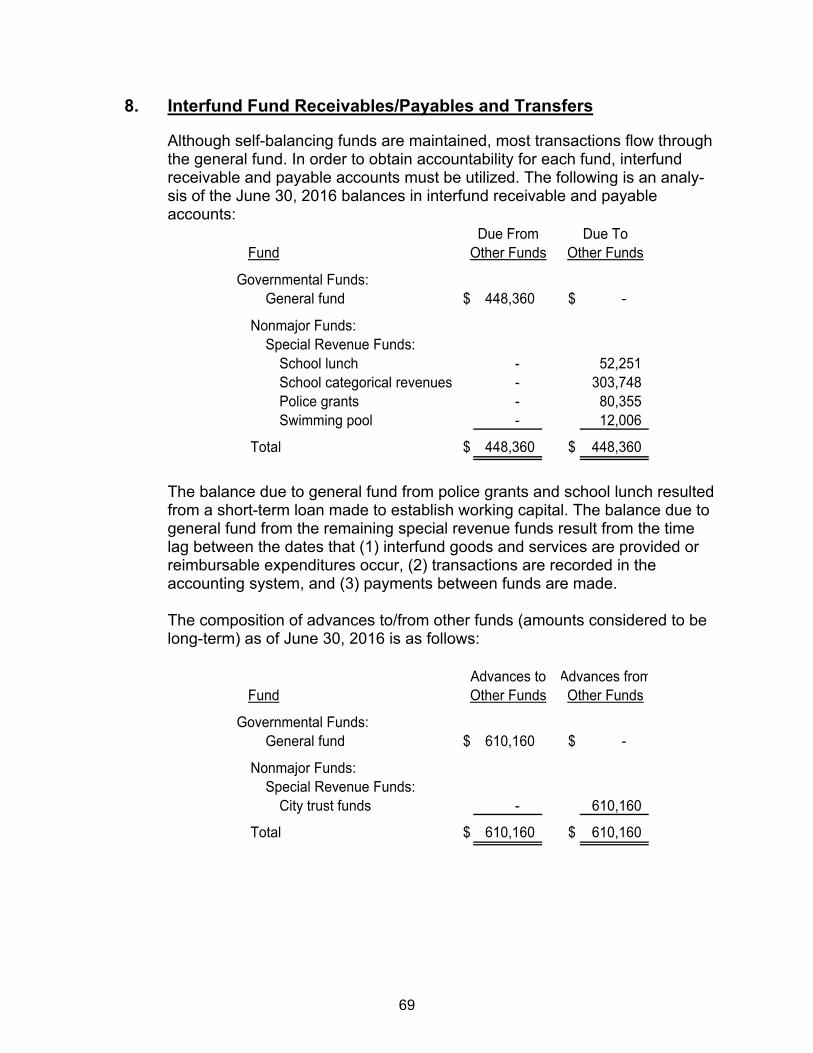
69
8. Interfund Fund Receivables/Payables and Transfers
Although self-balancing funds are maintained, most transactions flow through the general fund. In order to obtain accountability for each fund, interfund receivable and payable accounts must be utilized. The following is an analy-sis of the June 30, 2016 balances in interfund receivable and payable accounts:
Fund
Governmental Funds:General fund $ 448,360 $ -
Nonmajor Funds:Special Revenue Funds:
School lunch - 52,251 School categorical revenues - 303,748 Police grants - 80,355 Swimming pool - 12,006
Total $ 448,360 $ 448,360
Due From Due ToOther Funds Other Funds
The balance due to general fund from police grants and school lunch resulted from a short-term loan made to establish working capital. The balance due to general fund from the remaining special revenue funds result from the time lag between the dates that (1) interfund goods and services are provided or reimbursable expenditures occur, (2) transactions are recorded in the accounting system, and (3) payments between funds are made. The composition of advances to/from other funds (amounts considered to be long-term) as of June 30, 2016 is as follows:
Fund
Governmental Funds:General fund $ 610,160 $ -
Nonmajor Funds:Special Revenue Funds:
City trust funds - 610,160
Total $ 610,160 $ 610,160
Other Funds Other FundsAdvances to Advances from
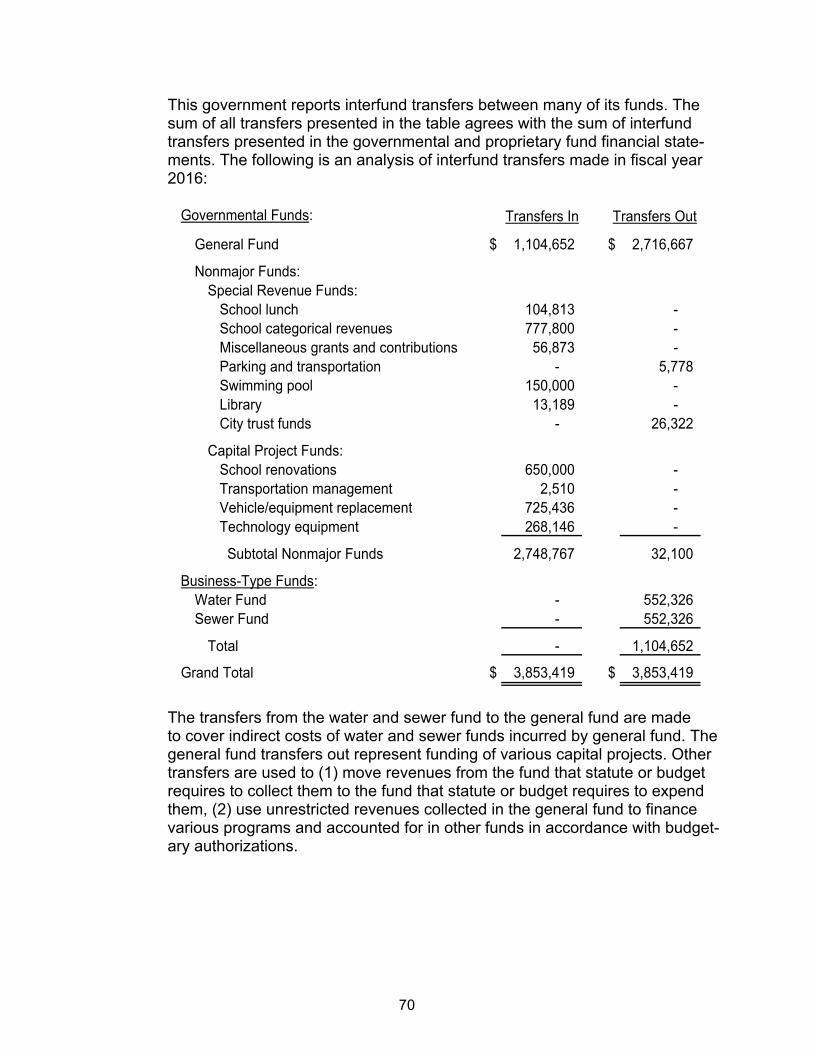
70
This government reports interfund transfers between many of its funds. The sum of all transfers presented in the table agrees with the sum of interfund transfers presented in the governmental and proprietary fund financial state-ments. The following is an analysis of interfund transfers made in fiscal year 2016:
Governmental Funds:
General Fund $ 1,104,652 $ 2,716,667
Nonmajor Funds:Special Revenue Funds:
School lunch 104,813 - School categorical revenues 777,800 - Miscellaneous grants and contributions 56,873 - Parking and transportation - 5,778 Swimming pool 150,000 - Library 13,189 - City trust funds - 26,322
Capital Project Funds:School renovations 650,000 - Transportation management 2,510 - Vehicle/equipment replacement 725,436 - Technology equipment 268,146 -
Subtotal Nonmajor Funds 2,748,767 32,100
Business-Type Funds:Water Fund - 552,326 Sewer Fund - 552,326
Total - 1,104,652
Grand Total $ 3,853,419 $ 3,853,419
Transfers In Transfers Out
The transfers from the water and sewer fund to the general fund are made to cover indirect costs of water and sewer funds incurred by general fund. The general fund transfers out represent funding of various capital projects. Other transfers are used to (1) move revenues from the fund that statute or budget requires to collect them to the fund that statute or budget requires to expend them, (2) use unrestricted revenues collected in the general fund to finance various programs and accounted for in other funds in accordance with budget-ary authorizations.
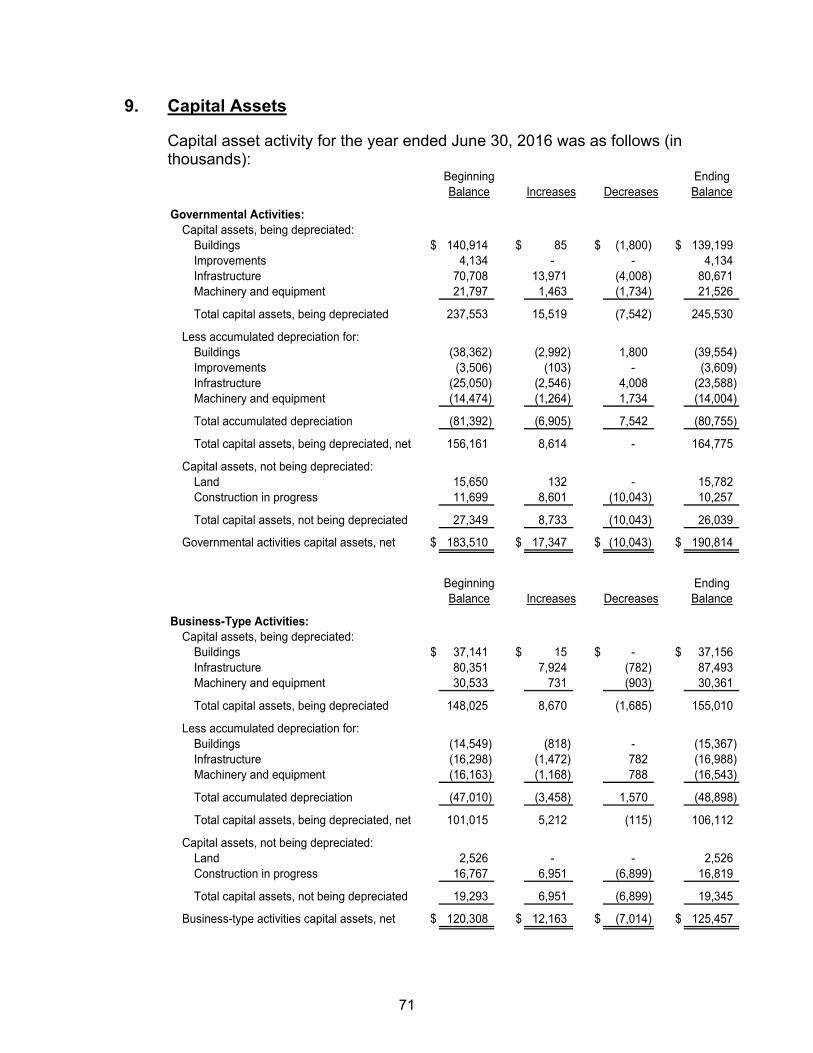
71
9. Capital Assets
Capital asset activity for the year ended June 30, 2016 was as follows (in thousands):
EndingBalance
Governmental Activities:Capital assets, being depreciated:
Buildings $ 140,914 $ 85 $ (1,800) $ 139,199 Improvements 4,134 - - 4,134 Infrastructure 70,708 13,971 (4,008) 80,671 Machinery and equipment 21,797 1,463 (1,734) 21,526
Total capital assets, being depreciated 237,553 15,519 (7,542) 245,530
Less accumulated depreciation for:Buildings (38,362) (2,992) 1,800 (39,554) Improvements (3,506) (103) - (3,609) Infrastructure (25,050) (2,546) 4,008 (23,588) Machinery and equipment (14,474) (1,264) 1,734 (14,004)
Total accumulated depreciation (81,392) (6,905) 7,542 (80,755)
Total capital assets, being depreciated, net 156,161 8,614 - 164,775
Capital assets, not being depreciated:Land 15,650 132 - 15,782 Construction in progress 11,699 8,601 (10,043) 10,257
Total capital assets, not being depreciated 27,349 8,733 (10,043) 26,039
Governmental activities capital assets, net $ 183,510 $ 17,347 $ (10,043) $ 190,814
BeginningBalance Increases Decreases
EndingBalance
Business-Type Activities:Capital assets, being depreciated:
Buildings $ 37,141 $ 15 $ - $ 37,156 Infrastructure 80,351 7,924 (782) 87,493 Machinery and equipment 30,533 731 (903) 30,361
Total capital assets, being depreciated 148,025 8,670 (1,685) 155,010
Less accumulated depreciation for:Buildings (14,549) (818) - (15,367) Infrastructure (16,298) (1,472) 782 (16,988) Machinery and equipment (16,163) (1,168) 788 (16,543)
Total accumulated depreciation (47,010) (3,458) 1,570 (48,898)
Total capital assets, being depreciated, net 101,015 5,212 (115) 106,112
Capital assets, not being depreciated:Land 2,526 - - 2,526 Construction in progress 16,767 6,951 (6,899) 16,819
Total capital assets, not being depreciated 19,293 6,951 (6,899) 19,345
Business-type activities capital assets, net $ 120,308 $ 12,163 $ (7,014) $ 125,457
Increases DecreasesBeginningBalance
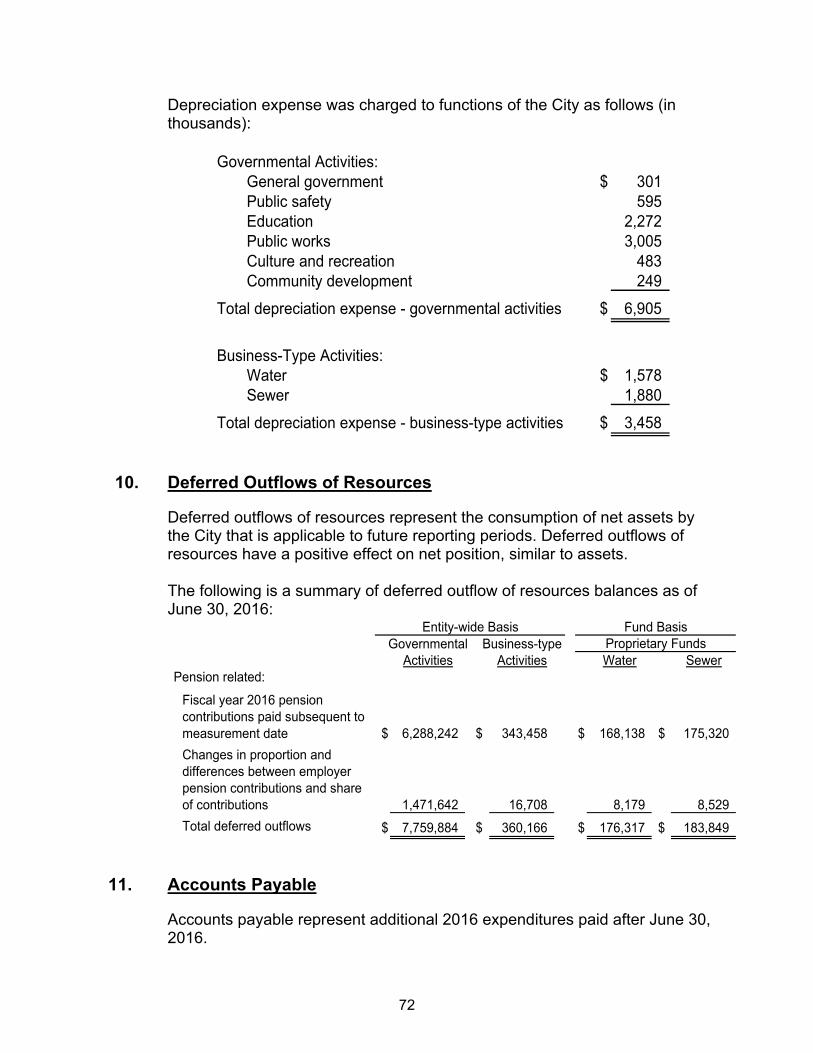
72
Depreciation expense was charged to functions of the City as follows (in thousands):
Governmental Activities:General government $ 301 Public safety 595 Education 2,272 Public works 3,005 Culture and recreation 483 Community development 249
Total depreciation expense - governmental activities $ 6,905
Business-Type Activities:
Water $ 1,578 Sewer 1,880
Total depreciation expense - business-type activities $ 3,458
10. Deferred Outflows of Resources
Deferred outflows of resources represent the consumption of net assets by the City that is applicable to future reporting periods. Deferred outflows of resources have a positive effect on net position, similar to assets. The following is a summary of deferred outflow of resources balances as of June 30, 2016:
Governmental Business-typeActivities Activities Water Sewer
Pension related:
Fiscal year 2016 pension contributions paid subsequent to measurement date $ 6,288,242 $ 343,458 $ 168,138 $ 175,320
Changes in proportion and differences between employer pension contributions and share of contributions 1,471,642 16,708 8,179 8,529
Total deferred outflows $ 7,759,884 $ 360,166 $ 176,317 $ 183,849
Proprietary FundsEntity-wide Basis Fund Basis
11. Accounts Payable
Accounts payable represent additional 2016 expenditures paid after June 30, 2016.
73
12. Accrued Liabilities
Accrued liabilities represent a reserve for insurance claims and accrued pay-roll in governmental funds, and accrued payroll and accrued interest in busi-ness-type funds.
13. Tax Refunds Payable
This balance consists of an estimate of refunds due to property taxpayers for potential abatements pending with the state Board of Tax and Land Appeals and Superior Court.
14. Other Liabilities
This balance consists primarily of municipal escrow accounts, and various other miscellaneous liabilities.
15. Notes Payable
The City had general obligation taxable bond anticipation notes during the year ended June 30, 2016 in the Building and Infrastructure governmental fund. The following are changes in notes payable for the year ended June 30, 2016:
Interest Maturity BeginningRate Date Balance Additions Reductions
Taxable BAN 1.20% 6/23/2017 $ - $ 5,000,000 $ - $ 5,000,000 Taxable BAN 1.50% 6/23/2017 - 2,000,000 - 2,000,000
Total $ - $ 7,000,000 $ - $ 7,000,000
EndingBalance
16. Long-Term Debt
A. Long-Term Debt Supporting Governmental Activities
General obligation bonds, issued by the City for various municipal improve-ments, are approved by the voters and repaid with property taxes recorded in the General Fund. These bonds are required to be fully paid within 20 years from the date of issue and are backed by the full faith and credit of the City. The City’s borrowing capacity is restrained by State law. Com-pensated absences and the City’s Net OPEB Obligation are repaid from the funds that the costs relate to, mostly general, water, and sewer funds.
74
B. General Obligation Bonds and State Revolving Loans
General obligation bonds and state revolving loans have been issued for both governmental and business-type activities. General obligation bonds and state revolving loans currently outstanding are as follows:
SerialOriginal Maturities Interest
Governmental Activities: Issue Through Rate(s) %
Coakley Landfill $ 3,605,774 08/01/18 0.85 $ 540,866 Coakley Landfill OU2 652,330 07/01/19 1.02 130,465 Capital Improvements 2006 950,000 06/15/17 4.00 95,000 Capital Improvements Streets Sidewalks 2007 3,450,000 06/15/17 4.00 345,000 Capital Improvements to Facilities 2007 1,000,000 06/15/17 4.00 100,000 New Castle Ave. Seawall 600,000 06/15/17 4.00 60,000 FY08 Streets, Sidewalks, Bridges 2,500,000 06/15/18 3.71 500,000 FY08 School Improvements 500,000 06/15/18 3.71 100,000 Fire Station 2 3,650,000 06/15/28 3.98 370,000 Purchase of Land for Fire Station 2 1,300,000 06/15/28 3.98 130,000 Capital Improvements 2009 Fire Station 2 1,500,000 01/15/29 3.76 225,000 Capital Improvements 2009 3,500,000 01/15/19 3.76 1,050,000 Capital Improvements 2010 1,800,000 05/15/20 3.27 720,000 School Improvements 2010 500,000 05/15/20 3.27 200,000 Middle School Construction 15,000,000 05/15/30 3.27 10,500,000 Middle School Construction 22,500,000 12/01/31 2.68 18,000,000 Capital Improvements 2011 6,400,000 12/01/21 2.68 3,840,000 Fire Apparatus 500,000 12/01/16 2.68 100,000 Refunding High School 17,325,000 09/15/22 1.40 11,850,000 Streets Sidewalks, Bridge 2013 2,267,000 06/15/23 2.38 1,575,000 School Improvements 2013 500,000 06/15/23 2.38 350,000 Facilities, Streets and Sidewalks 2014 5,750,000 06/01/24 1.78 4,600,000 Middle School Construction 3,300,000 06/01/34 2.87 2,970,000 School Energy Efficiency Improvements 345,000 10/21/17 2.09 252,608 Capital Improvements 2015 3,475,000 06/30/25 2.10 3,125,000 School Facility Improvements 2015 750,000 06/30/25 2.10 675,000 Refunding Library 2015 3,335,000 08/01/25 2.09 3,335,000 Streets Sidewalks, Bridge 2016 6,100,000 06/15/26 1.87 6,100,000 Fire Apparatus 2016 523,290 06/15/21 1.87 523,290 School Facilities 2016 500,000 05/15/26 1.87 500,000 Little Harbour School Facility Improvement 2016 5,000,000 05/15/26 1.87 5,000,000 Commerce Way 2016 1,524,710 05/15/26 1.87 1,524,710 Refunding Fire Station 2 Construction and Land 2,332,000 05/15/26 1.87 2,332,000 Refunding Fire Station 2 Improvements 708,500 01/15/29 1.57 708,500
Total Governmental Activities $ 82,427,439
AmountOutstanding
as of6/30/16
75
SerialOriginal Maturities Interest
Business-Type Activities: Issue Through Rate(s) %
Water:Upgrade to Motor Control $ 300,000 01/01/22 3.98 $ 90,000 Corrosion Control Program 288,000 01/01/22 3.80 86,400 Constitution Avenue 4,800,000 01/01/22 3.70 1,680,000 Spinney Tank 1,162,560 12/01/22 3.73 406,896 Madbury WTP Design 2,000,000 06/01/28 2.49 1,200,000 Water Treatment Plant 16,000,000 01/15/29 3.94 2,530,000 Madbury WTP 5,000,000 06/01/32 2.72 4,000,000 Hobb's Hill Water Tank 3,500,000 06/01/34 2.87 3,150,000 Greenland Well & Water Line 4,800,000 06/15/35 2.99 4,560,000 Water System Pressure and Storage 4,100,000 06/15/36 1.87 4,100,000 Refunding Madbury Plant 7,921,500 01/15/29 1.57 7,921,500
Sewer:Waste Water Treatment Plant Pease 6,586,836 03/01/20 1.02 1,285,802 Sewer Projects Phase I 4,931,361 08/01/21 1.36 1,479,408 Sewer Projects Phase II 8,898,110 12/01/24 1.87 4,004,149 Lower Court Utilities Upgrade 688,563 07/01/27 2.38 413,137 Phase III Sewer 5,508,137 12/01/27 2.38 3,304,882 Sewer-Rye Line Pump Station 1,069,714 11/01/29 2.58 748,800 Sewer-201 Facility Study 1,000,000 01/01/30 2.58 700,000 Bartlett Street 5,290,233 01/01/31 2.62 3,967,672 Sewer PIWWTP 3,000,000 01/01/31 2.68 2,400,000 Sewer WWTP - Plant 8,000,000 09/15/12 2.31 6,400,000 State St Utilities Upgrade 1,500,433 09/01/21 1.36 900,260 Lincoln 3C 3,929,000 06/15/33 2.38 3,325,000 Lincoln Separation 5,595,874 06/01/33 3.35 4,756,493 Pierce Island WWTP 10,000,000 06/01/34 2.87 9,000,000 Pease WWTP 2014 3,500,000 06/01/34 2.87 3,150,000 Pease WWTP 2015 1,000,000 06/15/35 2.99 950,000 Lafayette Pumping Station 4,000,000 06/15/36 1.87 4,000,000
Total Business-Type Activities $ 80,510,399
AmountOutstanding
as of6/30/16
76
C. Future Debt Service
The annual payments to retire all general obligation long-term debt outstanding as of June 30, 2016 are as follows:
Governmental Principal Interest Total
2017 $ 9,452,877 $ 3,006,160 $ 12,459,037 2018 8,725,540 2,703,954 11,429,494 2019 8,257,905 2,388,709 10,646,614 2020 7,717,617 2,065,304 9,782,921 2021 7,445,000 1,740,046 9,185,046
2022 - 2026 26,605,000 4,947,056 31,552,056 2027 - 2031 11,353,500 1,536,829 12,890,329 2032 - 2034 2,870,000 174,600 3,044,600
Total $ 82,427,439 $ 18,562,658 $ 100,990,097
Business-Type Principal Interest Total
2017 $ 5,988,121 $ 2,532,674 $ 8,520,795 2018 5,988,121 2,467,782 8,455,903 2019 5,978,121 2,266,200 8,244,321 2020 5,933,121 2,085,218 8,018,339 2021 5,611,670 1,894,635 7,506,305
2022 - 2026 25,005,019 6,771,217 31,776,236 2027 - 2031 18,771,639 2,920,177 21,691,816 2032 - 2036 7,234,587 526,456 7,761,043
Total $ 80,510,399 $ 21,464,359 $ 101,974,758
D. Bond Authorizations/Unissued
Long-term debt authorizations which have not been issued or rescinded as of June 30, 2016 are as follows:
Purpose Amount
Governmental activities:Coakley landfill $ 4,641,897 Commerce way 75,290 Deer St. parking facility 23,200,000 New Franklin school energy efficiency 25,000 School facilities 5,000,000 Fire apparatus 76,710
Subtotal governmental 33,018,897
Business-type activities:Pierce Island wastewater treatment facility upgrade 75,000,000
Subtotal business-type 75,000,000
Total Bond Authorizations/unissued $ 108,018,897
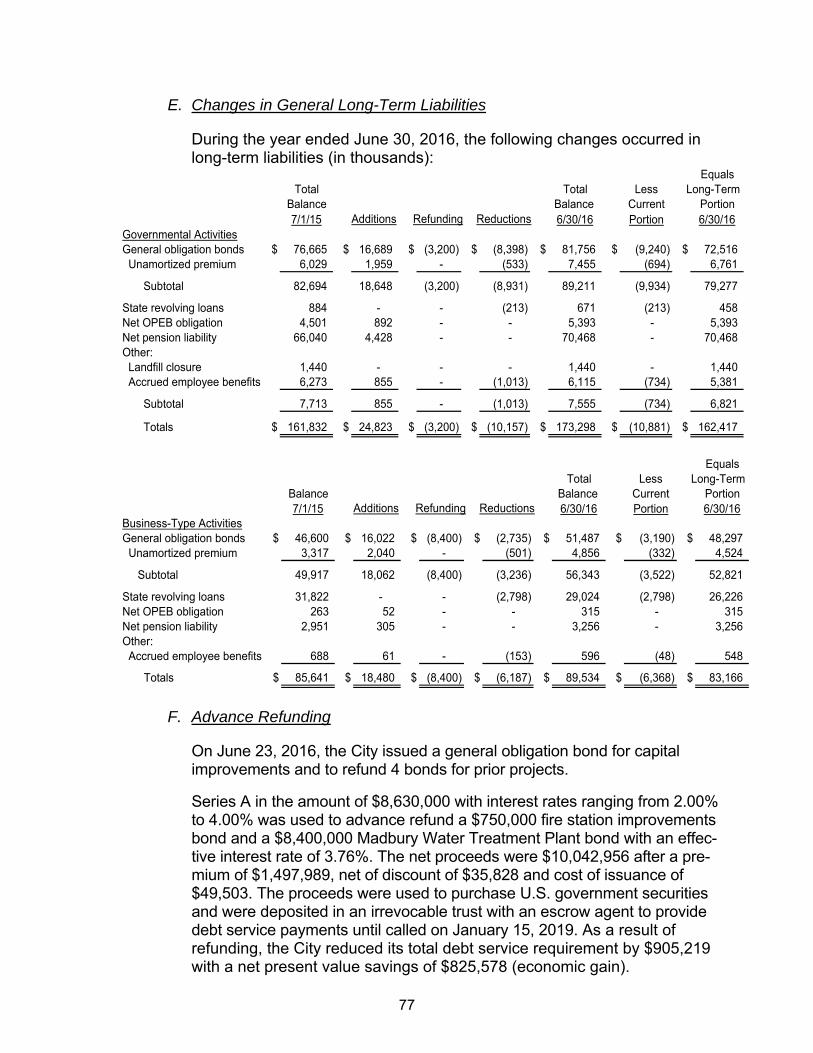
77
E. Changes in General Long-Term Liabilities
During the year ended June 30, 2016, the following changes occurred in long-term liabilities (in thousands):
EqualsTotal Total Less
Balance Current Portion7/1/15 6/30/16 Portion 6/30/16
Governmental ActivitiesGeneral obligation bonds $ 76,665 $ 16,689 $ (3,200) $ (8,398) $ 81,756 $ (9,240) $ 72,516 Unamortized premium 6,029 1,959 - (533) 7,455 (694) 6,761
Subtotal 82,694 18,648 (3,200) (8,931) 89,211 (9,934) 79,277
State revolving loans 884 - - (213) 671 (213) 458 Net OPEB obligation 4,501 892 - - 5,393 - 5,393 Net pension liability 66,040 4,428 - - 70,468 - 70,468 Other: Landfill closure 1,440 - - - 1,440 - 1,440 Accrued employee benefits 6,273 855 - (1,013) 6,115 (734) 5,381
Subtotal 7,713 855 - (1,013) 7,555 (734) 6,821
Totals $ 161,832 $ 24,823 $ (3,200) $ (10,157) $ 173,298 $ (10,881) $ 162,417
Additions
Long-TermBalance
ReductionsRefunding
EqualsTotal Less
Balance Current Portion7/1/15 6/30/16 Portion 6/30/16
Business-Type ActivitiesGeneral obligation bonds $ 46,600 $ 16,022 $ (8,400) $ (2,735) $ 51,487 $ (3,190) $ 48,297 Unamortized premium 3,317 2,040 - (501) 4,856 (332) 4,524
Subtotal 49,917 18,062 (8,400) (3,236) 56,343 (3,522) 52,821
State revolving loans 31,822 - - (2,798) 29,024 (2,798) 26,226 Net OPEB obligation 263 52 - - 315 - 315 Net pension liability 2,951 305 - - 3,256 - 3,256 Other: Accrued employee benefits 688 61 - (153) 596 (48) 548
Totals $ 85,641 $ 18,480 $ (8,400) $ (6,187) $ 89,534 $ (6,368) $ 83,166
Additions Reductions
Long-TermBalance
Refunding
F. Advance Refunding
On June 23, 2016, the City issued a general obligation bond for capital improvements and to refund 4 bonds for prior projects.
Series A in the amount of $8,630,000 with interest rates ranging from 2.00% to 4.00% was used to advance refund a $750,000 fire station improvements bond and a $8,400,000 Madbury Water Treatment Plant bond with an effec-tive interest rate of 3.76%. The net proceeds were $10,042,956 after a pre-mium of $1,497,989, net of discount of $35,828 and cost of issuance of $49,503. The proceeds were used to purchase U.S. government securities and were deposited in an irrevocable trust with an escrow agent to provide debt service payments until called on January 15, 2019. As a result of refunding, the City reduced its total debt service requirement by $905,219 with a net present value savings of $825,578 (economic gain).
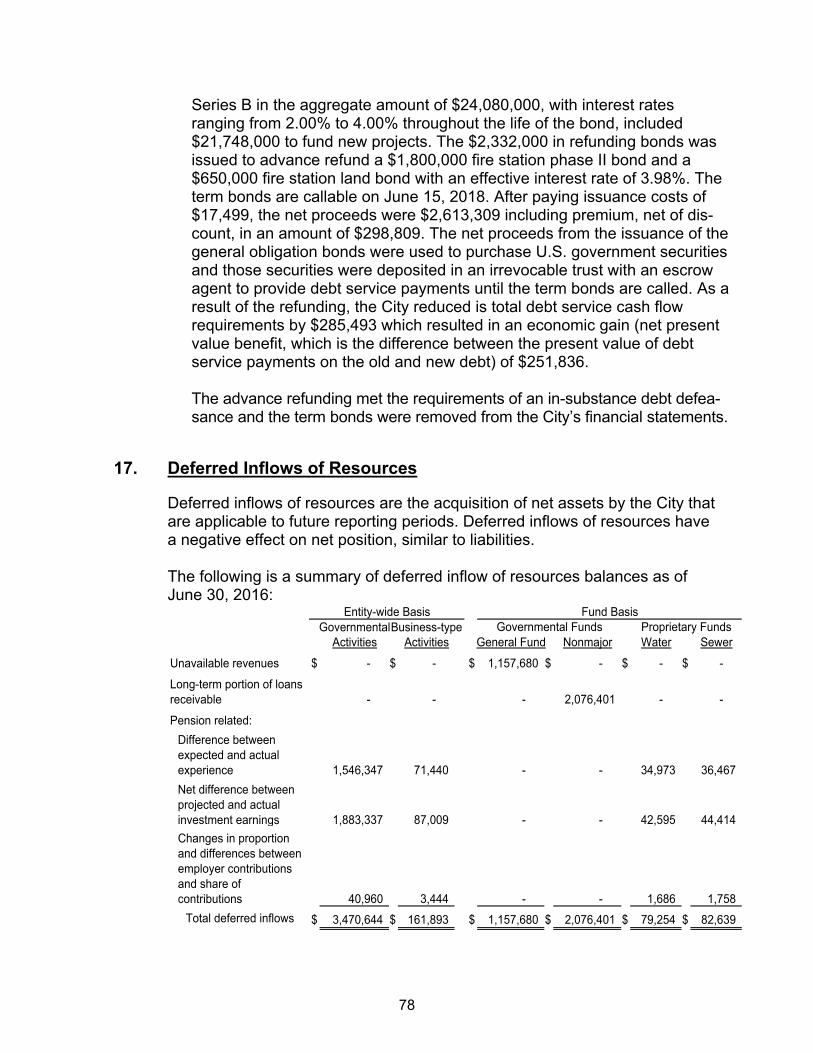
78
Series B in the aggregate amount of $24,080,000, with interest rates ranging from 2.00% to 4.00% throughout the life of the bond, included $21,748,000 to fund new projects. The $2,332,000 in refunding bonds was issued to advance refund a $1,800,000 fire station phase II bond and a $650,000 fire station land bond with an effective interest rate of 3.98%. The term bonds are callable on June 15, 2018. After paying issuance costs of $17,499, the net proceeds were $2,613,309 including premium, net of dis-count, in an amount of $298,809. The net proceeds from the issuance of the general obligation bonds were used to purchase U.S. government securities and those securities were deposited in an irrevocable trust with an escrow agent to provide debt service payments until the term bonds are called. As a result of the refunding, the City reduced is total debt service cash flow requirements by $285,493 which resulted in an economic gain (net present value benefit, which is the difference between the present value of debt service payments on the old and new debt) of $251,836. The advance refunding met the requirements of an in-substance debt defea-sance and the term bonds were removed from the City’s financial statements.
17. Deferred Inflows of Resources
Deferred inflows of resources are the acquisition of net assets by the City that are applicable to future reporting periods. Deferred inflows of resources have a negative effect on net position, similar to liabilities. The following is a summary of deferred inflow of resources balances as of June 30, 2016:
GovernmentalBusiness-typeActivities Activities General Fund Nonmajor Water Sewer
Unavailable revenues $ - $ - $ 1,157,680 $ - $ - $ -
Long-term portion of loans receivable - - - 2,076,401 - -
Pension related:
Difference between expected and actual experience 1,546,347 71,440 - - 34,973 36,467
Net difference between projected and actual investment earnings 1,883,337 87,009 - - 42,595 44,414
Changes in proportion and differences between employer contributions and share of contributions 40,960 3,444 - - 1,686 1,758
Total deferred inflows $ 3,470,644 $ 161,893 $ 1,157,680 $ 2,076,401 $ 79,254 $ 82,639
Entity-wide BasisGovernmental Funds Proprietary Funds
Fund Basis
79
18. Restricted Net Position
The accompanying entity-wide financial statements report restricted net position when external constraints from grantors or contributors are placed on net position. Permanent fund restricted net position is segregated between nonexpendable and expendable. The nonexpendable portion represents the original restricted principal contribution, and the expendable represents accumulated earnings which are available to be spent based on donor restrictions.
19. Governmental Funds - Balances
Fund balances are segregated to account for resources that are either not available for expenditure in the future or are legally set aside for a specific future use. The following types of fund balances are reported at June 30, 2016: Nonspendable - This fund balance classification includes an offset for inven-tory, advances to other funds, and reserves for the principal portion of perma-nent trust funds.
Restricted - This fund balance classification includes various special revenue funds, capital project balances funded by bond issuances and grants, and the income portion of permanent trust funds.
Committed - This fund balance classification includes General Fund capital reserve funds set aside by City Council vote for future debt payments, health insurance costs, future tax abatements, capital acquisitions and improve-ments, subsequent year’s use of fund balance, and amounts used from operations for capital per City Council resolutions.
Assigned - This fund balance classification includes General Fund surplus balances that management assigns for specific purposes with City Council approval.
Unassigned - This fund balance classification includes General Fund avail-able balance and other funds’ temporary fund balance deficits.
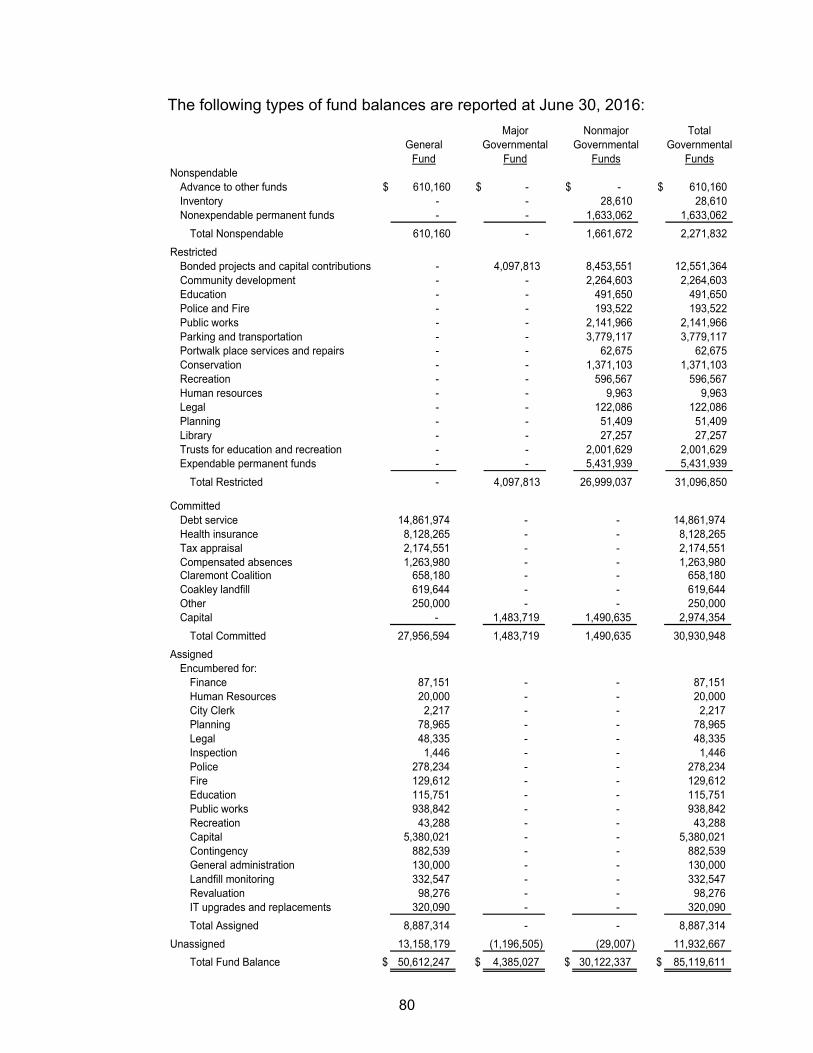
80
The following types of fund balances are reported at June 30, 2016:
Major Nonmajor TotalGeneral Governmental Governmental Governmental
Fund Fund Funds FundsNonspendable
Advance to other funds $ 610,160 $ - $ - $ 610,160 Inventory - - 28,610 28,610 Nonexpendable permanent funds - - 1,633,062 1,633,062
Total Nonspendable 610,160 - 1,661,672 2,271,832
RestrictedBonded projects and capital contributions - 4,097,813 8,453,551 12,551,364 Community development - - 2,264,603 2,264,603 Education - - 491,650 491,650 Police and Fire - - 193,522 193,522 Public works - - 2,141,966 2,141,966 Parking and transportation - - 3,779,117 3,779,117 Portwalk place services and repairs - - 62,675 62,675 Conservation - - 1,371,103 1,371,103 Recreation - - 596,567 596,567 Human resources - - 9,963 9,963 Legal - - 122,086 122,086 Planning - - 51,409 51,409 Library - - 27,257 27,257 Trusts for education and recreation - - 2,001,629 2,001,629 Expendable permanent funds - - 5,431,939 5,431,939
Total Restricted - 4,097,813 26,999,037 31,096,850 Committed
Debt service 14,861,974 - - 14,861,974 Health insurance 8,128,265 - - 8,128,265 Tax appraisal 2,174,551 - - 2,174,551 Compensated absences 1,263,980 - - 1,263,980 Claremont Coalition 658,180 - - 658,180 Coakley landfill 619,644 - - 619,644 Other 250,000 - - 250,000 Capital - 1,483,719 1,490,635 2,974,354
Total Committed 27,956,594 1,483,719 1,490,635 30,930,948
AssignedEncumbered for:
Finance 87,151 - - 87,151 Human Resources 20,000 - - 20,000 City Clerk 2,217 - - 2,217 Planning 78,965 - - 78,965 Legal 48,335 - - 48,335 Inspection 1,446 - - 1,446 Police 278,234 - - 278,234 Fire 129,612 - - 129,612 Education 115,751 - - 115,751 Public works 938,842 - - 938,842 Recreation 43,288 - - 43,288 Capital 5,380,021 - - 5,380,021 Contingency 882,539 - - 882,539 General administration 130,000 - - 130,000 Landfill monitoring 332,547 - - 332,547 Revaluation 98,276 - - 98,276 IT upgrades and replacements 320,090 - - 320,090
Total Assigned 8,887,314 - - 8,887,314
Unassigned 13,158,179 (1,196,505) (29,007) 11,932,667
Total Fund Balance $ 50,612,247 $ 4,385,027 $ 30,122,337 $ 85,119,611
81
20. Commitments and Contingencies
Grants - Amounts received or receivable from grantor agencies are subject to audit and adjustment by grantor agencies, principally the federal government. Any disallowed claims, including amounts already collected, may constitute a liability of the applicable funds. The amount of expenditures which may be disallowed by the grantor cannot be determined at this time, although the City expects such amounts, if any, to be immaterial. Coakley Landfill – For the period 1972 through 1982, the Coakley Landfill site, located in North Hampton, New Hampshire, served as the municipal refuse disposal site for the City of Portsmouth and for the Towns of North Hampton, New Castle, and Pease Air Force Base. In December 1984, the City was advised by the State of New Hampshire that the City was considered to be a Potentially Responsible Party (PRP) under the provisions of the Comprehensive Environmental Response, Compensation and Liability Act (CERCLA), as amended by the Superfund Amendments and Reauthorization Act of 1986, for contamination conditions which exist at the site. In December 1992, a total of 27 responsible parties, including the City, entered into a Consent Decree (Decree) with the United States Environmental Protection Agency (EPA). The Decree commits the City to expend a signifi-cant amount as its share of the costs to remedy conditions at the site and to monitor and maintain the site once the remedial steps have been completed. The Decree estimated the total cost of the cleanup to be approximately $22 million, with the City’s share of these costs estimated to be approximately $8.9 million, to be contributed over a number of years as needed by the pro-ject. Liability amongst the responsible parties is joint and several and is in no way limited by the estimate in the Decree. Should one of the responsible par-ties default on its obligations, the remaining parties will assume the liability for the defaulting party. In December 1991, the City Council authorized the issuance of $8.9 million in bonds to pay for the costs of the project. To date, the City has borrowed $4,258,103 from the State Revolving Loan Fund against this authorization. The City is receiving state aid payments in connection with the project in the total amount of $493,644 payable over the life of the loan. The City awaits a final determination of the City’s remaining liability and has $4,641,897 remain-ing in the bond authority to pay its liability, if necessary. Wastewater Treatment Facility – The City of Portsmouth is obligated under a consent Decree with the Environmental Protection Agency (EPA) and New Hampshire Department of Environmental Services (DES) to complete con-struction of an upgraded wastewater treatment facility and achieve secondary treatment permit limits by May 2017. Construction commenced in September 2016 and substantial completion is anticipated in May 2020. The City’s request for a schedule extension has been agreed to by Federal and State regulators
82
and approved by the U.S. District Court for the District of New Hampshire. Bond authorization for up to $75 million was approved for the construction effort.
Other legal matters – Between 1995 and 1997 the City constructed a sewer line across property of the State of New Hampshire located off the Route 1 By-pass. The State had given the City permission, but no formal easement was ever recorded. In 2003, after passing through several owners, the prop-erty came to be owned by 150 Greenleaf Avenue Realty Trust, which is now seeking removal of the sewer line from the property as well as substantial money damages as a result of allegations that the sewer line has flooded the property and otherwise impeded the development of the land into a second automobile dealership. The City disputes these claims. The matter is sched-uled for trial in early 2017. On the completion of trial, appeals are likely. Therefore, it is not the City’s Legal Department’s expectation that the case will reach resolution or that the City’s liability, if any exists, will be determined with finality for several years. The City also has commenced eminent domain proceedings to acquire rights in the property; $345,000 is being offered to acquire rights as supported by an appraisal. In addition to the above, there are various suits pending in courts within the State in which the City is a defendant. In the opinion of Counsel for the City, no litigation is pending, or to his knowledge, threatened, which is likely to result, either individually or in the aggregate, in final judgements against the City that would materially affect its financial position.
21. Post-Employment Healthcare and Life Insurance Benefits
GASB Statement 45, Accounting and Financial Reporting by Employers for Post-Employment Benefits Other Than Pensions, requires governments to account for other post-employment benefits (OPEB), primarily healthcare, on an accrual basis rather than on a pay-as-you-go basis. The effect is the recognition of an actuarially required contribution as an expense on the State-ment of Activities when a future retiree earns their post-employment benefits, rather than when they use their post-employment benefit. To the extent that an entity does not fund their actuarially required contribution, a post-employment benefit liability is recognized on the Statement of Net Position over time.
A. Plan Description
In addition to providing the pension benefits described, the City pro-vides post-employment healthcare and life insurance benefits for retired employees through the City’s single employer defined benefit plan. The benefits, benefit levels, employee contributions and employer contributions are governed by RSA 100-A:50. As of June 30, 2015, the actuarial valuation date, approximately 78 retirees and 739 active employees meet the eligibil-ity requirements. The plan does not issue a separate financial report.

83
B. Benefits Provided
The City provides medical, prescription drug, mental health/substance abuse and life insurance to retirees and their covered dependents. All active employees who retire from the City and meet the eligibility criteria will receive these benefits.
C. Funding Policy
Retirees contribute 100% of the cost of the health plan, as determined by the City. The City contributes the remainder of the health plan costs on a pay-as-you-go basis.
D. Annual OPEB Costs and Net OPEB Obligation
The City’s fiscal 2016 annual OPEB expense is calculated based on the annual required contribution of the employer (ARC), an amount actuarially determined in accordance with the parameters of GASB Statement No. 45. The ARC represents a level of funding that, if paid on an ongoing basis, is projected to cover the normal cost per year and amortize the unfunded actuarial liability over a period of thirty years. The following table shows the components of the City’s annual OPEB cost for the year ending June 30, 2016, the amount actually contributed to the plan, and the change in the City’s net OPEB obligation based on an actuarial valuation as of June 30, 2015.
Annual Required Contribution (ARC) $ 1,538,585 Interest on net OPEB obligation 171,858 Adjustment to ARC (162,781)
Annual OPEB cost 1,547,662 Contributions made (603,181)
Increase in net OPEB obligation 944,481 Net OPEB obligation - beginning of year 4,763,552
Net OPEB obligation - end of year $ 5,708,033
The City’s annual OPEB cost, the percentage of annual OPEB cost con-tributed to the plan, and the net OPEB obligation were as follows:
Fiscal Year EndedAnnual OPEB
Cost
Percentage of OPEB Cost Contributed
Net OPEBObligation
2016 1,547,662$ 39.0% 5,708,033$ 2015 1,547,662$ 39.0% 4,763,552$ 2014 1,702,453$ 52.2% 3,819,072$ 2013 1,702,453$ 52.2% 3,005,989$ 2012 1,493,990$ 58.4% 2,192,906$ 2011 1,493,990$ 58.4% 1,571,921$
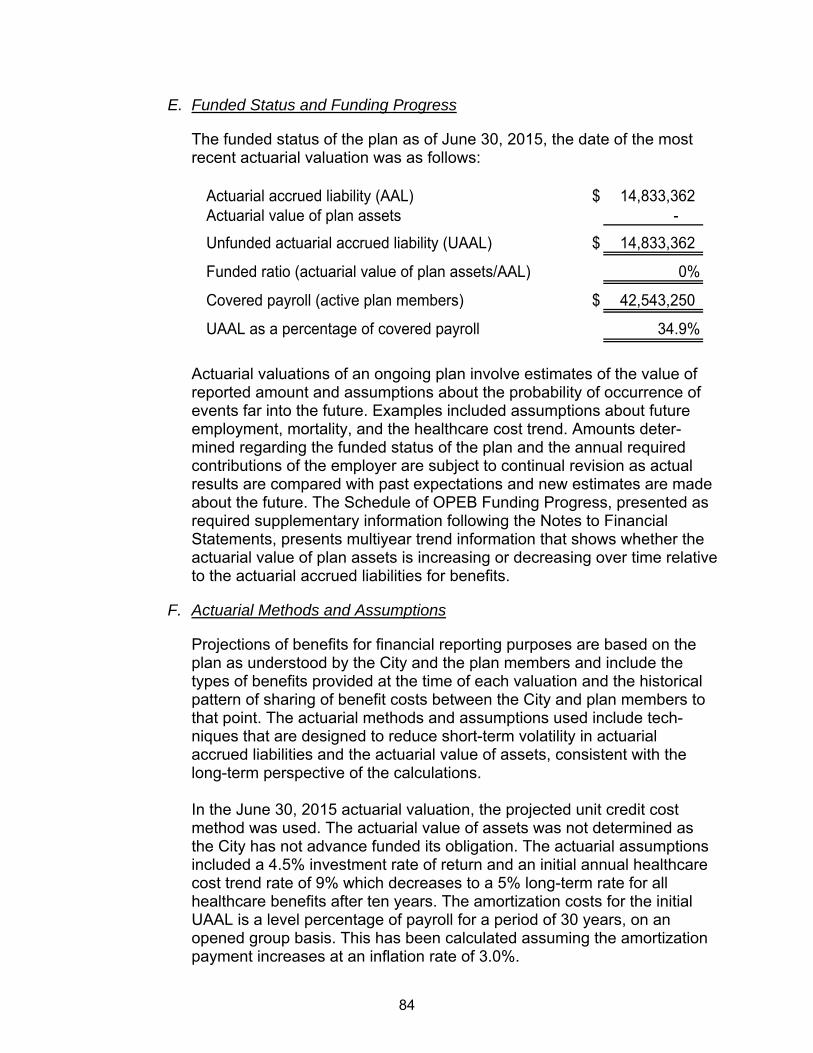
84
E. Funded Status and Funding Progress
The funded status of the plan as of June 30, 2015, the date of the most recent actuarial valuation was as follows:
Actuarial accrued liability (AAL) $ 14,833,362 Actuarial value of plan assets -
Unfunded actuarial accrued liability (UAAL) $ 14,833,362
Funded ratio (actuarial value of plan assets/AAL) 0%
Covered payroll (active plan members) $ 42,543,250
UAAL as a percentage of covered payroll 34.9%
Actuarial valuations of an ongoing plan involve estimates of the value of reported amount and assumptions about the probability of occurrence of events far into the future. Examples included assumptions about future employment, mortality, and the healthcare cost trend. Amounts deter-mined regarding the funded status of the plan and the annual required contributions of the employer are subject to continual revision as actual results are compared with past expectations and new estimates are made about the future. The Schedule of OPEB Funding Progress, presented as required supplementary information following the Notes to Financial Statements, presents multiyear trend information that shows whether the actuarial value of plan assets is increasing or decreasing over time relative to the actuarial accrued liabilities for benefits.
F. Actuarial Methods and Assumptions
Projections of benefits for financial reporting purposes are based on the plan as understood by the City and the plan members and include the types of benefits provided at the time of each valuation and the historical pattern of sharing of benefit costs between the City and plan members to that point. The actuarial methods and assumptions used include tech-niques that are designed to reduce short-term volatility in actuarial accrued liabilities and the actuarial value of assets, consistent with the long-term perspective of the calculations. In the June 30, 2015 actuarial valuation, the projected unit credit cost method was used. The actuarial value of assets was not determined as the City has not advance funded its obligation. The actuarial assumptions included a 4.5% investment rate of return and an initial annual healthcare cost trend rate of 9% which decreases to a 5% long-term rate for all healthcare benefits after ten years. The amortization costs for the initial UAAL is a level percentage of payroll for a period of 30 years, on an opened group basis. This has been calculated assuming the amortization payment increases at an inflation rate of 3.0%.

85
22. Retirement System
The City follows the provisions of GASB Statement No. 68, Accounting and Financial Reporting for Pensions – an amendment of GASB Statement No. 27, with respect to the State of New Hampshire Retirement System (NHRS).
A. Plan Description
Full-time employees participate in the New Hampshire Retirement System (NHRS), a cost sharing, multiple-employer defined benefit contributory pension plan and trust established in 1967 by RSA 100-A:2 and qualified as a tax-exempt organization under Sections 401(a) and 501(a) of the Internal Revenue Code. The plan is a contributory, defined benefit plan providing service, disability, death, and vested retirement benefits to mem-bers and their beneficiaries. Substantially all full-time state employees, public school teachers and administrators, permanent firefighters, and permanent police officers within the State of New Hampshire are eligible and required to participate in the system. Full-time employees of political subdivisions, including counties, municipalities, and school districts, are also eligible to participate as a group if the governing body of the political subdivision has elected participation. The New Hampshire Retirement System, a Public Employees Retirement System (PERS), is divided into two membership groups. State or local employees and teachers belong to Group I. Police officers and firefighters belong to Group II. All assets are held in a single trust and are available to each group. Additional information is disclosed in the NHRS annual report publicly available from the New Hampshire Retirement System located at 54 Regional Drive, Concord, New Hampshire 03301-8507.
B. Benefits Provided
Group I members at age 60 or 65 (for members who commence service after July 1, 2011) qualify for a normal service retirement allowance based on years of creditable service and average final salary for the highest of either three or five years, depending on when their service commenced. The yearly pension amount is 1/60 or 1.667% of average final compensa-tion (AFC), multiplied by years of creditable service. At age 65, the yearly pension amount is recalculated at 1/66 or 1.515% of AFC multiplied by years of creditable service. Group II members who are age 60, or members who are at least age 45 with at least 20 years of creditable service, can receive a retirement allow-ance at a rate of 2.5% of AFC for each year of creditable service, not to exceed 40 years. Members commencing service on or after July 1, 2011 or members who have a nonvested status as of January 1, 2012 can receive a retirement allowance at age 52.5 with 25 years of service or age 60. The benefit shall be equal to 2% of AFC times creditable service
86
up to 42.5 years. However, a member who commenced service on or after July 1, 2011 shall not receive a retirement allowance until attaining the age of 52.5, but may receive a reduced allowance after age 50 if the member has at least 25 years of creditable service where the allowance shall be reduced, for each month by which the benefit commencement date precedes the month after which the member attains 52.5 years of age by ¼ of 1% or age 60. Members of both groups may qualify for vested deferred allowances, disability allowances and death benefit allowances subject to meeting various eligibility requirements. Benefits are based on AFC or earned compensation and/or service.
C. Contributions
Plan members are required to contribute a percentage of their gross earnings to the pension plan, which the contribution rates are 7% for employees and teachers 11.55% for police and 11.80% for fire. The City makes annual contributions to the pension plan equal to the amount required by Revised Statutes Annotated 100-A:16, and range from 11.17% to 29.16% of covered compensation. The City’s contributions to NHRS for the year ended June 30, 2016 was $6,243,379, which was equal to its annual required contribution.
D. Summary of Significant Accounting Policies
For purposes of measuring the net pension liability, deferred outflows of resources and deferred inflows of resources related to pensions, and pen-sion expense, information about the fiduciary net position of the NHRS and additions to/deductions from NHRS’ fiduciary net position have been deter-mined on the same basis as they are reported by NHRS. For this purpose, benefit payments (including refunds of employee contributions) are recog-nized when due and payable in accordance with benefit terms. Investments are reported at fair value.
E. Pension Liabilities, Pension Expense, and Deferred Outflows of Resources and Deferred Inflows of Resources Related to Pensions
At June 30, 2016, the City reported a liability of $73,723,357 for its propor-tionate share of the net pension liability. The net pension liability was measured as of June 30, 2015, and the total pension liability used to cal-culate the net pension liability was determined by an actuarial valuation as of June 30, 2014. The City’s proportion of the net pension liability was based on a projection of the City’s long-term share of contributions to the pension plan relative to the projected contributions of all participating employers, actuarially determined. At June 30, 2014, the City’s proportion was 1.84 percent. At June 30, 2015, the City’s proportion was 1.86 percent, which was an increase of 0.02 percent from its previous year proportion.
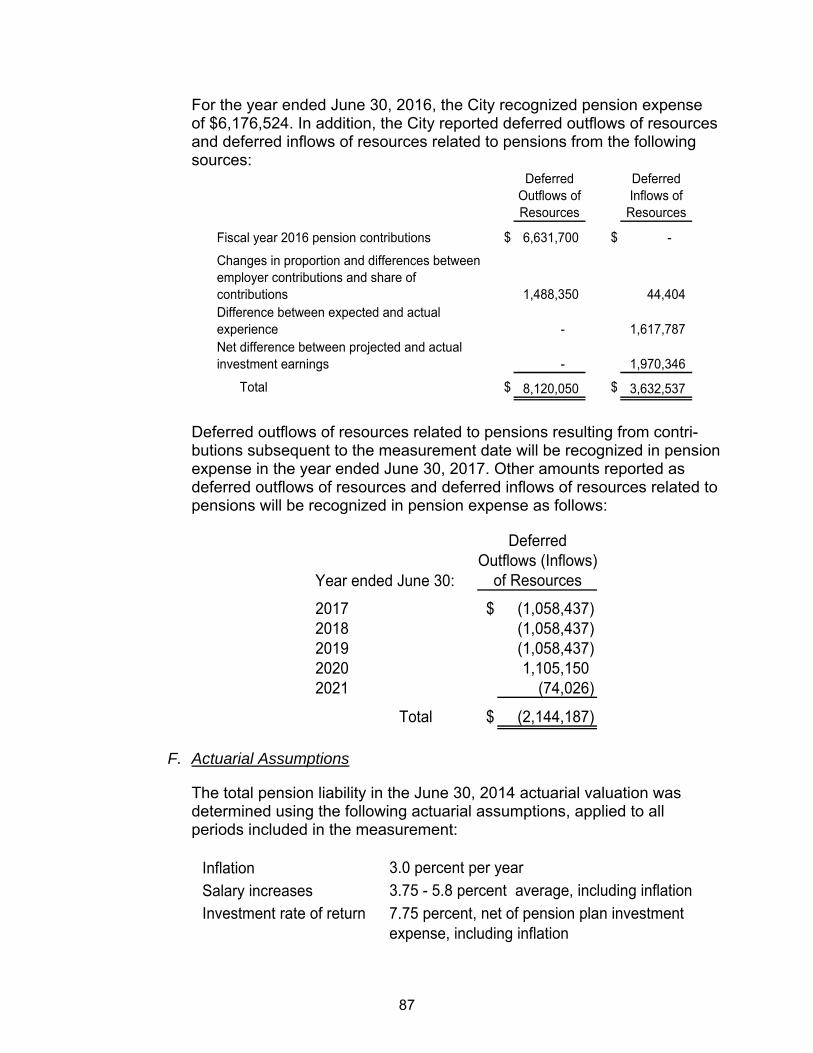
87
For the year ended June 30, 2016, the City recognized pension expense of $6,176,524. In addition, the City reported deferred outflows of resources and deferred inflows of resources related to pensions from the following sources:
Deferred Outflows of Resources
Deferred Inflows of
Resources
$ 6,631,700 $ -
1,488,350 44,404
- 1,617,787
- 1,970,346
Total $ 8,120,050 $ 3,632,537
Fiscal year 2016 pension contributions
Net difference between projected and actual investment earnings
Changes in proportion and differences between employer contributions and share of contributionsDifference between expected and actual experience
Deferred outflows of resources related to pensions resulting from contri-butions subsequent to the measurement date will be recognized in pension expense in the year ended June 30, 2017. Other amounts reported as deferred outflows of resources and deferred inflows of resources related to pensions will be recognized in pension expense as follows:
Year ended June 30:
2017 $ (1,058,437) 2018 (1,058,437) 2019 (1,058,437) 2020 1,105,150 2021 (74,026)
Total $ (2,144,187)
DeferredOutflows (Inflows)
of Resources
F. Actuarial Assumptions
The total pension liability in the June 30, 2014 actuarial valuation was determined using the following actuarial assumptions, applied to all periods included in the measurement:
Inflation
Salary increasesInvestment rate of return
3.75 - 5.8 percent average, including inflation
7.75 percent, net of pension plan investment expense, including inflation
3.0 percent per year
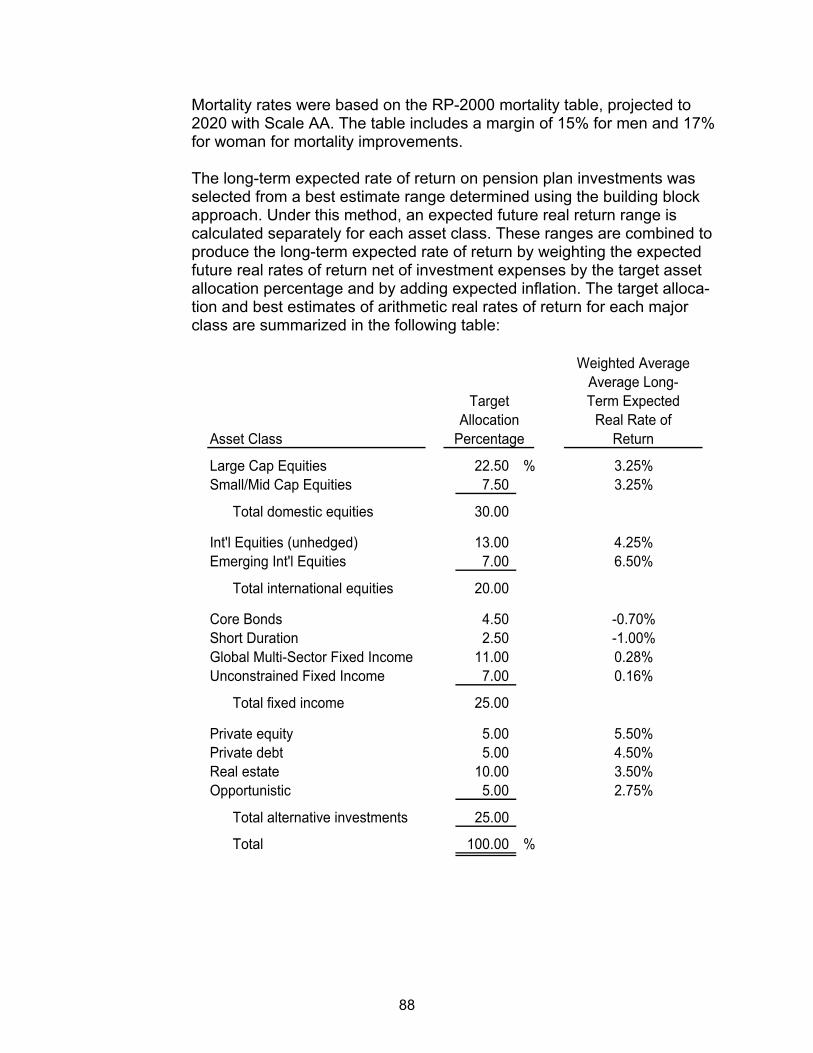
88
Mortality rates were based on the RP-2000 mortality table, projected to 2020 with Scale AA. The table includes a margin of 15% for men and 17% for woman for mortality improvements. The long-term expected rate of return on pension plan investments was selected from a best estimate range determined using the building block approach. Under this method, an expected future real return range is calculated separately for each asset class. These ranges are combined to produce the long-term expected rate of return by weighting the expected future real rates of return net of investment expenses by the target asset allocation percentage and by adding expected inflation. The target alloca-tion and best estimates of arithmetic real rates of return for each major class are summarized in the following table:
Weighted AverageAverage Long-Term Expected
Real Rate ofReturn
22.50 % 3.25%Small/Mid Cap Equities 7.50 3.25%
Total domestic equities 30.00
Int'l Equities (unhedged) 13.00 4.25%Emerging Int'l Equities 7.00 6.50%
Total international equities 20.00
Core Bonds 4.50 -0.70%Short Duration 2.50 -1.00%Global Multi-Sector Fixed Income 11.00 0.28%Unconstrained Fixed Income 7.00 0.16%
Total fixed income 25.00
Private equity 5.00 5.50%Private debt 5.00 4.50%Real estate 10.00 3.50%Opportunistic 5.00 2.75%
Total alternative investments 25.00
Total 100.00 %
Large Cap Equities
TargetAllocation
Asset Class Percentage
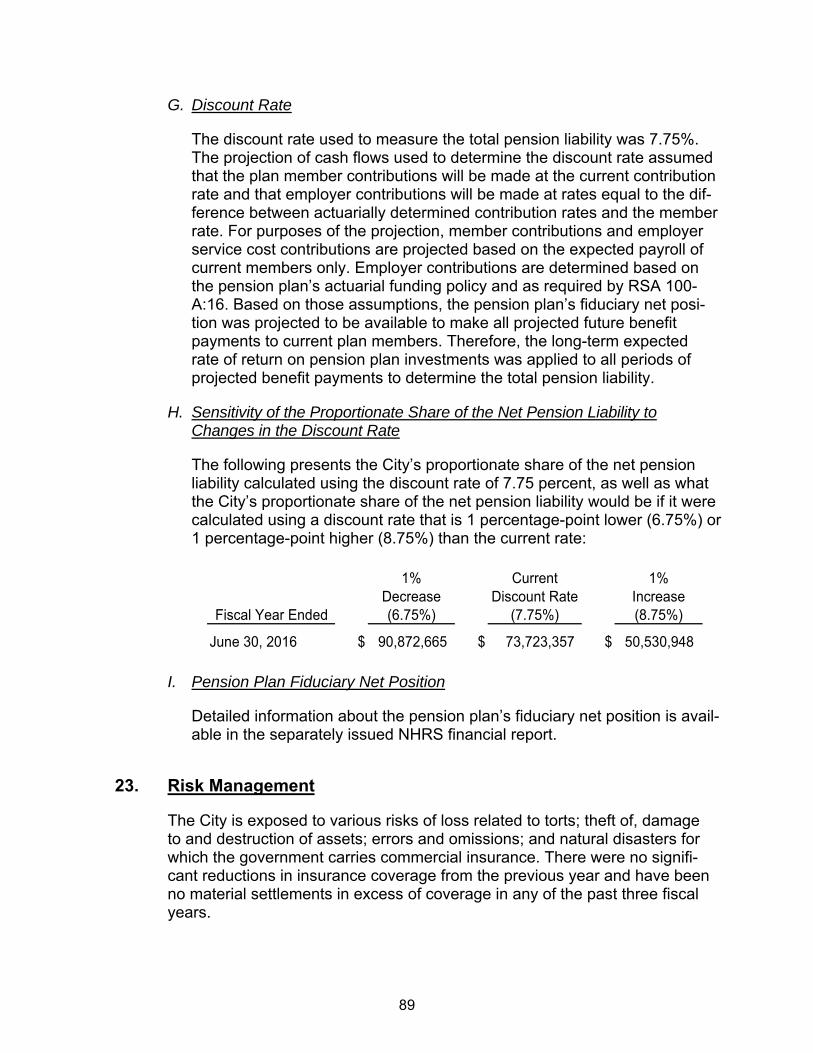
89
G. Discount Rate
The discount rate used to measure the total pension liability was 7.75%. The projection of cash flows used to determine the discount rate assumed that the plan member contributions will be made at the current contribution rate and that employer contributions will be made at rates equal to the dif-ference between actuarially determined contribution rates and the member rate. For purposes of the projection, member contributions and employer service cost contributions are projected based on the expected payroll of current members only. Employer contributions are determined based on the pension plan’s actuarial funding policy and as required by RSA 100-A:16. Based on those assumptions, the pension plan’s fiduciary net posi-tion was projected to be available to make all projected future benefit payments to current plan members. Therefore, the long-term expected rate of return on pension plan investments was applied to all periods of projected benefit payments to determine the total pension liability.
H. Sensitivity of the Proportionate Share of the Net Pension Liability to Changes in the Discount Rate
The following presents the City’s proportionate share of the net pension liability calculated using the discount rate of 7.75 percent, as well as what the City’s proportionate share of the net pension liability would be if it were calculated using a discount rate that is 1 percentage-point lower (6.75%) or 1 percentage-point higher (8.75%) than the current rate:
Fiscal Year Ended
1% Decrease (6.75%)
Current Discount Rate
(7.75%)
1%Increase (8.75%)
June 30, 2016 $ 90,872,665 $ 73,723,357 $ 50,530,948
I. Pension Plan Fiduciary Net Position
Detailed information about the pension plan’s fiduciary net position is avail-able in the separately issued NHRS financial report.
23. Risk Management
The City is exposed to various risks of loss related to torts; theft of, damage to and destruction of assets; errors and omissions; and natural disasters for which the government carries commercial insurance. There were no signifi-cant reductions in insurance coverage from the previous year and have been no material settlements in excess of coverage in any of the past three fiscal years.
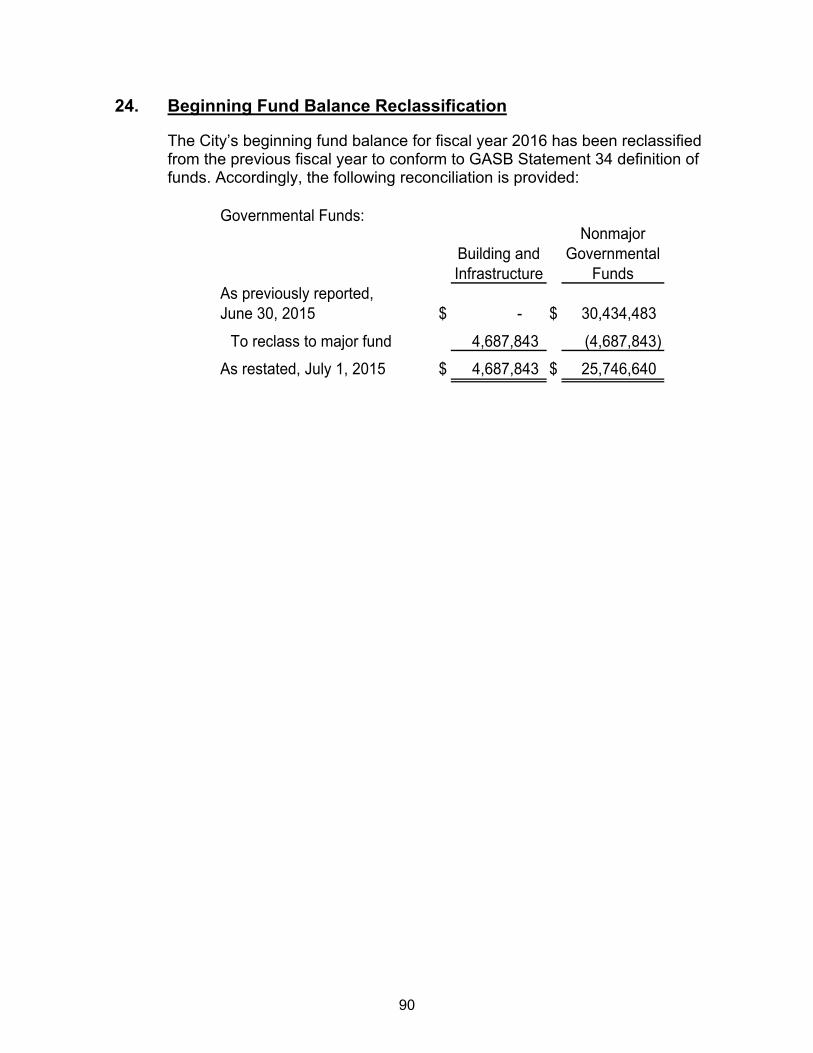
90
24. Beginning Fund Balance Reclassification
The City’s beginning fund balance for fiscal year 2016 has been reclassified from the previous fiscal year to conform to GASB Statement 34 definition of funds. Accordingly, the following reconciliation is provided:
Building and Infrastructure
Nonmajor Governmental
FundsAs previously reported, June 30, 2015 $ - $ 30,434,483
To reclass to major fund 4,687,843 (4,687,843)
As restated, July 1, 2015 $ 4,687,843 $ 25,746,640
Governmental Funds:
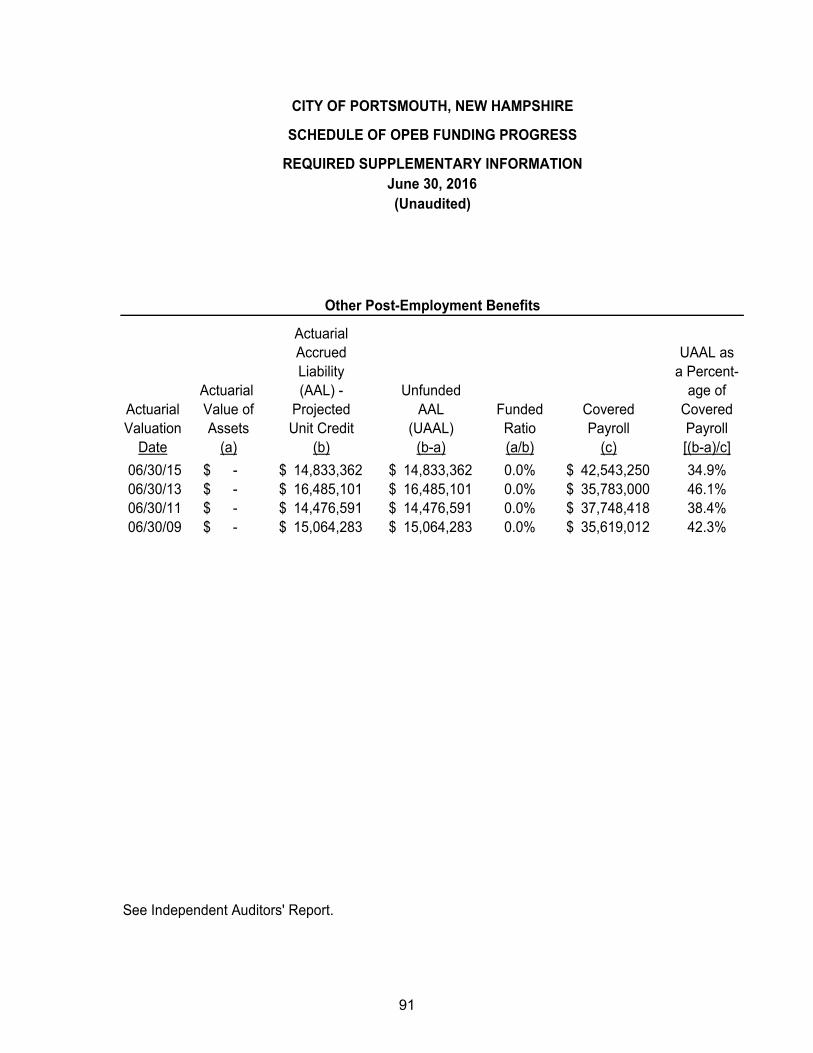
91
ActuarialAccrued UAAL asLiability a Percent-
Actuarial (AAL) - Unfunded age ofActuarial Value of Projected AAL Funded Covered CoveredValuation Assets Unit Credit (UAAL) Ratio Payroll Payroll
Date (a) (b) (b-a) (a/b) (c) [(b-a)/c]
06/30/15 -$ 14,833,362$ 14,833,362$ 0.0% 42,543,250$ 34.9%06/30/13 -$ 16,485,101$ 16,485,101$ 0.0% 35,783,000$ 46.1%06/30/11 -$ 14,476,591$ 14,476,591$ 0.0% 37,748,418$ 38.4%06/30/09 -$ 15,064,283$ 15,064,283$ 0.0% 35,619,012$ 42.3%
See Independent Auditors' Report.
CITY OF PORTSMOUTH, NEW HAMPSHIRE
SCHEDULE OF OPEB FUNDING PROGRESS
REQUIRED SUPPLEMENTARY INFORMATIONJune 30, 2016
Other Post-Employment Benefits
(Unaudited)
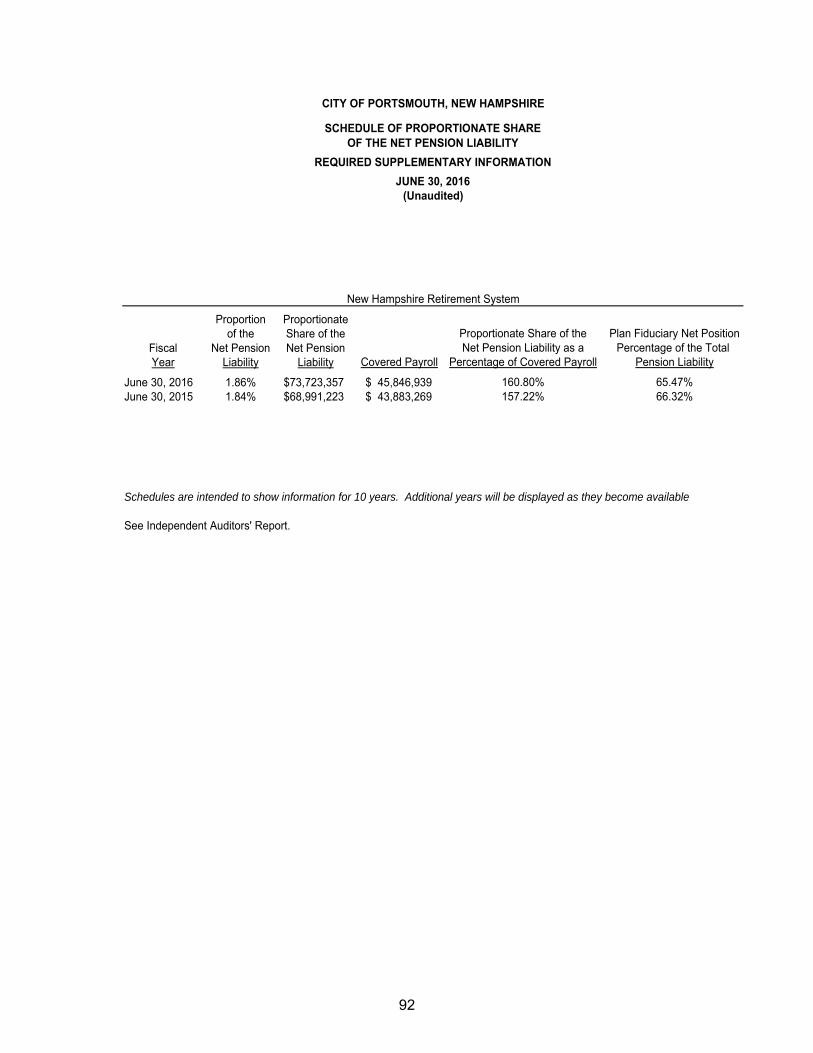
92
Proportion Proportionateof the Share of the
Fiscal Net Pension Net PensionYear Liability Liability
June 30, 2016 1.86% $73,723,357 45,846,939$ June 30, 2015 1.84% $68,991,223 43,883,269$
See Independent Auditors' Report.
Schedules are intended to show information for 10 years. Additional years will be displayed as they become available
Covered Payroll Percentage of Covered Payroll Pension Liability
160.80% 65.47%157.22% 66.32%
Proportionate Share of the Plan Fiduciary Net PositionNet Pension Liability as a Percentage of the Total
New Hampshire Retirement System
CITY OF PORTSMOUTH, NEW HAMPSHIRE
SCHEDULE OF PROPORTIONATE SHAREOF THE NET PENSION LIABILITY
REQUIRED SUPPLEMENTARY INFORMATION
JUNE 30, 2016(Unaudited)

93
Contributions inRelation to the
Contractually Contractually Contribution Contributions asFiscal Required Required Deficiency Covered a Percentage ofYear Contribution Contribution (Excess) Payroll Covered Payroll
June 30, 2016 6,243,379$ 6,243,379$ -$ 45,846,939$ 13.6%June 30, 2015 5,962,925$ 5,962,925$ -$ 43,883,269$ 13.6%
Schedules are intended to show information for 10 years. Additional years will be displayed as they become available
See Independent Auditors' Report.
CITY OF PORTSMOUTH, NEW HAMPSHIRE
SCHEDULE OF PENSION CONTRIBUTIONS
REQUIRED SUPPLEMENTARY INFORMATION
JUNE 30, 2016(Unaudited)
New Hampshire Retirement System

94
(This page intentionally left blank.)

95
Combining Financial Statements
96
NON-MAJOR GOVERNMENTAL FUNDS
SPECIAL REVENUE FUNDS
Special Revenue Funds are established to account for resources obtained and expended for specified purposes and restricted by law or local action. Special Revenue Funds are established for the following purposes: Community Development: to account for the use of Community Development
Block Grant Funds as received from the federal government through the New Hampshire Office of State Planning. Current grants are mainly designed for City of Portsmouth economic development, housing rehabilitation, public service, and public facilities.
School Lunch: to account for local funds and funds received from the federal and state governments to provide lunches at City of Portsmouth schools.
School Categorical Revenues: to account for funds received from the federal and state governments for special programs and projects at City of Portsmouth schools.
Miscellaneous Grants and Contributions: to account for the various other funds of the City designated for specific purposes.
Police Grants: to account for federal and State grants for the Police Department.
Seizure: to account for Federal Equitable Sharing program funds received from seized funds and equipment.
Parking and Transportation: to account for operations of the City’s parking facility, parking enforcement, parking meter operations and parking administration funded by funds generated from these parking activities.
Portwalk Place: to account for public works services, private street maintenance, parking enforcement services and reserve for future repair and maintenance costs of the private street.
Housing Subsidy: to account for housing subsidy grants to provide assistance to first time homebuyers.
Conservation: to account for Land Use Change Tax dedicated for the acquisition or preservation of open space.
Unmet Parking Needs: to account for fees collected for unmet parking needs to be used within the Central Business District for transportation related improve-ments.
Recreation: to account for fees collected for sports and other recreational activities and related expenditures.
97
Swimming Pool: to account for operations of the Portsmouth indoor swimming pool.
Library: to account for certain revenues, including equipment fees and donations and related expenditures incurred in operation of this public library located at 175 Parrott Avenue.
Library Trust: to account for expendable gifts received by the Library.
City Trust: to account for the various expendable portions of the City’s trusts.
CAPITAL PROJECT FUNDS Capital Project Funds are established to account for resources obtained and expended for the acquisition of major capital facilities or equipment other than those employed in the delivery of services accounted for in Enterprise Funds. The current funds were established for the following purposes: School Renovations: to fund Middle School renovation costs.
Transportation Management: to fund transportation management projects.
Transportation State: to account for transportation projects funded both by City and State funds and as where the City manages the project.
Vehicle/Equipment Replacement: to fund purchases of vehicles and equipment.
Technology Equipment: to fund purchases of technology equipment.
PERMANENT FUNDS Permanent Funds are established to account for certain assets held by the City in a fiduciary capacity as trustee. The following is a description of City Permanent Funds: City Trust: to account for various bequests to the City designated for particular
purposes.
Library Trust: to account for nonexpendable gifts received by the library with income restricted for maintenance of the library grounds.
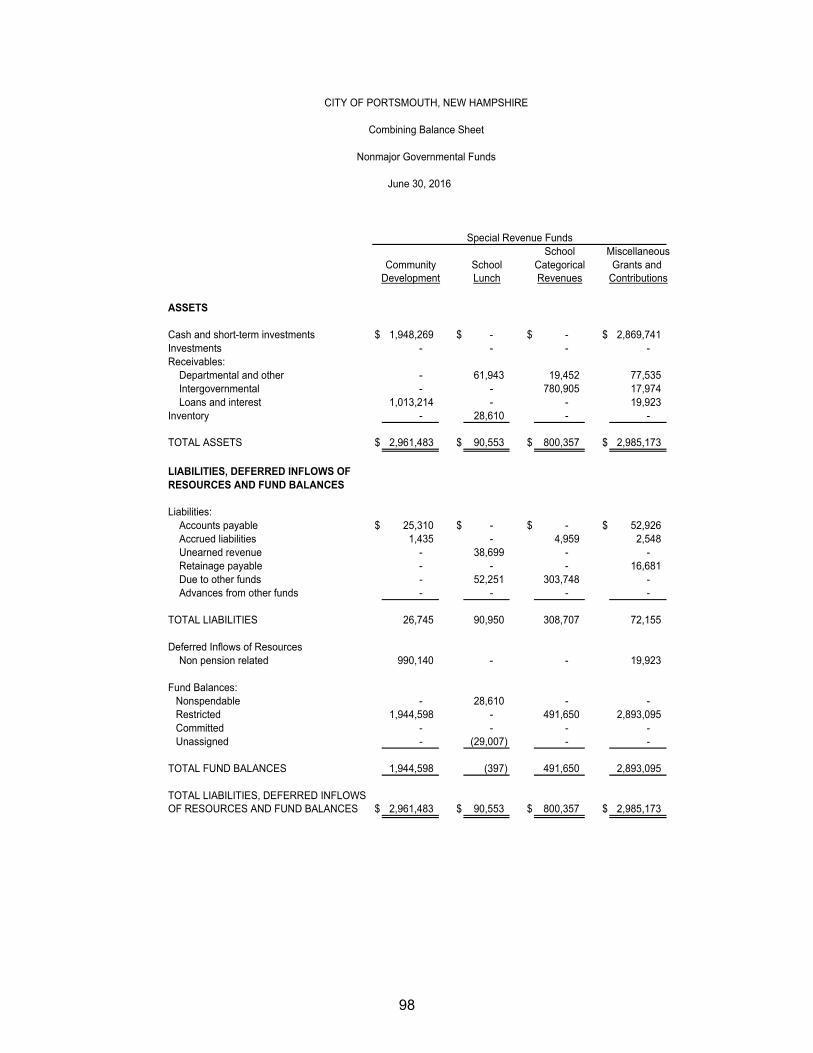
98
School MiscellaneousCommunity School Categorical Grants and
Development Lunch Revenues Contributions
ASSETS
Cash and short-term investments $ 1,948,269 $ - $ - $ 2,869,741 Investments - - - - Receivables:
Departmental and other - 61,943 19,452 77,535 Intergovernmental - - 780,905 17,974 Loans and interest 1,013,214 - - 19,923
Inventory - 28,610 - -
TOTAL ASSETS $ 2,961,483 $ 90,553 $ 800,357 $ 2,985,173
LIABILITIES, DEFERRED INFLOWS OFRESOURCES AND FUND BALANCES
Liabilities:Accounts payable $ 25,310 $ - $ - $ 52,926 Accrued liabilities 1,435 - 4,959 2,548 Unearned revenue - 38,699 - - Retainage payable - - - 16,681 Due to other funds - 52,251 303,748 - Advances from other funds - - - -
TOTAL LIABILITIES 26,745 90,950 308,707 72,155
Deferred Inflows of ResourcesNon pension related 990,140 - - 19,923
Fund Balances:Nonspendable - 28,610 - - Restricted 1,944,598 - 491,650 2,893,095 Committed - - - - Unassigned - (29,007) - -
TOTAL FUND BALANCES 1,944,598 (397) 491,650 2,893,095
TOTAL LIABILITIES, DEFERRED INFLOWSOF RESOURCES AND FUND BALANCES $ 2,961,483 $ 90,553 $ 800,357 $ 2,985,173
Special Revenue Funds
CITY OF PORTSMOUTH, NEW HAMPSHIRE
Combining Balance Sheet
Nonmajor Governmental Funds
June 30, 2016
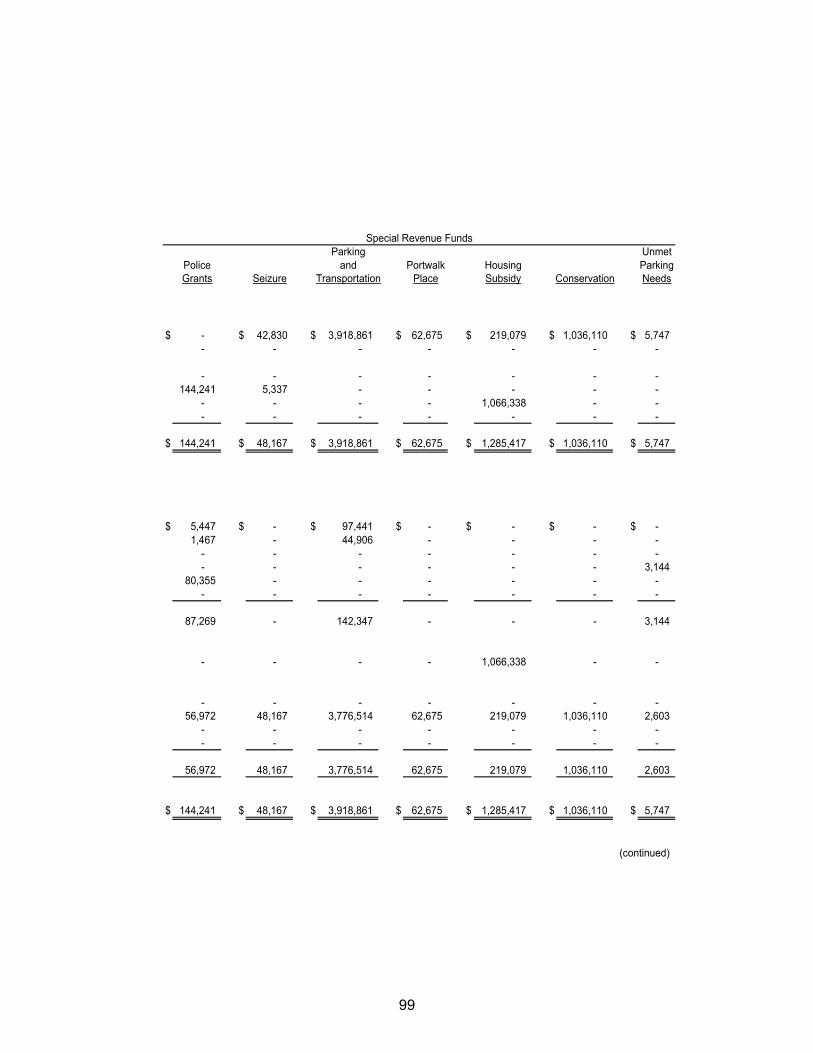
99
Parking UnmetPolice and Portwalk Housing ParkingGrants Seizure Transportation Place Subsidy Conservation Needs
$ - $ 42,830 $ 3,918,861 $ 62,675 $ 219,079 $ 1,036,110 $ 5,747 - - - - - - -
- - - - - - - 144,241 5,337 - - - - -
- - - - 1,066,338 - - - - - - - - -
$ 144,241 $ 48,167 $ 3,918,861 $ 62,675 $ 1,285,417 $ 1,036,110 $ 5,747
$ 5,447 $ - $ 97,441 $ - $ - $ - $ - 1,467 - 44,906 - - - -
- - - - - - - - - - - - - 3,144
80,355 - - - - - - - - - - - - -
87,269 - 142,347 - - - 3,144
- - - - 1,066,338 - -
- - - - - - - 56,972 48,167 3,776,514 62,675 219,079 1,036,110 2,603
- - - - - - - - - - - - - -
56,972 48,167 3,776,514 62,675 219,079 1,036,110 2,603
$ 144,241 $ 48,167 $ 3,918,861 $ 62,675 $ 1,285,417 $ 1,036,110 $ 5,747
(continued)
Special Revenue Funds
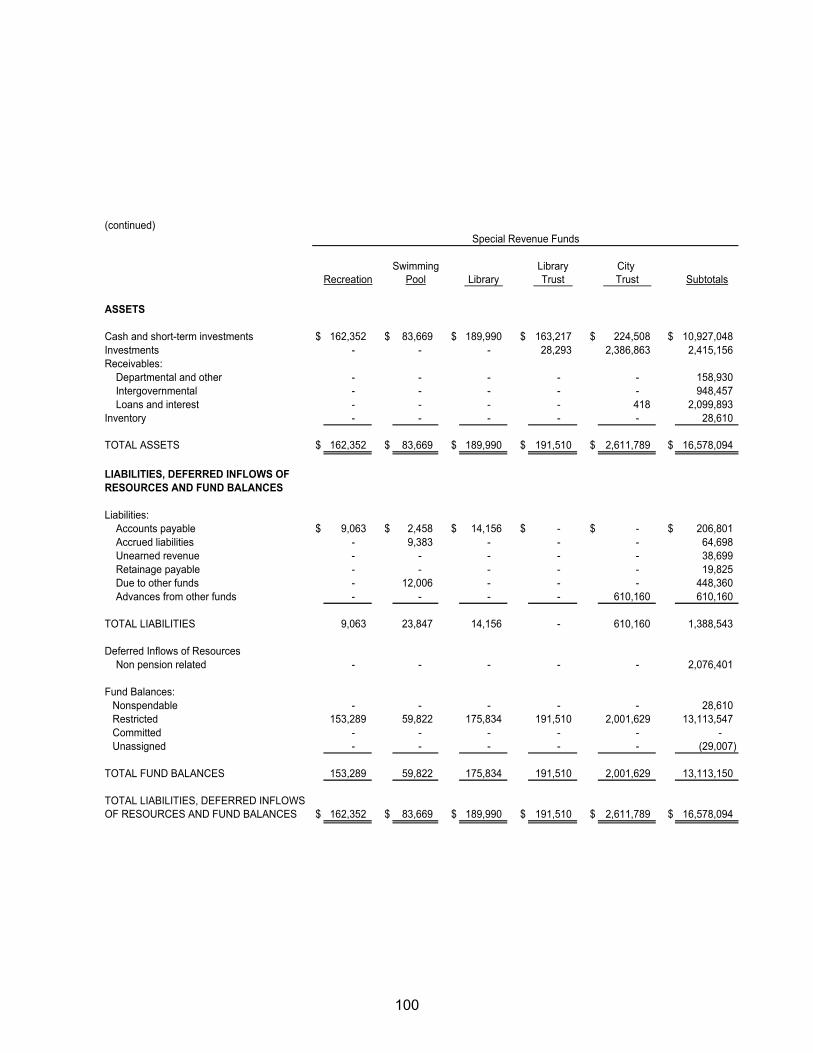
100
(continued)
Swimming Library City Recreation Pool Library Trust Trust Subtotals
ASSETS
Cash and short-term investments $ 162,352 $ 83,669 $ 189,990 $ 163,217 $ 224,508 $ 10,927,048 Investments - - - 28,293 2,386,863 2,415,156 Receivables:
Departmental and other - - - - - 158,930 Intergovernmental - - - - - 948,457 Loans and interest - - - - 418 2,099,893
Inventory - - - - - 28,610
TOTAL ASSETS $ 162,352 $ 83,669 $ 189,990 $ 191,510 $ 2,611,789 $ 16,578,094
LIABILITIES, DEFERRED INFLOWS OFRESOURCES AND FUND BALANCES
Liabilities:Accounts payable $ 9,063 $ 2,458 $ 14,156 $ - $ - $ 206,801 Accrued liabilities - 9,383 - - - 64,698 Unearned revenue - - - - - 38,699 Retainage payable - - - - - 19,825 Due to other funds - 12,006 - - - 448,360 Advances from other funds - - - - 610,160 610,160
TOTAL LIABILITIES 9,063 23,847 14,156 - 610,160 1,388,543
Deferred Inflows of ResourcesNon pension related - - - - - 2,076,401
Fund Balances:Nonspendable - - - - - 28,610 Restricted 153,289 59,822 175,834 191,510 2,001,629 13,113,547 Committed - - - - - - Unassigned - - - - - (29,007)
TOTAL FUND BALANCES 153,289 59,822 175,834 191,510 2,001,629 13,113,150
TOTAL LIABILITIES, DEFERRED INFLOWSOF RESOURCES AND FUND BALANCES $ 162,352 $ 83,669 $ 189,990 $ 191,510 $ 2,611,789 $ 16,578,094
Special Revenue Funds
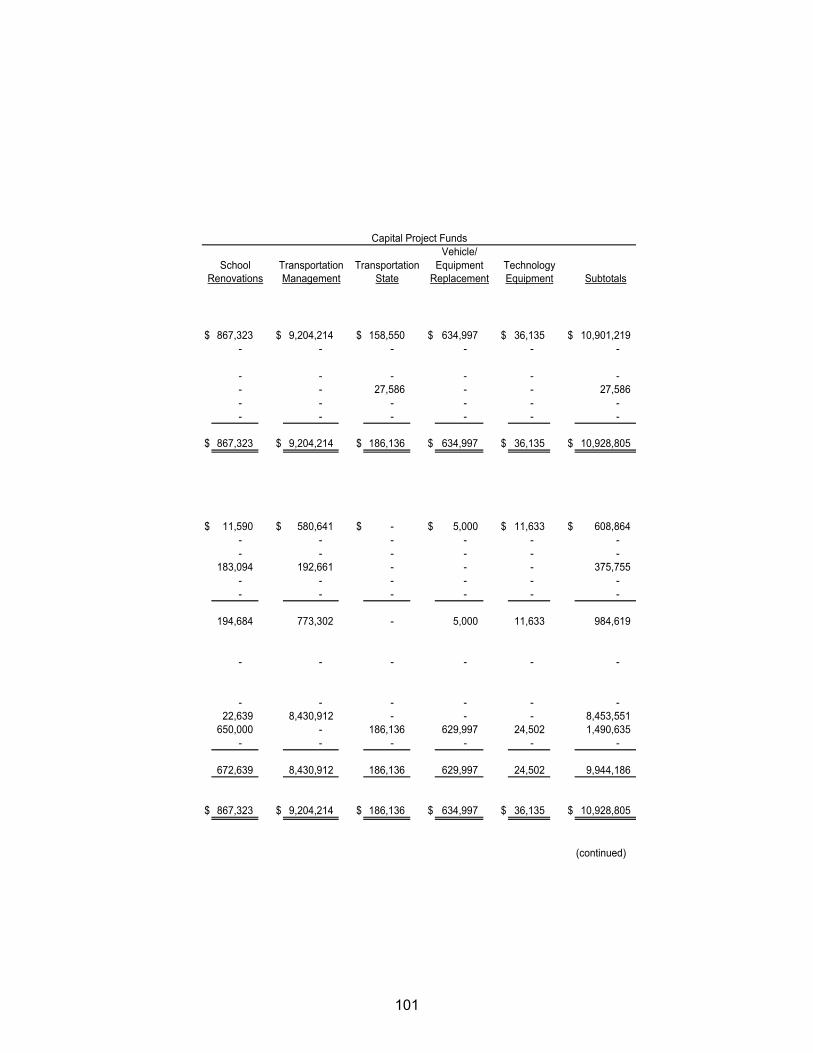
101
Vehicle/School Transportation Transportation Equipment Technology
Renovations Management State Replacement Equipment Subtotals
$ 867,323 $ 9,204,214 $ 158,550 $ 634,997 $ 36,135 $ 10,901,219 - - - - - -
- - - - - - - - 27,586 - - 27,586 - - - - - - - - - - - -
$ 867,323 $ 9,204,214 $ 186,136 $ 634,997 $ 36,135 $ 10,928,805
$ 11,590 $ 580,641 $ - $ 5,000 $ 11,633 $ 608,864 - - - - - - - - - - - -
183,094 192,661 - - - 375,755 - - - - - - - - - - - -
194,684 773,302 - 5,000 11,633 984,619
- - - - - -
- - - - - - 22,639 8,430,912 - - - 8,453,551
650,000 - 186,136 629,997 24,502 1,490,635 - - - - - -
672,639 8,430,912 186,136 629,997 24,502 9,944,186
$ 867,323 $ 9,204,214 $ 186,136 $ 634,997 $ 36,135 $ 10,928,805
(continued)
Capital Project Funds

102
(continued) TotalNonmajor
City Library GovernmentalTrust Trust Subtotals Funds
ASSETS
Cash and short-term investments $ 19,360 $ - $ 19,360 $ 21,847,627 Investments 7,049,894 4,471 7,054,365 9,469,521 Receivables:
Departmental and other - - - 158,930 Intergovernmental - - - 976,043 Loans and interest - - - 2,099,893
Inventory - - - 28,610
TOTAL ASSETS $ 7,069,254 $ 4,471 $ 7,073,725 $ 34,580,624
LIABILITIES, DEFERRED INFLOWS OFRESOURCES AND FUND BALANCES
Liabilities:Accounts payable $ 8,724 $ - $ 8,724 $ 824,389 Accrued liabilities - - - 64,698 Unearned revenue - - - 38,699 Retainage payable - - - 395,580 Due to other funds - - - 448,360 Advances from other funds - - - 610,160
TOTAL LIABILITIES 8,724 - 8,724 2,381,886
Deferred Inflows of ResourcesNon pension related - - - 2,076,401
Fund Balances:Nonspendable 1,629,062 4,000 1,633,062 1,661,672 Restricted 5,431,468 471 5,431,939 26,999,037 Committed - - - 1,490,635 Unassigned - - - (29,007)
TOTAL FUND BALANCES 7,060,530 4,471 7,065,001 30,122,337
TOTAL LIABILITIES, DEFERRED INFLOWSOF RESOURCES AND FUND BALANCES $ 7,069,254 $ 4,471 $ 7,073,725 $ 34,580,624
Permanent Funds

103
(This page intentionally left blank.)
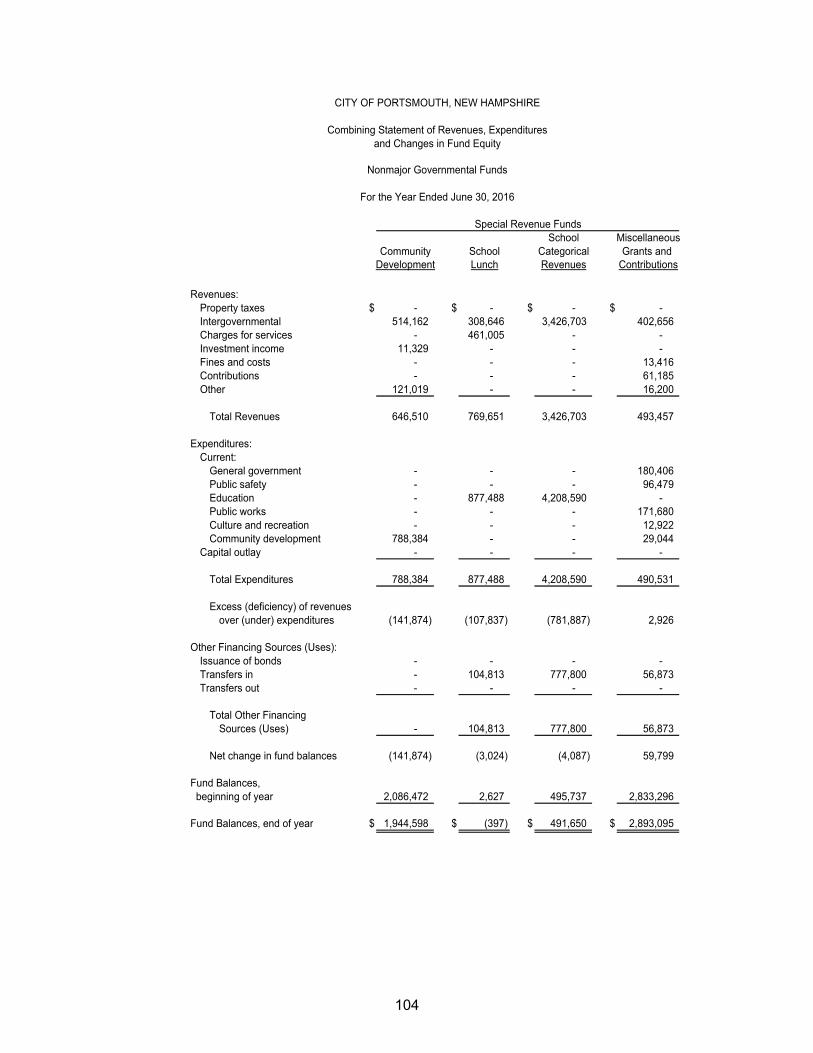
104
School MiscellaneousCommunity School Categorical Grants and
Development Lunch Revenues Contributions
Revenues:
Property taxes $ - $ - $ - $ - Intergovernmental 514,162 308,646 3,426,703 402,656 Charges for services - 461,005 - - Investment income 11,329 - - - Fines and costs - - - 13,416 Contributions - - - 61,185 Other 121,019 - - 16,200
Total Revenues 646,510 769,651 3,426,703 493,457
Expenditures:Current:
General government - - - 180,406 Public safety - - - 96,479 Education - 877,488 4,208,590 - Public works - - - 171,680 Culture and recreation - - - 12,922 Community development 788,384 - - 29,044
Capital outlay - - - -
Total Expenditures 788,384 877,488 4,208,590 490,531
Excess (deficiency) of revenuesover (under) expenditures (141,874) (107,837) (781,887) 2,926
Other Financing Sources (Uses):Issuance of bonds - - - - Transfers in - 104,813 777,800 56,873 Transfers out - - - -
Total Other FinancingSources (Uses) - 104,813 777,800 56,873
Net change in fund balances (141,874) (3,024) (4,087) 59,799
Fund Balances, beginning of year 2,086,472 2,627 495,737 2,833,296
Fund Balances, end of year $ 1,944,598 $ (397) $ 491,650 $ 2,893,095
CITY OF PORTSMOUTH, NEW HAMPSHIRE
Combining Statement of Revenues, Expendituresand Changes in Fund Equity
Nonmajor Governmental Funds
For the Year Ended June 30, 2016
Special Revenue Funds
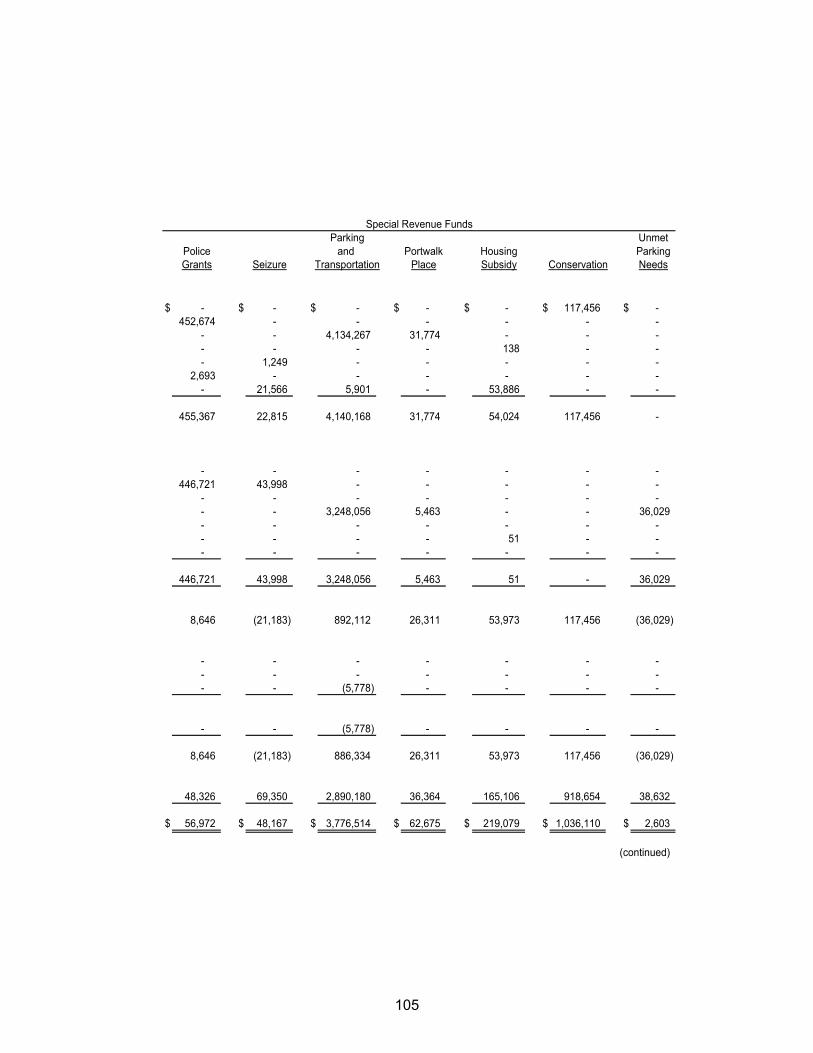
105
Parking UnmetPolice and Portwalk Housing ParkingGrants Seizure Transportation Place Subsidy Conservation Needs
$ - $ - $ - $ - $ - $ 117,456 $ - 452,674 - - - - - -
- - 4,134,267 31,774 - - - - - - - 138 - - - 1,249 - - - - -
2,693 - - - - - - - 21,566 5,901 - 53,886 - -
455,367 22,815 4,140,168 31,774 54,024 117,456 -
- - - - - - - 446,721 43,998 - - - - -
- - - - - - - - - 3,248,056 5,463 - - 36,029 - - - - - - - - - - - 51 - - - - - - - - -
446,721 43,998 3,248,056 5,463 51 - 36,029
8,646 (21,183) 892,112 26,311 53,973 117,456 (36,029)
- - - - - - - - - - - - - - - - (5,778) - - - -
- - (5,778) - - - -
8,646 (21,183) 886,334 26,311 53,973 117,456 (36,029)
48,326 69,350 2,890,180 36,364 165,106 918,654 38,632
$ 56,972 $ 48,167 $ 3,776,514 $ 62,675 $ 219,079 $ 1,036,110 $ 2,603
(continued)
Special Revenue Funds
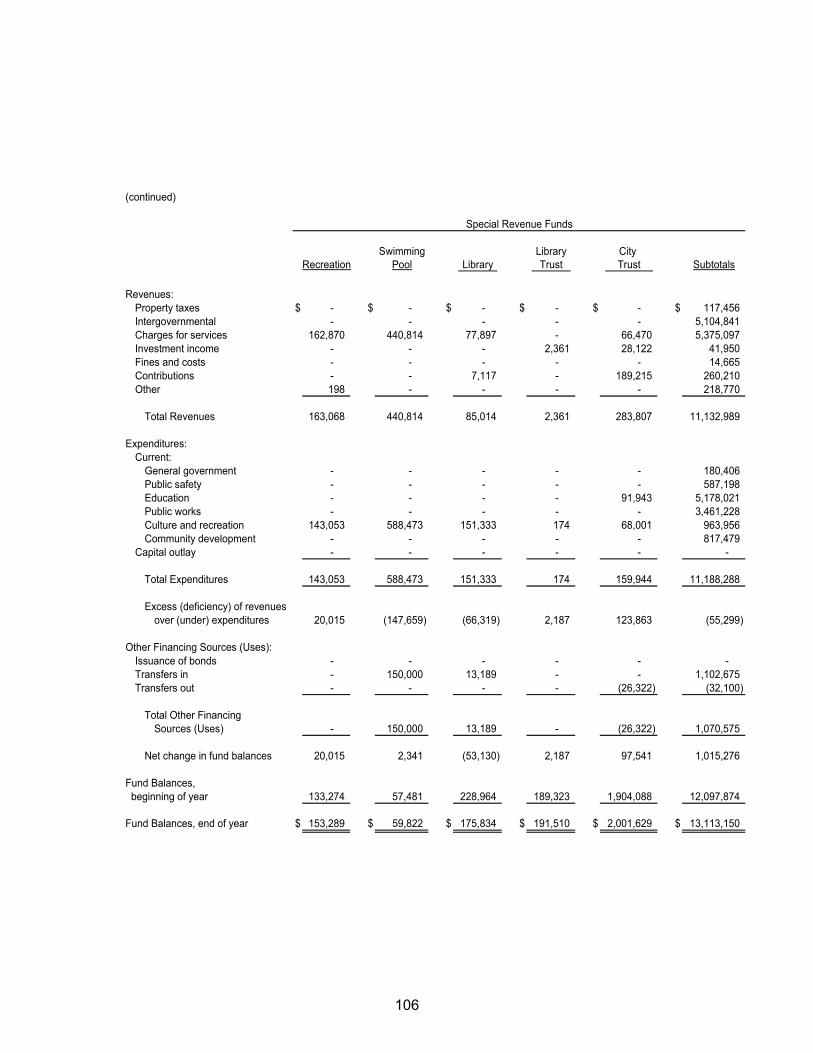
106
(continued)
Swimming Library City Recreation Pool Library Trust Trust Subtotals
Revenues:Property taxes $ - $ - $ - $ - $ - $ 117,456 Intergovernmental - - - - - 5,104,841 Charges for services 162,870 440,814 77,897 - 66,470 5,375,097 Investment income - - - 2,361 28,122 41,950 Fines and costs - - - - - 14,665 Contributions - - 7,117 - 189,215 260,210 Other 198 - - - - 218,770
Total Revenues 163,068 440,814 85,014 2,361 283,807 11,132,989
Expenditures: Current:
General government - - - - - 180,406 Public safety - - - - - 587,198 Education - - - - 91,943 5,178,021 Public works - - - - - 3,461,228 Culture and recreation 143,053 588,473 151,333 174 68,001 963,956 Community development - - - - - 817,479
Capital outlay - - - - - -
Total Expenditures 143,053 588,473 151,333 174 159,944 11,188,288
Excess (deficiency) of revenuesover (under) expenditures 20,015 (147,659) (66,319) 2,187 123,863 (55,299)
Other Financing Sources (Uses):Issuance of bonds - - - - - - Transfers in - 150,000 13,189 - - 1,102,675 Transfers out - - - - (26,322) (32,100)
Total Other FinancingSources (Uses) - 150,000 13,189 - (26,322) 1,070,575
Net change in fund balances 20,015 2,341 (53,130) 2,187 97,541 1,015,276
Fund Balances, beginning of year 133,274 57,481 228,964 189,323 1,904,088 12,097,874
Fund Balances, end of year $ 153,289 $ 59,822 $ 175,834 $ 191,510 $ 2,001,629 $ 13,113,150
Special Revenue Funds
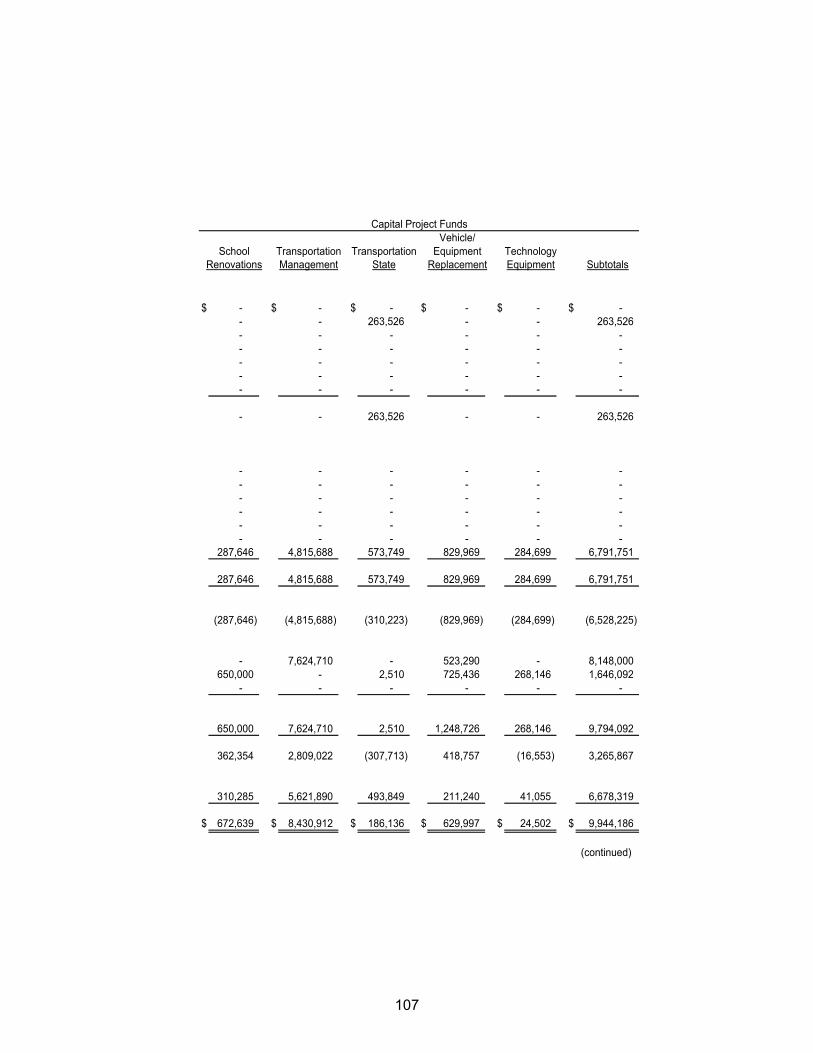
107
School TransportationRenovations Management Subtotals
$ - $ - $ - $ - $ - $ - - - 263,526 - - 263,526 - - - - - - - - - - - - - - - - - - - - - - - - - - - - - -
- - 263,526 - - 263,526
- - - - - - - - - - - - - - - - - - - - - - - - - - - - - - - - - - - -
287,646 4,815,688 573,749 829,969 284,699 6,791,751
287,646 4,815,688 573,749 829,969 284,699 6,791,751
(287,646) (4,815,688) (310,223) (829,969) (284,699) (6,528,225)
- 7,624,710 - 523,290 - 8,148,000 650,000 - 2,510 725,436 268,146 1,646,092
- - - - - -
650,000 7,624,710 2,510 1,248,726 268,146 9,794,092
362,354 2,809,022 (307,713) 418,757 (16,553) 3,265,867
310,285 5,621,890 493,849 211,240 41,055 6,678,319
$ 672,639 $ 8,430,912 $ 186,136 $ 629,997 $ 24,502 $ 9,944,186
(continued)
ReplacementEquipment
Vehicle/Capital Project Funds
TransportationState Equipment
Technology

108
(continued)
TotalNonmajor
City Library GovernmentalTrust Trust Subtotals Funds
Revenues:Property taxes $ - $ - $ - $ 117,456 Intergovernmental - - - 5,368,367 Charges for services - - - 5,375,097 Investment income 311,146 55 311,201 353,151 Fines and costs - - - 14,665 Contributions 27,198 - 27,198 287,408 Other - - - 218,770
Total Revenues 338,344 55 338,399 11,734,914
Expenditures:Current:
General government - - - 180,406 Public safety - - - 587,198 Education 3,732 - 3,732 5,181,753 Public works - - - 3,461,228 Culture and recreation 240,113 - 240,113 1,204,069 Community development - - - 817,479
Capital Outlay - - - 6,791,751
Total Expenditures 243,845 - 243,845 18,223,884
Excess (deficiency) of revenuesover (under) expenditures 94,499 55 94,554 (6,488,970)
Other Financing Sources (Uses):Issuance of bonds - - - 8,148,000 Transfers in - - - 2,748,767 (1)
Transfers out - - - (32,100) (1)
Total Other FinancingSources (Uses) - - - 10,864,667
Net change in fund balances 94,499 55 94,554 4,375,697
Fund Balances, beginning of year 6,966,031 4,416 6,970,447 25,746,640
$ 7,060,530 $ 4,471 $ 7,065,001 $ 30,122,337
(1) Transfers in and out were netted on page 46 to eliminate activity within nonmajor governmental funds.
Fund Balances, end of year
Permanent Funds
109
FIDUCIARY FUNDS
PRIVATE-PURPOSE TRUST FUNDS
Private-Purpose Trust Funds represent contributions used to account for trust arrangements, under which principal and investment income exclusively benefit individuals, private organizations, or other governments.
Park: represents contributions used to compensate local artists performing in Prescott Park Arts Festival and to maintain and provide for upkeep of the Lower State Street Park.
Scholarship: represents contributions used to subsidize education costs for
eligible students.
Worthy Poor: represents contributions to help eligible residents with living costs.
Memorial: represents contributions used to maintain Emerson Hovey Fountain
in Prescott Park, construction of memorial for veterans, and presentation of travel talks for the public.
Commemoration: represents contributions for celebration on Emancipation
Day, tri-centennial celebration in 2076, and to further Japanese-American relations.
AGENCY FUNDS
Agency Funds are established to account for fiduciary assets held by the City in a custodial capacity as an agent on behalf of others.
Claremont Coalition: represents contributions from various local governments in the State of New Hampshire, which are used to pay legal costs related to state-wide property tax issue.
Art Speak: represents contributions from various sources used to fully or partially support artistic and/or cultural activities within the City of Portsmouth.
School: represents primarily student activity funds, which are contributions from students and fundraising receipts used to pay for student-related activities.
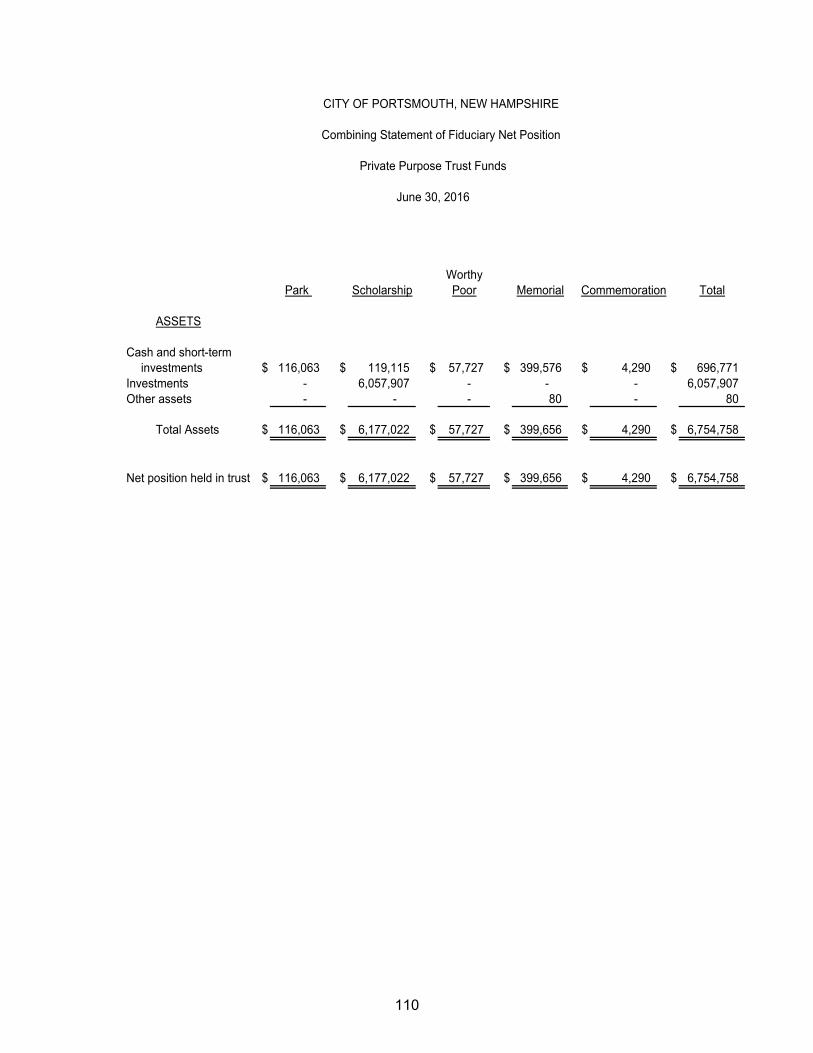
110
WorthyPark Scholarship Poor Memorial Total
ASSETS
Cash and short-term investments $ 116,063 $ 119,115 $ 57,727 $ 399,576 $ 4,290 $ 696,771
Investments - 6,057,907 - - - 6,057,907 Other assets - - - 80 - 80
Total Assets $ 116,063 $ 6,177,022 $ 57,727 $ 399,656 $ 4,290 $ 6,754,758
Net position held in trust $ 116,063 $ 6,177,022 $ 57,727 $ 399,656 $ 4,290 $ 6,754,758
CITY OF PORTSMOUTH, NEW HAMPSHIRE
Combining Statement of Fiduciary Net Position
Private Purpose Trust Funds
June 30, 2016
Commemoration
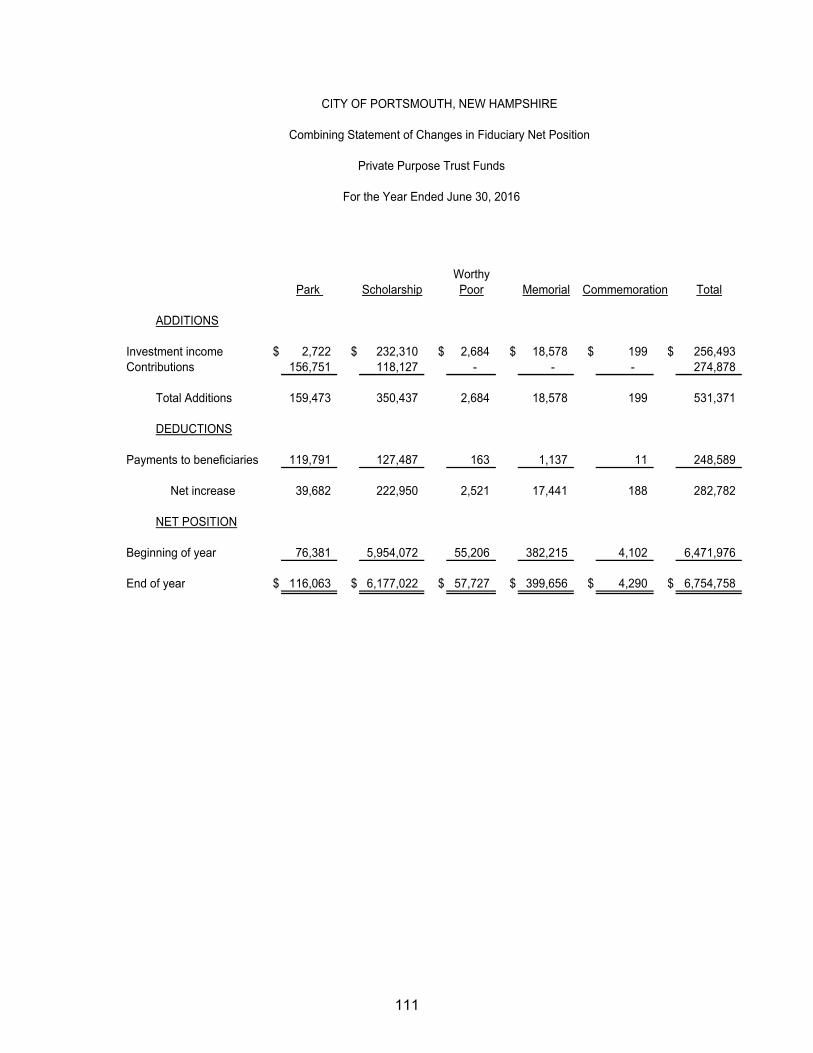
111
WorthyPark Scholarship Poor Memorial Commemoration Total
ADDITIONS
Investment income $ 2,722 $ 232,310 $ 2,684 $ 18,578 $ 199 $ 256,493 Contributions 156,751 118,127 - - - 274,878
Total Additions 159,473 350,437 2,684 18,578 199 531,371
DEDUCTIONS
Payments to beneficiaries 119,791 127,487 163 1,137 11 248,589
Net increase 39,682 222,950 2,521 17,441 188 282,782
NET POSITION
Beginning of year 76,381 5,954,072 55,206 382,215 4,102 6,471,976
End of year $ 116,063 $ 6,177,022 $ 57,727 $ 399,656 $ 4,290 $ 6,754,758
CITY OF PORTSMOUTH, NEW HAMPSHIRE
Combining Statement of Changes in Fiduciary Net Position
Private Purpose Trust Funds
For the Year Ended June 30, 2016
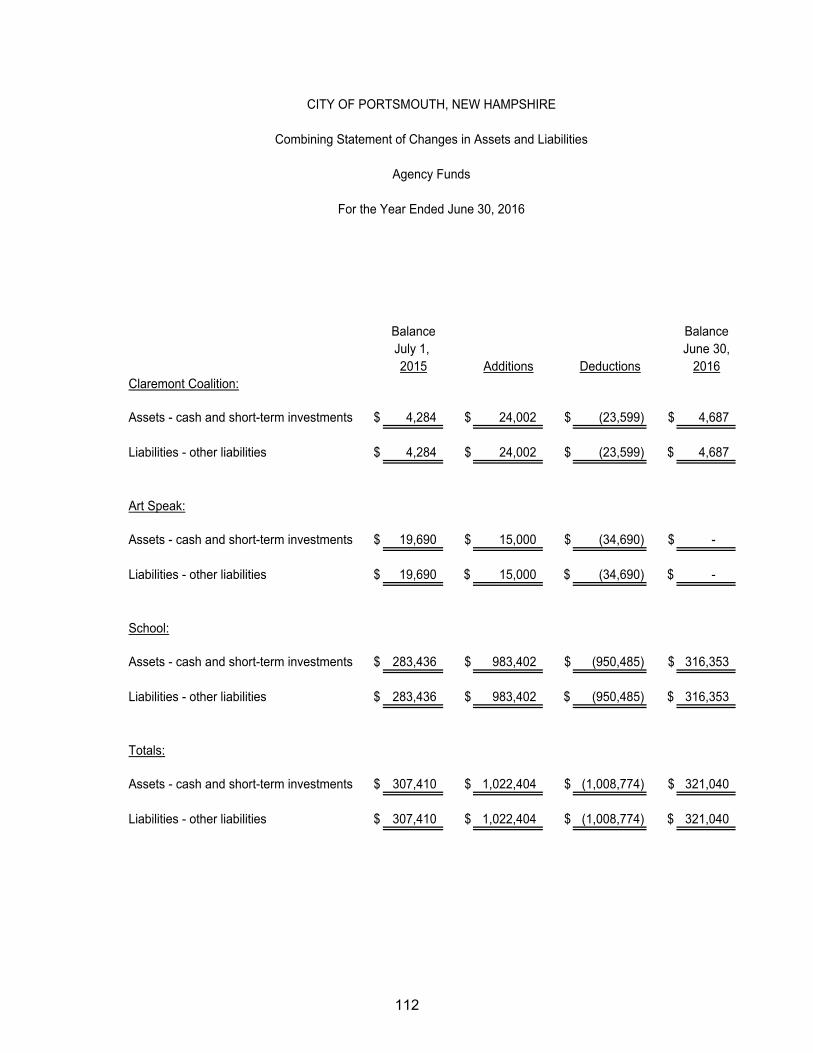
112
Balance BalanceJuly 1, June 30,2015 Additions 2016
Assets - cash and short-term investments $ 4,284 $ 24,002 $ (23,599) $ 4,687
Liabilities - other liabilities $ 4,284 $ 24,002 $ (23,599) $ 4,687
Assets - cash and short-term investments $ 19,690 $ 15,000 $ (34,690) $ -
Liabilities - other liabilities $ 19,690 $ 15,000 $ (34,690) $ -
Assets - cash and short-term investments $ 283,436 $ 983,402 $ (950,485) $ 316,353
Liabilities - other liabilities $ 283,436 $ 983,402 $ (950,485) $ 316,353
Totals:
Assets - cash and short-term investments $ 307,410 $ 1,022,404 $ (1,008,774) $ 321,040
Liabilities - other liabilities $ 307,410 $ 1,022,404 $ (1,008,774) $ 321,040
Claremont Coalition:
School:
CITY OF PORTSMOUTH, NEW HAMPSHIRE
Combining Statement of Changes in Assets and Liabilities
Agency Funds
For the Year Ended June 30, 2016
Art Speak:
Deductions
113
CITY OF PORTSMOUTH, NEW HAMPSHIRE
STATISTICAL SECTION The City of Portsmouth comprehensive annual financial report presents detailed information as a context for understanding what the information in the financial statements, note disclosures, and required supplementary information says about the government’s overall financial health. Page Financial Trends
These schedules contain trend information to help the reader understand how the government’s financial performance and well- being have changed over time. 114 - 118
Revenue Capacity
These schedules contain information to help the reader assess the government’s most significant local revenue source, the property tax. 119 - 125
Debt Capacity
These schedules present information to help the reader assess the affordability of the government’s current levels of outstanding debt and the government’s ability to issue additional debt in the future. 126 - 129
Demographic and Economic Information
These schedules offer demographic and economic indicators to help the reader understand the environment within which the government’s financial activities take place. 130 - 131
Operating Information
These schedules contain service and infrastructure data to help the reader understand how the information in the government’s financial report relates to the service the government provides and the activities it performs. 132 - 134
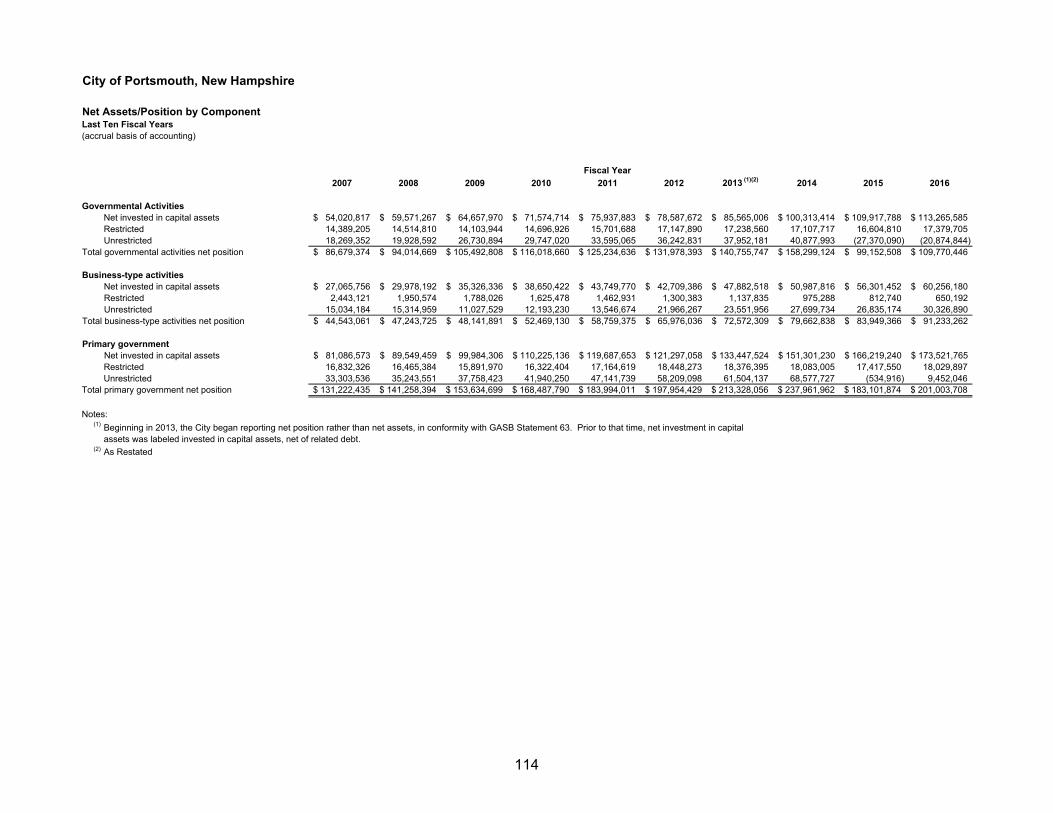
City of Portsmouth, New Hampshire
Net Assets/Position by ComponentLast Ten Fiscal Years (accrual basis of accounting)
2007 2008 2009 2010 2011 2012 2013 (1)(2) 2014 2015 2016
Governmental ActivitiesNet invested in capital assets 54,020,817$ 59,571,267$ 64,657,970$ 71,574,714$ 75,937,883$ 78,587,672$ 85,565,006$ 100,313,414$ 109,917,788$ 113,265,585$ Restricted 14,389,205 14,514,810 14,103,944 14,696,926 15,701,688 17,147,890 17,238,560 17,107,717 16,604,810 17,379,705 Unrestricted 18,269,352 19,928,592 26,730,894 29,747,020 33,595,065 36,242,831 37,952,181 40,877,993 (27,370,090) (20,874,844)
Total governmental activities net position 86,679,374$ 94,014,669$ 105,492,808$ 116,018,660$ 125,234,636$ 131,978,393$ 140,755,747$ 158,299,124$ 99,152,508$ 109,770,446$
Business-type activitiesNet invested in capital assets 27,065,756$ 29,978,192$ 35,326,336$ 38,650,422$ 43,749,770$ 42,709,386$ 47,882,518$ 50,987,816$ 56,301,452$ 60,256,180$ Restricted 2,443,121 1,950,574 1,788,026 1,625,478 1,462,931 1,300,383 1,137,835 975,288 812,740 650,192 Unrestricted 15,034,184 15,314,959 11,027,529 12,193,230 13,546,674 21,966,267 23,551,956 27,699,734 26,835,174 30,326,890
Total business-type activities net position 44,543,061$ 47,243,725$ 48,141,891$ 52,469,130$ 58,759,375$ 65,976,036$ 72,572,309$ 79,662,838$ 83,949,366$ 91,233,262$
Primary governmentNet invested in capital assets 81,086,573$ 89,549,459$ 99,984,306$ 110,225,136$ 119,687,653$ 121,297,058$ 133,447,524$ 151,301,230$ 166,219,240$ 173,521,765$ Restricted 16,832,326 16,465,384 15,891,970 16,322,404 17,164,619 18,448,273 18,376,395 18,083,005 17,417,550 18,029,897 Unrestricted 33,303,536 35,243,551 37,758,423 41,940,250 47,141,739 58,209,098 61,504,137 68,577,727 (534,916) 9,452,046
Total primary government net position 131,222,435$ 141,258,394$ 153,634,699$ 168,487,790$ 183,994,011$ 197,954,429$ 213,328,056$ 237,961,962$ 183,101,874$ 201,003,708$
Notes:(1)
(2) As Restated
Beginning in 2013, the City began reporting net position rather than net assets, in conformity with GASB Statement 63. Prior to that time, net investment in capital assets was labeled invested in capital assets, net of related debt.
Fiscal Year
114
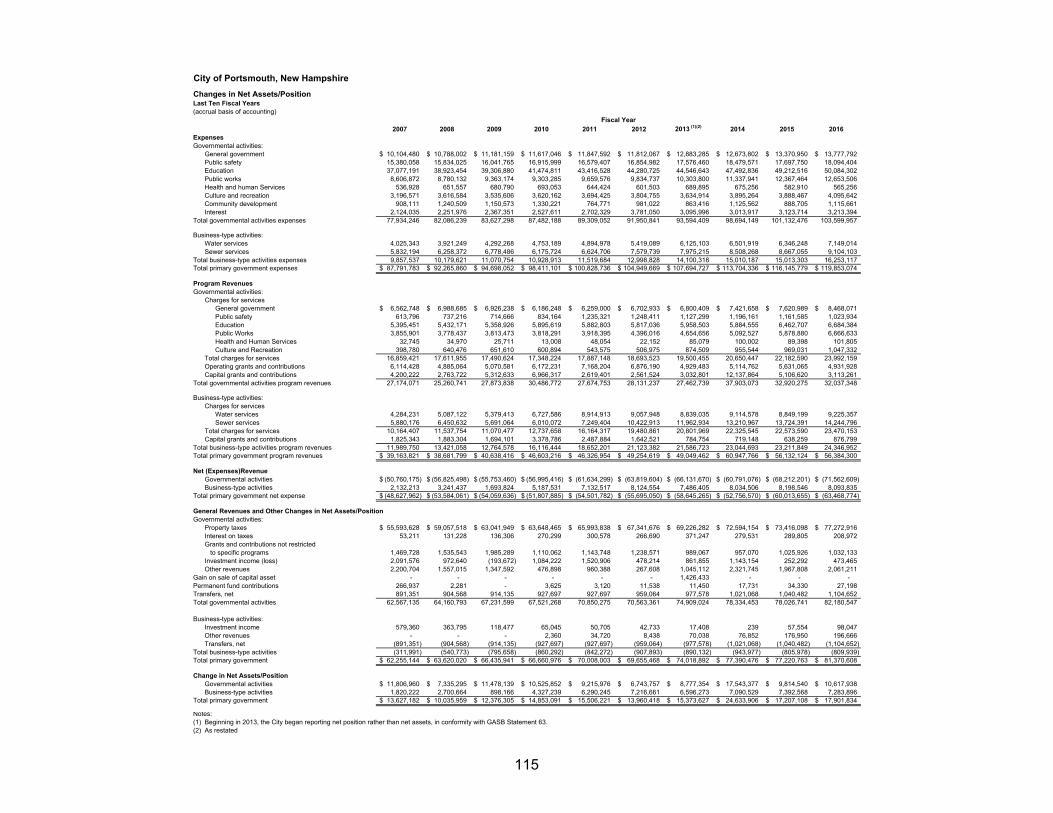
City of Portsmouth, New Hampshire
Changes in Net Assets/PositionLast Ten Fiscal Years (accrual basis of accounting)
2007 2008 2009 2010 2011 2012 2013 (1)(2) 2014 2015 2016ExpensesGovernmental activities:
General government 10,104,480$ 10,788,002$ 11,181,159$ 11,617,046$ 11,847,592$ 11,812,067$ 12,883,285$ 12,673,802$ 13,370,950$ 13,777,792$ Public safety 15,380,058 15,834,025 16,041,765 16,915,999 16,579,407 16,854,982 17,576,460 18,479,571 17,697,750 18,094,404 Education 37,077,191 38,923,454 39,306,880 41,474,811 43,416,528 44,280,725 44,546,643 47,492,836 49,212,516 50,084,302 Public works 8,606,872 8,780,132 9,363,174 9,303,285 9,659,576 9,834,737 10,303,800 11,337,941 12,367,464 12,653,506 Health and human Services 536,928 651,557 680,790 693,053 644,424 601,503 689,895 675,256 582,910 565,256 Culture and recreation 3,196,571 3,616,584 3,535,606 3,620,162 3,694,425 3,804,755 3,634,914 3,895,264 3,888,467 4,095,642 Community development 908,111 1,240,509 1,150,573 1,330,221 764,771 981,022 863,416 1,125,562 888,705 1,115,661 Interest 2,124,035 2,251,976 2,367,351 2,527,611 2,702,329 3,781,050 3,095,996 3,013,917 3,123,714 3,213,394
Total governmental activities expenses 77,934,246 82,086,239 83,627,298 87,482,188 89,309,052 91,950,841 93,594,409 98,694,149 101,132,476 103,599,957
Business-type activities: Water services 4,025,343 3,921,249 4,292,268 4,753,189 4,894,978 5,419,089 6,125,103 6,501,919 6,346,248 7,149,014 Sewer services 5,832,194 6,258,372 6,778,486 6,175,724 6,624,706 7,579,739 7,975,215 8,508,268 8,667,055 9,104,103
Total business-type activities expenses 9,857,537 10,179,621 11,070,754 10,928,913 11,519,684 12,998,828 14,100,318 15,010,187 15,013,303 16,253,117 Total primary government expenses 87,791,783$ 92,265,860$ 94,698,052$ 98,411,101$ 100,828,736$ 104,949,669$ 107,694,727$ 113,704,336$ 116,145,779$ 119,853,074$
Program RevenuesGovernmental activities:
Charges for servicesGeneral government 6,562,748$ 6,988,685$ 6,926,238$ 6,186,248$ 6,259,000$ 6,702,933$ 6,800,409$ 7,421,658$ 7,620,989$ 8,468,071$ Public safety 613,796 737,216 714,666 834,164 1,235,321 1,248,411 1,127,299 1,196,161 1,161,585 1,023,934 Education 5,395,451 5,432,171 5,358,926 5,895,619 5,882,803 5,817,036 5,958,503 5,884,555 6,462,707 6,684,384 Public Works 3,855,901 3,778,437 3,813,473 3,818,291 3,918,395 4,396,016 4,654,656 5,092,527 5,878,880 6,666,633 Health and Human Services 32,745 34,970 25,711 13,008 48,054 22,152 85,079 100,002 89,398 101,805 Culture and Recreation 398,780 640,476 651,610 600,894 543,575 506,975 874,509 955,544 969,031 1,047,332
Total charges for services 16,859,421 17,611,955 17,490,624 17,348,224 17,887,148 18,693,523 19,500,455 20,650,447 22,182,590 23,992,159 Operating grants and contributions 6,114,428 4,885,064 5,070,581 6,172,231 7,168,204 6,876,190 4,929,483 5,114,762 5,631,065 4,931,928 Capital grants and contributions 4,200,222 2,763,722 5,312,633 6,966,317 2,619,401 2,561,524 3,032,801 12,137,864 5,106,620 3,113,261
Total governmental activities program revenues 27,174,071 25,260,741 27,873,838 30,486,772 27,674,753 28,131,237 27,462,739 37,903,073 32,920,275 32,037,348
Business-type activities:Charges for services
Water services 4,284,231 5,087,122 5,379,413 6,727,586 8,914,913 9,057,948 8,839,035 9,114,578 8,849,199 9,225,357 Sewer services 5,880,176 6,450,632 5,691,064 6,010,072 7,249,404 10,422,913 11,962,934 13,210,967 13,724,391 14,244,796
Total charges for services 10,164,407 11,537,754 11,070,477 12,737,658 16,164,317 19,480,861 20,801,969 22,325,545 22,573,590 23,470,153 Capital grants and contributions 1,825,343 1,883,304 1,694,101 3,378,786 2,487,884 1,642,521 784,754 719,148 638,259 876,799
Total business-type activities program revenues 11,989,750 13,421,058 12,764,578 16,116,444 18,652,201 21,123,382 21,586,723 23,044,693 23,211,849 24,346,952 Total primary government program revenues 39,163,821$ 38,681,799$ 40,638,416$ 46,603,216$ 46,326,954$ 49,254,619$ 49,049,462$ 60,947,766$ 56,132,124$ 56,384,300$
Net (Expenses)RevenueGovernmental activities (50,760,175)$ (56,825,498)$ (55,753,460)$ (56,995,416)$ (61,634,299)$ (63,819,604)$ (66,131,670)$ (60,791,076)$ (68,212,201)$ (71,562,609)$ Business-type activities 2,132,213 3,241,437 1,693,824 5,187,531 7,132,517 8,124,554 7,486,405 8,034,506 8,198,546 8,093,835
Total primary government net expense (48,627,962)$ (53,584,061)$ (54,059,636)$ (51,807,885)$ (54,501,782)$ (55,695,050)$ (58,645,265)$ (52,756,570)$ (60,013,655)$ (63,468,774)$
General Revenues and Other Changes in Net Assets/PositionGovernmental activities:
Property taxes 55,593,628$ 59,057,518$ 63,041,949$ 63,648,465$ 65,993,838$ 67,341,676$ 69,226,282$ 72,594,154$ 73,416,098$ 77,272,916$ Interest on taxes 53,211 131,228 136,306 270,299 300,578 266,690 371,247 279,531 289,805 208,972 Grants and contributions not restricted to specific programs 1,469,728 1,535,543 1,985,289 1,110,062 1,143,748 1,238,571 989,067 957,070 1,025,926 1,032,133 Investment income (loss) 2,091,576 972,640 (193,672) 1,084,222 1,520,906 478,214 861,855 1,143,154 252,292 473,465 Other revenues 2,200,704 1,557,015 1,347,592 476,898 960,388 267,608 1,045,112 2,321,745 1,967,808 2,061,211
Gain on sale of capital asset - - - - - - 1,426,433 - - - Permanent fund contributions 266,937 2,281 - 3,625 3,120 11,538 11,450 17,731 34,330 27,198 Transfers, net 891,351 904,568 914,135 927,697 927,697 959,064 977,578 1,021,068 1,040,482 1,104,652 Total governmental activities 62,567,135 64,160,793 67,231,599 67,521,268 70,850,275 70,563,361 74,909,024 78,334,453 78,026,741 82,180,547
Business-type activities:Investment income 579,360 363,795 118,477 65,045 50,705 42,733 17,408 239 57,554 98,047 Other revenues - - - 2,360 34,720 8,438 70,038 76,852 176,950 196,666 Transfers, net (891,351) (904,568) (914,135) (927,697) (927,697) (959,064) (977,578) (1,021,068) (1,040,482) (1,104,652)
Total business-type activities (311,991) (540,773) (795,658) (860,292) (842,272) (907,893) (890,132) (943,977) (805,978) (809,939) Total primary government 62,255,144$ 63,620,020$ 66,435,941$ 66,660,976$ 70,008,003$ 69,655,468$ 74,018,892$ 77,390,476$ 77,220,763$ 81,370,608$
Change in Net Assets/PositionGovernmental activities 11,806,960$ 7,335,295$ 11,478,139$ 10,525,852$ 9,215,976$ 6,743,757$ 8,777,354$ 17,543,377$ 9,814,540$ 10,617,938$ Business-type activities 1,820,222 2,700,664 898,166 4,327,239 6,290,245 7,216,661 6,596,273 7,090,529 7,392,568 7,283,896
Total primary government 13,627,182$ 10,035,959$ 12,376,305$ 14,853,091$ 15,506,221$ 13,960,418$ 15,373,627$ 24,633,906$ 17,207,108$ 17,901,834$
Notes:(1) Beginning in 2013, the City began reporting net position rather than net assets, in conformity with GASB Statement 63.(2) As restated
Fiscal Year
115
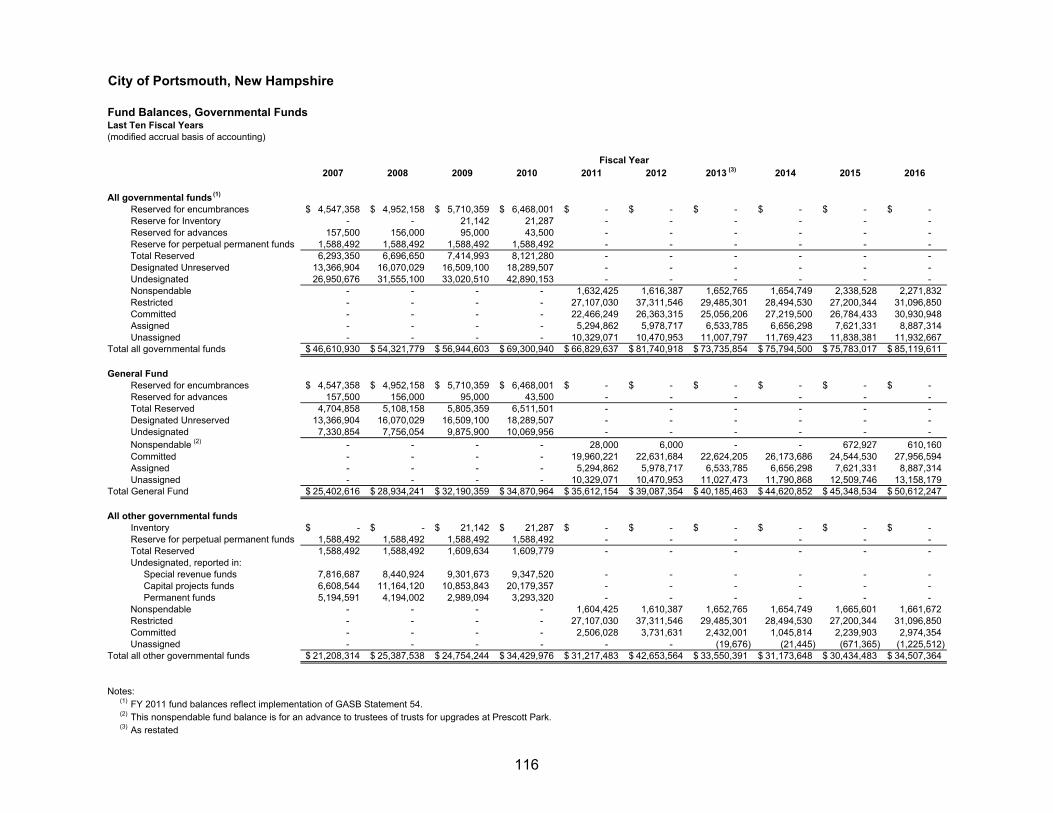
City of Portsmouth, New Hampshire
Fund Balances, Governmental FundsLast Ten Fiscal Years(modified accrual basis of accounting)
2007 2008 2009 2010 2011 2012 2013 (3) 2014 2015 2016
All governmental funds (1)
Reserved for encumbrances 4,547,358$ 4,952,158$ 5,710,359$ 6,468,001$ -$ -$ -$ -$ -$ -$ Reserve for Inventory - - 21,142 21,287 - - - - - - Reserved for advances 157,500 156,000 95,000 43,500 - - - - - - Reserve for perpetual permanent funds 1,588,492 1,588,492 1,588,492 1,588,492 - - - - - - Total Reserved 6,293,350 6,696,650 7,414,993 8,121,280 - - - - - - Designated Unreserved 13,366,904 16,070,029 16,509,100 18,289,507 - - - - - - Undesignated 26,950,676 31,555,100 33,020,510 42,890,153 - - - - - - Nonspendable - - - - 1,632,425 1,616,387 1,652,765 1,654,749 2,338,528 2,271,832 Restricted - - - - 27,107,030 37,311,546 29,485,301 28,494,530 27,200,344 31,096,850 Committed - - - - 22,466,249 26,363,315 25,056,206 27,219,500 26,784,433 30,930,948 Assigned - - - - 5,294,862 5,978,717 6,533,785 6,656,298 7,621,331 8,887,314 Unassigned - - - - 10,329,071 10,470,953 11,007,797 11,769,423 11,838,381 11,932,667
Total all governmental funds 46,610,930$ 54,321,779$ 56,944,603$ 69,300,940$ 66,829,637$ 81,740,918$ 73,735,854$ 75,794,500$ 75,783,017$ 85,119,611$
General FundReserved for encumbrances 4,547,358$ 4,952,158$ 5,710,359$ 6,468,001$ -$ -$ -$ -$ -$ -$ Reserved for advances 157,500 156,000 95,000 43,500 - - - - - - Total Reserved 4,704,858 5,108,158 5,805,359 6,511,501 - - - - - - Designated Unreserved 13,366,904 16,070,029 16,509,100 18,289,507 - - - - - - Undesignated 7,330,854 7,756,054 9,875,900 10,069,956 - - - - - - Nonspendable (2) - - - - 28,000 6,000 - - 672,927 610,160 Committed - - - - 19,960,221 22,631,684 22,624,205 26,173,686 24,544,530 27,956,594 Assigned - - - - 5,294,862 5,978,717 6,533,785 6,656,298 7,621,331 8,887,314 Unassigned - - - - 10,329,071 10,470,953 11,027,473 11,790,868 12,509,746 13,158,179
Total General Fund 25,402,616$ 28,934,241$ 32,190,359$ 34,870,964$ 35,612,154$ 39,087,354$ 40,185,463$ 44,620,852$ 45,348,534$ 50,612,247$
All other governmental fundsInventory -$ -$ 21,142$ 21,287$ -$ -$ -$ -$ -$ -$ Reserve for perpetual permanent funds 1,588,492 1,588,492 1,588,492 1,588,492 - - - - - - Total Reserved 1,588,492 1,588,492 1,609,634 1,609,779 - - - - - - Undesignated, reported in: Special revenue funds 7,816,687 8,440,924 9,301,673 9,347,520 - - - - - - Capital projects funds 6,608,544 11,164,120 10,853,843 20,179,357 - - - - - - Permanent funds 5,194,591 4,194,002 2,989,094 3,293,320 - - - - - - Nonspendable - - - - 1,604,425 1,610,387 1,652,765 1,654,749 1,665,601 1,661,672 Restricted - - - - 27,107,030 37,311,546 29,485,301 28,494,530 27,200,344 31,096,850 Committed - - - - 2,506,028 3,731,631 2,432,001 1,045,814 2,239,903 2,974,354 Unassigned - - - - - - (19,676) (21,445) (671,365) (1,225,512)
Total all other governmental funds 21,208,314$ 25,387,538$ 24,754,244$ 34,429,976$ 31,217,483$ 42,653,564$ 33,550,391$ 31,173,648$ 30,434,483$ 34,507,364$
Notes:(1) FY 2011 fund balances reflect implementation of GASB Statement 54.(2) This nonspendable fund balance is for an advance to trustees of trusts for upgrades at Prescott Park.(3) As restated
Fiscal Year
116
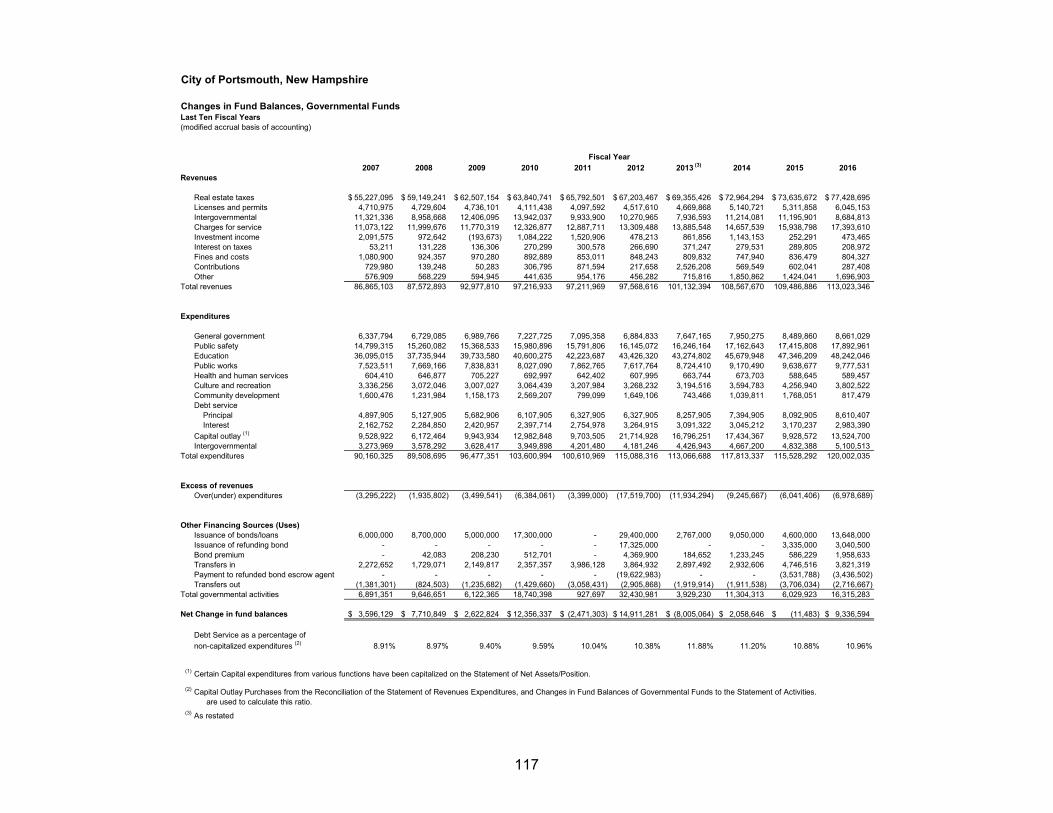
City of Portsmouth, New Hampshire
Changes in Fund Balances, Governmental FundsLast Ten Fiscal Years(modified accrual basis of accounting)
2007 2008 2009 2010 2011 2012 2013 (3) 2014 2015 2016Revenues
Real estate taxes 55,227,095$ 59,149,241$ 62,507,154$ 63,840,741$ 65,792,501$ 67,203,467$ 69,355,426$ 72,964,294$ 73,635,672$ 77,428,695$ Licenses and permits 4,710,975 4,729,604 4,736,101 4,111,438 4,097,592 4,517,610 4,669,868 5,140,721 5,311,858 6,045,153 Intergovernmental 11,321,336 8,958,668 12,406,095 13,942,037 9,933,900 10,270,965 7,936,593 11,214,081 11,195,901 8,684,813 Charges for service 11,073,122 11,999,676 11,770,319 12,326,877 12,887,711 13,309,488 13,885,548 14,657,539 15,938,798 17,393,610 Investment income 2,091,575 972,642 (193,673) 1,084,222 1,520,906 478,213 861,856 1,143,153 252,291 473,465 Interest on taxes 53,211 131,228 136,306 270,299 300,578 266,690 371,247 279,531 289,805 208,972 Fines and costs 1,080,900 924,357 970,280 892,889 853,011 848,243 809,832 747,940 836,479 804,327 Contributions 729,980 139,248 50,283 306,795 871,594 217,658 2,526,208 569,549 602,041 287,408 Other 576,909 568,229 594,945 441,635 954,176 456,282 715,816 1,850,862 1,424,041 1,696,903
Total revenues 86,865,103 87,572,893 92,977,810 97,216,933 97,211,969 97,568,616 101,132,394 108,567,670 109,486,886 113,023,346
Expenditures
General government 6,337,794 6,729,085 6,989,766 7,227,725 7,095,358 6,884,833 7,647,165 7,950,275 8,489,860 8,661,029 Public safety 14,799,315 15,260,082 15,368,533 15,980,896 15,791,806 16,145,072 16,246,164 17,162,643 17,415,808 17,892,961 Education 36,095,015 37,735,944 39,733,580 40,600,275 42,223,687 43,426,320 43,274,802 45,679,948 47,346,209 48,242,046 Public works 7,523,511 7,669,166 7,838,831 8,027,090 7,862,765 7,617,764 8,724,410 9,170,490 9,638,677 9,777,531 Health and human services 604,410 646,877 705,227 692,997 642,402 607,995 663,744 673,703 588,645 589,457 Culture and recreation 3,336,256 3,072,046 3,007,027 3,064,439 3,207,984 3,268,232 3,194,516 3,594,783 4,256,940 3,802,522 Community development 1,600,476 1,231,984 1,158,173 2,569,207 799,099 1,649,106 743,466 1,039,811 1,768,051 817,479 Debt service Principal 4,897,905 5,127,905 5,682,906 6,107,905 6,327,905 6,327,905 8,257,905 7,394,905 8,092,905 8,610,407 Interest 2,162,752 2,284,850 2,420,957 2,397,714 2,754,978 3,264,915 3,091,322 3,045,212 3,170,237 2,983,390
Capital outlay (1) 9,528,922 6,172,464 9,943,934 12,982,848 9,703,505 21,714,928 16,796,251 17,434,367 9,928,572 13,524,700 Intergovernmental 3,273,969 3,578,292 3,628,417 3,949,898 4,201,480 4,181,246 4,426,943 4,667,200 4,832,388 5,100,513
Total expenditures 90,160,325 89,508,695 96,477,351 103,600,994 100,610,969 115,088,316 113,066,688 117,813,337 115,528,292 120,002,035
Excess of revenuesOver(under) expenditures (3,295,222) (1,935,802) (3,499,541) (6,384,061) (3,399,000) (17,519,700) (11,934,294) (9,245,667) (6,041,406) (6,978,689)
Other Financing Sources (Uses)Issuance of bonds/loans 6,000,000 8,700,000 5,000,000 17,300,000 - 29,400,000 2,767,000 9,050,000 4,600,000 13,648,000 Issuance of refunding bond - - - - - 17,325,000 - - 3,335,000 3,040,500 Bond premium - 42,083 208,230 512,701 - 4,369,900 184,652 1,233,245 586,229 1,958,633 Transfers in 2,272,652 1,729,071 2,149,817 2,357,357 3,986,128 3,864,932 2,897,492 2,932,606 4,746,516 3,821,319 Payment to refunded bond escrow agent - - - - - (19,622,983) - - (3,531,788) (3,436,502) Transfers out (1,381,301) (824,503) (1,235,682) (1,429,660) (3,058,431) (2,905,868) (1,919,914) (1,911,538) (3,706,034) (2,716,667)
Total governmental activities 6,891,351 9,646,651 6,122,365 18,740,398 927,697 32,430,981 3,929,230 11,304,313 6,029,923 16,315,283
Net Change in fund balances 3,596,129$ 7,710,849$ 2,622,824$ 12,356,337$ (2,471,303)$ 14,911,281$ (8,005,064)$ 2,058,646$ (11,483)$ 9,336,594$
Debt Service as a percentage of
non-capitalized expenditures (2) 8.91% 8.97% 9.40% 9.59% 10.04% 10.38% 11.88% 11.20% 10.88% 10.96%
(1) Certain Capital expenditures from various functions have been capitalized on the Statement of Net Assets/Position.
(2) Capital Outlay Purchases from the Reconciliation of the Statement of Revenues Expenditures, and Changes in Fund Balances of Governmental Funds to the Statement of Activities.are used to calculate this ratio.
(3) As restated
Fiscal Year
117
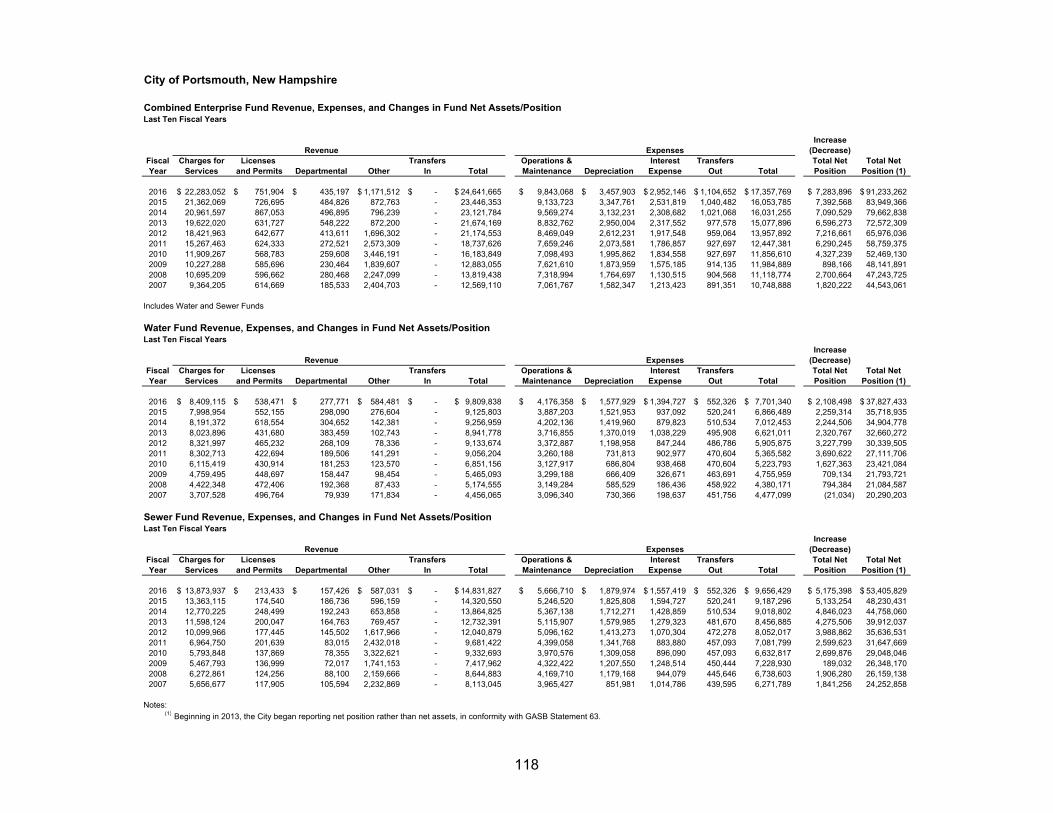
City of Portsmouth, New Hampshire
Combined Enterprise Fund Revenue, Expenses, and Changes in Fund Net Assets/PositionLast Ten Fiscal Years
IncreaseRevenue Expenses (Decrease)
Fiscal Charges for Licenses Transfers Operations & Interest Transfers Total Net Total NetYear Services and Permits Departmental Other In Total Maintenance Depreciation Expense Out Total Position Position (1)
2016 22,283,052$ 751,904$ 435,197$ 1,171,512$ -$ 24,641,665$ 9,843,068$ 3,457,903$ 2,952,146$ 1,104,652$ 17,357,769$ 7,283,896$ 91,233,262$ 2015 21,362,069 726,695 484,826 872,763 - 23,446,353 9,133,723 3,347,761 2,531,819 1,040,482 16,053,785 7,392,568 83,949,366 2014 20,961,597 867,053 496,895 796,239 - 23,121,784 9,569,274 3,132,231 2,308,682 1,021,068 16,031,255 7,090,529 79,662,838 2013 19,622,020 631,727 548,222 872,200 - 21,674,169 8,832,762 2,950,004 2,317,552 977,578 15,077,896 6,596,273 72,572,309 2012 18,421,963 642,677 413,611 1,696,302 - 21,174,553 8,469,049 2,612,231 1,917,548 959,064 13,957,892 7,216,661 65,976,036 2011 15,267,463 624,333 272,521 2,573,309 - 18,737,626 7,659,246 2,073,581 1,786,857 927,697 12,447,381 6,290,245 58,759,375 2010 11,909,267 568,783 259,608 3,446,191 - 16,183,849 7,098,493 1,995,862 1,834,558 927,697 11,856,610 4,327,239 52,469,130 2009 10,227,288 585,696 230,464 1,839,607 - 12,883,055 7,621,610 1,873,959 1,575,185 914,135 11,984,889 898,166 48,141,891 2008 10,695,209 596,662 280,468 2,247,099 - 13,819,438 7,318,994 1,764,697 1,130,515 904,568 11,118,774 2,700,664 47,243,725 2007 9,364,205 614,669 185,533 2,404,703 - 12,569,110 7,061,767 1,582,347 1,213,423 891,351 10,748,888 1,820,222 44,543,061
Includes Water and Sewer Funds
Water Fund Revenue, Expenses, and Changes in Fund Net Assets/PositionLast Ten Fiscal Years
IncreaseRevenue Expenses (Decrease)
Fiscal Charges for Licenses Transfers Operations & Interest Transfers Total Net Total NetYear Services and Permits Departmental Other In Total Maintenance Depreciation Expense Out Total Position Position (1)
2016 8,409,115$ 538,471$ 277,771$ 584,481$ -$ 9,809,838$ 4,176,358$ 1,577,929$ 1,394,727$ 552,326$ 7,701,340$ 2,108,498$ 37,827,433$ 2015 7,998,954 552,155 298,090 276,604 - 9,125,803 3,887,203 1,521,953 937,092 520,241 6,866,489 2,259,314 35,718,935 2014 8,191,372 618,554 304,652 142,381 - 9,256,959 4,202,136 1,419,960 879,823 510,534 7,012,453 2,244,506 34,904,778 2013 8,023,896 431,680 383,459 102,743 - 8,941,778 3,716,855 1,370,019 1,038,229 495,908 6,621,011 2,320,767 32,660,272 2012 8,321,997 465,232 268,109 78,336 - 9,133,674 3,372,887 1,198,958 847,244 486,786 5,905,875 3,227,799 30,339,505 2011 8,302,713 422,694 189,506 141,291 - 9,056,204 3,260,188 731,813 902,977 470,604 5,365,582 3,690,622 27,111,706 2010 6,115,419 430,914 181,253 123,570 - 6,851,156 3,127,917 686,804 938,468 470,604 5,223,793 1,627,363 23,421,084 2009 4,759,495 448,697 158,447 98,454 - 5,465,093 3,299,188 666,409 326,671 463,691 4,755,959 709,134 21,793,721 2008 4,422,348 472,406 192,368 87,433 - 5,174,555 3,149,284 585,529 186,436 458,922 4,380,171 794,384 21,084,587 2007 3,707,528 496,764 79,939 171,834 - 4,456,065 3,096,340 730,366 198,637 451,756 4,477,099 (21,034) 20,290,203
Sewer Fund Revenue, Expenses, and Changes in Fund Net Assets/PositionLast Ten Fiscal Years
IncreaseRevenue Expenses (Decrease)
Fiscal Charges for Licenses Transfers Operations & Interest Transfers Total Net Total NetYear Services and Permits Departmental Other In Total Maintenance Depreciation Expense Out Total Position Position (1)
2016 13,873,937$ 213,433$ 157,426$ 587,031$ -$ 14,831,827$ 5,666,710$ 1,879,974$ 1,557,419$ 552,326$ 9,656,429$ 5,175,398$ 53,405,829$ 2015 13,363,115 174,540 186,736 596,159 - 14,320,550 5,246,520 1,825,808 1,594,727 520,241 9,187,296 5,133,254 48,230,431 2014 12,770,225 248,499 192,243 653,858 - 13,864,825 5,367,138 1,712,271 1,428,859 510,534 9,018,802 4,846,023 44,758,060 2013 11,598,124 200,047 164,763 769,457 - 12,732,391 5,115,907 1,579,985 1,279,323 481,670 8,456,885 4,275,506 39,912,037 2012 10,099,966 177,445 145,502 1,617,966 - 12,040,879 5,096,162 1,413,273 1,070,304 472,278 8,052,017 3,988,862 35,636,531 2011 6,964,750 201,639 83,015 2,432,018 - 9,681,422 4,399,058 1,341,768 883,880 457,093 7,081,799 2,599,623 31,647,669 2010 5,793,848 137,869 78,355 3,322,621 - 9,332,693 3,970,576 1,309,058 896,090 457,093 6,632,817 2,699,876 29,048,046 2009 5,467,793 136,999 72,017 1,741,153 - 7,417,962 4,322,422 1,207,550 1,248,514 450,444 7,228,930 189,032 26,348,170 2008 6,272,861 124,256 88,100 2,159,666 - 8,644,883 4,169,710 1,179,168 944,079 445,646 6,738,603 1,906,280 26,159,138 2007 5,656,677 117,905 105,594 2,232,869 - 8,113,045 3,965,427 851,981 1,014,786 439,595 6,271,789 1,841,256 24,252,858
Notes:(1) Beginning in 2013, the City began reporting net position rather than net assets, in conformity with GASB Statement 63.
118

City of Portsmouth, New Hampshire
General Government Tax Revenues by SourceLast Ten Fiscal Years(modified accrual basis of accounting)
Fiscal Property Payment in Tax InterestYear Taxes Lieu of Tax & Penalties Total
2016 77,191,614$ 119,625$ 208,972$ 77,520,211$ 2015 73,492,844 142,828 289,805 73,925,477 2014 72,721,967 143,413 279,531 73,144,911 2013 69,241,043 114,383 371,247 69,726,673 2012 67,008,930 194,537 266,690 67,470,157 2011 65,639,699 152,802 300,578 66,093,079 2010 63,633,412 207,329 270,299 64,111,040 2009 62,387,310 119,844 136,306 62,643,460 2008 59,000,841 148,400 131,228 59,280,469 2007 54,779,457 125,638 53,211 54,958,306
Data Source:Finance Department Records
119

City of Portsmouth, New Hampshire
Property Tax Levies and CollectionsLast Ten Fiscal Years
Property Tax Balance at Subsequent Balance at endFiscal Levied for Fiscal Year End Tax of CurrentYear Fiscal Year Amount % of Levy of Levy Year Collections Fiscal year Amount % of Levy in Levy Liened % Liened
2016 78,413,113$ 76,816,032$ 98.0% 1,597,081$ -$ 1,597,081$ 76,816,032$ 98.0% 8,536 112 1.3%2015 74,936,960 73,219,903 97.7% 1,717,057 1,432,370 284,687 74,652,272 99.6% 8,559 121 1.4%2014 72,401,876 70,320,311 97.1% 2,081,565 1,896,535 185,031 72,216,845 99.7% 8,540 133 1.6%2013 70,007,505 67,688,563 96.7% 2,318,942 2,278,118 40,823 69,966,681 99.9% 8,522 172 2.0%2012 67,841,808 65,297,485 96.2% 2,544,323 2,543,958 365 67,841,443 100.0% 8,457 208 2.5%2011 67,027,315 64,531,067 96.3% 2,496,248 2,495,881 368 67,026,948 100.0% 8,360 214 2.6%2010 64,141,858 61,788,074 96.3% 2,353,785 2,319,910 33,875 64,107,984 99.9% 8,321 204 2.5%2009 63,263,633 61,011,224 96.4% 2,252,409 2,252,133 276 63,263,357 100.0% 8,299 235 2.8%2008 60,035,344 57,924,795 96.5% 2,110,549 2,110,301 248 60,035,097 100.0% 8,268 151 1.8%2007 57,092,233 55,280,205 96.8% 1,812,027 1,811,785 241 57,091,991 100.0% 8,197 152 1.9%
Data Source:Audited Internal Financial Statements, Property Tax Warrants and Reports of Tax Lien Executions
Tax liens are placed within 60 days after the end of the fiscal year.
Fiscal Year of the Levy Total Collections to DateCollected within the
Number of Parcels
120
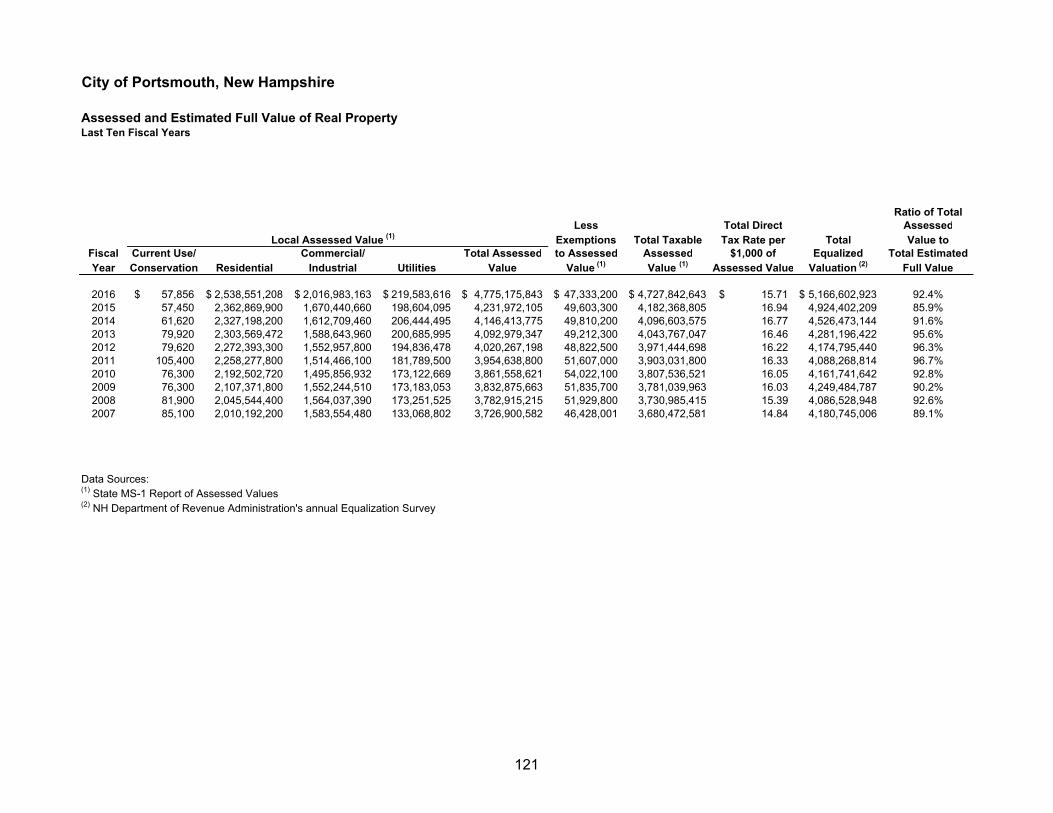
City of Portsmouth, New Hampshire
Assessed and Estimated Full Value of Real PropertyLast Ten Fiscal Years
Ratio of TotalLess Total Direct Assessed
Local Assessed Value (1) Exemptions Total Taxable Tax Rate per Total Value toFiscal Current Use/ Commercial/ Total Assessed to Assessed Assessed $1,000 of Equalized Total EstimatedYear Conservation Residential Industrial Utilities Value Value (1) Value (1) Assessed Value Valuation (2) Full Value
2016 57,856$ 2,538,551,208$ 2,016,983,163$ 219,583,616$ 4,775,175,843$ 47,333,200$ 4,727,842,643$ 15.71$ 5,166,602,923$ 92.4%2015 57,450 2,362,869,900 1,670,440,660 198,604,095 4,231,972,105 49,603,300 4,182,368,805 16.94 4,924,402,209 85.9%2014 61,620 2,327,198,200 1,612,709,460 206,444,495 4,146,413,775 49,810,200 4,096,603,575 16.77 4,526,473,144 91.6%2013 79,920 2,303,569,472 1,588,643,960 200,685,995 4,092,979,347 49,212,300 4,043,767,047 16.46 4,281,196,422 95.6%2012 79,620 2,272,393,300 1,552,957,800 194,836,478 4,020,267,198 48,822,500 3,971,444,698 16.22 4,174,795,440 96.3%2011 105,400 2,258,277,800 1,514,466,100 181,789,500 3,954,638,800 51,607,000 3,903,031,800 16.33 4,088,268,814 96.7%2010 76,300 2,192,502,720 1,495,856,932 173,122,669 3,861,558,621 54,022,100 3,807,536,521 16.05 4,161,741,642 92.8%2009 76,300 2,107,371,800 1,552,244,510 173,183,053 3,832,875,663 51,835,700 3,781,039,963 16.03 4,249,484,787 90.2%2008 81,900 2,045,544,400 1,564,037,390 173,251,525 3,782,915,215 51,929,800 3,730,985,415 15.39 4,086,528,948 92.6%2007 85,100 2,010,192,200 1,583,554,480 133,068,802 3,726,900,582 46,428,001 3,680,472,581 14.84 4,180,745,006 89.1%
Data Sources:(1) State MS-1 Report of Assessed Values(2) NH Department of Revenue Administration's annual Equalization Survey
121
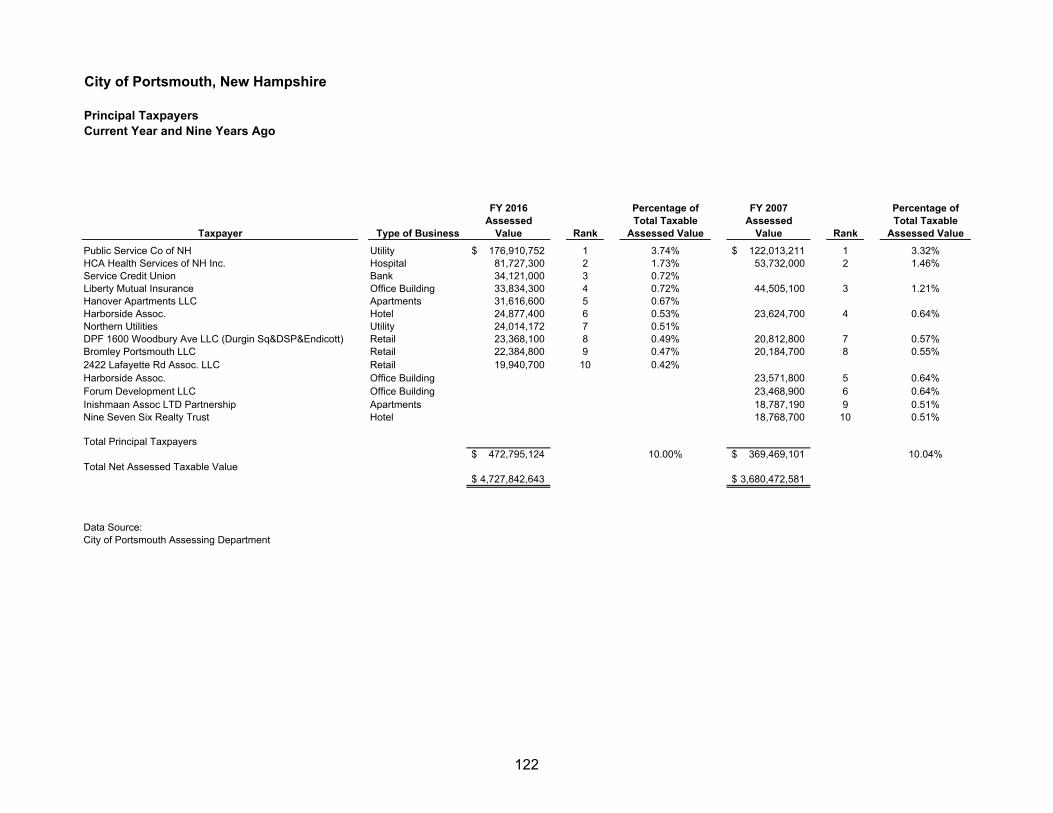
City of Portsmouth, New Hampshire
Principal TaxpayersCurrent Year and Nine Years Ago
FY 2016 Percentage of FY 2007 Percentage ofAssessed Total Taxable Assessed Total Taxable
Taxpayer Type of Business Value Rank Assessed Value Value Rank Assessed Value
Public Service Co of NH Utility 176,910,752$ 1 3.74% 122,013,211$ 1 3.32%HCA Health Services of NH Inc. Hospital 81,727,300 2 1.73% 53,732,000 2 1.46%Service Credit Union Bank 34,121,000 3 0.72%Liberty Mutual Insurance Office Building 33,834,300 4 0.72% 44,505,100 3 1.21%Hanover Apartments LLC Apartments 31,616,600 5 0.67%Harborside Assoc. Hotel 24,877,400 6 0.53% 23,624,700 4 0.64%Northern Utilities Utility 24,014,172 7 0.51%DPF 1600 Woodbury Ave LLC (Durgin Sq&DSP&Endicott) Retail 23,368,100 8 0.49% 20,812,800 7 0.57%Bromley Portsmouth LLC Retail 22,384,800 9 0.47% 20,184,700 8 0.55%2422 Lafayette Rd Assoc. LLC Retail 19,940,700 10 0.42%Harborside Assoc. Office Building 23,571,800 5 0.64%Forum Development LLC Office Building 23,468,900 6 0.64%Inishmaan Assoc LTD Partnership Apartments 18,787,190 9 0.51%Nine Seven Six Realty Trust Hotel 18,768,700 10 0.51%
Total Principal Taxpayers472,795,124$ 10.00% 369,469,101$ 10.04%
Total Net Assessed Taxable Value4,727,842,643$ 3,680,472,581$
Data Source:City of Portsmouth Assessing Department
122
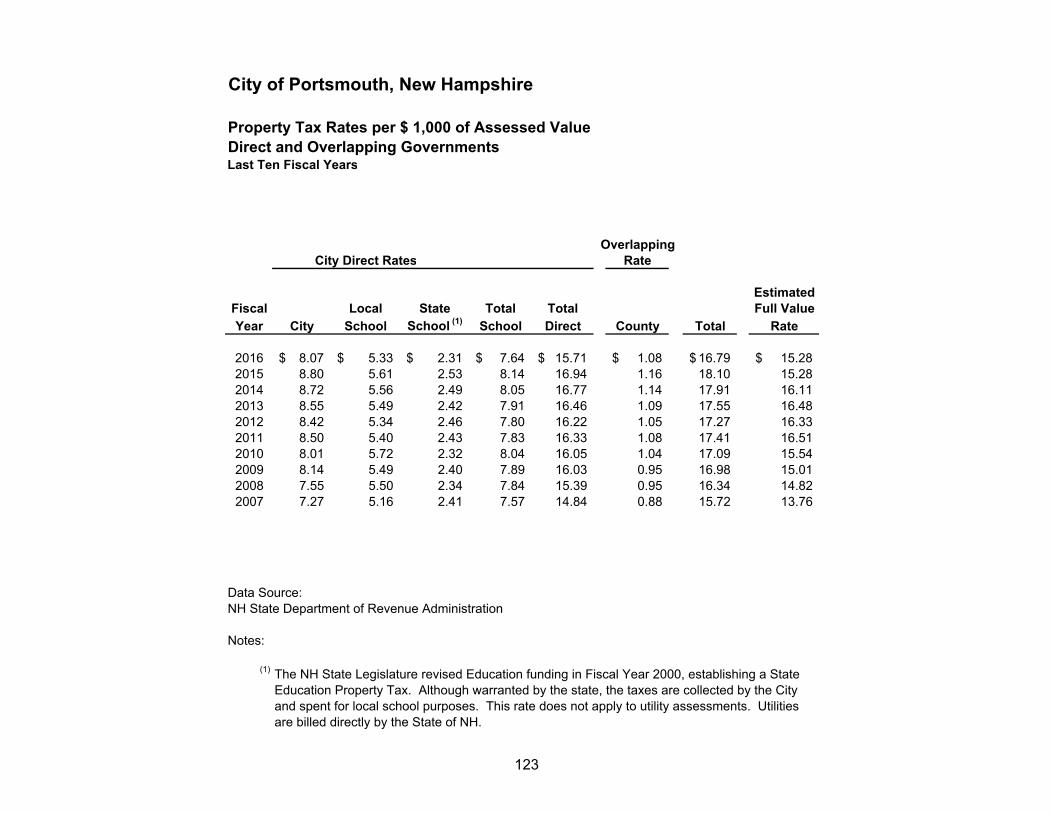
City of Portsmouth, New Hampshire
Property Tax Rates per $ 1,000 of Assessed ValueDirect and Overlapping GovernmentsLast Ten Fiscal Years
OverlappingCity Direct Rates Rate
EstimatedFiscal Local State Total Total Full ValueYear City School School (1) School Direct County Total Rate
2016 8.07$ 5.33$ 2.31$ 7.64$ 15.71$ 1.08$ 16.79$ 15.28$ 2015 8.80 5.61 2.53 8.14 16.94 1.16 18.10 15.28 2014 8.72 5.56 2.49 8.05 16.77 1.14 17.91 16.11 2013 8.55 5.49 2.42 7.91 16.46 1.09 17.55 16.48 2012 8.42 5.34 2.46 7.80 16.22 1.05 17.27 16.33 2011 8.50 5.40 2.43 7.83 16.33 1.08 17.41 16.51 2010 8.01 5.72 2.32 8.04 16.05 1.04 17.09 15.54 2009 8.14 5.49 2.40 7.89 16.03 0.95 16.98 15.01 2008 7.55 5.50 2.34 7.84 15.39 0.95 16.34 14.82 2007 7.27 5.16 2.41 7.57 14.84 0.88 15.72 13.76
Data Source:NH State Department of Revenue Administration
Notes:
(1) The NH State Legislature revised Education funding in Fiscal Year 2000, establishing a State Education Property Tax. Although warranted by the state, the taxes are collected by the City and spent for local school purposes. This rate does not apply to utility assessments. Utilities are billed directly by the State of NH.
123
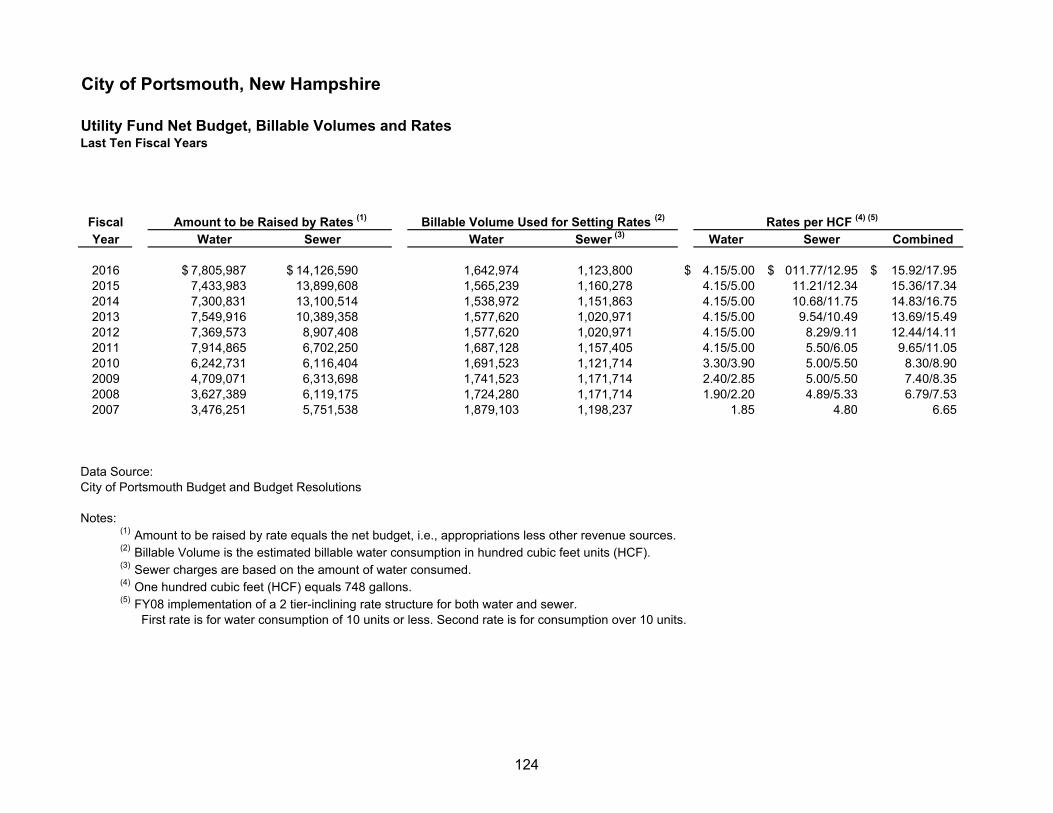
City of Portsmouth, New Hampshire
Utility Fund Net Budget, Billable Volumes and RatesLast Ten Fiscal Years
Fiscal Rates per HCF (4) (5)
Year Water Sewer Water Sewer (3) Water Sewer Combined
2016 7,805,987$ 14,126,590$ 1,642,974 1,123,800 $ 4.15/5.00 $ 011.77/12.95 $ 15.92/17.952015 7,433,983 13,899,608 1,565,239 1,160,278 4.15/5.00 11.21/12.34 15.36/17.342014 7,300,831 13,100,514 1,538,972 1,151,863 4.15/5.00 10.68/11.75 14.83/16.752013 7,549,916 10,389,358 1,577,620 1,020,971 4.15/5.00 9.54/10.49 13.69/15.492012 7,369,573 8,907,408 1,577,620 1,020,971 4.15/5.00 8.29/9.11 12.44/14.112011 7,914,865 6,702,250 1,687,128 1,157,405 4.15/5.00 5.50/6.05 9.65/11.052010 6,242,731 6,116,404 1,691,523 1,121,714 3.30/3.90 5.00/5.50 8.30/8.902009 4,709,071 6,313,698 1,741,523 1,171,714 2.40/2.85 5.00/5.50 7.40/8.352008 3,627,389 6,119,175 1,724,280 1,171,714 1.90/2.20 4.89/5.33 6.79/7.532007 3,476,251 5,751,538 1,879,103 1,198,237 1.85 4.80 6.65
Data Source:City of Portsmouth Budget and Budget Resolutions
Notes:(1) Amount to be raised by rate equals the net budget, i.e., appropriations less other revenue sources.(2) Billable Volume is the estimated billable water consumption in hundred cubic feet units (HCF).(3) Sewer charges are based on the amount of water consumed.(4) One hundred cubic feet (HCF) equals 748 gallons.(5) FY08 implementation of a 2 tier-inclining rate structure for both water and sewer.
First rate is for water consumption of 10 units or less. Second rate is for consumption over 10 units.
Billable Volume Used for Setting Rates (2)Amount to be Raised by Rates (1)
124

City of Portsmouth, New Hampshire
Portsmouth's Share of the Rockingham County Tax ApportionmentLast Ten Fiscal Years(based on percentage of equalized value)
Total Equalized Values Apportionment of County Tax Levy
Add: EqualizationPortsmouth of PILOTS and RR Tax Portsmouth
Tax Base Valuation Less: Equalization of Total Fiscal County Portsmouth's Portsmouth's Share Portsmouth's ShareYear for Debt Limits State Shared Revenues Equalized Valuation Rockingham County Portsmouth's % Year Tax Levy Share (1) $ Change % Change
2015 5,118,914,757$ 47,688,166$ 5,166,602,923$ 46,585,299,985$ 11.0906293% 2016 46,013,873$ 5,100,511$ 268,123$ 5.5%2014 4,871,579,273 52,822,935 4,924,402,208 44,425,117,020 11.0847253% 2015 44,809,156 4,832,388 165,188 3.5%2013 4,481,154,370 45,318,774 4,526,473,144 41,972,510,217 10.7843756% 2014 43,873,563 4,667,200 240,257 5.4%2012 4,238,460,159 42,736,264 4,281,196,423 40,244,948,862 10.6378478% 2013 43,141,885 4,426,943 245,697 5.9%2011 4,129,016,814 45,778,625 4,174,795,439 40,684,633,568 10.2613569% 2012 41,991,666 4,181,246 (20,234) -0.5%2010 4,044,429,991 43,838,823 4,088,268,814 41,057,907,008 9.9573240% 2011 42,232,608 4,201,480 251,582 6.4%2009 4,112,257,420 49,484,222 4,161,741,642 41,833,160,979 9.9484274% 2010 41,779,570 3,949,898 321,481 8.9%2008 4,244,939,572 4,545,215 4,249,484,787 44,948,403,778 9.4541395% 2009 40,037,695 3,628,417 50,125 1.4%2007 4,083,981,593 2,547,355 4,086,528,948 45,092,725,896 9.0625015% 2008 38,778,613 3,578,292 304,323 9.3%2006 4,168,377,073 12,367,933 4,180,745,006 45,307,514,659 9.2274870% 2007 37,666,947 3,273,969 52,942 1.6%
Data Sources:NH Department of Revenue Administration Equalization SurveysCounty Tax WarrantsAdopted Rockingham County Budgets
*Revised due to court settlement
(1) Rockingham County uses the previous year's proportion percentage to calculate City's tax obligation.
125
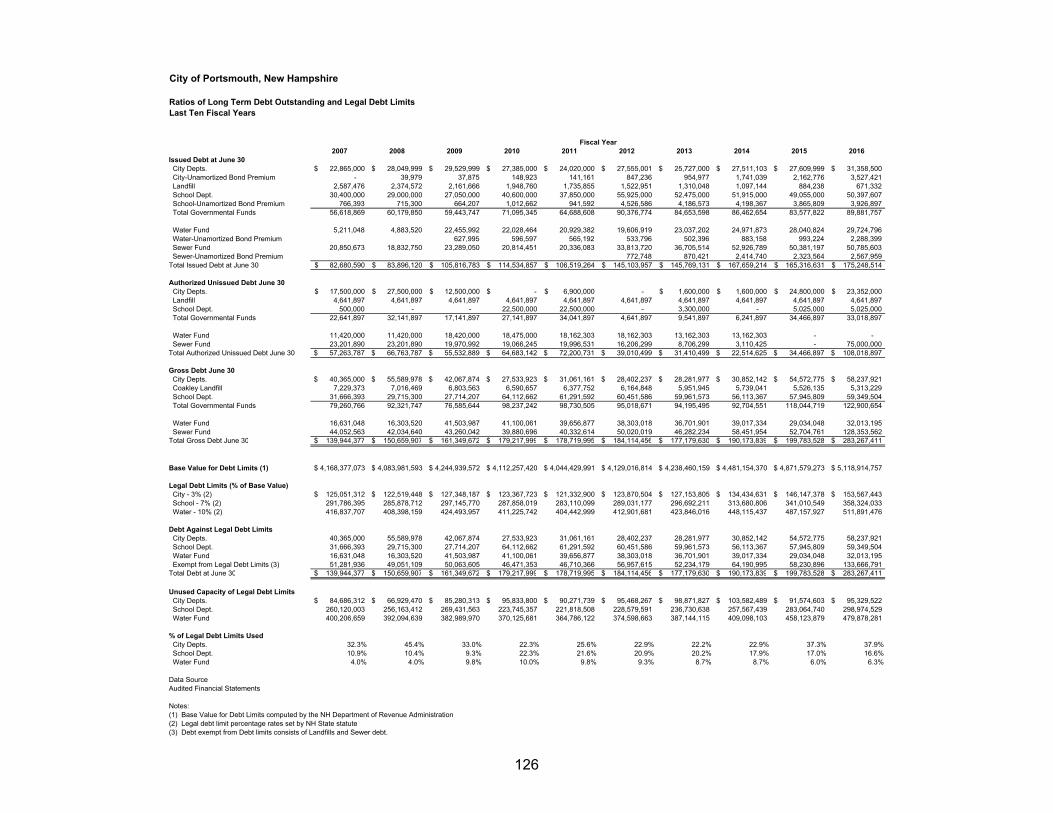
City of Portsmouth, New Hampshire
Ratios of Long Term Debt Outstanding and Legal Debt LimitsLast Ten Fiscal Years
2007 2008 2009 2010 2011 2012 2013 2014 2015 2016Issued Debt at June 30 City Depts. 22,865,000$ 28,049,999$ 29,529,999$ 27,385,000$ 24,020,000$ 27,555,001$ 25,727,000$ 27,511,103$ 27,609,999$ 31,358,500$ City-Unamortized Bond Premium - 39,979 37,875 148,923 141,161 847,236 954,977 1,741,039 2,162,776 3,527,421 Landfill 2,587,476 2,374,572 2,161,666 1,948,760 1,735,855 1,522,951 1,310,048 1,097,144 884,238 671,332 School Dept. 30,400,000 29,000,000 27,050,000 40,600,000 37,850,000 55,925,000 52,475,000 51,915,000 49,055,000 50,397,607 School-Unamortized Bond Premium 766,393 715,300 664,207 1,012,662 941,592 4,526,586 4,186,573 4,198,367 3,865,809 3,926,897 Total Governmental Funds 56,618,869 60,179,850 59,443,747 71,095,345 64,688,608 90,376,774 84,653,598 86,462,654 83,577,822 89,881,757
Water Fund 5,211,048 4,883,520 22,455,992 22,028,464 20,929,382 19,606,919 23,037,202 24,971,873 28,040,824 29,724,796 Water-Unamortized Bond Premium 627,995 596,597 565,192 533,796 502,396 883,158 993,224 2,288,399 Sewer Fund 20,850,673 18,832,750 23,289,050 20,814,451 20,336,083 33,813,720 36,705,514 52,926,789 50,381,197 50,785,603 Sewer-Unamortized Bond Premium 772,748 870,421 2,414,740 2,323,564 2,567,959 Total Issued Debt at June 30 82,680,590$ 83,896,120$ 105,816,783$ 114,534,857$ 106,519,264$ 145,103,957$ 145,769,131$ 167,659,214$ 165,316,631$ 175,248,514$
Authorized Unissued Debt June 30 City Depts. 17,500,000$ 27,500,000$ 12,500,000$ -$ 6,900,000$ - 1,600,000$ 1,600,000$ 24,800,000$ 23,352,000$ Landfill 4,641,897 4,641,897 4,641,897 4,641,897 4,641,897 4,641,897 4,641,897 4,641,897 4,641,897 4,641,897 School Dept. 500,000 - - 22,500,000 22,500,000 - 3,300,000 - 5,025,000 5,025,000 Total Governmental Funds 22,641,897 32,141,897 17,141,897 27,141,897 34,041,897 4,641,897 9,541,897 6,241,897 34,466,897 33,018,897
Water Fund 11,420,000 11,420,000 18,420,000 18,475,000 18,162,303 18,162,303 13,162,303 13,162,303 - - Sewer Fund 23,201,890 23,201,890 19,970,992 19,066,245 19,996,531 16,206,299 8,706,299 3,110,425 - 75,000,000 Total Authorized Unissued Debt June 30 57,263,787$ 66,763,787$ 55,532,889$ 64,683,142$ 72,200,731$ 39,010,499$ 31,410,499$ 22,514,625$ 34,466,897$ 108,018,897$
Gross Debt June 30 City Depts. 40,365,000$ 55,589,978$ 42,067,874$ 27,533,923$ 31,061,161$ 28,402,237$ 28,281,977$ 30,852,142$ 54,572,775$ 58,237,921$ Coakley Landfill 7,229,373 7,016,469 6,803,563 6,590,657 6,377,752 6,164,848 5,951,945 5,739,041 5,526,135 5,313,229 School Dept. 31,666,393 29,715,300 27,714,207 64,112,662 61,291,592 60,451,586 59,961,573 56,113,367 57,945,809 59,349,504 Total Governmental Funds 79,260,766 92,321,747 76,585,644 98,237,242 98,730,505 95,018,671 94,195,495 92,704,551 118,044,719 122,900,654
Water Fund 16,631,048 16,303,520 41,503,987 41,100,061 39,656,877 38,303,018 36,701,901 39,017,334 29,034,048 32,013,195 Sewer Fund 44,052,563 42,034,640 43,260,042 39,880,696 40,332,614 50,020,019 46,282,234 58,451,954 52,704,761 128,353,562 Total Gross Debt June 30 139,944,377$ 150,659,907$ 161,349,672$ 179,217,999$ 178,719,995$ 184,114,456$ 177,179,630$ 190,173,839$ 199,783,528$ 283,267,411$
Base Value for Debt Limits (1) 4,168,377,073$ 4,083,981,593$ 4,244,939,572$ 4,112,257,420$ 4,044,429,991$ 4,129,016,814$ 4,238,460,159$ 4,481,154,370$ 4,871,579,273$ 5,118,914,757$
Legal Debt Limits (% of Base Value) City - 3% (2) 125,051,312$ 122,519,448$ 127,348,187$ 123,367,723$ 121,332,900$ 123,870,504$ 127,153,805$ 134,434,631$ 146,147,378$ 153,567,443$ School - 7% (2) 291,786,395 285,878,712 297,145,770 287,858,019 283,110,099 289,031,177 296,692,211 313,680,806 341,010,549 358,324,033 Water - 10% (2) 416,837,707 408,398,159 424,493,957 411,225,742 404,442,999 412,901,681 423,846,016 448,115,437 487,157,927 511,891,476
Debt Against Legal Debt Limits City Depts. 40,365,000 55,589,978 42,067,874 27,533,923 31,061,161 28,402,237 28,281,977 30,852,142 54,572,775 58,237,921 School Dept. 31,666,393 29,715,300 27,714,207 64,112,662 61,291,592 60,451,586 59,961,573 56,113,367 57,945,809 59,349,504 Water Fund 16,631,048 16,303,520 41,503,987 41,100,061 39,656,877 38,303,018 36,701,901 39,017,334 29,034,048 32,013,195 Exempt from Legal Debt Limits (3) 51,281,936 49,051,109 50,063,605 46,471,353 46,710,366 56,957,615 52,234,179 64,190,995 58,230,896 133,666,791 Total Debt at June 30 139,944,377$ 150,659,907$ 161,349,672$ 179,217,999$ 178,719,995$ 184,114,456$ 177,179,630$ 190,173,839$ 199,783,528$ 283,267,411$
Unused Capacity of Legal Debt Limits City Depts. 84,686,312$ 66,929,470$ 85,280,313$ 95,833,800$ 90,271,739$ 95,468,267$ 98,871,827$ 103,582,489$ 91,574,603$ 95,329,522$ School Dept. 260,120,003 256,163,412 269,431,563 223,745,357 221,818,508 228,579,591 236,730,638 257,567,439 283,064,740 298,974,529 Water Fund 400,206,659 392,094,639 382,989,970 370,125,681 364,786,122 374,598,663 387,144,115 409,098,103 458,123,879 479,878,281
% of Legal Debt Limits Used City Depts. 32.3% 45.4% 33.0% 22.3% 25.6% 22.9% 22.2% 22.9% 37.3% 37.9% School Dept. 10.9% 10.4% 9.3% 22.3% 21.6% 20.9% 20.2% 17.9% 17.0% 16.6% Water Fund 4.0% 4.0% 9.8% 10.0% 9.8% 9.3% 8.7% 8.7% 6.0% 6.3%
Data SourceAudited Financial Statements
Notes:(1) Base Value for Debt Limits computed by the NH Department of Revenue Administration(2) Legal debt limit percentage rates set by NH State statute(3) Debt exempt from Debt limits consists of Landfills and Sewer debt.
Fiscal Year
126
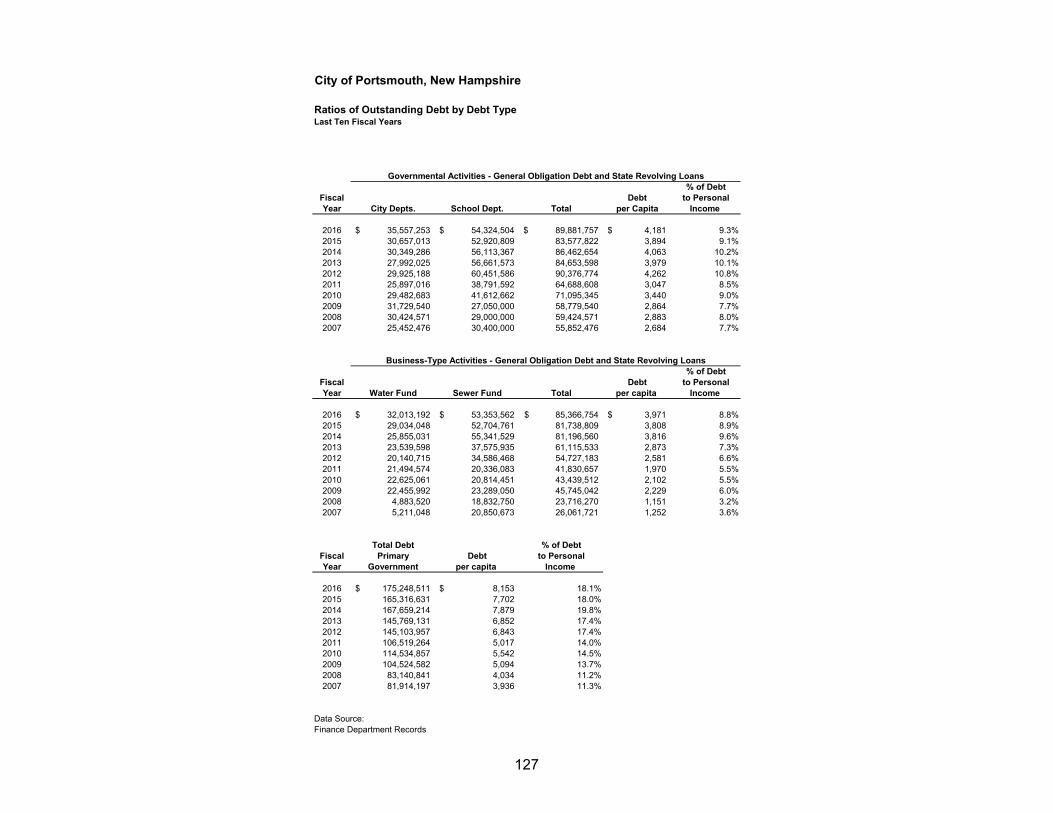
City of Portsmouth, New Hampshire
Ratios of Outstanding Debt by Debt TypeLast Ten Fiscal Years
% of DebtFiscal Debt to PersonalYear City Depts. School Dept. Total per Capita Income
2016 35,557,253$ 54,324,504$ 89,881,757$ 4,181$ 9.3%2015 30,657,013 52,920,809 83,577,822 3,894 9.1%2014 30,349,286 56,113,367 86,462,654 4,063 10.2%2013 27,992,025 56,661,573 84,653,598 3,979 10.1%2012 29,925,188 60,451,586 90,376,774 4,262 10.8%2011 25,897,016 38,791,592 64,688,608 3,047 8.5%2010 29,482,683 41,612,662 71,095,345 3,440 9.0%2009 31,729,540 27,050,000 58,779,540 2,864 7.7%2008 30,424,571 29,000,000 59,424,571 2,883 8.0%2007 25,452,476 30,400,000 55,852,476 2,684 7.7%
% of DebtFiscal Debt to PersonalYear Water Fund Sewer Fund Total per capita Income
2016 32,013,192$ 53,353,562$ 85,366,754$ 3,971$ 8.8%2015 29,034,048 52,704,761 81,738,809 3,808 8.9%2014 25,855,031 55,341,529 81,196,560 3,816 9.6%2013 23,539,598 37,575,935 61,115,533 2,873 7.3%2012 20,140,715 34,586,468 54,727,183 2,581 6.6%2011 21,494,574 20,336,083 41,830,657 1,970 5.5%2010 22,625,061 20,814,451 43,439,512 2,102 5.5%2009 22,455,992 23,289,050 45,745,042 2,229 6.0%2008 4,883,520 18,832,750 23,716,270 1,151 3.2%2007 5,211,048 20,850,673 26,061,721 1,252 3.6%
Total Debt % of DebtFiscal Primary Debt to PersonalYear Government per capita Income
2016 175,248,511$ 8,153$ 18.1%2015 165,316,631 7,702 18.0%2014 167,659,214 7,879 19.8%2013 145,769,131 6,852 17.4%2012 145,103,957 6,843 17.4%2011 106,519,264 5,017 14.0%2010 114,534,857 5,542 14.5%2009 104,524,582 5,094 13.7%2008 83,140,841 4,034 11.2%2007 81,914,197 3,936 11.3%
Data Source:Finance Department Records
Governmental Activities - General Obligation Debt and State Revolving Loans
Business-Type Activities - General Obligation Debt and State Revolving Loans
127
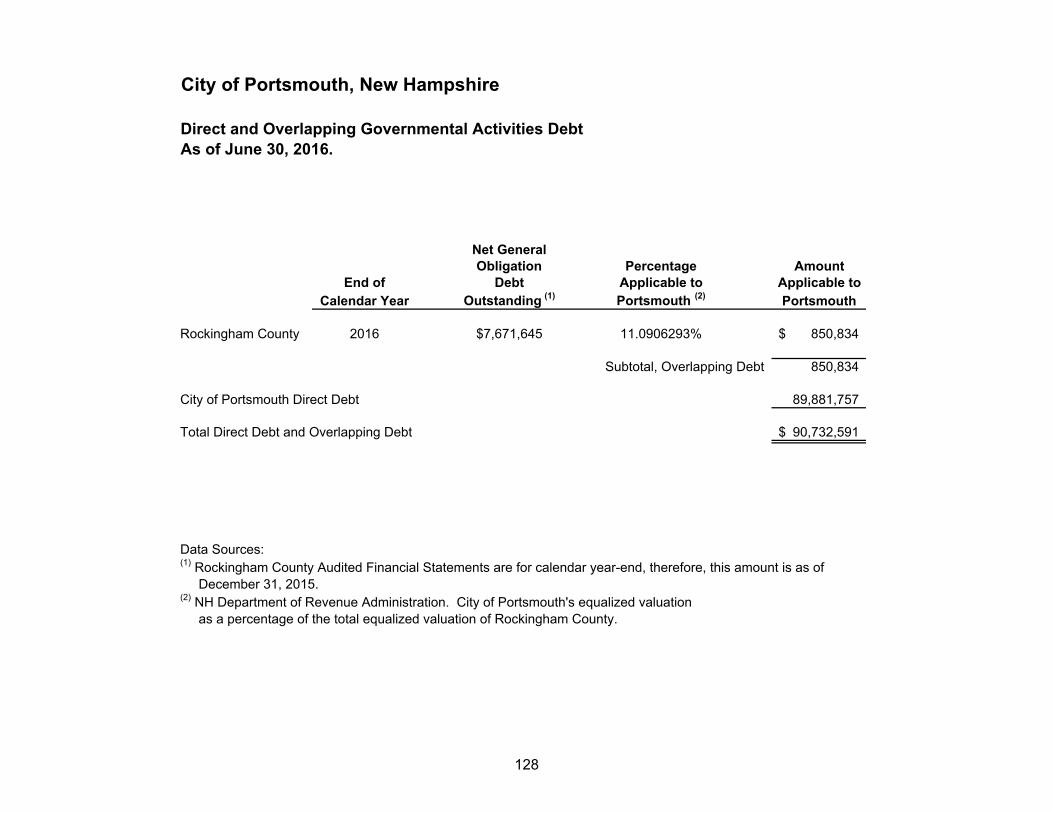
City of Portsmouth, New Hampshire
Direct and Overlapping Governmental Activities DebtAs of June 30, 2016.
Net GeneralObligation Percentage Amount
End of Debt Applicable to Applicable toCalendar Year Outstanding (1) Portsmouth (2) Portsmouth
Rockingham County 2016 $7,671,645 11.0906293% 850,834$
Subtotal, Overlapping Debt 850,834
City of Portsmouth Direct Debt 89,881,757
Total Direct Debt and Overlapping Debt 90,732,591$
Data Sources:(1) Rockingham County Audited Financial Statements are for calendar year-end, therefore, this amount is as of December 31, 2015.(2) NH Department of Revenue Administration. City of Portsmouth's equalized valuation as a percentage of the total equalized valuation of Rockingham County.
128
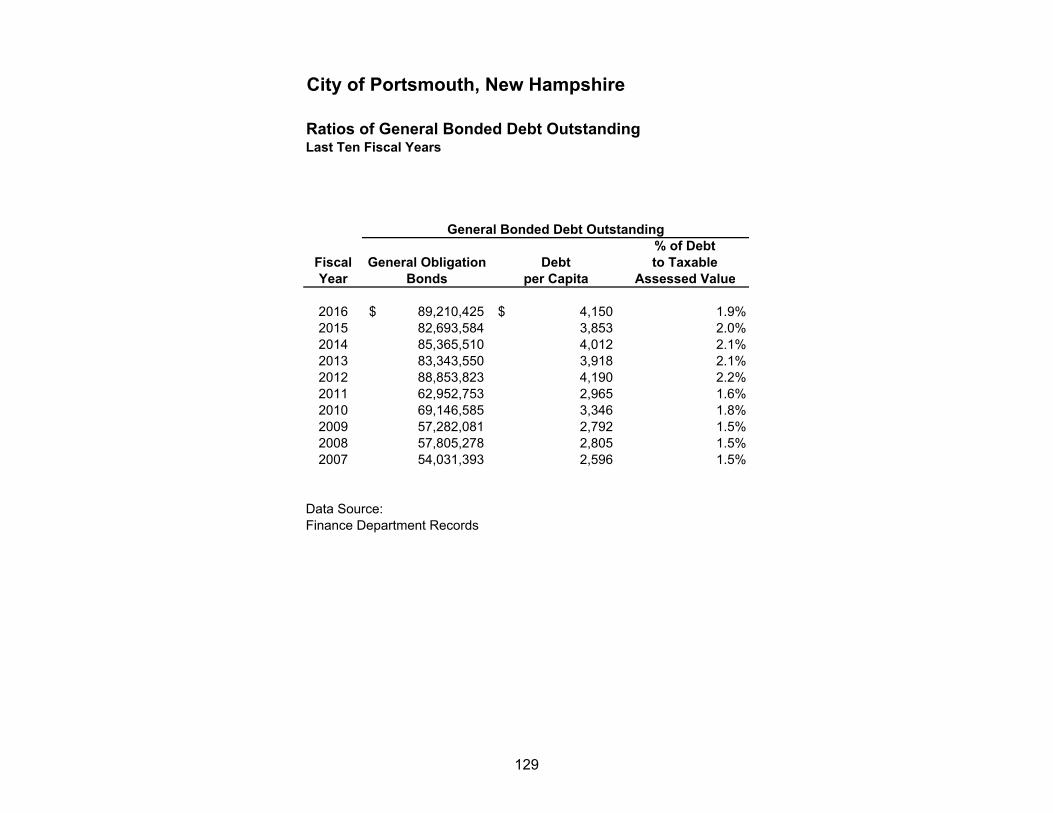
City of Portsmouth, New Hampshire
Ratios of General Bonded Debt OutstandingLast Ten Fiscal Years
% of DebtFiscal General Obligation Debt to TaxableYear Bonds per Capita Assessed Value
2016 89,210,425$ 4,150$ 1.9%2015 82,693,584 3,853 2.0%2014 85,365,510 4,012 2.1%2013 83,343,550 3,918 2.1%2012 88,853,823 4,190 2.2%2011 62,952,753 2,965 1.6%2010 69,146,585 3,346 1.8%2009 57,282,081 2,792 1.5%2008 57,805,278 2,805 1.5%2007 54,031,393 2,596 1.5%
Data Source:Finance Department Records
General Bonded Debt Outstanding
129
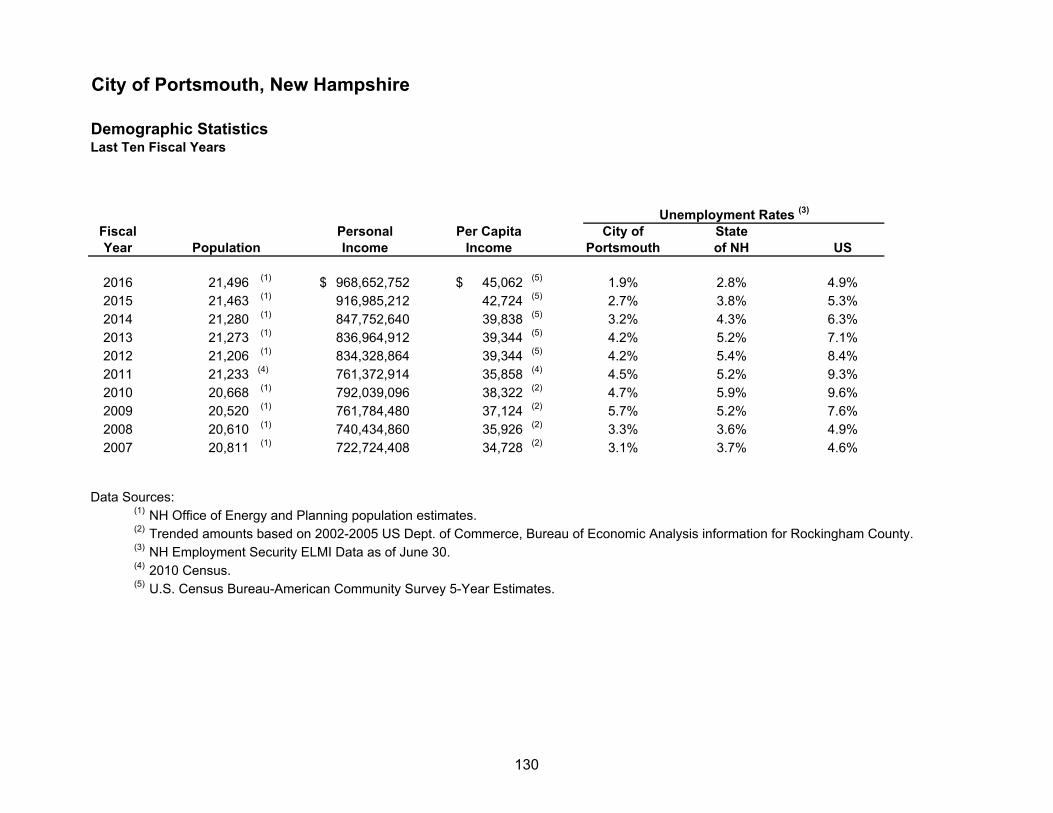
City of Portsmouth, New Hampshire
Demographic StatisticsLast Ten Fiscal Years
Fiscal Personal Per Capita City of StateYear Population Income Income Portsmouth of NH US
2016 21,496 (1) 968,652,752$ 45,062$ (5) 1.9% 2.8% 4.9%2015 21,463 (1) 916,985,212 42,724 (5) 2.7% 3.8% 5.3%2014 21,280 (1) 847,752,640 39,838 (5) 3.2% 4.3% 6.3%2013 21,273 (1) 836,964,912 39,344 (5) 4.2% 5.2% 7.1%2012 21,206 (1) 834,328,864 39,344 (5) 4.2% 5.4% 8.4%2011 21,233 (4) 761,372,914 35,858 (4) 4.5% 5.2% 9.3%2010 20,668 (1) 792,039,096 38,322 (2) 4.7% 5.9% 9.6%2009 20,520 (1) 761,784,480 37,124 (2) 5.7% 5.2% 7.6%2008 20,610 (1) 740,434,860 35,926 (2) 3.3% 3.6% 4.9%2007 20,811 (1) 722,724,408 34,728 (2) 3.1% 3.7% 4.6%
Data Sources:(1) NH Office of Energy and Planning population estimates.(2) Trended amounts based on 2002-2005 US Dept. of Commerce, Bureau of Economic Analysis information for Rockingham County.(3) NH Employment Security ELMI Data as of June 30.(4) 2010 Census.(5) U.S. Census Bureau-American Community Survey 5-Year Estimates.
Unemployment Rates (3)
130
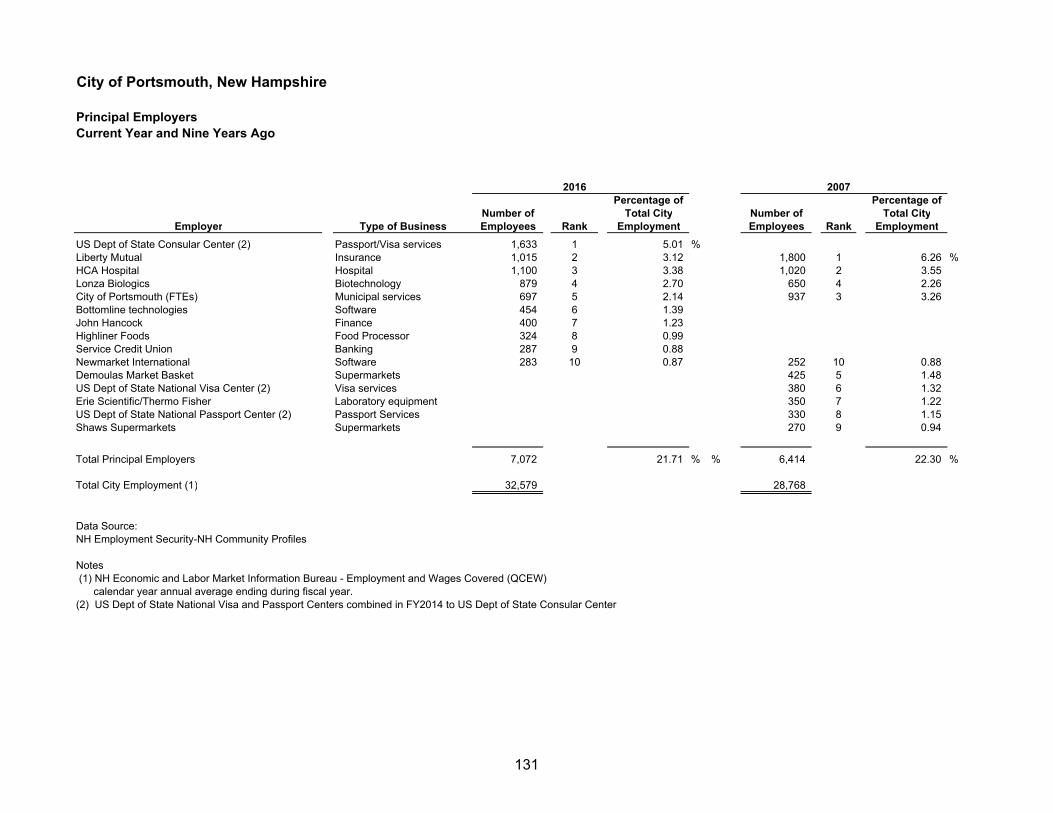
City of Portsmouth, New Hampshire
Principal EmployersCurrent Year and Nine Years Ago
2016 2007Percentage of Percentage of
Number of Total City Number of Total CityEmployer Type of Business Employees Rank Employment Employees Rank Employment
US Dept of State Consular Center (2) Passport/Visa services 1,633 1 5.01 %Liberty Mutual Insurance 1,015 2 3.12 1,800 1 6.26 %HCA Hospital Hospital 1,100 3 3.38 1,020 2 3.55 Lonza Biologics Biotechnology 879 4 2.70 650 4 2.26 City of Portsmouth (FTEs) Municipal services 697 5 2.14 937 3 3.26 Bottomline technologies Software 454 6 1.39 John Hancock Finance 400 7 1.23 Highliner Foods Food Processor 324 8 0.99 Service Credit Union Banking 287 9 0.88 Newmarket International Software 283 10 0.87 252 10 0.88 Demoulas Market Basket Supermarkets 425 5 1.48 US Dept of State National Visa Center (2) Visa services 380 6 1.32 Erie Scientific/Thermo Fisher Laboratory equipment 350 7 1.22 US Dept of State National Passport Center (2) Passport Services 330 8 1.15 Shaws Supermarkets Supermarkets 270 9 0.94
Total Principal Employers 7,072 21.71 % % 6,414 22.30 %
Total City Employment (1) 32,579 28,768
Data Source:NH Employment Security-NH Community Profiles
Notes (1) NH Economic and Labor Market Information Bureau - Employment and Wages Covered (QCEW) calendar year annual average ending during fiscal year.(2) US Dept of State National Visa and Passport Centers combined in FY2014 to US Dept of State Consular Center
131
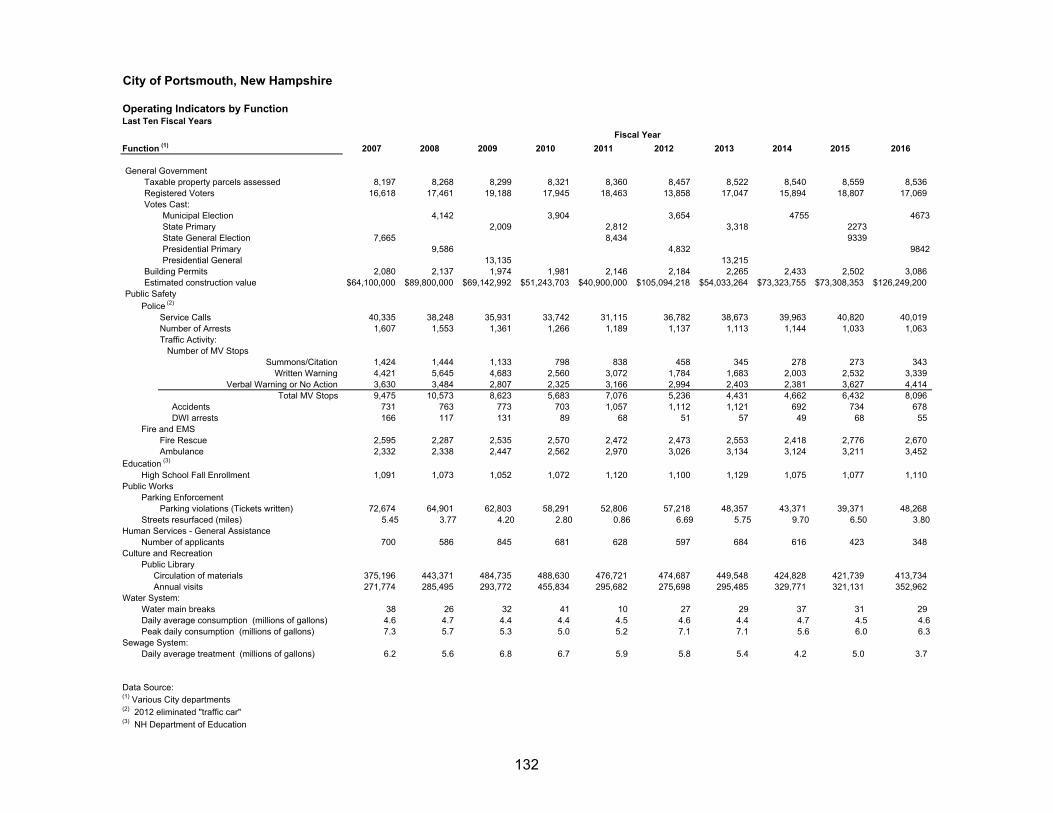
City of Portsmouth, New Hampshire
Operating Indicators by FunctionLast Ten Fiscal Years
Function (1) 2007 2008 2009 2010 2011 2012 2013 2014 2015 2016
General GovernmentTaxable property parcels assessed 8,197 8,268 8,299 8,321 8,360 8,457 8,522 8,540 8,559 8,536 Registered Voters 16,618 17,461 19,188 17,945 18,463 13,858 17,047 15,894 18,807 17,069 Votes Cast:
Municipal Election 4,142 3,904 3,654 4755 4673State Primary 2,009 2,812 3,318 2273State General Election 7,665 8,434 9339Presidential Primary 9,586 4,832 9842Presidential General 13,135 13,215
Building Permits 2,080 2,137 1,974 1,981 2,146 2,184 2,265 2,433 2,502 3,086 Estimated construction value $64,100,000 $89,800,000 $69,142,992 $51,243,703 $40,900,000 $105,094,218 $54,033,264 $73,323,755 $73,308,353 $126,249,200
Public Safety
Police (2)
Service Calls 40,335 38,248 35,931 33,742 31,115 36,782 38,673 39,963 40,820 40,019 Number of Arrests 1,607 1,553 1,361 1,266 1,189 1,137 1,113 1,144 1,033 1,063 Traffic Activity: Number of MV Stops
Summons/Citation 1,424 1,444 1,133 798 838 458 345 278 273 343 Written Warning 4,421 5,645 4,683 2,560 3,072 1,784 1,683 2,003 2,532 3,339
Verbal Warning or No Action 3,630 3,484 2,807 2,325 3,166 2,994 2,403 2,381 3,627 4,414 Total MV Stops 9,475 10,573 8,623 5,683 7,076 5,236 4,431 4,662 6,432 8,096
Accidents 731 763 773 703 1,057 1,112 1,121 692 734 678 DWI arrests 166 117 131 89 68 51 57 49 68 55
Fire and EMSFire Rescue 2,595 2,287 2,535 2,570 2,472 2,473 2,553 2,418 2,776 2,670 Ambulance 2,332 2,338 2,447 2,562 2,970 3,026 3,134 3,124 3,211 3,452
Education (3)
High School Fall Enrollment 1,091 1,073 1,052 1,072 1,120 1,100 1,129 1,075 1,077 1,110 Public Works
Parking EnforcementParking violations (Tickets written) 72,674 64,901 62,803 58,291 52,806 57,218 48,357 43,371 39,371 48,268
Streets resurfaced (miles) 5.45 3.77 4.20 2.80 0.86 6.69 5.75 9.70 6.50 3.80Human Services - General Assistance
Number of applicants 700 586 845 681 628 597 684 616 423 348 Culture and Recreation
Public Library Circulation of materials 375,196 443,371 484,735 488,630 476,721 474,687 449,548 424,828 421,739 413,734 Annual visits 271,774 285,495 293,772 455,834 295,682 275,698 295,485 329,771 321,131 352,962
Water System:Water main breaks 38 26 32 41 10 27 29 37 31 29Daily average consumption (millions of gallons) 4.6 4.7 4.4 4.4 4.5 4.6 4.4 4.7 4.5 4.6Peak daily consumption (millions of gallons) 7.3 5.7 5.3 5.0 5.2 7.1 7.1 5.6 6.0 6.3
Sewage System:Daily average treatment (millions of gallons) 6.2 5.6 6.8 6.7 5.9 5.8 5.4 4.2 5.0 3.7
Data Source:(1) Various City departments(2) 2012 eliminated "traffic car"(3) NH Department of Education
Fiscal Year
132
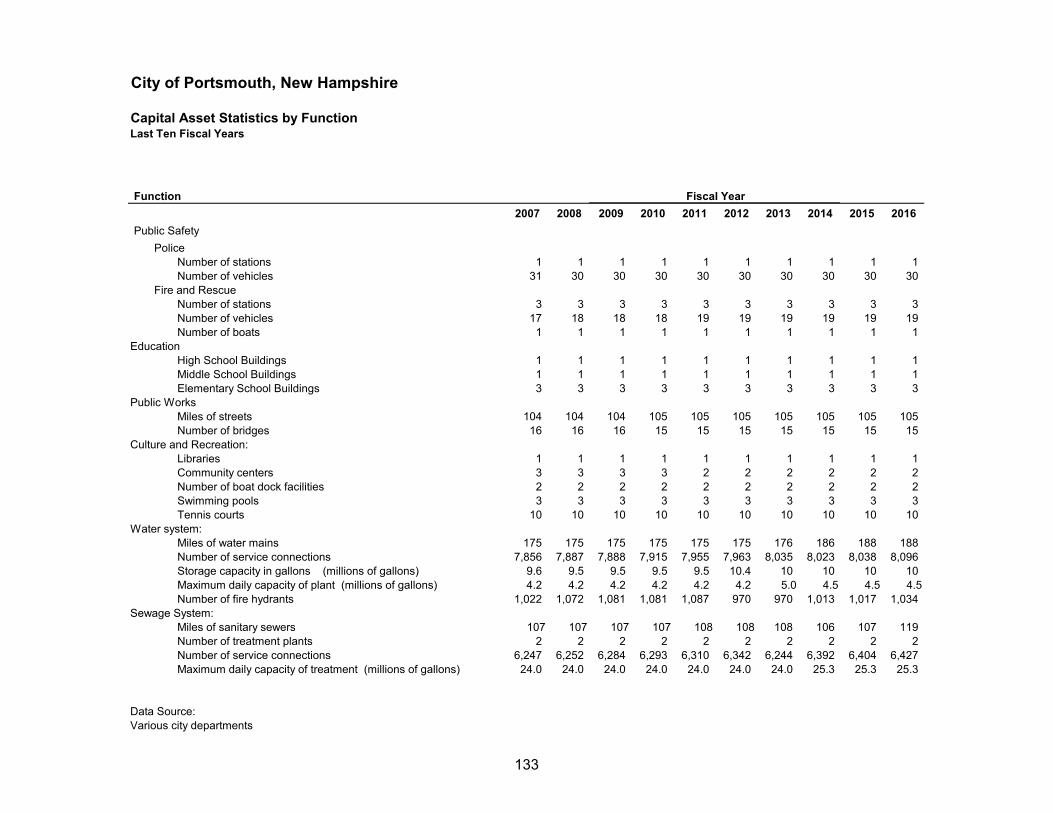
City of Portsmouth, New Hampshire
Capital Asset Statistics by FunctionLast Ten Fiscal Years
Function
2007 2008 2009 2010 2011 2012 2013 2014 2015 2016
Public Safety
Police Number of stations 1 1 1 1 1 1 1 1 1 1 Number of vehicles 31 30 30 30 30 30 30 30 30 30
Fire and RescueNumber of stations 3 3 3 3 3 3 3 3 3 3 Number of vehicles 17 18 18 18 19 19 19 19 19 19 Number of boats 1 1 1 1 1 1 1 1 1 1
EducationHigh School Buildings 1 1 1 1 1 1 1 1 1 1 Middle School Buildings 1 1 1 1 1 1 1 1 1 1 Elementary School Buildings 3 3 3 3 3 3 3 3 3 3
Public WorksMiles of streets 104 104 104 105 105 105 105 105 105 105 Number of bridges 16 16 16 15 15 15 15 15 15 15
Culture and Recreation:Libraries 1 1 1 1 1 1 1 1 1 1 Community centers 3 3 3 3 2 2 2 2 2 2 Number of boat dock facilities 2 2 2 2 2 2 2 2 2 2 Swimming pools 3 3 3 3 3 3 3 3 3 3 Tennis courts 10 10 10 10 10 10 10 10 10 10
Water system:Miles of water mains 175 175 175 175 175 175 176 186 188 188 Number of service connections 7,856 7,887 7,888 7,915 7,955 7,963 8,035 8,023 8,038 8,096 Storage capacity in gallons (millions of gallons) 9.6 9.5 9.5 9.5 9.5 10.4 10 10 10 10 Maximum daily capacity of plant (millions of gallons) 4.2 4.2 4.2 4.2 4.2 4.2 5.0 4.5 4.5 4.5Number of fire hydrants 1,022 1,072 1,081 1,081 1,087 970 970 1,013 1,017 1,034
Sewage System:Miles of sanitary sewers 107 107 107 107 108 108 108 106 107 119 Number of treatment plants 2 2 2 2 2 2 2 2 2 2 Number of service connections 6,247 6,252 6,284 6,293 6,310 6,342 6,244 6,392 6,404 6,427 Maximum daily capacity of treatment (millions of gallons) 24.0 24.0 24.0 24.0 24.0 24.0 24.0 25.3 25.3 25.3
Data Source:Various city departments
Fiscal Year
133
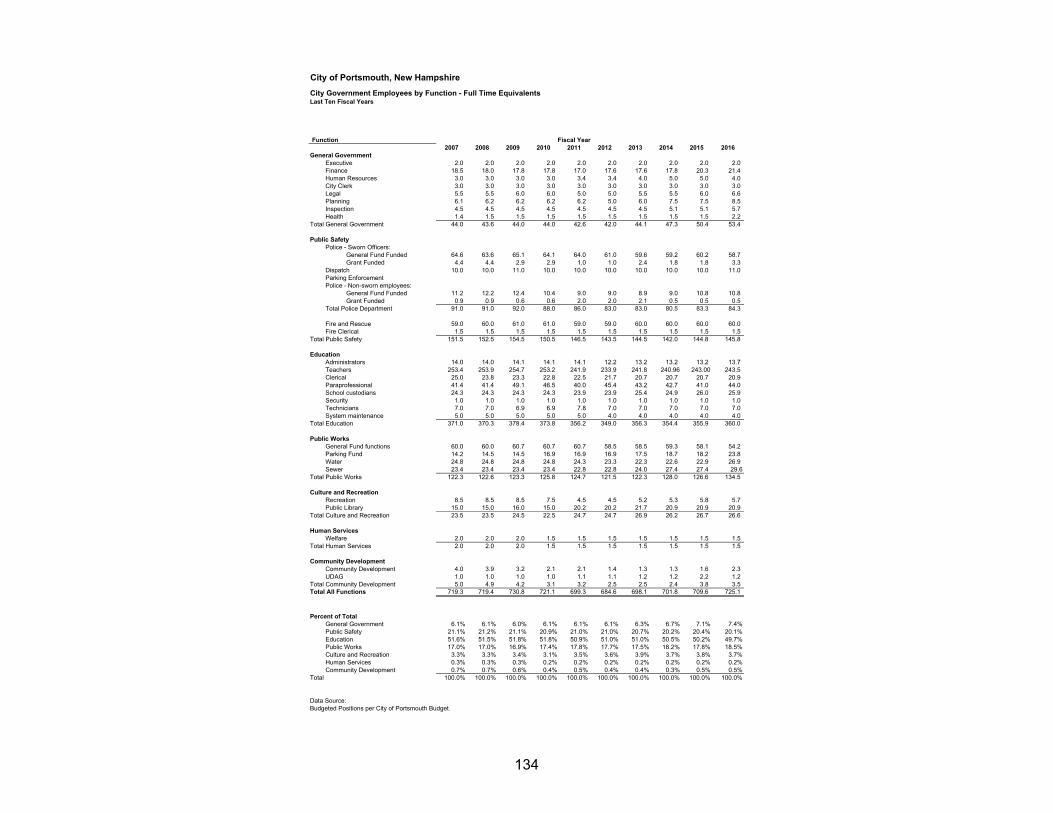
City of Portsmouth, New Hampshire
City Government Employees by Function - Full Time EquivalentsLast Ten Fiscal Years
Function2007 2008 2009 2010 2011 2012 2013 2014 2015 2016
General GovernmentExecutive 2.0 2.0 2.0 2.0 2.0 2.0 2.0 2.0 2.0 2.0 Finance 18.5 18.0 17.8 17.8 17.0 17.6 17.6 17.8 20.3 21.4 Human Resources 3.0 3.0 3.0 3.0 3.4 3.4 4.0 5.0 5.0 4.0 City Clerk 3.0 3.0 3.0 3.0 3.0 3.0 3.0 3.0 3.0 3.0 Legal 5.5 5.5 6.0 6.0 5.0 5.0 5.5 5.5 6.0 6.6 Planning 6.1 6.2 6.2 6.2 6.2 5.0 6.0 7.5 7.5 8.5 Inspection 4.5 4.5 4.5 4.5 4.5 4.5 4.5 5.1 5.1 5.7 Health 1.4 1.5 1.5 1.5 1.5 1.5 1.5 1.5 1.5 2.2
Total General Government 44.0 43.6 44.0 44.0 42.6 42.0 44.1 47.3 50.4 53.4
Public SafetyPolice - Sworn Officers: General Fund Funded 64.6 63.6 65.1 64.1 64.0 61.0 59.6 59.2 60.2 58.7 Grant Funded 4.4 4.4 2.9 2.9 1.0 1.0 2.4 1.8 1.8 3.3 Dispatch 10.0 10.0 11.0 10.0 10.0 10.0 10.0 10.0 10.0 11.0 Parking EnforcementPolice - Non-sworn employees: General Fund Funded 11.2 12.2 12.4 10.4 9.0 9.0 8.9 9.0 10.8 10.8 Grant Funded 0.9 0.9 0.6 0.6 2.0 2.0 2.1 0.5 0.5 0.5 Total Police Department 91.0 91.0 92.0 88.0 86.0 83.0 83.0 80.5 83.3 84.3
Fire and Rescue 59.0 60.0 61.0 61.0 59.0 59.0 60.0 60.0 60.0 60.0 Fire Clerical 1.5 1.5 1.5 1.5 1.5 1.5 1.5 1.5 1.5 1.5
Total Public Safety 151.5 152.5 154.5 150.5 146.5 143.5 144.5 142.0 144.8 145.8
EducationAdministrators 14.0 14.0 14.1 14.1 14.1 12.2 13.2 13.2 13.2 13.7 Teachers 253.4 253.9 254.7 253.2 241.9 233.9 241.8 240.96 243.00 243.5 Clerical 25.0 23.8 23.3 22.8 22.5 21.7 20.7 20.7 20.7 20.9 Paraprofessional 41.4 41.4 49.1 46.5 40.0 45.4 43.2 42.7 41.0 44.0 School custodians 24.3 24.3 24.3 24.3 23.9 23.9 25.4 24.9 26.0 25.9 Security 1.0 1.0 1.0 1.0 1.0 1.0 1.0 1.0 1.0 1.0 Technicians 7.0 7.0 6.9 6.9 7.8 7.0 7.0 7.0 7.0 7.0 System maintenance 5.0 5.0 5.0 5.0 5.0 4.0 4.0 4.0 4.0 4.0
Total Education 371.0 370.3 378.4 373.8 356.2 349.0 356.3 354.4 355.9 360.0
Public WorksGeneral Fund functions 60.0 60.0 60.7 60.7 60.7 58.5 58.5 59.3 58.1 54.2 Parking Fund 14.2 14.5 14.5 16.9 16.9 16.9 17.5 18.7 18.2 23.8 Water 24.8 24.8 24.8 24.8 24.3 23.3 22.3 22.6 22.9 26.9 Sewer 23.4 23.4 23.4 23.4 22.8 22.8 24.0 27.4 27.4 29.6
Total Public Works 122.3 122.6 123.3 125.8 124.7 121.5 122.3 128.0 126.6 134.5
Culture and RecreationRecreation 8.5 8.5 8.5 7.5 4.5 4.5 5.2 5.3 5.8 5.7 Public Library 15.0 15.0 16.0 15.0 20.2 20.2 21.7 20.9 20.9 20.9
Total Culture and Recreation 23.5 23.5 24.5 22.5 24.7 24.7 26.9 26.2 26.7 26.6
Human ServicesWelfare 2.0 2.0 2.0 1.5 1.5 1.5 1.5 1.5 1.5 1.5
Total Human Services 2.0 2.0 2.0 1.5 1.5 1.5 1.5 1.5 1.5 1.5
Community DevelopmentCommunity Development 4.0 3.9 3.2 2.1 2.1 1.4 1.3 1.3 1.6 2.3 UDAG 1.0 1.0 1.0 1.0 1.1 1.1 1.2 1.2 2.2 1.2
Total Community Development 5.0 4.9 4.2 3.1 3.2 2.5 2.5 2.4 3.8 3.5 Total All Functions 719.3 719.4 730.8 721.1 699.3 684.6 698.1 701.8 709.6 725.1
Percent of TotalGeneral Government 6.1% 6.1% 6.0% 6.1% 6.1% 6.1% 6.3% 6.7% 7.1% 7.4%Public Safety 21.1% 21.2% 21.1% 20.9% 21.0% 21.0% 20.7% 20.2% 20.4% 20.1%Education 51.6% 51.5% 51.8% 51.8% 50.9% 51.0% 51.0% 50.5% 50.2% 49.7%Public Works 17.0% 17.0% 16.9% 17.4% 17.8% 17.7% 17.5% 18.2% 17.8% 18.5%Culture and Recreation 3.3% 3.3% 3.4% 3.1% 3.5% 3.6% 3.9% 3.7% 3.8% 3.7%Human Services 0.3% 0.3% 0.3% 0.2% 0.2% 0.2% 0.2% 0.2% 0.2% 0.2%Community Development 0.7% 0.7% 0.6% 0.4% 0.5% 0.4% 0.4% 0.3% 0.5% 0.5%
Total 100.0% 100.0% 100.0% 100.0% 100.0% 100.0% 100.0% 100.0% 100.0% 100.0%
Data Source:Budgeted Positions per City of Portsmouth Budget.
Fiscal Year
134