city of racine, wisconsin proposed 2022 budget
TRANSCRIPT
CITY OF RACINE, WISCONSIN
PROPOSED2022 BUDGET
Operating Budget Overview……………………………………………………………………………………… 1
Financial Summary…………………………………………………………………………………………………21Summaary of Expenditures - All Budgeted Funds……………………………………………………………… 22Summary of Revenues - All Budgeted Funds………………………………………………………………………24Summary of Tax Levy by Fund……………………………………………………………………………………27Summay of Reserves Applied………………………………………………………………………………………28Organizational Summary……………………………………………………………………………………….. 29
General FundSummary of Expenditures by Function……………………………………………………………33General Fund Summay of Revenues by Category…………………………………………………………………35General Fund Revenue Detail by Category……………………………………………………………………… 36
City Administration…………………………………………………………………………………………………43Human Resources……………………………………………………………………………………………………51City Attorney………………………………………………………………………………………………………. 59Finance Department……………………………………………………….……………………………………… 67Non-Departmental………………………………………………………………………………………………… 77Health Department………………………………………………………………………………………………. 83
Fire Department…………………………………………………………………………………………………… 93Police Department………………………………………………………………………………………………….101
Public Works Department……………………………………………………………………………………… 113
TABLE OF CONTENTS 2022 Proposed Budget
SUMMARIES
GENERAL FUND
GENERAL ADMINISTRATION
PUBLIC SAFETY
PUBLIC WORKS

TABLE OF CONTENTS 2022 Proposed Budget
Parks and Recreation Department………………………………………………………………………………. 125
City Development Department…………………………………………………………………………………… 139
Library………………………………………………………………………………………………………………155Waste Disposal………………………………………………………………………………………………………167Municipal Court…………………………………………………………………………………………………… 173Cemetery…………………………………………………………………………………………………………… 179Neighborhood Enhancement Division………………………………………………………………………………185Sanitary Sewer Maintenance………………………………………………………………………………………195Health Department Laboratory……………………………………………………………………………………201Room Tax……………………………………………………………………………………………………………207
Debt Service…………………………………………………………………………………………………………213
General Obligation Bond Fund………………………………………………………………………………….. 219Equipment Replacement Short Term Bond Fund…………………………………………………………………231Intergovernmental Revenue Sharing Fund……………………………………………………………………… 241
Transit System………………………………………………………………………………………………………247Parking System………………………………………………………………………………………………………261Storm Water Utility………………………………………………………………………………………………. 269Civic Centre…………………………………………………………………………………………………………279Radio Communication Resources……………………………………………………………………………….. 285
COMMUNITY DEVELOPMENT
PARKS AND RECREATION
SPECIAL REVENUE
DEBT SERVICE
CAPITAL OUTLAY
ENTERPRISE

TABLE OF CONTENTS 2022 Proposed Budget
Water Utility……...…………………………………………………………………………………………………293Wastewater Utility………..…………………………………………………………………………………………299
Equipment Maintenance Garage……………………………………………………………………………………305Information Systems………………………………………………………………………………………………. 311Building Complex……………...……………………………………………………………………………………321Insurance Fund………………………………………………………………………………………………………327Telephone Fund………………………………………………………………………………………………………333
Positions…………..…………………………………………………………………………………………………339Fee Schedule…………………………………………………………………………………………………………353Ordinances…………..……...……………………………………………………………………………………… Separate TabCapital Improvement Plan…………..………………………………………………………………………………Separate Tab
INTERNAL SERVICE
UTILITIES
APPENDICES
This page is intentionally left blank

CITY OF RACINE
2022 Operating Budget Overview
The City of Racine maintains a budget document as a tool for financial planning. The City uses a decentralized approach to creating the budget; that is, department heads and managers develop and create the working numbers that fill the line items with direction and advice from the Mayor, City Administrator and the Finance Department. This document is also used to provide additional information about City departments including the services provided, significant goals and initiatives and the associated funding impacts for 2022. Although this budget was developed to look beyond 2022, maintaining delivery of current services to the citizenry while complying with the State imposed expenditure restraint and tax levy limits continues to be a challenge. While this budget was not as challenging as in recent years, the development of this budget still came with challenges as the City continues to face a structural deficit that has the cost of services increasing by more than inflation while major revenue sources remain flat. Funding from the federal government, under the American Rescue Plan, and hard choices that were made by the Common Council in previous budgets, gave us a reprieve from another year of difficult decisions. The 2022 budget addresses new challenges like employee recruitment and retention and also includes funding for the expansion of strategic initiatives and right sizing of departments to provide essential services. While the 2022 budget development was easier than in recent years, we will continue to face budget stabilization challenges in the future. Throughout 2022, we will continue to investigate ways to reduce costs and increase revenues, yet still provide competitive compensation and benefits for our employees, and essential services to the citizenry.
Funding for strategic initiatives including recruitment, retention, equity diversity and inclusion, neighborhoods, sustainability and smart cities can be found throughout the budget.
Salary Steps and a 1% COLA for Non Represented 600,000$ H.S.A Contributions for Non Represented 525,000 Minimum Part Time Wage to $15/hr 225,000
Increase for outside Attorneys 125,000
Additional Public Health Nurses (1 FT & 1 PT) 200,000 2 Additional NED Inspectors (FT) 200,000 6 Additional Lifegaurds 60,000 Pay Scale Differential of 3% for City Resident Employees Non Represented 375,000 1 Additional Information Technology Help Desk Technician 100,000
Items of Interest in the 2022 Budget
Page 1

CITY OF RACINE
2022 Operating Budget Overview
REVENUE HIGHLIGHTS
General Fund revenues are made up of various categories. The various categories and the 2022 budget impact for each are discussed below.
o Property taxes- Property taxes in the general fund increased by about .68% which correlates closely to our permitted tax increase from net new construction. o Licenses and permits- The amount of revenue that is generated from permit and development fees is based on the development and construction market. The 2022 budget reflects a 12% decrease in license and permit revenue primarily due to the reclassification of NED to a special revenue fund. o Fines and Forfeitures - The 2022 budget remains flat. o Charges for services- Includes revenues such as ambulance billing, fire inspection fees, recreation and other park fees. The category increased slightly in the 2022 budget to include fees for board ups and razing.
o Miscellaneous Revenues, of which interest income is the largest component, remains almost flat from 2021.
o Other Financing Sources- This category includes the PILOT payment from the Water Department and Transfer from other funds. The 2022 other financing sources decreased substantially due to a reclassification of a transfer from CDBG for the partial funding of the Neighborhood Enhancement Division, and an decrease in the funding formula under the library funding portion of the wastewater agreement.
o Fund Balance Applied- This category reflects in 2022 the application of a portion of the lost revenue category, of the American Rescue Plan funds that the City
received in 2021, classified as budget stabilization. Undesignated or Wage Provision general fund balance has not been applied in the 2022 budget.
2021 Adopted 2022 Proposed ChangeProperty Taxes 33,717,000$ 33,946,450$ 229,450$ Other Taxes 350,000 400,000 50,000 Intergovernmental Revenues 33,442,071 33,368,994 (73,077) Licenses and Permits 2,303,435 2,030,380 (273,055) Fines and Forfeitures 1,122,000 1,122,000 -
Charges for Services 4,233,280 4,446,080 212,800 Intergovernmental Charges for Services 1,895,003 1,920,027 25,024 Miscellaneous Revenues 644,144 649,550 5,406 Other Financing Sources 5,538,474 4,430,784 (1,107,690) Budget Stabilzation Fund Balance Applied - 2,429,740 2,429,740 Assigned Fund Balance Applied 750,000 - (750,000) Unassigned Fund Balance Applied 250,000 - (250,000) Total Revenues 84,245,407$ 84,744,005$ 498,598$
General Fund Revenues2021 Adopted to 2022 Proposed
Page 2

CITY OF RACINE
2022 Operating Budget Overview
The largest components of the General Fund revenues are Property Taxes and Intergovernmental Revenues. The City largest operating fund continues to rely
heavily on State Shared Revenue and Property Taxes.
Intergovernmental revenues include all grants and contributions received from the State and Federal government as well as other local governments. The
City’s largest intergovernmental revenues come from the State of Wisconsin under the State Shared Revenue and Expenditure Restraint Program and account
for about $27.4 million of revenue in the General fund.
Page 3

CITY OF RACINE
2022 Operating Budget Overview
Property Tax Levy by Fund The proposed Tax Levy for 2022 is $56,492,894 which is a 1.19% decrease from the prior year. The Tax Levy consists of two components, an operational levy and a debt service levy. The operational levy increased by the amount permitted by the State of Wisconsin under levy limits, .58%. The City property tax levy represents 40% of the total General Fund revenues. The City allocates tax levy to the general fund, special revenue funds, debt service funds, and enterprise funds, with general fund and the debt service fund having the largest allocation.
Property Tax Levy Allocation by Type
General Fund$33,946,450 60%
Special Revenue$2,865,444 5%
Debt Service$18,600,000
33%
Enterprise$1,081,000 2%
2018 2019 2020 2021 2022Budget Budget Budget Budget Budget
Operating Levy 36,917,474$ 37,309,197$ 37,609,000$ 37,674,692$ 37,892,894$ Debt Service Levy 17,404,776 17,013,053 16,211,230 19,500,000 18,600,000
54,322,250$ 54,322,250$ 53,820,230$ 57,174,692$ 56,492,894$
Page 4
CITY OF RACINE
2022 Operating Budget Overview
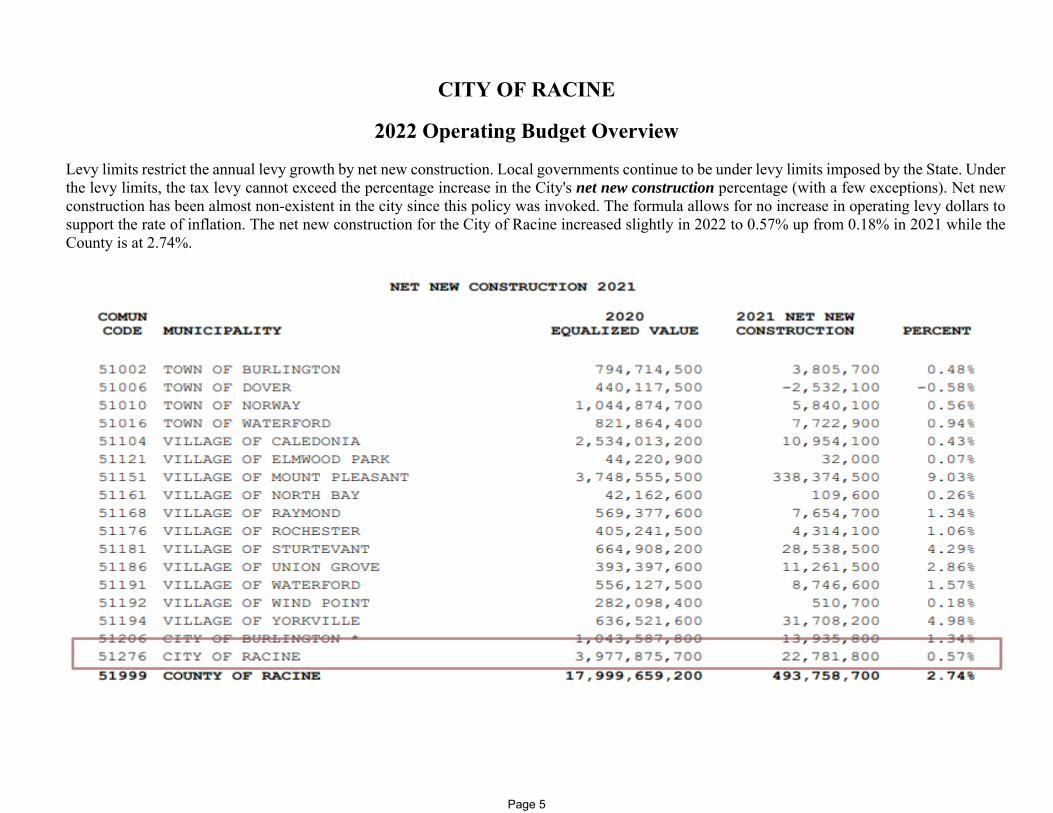
Levy limits restrict the annual levy growth by net new construction. Local governments continue to be under levy limits imposed by the State. Under the levy limits, the tax levy cannot exceed the percentage increase in the City's net new construction percentage (with a few exceptions). Net new construction has been almost non-existent in the city since this policy was invoked. The formula allows for no increase in operating levy dollars to support the rate of inflation. The net new construction for the City of Racine increased slightly in 2022 to 0.57% up from 0.18% in 2021 while the County is at 2.74%.
Page 5
CITY OF RACINE
2022 Operating Budget Overview
Intergovernmental Revenues-State Shared Revenues
The largest portion of intergovernmental revenues comes from the State shared revenue and expenditure restraint programs. This program has been in existence for many years and is the largest source of non-tax levy revenue in the General Fund. It accounts for about 35% of the total General Fund revenue for 2022. The City’s state shared revenues have decreased substantially since 2010 and will decrease again in 2022.
Shared revenue is driven by a complicated formula which determines a municipality's wealth and financial need in comparison to other municipalities throughout the State of Wisconsin. While there are a number of components to the formula, a major element is per capita equalized values. This is the factor used by the state to determine a municipality's "tax base wealth" and has a major impact on the amount of shared revenues a community receives in a given year. The formula also has a provision which guarantees that a community will receive at least 95% of the prior year's amount. Shared revenue also includes the $2.3 million the City receives under the expenditure restraint program. The program limits the operating expenditure increase to an inflationary calculation performed by the State. Although not finalized, current projections anticipate an allowable expenditure increase of 3.1%. The 2022 budget as proposed is well under the expenditure restraint limit.
2021 REVENUE BUDGET ITEMS OF INTEREST
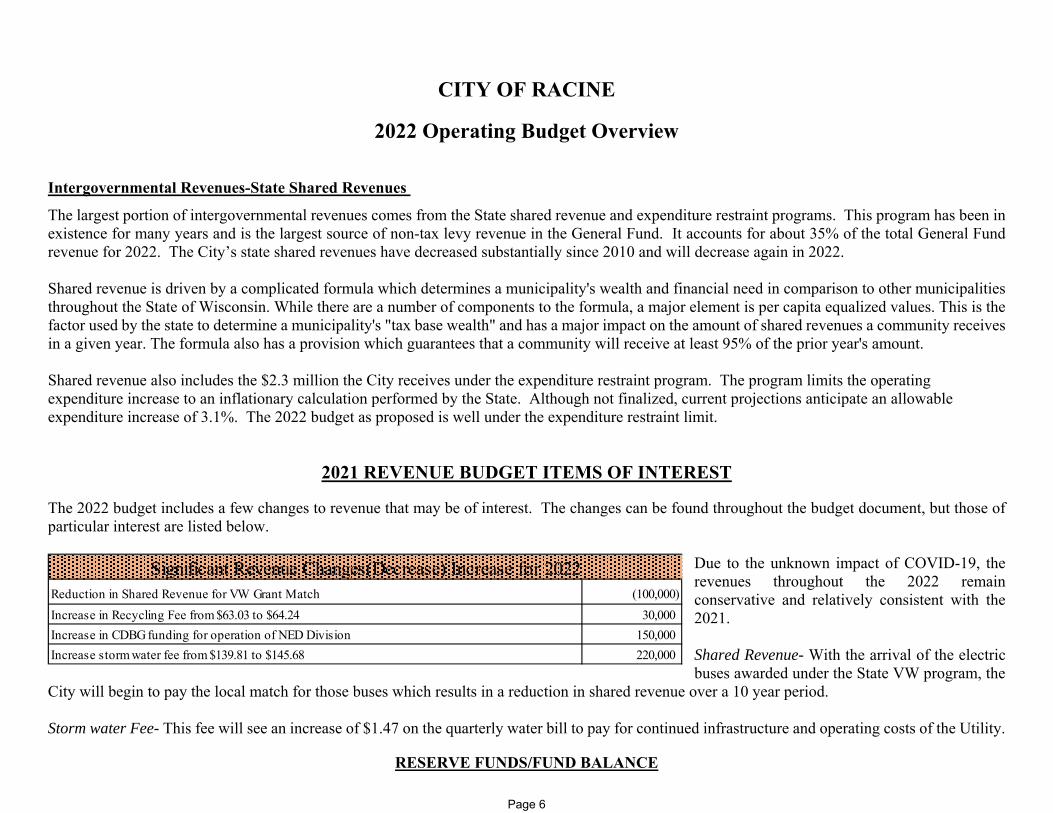
The 2022 budget includes a few changes to revenue that may be of interest. The changes can be found throughout the budget document, but those of particular interest are listed below.
Due to the unknown impact of COVID-19, the revenues throughout the 2022 remain conservative and relatively consistent with the 2021. Shared Revenue- With the arrival of the electric buses awarded under the State VW program, the
City will begin to pay the local match for those buses which results in a reduction in shared revenue over a 10 year period. Storm water Fee- This fee will see an increase of $1.47 on the quarterly water bill to pay for continued infrastructure and operating costs of the Utility.
RESERVE FUNDS/FUND BALANCE
Reduction in Shared Revenue for VW Grant Match (100,000) Increase in Recycling Fee from $63.03 to $64.24 30,000 Increase in CDBG funding for operation of NED Division 150,000 Increase storm water fee from $139.81 to $145.68 220,000
Significant Revenue Changes(Decrease) Increase for 2022
Page 6
CITY OF RACINE
2022 Operating Budget Overview
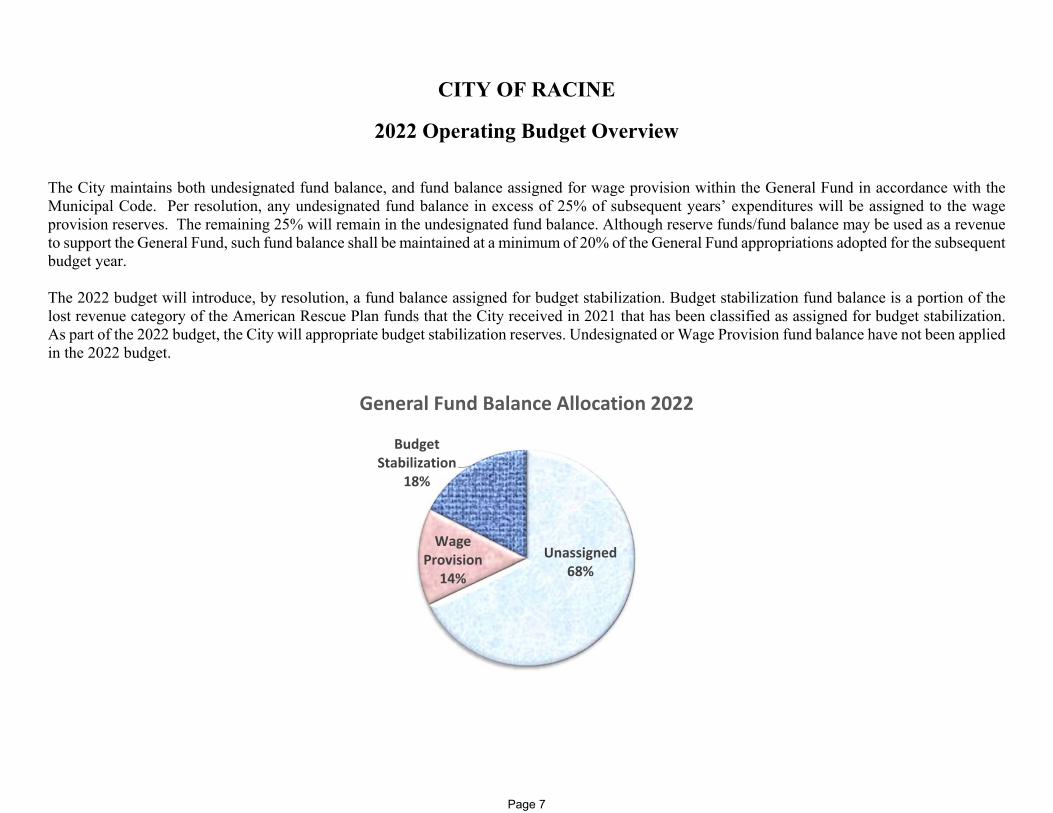
The City maintains both undesignated fund balance, and fund balance assigned for wage provision within the General Fund in accordance with the Municipal Code. Per resolution, any undesignated fund balance in excess of 25% of subsequent years’ expenditures will be assigned to the wage provision reserves. The remaining 25% will remain in the undesignated fund balance. Although reserve funds/fund balance may be used as a revenue to support the General Fund, such fund balance shall be maintained at a minimum of 20% of the General Fund appropriations adopted for the subsequent budget year. The 2022 budget will introduce, by resolution, a fund balance assigned for budget stabilization. Budget stabilization fund balance is a portion of the lost revenue category of the American Rescue Plan funds that the City received in 2021 that has been classified as assigned for budget stabilization. As part of the 2022 budget, the City will appropriate budget stabilization reserves. Undesignated or Wage Provision fund balance have not been applied in the 2022 budget.
Unassigned68%
Wage Provision
14%
Budget Stabilization
18%
General Fund Balance Allocation 2022
Page 7
CITY OF RACINE
2022 Operating Budget Overview
RESERVE FUNDS/FUND BALANCE
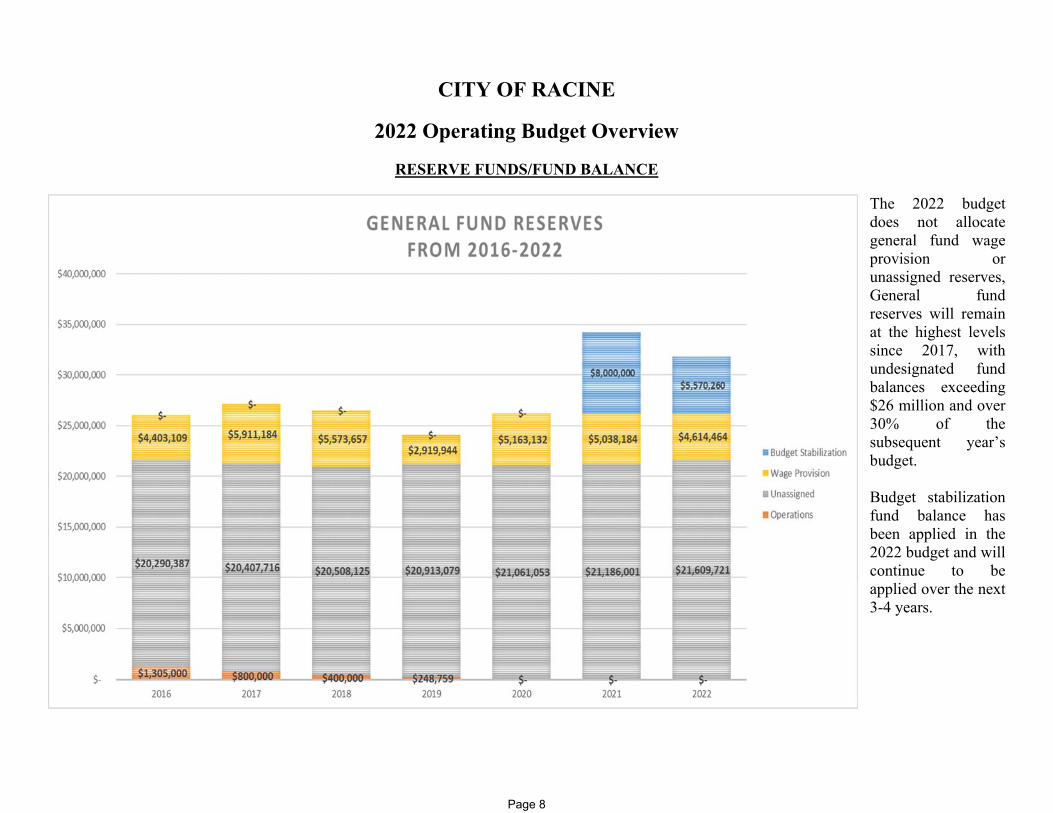
The 2022 budget does not allocate general fund wage provision or unassigned reserves, General fund reserves will remain at the highest levels since 2017, with undesignated fund balances exceeding $26 million and over 30% of the subsequent year’s budget. Budget stabilization fund balance has been applied in the 2022 budget and will continue to be applied over the next 3-4 years.
Page 8
CITY OF RACINE
2022 Operating Budget Overview
RESERVE FUNDS/FUND BALANCE
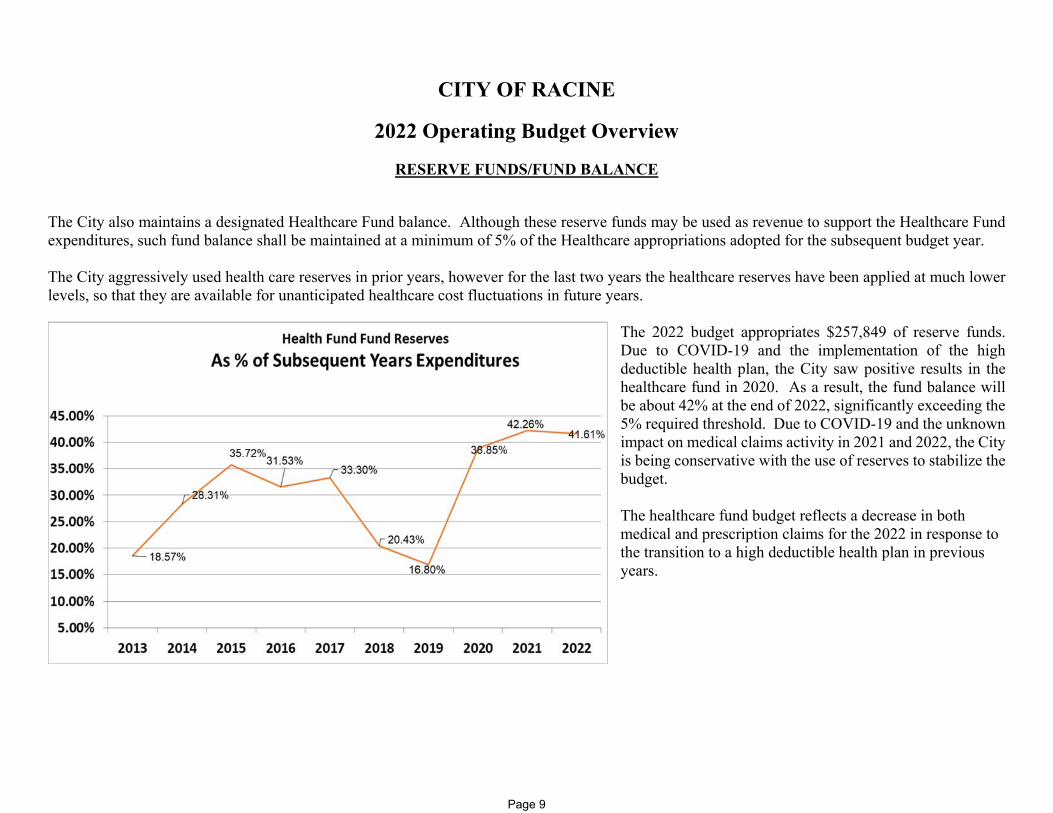
The City also maintains a designated Healthcare Fund balance. Although these reserve funds may be used as revenue to support the Healthcare Fund expenditures, such fund balance shall be maintained at a minimum of 5% of the Healthcare appropriations adopted for the subsequent budget year. The City aggressively used health care reserves in prior years, however for the last two years the healthcare reserves have been applied at much lower levels, so that they are available for unanticipated healthcare cost fluctuations in future years.
The 2022 budget appropriates $257,849 of reserve funds. Due to COVID-19 and the implementation of the high deductible health plan, the City saw positive results in the healthcare fund in 2020. As a result, the fund balance will be about 42% at the end of 2022, significantly exceeding the 5% required threshold. Due to COVID-19 and the unknown impact on medical claims activity in 2021 and 2022, the City is being conservative with the use of reserves to stabilize the budget. The healthcare fund budget reflects a decrease in both medical and prescription claims for the 2022 in response to the transition to a high deductible health plan in previous years.
Page 9

CITY OF RACINE
2022 Operating Budget Overview
EXPENDITURE HIGHLIGHTS
The 2022 budget reflects a maintenance of effort budget. The budget maintains City services and includes no position reductions, Personnel costs continue to be the driving force of the general fund expenditures, while Public safety constitutes more than half of our budgetary costs.
Page 10

CITY OF RACINE
2022 Operating Budget Overview
The largest operating fund, the General Fund expenditure budget for 2022 proposes an increase of approximately $500,000, or .59% from 2021.
The general fund reflects a status quo budget. The majority of the increases in expenses are in Health, Public Works, and Parks. Increases are described below.
Health Department- this area is proposing an increase for: Addition of 1 full time and 1 part time public health nurse of approximately $200,000 Remaining increase relates to Step increases, salary reclassifications, and COLA increases.
Public Works- this area is proposing an increase for: Salaries and Overtime including increased wages for truck drivers as authorized by Common Council. Fuel and maintenance cost increases
Parks- this area is proposing an increase in expenditures due to: $15/hr. Part Time minimum wage 6 Additional life guards on duty during the summer. Fuel and maintenance cost increases
2021 Adopted 2022 Proposed ChangeGeneral Government 15,568,503$ 15,383,783$ (184,720)$ Health 2,449,330 2,745,777 296,447 Public Safety 46,477,431 46,414,538 (62,893) Public Works 10,019,314 10,406,930 387,616 Education and Recreation 6,399,590 7,029,683 630,093 Community Development 3,331,239 2,763,294 (567,945) Total Expenditures 84,245,407$ 84,744,005$ 498,598$
General Fund Expenditures2021 Adopted to 2022 Proposed
Page 11
CITY OF RACINE
2022 Operating Budget Overview
Debt Administration
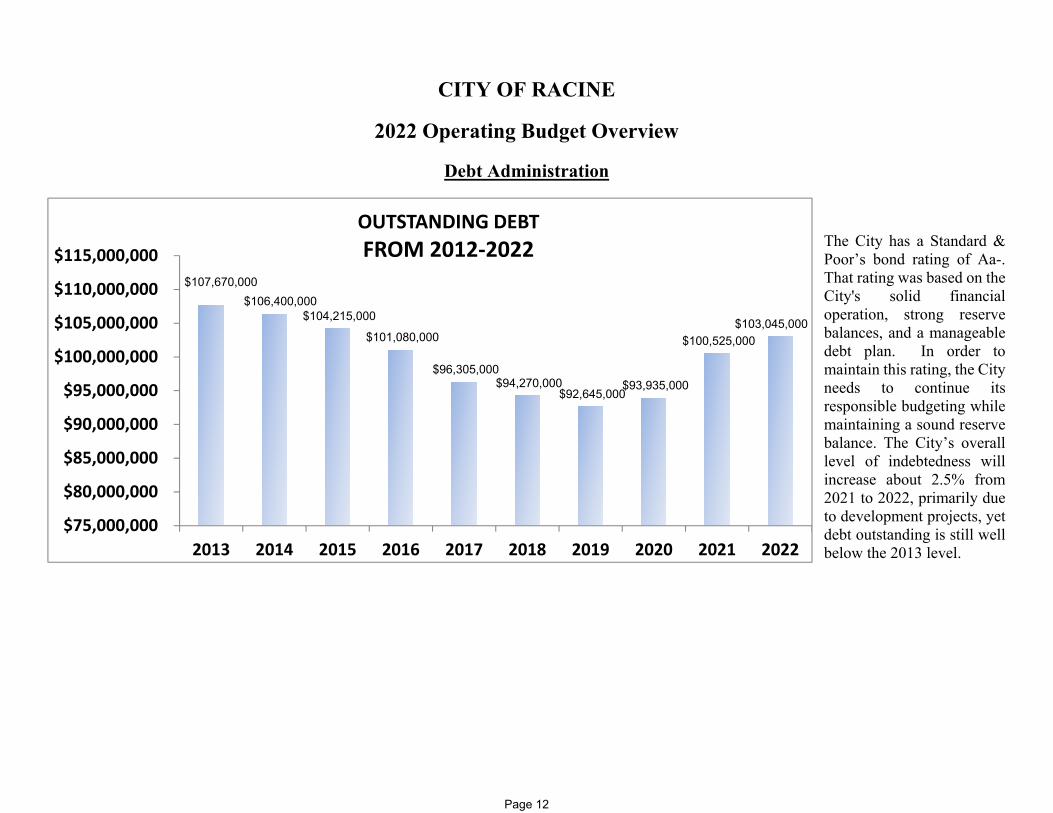
The City has a Standard & Poor’s bond rating of Aa-. That rating was based on the City's solid financial operation, strong reserve balances, and a manageable debt plan. In order to maintain this rating, the City needs to continue its responsible budgeting while maintaining a sound reserve balance. The City’s overall level of indebtedness will increase about 2.5% from 2021 to 2022, primarily due to development projects, yet debt outstanding is still well below the 2013 level.
$107,670,000 $106,400,000
$104,215,000
$101,080,000
$96,305,000 $94,270,000
$92,645,000 $93,935,000
$100,525,000 $103,045,000
$75,000,000
$80,000,000
$85,000,000
$90,000,000
$95,000,000
$100,000,000
$105,000,000
$110,000,000
$115,000,000
2013 2014 2015 2016 2017 2018 2019 2020 2021 2022
OUTSTANDING DEBTFROM 2012‐2022
Page 12

CITY OF RACINE
2022 Operating Budget Overview
The City’s debt capacity is based on the equalized value of the City of Racine. As equalized value rises, our borrowing capacity increases. Our estimated debt limit for 2022 is $223M, leaving our estimated borrowing capacity at 54%, the highest it has been in 10 years.
Page 13
CITY OF RACINE
2022 Operating Budget Overview
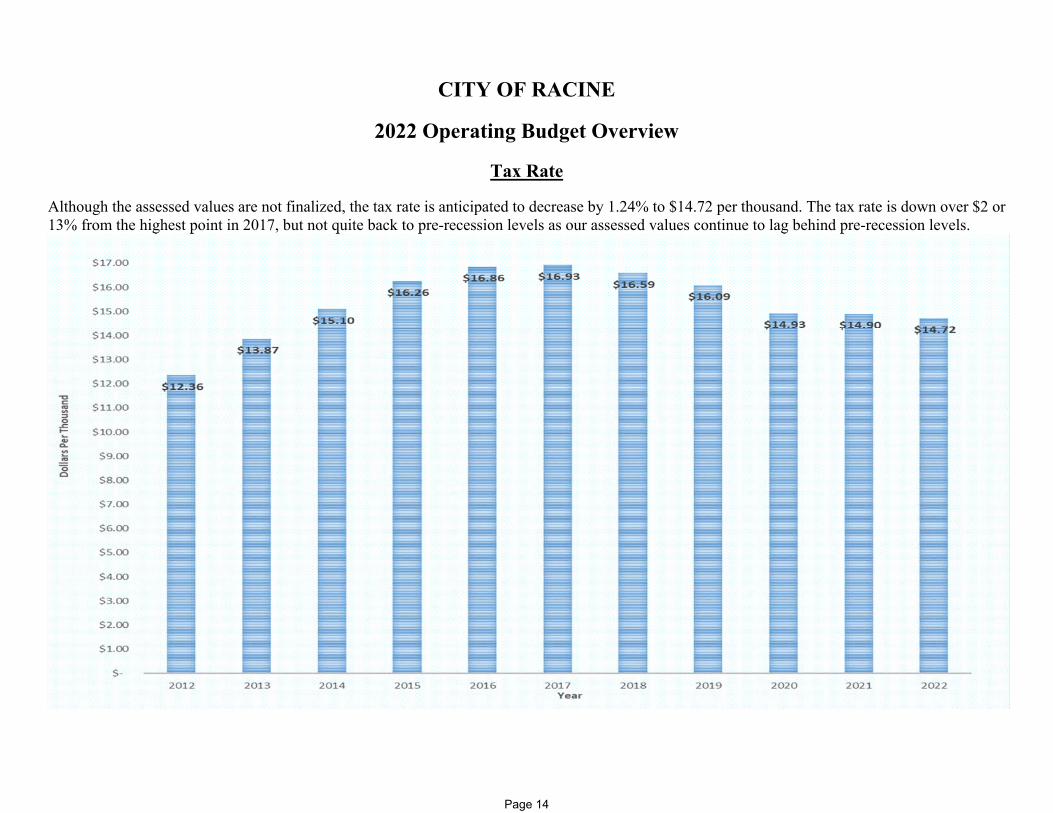
Tax Rate
Although the assessed values are not finalized, the tax rate is anticipated to decrease by 1.24% to $14.72 per thousand. The tax rate is down over $2 or 13% from the highest point in 2017, but not quite back to pre-recession levels as our assessed values continue to lag behind pre-recession levels.
Page 14
CITY OF RACINE
2022 Operating Budget Overview
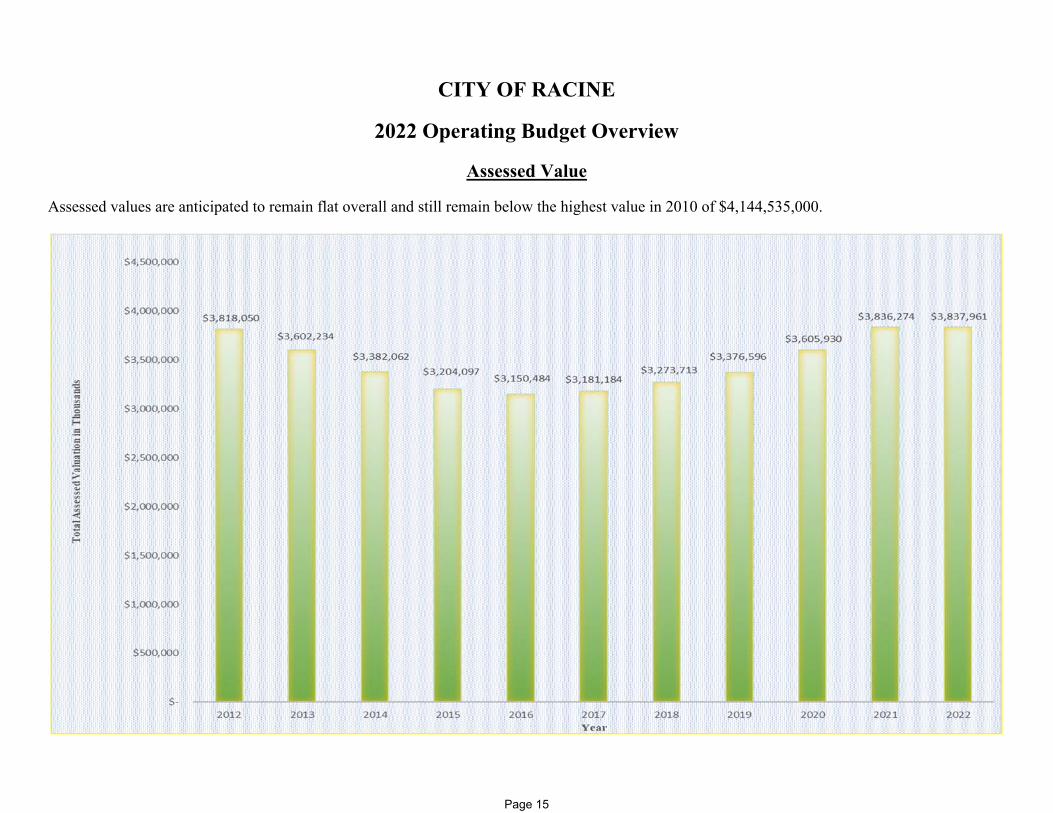
Assessed Value
Assessed values are anticipated to remain flat overall and still remain below the highest value in 2010 of $4,144,535,000.
Page 15

CITY OF RACINE
2022 Operating Budget Overview
OPERATING BUDGET POLICIES
The City will prepare an annual budget for all operating funds in accordance with §4.26-§4.33, of the Municipal Code of Ordinances, which incorporates, by reference, §65.90 and §62.12 of the Wisconsin State Statutes.
The ordinance, in general requires: A budget for governmental and proprietary funds. A budget available for public inspection. A public hearing prior to adoption by the Common Council. An itemization of all indebtedness, expenditures, revenues, and anticipated surpluses.
A two-thirds (2/3) vote of the entire membership of the Common Council is required to modify an adopted appropriation. The City will maintain a budgetary control system to ensure adherence to the adopted budget and will prepare reports comparing actual revenues and expenditures to budgeted amounts.
Budget amendments and transfers modifying the adopted appropriation unit are initiated by the department. After review by the Finance Department, the transfer is forwarded to Administration for recommendation of approval to the Finance Committee, with final approval by the Common Council.
Budget transfers within a departmental appropriation unit are initiated by the department. The Finance Department reviews for availability of funds and approves.
Carryover of prior year budget fund authorization is initiated by the department. The requests are reviewed by the Finance Department and Administration for recommendation of approval to the Finance Committee with final approval by the Common Council, generally in May of the subsequent year.
Increases to the adopted budgets are primarily made in the following situations:
Emergency situation Non recurring appropriations with offsetting revenues Carry-over of prior year appropriations
Page 16

CITY OF RACINE
2022 Operating Budget Overview
OPERATING BUDGET PROCESS
The following process establishes the City's operating budget for the ensuing fiscal calendar year.
The City's operating budget process begins with the development of the budget calendar and instructions to department heads regarding the expenditure and revenue policy of the Mayor. This policy will include fiscal and operational guidelines as well as guidelines relating to budgetary increases, etc.
Departments prepare budget requests and estimated projections, which provide the Finance Department and Administration with information to analyze the requests against previous budget years and against the total overall needs of the City.
The Mayor, City Administrator, Director of Finance, and Assistant Director of Finance review department budgets with each department head and staff.
Upon completion of these deliberations, the Finance Department will prepare the Proposed Budget for presentation by the Mayor to the legislative body. The legislative body refers the Proposed Budget to the Committee of the Whole. The Committee of the Whole is responsible for review of the Proposed Budget and referral to the Common Council for adoption.
The City holds a public hearing on the budget and a Committee of the Whole meeting to deliberate the Proposed Budget and any amendments recommended by the Committee of the Whole.
The budget is adopted by the Common Council through appropriate resolutions. Once the budget is adopted, the Finance Department makes the adopted version of the budget document available to all departments, the
legislative body and the public.
Mayor's Budget address and distribution of operating and capital budgets to Common Council Tuesday October 19thBudget Committee of the Whole Meeting-All Departments and Capital Monday October 25th
Public Hearing and Committee of the Whole Tuesday October 26thBudget Committee of the Whole Meeting Thursday October 28thBudget Committee of the Whole Meeting-amendments for approval Monday November 1stCommon Council Meeting Budget Adoption Tuesday November 2nd
2022 Budget Calendar
Page 17

CITY OF RACINE
2022 Operating Budget Overview
RESERVE POLICIES
• Per Section 46-63 of the Municipal Code, the common council shall maintain an undesignated fund balance within the general fund in accordance with the audit and accounting guide, Audits of State and Local Governmental Units. Such fund balance shall be maintained at a minimum of 20% of the general fund appropriations adopted for the subsequent budget year. The percentage calculation shall be performed annually upon the adoption of the budget for the general fund, based on the city's prior year undesignated general fund balances as set forth in its audited financial statements.
• Per Section 46-64 of the Municipal Code, The common council shall maintain an undesignated fund balance within the health insurance fund in accordance with the audit and accounting guide, Audits of State and Local Governmental Units. Such fund balance shall be maintained at a minimum of 5% of the health insurance fund appropriations adopted for the subsequent budget year. The percentage calculation shall be performed annually upon the adoption of the budget for the health insurance fund, based on the city's prior year undesignated health insurance fund balances as set forth in its audited financial statements. Any shortfall shall be appropriated and transferred from the undesignated general fund balance to the extent possible.
• All general obligation debts will be paid through a general debt service fund. Operating budgets will be prepared to meet the annual principal, interest, and service charge costs for each fund. Net debt service requirements (debt service expenditures less debt service revenue) will be funded through the general tax levy.
Page 18
CITY OF RACINE
2022 Operating Budget Overview
DEBT POLICIES
• The City will confine long-term borrowing to capital improvements and equipment with high cost and long expected useful life.
• The City will follow a policy of full disclosure on every financial report and bond prospectus.
• The City will use short term debt for cash flow and bond or note anticipation purposes.
• The City will first look to available current resources before using debt to fund capital improvements.
• Section 67.03 (1) of the Wisconsin State Statutes provides that the amount of indebtedness of a municipality shall not exceed 5 percent of the equalized valuation of the taxable property in the municipality.
ACCOUNTING POLICIES
• The accounts of the City are presented on the basis of funds and account groups, each of which is considered a separate accounting entity. The operations of each fund are accounted for with a separate set of self-balancing accounts that comprise its assets, liabilities, fund equity, revenues, and expenditures.
• The books and records of the City are maintained in conformance with accounting principles accepted as the standard in the industry. The only
exception to conformance with accounting principles result from State or Federal law.
• An annual audit will be performed by an independent accounting firm.
• The accounting records of the City are maintained on the modified accrual basis of accounting for the General Fund, Special Revenue Funds, Debt Service Funds, Capital Project Funds, Expendable Trust Funds and Agency Funds. The accrual basis of accounting is used for the Enterprise Funds, Internal Service Funds, and Non-Expendable Trust Funds.
• In general, under the modified accrual basis of accounting, revenues are recognized when they become measurable and available as new current
assets. Expenditures are generally recognized when the related fund liability is incurred. Under the accrual basis of accounting, revenues are recognized when earned and expenses are recognized when liabilities are incurred without regard to receipt or disbursement of each.
Page 19

This page is intentionally left blank
Page 20
Financial
Summary
Page 21
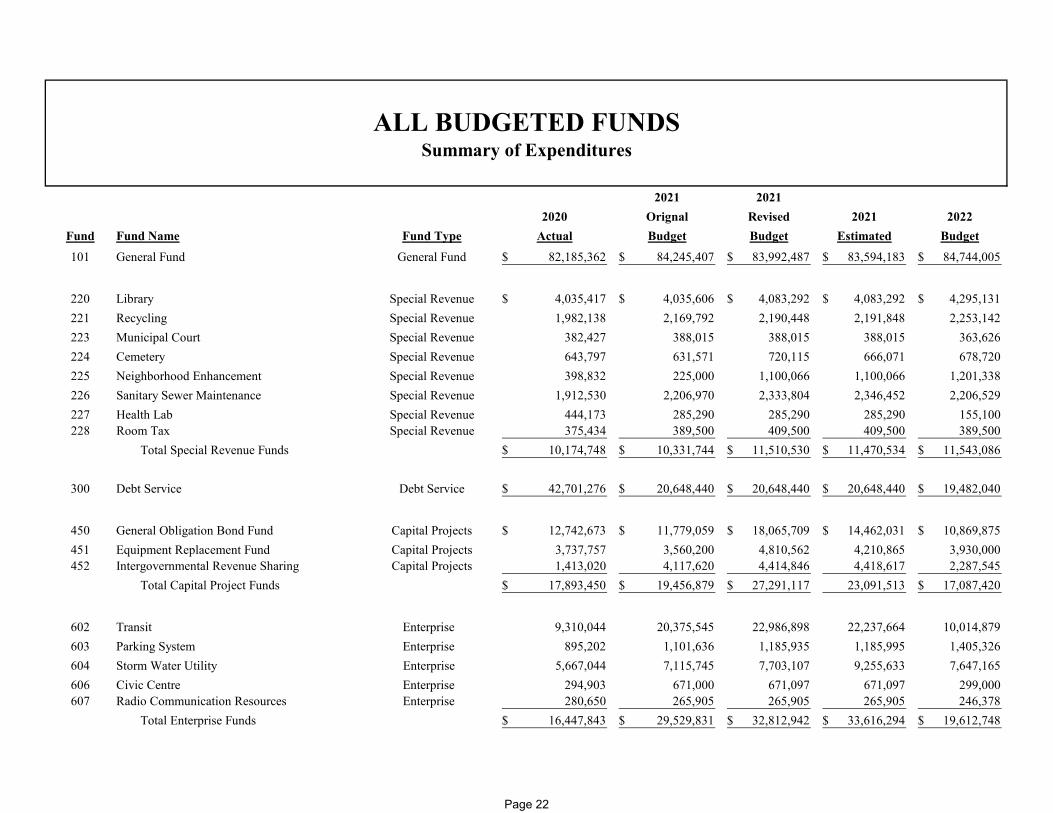
2021 20212020 Orignal Revised 2021 2022
Fund Fund Name Fund Type Actual Budget Budget Estimated Budget
101 General Fund General Fund 82,185,362$ 84,245,407$ 83,992,487$ 83,594,183$ 84,744,005$
220 Library Special Revenue 4,035,417$ 4,035,606$ 4,083,292$ 4,083,292$ 4,295,131$ 221 Recycling Special Revenue 1,982,138 2,169,792 2,190,448 2,191,848 2,253,142 223 Municipal Court Special Revenue 382,427 388,015 388,015 388,015 363,626 224 Cemetery Special Revenue 643,797 631,571 720,115 666,071 678,720 225 Neighborhood Enhancement Special Revenue 398,832 225,000 1,100,066 1,100,066 1,201,338 226 Sanitary Sewer Maintenance Special Revenue 1,912,530 2,206,970 2,333,804 2,346,452 2,206,529 227 Health Lab Special Revenue 444,173 285,290 285,290 285,290 155,100 228 Room Tax Special Revenue 375,434 389,500 409,500 409,500 389,500
Total Special Revenue Funds 10,174,748$ 10,331,744$ 11,510,530$ 11,470,534$ 11,543,086$
300 Debt Service Debt Service 42,701,276$ 20,648,440$ 20,648,440$ 20,648,440$ 19,482,040$
450 General Obligation Bond Fund Capital Projects 12,742,673$ 11,779,059$ 18,065,709$ 14,462,031$ 10,869,875$ 451 Equipment Replacement Fund Capital Projects 3,737,757 3,560,200 4,810,562 4,210,865 3,930,000 452 Intergovernmental Revenue Sharing Capital Projects 1,413,020 4,117,620 4,414,846 4,418,617 2,287,545
Total Capital Project Funds 17,893,450$ 19,456,879$ 27,291,117$ 23,091,513 17,087,420$
602 Transit Enterprise 9,310,044 20,375,545 22,986,898 22,237,664 10,014,879 603 Parking System Enterprise 895,202 1,101,636 1,185,935 1,185,995 1,405,326 604 Storm Water Utility Enterprise 5,667,044 7,115,745 7,703,107 9,255,633 7,647,165 606 Civic Centre Enterprise 294,903 671,000 671,097 671,097 299,000 607 Radio Communication Resources Enterprise 280,650 265,905 265,905 265,905 246,378
Total Enterprise Funds 16,447,843$ 29,529,831$ 32,812,942$ 33,616,294$ 19,612,748$
ALL BUDGETED FUNDSSummary of Expenditures
Page 22

2021 20212020 Orignal Revised 2021 2022
Fund Fund Name Fund Type Actual Budget Budget Estimated Budget
ALL BUDGETED FUNDSSummary of Expenditures
600 Water Utility Enterprise-Utilities 20,789,769$ 20,700,000$ 20,700,000$ 20,572,000$ 21,500,000$ 601 WasteWater Utility Enterprise-Utilities 11,994,776 12,690,964 12,690,964 12,458,000 12,936,911
32,784,545$ 33,390,964$ 33,390,964$ 33,030,000$ 34,436,911$
700 Equipment Maintenance Internal Service 3,691,760$ 3,927,153$ 3,955,257$ 3,891,432$ 4,269,411$ 701 Information Systems Internal Service 3,153,515 3,650,237 4,350,835 3,813,749 4,352,128 702 Building Complex Internal Service 2,940,806 3,017,523 3,031,267 3,213,542 3,181,950 703 Insurance Internal Service 16,281,067 19,449,692 19,484,699 18,484,699 19,136,849 704 Telephone Internal Service 203,276 112,392 112,392 112,392 112,100
Total Internal Service Funds 26,270,424$ 30,156,997$ 30,934,450$ 29,515,814$ 31,052,438$
Total Expenditures-All Funds 228,457,648$ 227,760,262$ 240,580,930$ 234,966,778$ 217,958,648$
General Fund37%
Special Revenue 4%
Debt Service
9%
Capital Projects
9%
Enterprise 13%
Internal Service13%
Enterprise-Utilities 15%
2021 Expenditures by Fund Type
General Fund39%
Special Revenue5%
Debt Service9%
Capital Projects8%
Enterprise 9%
Enterprise-Utilities 16%
Internal Service14%
2022 Expenditures by Fund Type
Page 23

2021 % Increase2020 Original 2022 (Decrease)
Actual Budget Budget 2022 vs 2021General Fund
Property Taxes 32,531,717$ 33,717,000$ 33,946,450$ 0.68%Other Taxes 476,959 350,000 400,000 14.29%Intergovernmental Revenues 35,574,900 33,442,071 33,368,994 -0.22%Licenses and Permits 2,482,038 2,303,435 2,030,380 -11.85%Fines and Forfeitures 972,086 1,122,000 1,122,000 0.00%Charges for Services 3,822,434 4,233,280 4,446,080 5.03%Intergovernmental Charges for Services 2,033,100 1,895,003 1,920,027 1.32%Miscellaneous Revenues 1,325,758 644,144 649,550 0.84%Other Financing Sources 4,922,462 6,538,474 6,860,524 4.93%
84,141,454$ 84,245,407$ 84,744,005$ 0.59%
Special Revenue FundsProperty Taxes 3,301,197$ 2,879,692$ 2,865,444$ -0.49%Other Taxes 234,473 367,000 367,000 0.00%Intergovernmental Revenues 1,959,438 2,024,600 2,332,260 15.20%License and Permits - - 250,000 100.00%Fines and Forfeitures 150,010 200,000 200,000 0.00%Charges for Services 4,411,031 4,642,040 4,624,225 -0.38%Miscellaneous Revenues 280,781 61,500 82,500 34.15%Other Financing Sources - 156,912 821,657 423.64%
10,336,930$ 10,331,744$ 11,543,086$ 11.72%
Debt Service FundsProperty Taxes 16,211,230$ 19,500,000$ 18,600,000$ -4.62%Intergovernmental Revenues - - - 0.00%Miscellaneous Revenues 239,547 29,127 - -100.00%Other Financing Sources 26,202,010 1,119,313 882,040 -21.20%
42,652,787$ 20,648,440$ 19,482,040$ -5.65%
ALL BUDGETED FUNDSSummary of Revenues
Page 24
2021 % Increase2020 Original 2022 (Decrease)
Actual Budget Budget 2022 vs 2021
ALL BUDGETED FUNDSSummary of Revenues
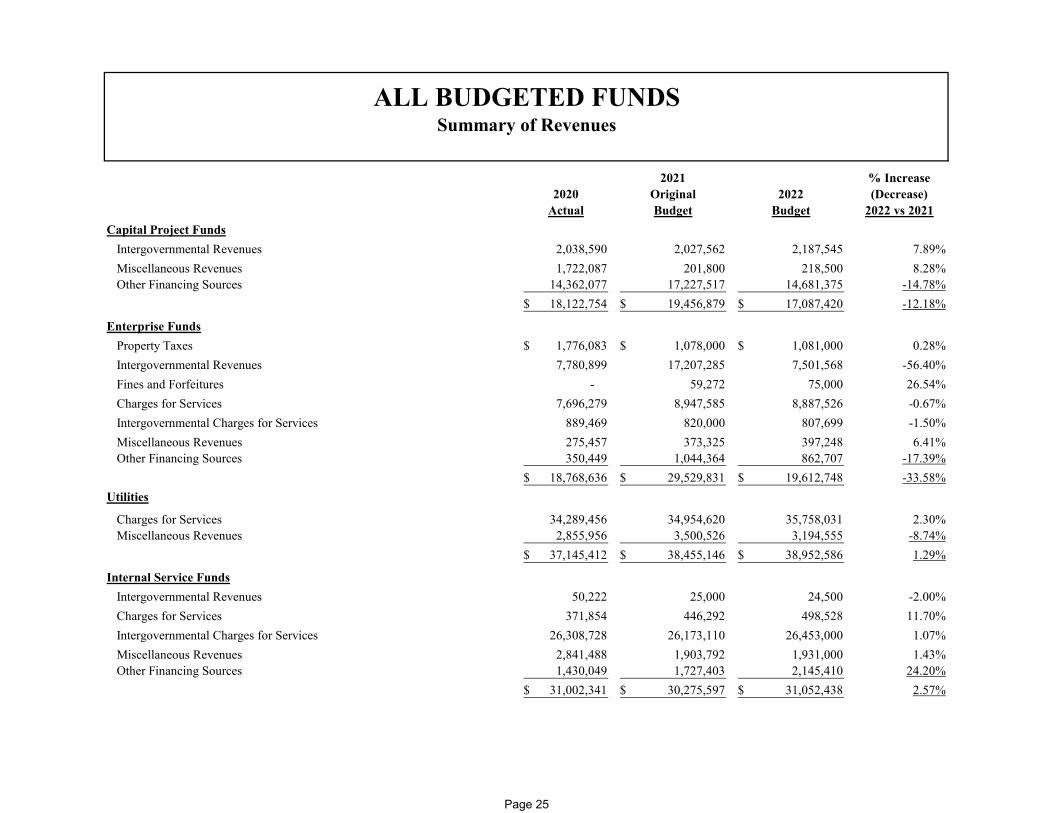
Capital Project FundsIntergovernmental Revenues 2,038,590 2,027,562 2,187,545 7.89%Miscellaneous Revenues 1,722,087 201,800 218,500 8.28%Other Financing Sources 14,362,077 17,227,517 14,681,375 -14.78%
18,122,754$ 19,456,879$ 17,087,420$ -12.18%
Enterprise FundsProperty Taxes 1,776,083$ 1,078,000$ 1,081,000$ 0.28%Intergovernmental Revenues 7,780,899 17,207,285 7,501,568 -56.40%Fines and Forfeitures - 59,272 75,000 26.54%Charges for Services 7,696,279 8,947,585 8,887,526 -0.67%Intergovernmental Charges for Services 889,469 820,000 807,699 -1.50%Miscellaneous Revenues 275,457 373,325 397,248 6.41%Other Financing Sources 350,449 1,044,364 862,707 -17.39%
18,768,636$ 29,529,831$ 19,612,748$ -33.58%Utilities
Charges for Services 34,289,456 34,954,620 35,758,031 2.30%Miscellaneous Revenues 2,855,956 3,500,526 3,194,555 -8.74%
37,145,412$ 38,455,146$ 38,952,586$ 1.29%
Internal Service FundsIntergovernmental Revenues 50,222 25,000 24,500 -2.00%Charges for Services 371,854 446,292 498,528 11.70%Intergovernmental Charges for Services 26,308,728 26,173,110 26,453,000 1.07%Miscellaneous Revenues 2,841,488 1,903,792 1,931,000 1.43%Other Financing Sources 1,430,049 1,727,403 2,145,410 24.20%
31,002,341$ 30,275,597$ 31,052,438$ 2.57%
Page 25

2021 % Increase2020 Original 2022 (Decrease)
Actual Budget Budget 2022 vs 2021
ALL BUDGETED FUNDSSummary of Revenues
Total All Funds
Property Taxes 53,820,227$ 57,174,692$ 56,492,894$ -1.19%Other Taxes 711,432 717,000 767,000 6.97%Intergovernmental Revenues 47,404,049 54,726,518 45,414,867 -17.01%Licenses and Permits 2,482,038 2,303,435 2,280,380 -1.00%Fines and Forfeitures 1,122,096 1,381,272 1,397,000 1.14%Charges for Services 50,591,054 53,223,817 54,214,390 1.86%Intergovernmental Charges for Services 29,231,297 28,888,113 29,180,726 1.01%Miscellaneous Revenues 9,541,074 6,714,214 6,473,353 -3.59%Other Financing Sources 47,267,047 27,813,983 26,253,713 -5.61%
242,170,314$ 232,943,044$ 222,474,323$ -4.49%
Property Taxes25%
Other Taxes0%
Intergovernmental
Revenues23%
Licenses and
Permits1%
Fines and Forfeitures
1%
Charges for Services23%
Intergovernmental Charges for Services
12%
Miscellaneous Revenues…
Other Financing Sources12%
2021 Revenue by Category
Property Taxes25%
Other Taxes0%
Intergovernmental Revenues
21%
Licenses and
Permits1%
Fines and Forfeitures
1%
Charges for Services24%
Intergovernmental Charges for Services
13%
Miscellaneous Revenues
3%
Other Financing Sources12%
2022 Revenue by Category
Page 26

2017 2018 2019 2020 2021 2022Fund Budget Budget Budget Budget Budget Budget
General Fund 32,468,900$ 32,204,966$ 32,205,500$ 32,531,720$ 33,717,000$ 33,946,450$
Library 1,910,909 2,239,208 2,465,271 2,504,816 2,254,816 2,257,317 Recycling 331,515 285,932 314,725 - - - Municipal Court 86,605 92,468 140,165 156,405 188,015 163,626 Cemetery 202,744 230,000 222,849 233,166 201,571 204,720 Neighborhood Enhancement - - - - - 109,681 Health Lab 249,687 270,900 388,368 406,810 235,290 130,100 Debt Service 17,108,267 17,404,776 17,013,053 16,211,230 19,500,000 18,600,000 Transit 1,200,000 1,300,000 1,276,319 1,480,083 782,000 782,000 Civic Centre 293,000 294,000 296,000 296,000 296,000 299,000
53,851,627$ 54,322,250$ 54,322,250$ 53,820,230$ 57,174,692$ 56,492,894$
TAX LEVY ALLOCATION BY FUNDSUMMARY OF TAX LEVY
$32,468,900 $32,204,966 $32,205,500 $32,531,720 $33,717,000 $33,946,450
17,108,267 17,404,776 17,013,053 16,211,230 19,500,000 18,600,000
$‐
$10,000,000
$20,000,000
$30,000,000
$40,000,000
$50,000,000
$60,000,000
$70,000,000
2017 2018 2019 2020 2021 2022
General Fund Debt Service Library Transit Other
Page 27

2017 2018 2019 2020 2021 2022Fund Budget Budget Budget Budget Budget Budget
General Fund 1,305,000$ 2,480,000$ 2,400,000$ 1,465,759$ 1,000,000$ 2,429,740$ Library 98,367 100,000 150,000 119,052 21,912 - Cemetery 100,000 90,000 130,000 100,000 85,000 100,000 Other Special Revenue 35,367 128,279 280,000 50,000 50,000 25,000 Debt Service 300,000 - - - - 51,971 Enterprise 97,553 4,741 96,914 454,049 79,364 540,507 Health Insurance 1,200,000 1,750,000 1,700,000 525,000 - 257,849 Other Internal Service 423,990 399,534 229,012 70,394 37,403 56,561
3,560,277$ 4,952,554$ 4,985,926$ 2,784,254$ 1,273,679$ 3,461,628$
OPERATING BUDGET FUND BALANCE APPLIEDSUMMARY OF RESERVES USED
General Fund
General Fund General Fund
General FundGeneral Fund
General Fund
Health Insurance
Health Insurance Health Insurance
Health Insurance
Health Insurance
Health Insurance
$‐
$1,000,000
$2,000,000
$3,000,000
$4,000,000
$5,000,000
$6,000,000
2017 2018 2019 2020 2021 2022
General Fund Debt Service Library EnterpriseOther Internal Service Health Insurance Other Special Revenue Cemetery
Page 28

Organizational
Summary
Page 29

First Jeff CoeSecond Mollie JonesThird John Tate, IIFourth Edwin SantiagoFifth Melissa KaprelianSixth Jeffrey PetersonSeventh Maurice HortonEighth Marcus T. WestNinth Terry McCarthyTenth Sam PeeteEleventh CJ RouseTwelfth Henry PerezThirteenth Natalia TaftFourteenth Jason MeekmaFifteenth Melissa Lemke
Common Council
President: John Tate, II
MAYOR Cory Mason
Page 30
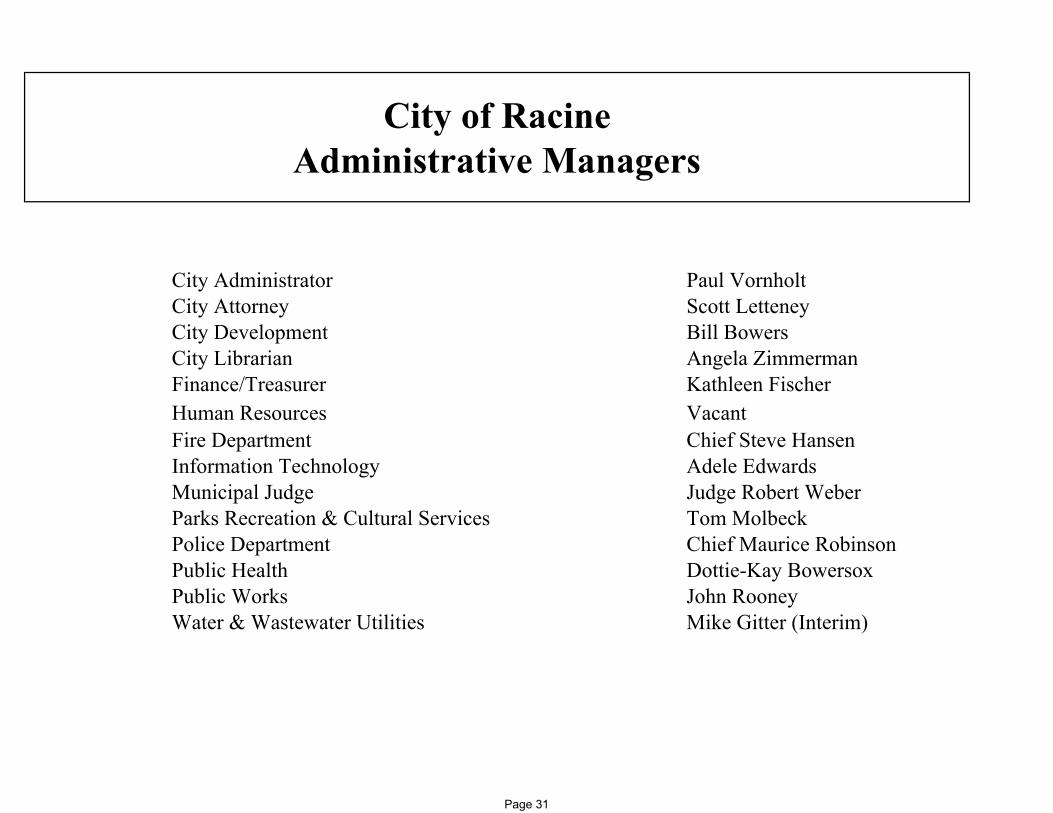
City Administrator Paul VornholtCity Attorney Scott LetteneyCity Development Bill BowersCity Librarian Angela ZimmermanFinance/Treasurer Kathleen FischerHuman Resources VacantFire Department Chief Steve HansenInformation Technology Adele EdwardsMunicipal Judge Judge Robert WeberParks Recreation & Cultural Services Tom MolbeckPolice Department Chief Maurice RobinsonPublic Health Dottie-Kay BowersoxPublic Works John RooneyWater & Wastewater Utilities Mike Gitter (Interim)
City of Racine Administrative Managers
Page 31

Natalia Taft-Chairwoman Samuel PeeteJason Meekma John Tate, IIMarcus West
Mollie Jones - Chairman Terry McCarthyCJ Rouse Melissa LemkeEdwin Santiago
Jeff Coe - Chairman Maurice HortonMelissa Kaprelian Henry PerezJeffrey Peterson
Finance & Personnel Committee Chairman Natalia TaftPublic Works & Services Committee Chairman Mollie Jones
Public Safety & Licensing Committee Chairman Jeff CoeAlderman at Large
Committee of the WholeAll Aldermen
Executive CommitteeMayor Cory Mason
Council President John Tate, II
COUNCIL COMMITTEES2021-2022
Finance & Personnel Committee
Public Works & Services Committee
Public Safety & Licensing Committee
Page 32
2021 20212020 Orignal Revised 2021 2022
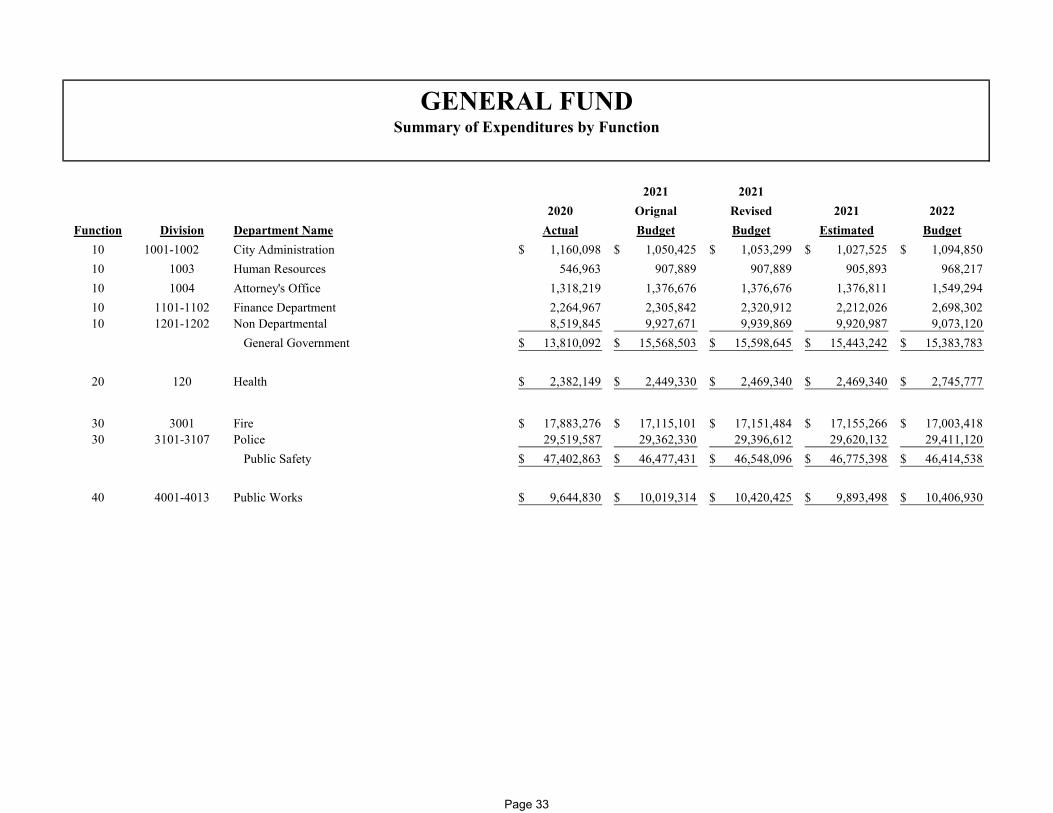
Function Division Department Name Actual Budget Budget Estimated Budget10 1001-1002 City Administration 1,160,098$ 1,050,425$ 1,053,299$ 1,027,525$ 1,094,850$ 10 1003 Human Resources 546,963 907,889 907,889 905,893 968,217 10 1004 Attorney's Office 1,318,219 1,376,676 1,376,676 1,376,811 1,549,294 10 1101-1102 Finance Department 2,264,967 2,305,842 2,320,912 2,212,026 2,698,302 10 1201-1202 Non Departmental 8,519,845 9,927,671 9,939,869 9,920,987 9,073,120
General Government 13,810,092$ 15,568,503$ 15,598,645$ 15,443,242$ 15,383,783$
20 120 Health 2,382,149$ 2,449,330$ 2,469,340$ 2,469,340$ 2,745,777$
30 3001 Fire 17,883,276$ 17,115,101$ 17,151,484$ 17,155,266$ 17,003,418$ 30 3101-3107 Police 29,519,587 29,362,330 29,396,612 29,620,132 29,411,120
Public Safety 47,402,863$ 46,477,431$ 46,548,096$ 46,775,398$ 46,414,538$
40 4001-4013 Public Works 9,644,830$ 10,019,314$ 10,420,425$ 9,893,498$ 10,406,930$
GENERAL FUNDSummary of Expenditures by Function
Page 33
2021 20212020 Orignal Revised 2021 2022
Function Division Department Name Actual Budget Budget Estimated Budget
GENERAL FUNDSummary of Expenditures by Function
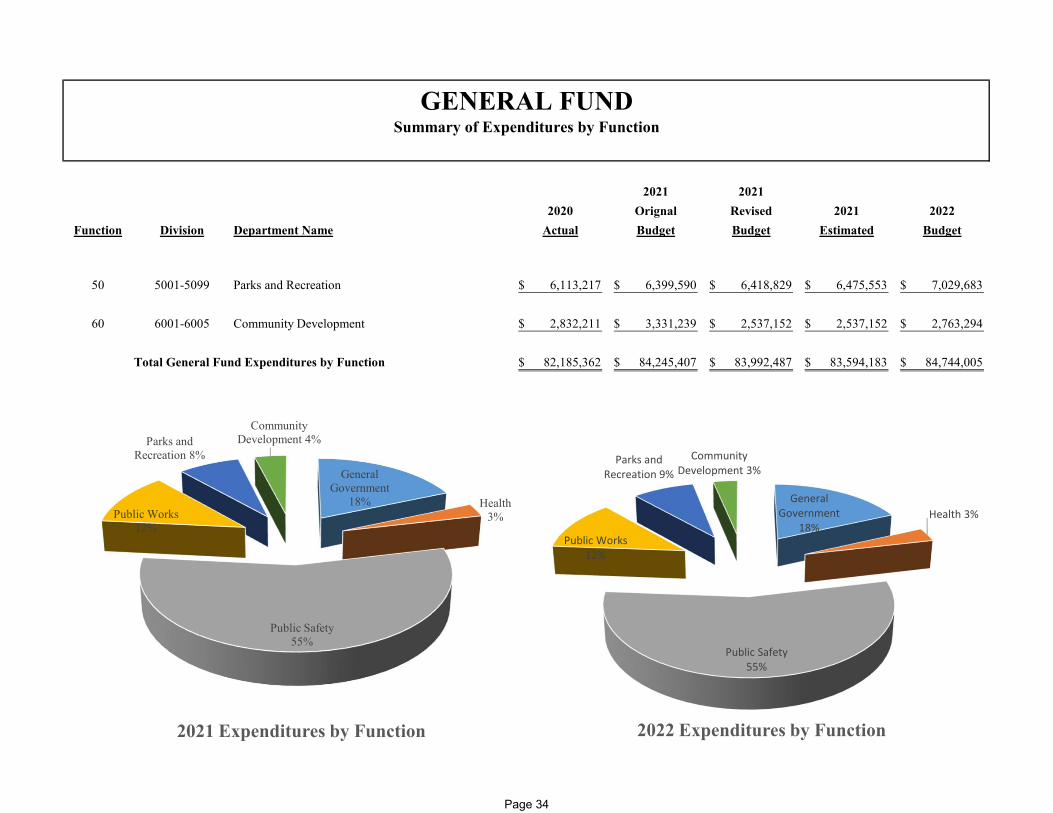
50 5001-5099 Parks and Recreation 6,113,217$ 6,399,590$ 6,418,829$ 6,475,553$ 7,029,683$
60 6001-6005 Community Development 2,832,211$ 3,331,239$ 2,537,152$ 2,537,152$ 2,763,294$
Total General Fund Expenditures by Function 82,185,362$ 84,245,407$ 83,992,487$ 83,594,183$ 84,744,005$
General Government
18% Health3%
Public Safety55%
Public Works12%
Parks and Recreation 8%
Community Development 4%
2021 Expenditures by Function
General Government
18%Health 3%
Public Safety55%
Public Works12%
Parks and Recreation 9%
Community Development 3%
2022 Expenditures by Function
Page 34
2021 20212020 Original Revised 2021 2022
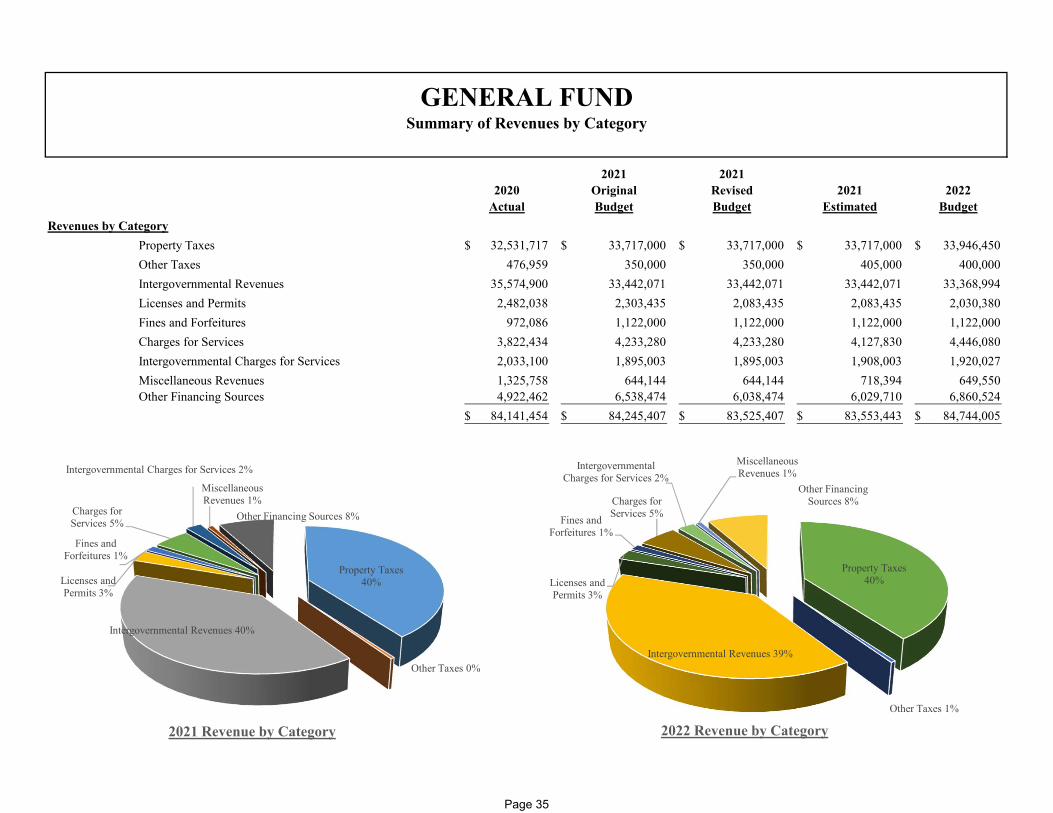
Actual Budget Budget Estimated BudgetRevenues by Category
Property Taxes 32,531,717$ 33,717,000$ 33,717,000$ 33,717,000$ 33,946,450$ Other Taxes 476,959 350,000 350,000 405,000 400,000 Intergovernmental Revenues 35,574,900 33,442,071 33,442,071 33,442,071 33,368,994 Licenses and Permits 2,482,038 2,303,435 2,083,435 2,083,435 2,030,380 Fines and Forfeitures 972,086 1,122,000 1,122,000 1,122,000 1,122,000 Charges for Services 3,822,434 4,233,280 4,233,280 4,127,830 4,446,080 Intergovernmental Charges for Services 2,033,100 1,895,003 1,895,003 1,908,003 1,920,027 Miscellaneous Revenues 1,325,758 644,144 644,144 718,394 649,550 Other Financing Sources 4,922,462 6,538,474 6,038,474 6,029,710 6,860,524
84,141,454$ 84,245,407$ 83,525,407$ 83,553,443$ 84,744,005$
GENERAL FUNDSummary of Revenues by Category
Property Taxes40%
Other Taxes 0%
Intergovernmental Revenues 40%
Licenses and Permits 3%
Fines and Forfeitures 1%
Charges for Services 5%
Intergovernmental Charges for Services 2%
Miscellaneous Revenues 1%
Other Financing Sources 8%
2021 Revenue by Category
Property Taxes40%
Other Taxes 1%
Intergovernmental Revenues 39%
Licenses and Permits 3%
Fines and Forfeitures 1%
Charges for Services 5%
Intergovernmental Charges for Services 2%
Miscellaneous Revenues 1%
Other Financing Sources 8%
2022 Revenue by Category
Page 35
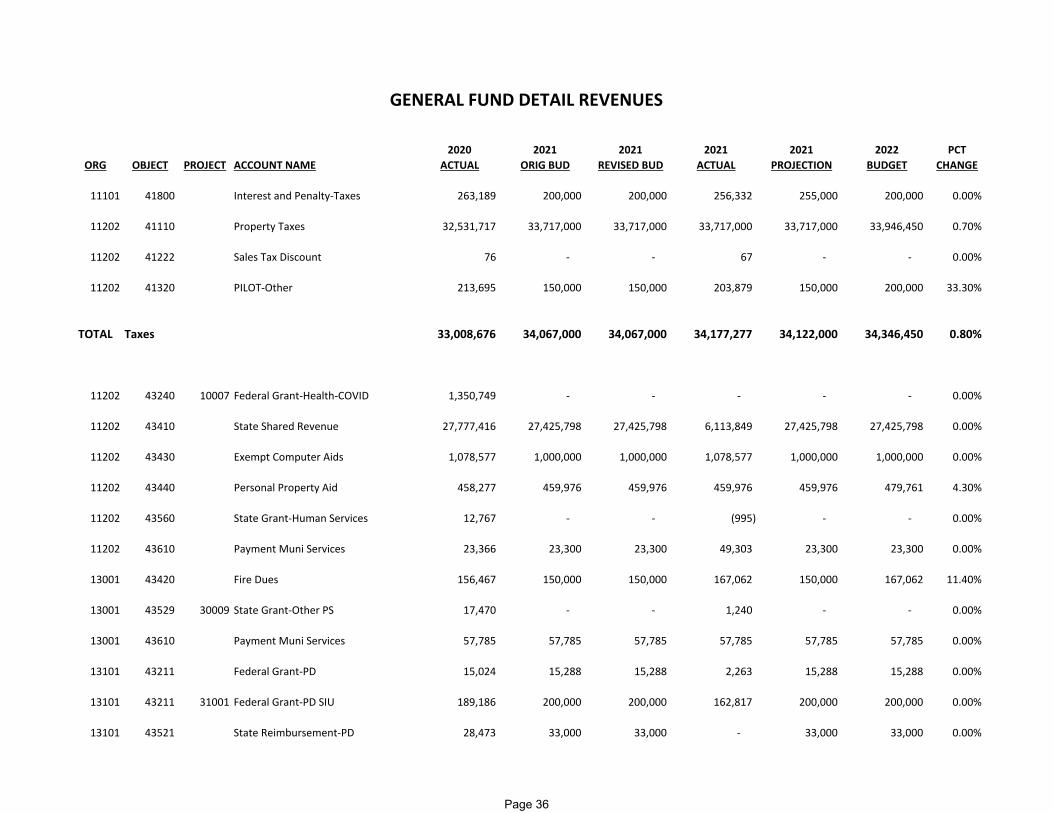
2020 2021 2021 2021 2021 2022 PCTORG OBJECT PROJECT ACCOUNT NAME ACTUAL ORIG BUD REVISED BUD ACTUAL PROJECTION BUDGET CHANGE
11101 41800 Interest and Penalty‐Taxes 263,189 200,000 200,000 256,332 255,000 200,000 0.00%
11202 41110 Property Taxes 32,531,717 33,717,000 33,717,000 33,717,000 33,717,000 33,946,450 0.70%
11202 41222 Sales Tax Discount 76 ‐ ‐ 67 ‐ ‐ 0.00%
11202 41320 PILOT‐Other 213,695 150,000 150,000 203,879 150,000 200,000 33.30%
TOTAL Taxes 33,008,676 34,067,000 34,067,000 34,177,277 34,122,000 34,346,450 0.80%
11202 43240 10007 Federal Grant‐Health‐COVID 1,350,749 ‐ ‐ ‐ ‐ ‐ 0.00%
11202 43410 State Shared Revenue 27,777,416 27,425,798 27,425,798 6,113,849 27,425,798 27,425,798 0.00%
11202 43430 Exempt Computer Aids 1,078,577 1,000,000 1,000,000 1,078,577 1,000,000 1,000,000 0.00%
11202 43440 Personal Property Aid 458,277 459,976 459,976 459,976 459,976 479,761 4.30%
11202 43560 State Grant‐Human Services 12,767 ‐ ‐ (995) ‐ ‐ 0.00%
11202 43610 Payment Muni Services 23,366 23,300 23,300 49,303 23,300 23,300 0.00%
13001 43420 Fire Dues 156,467 150,000 150,000 167,062 150,000 167,062 11.40%
13001 43529 30009 State Grant‐Other PS 17,470 ‐ ‐ 1,240 ‐ ‐ 0.00%
13001 43610 Payment Muni Services 57,785 57,785 57,785 57,785 57,785 57,785 0.00%
13101 43211 Federal Grant‐PD 15,024 15,288 15,288 2,263 15,288 15,288 0.00%
13101 43211 31001 Federal Grant‐PD SIU 189,186 200,000 200,000 162,817 200,000 200,000 0.00%
13101 43521 State Reimbursement‐PD 28,473 33,000 33,000 ‐ 33,000 33,000 0.00%
GENERAL FUND DETAIL REVENUES
Page 36

2020 2021 2021 2021 2021 2022 PCTORG OBJECT PROJECT ACCOUNT NAME ACTUAL ORIG BUD REVISED BUD ACTUAL PROJECTION BUDGET CHANGE
14010 43531 General Transp Aids 4,007,596 3,824,924 3,824,924 2,864,934 3,824,924 3,715,000 ‐2.90%
14010 43533 State‐Other Highway 401,747 252,000 252,000 336,507 252,000 252,000 0.00%
TOTAL Intergovern Revenues 35,574,900 33,442,071 33,442,071 11,293,318 33,442,071 33,368,994 ‐0.20%
11101 44100 Liquor/Tavern License 114,465 96,710 96,710 98,035 96,710 98,910 2.30%
11101 44110 Business License‐Other 44,750 82,000 82,000 62,340 82,000 55,745 ‐32.00%
11101 44120 Stationary Engineer License ‐ 4,375 4,375 ‐ 4,375 4,375 0.00%
11101 44930 Property Registration 118,855 2,350 2,350 35,553 2,350 2,350 0.00%
11202 44900 Cable Franchise 814,540 815,000 815,000 470,116 815,000 781,000 ‐4.20%
120 44110 Business License‐Other 207,501 200,000 200,000 207,431 200,000 200,000 0.00%
120 44140 Weights and Measures 29,309 27,000 27,000 28,869 27,000 27,000 0.00%
120 44200 Animal Licenses 46,050 58,000 58,000 38,763 58,000 58,000 0.00%
13001 44330 Fire Permits‐Other 18,343 7,500 7,500 20,691 7,500 7,500 0.00%
14002 44320 Sidewalk/Street Permits 72,375 75,000 75,000 75,723 75,000 80,000 6.70%
14013 44330 Permits‐Other ‐ ‐ ‐ 100 ‐ ‐ 0.00%
14013 44920 Other Permits‐Area Priveledge 11,628 14,000 14,000 11,084 14,000 14,000 0.00%
16003 44300 Building Permits 764,751 700,000 700,000 651,772 700,000 700,000 0.00%
16003 44310 Property Inspection Fee 238,390 ‐ ‐ (800) ‐ ‐ 0.00%
16003 44330 Permits‐Other 960 500 500 450 500 500 0.00%
16003 44400 Zoning Permits 120 1,000 1,000 180 1,000 1,000 0.00%
Page 37

2020 2021 2021 2021 2021 2022 PCTORG OBJECT PROJECT ACCOUNT NAME ACTUAL ORIG BUD REVISED BUD ACTUAL PROJECTION BUDGET CHANGE
16006 44310 Property Inspection Fee ‐ 220,000 ‐ ‐ ‐ ‐ ‐100.00%
TOTAL Licenses and Permits 2,482,038 2,303,435 2,083,435 1,700,306 2,083,435 2,030,380 ‐11.90%
13101 45110 Muni Court Fines 311,648 400,000 400,000 289,447 400,000 400,000 0.00%
13101 45120 County Court Fines 756 2,000 2,000 592 2,000 2,000 0.00%
13101 45130 Parking Fines 620,290 700,000 700,000 546,617 700,000 700,000 0.00%
14010 45222 Judgments/Damages‐DPW 8,281 ‐ ‐ ‐ ‐ ‐ 0.00%
14013 45222 Judgments/Damages‐DPW 31,111 20,000 20,000 10,569 20,000 20,000 0.00%
TOTAL Fines and Forfeiture 972,086 1,122,000 1,122,000 847,224 1,122,000 1,122,000 0.00%
11003 46120 HR Miscellaneous Fees 42 ‐ ‐ ‐ ‐ ‐ 0.00%
11004 46110 Atty/Court Costs (1,526) ‐ ‐ ‐ ‐ ‐ 0.00%
11004 46120 Atty Miscellaneous Fees 5,055 3,000 3,000 2,250 3,000 3,000 0.00%
11101 46100 Licensing Fees 18,808 17,020 17,020 23,217 22,870 11,020 ‐35.30%
11101 46120 Fin Miscellaneous Fees 9,079 9,000 9,000 6,556 9,000 9,000 0.00%
11101 46160 Tax Search Fee 73,414 65,000 65,000 67,243 65,000 65,000 0.00%
11103 46120 Asses Miscellaneous Fees (34) (300) (300) ‐ (300) ‐ ‐100.00%
11202 46120 Miscellaneous Fees 309 200 200 ‐ 200 200 0.00%
11202 46140 Property Rentals 11,751 12,000 12,000 12,056 12,000 12,000 0.00%
Page 38

2020 2021 2021 2021 2021 2022 PCTORG OBJECT PROJECT ACCOUNT NAME ACTUAL ORIG BUD REVISED BUD ACTUAL PROJECTION BUDGET CHANGE
120 46590 Health Services Charges 39,688 58,000 58,000 38,374 58,000 58,000 0.00%
13001 46220 Fire Inspection Fees 538,900 538,000 538,000 538,437 538,000 538,000 0.00%
13001 46230 Ambulance/EMS Fees 2,571,145 2,250,000 2,250,000 1,808,403 2,250,000 2,300,000 2.20%
13101 46210 Charges‐PD 16,305 25,000 25,000 15,847 25,000 25,000 0.00%
13101 46290 Towing Fees 71,729 100,000 100,000 68,090 100,000 100,000 0.00%
13105 46210 Charges‐PD 1,000 1,500 1,500 958 1,500 1,500 0.00%
14001 46130 Plan/Street Fees 2,100 2,000 2,000 1,055 2,000 2,000 0.00%
14001 46140 Property Rentals 2,871 2,450 2,450 2,989 2,450 2,450 0.00%
14001 46150 Special Event Fees 25 1,000 1,000 3,375 3,200 1,000 0.00%
14002 46311 Engineering Design Charges 77,392 35,000 35,000 22,591 35,000 52,500 50.00%
14006 46431 Solid Waste Disposal Fee 241,786 200,000 200,000 175,718 200,000 200,000 0.00%
14006 46436 Pearl Street Fees ‐ ‐ ‐ ‐ ‐ 30,000 0.00%
14010 46310 Highway/Street Charges ‐ 549,000 549,000 505,000 549,000 569,000 3.60%
15002 46743 Community Center Revenues 2,202 6,000 6,000 1,621 2,500 8,000 33.30%
15003 46720 Charges‐Parks 1,880 28,000 28,000 33,720 32,000 32,000 14.30%
15003 46753 Park and Rec Rental 75,825 78,200 78,200 19,550 78,200 78,200 0.00%
15004 46120 Miscellaneous Fees ‐ 210 210 50 210 210 0.00%
15004 46750 Youth Activities 15,034 42,000 42,000 44,479 4,000 42,000 0.00%
15004 46751 Adult Activities (354) 140,000 140,000 92,558 73,000 140,000 0.00%
15004 46753 Park and Rec Rental 2,932 10,000 10,000 7,210 8,000 10,000 0.00%
15004 46755 Boat Launch Charges 22,294 15,000 15,000 ‐ 15,000 15,000 0.00%
Page 39

2020 2021 2021 2021 2021 2022 PCTORG OBJECT PROJECT ACCOUNT NAME ACTUAL ORIG BUD REVISED BUD ACTUAL PROJECTION BUDGET CHANGE
15004 46756 Rec‐Contract Concessions ‐ 15,000 15,000 15,338 8,000 10,000 ‐33.30%
16001 46843 CD‐Misc. Fees 18,530 25,000 25,000 46,975 25,000 25,000 0.00%
16003 46900 Razing & Removing ‐ ‐ ‐ ‐ ‐ 100,000 0.00%
16004 46843 CD‐Misc. Fees 4,252 6,000 6,000 1,154 6,000 6,000 0.00%
TOTAL Charges for Services 3,822,434 4,233,280 4,233,280 3,554,815 4,127,830 4,446,080 5.00%
11202 47390 Other Services to Local Govmt 400,000 150,000 150,000 150,000 150,000 150,000 0.00%
11202 47400 Storm Water Services 15,000 15,000 15,000 11,250 15,000 15,000 0.00%
11202 47401 Transit Services 162,000 165,000 165,000 121,500 165,000 165,000 0.00%
11202 47402 Parking System Services 15,000 17,000 17,000 9,625 17,000 17,000 0.00%
11202 47403 Radio Communication Services 2,000 2,500 2,500 3,125 2,500 2,500 0.00%
11202 47404 Water/Wastewater Services 175,000 180,000 180,000 135,000 180,000 180,000 0.00%
120 47350 Intergov Charges‐Health 4,456 4,456 4,456 0 4,456 ‐ ‐100.00%
13001 47323 Intergov Charges‐Fire ‐ ‐ ‐ ‐ ‐ 46,000 0.00%
13001 47406 Bridge Washing 4,000 6,500 6,500 6,500 6,500 6,500 0.00%
13101 47321 31041 Intergov Charges‐PD‐Unified 77,659 85,000 85,000 56,330 85,000 85,000 0.00%
14006 47400 Storm Water Services 250,345 298,713 298,713 187,759 298,713 276,193 ‐7.50%
14006 47405 Interdep Equipment Rental 480,000 480,000 480,000 360,000 480,000 480,000 0.00%
14010 47402 Parking System Services 20,000 27,000 27,000 15,000 27,000 28,000 3.70%
14010 47405 Interdep Equipment Rental 403,834 403,834 403,834 302,538 403,834 403,834 0.00%
Page 40
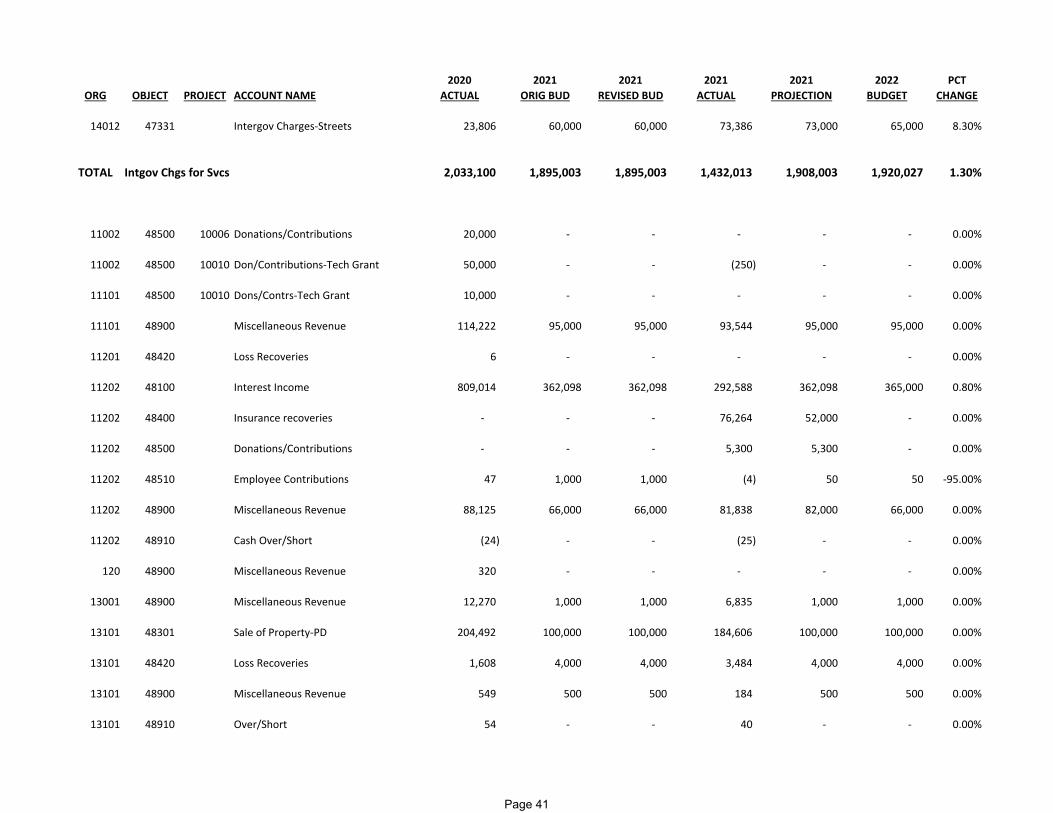
2020 2021 2021 2021 2021 2022 PCTORG OBJECT PROJECT ACCOUNT NAME ACTUAL ORIG BUD REVISED BUD ACTUAL PROJECTION BUDGET CHANGE
14012 47331 Intergov Charges‐Streets 23,806 60,000 60,000 73,386 73,000 65,000 8.30%
TOTAL Intgov Chgs for Svcs 2,033,100 1,895,003 1,895,003 1,432,013 1,908,003 1,920,027 1.30%
11002 48500 10006 Donations/Contributions 20,000 ‐ ‐ ‐ ‐ ‐ 0.00%
11002 48500 10010 Don/Contributions‐Tech Grant 50,000 ‐ ‐ (250) ‐ ‐ 0.00%
11101 48500 10010 Dons/Contrs‐Tech Grant 10,000 ‐ ‐ ‐ ‐ ‐ 0.00%
11101 48900 Miscellaneous Revenue 114,222 95,000 95,000 93,544 95,000 95,000 0.00%
11201 48420 Loss Recoveries 6 ‐ ‐ ‐ ‐ ‐ 0.00%
11202 48100 Interest Income 809,014 362,098 362,098 292,588 362,098 365,000 0.80%
11202 48400 Insurance recoveries ‐ ‐ ‐ 76,264 52,000 ‐ 0.00%
11202 48500 Donations/Contributions ‐ ‐ ‐ 5,300 5,300 ‐ 0.00%
11202 48510 Employee Contributions 47 1,000 1,000 (4) 50 50 ‐95.00%
11202 48900 Miscellaneous Revenue 88,125 66,000 66,000 81,838 82,000 66,000 0.00%
11202 48910 Cash Over/Short (24) ‐ ‐ (25) ‐ ‐ 0.00%
120 48900 Miscellaneous Revenue 320 ‐ ‐ ‐ ‐ ‐ 0.00%
13001 48900 Miscellaneous Revenue 12,270 1,000 1,000 6,835 1,000 1,000 0.00%
13101 48301 Sale of Property‐PD 204,492 100,000 100,000 184,606 100,000 100,000 0.00%
13101 48420 Loss Recoveries 1,608 4,000 4,000 3,484 4,000 4,000 0.00%
13101 48900 Miscellaneous Revenue 549 500 500 184 500 500 0.00%
13101 48910 Over/Short 54 ‐ ‐ 40 ‐ ‐ 0.00%
Page 41
2020 2021 2021 2021 2021 2022 PCTORG OBJECT PROJECT ACCOUNT NAME ACTUAL ORIG BUD REVISED BUD ACTUAL PROJECTION BUDGET CHANGE
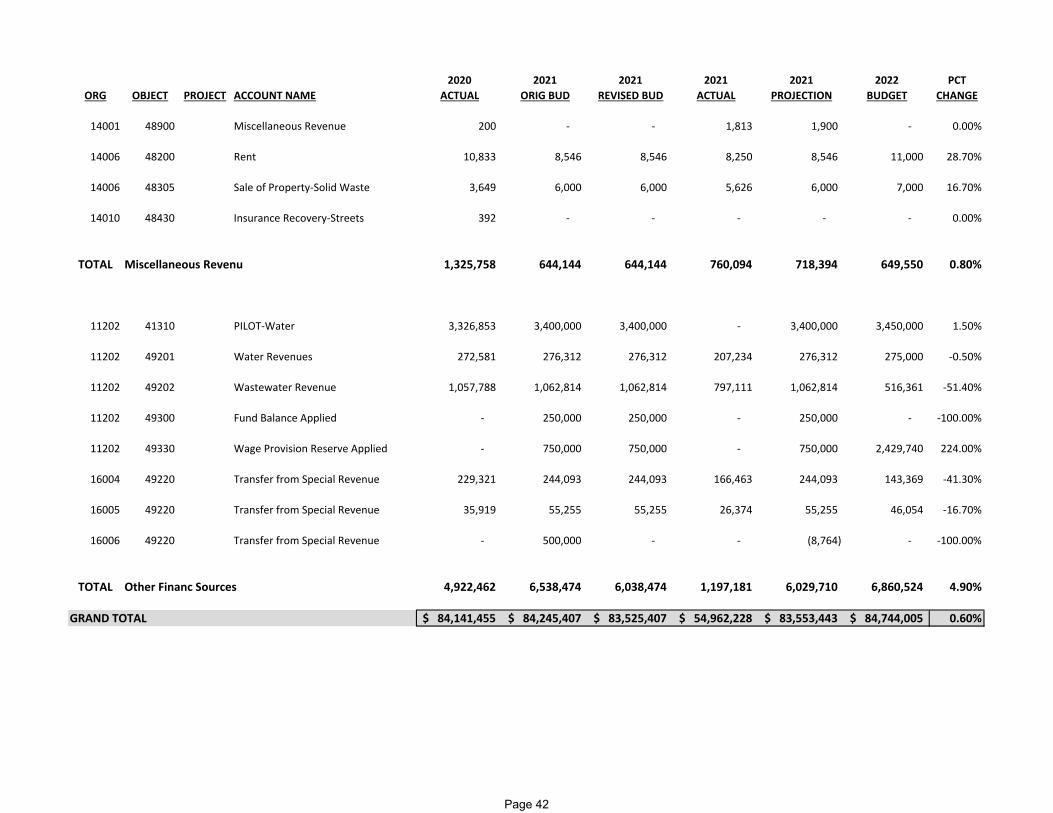
14001 48900 Miscellaneous Revenue 200 ‐ ‐ 1,813 1,900 ‐ 0.00%
14006 48200 Rent 10,833 8,546 8,546 8,250 8,546 11,000 28.70%
14006 48305 Sale of Property‐Solid Waste 3,649 6,000 6,000 5,626 6,000 7,000 16.70%
14010 48430 Insurance Recovery‐Streets 392 ‐ ‐ ‐ ‐ ‐ 0.00%
TOTAL Miscellaneous Revenu 1,325,758 644,144 644,144 760,094 718,394 649,550 0.80%
11202 41310 PILOT‐Water 3,326,853 3,400,000 3,400,000 ‐ 3,400,000 3,450,000 1.50%
11202 49201 Water Revenues 272,581 276,312 276,312 207,234 276,312 275,000 ‐0.50%
11202 49202 Wastewater Revenue 1,057,788 1,062,814 1,062,814 797,111 1,062,814 516,361 ‐51.40%
11202 49300 Fund Balance Applied ‐ 250,000 250,000 ‐ 250,000 ‐ ‐100.00%
11202 49330 Wage Provision Reserve Applied ‐ 750,000 750,000 ‐ 750,000 2,429,740 224.00%
16004 49220 Transfer from Special Revenue 229,321 244,093 244,093 166,463 244,093 143,369 ‐41.30%
16005 49220 Transfer from Special Revenue 35,919 55,255 55,255 26,374 55,255 46,054 ‐16.70%
16006 49220 Transfer from Special Revenue ‐ 500,000 ‐ ‐ (8,764) ‐ ‐100.00%
TOTAL Other Financ Sources 4,922,462 6,538,474 6,038,474 1,197,181 6,029,710 6,860,524 4.90%
GRAND TOTAL 84,141,455$ 84,245,407$ 83,525,407$ 54,962,228$ 83,553,443$ 84,744,005$ 0.60%
Page 42

CITY ADMINISTRATION
Fund: 101-General Fund Department: 10-Administration Function: 10-General Administration Orgs: 11001-11002
MISSION STATEMENT
City Administration is dedicated to making Racine the Community of Choice in Wisconsin by focusing on equity, sustainability, and Smart City innovation. These efforts work together to improve the quality of life for all of our residents.
FUNCTION
Administration works internally with City departments as well as external stakeholders to set strategic goals and prioritize initiatives that align with the mission of making Racine a more sustainable, smart, equitable, and inclusive community.
SIGNIFICANT INITIATIVES RECENTLY ACCOMPLISHED
Sustainability:
● Completed energy audit for the City. ● Continued to support and expand Solar Group Buy. ● Deployed first public electric vehicle charging station at City Hall ● By the end of 2021, will deploy the largest fleet of electric city buses in the state ● Worked with Developers on ways to certify housing developments at a minimum LEED Silver level
Page 43

CITY ADMINISTRATION
Fund: 101-General Fund Department: 10-Administration Function: 10-General Administration Orgs: 11001-11002
Equitable & Inclusive Community:
Launched Racine Financial Empowerment Center (FEC) in December 2020 and managed program operations, outreach, and partnerships. Continued extensive collaboration with the YWCA of SE Wisconsin and Higher Expectations to scale the YWCA’s free adult HSED program to help
more City residents attain their diplomas. Obtained $100,000 in grant funding from WI Department of Health Services for Covid‐19 Vaccine Outreach. Lead the City’s Covid‐19 Vaccination efforts, including deploying DHS and FEMA funds, planning nearly 50 mobile vaccine clinics, convening the
Vaccinate Racine Coalition, and designing and implementing incentive strategies to increase vaccination rates. Obtained $20,000 grant from Results for America for Outreach & Communications Fellow to promote the City’s economic mobility efforts. Obtained $12,300 grant from Results for America to support the City’s internal diversity, equity, and inclusion work. Convened the staff‐level Racial Equity Leadership Team and arranged for Team to go through National League of Cities’ Race Equity and
Leadership (REAL) Normalizing Racial Equity training. Collaborating with community stakeholders and internal City staff to implement the Youth Protection Resolution.
Smart City & Other Innovations
● Continued partnership with UW‐Madison and Gateway Technical College to support research and development of autonomous vehicles in Racine.
2022 STRATEGIC INITIATIVES
● To help mitigate and adapt to the effects of climate change, the City of Racine will pass an Equitable Climate Action Plan that continues to lead with racial equity, reduce the City's municipal carbon footprint, reduce city operational costs, generate new revenue, and institutionalize sustainability throughout the organization and the Racine community by December 2022
● Continue working to reduce the carbon footprint and costs associated with nonrenewable energy resources within the City of Racine in order to meet state and federal climate goals
Page 44

CITY ADMINISTRATION
Fund: 101-General Fund Department: 10-Administration Function: 10-General Administration Orgs: 11001-11002
● Continue efforts to provide better and more streamlined customer services to the residents of the City, the Mayor’s office will increase our data
and tracking capacity to help monitor and address the need of residents on a weekly basis by implementing a new constituent tracking software program to respond to all incoming contacts within 24 hour, enter 95% of all contacts into the system, and pull reports weekly by June, 2021.
● As part of the City’s Smart Cities initiative, continue to invest in expanding our fiber network to be able to provide more public access Wi‐Fi connectivity
● Continue to support the health of the community by opening the Racine Community Health Clinic at Julian Thomas Elementary School and work to fundraise for a stand‐alone clinic in the Lincoln‐King neighborhood.
● Work to continue to expand and support the work RUSD and the YWCA have done to expand the 5.09 HSED program to help more City residents attain their high school diploma.
● Continue to work with WRTP and other partners to recruit more City residents into the Racine Works program to ensure City resident are employed on publicly funded construction and development projects, and build a sustainable path to the middle class.
● Continue to support and expand access to the Financial Empowerment Center in 2022 and continue to increase residents' credit, income, and access to wealth
● Support minority home ownership through the expansion of Land Bank and homeownership programs for City residents ● Support the HR Departments efforts to address equity and disparities in the City’s own workforce through the creation of Citywide equitable
workforce plan to hire more City residents with a focus on diversity, as well as normalizing racial equity training for all City employees through support from GARE and the National League of Cities Racine Equity and Leadership Initiative.
● Continue to lead on vaccine outreach and increasing the rate of COVID‐19 vaccination in the City of Racine
SIGNIFICANT FUNDING OR PROGRAM CHANGES IN 2022
No significant changes in funding are proposed
Page 45
2022 Goal‐Setting Statement Department Name: Mayor’s Office Department Head/Staff Name(s): Shannon Powell, Vicky Selkowe, Ellen Nuechterlein
Goal Statement #1 In order to provide better and more streamlined customer services to the residents of Racine, the Mayor’s Office will increase our data and tracking capacity to help monitor and address the needs of residents on a weekly basis by fully implementing the use of the constituent services tracking software, Racine311 by June 2022.
Goal Statement #2 In 2021, the Mayor's office successfully launched and managed the Racine Financial Empowerment Center (FEC), which has already provided free, professional, financial counseling to nearly 130 clients and helped them reduce more than $100,000 in debts. In 2022, the Mayor's office will continue to manage the FEC and, by December 31, 2022, aims to achieve the following measurable goals: serve at least 400 residents, help them reduce at least $300,000 in debts, increase savings by at least $200,000, and assist a minimum of 75 residents in raising their credit scores by 35+ points.
Goal Statement #3 In order to mitigate and adapt to the effects of climate change, the City of Racine task the newly created Climate Sustainability Officer to develop and pass an Equitable Climate Action Plan that will put the City on course to meet Federal climate action goals of reducing 50‐52 percent of emission by the year 2030, and reaching net zero emissions by the year 2050. The plan will focus on racial equity, reducing the City's municipal carbon footprint, reducing city operational costs, generates new revenue, and institutionalize sustainability throughout the organization and the Racine community by December 2022.
Page 46

Fund: 101 - General FundFunction: 10 - General GovernmentDepartment: City AdministrationDivision: 1001-1002Org: 11001-11002
2021 20212020 Orignal Revised 2021 2022
Actual Budget Budget Estimated BudgetExpenditures by Appropriation Unit
10GF1 Salaries & Fringes 688,265$ 749,720$ 749,720$ 749,720$ 776,868$ 10GF2 Operating Expenditures 255,837 89,950 92,824 67,050 89,550 10GF3 Inter-Departmental 215,996 210,755 210,755 210,755 228,432 10GF4 Capital Outlay - - - - -
Total Expenditures 1,160,098$ 1,050,425$ 1,053,299$ 1,027,525$ 1,094,850$
Expenditures by Division1001 City Council 290,391$ 292,379$ 293,729$ 286,479$ 297,695$ 1002 Mayor's Office 869,707 758,046 759,570 741,046 797,155
Total Expenditures 1,160,098$ 1,050,425$ 1,053,299$ 1,027,525$ 1,094,850$
DEPARTMENT OF ADMINISTRATIONDepartmental Expenditure Summary
City Council28%
Mayor's Office72%
2021 Costs by Division
City Council, 27%
Mayor's Office, 73%
2022 Costs by Division
Page 47

2020 2021 2021 2021 2021 2022 PCTORG OBJECT PROJECT ACCOUNT NAME ACTUAL ORIG BUD REVISED BUD ACTUAL PROJECTION PROPOSED CHANGE
11001 50200 Cncl‐Part Time Salaries 104,772 103,500 103,500 75,076 103,500 103,500 0.00%
11001 51010 Cncl‐FICA 8,014 7,920 7,920 5,743 7,920 7,920 0.00%
11001 51100 Cncl‐WRS 1,345 932 932 661 932 1,347 44.50%
11002 50100 Admn‐Salaries 384,826 444,613 444,613 313,850 444,613 468,342 5.30%
11002 50200 Admn‐Part Time Salaries 24,357 14,876 14,876 18,240 14,876 15,362 3.30%
11002 51010 Admn‐FICA 29,892 36,868 36,868 23,733 36,868 38,955 5.70%
11002 51100 Admn‐WRS 25,409 30,011 30,011 21,176 30,011 30,442 1.40%
11002 51200 Admn‐Health Care 105,300 105,300 105,300 78,975 105,300 105,300 0.00%
11002 51810 Admn‐Mileage 4,350 5,700 5,700 4,400 5,700 5,700 0.00%
TOTAL Admin General Fund Salary & Fringes 688,265 749,720 749,720 541,854 749,720 776,868 3.60%
11001 52200 Cncl‐Contracted Services 4,309 15,000 15,000 13,476 15,000 15,000 0.00%
11001 52315 Cncl‐Advertising 8,991 16,000 16,000 6,590 12,000 10,000 ‐37.50%
11001 53100 Cncl‐Office Supplies 537 500 500 808 1,000 1,000 100.00%
11001 53200 Cncl‐Work Supplies ‐ 800 800 738 800 1,500 87.50%
11001 53200 10007 Work Supplies‐COVID 15,652 ‐ ‐ ‐ ‐ ‐ 0.00%
ADMINISTRATION DETAIL EXPENDITURES
Page 48

2020 2021 2021 2021 2021 2022 PCTORG OBJECT PROJECT ACCOUNT NAME ACTUAL ORIG BUD REVISED BUD ACTUAL PROJECTION PROPOSED CHANGE11001 53275 Cncl‐Meeting Expenses 1,830 1,500 1,500 1,512 1,600 1,000 ‐33.30%
11001 53800 Cncl‐Educ/Training/Conferences 1,485 4,000 5,350 1,350 1,500 5,000 25.00%
11001 53810 Cncl‐Travel ‐ 700 700 ‐ 700 700 0.00%
11002 52100 Admn‐Professional Services 22,171 10,000 11,524 2,362 1,000 1,500 ‐85.00%
11002 52100 10007 Professional Services‐COVID 150,282 ‐ ‐ ‐ ‐ ‐ 0.00%
11002 52200 Admn‐Contracted Services 298 ‐ ‐ ‐ ‐ ‐ 0.00%
11002 52200 10006 Contracted Services‐FEC 10,000 ‐ ‐ ‐ ‐ ‐ 0.00%
11002 52350 Admn‐Special Programs/Events 1,304 500 500 1,757 1,800 1,500 200.00%
11002 52350 10007 Special Programs/Events‐COVID 7,102 ‐ ‐ ‐ ‐ ‐ 0.00%
11002 53100 Admn‐Office Supplies 3,363 5,000 5,000 5,841 6,000 5,000 0.00%
11002 53110 Admn‐Postage & Shipping 308 300 300 195 300 400 33.30%
11002 53115 Admn‐Publications & Subscrip 285 400 400 1,170 1,200 1,500 275.00%
11002 53160 Admn‐Copying & Printing 285 ‐ ‐ ‐ ‐ ‐ 0.00%
11002 53200 Admn‐Work Supplies 1,291 3,000 3,000 237 3,000 3,000 0.00%
11002 53200 10007 Work Supplies‐COVID 399 ‐ ‐ 228 ‐ ‐ 0.00%
11002 53265 Admn‐Memberships 17,727 11,350 11,350 17,135 11,350 22,350 96.90%
11002 53275 Admn‐Meeting Expenses 2,304 3,000 3,000 867 3,000 3,000 0.00%
11002 53360 Admn‐External Comm Services 5,246 3,800 3,800 4,667 3,800 5,000 31.60%
11002 53800 Admn‐Educ/Training/Conferences 667 4,100 4,100 ‐ 1,000 4,100 0.00%
11002 53810 Admn‐Travel ‐ 10,000 10,000 ‐ 2,000 8,000 ‐20.00%
Page 49

2020 2021 2021 2021 2021 2022 PCTORG OBJECT PROJECT ACCOUNT NAME ACTUAL ORIG BUD REVISED BUD ACTUAL PROJECTION PROPOSED CHANGE
TOTAL Admin General Fund Operating 255,838 89,950 92,824 58,932 67,050 89,550 ‐0.40%
11001 55100 Cncl‐I/S Building Occupancy 90,792 94,318 94,318 70,738 94,318 99,073 5.00%
11001 55200 Cncl‐I/S City Telephone System 183 183 183 92 183 183 0.00%
11001 55400 Cncl‐I/S Information Systems 52,480 47,026 47,026 35,269 47,026 51,472 9.50%
11002 55100 Admn‐I/S Building Occupancy 14,148 14,697 14,697 11,023 14,697 15,438 5.00%
11002 55200 Admn‐I/S City Telephone System 915 915 915 458 915 915 0.00%
11002 55400 Admn‐I/S Information Systems 57,478 53,616 53,616 40,212 53,616 61,351 14.40%
TOTAL Admin General Fund Internal Service 215,996 210,755 210,755 157,792 210,755 228,432 8.40%
GRAND TOTAL 1,160,098$ 1,050,425$ 1,053,299$ 758,578$ 1,027,525$ 1,094,850$ 4.20%
Page 50
HUMAN RESOURCES
Fund: 101-General Fund Department: 10-Human Resources Function: 10-General Administration Orgs: 11003
MISSION STATEMENT
The goal of the Human Resources Department is to ensure that we provide the best possible service to our current employees, prospective employees, retirees, and the citizens of Racine, thus making the city an employer of choice and a great place to work.
FUNCTION
We are responsible for personnel services and policies and overall employee relations for the City of Racine. We are dedicated to providing quality services to current city employees, retirees as well as to individuals seeking employment with the City. Our staff of professionals administers a variety of programs and activities that include:
* Recruiting and Hiring * Employee Compensation and Benefits * Affirmative Action/Equal Employment Opportunity * Labor Relations/Employee Relations * Safety and Employee Services
SIGNIFICANT INITIATIVES RECENTLY ACCOMPLISHED
Open enrollment was completed online for all employees and will continue to be done online in the future. A rollout of a prescription savings program through CVS was rolled out for employees who do not qualify for benefits. A benefit survey has been completed and will be rolled out to employees. The RFP process for the City’s Third Party Administrator for Health Insurance and the City’s Pharmacy Benefit Manager was completed
through the MEI Coalition. The RFP process for a benefits broker was completed.
Page 51

HUMAN RESOURCES
Fund: 101-General Fund Department: 10-Human Resources Function: 10-General Administration Orgs: 11003
Reasonable suspicion training was completed. Family Medical Leave Act training was completed. Obtain an interview question bank for Police Officer and Firefighter positions that take Diversity, Equity and Inclusion into consideration.
2022 STRATEGIC INITIATIVES
Offer the Employee Assistance Program to all City employees. Personalize our City of Racine Wellness Program by reconvening the wellness committee and working with the wellness coach at the Health
and Wellness Center. Participate in more job fairs for Diversity, Equity and Inclusion purposes. Research new advertising for Diversity, Equity and Inclusion purposes. Increase utilization at the health and wellness center. Update the entire Human Resources website. Build a benefits phone app with the benefits broker. Update the handbook and policies.
SIGNIFICANT FUNDING OR PROGRAM CHANGES IN 2022
Addition of $100,000 for Citywide Diversity, Equity and Inclusion training Increase in professional services budget for executive recruitments anticipated in 2022.
Page 52
2022 Goal‐Setting Statement Department Name: Human Resources Department Head/Staff Name(s): Rashanda Cainion
Goal Statement #1 Maintain an equitable workforce
In order to continue the work to maintain an equitable workforce and to be able to recruit and retain employees, the Human Resources Department will implement a training program to continue training for Diversity, Equity and Inclusion that also includes training for new employees.
Goal Statement #2 Improve employee recruitment and retention
In order to improve employee recruitment and retention, the Human Resources Department will do a benefits assessment utilizing results from the benefits survey.
Goal Statement #3 Complete comprehensive update to employee handbook
In order to complete a comprehensive update to the Employee Handbook, the Human Resources Department will work with the Attorney’s Office, our insurance carrier, CVMIC, and Administrative Managers to complete and present a comprehensive update to the Common Council.
Page 53

This page is intentionally left blank
Page 54

Fund: 101 - General FundFunction: 10 - General GovernmentDepartment: Human ResourcesDivision: 1003Org: 11003
2021 20212020 Orignal Revised 2021 2022
Actual Budget Budget Estimated BudgetExpenditures by Appropriation Unit
HRGF1 Salaries & Fringes 423,111$ 565,584$ 565,584$ 561,588$ 614,206$ HRGF2 Operating Expenditures 74,491 291,150 291,150 293,150 289,650 HRGF3 Inter-Departmental 49,361 51,155 51,155 51,155 64,361 HRGF4 Capital Outlay - - - - -
Total Expenditures 546,963$ 907,889$ 907,889$ 905,893$ 968,217$
HUMAN RESOURCESDepartmental Expenditure Summary
Salaries & Fringes62%
Operating Expenditures32%
Inter‐Departmental6%
2021 Expenditures
Salaries & Fringes63%
Operating Expenditures
30%
Inter‐Departmental
7%
2022 Expenditures
Page 55

2020 2021 2021 2021 2021 2022 PCTORG OBJECT PROJECT ACCOUNT NAME ACTUAL ORIG BUD REVISED BUD ACTUAL PROJECTION PROPOSED CHANGE
11003 50100 Hr‐Salaries 272,729 369,128 369,128 299,939 350,000 403,808 9.40%
11003 50200 Hr‐Part Time Salaries 518 1,368 1,368 30,541 30,000 26,000 1800.60%
11003 50300 Hr‐Overtime 91 ‐ ‐ 38 ‐ ‐ 0.00%
11003 51010 Hr‐FICA 19,660 28,343 28,343 22,399 28,343 32,880 16.00%
11003 51100 Hr‐WRS 18,418 24,915 24,915 20,248 24,915 26,248 5.40%
11003 51200 Hr‐Health Care 105,300 115,830 115,830 115,488 115,830 94,770 ‐18.20%
11003 51810 Hr‐Mileage ‐ 1,000 1,000 ‐ 500 500 ‐50.00%
11003 51830 Hr‐Employee Reimbursement 6,394 25,000 25,000 6,602 12,000 30,000 20.00%
TOTAL HR General Fund Salary & Fringes 423,111 565,584 565,584 495,254 561,588 614,206 8.60%
11003 52100 Hr‐Professional Services 22,063 218,000 218,000 97,196 218,000 203,000 ‐6.90%
11003 52200 Hr‐Contracted Services 418 500 500 157 500 500 0.00%
11003 52210 Hr‐Property/Equipment Rental 941 2,500 2,500 941 2,500 2,000 ‐20.00%
11003 52315 Hr‐Advertising 23,608 30,000 30,000 6,348 30,000 30,000 0.00%
11003 52350 Hr‐Special Programs/Events 250 ‐ ‐ 159 ‐ ‐ 0.00%
HUMAN RESOURCES DETAIL EXPENDITURES
Page 56
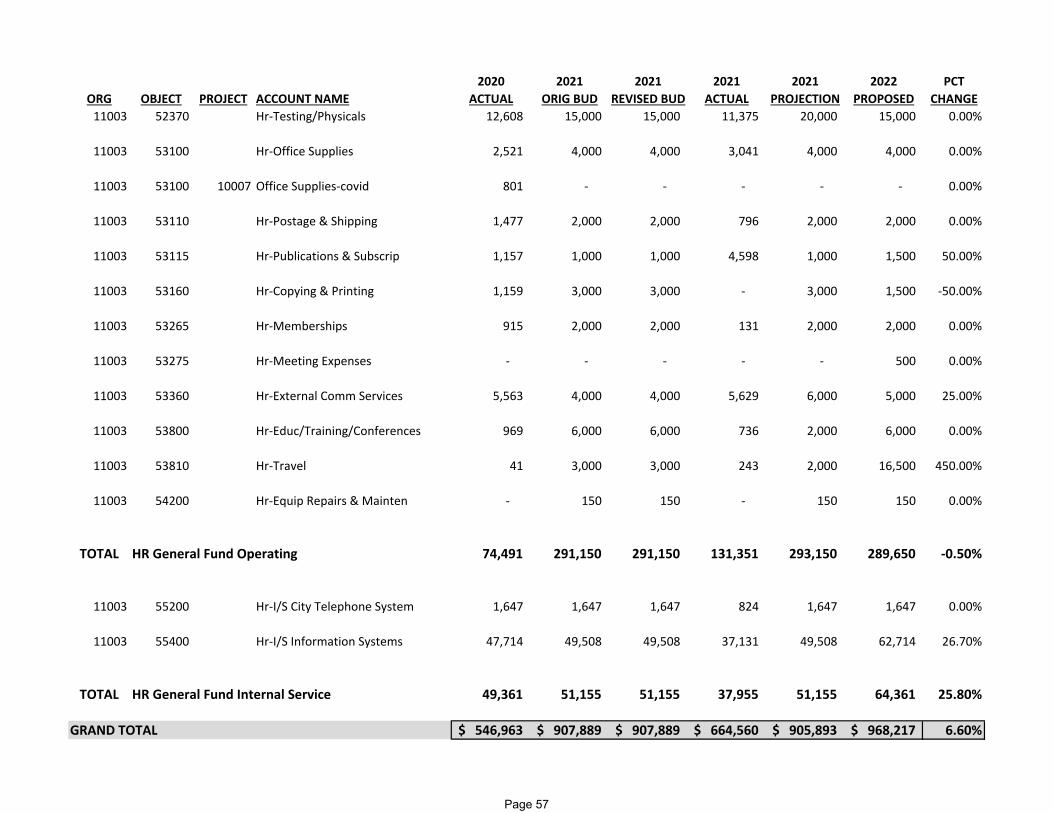
2020 2021 2021 2021 2021 2022 PCTORG OBJECT PROJECT ACCOUNT NAME ACTUAL ORIG BUD REVISED BUD ACTUAL PROJECTION PROPOSED CHANGE11003 52370 Hr‐Testing/Physicals 12,608 15,000 15,000 11,375 20,000 15,000 0.00%
11003 53100 Hr‐Office Supplies 2,521 4,000 4,000 3,041 4,000 4,000 0.00%
11003 53100 10007 Office Supplies‐covid 801 ‐ ‐ ‐ ‐ ‐ 0.00%
11003 53110 Hr‐Postage & Shipping 1,477 2,000 2,000 796 2,000 2,000 0.00%
11003 53115 Hr‐Publications & Subscrip 1,157 1,000 1,000 4,598 1,000 1,500 50.00%
11003 53160 Hr‐Copying & Printing 1,159 3,000 3,000 ‐ 3,000 1,500 ‐50.00%
11003 53265 Hr‐Memberships 915 2,000 2,000 131 2,000 2,000 0.00%
11003 53275 Hr‐Meeting Expenses ‐ ‐ ‐ ‐ ‐ 500 0.00%
11003 53360 Hr‐External Comm Services 5,563 4,000 4,000 5,629 6,000 5,000 25.00%
11003 53800 Hr‐Educ/Training/Conferences 969 6,000 6,000 736 2,000 6,000 0.00%
11003 53810 Hr‐Travel 41 3,000 3,000 243 2,000 16,500 450.00%
11003 54200 Hr‐Equip Repairs & Mainten ‐ 150 150 ‐ 150 150 0.00%
TOTAL HR General Fund Operating 74,491 291,150 291,150 131,351 293,150 289,650 ‐0.50%
11003 55200 Hr‐I/S City Telephone System 1,647 1,647 1,647 824 1,647 1,647 0.00%
11003 55400 Hr‐I/S Information Systems 47,714 49,508 49,508 37,131 49,508 62,714 26.70%
TOTAL HR General Fund Internal Service 49,361 51,155 51,155 37,955 51,155 64,361 25.80%
GRAND TOTAL 546,963$ 907,889$ 907,889$ 664,560$ 905,893$ 968,217$ 6.60%
Page 57

This page is intentionally left blank
Page 58

CITY ATTORNEY
Fund: 101-General Fund Department: 10-City Attorney Function: 10-General Administration Orgs: 11004
MISSION STATEMENT
The mission of the Office of the City of Racine City Attorney is to serve as attorney for and counselor to the City of Racine government, its duty being to assure that the City complies with all laws and uses the law to advance the mission and vision of the City. The Office of the City Attorney will provide professional legal services and representation of the highest quality to the City of Racine government.
FUNCTION
The City Attorney is charged, by Wisconsin Statute, with the conduct of all the law business in which the city is interested. The client of the City Attorney’s Office is the City of Racine as a body corporate, and not any individual official or employee. The City Attorney’s Office performs, or manages, all the legal functions for the City. This includes such activities as providing legal advice to City officials in all departments, commissions, boards, and authorities, issuing written legal opinions, drafting ordinances and other instruments as may be required by City officers, litigation of civil law suits for and against the City and its officers, collection of claims and delinquencies, and prosecution of violations of City law. The City Attorney’s Office serves the members of the general public in a manner that does not conflict with its duty to the City of Racine government or conflict with the best interests of the City of Racine as an entity and treats all persons in a dignified and respectful manner without discrimination and without regard to economic or political status. The City Attorney’s Office does not provide legal advice to any person regarding private legal matters.
SIGNIFICANT INITIATIVES RECENTLY ACCOMPLISHED
Working together with the Department of Information Services and the Purchasing Manager, the City Attorney’s Office implemented an e-signature process for all contracts within the City’s control.
2021 STRATEGIC INITIATIVES
1. In order to increase responsiveness for proposed legislative changes, the City Attorney’s Office will provide draft ordinance changes to the requesting elected official within 30 days of the formal request pursuant to Racine Ordinances section 2-119 in 80% of the requests and within 60 days of the formal request in 100% of the requests, in 2021. a. The City Attorney’s Office has met the goal based upon informal measurement. Formal tracking and measurement is still in the works.
Page 59

CITY ATTORNEY
Fund: 101-General Fund Department: 10-City Attorney Function: 10-General Administration Orgs: 11004
2. In order to increase responsiveness to requests for contracts, the City Attorney’s Office will review 80% of contracts presented for review
within 15 days of receipt, and draft 80% of contracts requested to be drafted within 30 days of receipt, in 2021. a. The City Attorney’s Office has met the goal based upon informal measurement. Formal tracking and measurement is still in the
works.
3. In order to streamline execution of contracts, the City Attorney’s Office will implement an e-signature process for all contracts within the City’s control by April 1, 2021.
a. The City Attorney’s Office has fully met this goal
SIGNIFICANT FUNDING OR PROGRAM CHANGES IN 2022
1. An additional .20 part-time position is included in part time salaries, to be filled under the State Bar’s Diversity Clerkship program.
Diversity Clerkship Over the years, the City Attorney’s Office has had a number of law student clerks, which has had the dual benefit of getting good lower-level legal work from eager students and allowing our office to contribute positively to the development of future attorneys. The City Attorney’s Office would like to contribute this while assisting with the City’s goal of increasing opportunities for diverse employees. Therefore, the City Attorney’s Office would like to participate in the Wisconsin State Bar’s Diversity Clerkship Program.
Diversity Clerkship Program is a ten-week long, paid summer employment opportunity where first-year Marquette University Law School and University of Wisconsin Law School students with diverse backgrounds are matched with employers. Law students gain practical legal experience, and the City Attorney’s Office would benefit from obtaining legal work from a student who might otherwise not apply. Students and employers apply to be in the program and are matched to each other based upon preference.
2. An additional $125,000 has been added to professional services for outside Council to assist with litigation.
Page 60

2022 Goal‐Setting Statement Department Name: City Attorney’s Office Department Head/Staff Name(s): City Attorney Scott R. Letteney
Goal Statement #1 Increase responsiveness to Wisconsin Public Records Law requests
1. In order to increase responsiveness to Wisconsin Public Records Law requests, 100% of requesters will receive an initial response
from the City within five business days after receipt in 2022. 2. In order to increase responsiveness to Wisconsin Public Records Law requests, the City Attorney’s Office will provide the
necessary legal and administrative guidance to empower all City departments to respond directly to requests for public records that are in the custody of their respective departments by the end of 2022.
a. To help achieve that goal, 100% of all new requests for public records will be routed to the appropriate custodian within five business days after receipt.
b. To help achieve that goal, the City Attorney’s Office will train 100% staff members from each department designated by departmental records custodians to prepare records request responses.
c. To help achieve that goal, the City Attorney’s Office will respond to 100% requests for guidance staff members from each department designated by departmental records custodians within five days of such request
Goal Statement #2
Analyze City Attorney’s Office Staffing Levels
In order to determine how much additional professional or administrative staffing is needed, the City Attorney’s Office will implement a workload‐tracking process by January 1, 2022.
Page 61

This page is intentionally left blank
Page 62

Fund: 101 - General FundFunction: 10 - General GovernmentDepartment: City AttorneyDivision: 1004Org: 11004
2021 20212020 Orignal Revised 2021 2022
Actual Budget Budget Estimated BudgetExpenditures by Appropriation Unit
ATTY1 Salaries & Fringes 816,489$ 852,576$ 852,576$ 852,576$ 882,950$ ATTY2 Operating Expenditures 413,834 432,900 432,900 433,035 559,900 ATTY3 Inter-Departmental 87,896 91,200 91,200 91,200 106,444 ATTY4 Capital Outlay - - - - -
Total Expenditures 1,318,219$ 1,376,676$ 1,376,676$ 1,376,811$ 1,549,294$
OFFICE OF THE CITY ATTORNEYDepartmental Expenditure Summary
Salaries & Fringes62%
Operating Expenditures31%
Inter‐Departmental7%
2021 Expenditures
Salaries & Fringes57%
Operating Expenditures
36%
Inter‐Departmental7%
2022 Expenditures
Page 63

2020 2021 2021 2021 2021 2022 PCTORG OBJECT PROJECT ACCOUNT NAME ACTUAL ORIG BUD REVISED BUD ACTUAL PROJECTION PROPOSED CHANGE
11004 50100 Atty‐Salaries 592,533 616,923 616,923 449,893 616,923 654,588 6.10%
11004 50200 Atty‐Part Time Salaries 29,986 35,474 35,474 23,534 35,474 45,094 27.10%
11004 50300 Atty‐Overtime 592 ‐ ‐ ‐ ‐ ‐ 0.00%
11004 51010 Atty‐FICA 46,226 49,841 49,841 34,552 49,841 53,427 7.20%
11004 51100 Atty‐WRS 41,851 44,038 44,038 31,470 44,038 44,601 1.30%
11004 51200 Atty‐Health Care 105,300 105,300 105,300 78,975 105,300 84,240 ‐20.00%
11004 51810 Atty‐Mileage ‐ 1,000 1,000 ‐ 1,000 1,000 0.00%
TOTAL Attorney' Office Salary & Fringes 816,489 852,576 852,576 618,424 852,576 882,950 3.60%
11004 52100 Atty‐Professional Services 356,444 375,000 375,000 362,048 375,000 500,000 33.30%
11004 52200 Atty‐Contracted Services 1,689 3,000 3,000 2,583 3,000 4,000 33.30%
11004 52210 Atty‐Property/Equipment Rental 6,072 3,500 3,500 4,098 3,500 3,500 0.00%
11004 53100 Atty‐Office Supplies 3,597 3,000 3,000 3,552 3,135 4,000 33.30%
11004 53110 Atty‐Postage & Shipping 3,746 2,500 2,500 1,098 2,500 2,500 0.00%
11004 53115 Atty‐Publications & Subscrip 21,829 21,000 21,000 17,038 21,000 21,000 0.00%
11004 53160 Atty‐Copying & Printing 1,692 400 400 5 400 400 0.00%
ATTORNEY DETAIL EXPENDITURES
Page 64
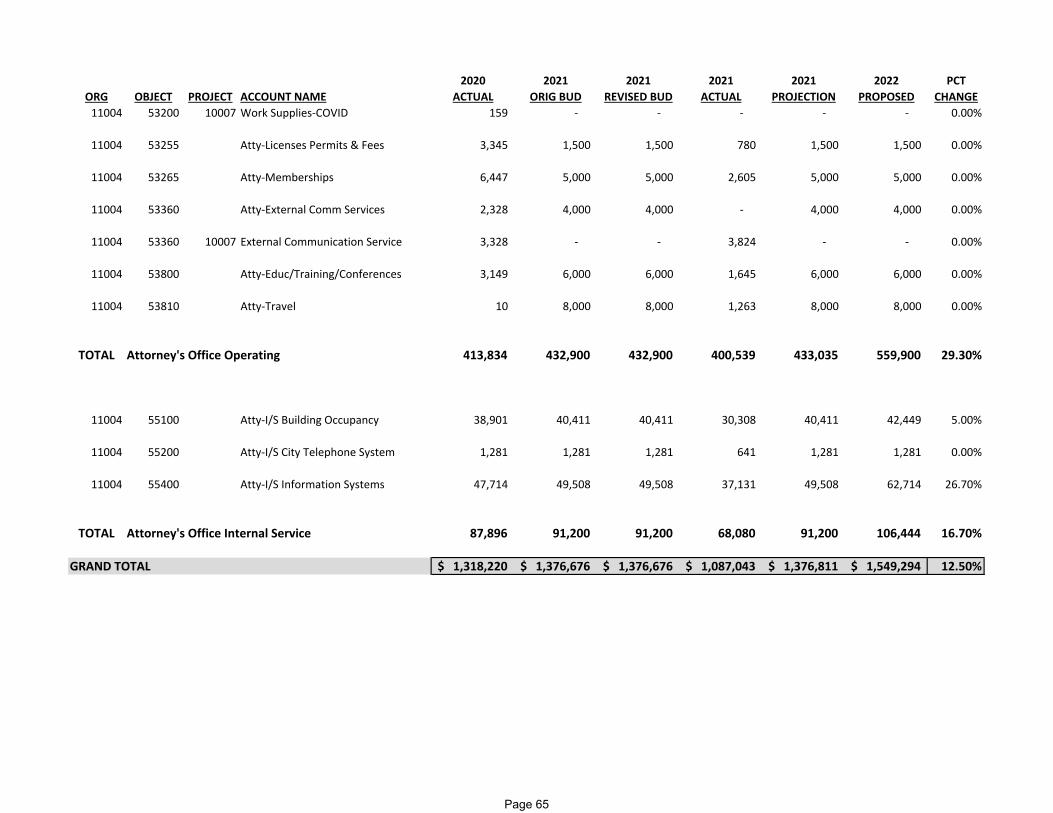
2020 2021 2021 2021 2021 2022 PCTORG OBJECT PROJECT ACCOUNT NAME ACTUAL ORIG BUD REVISED BUD ACTUAL PROJECTION PROPOSED CHANGE11004 53200 10007 Work Supplies‐COVID 159 ‐ ‐ ‐ ‐ ‐ 0.00%
11004 53255 Atty‐Licenses Permits & Fees 3,345 1,500 1,500 780 1,500 1,500 0.00%
11004 53265 Atty‐Memberships 6,447 5,000 5,000 2,605 5,000 5,000 0.00%
11004 53360 Atty‐External Comm Services 2,328 4,000 4,000 ‐ 4,000 4,000 0.00%
11004 53360 10007 External Communication Service 3,328 ‐ ‐ 3,824 ‐ ‐ 0.00%
11004 53800 Atty‐Educ/Training/Conferences 3,149 6,000 6,000 1,645 6,000 6,000 0.00%
11004 53810 Atty‐Travel 10 8,000 8,000 1,263 8,000 8,000 0.00%
TOTAL Attorney's Office Operating 413,834 432,900 432,900 400,539 433,035 559,900 29.30%
11004 55100 Atty‐I/S Building Occupancy 38,901 40,411 40,411 30,308 40,411 42,449 5.00%
11004 55200 Atty‐I/S City Telephone System 1,281 1,281 1,281 641 1,281 1,281 0.00%
11004 55400 Atty‐I/S Information Systems 47,714 49,508 49,508 37,131 49,508 62,714 26.70%
TOTAL Attorney's Office Internal Service 87,896 91,200 91,200 68,080 91,200 106,444 16.70%
GRAND TOTAL 1,318,220$ 1,376,676$ 1,376,676$ 1,087,043$ 1,376,811$ 1,549,294$ 12.50%
Page 65

This page is intentionally left blank
Page 66
FINANCE DEPARTMENT
Fund: 101-General Fund Department: 11-Finance Department Function: 10-General Administration Orgs: 11101-11102
MISSION STATEMENT
To receipt, record, and accurately deposit and disburse all funds incoming and due to the City. Provide timely and accurate financial information to key stakeholders while protecting City assets, both real and intangible, and ensuring City compliance with applicable federal, state, and local laws from a financial and fiduciary standpoint. To ensure local transparency and accessibility through the legislative, licensing, and election processes while striving to provide exemplary customer service to City residents.
FUNCTION
The Finance Department includes all duties and activities associated with the finance and the clerk/treasurers’ office. The Finance area is responsible for the financial operation of the city, including budgeting, internal and external financial reporting, investments, debt management, cash management, internal controls, payroll, accounts payable, purchasing, accounts receivable, financial forecasting. The City Clerk/Treasurer has a wide variety of duties centering on the position as the official records custodian and primary cash collection function of the City. The City Clerk/Treasurer is responsible for tax roll preparation/collection, is responsible for the issuance of various licenses, conducts all City elections, and is the gatekeeper of the legislative process. The department also provides financial advice and assistance to the Mayor, Common Council, City Committees and user departments on an on-going basis and develops city-wide financial procedures.
SIGNIFICANT INITIATIVES RECENTLY ACCOMPLISHED
1. Replace our current tax collection system with the implementation of the County Tax Collection system by November of 2021. 2. Proactively manage all aspects of boards, commissions, and committees 3. Managed, applied for, and ensured compliance for FEMA funding for COVID response 4. Strategized, managed, ensured compliance for unanticipated Rescue Plan funding 5. Seamlessly incorporate the DPW counter duties into the duties of the City Clerks office 6. Verified, negotiated, oversaw the financing packages for several large scale developments within the City of Racine 7. Management and oversight of the Racine Works Program and WRTP by the purchasing agent to increase certified participants in the program.
Page 67
FINANCE DEPARTMENT
Fund: 101-General Fund Department: 11-Finance Department Function: 10-General Administration Orgs: 11101-11102
2022 STRATEGIC INITIATIVES
1. Implement new budget transparency software for the presentation of the 2023 budget 2. Fully implement and utilize the mobile voting office to accommodate early voting for 20 locations within the City of Racine for the November 2022
Election. 3. Host public information sessions relating to clerk’s office functions
SIGNIFICANT FUNDING OR PROGRAM CHANGES IN 2022
1. Due to the increase in absentee ballot request in 2020 & 2021 the Clerk’s Office postage budget has increased. In the November 2020 election over 20,000 absentee ballots were requested, many of whom requested indefinitely confined ballots which do not expire.
Page 68

2022 Goal‐Setting Statement Department Name: Finance Department Department Head/Staff Name(s): Kathleen Fischer‐ Finance Director, Crystal Moore‐ Assistant Finance Director, Tara Coolidge‐ City Clerk, Amber Pfeiffer‐ Deputy City Clerk
Goal Statement #1 Before August 31, 2022, implement new budget transparency software for the presentation of the 2023 budget
Our enterprise financial system is adequate for the internal financial preparation of the budget, however, to provide further transparency to the Alders and the citizenry, and to simplify to preparation of the budget book we will move to a collaborative cloud based solution.
Goal Statement #2 Fully implement and utilize the mobile voting office to accommodate early voting for 20 locations within the City of Racine for the
November 2022 Election. With the purchase of new equipment for Elections, the Finance team would like to ensure we are utilizing the Mobile Voting Office to bring democracy closer to the citizens of Racine by fully implementing 20 locations for early voting the 2 weeks prior to the November 2022 Election.
Page 69

Goal Statement #3 Host 7 public information sessions relating to City Clerk’s office functions
By December 31, 2022 host the following sessions open to the public, employees, and elected officials:
o 2‐ Licensing: How to get started applying for a license o 1‐ Legislative: How to find a legislative item o 1‐ Legislative: How to sign up for notifications for agendas o 1‐ Elections: All about Badger Books o 1‐ Elections: Voting Absentee Process o 1‐ Elections: Q&A on Elections
Page 70

Fund: 101 - General FundFunction: 10 - General GovernmentDepartment: Finance DepartmentDivision: 1101-1102Org: 11101-11102
2021 20212020 Orignal Revised 2021 2022
Actual Budget Budget Estimated BudgetExpenditures by Appropriation Unit
10GF1 Salaries & Fringes 1,627,849$ 1,694,009$ 1,694,009$ 1,645,732$ 1,849,996$ 10GF2 Operating Expenditures 443,485 334,321 349,391 288,782 559,436 10GF3 Inter-Departmental 193,633 277,512 277,512 277,512 288,870 10GF4 Capital Outlay - - - - -
Total Expenditures 2,264,967$ 2,305,842$ 2,320,912$ 2,212,026$ 2,698,302$
Expenditures by Division1101 Finance/Clerk/Treasurer 1,849,393$ 2,090,292$ 2,102,056$ 2,104,256$ 2,176,594$ 1102 Elections 415,574 215,550 218,856 107,770 521,708
2,264,967$ 2,305,842$ 2,320,912$ 2,212,026$ 2,698,302$
FINANCE DEPARTMENTDepartmental Expenditure Summary
Finance/Clerk/Treasurer 91%
Elections 9%
2021 Costs by Division
Finance/Clerk/Treasurer 81%
Elections 19%
2022 Costs by Division
Page 71
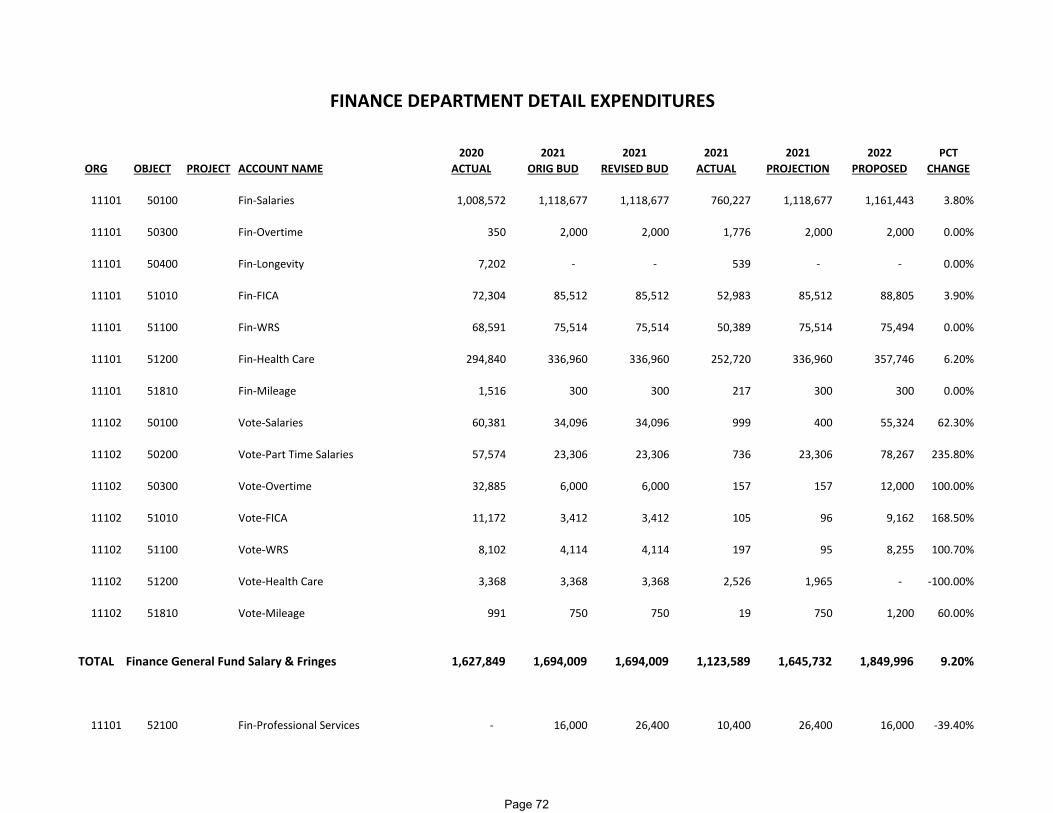
2020 2021 2021 2021 2021 2022 PCTORG OBJECT PROJECT ACCOUNT NAME ACTUAL ORIG BUD REVISED BUD ACTUAL PROJECTION PROPOSED CHANGE
11101 50100 Fin‐Salaries 1,008,572 1,118,677 1,118,677 760,227 1,118,677 1,161,443 3.80%
11101 50300 Fin‐Overtime 350 2,000 2,000 1,776 2,000 2,000 0.00%
11101 50400 Fin‐Longevity 7,202 ‐ ‐ 539 ‐ ‐ 0.00%
11101 51010 Fin‐FICA 72,304 85,512 85,512 52,983 85,512 88,805 3.90%
11101 51100 Fin‐WRS 68,591 75,514 75,514 50,389 75,514 75,494 0.00%
11101 51200 Fin‐Health Care 294,840 336,960 336,960 252,720 336,960 357,746 6.20%
11101 51810 Fin‐Mileage 1,516 300 300 217 300 300 0.00%
11102 50100 Vote‐Salaries 60,381 34,096 34,096 999 400 55,324 62.30%
11102 50200 Vote‐Part Time Salaries 57,574 23,306 23,306 736 23,306 78,267 235.80%
11102 50300 Vote‐Overtime 32,885 6,000 6,000 157 157 12,000 100.00%
11102 51010 Vote‐FICA 11,172 3,412 3,412 105 96 9,162 168.50%
11102 51100 Vote‐WRS 8,102 4,114 4,114 197 95 8,255 100.70%
11102 51200 Vote‐Health Care 3,368 3,368 3,368 2,526 1,965 ‐ ‐100.00%
11102 51810 Vote‐Mileage 991 750 750 19 750 1,200 60.00%
TOTAL Finance General Fund Salary & Fringes 1,627,849 1,694,009 1,694,009 1,123,589 1,645,732 1,849,996 9.20%
11101 52100 Fin‐Professional Services ‐ 16,000 26,400 10,400 26,400 16,000 ‐39.40%
FINANCE DEPARTMENT DETAIL EXPENDITURES
Page 72

2020 2021 2021 2021 2021 2022 PCTORG OBJECT PROJECT ACCOUNT NAME ACTUAL ORIG BUD REVISED BUD ACTUAL PROJECTION PROPOSED CHANGE
11101 52100 10007 Professional Services 1,760 ‐ ‐ ‐ ‐ ‐ 0.00%
11101 52120 Fin‐Audit Services 70,000 85,000 85,000 70,000 85,000 85,000 0.00%
11101 52200 Fin‐Contracted Services 40,048 22,620 22,620 14,070 22,620 16,872 ‐25.40%
11101 52210 Fin‐Property/Equipment Rental 1,913 2,800 2,800 4,077 5,000 4,076 45.60%
11101 52220 Fin‐Banking/Financial Charges 301 ‐ ‐ 524 ‐ ‐ 0.00%
11101 52310 Fin‐Outside Help ‐ 3,000 3,000 ‐ 3,000 3,000 0.00%
11101 52315 Fin‐Advertising 1,095 2,500 2,500 1,828 2,500 2,500 0.00%
11101 53100 Fin‐Office Supplies 14,611 12,137 12,137 8,214 12,137 15,000 23.60%
11101 53110 Fin‐Postage & Shipping 46,553 31,000 31,000 16,571 31,000 35,000 12.90%
11101 53115 Fin‐Publications & Subscrip 833 1,000 1,000 590 1,000 800 ‐20.00%
11101 53160 Fin‐Copying & Printing 1,384 3,600 3,600 653 3,600 3,600 0.00%
11101 53200 Fin‐Work Supplies 6,901 3,400 4,764 3,821 4,764 6,204 30.20%
11101 53200 10007 Work Supplies 11,128 ‐ ‐ 2,652 ‐ ‐ 0.00%
11101 53200 13003 Work Supplies‐Cyber Attack 332 ‐ ‐ ‐ ‐ ‐ 0.00%
11101 53255 Fin‐Licenses Prmts & Fees 210 140 140 55 140 210 50.00%
11101 53265 Fin‐Memberships 711 1,780 1,780 441 1,780 1,570 ‐11.80%
11101 53275 Fin‐Meeting Expenses 899 500 500 983 500 500 0.00%
11101 53275 10007 Meeting Expenses‐COVID 137 ‐ ‐ ‐ ‐ ‐ 0.00%
11101 53360 Fin‐External Comm Services 82 840 840 3,037 840 4,104 388.60%
11101 53800 Fin‐Educ/Training/Conferences 3,024 6,000 6,000 2,440 6,000 6,000 0.00%
Page 73

2020 2021 2021 2021 2021 2022 PCTORG OBJECT PROJECT ACCOUNT NAME ACTUAL ORIG BUD REVISED BUD ACTUAL PROJECTION PROPOSED CHANGE
11101 53810 Fin‐Travel 463 1,500 1,500 ‐ 1,500 1,500 0.00%
11102 52100 Vote‐Professional Services ‐ ‐ ‐ (9) (9) ‐ 0.00%
11102 52200 Vote‐Contracted Services 64,056 75,000 75,000 2,498 40,000 140,000 86.70%
11102 52210 Vote‐Property/Equipment Rental 6,281 1,500 1,500 ‐ ‐ 3,000 100.00%
11102 52310 Vote‐Outside Help 357 ‐ ‐ ‐ ‐ ‐ 0.00%
11102 52315 Vote‐Advertising 9,907 25,000 28,306 5,195 3,306 25,000 ‐11.70%
11102 53100 Vote‐Office Supplies 18,545 ‐ ‐ ‐ ‐ ‐ 0.00%
11102 53110 Vote‐Postage & Shipping 45,159 4,500 4,500 1 4,500 120,000 2566.70%
11102 53115 Vote‐Publications & Subscrip ‐ 1,300 1,300 ‐ ‐ ‐ ‐100.00%
11102 53160 Vote‐Copying & Printing 22,224 ‐ ‐ ‐ ‐ 30,000 0.00%
11102 53200 Vote‐Work Supplies 5,159 2,500 2,500 392 2,500 2,500 0.00%
11102 53200 10007 Work Supplies‐COVID 68,036 ‐ ‐ ‐ ‐ ‐ 0.00%
11102 53275 Vote‐Meeting Expenses 1,375 ‐ ‐ 46 ‐ ‐ 0.00%
11102 53810 Vote‐Travel ‐ ‐ ‐ ‐ ‐ 5,000 0.00%
11102 54200 Vote‐Equip Repairs & Mainten ‐ 30,704 30,704 15,574 30,704 32,000 4.20%
TOTAL Finance General Fund Operating 443,485 334,321 349,391 164,055 288,782 559,436 60.10%
11101 55100 Fin‐I/S Building Occupancy 117,435 121,845 121,845 91,384 121,845 128,147 5.20%
11101 55200 Fin‐I/S City Telephone System 4,758 4,758 4,758 2,379 4,758 4,758 0.00%
Page 74
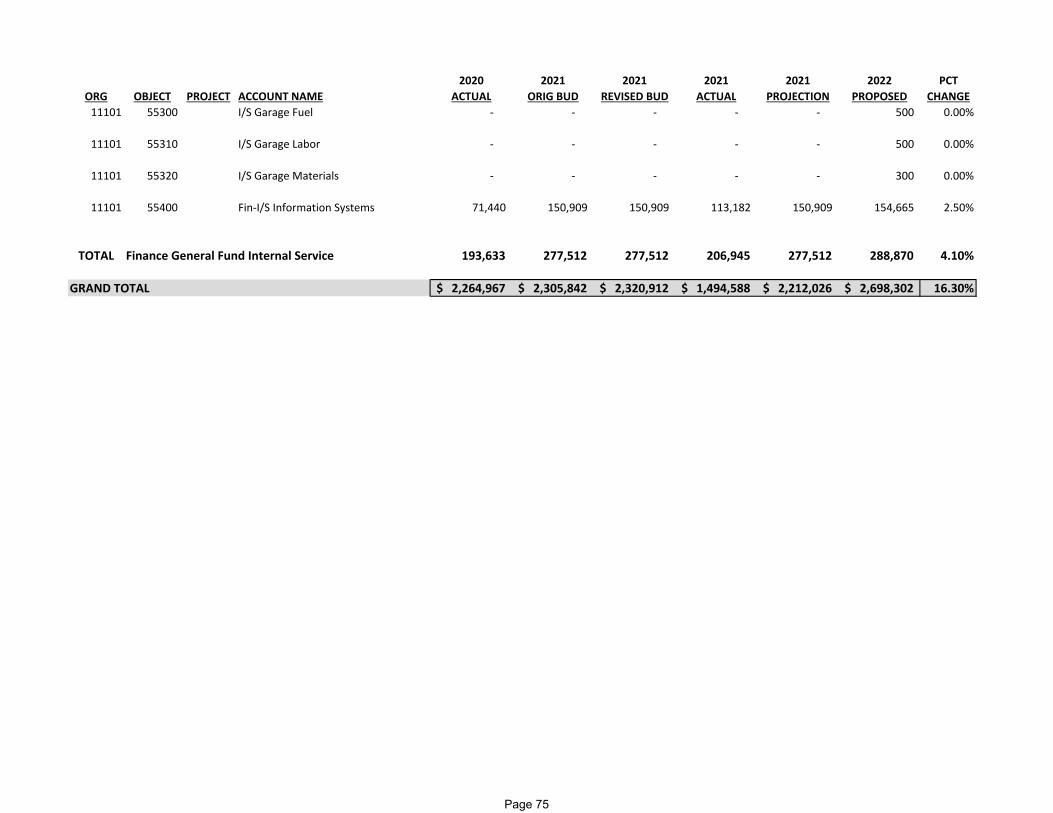
2020 2021 2021 2021 2021 2022 PCTORG OBJECT PROJECT ACCOUNT NAME ACTUAL ORIG BUD REVISED BUD ACTUAL PROJECTION PROPOSED CHANGE11101 55300 I/S Garage Fuel ‐ ‐ ‐ ‐ ‐ 500 0.00%
11101 55310 I/S Garage Labor ‐ ‐ ‐ ‐ ‐ 500 0.00%
11101 55320 I/S Garage Materials ‐ ‐ ‐ ‐ ‐ 300 0.00%
11101 55400 Fin‐I/S Information Systems 71,440 150,909 150,909 113,182 150,909 154,665 2.50%
TOTAL Finance General Fund Internal Service 193,633 277,512 277,512 206,945 277,512 288,870 4.10%
GRAND TOTAL 2,264,967$ 2,305,842$ 2,320,912$ 1,494,588$ 2,212,026$ 2,698,302$ 16.30%
Page 75
This page is intentionally left blank
Page 76

NON DEPARTMENTAL
Fund: 101-General Fund Department: 12-Non Departmental Function: 10-General Government Orgs: 11201-11202
FUNCTION
This budget reflects revenues and expenditures for items that are not specifically applicable to a department. The budget has two sections; Employee Benefits and Insurance and Miscellaneous Unclassified.
Employee Benefits and Insurance: This budget is established to provide for various employee benefits that may not be easily budgeted in a specific department as it is often unknown at the time of budgeting which departments may utilize them. This includes budgets for life insurance, unemployment compensation, and retiree healthcare, and sick leave payout. This budget also includes amounts necessary to insure city-owned property.
Miscellaneous Unclassified: This budget includes both revenues and expenses that cannot be classified to a specific department. The revenue budget includes amounts for shared revenue, interest income, cable franchise fees, and fund balance reserves applied. The expenditure budget includes amounts for judgement and claims, finance fees, and grants to non- profits.
2022 STRATEGIC INITIATIVES
To continue to investigate ways to achieve savings in this area as costs continue to rise for many of these items
Modifications to the handbook and labor negotiations may result in savings in this area for 2022 and beyond.
SIGNIFICANT FUNDING OR PROGRAM CHANGES IN 2022
Wage provision in the amount of $350,000 is included to create a resident pay scale that is 3% higher than the non-resident pay scale for non-represented employees.
Sick leave payout amounts have been decreased by $225,000 as Council action from last year will result in less payouts. Retiree health costs have decreased by $300,000 due primarily to the high deductible health plan.
Page 77

This page is intentionally left blank
Page 78
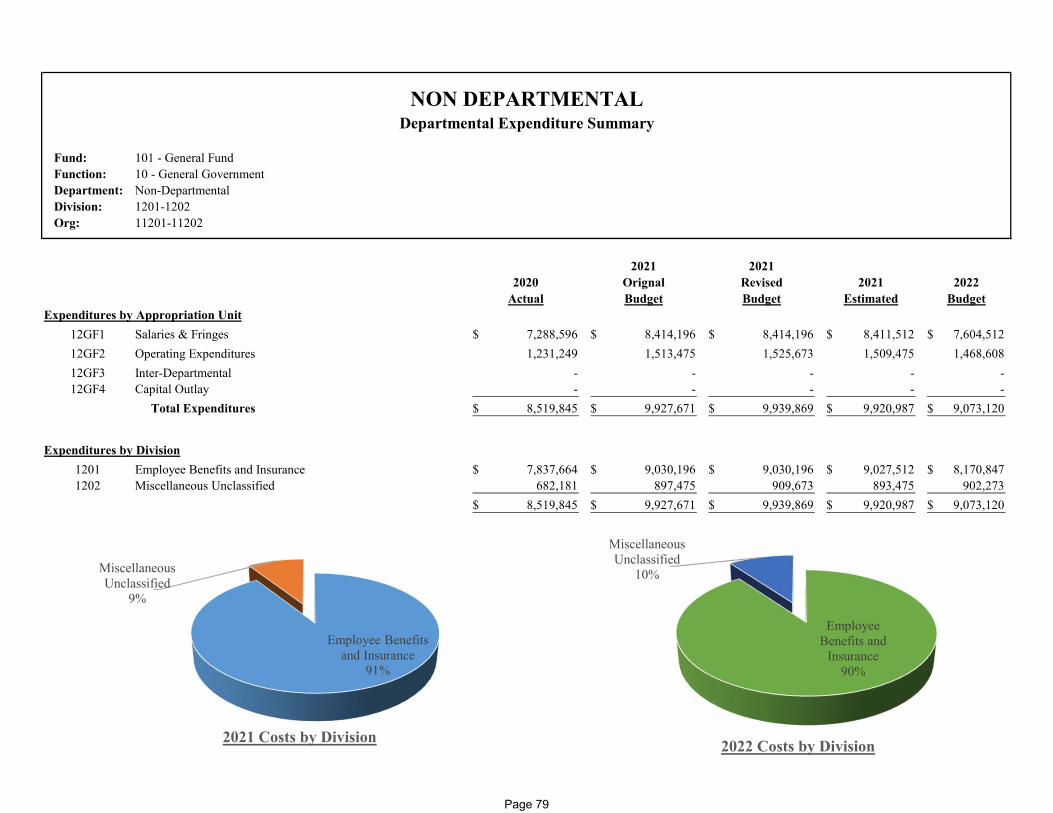
Fund: 101 - General FundFunction: 10 - General GovernmentDepartment: Non-DepartmentalDivision: 1201-1202Org: 11201-11202
2021 20212020 Orignal Revised 2021 2022
Actual Budget Budget Estimated BudgetExpenditures by Appropriation Unit
12GF1 Salaries & Fringes 7,288,596$ 8,414,196$ 8,414,196$ 8,411,512$ 7,604,512$ 12GF2 Operating Expenditures 1,231,249 1,513,475 1,525,673 1,509,475 1,468,608 12GF3 Inter-Departmental - - - - - 12GF4 Capital Outlay - - - - -
Total Expenditures 8,519,845$ 9,927,671$ 9,939,869$ 9,920,987$ 9,073,120$
Expenditures by Division1201 Employee Benefits and Insurance 7,837,664$ 9,030,196$ 9,030,196$ 9,027,512$ 8,170,847$ 1202 Miscellaneous Unclassified 682,181 897,475 909,673 893,475 902,273
8,519,845$ 9,927,671$ 9,939,869$ 9,920,987$ 9,073,120$
NON DEPARTMENTALDepartmental Expenditure Summary
Employee Benefits and Insurance
91%
Miscellaneous Unclassified
9%
2021 Costs by Division
Employee Benefits and
Insurance90%
Miscellaneous Unclassified
10%
2022 Costs by Division
Page 79
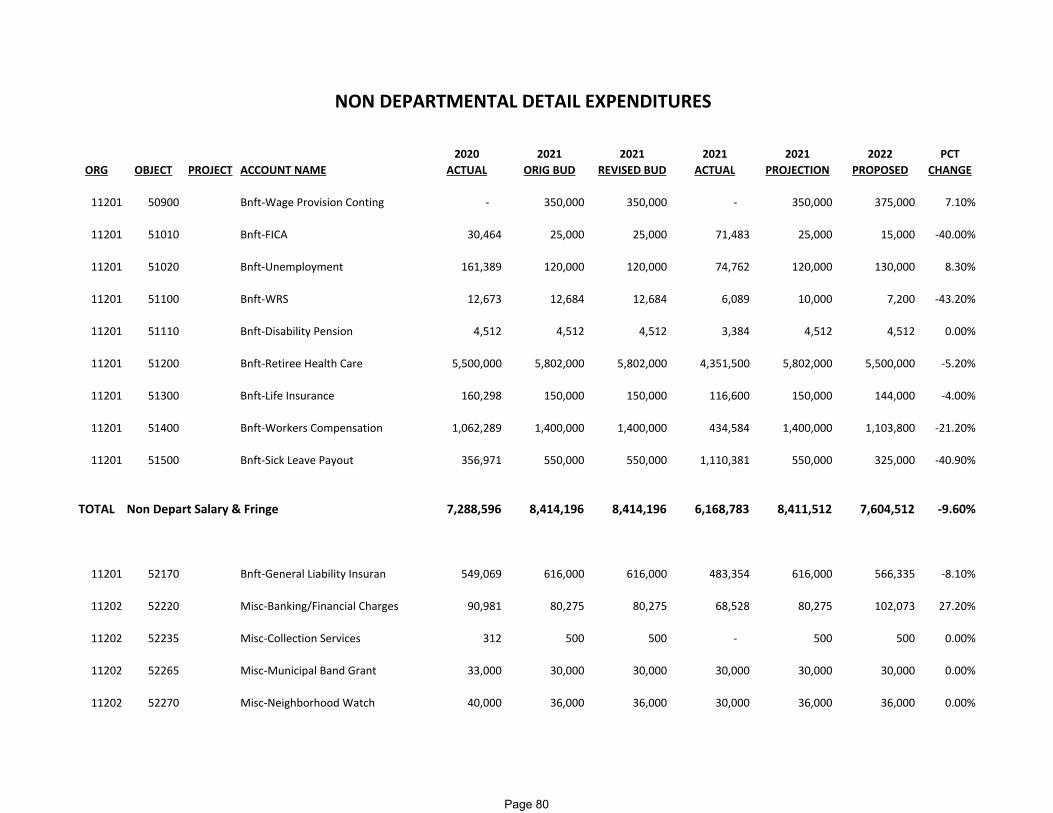
2020 2021 2021 2021 2021 2022 PCTORG OBJECT PROJECT ACCOUNT NAME ACTUAL ORIG BUD REVISED BUD ACTUAL PROJECTION PROPOSED CHANGE
11201 50900 Bnft‐Wage Provision Conting ‐ 350,000 350,000 ‐ 350,000 375,000 7.10%
11201 51010 Bnft‐FICA 30,464 25,000 25,000 71,483 25,000 15,000 ‐40.00%
11201 51020 Bnft‐Unemployment 161,389 120,000 120,000 74,762 120,000 130,000 8.30%
11201 51100 Bnft‐WRS 12,673 12,684 12,684 6,089 10,000 7,200 ‐43.20%
11201 51110 Bnft‐Disability Pension 4,512 4,512 4,512 3,384 4,512 4,512 0.00%
11201 51200 Bnft‐Retiree Health Care 5,500,000 5,802,000 5,802,000 4,351,500 5,802,000 5,500,000 ‐5.20%
11201 51300 Bnft‐Life Insurance 160,298 150,000 150,000 116,600 150,000 144,000 ‐4.00%
11201 51400 Bnft‐Workers Compensation 1,062,289 1,400,000 1,400,000 434,584 1,400,000 1,103,800 ‐21.20%
11201 51500 Bnft‐Sick Leave Payout 356,971 550,000 550,000 1,110,381 550,000 325,000 ‐40.90%
TOTAL Non Depart Salary & Fringe 7,288,596 8,414,196 8,414,196 6,168,783 8,411,512 7,604,512 ‐9.60%
11201 52170 Bnft‐General Liability Insuran 549,069 616,000 616,000 483,354 616,000 566,335 ‐8.10%
11202 52220 Misc‐Banking/Financial Charges 90,981 80,275 80,275 68,528 80,275 102,073 27.20%
11202 52235 Misc‐Collection Services 312 500 500 ‐ 500 500 0.00%
11202 52265 Misc‐Municipal Band Grant 33,000 30,000 30,000 30,000 30,000 30,000 0.00%
11202 52270 Misc‐Neighborhood Watch 40,000 36,000 36,000 30,000 36,000 36,000 0.00%
NON DEPARTMENTAL DETAIL EXPENDITURES
Page 80

2020 2021 2021 2021 2021 2022 PCTORG OBJECT PROJECT ACCOUNT NAME ACTUAL ORIG BUD REVISED BUD ACTUAL PROJECTION PROPOSED CHANGE11202 52350 Misc‐Special Programs/Events 26,055 13,000 13,000 8,914 13,000 17,000 30.80%
11202 52395 Misc‐20 Year Club 98 ‐ ‐ ‐ ‐ ‐ 0.00%
11202 53265 Misc‐Memberships ‐ 16,500 16,500 ‐ ‐ ‐ ‐100.00%
11202 53340 Misc‐Utilities‐Storm Water 7,417 8,000 8,000 8,246 8,000 8,500 6.30%
11202 53400 Misc‐Bad Debt Expense (21) ‐ ‐ ‐ ‐ ‐ 0.00%
11202 53420 Misc‐Property Taxes Cancelled 157,361 205,000 205,000 228,099 215,000 200,000 ‐2.40%
11202 53460 Misc‐Miscellaneous Expenses ‐ 1,000 1,000 3,414 3,500 1,000 0.00%
11202 53480 Misc‐Sister Cities 827 7,200 19,398 ‐ 7,200 7,200 ‐62.90%
11202 53500 Misc‐Judgment & Claims 326,151 300,000 300,000 108,165 300,000 300,000 0.00%
11202 56200 Misc‐Contingency ‐ 200,000 200,000 ‐ 200,000 200,000 0.00%
TOTAL Non Depart Gen Fund Operating 1,231,249 1,513,475 1,525,673 968,720 1,509,475 1,468,608 ‐3.70%
GRAND TOTAL 8,519,845$ 9,927,671$ 9,939,869$ 7,137,503$ 9,920,987$ 9,073,120$ ‐8.70%
Page 81

This page is intentionally left blank
Page 82

PUBLIC HEALTH DEPARTMENT
Fund: 101-General Fund Department: 20-Health Function: 20-Health Orgs: 120
MISSION STATEMENT
Provide comprehensive services, education, and advocacy for the protection, promotion, and improvement of the community’s health and environment.
FUNCTION
Administrative Division The Administrative Division provides facilitation of Department Divisions bringing together a unique set of priorities to maintain and improve public health while ensuring the equity of health outcomes and the preservation of various environments. The Administrative Division provides administrative oversight, regulatory management, strategic planning, budgeting, personnel relations, direct / programmatic community interactions, grant / technical writing services, internal / external agency collaboration, and direct client services. Financial support is comprised of tax levy dollars and grants. Grant applications are written / co-written / reviewed by the Public Health Administrator and all awards directly or indirectly benefit the City of Racine. Tax levy funds support core staff (1.0 FTE Public Health Administrator, 1.0 FTE Administrative Assistant, 0.83 FTE Epidemiologist) grants and contracts support the remainder of personnel (1.0 FTE Public Health Educator, 0.17 FTE Epidemiologist) supplies, and miscellaneous program costs. Community Health Division The Community Health Division protects, maintains, and improves the health of Racine residents through programs that prevent infectious and chronic disease, while promoting clean water and air, safe food, quality health care, and healthy living. Per the Wisconsin Department of Health Services(DHS), mandated services include: communicable disease surveillance, prevention and control; generalized public health nursing; services to promote health; services to prevent other diseases; abatement or removal of human health hazards; and services to prevent the future incidence of occupational disease, environmental disease, and human health hazard exposure focusing on populations experiencing disparities in health outcomes, specifically those in poverty, minority groups, children, and adolescents.
To achieve these goals, the Community Health Division looks to improve those factors which predict an individual’s success - early identification of problems and offering appropriate interventions to avoid teen pregnancy, substance abuse, injuries, sexually transmitted diseases, and childhood lead poisoning.
Financial support is comprised of tax levy dollars, grants, as well as clinic fees. Grant applications are written by the Community Health Director and Epidemiologist and all awards directly or indirectly benefit the City of Racine. Tax levy funds support core staff (.96 FTE Community Health Director, 4.5 FTE Public Health Nurses, 2.0 FTE Clerical Support, .82 FTE Health Educator) grants and contracts support the remainder of personnel (.04 FTE Community Health Director, .18 FTE Health Educator, 1.0 FTE Health Educator) supplies, maintenance of equipment, additional testing services, and miscellaneous program costs.
Page 83

PUBLIC HEALTH DEPARTMENT
Fund: 101-General Fund Department: 20-Health Function: 20-Health Orgs: 120
Environmental Health Division The Environmental Health Division works to protect, promote and improve public health in the City of Racine by monitoring and managing environmental health risks and hazards. To achieve this goal, the Environmental Health Division ensures that food served in licensed establishments is safe, ensures compliance with health standards for sanitary conditions, ensures regulated health activities are provided according to local ordinance or state statute, ensures indoor environments are healthy and safe, and that potential health risks from exposure to toxic chemicals are evaluated and eliminated. DHS mandates the following public health services: disease surveillance, prevention and control; services to promote health; services to prevent disease and promote health; abatement or removal of human health hazards; and services to prevent occupational disease, environmental disease, and human health hazard exposure. Financial support for the Environmental Health Division is comprised of tax levy dollars, grants and contracts awarded to it and/or its partner agencies as well as fees collected for services rendered. The Environmental Health Division is an agent of the Wisconsin Department of Agriculture Trade and Consumer Protection (DATCP) for regulating food, lodging, and pool facilities, as well an Agent of the Department of Regulation and Licensing for tattoo and body piercing establishments. Grant applications are written/co-written/reviewed by Environmental Health staff. Fees for service are primarily generated through licensed establishment inspections and enforcement.
Tax levy supports core staff (1.0 FTE Environmental Health Director, 4.0 FTE Sanitarian II, 1.0 FTE Clerical Support) grants and contracts support the remainder of supplies, maintenance of equipment, additional testing services, training, and miscellaneous program costs.
Laboratory Division The Laboratory Division ensures the integrity of the City’s natural resources are maintained; seeking a sustainable balance between public health protection, utility, and environmental preservation in order to improve quality of life within the community and contribute to enhancement of the Great Lakes basin. The Laboratory Division provides regulatory management, comprehensive water quality assessment, pollution source identification, site remediation / restoration, best management practice, planning, grant / technical writing services, and rapid molecular analytical support to multiple department programs. Laboratory services also extend to engagements, as collaborators or supporting roles, with the federal governments of the US and Canada, State agencies, academic institutions, regional planning commissions, local municipal agencies, and for-profit / non-profit organizations in Wisconsin and Illinois.
Financial support is comprised of tax levy dollars, storm water utility funds, grants and contracts awarded to the Laboratory and / or its partner agencies, as well as fees collected for services rendered. Grant applications are written / co-written / reviewed by Laboratory personnel and all awards directly or indirectly benefit the City of Racine. Contracts entered into with various agencies / organizations are utilized to undertake research, conduct monitoring, provide expert advice, review / write grant applications, provide placement for student interns, support projects / events, speak at engagements, participate in site assessments and act in the role of
Page 84
PUBLIC HEALTH DEPARTMENT
Fund: 101-General Fund Department: 20-Health Function: 20-Health Orgs: 120
scientific advisor. Fee for service testing is primarily generated through the analysis of surface water samples for recreational safety, beneficial use, and /or general water quality impairment investigations. This is supplemented by requests for analysis of treated or processed surface and ground water for individuals and other organizations. Tax levy is augmented by grant dollars and supports core staff (.22 FTE Laboratory Services Coordinator / Safety Officer, .55 FTE Research Assistant III, .44 FTE Research Assistant II). Grants and contracts support the remainder of personnel (.78 FTE Laboratory Services Coordinator, .45 FTE Assistant III, .56 FTE Assistant II).
SIGNIFICANT INITIATIVES RECENTLY ACCOMPLISHED
1. Response to the SARS-CoV2 (COVID-19) Pandemic: a. Implemented Incident Management System March 2020. b. Outbreak investigations in long term care facilities, schools, daycares, businesses, etc. c. Implemented testing with the Wisconsin National Guard WING (testing more than 25,000 individuals). d. Utilized the PHD’s Medical Countermeasure Plan planned and executed onsite and offsite mass vaccination clinics (vaccinating more than
12,383 individuals). e. Provided guidance and education through emergency orders and City Ordinances to government leaders, businesses, schools, long term care
facilities, daycares, etc. 2. Facilitated FEMA, WEM, contractors and internal departments to develop a disaster inventory and fundable projects to address January 10 – 12, 2020
coastal storm damage that resulted in a federal disaster declaration. 3. Continuation of communicable disease, emergency housing orders, health and human hazards, rabies, dangerous/prohibited animals, and shoreline
restoration activities. 2022 STRATEGIC INITIATIVES
1. Public Health response to the SARS-CoV2 (COVID-19) Pandemic 2. Establishment of the Racine Community Health Center. 3. Reinstitute / expand all Public Health Department programs/services.
Page 85
PUBLIC HEALTH DEPARTMENT
Fund: 101-General Fund Department: 20-Health Function: 20-Health Orgs: 120
SIGNIFICANT FUNDING OR PROGRAM CHANGES IN 2022
1. Reestablishment of Two Emergency Preparedness Grants: a. Coordination / facilitation of two emergency preparedness grants by the Laboratory Services Coordinator / Safety Officer. The Laboratory
Services Coordinator / Safety Officer position will be 78% grant funded by emergency preparedness grants where previous funding for this position was 80% accomplished by storm water funds. The displaced storm water funds will be redirected to cover the Research Assistant II and III positions resulting in a repositioning of City Levy funding by approximately $100,000
b. The tax levy reduction along with grant funds will be redirected to the Public Health Department for the addition of one and a half public health nurses and promotions / creation of a Community Health Coordinator / Health Educator, Environmental Health Coordinator / Sanitarian II, establishment of a Deputy Public Health Administrator / Community Health Director. In addition, Laboratory expansion of programs to include year round dairy, ice, and pool water analysis.
2. Reestablishment of One Community Health Grant: a. Coordination / facilitation of one additional community health grant by the Community Health Division and programming to include
expansion of current car seat, crib, and lead programs and the development of an Adolescent Sexual Health Program. The additional grant funds will offset the salaries of the proposed Community Health Coordinator/ Health Educator, and Public Health Nurses.
3. Additional Service Expansion: a. Expansion of lead programming by the Community Health and Environmental Health Divisions. b. Registration and compliance follow-up of Airbnb facilitates.
Page 86

2022 Goal‐Setting Statement Department Name: Public Health Department Department Head/Staff Name(s): Dottie Kay Bowersox
Goal Statement #1 Mediate / reduce the spread of COVID‐19 in the City of Racine, to a positivity rate of no more than 2 percent
Mediate / reduce the spread of COVID‐19 in the City of Racine, to a positivity rate of no more than 2 percent by December 31, 2022, through emergency orders, community testing, case interventions, mass vaccination clinics, and community education implemented by the Public Health Department and its partners.
Goal Statement #2 Operationalize medical, dental, and behavioral health services through the Racine Community Health Center
Operationalize medical, dental, and behavioral health services through the Racine Community Health Center by January 31, 2022 under the guidance of the Center’s Board of Directors, with financial support of community funders, and collaborative efforts.
Goal Statement #3 Reestablish and operationalize all Public Health Programming
Reestablish and operationalize all Public Health Programming no later than May 30, 2022. This includes service enhancements in the Community Health, Laboratory, and Environmental Health Divisions with the addition of dairy, ice, and pool analysis; registration and compliance of Airbnb establishments; expansion of the car seat, crib, and lead programs; and development of an Adolescent Health Program.
Page 87

This page is intentionally left blank
Page 88

Fund: 101 - General FundFunction: 20 - HealthDepartment: 20-Health DepartmentOrg: 120
2021 20212020 Orignal Revised 2021 2022
Actual Budget Budget Estimated BudgetExpenditures by Appropriation Unit
20GF1 Salaries & Fringes 1,662,735$ 1,682,319$ 1,682,319$ 1,682,319$ 1,910,203$ 20GF2 Operating Expenditures 425,051 456,910 476,920 476,920 456,910 20GF3 Inter-Departmental 294,363 310,101 310,101 310,101 378,664 20GF4 Capital Outlay - - - - -
Total Expenditures 2,382,149$ 2,449,330$ 2,469,340$ 2,469,340$ 2,745,777$
HEALTH DEPARTMENTDepartmental Expenditure Summary
Salaries & Fringes69%
Operating Expenditures
18%
Inter‐Departmental13%
2021 Expenditures
Salaries & Fringes69%
Operating Expenditures17%
Inter‐Departmental
14%
2022 Expenditures
Page 89
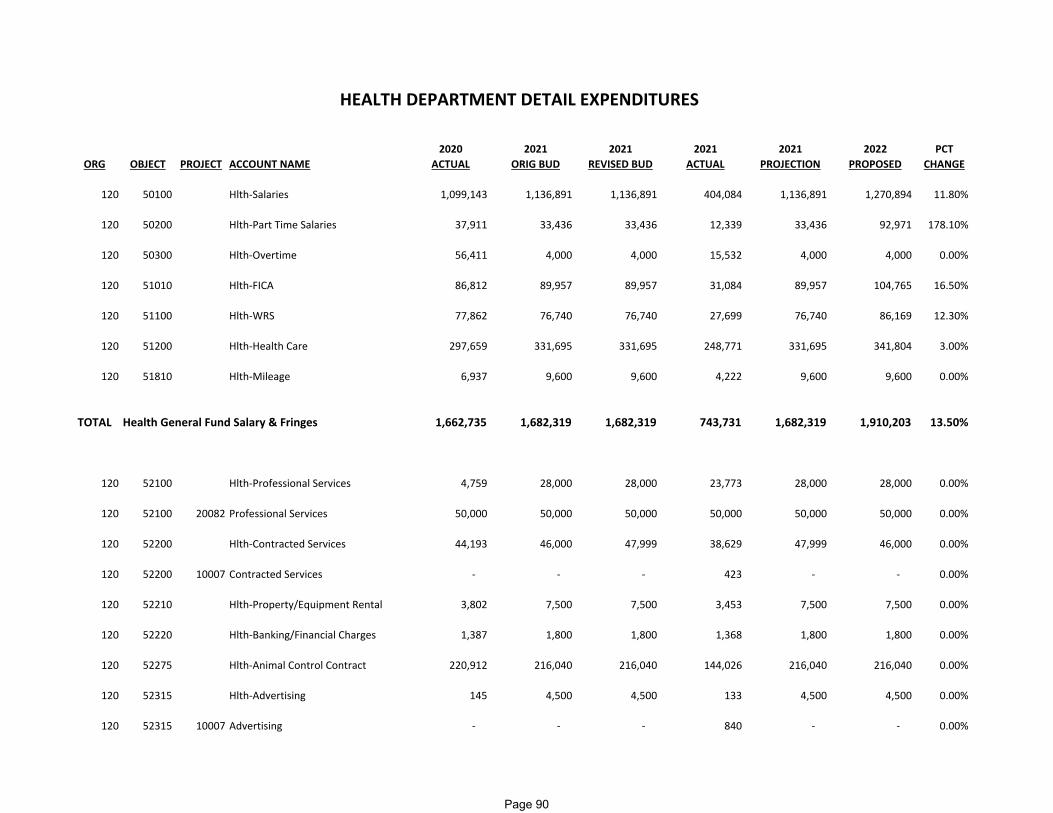
2020 2021 2021 2021 2021 2022 PCTORG OBJECT PROJECT ACCOUNT NAME ACTUAL ORIG BUD REVISED BUD ACTUAL PROJECTION PROPOSED CHANGE
120 50100 Hlth‐Salaries 1,099,143 1,136,891 1,136,891 404,084 1,136,891 1,270,894 11.80%
120 50200 Hlth‐Part Time Salaries 37,911 33,436 33,436 12,339 33,436 92,971 178.10%
120 50300 Hlth‐Overtime 56,411 4,000 4,000 15,532 4,000 4,000 0.00%
120 51010 Hlth‐FICA 86,812 89,957 89,957 31,084 89,957 104,765 16.50%
120 51100 Hlth‐WRS 77,862 76,740 76,740 27,699 76,740 86,169 12.30%
120 51200 Hlth‐Health Care 297,659 331,695 331,695 248,771 331,695 341,804 3.00%
120 51810 Hlth‐Mileage 6,937 9,600 9,600 4,222 9,600 9,600 0.00%
TOTAL Health General Fund Salary & Fringes 1,662,735 1,682,319 1,682,319 743,731 1,682,319 1,910,203 13.50%
120 52100 Hlth‐Professional Services 4,759 28,000 28,000 23,773 28,000 28,000 0.00%
120 52100 20082 Professional Services 50,000 50,000 50,000 50,000 50,000 50,000 0.00%
120 52200 Hlth‐Contracted Services 44,193 46,000 47,999 38,629 47,999 46,000 0.00%
120 52200 10007 Contracted Services ‐ ‐ ‐ 423 ‐ ‐ 0.00%
120 52210 Hlth‐Property/Equipment Rental 3,802 7,500 7,500 3,453 7,500 7,500 0.00%
120 52220 Hlth‐Banking/Financial Charges 1,387 1,800 1,800 1,368 1,800 1,800 0.00%
120 52275 Hlth‐Animal Control Contract 220,912 216,040 216,040 144,026 216,040 216,040 0.00%
120 52315 Hlth‐Advertising 145 4,500 4,500 133 4,500 4,500 0.00%
120 52315 10007 Advertising ‐ ‐ ‐ 840 ‐ ‐ 0.00%
HEALTH DEPARTMENT DETAIL EXPENDITURES
Page 90

2020 2021 2021 2021 2021 2022 PCTORG OBJECT PROJECT ACCOUNT NAME ACTUAL ORIG BUD REVISED BUD ACTUAL PROJECTION PROPOSED CHANGE
120 53100 Hlth‐Office Supplies 959 6,000 6,000 955 6,000 6,000 0.00%
120 53110 Hlth‐Postage & Shipping 4,788 8,500 8,500 3,960 8,500 8,500 0.00%
120 53115 Hlth‐Publications & Subscrip 840 1,700 1,700 1,488 1,700 1,700 0.00%
120 53160 Hlth‐Copying & Printing 8,008 7,000 7,000 7,358 7,000 7,000 0.00%
120 53200 Hlth‐Work Supplies 6,113 35,000 35,000 13,278 35,000 35,000 0.00%
120 53200 10007 Work Supplies‐COVID 55,640 ‐ ‐ 32,745 ‐ ‐ 0.00%
120 53200 13003 Work Supplies‐Cyber Attack 7,415 ‐ ‐ ‐ ‐ ‐ 0.00%
120 53205 Hlth‐Clinic Supplies 3,750 15,000 33,011 21,682 33,011 15,000 0.00%
120 53205 10007 Clinic Supplies 333 ‐ ‐ 1,963 ‐ ‐ 0.00%
120 53255 Hlth‐Licenses Permits & Fees 270 600 600 200 600 600 0.00%
120 53265 Hlth‐Memberships 2,051 3,000 3,000 1,767 3,000 3,000 0.00%
120 53275 Hlth‐Meeting Expenses ‐ 1,650 1,650 ‐ 1,650 1,650 0.00%
120 53360 Hlth‐External Comm Services 886 6,120 6,120 2,059 6,120 6,120 0.00%
120 53360 10007 External Communication Service 8,504 ‐ ‐ 4,260 ‐ ‐ 0.00%
120 53800 Hlth‐Educ/Training/Conferences 169 6,000 6,000 ‐ 6,000 6,000 0.00%
120 53810 Hlth‐Travel 125 9,000 9,000 10 9,000 9,000 0.00%
120 54200 Hlth‐Equip Repairs & Mainten ‐ 3,500 3,500 ‐ 3,500 3,500 0.00%
TOTAL Health General Fund Operating 425,051 456,910 476,920 354,370 476,920 456,910 0.00%
120 55100 Hlth‐I/S Building Occupancy 79,681 82,775 82,775 62,081 82,775 86,949 5.00%
Page 91

2020 2021 2021 2021 2021 2022 PCTORG OBJECT PROJECT ACCOUNT NAME ACTUAL ORIG BUD REVISED BUD ACTUAL PROJECTION PROPOSED CHANGE
120 55200 Hlth‐I/S City Telephone System 5,490 5,490 5,490 2,745 5,490 5,490 0.00%
120 55400 Hlth‐I/S Information Systems 209,192 221,836 221,836 166,377 221,836 286,225 29.00%
TOTAL Health General Fund Internal Service 294,363 310,101 310,101 231,203 310,101 378,664 22.10%
GRAND TOTAL 2,382,149$ 2,449,330$ 2,469,340$ 1,329,305$ 2,469,340$ 2,745,777$ 12.10%
Page 92

FIRE SUPPRESSION & AMBULANCE SERVICES
Fund: 101-General Fund Department: 30-Fire Department Function: 30-Public Safety Orgs: 13001
MISSION STATEMENT
We will support our community, firefighters and paramedics through dedicated teamwork to ensure that as a fire department we continue to build, sustain, and improve our capability to prepare for, protect against, respond to, recover from and mitigate all hazards with compassion, fairness, integrity and respect.
FUNCTION
The Racine Fire Department is an all hazards agency that provides the community with fire suppression, fire prevention, emergency medical services, hazardous materials, confined space, trench rescue, water/dive rescue, high and low angle rope rescue, and community risk reduction services to the citizens of Racine.
2021 SIGNIFICANT INITIATIVES RECENTLY ACCOMPLISHED
1. Still waiting for the FGM report on the Safety Building and Fire Station 6 to be presented to the Common Council
2. Working on securing the Fire and EMS Service Agreements with North Bay and Wind Point. RFP completed and submitted to the three villages. Elmwood Park has responded for 2022.
3. Updating the action plan for COVID 19 Delta variant to protect firefighters and paramedics
4. Preparing for a surge and spike in hospital transports for unvaccinated residents
2022 STRATEGIC INITIATIVES
1. Implementing fire department standard operating procedures with Lexipol
2. Continue assisting the Health Department with implementation of a community wide COVID 19 vaccination plan when requested
3. Replacement of deteriorating front line emergency apparatus due to age and increased call volume
4. Working with Human Resources and the Police and Fire Commission on diversity recruitment
Page 93
FIRE SUPPRESSION & AMBULANCE SERVICES
Fund: 101-General Fund Department: 30-Fire Department Function: 30-Public Safety Orgs: 13001
5. Working with Human Resources on the retention of existing firefighters and paramedics
6. Preparing for hospital transports to the new Advocate Aurora Hospital Emergency Department at I-94 & Hwy 20 in addition to the existing Ascension All Saints Hospital Emergency Department
SIGNIFICANT FUNDING OR PROGRAM CHANGES IN 2022
1. The reduction in fire department staffing in 2021 has resulted in increased wear and tear on all fire department apparatus due to significant number of emergency responses. This continues to drive increased fuel consumption, increased maintenance and repairs of all apparatus.
2. Mandatory replacement of 20+ year old fire apparatus that are now both beyond their normal life expectancy. Vehicles will be replaced using ARPA funds as authorized by the Common Council in September of 2021.
Page 94

2022 Goal‐Setting Statement
Department Name: Fire Department Department Head/Staff Name(s): Chief Hansen
Goal Statement #1 In order to increase diversity in the fire department, we will increase outreach by 5% in 2023
Subject to appropriate funding in the 2022 city budget along with HR support.
Goal Statement #2
In order to increase hiring city residents, the fire department will increase outreach with RUSD & GTC by 5% over three years Continue working with RUSD and GTC on the Academies program and potentially implementing an internship program subject to funding in the 2022 City Budget.
Goal Statement #3
In order to avoid future Fire and EMS service reductions in the face of ever increasing call volume, the fire department will increase EMS revenues by 5% annually starting January 1, 2022
This is a difficult goal to attain given Medicare and Medicaid reimbursements are beyond the City’s control and are set by the State and Federal Government. Medicare and Medicaid reimbursements have declined during the current COVID 19 pandemic.
Page 95

This page is intentionally left blank
Page 96

Fund: 101 - General FundFunction: 30 - Public SafetyDepartment: 30-Fire DepartmentOrg: 13001
2021 20212020 Orignal Revised 2021 2022
Actual Budget Budget Estimated BudgetExpenditures by Appropriation Unit
30GF1 Salaries & Fringes 16,579,528$ 15,760,031$ 15,760,031$ 15,760,031$ 15,527,941$ 30GF2 Operating Expenditures 941,231 895,400 931,783 935,565 946,100 30GF3 Inter-Departmental 362,517 459,670 459,670 459,670 529,377 30GF4 Capital Outlay - - - - -
Total Expenditures 17,883,276$ 17,115,101$ 17,151,484$ 17,155,266$ 17,003,418$
FIRE SUPPRESSION AND AMBULANCE SERVICESDepartmental Expenditure Summary
Salaries & Fringes
92%
Operating Expenditures
5%Inter-Departmental
3%
2021 Expenditures
Salaries & Fringes
91%
Operating Expenditures6%
Inter-Departmental3%
2022 Expenditures
Page 97

2020 2021 2021 2021 2021 2022 PCTORG OBJECT PROJECT ACCOUNT NAME ACTUAL ORIG BUD REVISED BUD ACTUAL PROJECTION PROPOSED CHANGE
13001 50100 Fire‐Salaries 10,634,637 10,474,472 10,474,472 7,614,903 10,474,472 10,355,170 ‐1.10%
13001 50200 Fire‐Part Time Salaries 299,040 309,000 309,000 128,521 309,000 309,000 0.00%
13001 50300 Fire‐Overtime 693,432 452,000 452,000 343,982 452,000 540,500 19.60%
13001 50400 Fire‐Longevity 6,615 6,412 6,412 4,766 6,412 6,646 3.60%
13001 51010 Fire‐FICA 171,873 146,819 146,819 125,968 146,819 169,031 15.10%
13001 51100 Fire‐WRS 1,930,674 1,717,268 1,717,268 1,331,454 1,717,268 1,704,197 ‐0.80%
13001 51200 Fire‐Health Care 2,843,100 2,653,560 2,653,560 1,990,170 2,653,560 2,442,647 ‐7.90%
13001 51810 Fire‐Mileage 158 500 500 ‐ 500 750 50.00%
TOTAL Fire General Fund Salary & Fringe 16,579,528 15,760,031 15,760,031 11,539,763 15,760,031 15,527,941 ‐1.50%
13001 52110 Fire‐Ambulance Billing Service 156,090 167,500 167,500 131,155 167,500 167,500 0.00%
13001 52200 Fire‐Contracted Services 9,676 25,000 25,000 945 25,000 36,000 44.00%
13001 52210 Fire‐Property/Equipment Rental 1,231 3,300 3,300 1,847 3,300 3,000 ‐9.10%
13001 52310 Fire‐Outside Help 616 ‐ ‐ ‐ ‐ ‐ 0.00%
13001 52315 Fire‐Advertising ‐ 15,000 15,000 ‐ 15,000 10,000 ‐33.30%
13001 52370 Fire‐Testing/Physicals 10,432 30,000 30,000 6,704 30,000 30,000 0.00%
13001 53100 Fire‐Office Supplies 5,627 4,500 4,500 4,153 4,500 6,000 33.30%
13001 53110 Fire‐Postage & Shipping 497 1,500 1,500 1,232 1,500 1,800 20.00%
FIRE DEPARTMENT DETAIL EXPENDITURES
Page 98

2020 2021 2021 2021 2021 2022 PCTORG OBJECT PROJECT ACCOUNT NAME ACTUAL ORIG BUD REVISED BUD ACTUAL PROJECTION PROPOSED CHANGE13001 53115 Fire‐Publications & Subscrip 1,635 5,000 5,000 4,092 5,000 8,500 70.00%
13001 53160 Fire‐Copying & Printing 2,246 3,300 3,300 3,335 3,300 4,500 36.40%
13001 53200 Fire‐Work Supplies 193,993 185,000 185,000 188,926 185,000 215,000 16.20%
13001 53200 10007 Work Supplies‐COVID 176,810 ‐ ‐ 40,921 ‐ 10,000 0.00%
13001 53230 Fire‐Small Equipment 6,417 6,300 6,300 6,219 6,300 5,000 ‐20.60%
13001 53240 Fire‐Direct clothing expenses 109,984 130,000 166,134 155,333 166,134 135,000 3.80%
13001 53265 Fire‐Memberships 3,602 2,500 2,500 2,567 2,500 2,800 12.00%
13001 53300 Fire‐Utilities 46,405 75,000 75,000 26,477 75,000 70,000 ‐6.70%
13001 53360 Fire‐External Comm Services 28,190 20,500 20,500 19,029 20,500 23,000 12.20%
13001 53800 Fire‐Educ/Training/Conferences 49,119 45,000 45,000 36,722 45,000 45,000 0.00%
13001 53800 10007 Education/Training/Conferences 610 ‐ ‐ ‐ ‐ ‐ 0.00%
13001 54100 Fire‐Building Rep & Mainten 55,260 88,000 88,249 40,761 88,249 83,000 ‐5.70%
13001 54200 Fire‐Equip Repairs & Mainten 82,792 88,000 88,000 97,238 91,783 90,000 2.30%
TOTAL Fire General Fund Operating 941,231 895,400 931,783 767,654 935,565 946,100 5.70%
13001 55100 Fire‐I/S Building Occupancy 256,567 303,476 303,476 227,607 303,476 318,779 5.00%
13001 55200 Fire‐I/S City Telephone System 9,882 10,000 10,000 5,000 10,000 10,000 0.00%
13001 55300 Fire‐I/S Garage Fuel 46,377 75,000 75,000 11,512 75,000 89,000 18.70%
13001 55400 Fire‐I/S Information Systems 49,691 71,194 71,194 53,395 71,194 111,598 56.80%
TOTAL Fire General Fund Internal Service 362,517 459,670 459,670 297,514 459,670 529,377 15.20%
GRAND TOTAL 17,883,276$ 17,115,101$ 17,151,484$ 12,604,931$ 17,155,266$ 17,003,418$ ‐0.70%
Page 99

This page is intentionally left blank
Page 100

RACINE POLICE DEPARTMENT
Fund: 101- General Fund Department: 31 Police Department Function: 30 Public Safety Orgs: 13101 - 13107
MISSION STATEMENT
To Protect Life & Property, Promote Community Partnerships, Build Trust and Serve with Honor.
FUNCTION
Public Safety
SIGNIFICANT INITIATIVES RECENTLY ACCOMPLISHED
1. After nearly two years of planning, the new COP Playbook was recently completed. After assisting multiple law enforcement agencies in implementing the COP House philosophy in other communities (Rockford, Il, Chicago, Saint Cloud, MN and the Town of Mt. Pleasant Police Departments), the Racine Police Department continues to receive requests to assist other departments in implementing this philosophy. The new COP Playbook will be used to inform and support the next generation of law enforcement leaders, locally and beyond.
2. Fair and Impartial Policing Training; Implicit Bias Training. 3. Implemented Citizen Services (Online Reporting) website. The purpose of this site is to provide an additional alternative to citizens for obtaining
information or reporting low-priority calls for service. 4. Utilized federal grant funds to purchase Personal Protective Equipment (PPE) and HALO disinfectant sprayers to disinfect vehicles and building for
officer safety during COVID- 19 pandemic. 5. Chicago PD COP tour. 6. VirTra science based de-escalation training for law enforcement and judgmental firearm training simulators. 7. Alcohol, tobacco, and Firearm (ATF)/National Integrated Ballistic Information Network (NIBIN) program for ballistics evaluations and provides
investigative leads in a timely fashion. 8. Internal Affairs (IA) Audit process to help reduce internal and external complaints.
2022 STRATEGIC INITIATIVES
1. Update Recruitment Process to Achieve City-wide Equitable Workplace Goals In the aftermath of the George Floyd homicide in Minnesota and subsequent the Jacob Blake office-involved shooting in Kenosha, calls for police reform currently dominate the national discourse. As we respond to the national narrative on a local level, the most pressing goal for 2022 will continue to be the need to identify, recruit, and hire new members that will assist in restoring trust in the policing profession. In particular, the
Page 101

RACINE POLICE DEPARTMENT
Fund: 101- General Fund Department: 31 Police Department Function: 30 Public Safety Orgs: 13101 - 13107
recruitment of local candidates will be critical, with a strong emphasis on attracting qualified minority candidates, will be charged with policing the community where they were born, raised, and educated.
2. Professional Standards Unit Creation Professional Standards Unit will provide administrative oversite into department processes such as, but not limited to; systematic use of force review; annual performance evaluations; regular TASER download and review; implementation of an early intervention system; and track outside employment.
3. Development of Formal Officer Mentoring Program and Supervisor Program New recruits will shadow supervisors before their first day. First line supervisor training program will be 20 hours and designed to provide tools on how to be a shift supervisor, receive complaints, incident reports, assess body worn camera footage, in car camera footage, and pursuit reviews.
4. Establishment Long-term Partnership with FBI (Permanent City-owned SIU Facility)
5. Establishment of Regional Law Enforcement Fusion Center (ATF, DEA, FBI, and regional LE Agencies) Supplement NIBIN implementation with ShotSpotter gunshot detection system. We will request a ShotSpotter demonstration of capabilities, and if satisfactory, seek grant funding to implement.
6. Remodel of COP Office (W. 6TH St.) Constructed in 1899 and opened in 1993, the W. 6th Street COP House is the oldest of six local COP house locations. Among the challenges with the current location is the absence of a community conference room and a computer learning lab. The current facility is not ADA complaint and parking near this facility is inadequate. In order to meet the changing needs of this community, the W. 6th Street COP house must be replaced. COVID delayed the remodel completion.
7. Development of RUSD Public Safety Pathway; Develop Policy Cadet Program Through a strategic partnership between the Racine Police Department, Gateway College and RUSD, a new Public Safety Pathway (under the RUSD Academies Initiative) was planned for the fall semester of 2021. Under this partnership, students with an interest in police and fire sciences would receive educational instruction that will build the necessary skills to be successful in their chosen field. The goal is to cultivate local candidates that will chose to serve locally. To maintain engagement, the Cadet and Explorer Program will be incorporated in this initiative.
Page 102

RACINE POLICE DEPARTMENT
Fund: 101- General Fund Department: 31 Police Department Function: 30 Public Safety Orgs: 13101 - 13107
8. Development of RPI Social Media Platform (YOUTube Channel/Merged Content Website)
In an effort to recruit and attract the most qualified police officer candidates, and to ensure the noteworthy contributions of all sworn members is regularly communicated to the citizens we serve, a new social media platform will be developed and managed in-house. Inasmuch as social media is used on a national level to communicate antipolice messaging, the goal of the local media platform is to publish local content designed to provide a counter-view to the national narrative (which is often not in line with the local narrative).
SIGNIFICANT FUNDING OR PROGRAM CHANGES IN 2022
1. Chief of Police, Assistant Chief of Police, and senior command staff appointments and promotions. Senior Command Staff to assist with overhaul and strategic plan; oversee goals, mission, and function of the department.
2. Addition of approximately $100,000 for building a career pipeline through a cadet program. 3. $450,000 in the 2022 capital for new body cams, tasers, dash cams software and hardware. This is a multi year commitment included in the ten year
capital plan.
Page 103
2022 Goal‐Setting Statement Department Name: Police Department Department Head/Staff Name(s): Maurice Robinson – Police Chief
Goal Statement #1
Update Recruitment Process to Achieve City‐wide Equitable Workplace Goals In the aftermath of the George Floyd homicide in Minnesota and subsequent the Jacob Blake office‐involved shooting in Kenosha, calls for police reform currently dominate the national discourse. As we respond to the national narrative on a local level, the most pressing goal for 2022 will continue to be the need to identify, recruit, and hire new members that will assist in restoring trust in the policing profession. In particular, the recruitment of local candidates will be critical, with a strong emphasis on attracting qualified minority candidates, will be charged with policing the community where they were born, raised, and educated.
Goal Statement #2 Create Professional Standards Unit
Professional Standards Unit will provide administrative oversite into department processes such as, but not limited to; systematic use of force review; annual performance evaluations; regular TASER download and review; implementation of an early intervention system; and track outside employment.
Page 104
Goal Statement #3 Develop Formal Officer Mentoring Program and Supervisor Program
New recruits will shadow supervisors before their first day. First line supervisor training program will be 20 hours and designed to provide tools on how to be a shift supervisor, receive complaints, incident reports, assess body worn camera footage, in car camera footage, and pursuit reviews.
Page 105

This page is intentionally left blank
Page 106

Fund: 101 - General FundFunction: 30 - Public SafetyDepartment: 31-Police DevelopmentDivision: 3101-3107Org: 13101-13107
2021 20212020 Orignal Revised 2021 2022
Actual Budget Budget Estimated BudgetExpenditures by Appropriation Unit
31GF1 Salaries & Fringes 25,186,698$ 24,814,430$ 24,814,430$ 25,009,823$ 24,465,757$ 31GF2 Operating Expenditures 2,674,013 2,651,410 2,685,692 2,713,819 2,806,762 31GF3 Inter-Departmental 1,658,876 1,896,490 1,896,490 1,896,490 2,138,601 31GF4 Capital Outlay - - - - -
Total Expenditures 29,519,587$ 29,362,330$ 29,396,612$ 29,620,132$ 29,411,120$
Expenditures by Division3101 Police Administration 27,859,032$ 27,755,462$ 27,787,695$ 28,028,264$ 27,791,754$ 3105 Community Service Officers 340,462 305,498 305,498 305,498 321,814 3106 Joint Dispatch 1,300,370 1,170,370 1,170,370 1,170,370 1,166,552 3107 Police and Fire Commision 19,723 131,000 133,049 116,000 131,000
29,519,587$ 29,362,330$ 29,396,612$ 29,620,132$ 29,411,120$
POLICE DEPARTMENTDepartmental Expenditure Summary
Police Administration 95%
Community Service Officers 1%
Joint Dispatch 4%
Police and Fire Commision 0%
2021 Costs by Division
Police Administration 95%
Community Service Officers
1%
Joint Dispatch 4%Police and Fire Commision 0%
2022 Costs by Division Page 107
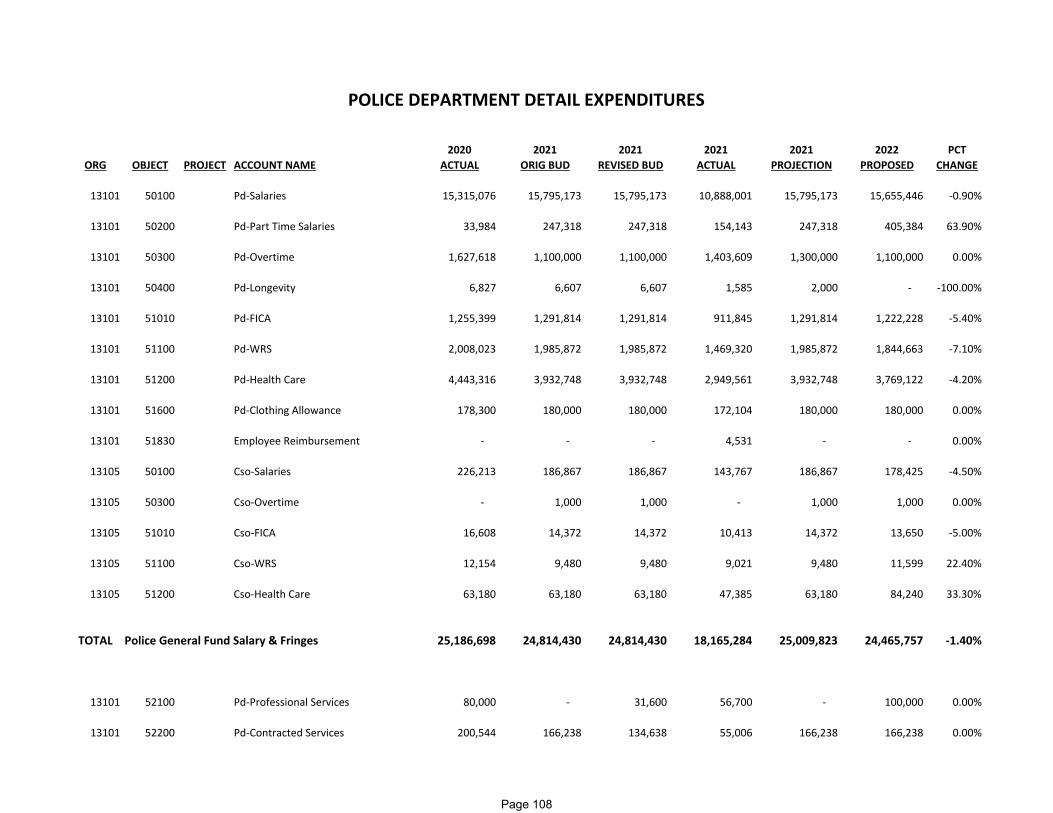
2020 2021 2021 2021 2021 2022 PCTORG OBJECT PROJECT ACCOUNT NAME ACTUAL ORIG BUD REVISED BUD ACTUAL PROJECTION PROPOSED CHANGE
13101 50100 Pd‐Salaries 15,315,076 15,795,173 15,795,173 10,888,001 15,795,173 15,655,446 ‐0.90%
13101 50200 Pd‐Part Time Salaries 33,984 247,318 247,318 154,143 247,318 405,384 63.90%
13101 50300 Pd‐Overtime 1,627,618 1,100,000 1,100,000 1,403,609 1,300,000 1,100,000 0.00%
13101 50400 Pd‐Longevity 6,827 6,607 6,607 1,585 2,000 ‐ ‐100.00%
13101 51010 Pd‐FICA 1,255,399 1,291,814 1,291,814 911,845 1,291,814 1,222,228 ‐5.40%
13101 51100 Pd‐WRS 2,008,023 1,985,872 1,985,872 1,469,320 1,985,872 1,844,663 ‐7.10%
13101 51200 Pd‐Health Care 4,443,316 3,932,748 3,932,748 2,949,561 3,932,748 3,769,122 ‐4.20%
13101 51600 Pd‐Clothing Allowance 178,300 180,000 180,000 172,104 180,000 180,000 0.00%
13101 51830 Employee Reimbursement ‐ ‐ ‐ 4,531 ‐ ‐ 0.00%
13105 50100 Cso‐Salaries 226,213 186,867 186,867 143,767 186,867 178,425 ‐4.50%
13105 50300 Cso‐Overtime ‐ 1,000 1,000 ‐ 1,000 1,000 0.00%
13105 51010 Cso‐FICA 16,608 14,372 14,372 10,413 14,372 13,650 ‐5.00%
13105 51100 Cso‐WRS 12,154 9,480 9,480 9,021 9,480 11,599 22.40%
13105 51200 Cso‐Health Care 63,180 63,180 63,180 47,385 63,180 84,240 33.30%
TOTAL Police General Fund Salary & Fringes 25,186,698 24,814,430 24,814,430 18,165,284 25,009,823 24,465,757 ‐1.40%
13101 52100 Pd‐Professional Services 80,000 ‐ 31,600 56,700 ‐ 100,000 0.00%
13101 52200 Pd‐Contracted Services 200,544 166,238 134,638 55,006 166,238 166,238 0.00%
POLICE DEPARTMENT DETAIL EXPENDITURES
Page 108

2020 2021 2021 2021 2021 2022 PCTORG OBJECT PROJECT ACCOUNT NAME ACTUAL ORIG BUD REVISED BUD ACTUAL PROJECTION PROPOSED CHANGE
13101 52200 31001 Pd‐SIU‐Contracted Services 22,970 23,390 23,390 22,577 23,390 23,390 0.00%
13101 52210 Pd‐Property/Equipment Rental 23,828 25,050 25,050 22,030 25,050 25,050 0.00%
13101 52210 31001 Pd‐SIU‐Property/Equipmt Rental 78,000 79,500 79,500 58,500 79,500 79,500 0.00%
13101 52220 Pd‐Banking/Financial Charges 2,043 15,000 15,000 1,467 15,000 15,000 0.00%
13101 52240 Pd‐Prisoner Expenses 2,680 25,000 25,000 31,670 32,000 25,000 0.00%
13101 52310 Pd‐Outside Help 18,902 7,000 7,000 43,618 44,000 7,000 0.00%
13101 52350 Pd‐Special Programs/Events 9,873 ‐ ‐ 1,155 981 ‐ 0.00%
13101 52380 Pd‐Towing 78,036 115,000 115,000 61,885 115,000 115,000 0.00%
13101 53100 Pd‐Office Supplies 32,362 60,000 60,000 42,458 60,000 60,000 0.00%
13101 53110 Pd‐Postage & Shipping 15,392 20,000 20,000 11,167 20,000 20,000 0.00%
13101 53115 Pd‐Publications & Subscrip 1,672 1,403 1,403 1,083 1,403 1,403 0.00%
13101 53160 Pd‐Copying & Printing 10,327 14,000 14,000 6,535 14,000 14,000 0.00%
13101 53160 31001 Pd‐SIU‐Copying & Printing 164 150 150 121 150 150 0.00%
13101 53200 Pd‐Work Supplies 92,748 85,300 85,795 98,842 85,990 98,390 15.30%
13101 53200 10007 Work Supplies‐COVID 51,593 ‐ 2,171 6,961 2,171 2,171 0.00%
13101 53200 31001 Pd‐SIU‐Work Supplies 80,000 80,000 80,000 20,645 80,000 80,000 0.00%
13101 53200 31011 Pd‐SWAT‐Work Supplies 15,602 6,000 6,000 16,590 6,000 6,000 0.00%
13101 53225 31001 Pd‐SIU‐Offsite Expenses 3,052 5,000 5,000 2,558 5,000 5,000 0.00%
13101 53230 Pd‐Small Equipment 77,418 92,275 109,198 93,112 109,198 109,200 18.30%
13101 53240 PD‐Direct clothing expenses 4,950 500 1,080 1,484 1,080 1,080 116.00%
Page 109
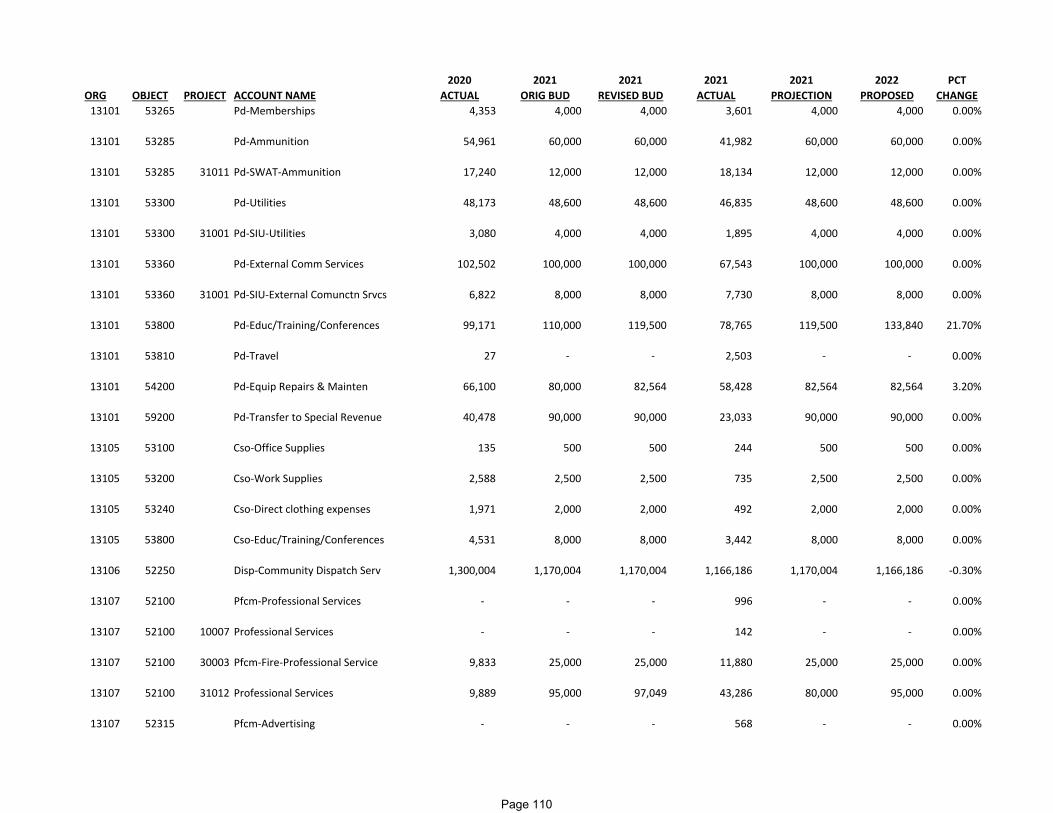
2020 2021 2021 2021 2021 2022 PCTORG OBJECT PROJECT ACCOUNT NAME ACTUAL ORIG BUD REVISED BUD ACTUAL PROJECTION PROPOSED CHANGE13101 53265 Pd‐Memberships 4,353 4,000 4,000 3,601 4,000 4,000 0.00%
13101 53285 Pd‐Ammunition 54,961 60,000 60,000 41,982 60,000 60,000 0.00%
13101 53285 31011 Pd‐SWAT‐Ammunition 17,240 12,000 12,000 18,134 12,000 12,000 0.00%
13101 53300 Pd‐Utilities 48,173 48,600 48,600 46,835 48,600 48,600 0.00%
13101 53300 31001 Pd‐SIU‐Utilities 3,080 4,000 4,000 1,895 4,000 4,000 0.00%
13101 53360 Pd‐External Comm Services 102,502 100,000 100,000 67,543 100,000 100,000 0.00%
13101 53360 31001 Pd‐SIU‐External Comunctn Srvcs 6,822 8,000 8,000 7,730 8,000 8,000 0.00%
13101 53800 Pd‐Educ/Training/Conferences 99,171 110,000 119,500 78,765 119,500 133,840 21.70%
13101 53810 Pd‐Travel 27 ‐ ‐ 2,503 ‐ ‐ 0.00%
13101 54200 Pd‐Equip Repairs & Mainten 66,100 80,000 82,564 58,428 82,564 82,564 3.20%
13101 59200 Pd‐Transfer to Special Revenue 40,478 90,000 90,000 23,033 90,000 90,000 0.00%
13105 53100 Cso‐Office Supplies 135 500 500 244 500 500 0.00%
13105 53200 Cso‐Work Supplies 2,588 2,500 2,500 735 2,500 2,500 0.00%
13105 53240 Cso‐Direct clothing expenses 1,971 2,000 2,000 492 2,000 2,000 0.00%
13105 53800 Cso‐Educ/Training/Conferences 4,531 8,000 8,000 3,442 8,000 8,000 0.00%
13106 52250 Disp‐Community Dispatch Serv 1,300,004 1,170,004 1,170,004 1,166,186 1,170,004 1,166,186 ‐0.30%
13107 52100 Pfcm‐Professional Services ‐ ‐ ‐ 996 ‐ ‐ 0.00%
13107 52100 10007 Professional Services ‐ ‐ ‐ 142 ‐ ‐ 0.00%
13107 52100 30003 Pfcm‐Fire‐Professional Service 9,833 25,000 25,000 11,880 25,000 25,000 0.00%
13107 52100 31012 Professional Services 9,889 95,000 97,049 43,286 80,000 95,000 0.00%
13107 52315 Pfcm‐Advertising ‐ ‐ ‐ 568 ‐ ‐ 0.00%
Page 110

2020 2021 2021 2021 2021 2022 PCTORG OBJECT PROJECT ACCOUNT NAME ACTUAL ORIG BUD REVISED BUD ACTUAL PROJECTION PROPOSED CHANGE
13107 52315 31012 Advertising ‐ 11,000 11,000 ‐ 11,000 11,000 0.00%
13107 53800 Pfcm‐Education/Training/Conf ‐ ‐ ‐ 200 ‐ ‐ 0.00%
TOTAL Police General Fund Operating 2,674,013 2,651,410 2,685,692 2,234,784 2,713,819 2,806,762 5.90%
13101 55100 Pd‐I/S Building Occupancy 638,271 662,111 662,111 496,583 662,111 694,181 4.80%
13101 55200 Pd‐I/S City Telephone System 36,183 36,183 36,183 18,092 36,183 32,471 ‐10.30%
13101 55300 Pd‐I/S Garage Fuel 183,740 249,000 249,000 195,241 249,000 297,000 19.30%
13101 55310 Pd‐I/S Garage Labor 309,516 340,500 340,500 222,958 340,500 330,000 ‐3.10%
13101 55320 Pd‐I/S Garage Materials 131,223 139,000 139,000 115,715 139,000 155,000 11.50%
13101 55400 Pd‐I/S Information Systems 346,496 451,730 451,730 338,798 451,730 609,683 35.00%
13105 55300 Cso‐I/S Garage Fuel 7,216 8,000 8,000 6,737 8,000 10,400 30.00%
13105 55310 Cso‐I/S Garage Labor 4,139 6,000 6,000 4,925 6,000 6,000 0.00%
13105 55320 Cso‐I/S Garage Materials 1,726 3,600 3,600 1,751 3,600 3,500 ‐2.80%
13106 55200 Disp‐I/S City Telephone System 366 366 366 183 366 366 0.00%
TOTAL Police General Fund Internal Service 1,658,876 1,896,490 1,896,490 1,400,982 1,896,490 2,138,601 12.80%
GRAND TOTAL 29,519,587$ 29,362,330$ 29,396,612$ 21,801,051$ 29,620,132$ 29,411,120$ 0.20%
Page 111

This page is intentionally left blank
Page 112
PUBLIC WORKS DEPARTMENT
Fund: 101-General Fund Department: 40-Public Works Function: 40-Public Works Orgs: 14001-14013
MISSION STATEMENT
The Public Works Department is responsible to manage all functions including Administration, Engineering, Solid Waste, Lift Bridges, Street Maintenance, Street Lighting, Traffic Signals and Emergency Sirens. Public Works also manages the Building Complex, Equipment Garage, Sanitary Sewer, Waste Disposal (Recycling), Parking System and Transit System, which are covered under different Mission Statements.
FUNCTION
The Public Works Department performs all the Mission Statement duties and needs to ensure all contracts are monitored and performed as required by State and Federal requirements. Public Works bids out all City funded projects in a proper manner and ensures that the annual budget is set up to cover all projects necessary to maintain roadways and facilities properly.
Solid Waste Division is responsible for the collection of all residential solid waste via the cart system implemented in 2017. This modified the collection of the materials that no longer fit in the cart and created the bulky waste collection function.
SIGNIFICANT INITIATIVES RECENTLY ACCOMPLISHED
1. Implemented a new holiday collection schedule for Solid Waste and Recycling 2. Implemented Household Bulky Item (HBI) waste collection at curbside and ended call-in bulky collection 3. Performed additional street maintenance functions due to Waste Collection changes 4. Completed a Facilities Condition Assessment (FCA) of occupied City buildings.
2022 STRATEGIC INITIATIVES
1. Perform and expand the facility condition analysis to include Fire Stations and Golf Course buildings. 2. Implement electric vehicle charging and battery storage for electric busses at the Transit Garage. 3. Review electric vehicle charging station for City facilities 4. Review services provided at Pearl Street
Page 113

PUBLIC WORKS DEPARTMENT
Fund: 101-General Fund Department: 40-Public Works Function: 40-Public Works Orgs: 14001-14013
SIGNIFICANT FUNDING OR PROGRAM CHANGES IN 2022
1. Provide funding for design and replacement of the Fuel Depot managed by DPW for all city vehicles & RUSD. 2. Provide funding for siting, design and construction of a solid waste/transfer station and waste drop-off facility to replace Pearl Street.
Page 114
2022 Goal‐Setting Statement Department Name: DPW Department Head/Staff Name(s): John Rooney
Goal Statement #1
Create and implement a comprehensive waste collection management plan In order to create and implement a comprehensive waste collection management plan, DPW ‐ Field Operations will prepare an action plan in 2022 to be implemented in the 2023 operating and capital budget by evaluating and recommending the most cost effective and efficient alternative in the Foth study.
Goal Statement #2 Create and implement an expansion of the Facilities Condition Assessment
In order to prepare, create, and implement an expansion of the Facilities Condition Assessment, DPW – Building Complex will include remote Fire Stations and Golf Course buildings to be programmed for capital improvements by evaluating assets and costs of repair of facilities in time for the preparation of the 2023‐2032 CIP in August 2022.
Goal Statement #3 Design and implement replacement Fuel Depot
In order to obtain compliance with State Regulations, DPW will cause the design and implementation of the replacement of the Fuel Depot to serve all City departments and RUSD safely and effectively by December 31, 2022, and to be constructed and operational in 2023.
Page 115

This page is intentionally left blank
Page 116
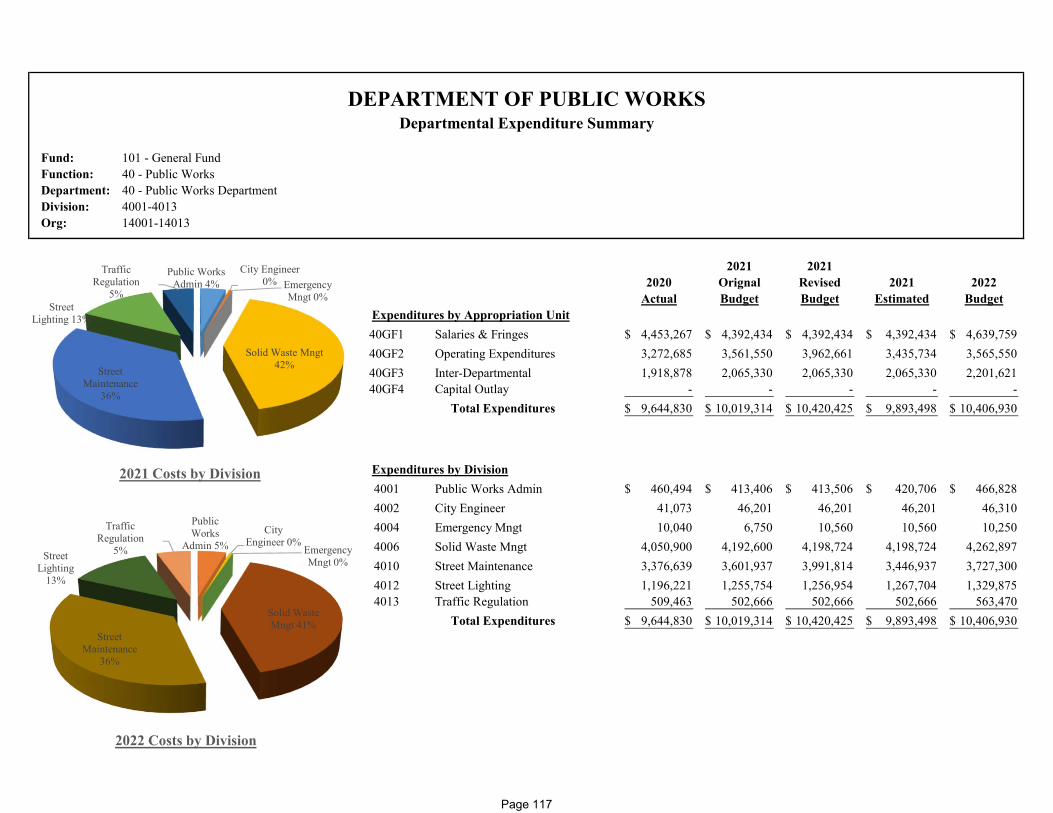
Fund: 101 - General FundFunction: 40 - Public WorksDepartment: 40 - Public Works DepartmentDivision: 4001-4013Org: 14001-14013
2021 20212020 Orignal Revised 2021 2022
Actual Budget Budget Estimated BudgetExpenditures by Appropriation Unit40GF1 Salaries & Fringes 4,453,267$ 4,392,434$ 4,392,434$ 4,392,434$ 4,639,759$ 40GF2 Operating Expenditures 3,272,685 3,561,550 3,962,661 3,435,734 3,565,550 40GF3 Inter-Departmental 1,918,878 2,065,330 2,065,330 2,065,330 2,201,621 40GF4 Capital Outlay - - - - -
Total Expenditures 9,644,830$ 10,019,314$ 10,420,425$ 9,893,498$ 10,406,930$
Expenditures by Division4001 Public Works Admin 460,494$ 413,406$ 413,506$ 420,706$ 466,828$ 4002 City Engineer 41,073 46,201 46,201 46,201 46,310 4004 Emergency Mngt 10,040 6,750 10,560 10,560 10,250 4006 Solid Waste Mngt 4,050,900 4,192,600 4,198,724 4,198,724 4,262,897 4010 Street Maintenance 3,376,639 3,601,937 3,991,814 3,446,937 3,727,300 4012 Street Lighting 1,196,221 1,255,754 1,256,954 1,267,704 1,329,875 4013 Traffic Regulation 509,463 502,666 502,666 502,666 563,470
Total Expenditures 9,644,830$ 10,019,314$ 10,420,425$ 9,893,498$ 10,406,930$
DEPARTMENT OF PUBLIC WORKSDepartmental Expenditure Summary
Public Works Admin 4%
City Engineer0% Emergency
Mngt 0%
Solid Waste Mngt42%Street
Maintenance36%
Street Lighting 13%
Traffic Regulation
5%
2021 Costs by Division
Public Works
Admin 5%City
Engineer 0%Emergency Mngt 0%
Solid Waste Mngt 41%
Street Maintenance
36%
Street Lighting
13%
Traffic Regulation
5%
2022 Costs by Division
Page 117
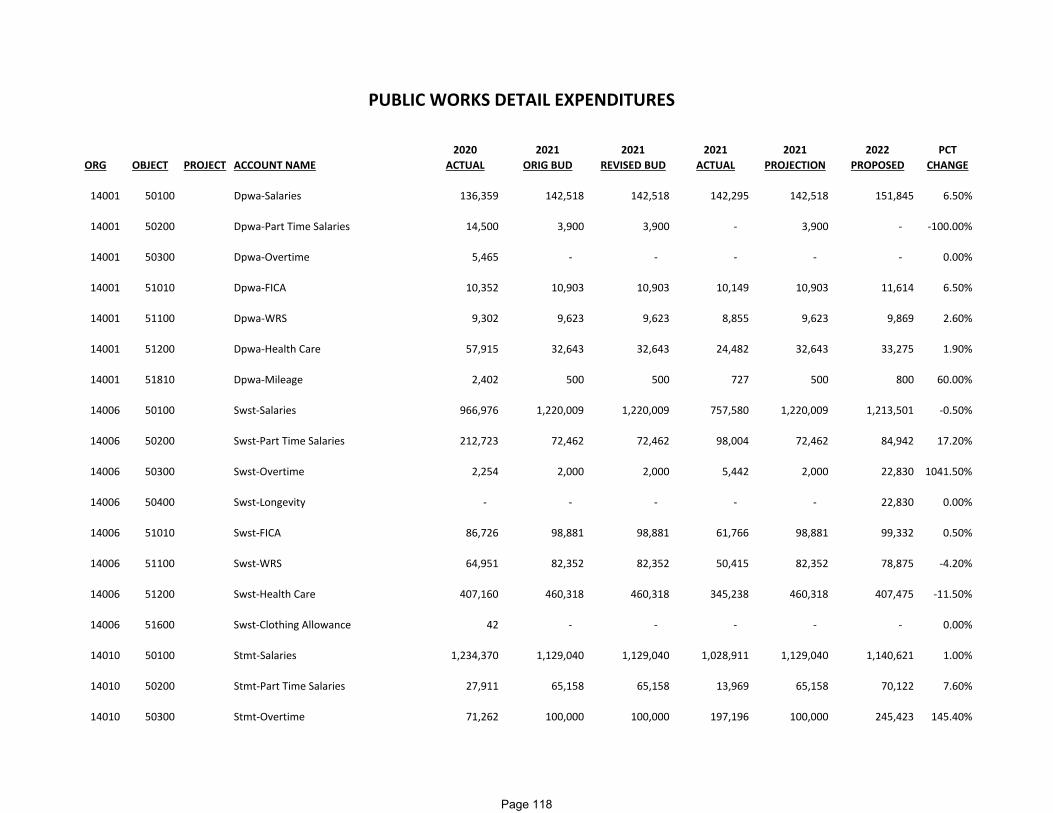
2020 2021 2021 2021 2021 2022 PCTORG OBJECT PROJECT ACCOUNT NAME ACTUAL ORIG BUD REVISED BUD ACTUAL PROJECTION PROPOSED CHANGE
14001 50100 Dpwa‐Salaries 136,359 142,518 142,518 142,295 142,518 151,845 6.50%
14001 50200 Dpwa‐Part Time Salaries 14,500 3,900 3,900 ‐ 3,900 ‐ ‐100.00%
14001 50300 Dpwa‐Overtime 5,465 ‐ ‐ ‐ ‐ ‐ 0.00%
14001 51010 Dpwa‐FICA 10,352 10,903 10,903 10,149 10,903 11,614 6.50%
14001 51100 Dpwa‐WRS 9,302 9,623 9,623 8,855 9,623 9,869 2.60%
14001 51200 Dpwa‐Health Care 57,915 32,643 32,643 24,482 32,643 33,275 1.90%
14001 51810 Dpwa‐Mileage 2,402 500 500 727 500 800 60.00%
14006 50100 Swst‐Salaries 966,976 1,220,009 1,220,009 757,580 1,220,009 1,213,501 ‐0.50%
14006 50200 Swst‐Part Time Salaries 212,723 72,462 72,462 98,004 72,462 84,942 17.20%
14006 50300 Swst‐Overtime 2,254 2,000 2,000 5,442 2,000 22,830 1041.50%
14006 50400 Swst‐Longevity ‐ ‐ ‐ ‐ ‐ 22,830 0.00%
14006 51010 Swst‐FICA 86,726 98,881 98,881 61,766 98,881 99,332 0.50%
14006 51100 Swst‐WRS 64,951 82,352 82,352 50,415 82,352 78,875 ‐4.20%
14006 51200 Swst‐Health Care 407,160 460,318 460,318 345,238 460,318 407,475 ‐11.50%
14006 51600 Swst‐Clothing Allowance 42 ‐ ‐ ‐ ‐ ‐ 0.00%
14010 50100 Stmt‐Salaries 1,234,370 1,129,040 1,129,040 1,028,911 1,129,040 1,140,621 1.00%
14010 50200 Stmt‐Part Time Salaries 27,911 65,158 65,158 13,969 65,158 70,122 7.60%
14010 50300 Stmt‐Overtime 71,262 100,000 100,000 197,196 100,000 245,423 145.40%
PUBLIC WORKS DETAIL EXPENDITURES
Page 118
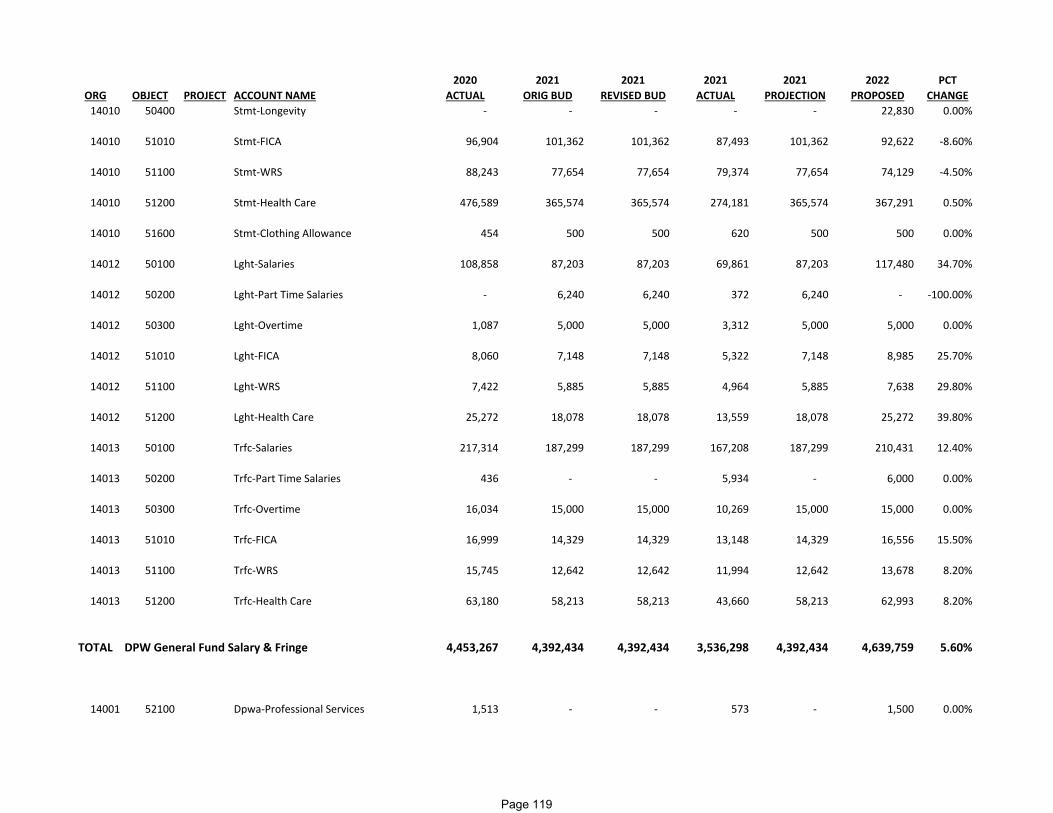
2020 2021 2021 2021 2021 2022 PCTORG OBJECT PROJECT ACCOUNT NAME ACTUAL ORIG BUD REVISED BUD ACTUAL PROJECTION PROPOSED CHANGE14010 50400 Stmt‐Longevity ‐ ‐ ‐ ‐ ‐ 22,830 0.00%
14010 51010 Stmt‐FICA 96,904 101,362 101,362 87,493 101,362 92,622 ‐8.60%
14010 51100 Stmt‐WRS 88,243 77,654 77,654 79,374 77,654 74,129 ‐4.50%
14010 51200 Stmt‐Health Care 476,589 365,574 365,574 274,181 365,574 367,291 0.50%
14010 51600 Stmt‐Clothing Allowance 454 500 500 620 500 500 0.00%
14012 50100 Lght‐Salaries 108,858 87,203 87,203 69,861 87,203 117,480 34.70%
14012 50200 Lght‐Part Time Salaries ‐ 6,240 6,240 372 6,240 ‐ ‐100.00%
14012 50300 Lght‐Overtime 1,087 5,000 5,000 3,312 5,000 5,000 0.00%
14012 51010 Lght‐FICA 8,060 7,148 7,148 5,322 7,148 8,985 25.70%
14012 51100 Lght‐WRS 7,422 5,885 5,885 4,964 5,885 7,638 29.80%
14012 51200 Lght‐Health Care 25,272 18,078 18,078 13,559 18,078 25,272 39.80%
14013 50100 Trfc‐Salaries 217,314 187,299 187,299 167,208 187,299 210,431 12.40%
14013 50200 Trfc‐Part Time Salaries 436 ‐ ‐ 5,934 ‐ 6,000 0.00%
14013 50300 Trfc‐Overtime 16,034 15,000 15,000 10,269 15,000 15,000 0.00%
14013 51010 Trfc‐FICA 16,999 14,329 14,329 13,148 14,329 16,556 15.50%
14013 51100 Trfc‐WRS 15,745 12,642 12,642 11,994 12,642 13,678 8.20%
14013 51200 Trfc‐Health Care 63,180 58,213 58,213 43,660 58,213 62,993 8.20%
TOTAL DPW General Fund Salary & Fringe 4,453,267 4,392,434 4,392,434 3,536,298 4,392,434 4,639,759 5.60%
14001 52100 Dpwa‐Professional Services 1,513 ‐ ‐ 573 ‐ 1,500 0.00%
Page 119
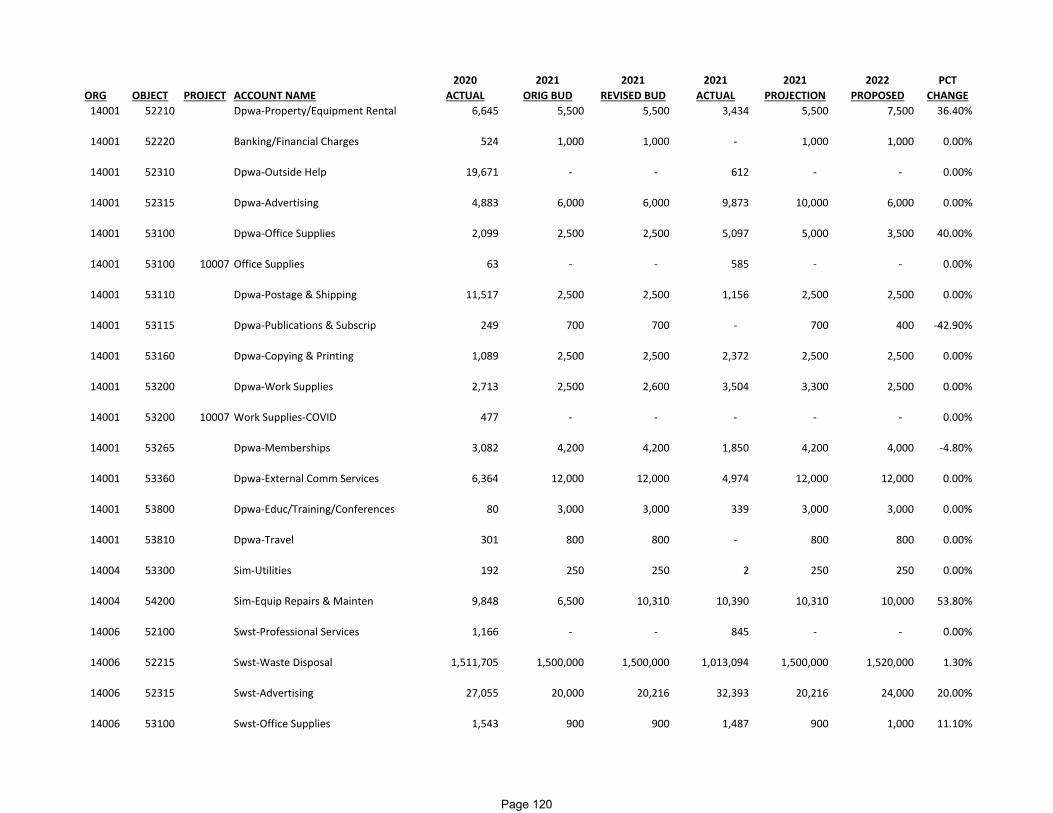
2020 2021 2021 2021 2021 2022 PCTORG OBJECT PROJECT ACCOUNT NAME ACTUAL ORIG BUD REVISED BUD ACTUAL PROJECTION PROPOSED CHANGE14001 52210 Dpwa‐Property/Equipment Rental 6,645 5,500 5,500 3,434 5,500 7,500 36.40%
14001 52220 Banking/Financial Charges 524 1,000 1,000 ‐ 1,000 1,000 0.00%
14001 52310 Dpwa‐Outside Help 19,671 ‐ ‐ 612 ‐ ‐ 0.00%
14001 52315 Dpwa‐Advertising 4,883 6,000 6,000 9,873 10,000 6,000 0.00%
14001 53100 Dpwa‐Office Supplies 2,099 2,500 2,500 5,097 5,000 3,500 40.00%
14001 53100 10007 Office Supplies 63 ‐ ‐ 585 ‐ ‐ 0.00%
14001 53110 Dpwa‐Postage & Shipping 11,517 2,500 2,500 1,156 2,500 2,500 0.00%
14001 53115 Dpwa‐Publications & Subscrip 249 700 700 ‐ 700 400 ‐42.90%
14001 53160 Dpwa‐Copying & Printing 1,089 2,500 2,500 2,372 2,500 2,500 0.00%
14001 53200 Dpwa‐Work Supplies 2,713 2,500 2,600 3,504 3,300 2,500 0.00%
14001 53200 10007 Work Supplies‐COVID 477 ‐ ‐ ‐ ‐ ‐ 0.00%
14001 53265 Dpwa‐Memberships 3,082 4,200 4,200 1,850 4,200 4,000 ‐4.80%
14001 53360 Dpwa‐External Comm Services 6,364 12,000 12,000 4,974 12,000 12,000 0.00%
14001 53800 Dpwa‐Educ/Training/Conferences 80 3,000 3,000 339 3,000 3,000 0.00%
14001 53810 Dpwa‐Travel 301 800 800 ‐ 800 800 0.00%
14004 53300 Sim‐Utilities 192 250 250 2 250 250 0.00%
14004 54200 Sim‐Equip Repairs & Mainten 9,848 6,500 10,310 10,390 10,310 10,000 53.80%
14006 52100 Swst‐Professional Services 1,166 ‐ ‐ 845 ‐ ‐ 0.00%
14006 52215 Swst‐Waste Disposal 1,511,705 1,500,000 1,500,000 1,013,094 1,500,000 1,520,000 1.30%
14006 52315 Swst‐Advertising 27,055 20,000 20,216 32,393 20,216 24,000 20.00%
14006 53100 Swst‐Office Supplies 1,543 900 900 1,487 900 1,000 11.10%
Page 120

2020 2021 2021 2021 2021 2022 PCTORG OBJECT PROJECT ACCOUNT NAME ACTUAL ORIG BUD REVISED BUD ACTUAL PROJECTION PROPOSED CHANGE
14006 53200 Swst‐Work Supplies 39,061 20,300 26,208 58,105 26,208 27,000 33.00%
14006 53210 Swst‐Janitorial Supplies 803 900 900 ‐ 900 900 0.00%
14006 53210 10007 Janitorial Supplies 771 ‐ ‐ ‐ ‐ ‐ 0.00%
14006 53240 Swst‐Direct clothing expenses 2,001 2,000 2,000 ‐ 2,000 2,000 0.00%
14006 53300 Swst‐Utilities 1,395 2,000 2,000 1,575 2,000 2,000 0.00%
14006 53360 Swst‐External Comm Services 8,398 ‐ ‐ ‐ ‐ ‐ 0.00%
14006 53800 Swst‐Educ/Training/Conferences 1,287 1,500 1,500 ‐ 1,500 1,500 0.00%
14006 53810 Swst‐Travel ‐ 500 500 ‐ 500 500 0.00%
14010 52100 Stmt‐Professional Services 362 ‐ ‐ 278 ‐ 500 0.00%
14010 52200 Stmt‐Contracted Services ‐ ‐ 5,000 7,635 5,000 20,000 0.00%
14010 52210 Stmt‐Property/Equipment Rental ‐ 1,000 1,000 ‐ 1,000 1,000 0.00%
14010 53100 Stmt‐Office Supplies 557 1,000 1,000 1,348 1,000 1,400 40.00%
14010 53100 10007 Office Supplies 1,116 ‐ ‐ ‐ ‐ ‐ 0.00%
14010 53160 Stmt‐Copying & Printing 4,135 2,000 2,000 ‐ 2,000 2,000 0.00%
14010 53200 Stmt‐Work Supplies 407,846 660,000 1,044,877 551,876 500,000 550,000 ‐16.70%
14010 53200 10007 Work Supplies 4,856 ‐ ‐ 1,464 ‐ ‐ 0.00%
14010 53210 Stmt‐Janitorial Supplies 1,449 1,500 1,500 643 1,500 1,500 0.00%
14010 53210 10007 Janitorial Supplies 1,871 ‐ ‐ ‐ ‐ ‐ 0.00%
14010 53240 Stmt‐Direct clothing expenses 86 500 500 ‐ 500 500 0.00%
14010 53300 Stmt‐Utilities 12,953 12,000 12,000 2,100 12,000 12,500 4.20%
Page 121
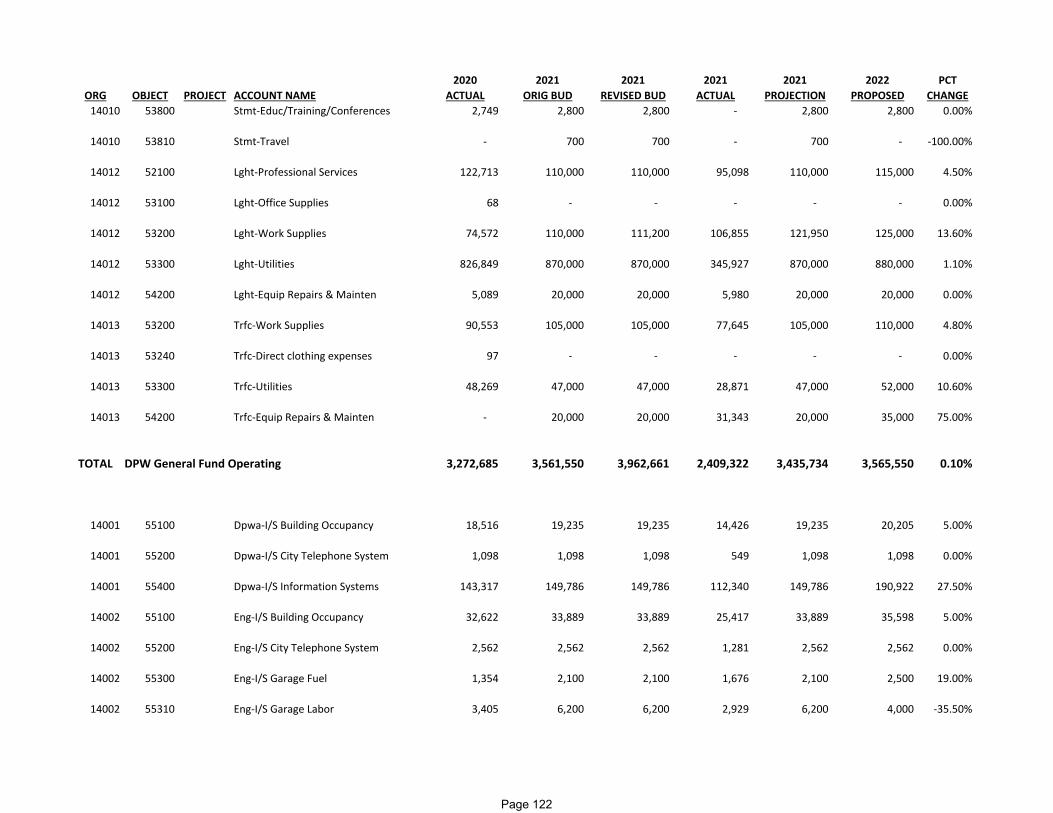
2020 2021 2021 2021 2021 2022 PCTORG OBJECT PROJECT ACCOUNT NAME ACTUAL ORIG BUD REVISED BUD ACTUAL PROJECTION PROPOSED CHANGE14010 53800 Stmt‐Educ/Training/Conferences 2,749 2,800 2,800 ‐ 2,800 2,800 0.00%
14010 53810 Stmt‐Travel ‐ 700 700 ‐ 700 ‐ ‐100.00%
14012 52100 Lght‐Professional Services 122,713 110,000 110,000 95,098 110,000 115,000 4.50%
14012 53100 Lght‐Office Supplies 68 ‐ ‐ ‐ ‐ ‐ 0.00%
14012 53200 Lght‐Work Supplies 74,572 110,000 111,200 106,855 121,950 125,000 13.60%
14012 53300 Lght‐Utilities 826,849 870,000 870,000 345,927 870,000 880,000 1.10%
14012 54200 Lght‐Equip Repairs & Mainten 5,089 20,000 20,000 5,980 20,000 20,000 0.00%
14013 53200 Trfc‐Work Supplies 90,553 105,000 105,000 77,645 105,000 110,000 4.80%
14013 53240 Trfc‐Direct clothing expenses 97 ‐ ‐ ‐ ‐ ‐ 0.00%
14013 53300 Trfc‐Utilities 48,269 47,000 47,000 28,871 47,000 52,000 10.60%
14013 54200 Trfc‐Equip Repairs & Mainten ‐ 20,000 20,000 31,343 20,000 35,000 75.00%
TOTAL DPW General Fund Operating 3,272,685 3,561,550 3,962,661 2,409,322 3,435,734 3,565,550 0.10%
14001 55100 Dpwa‐I/S Building Occupancy 18,516 19,235 19,235 14,426 19,235 20,205 5.00%
14001 55200 Dpwa‐I/S City Telephone System 1,098 1,098 1,098 549 1,098 1,098 0.00%
14001 55400 Dpwa‐I/S Information Systems 143,317 149,786 149,786 112,340 149,786 190,922 27.50%
14002 55100 Eng‐I/S Building Occupancy 32,622 33,889 33,889 25,417 33,889 35,598 5.00%
14002 55200 Eng‐I/S City Telephone System 2,562 2,562 2,562 1,281 2,562 2,562 0.00%
14002 55300 Eng‐I/S Garage Fuel 1,354 2,100 2,100 1,676 2,100 2,500 19.00%
14002 55310 Eng‐I/S Garage Labor 3,405 6,200 6,200 2,929 6,200 4,000 ‐35.50%
Page 122
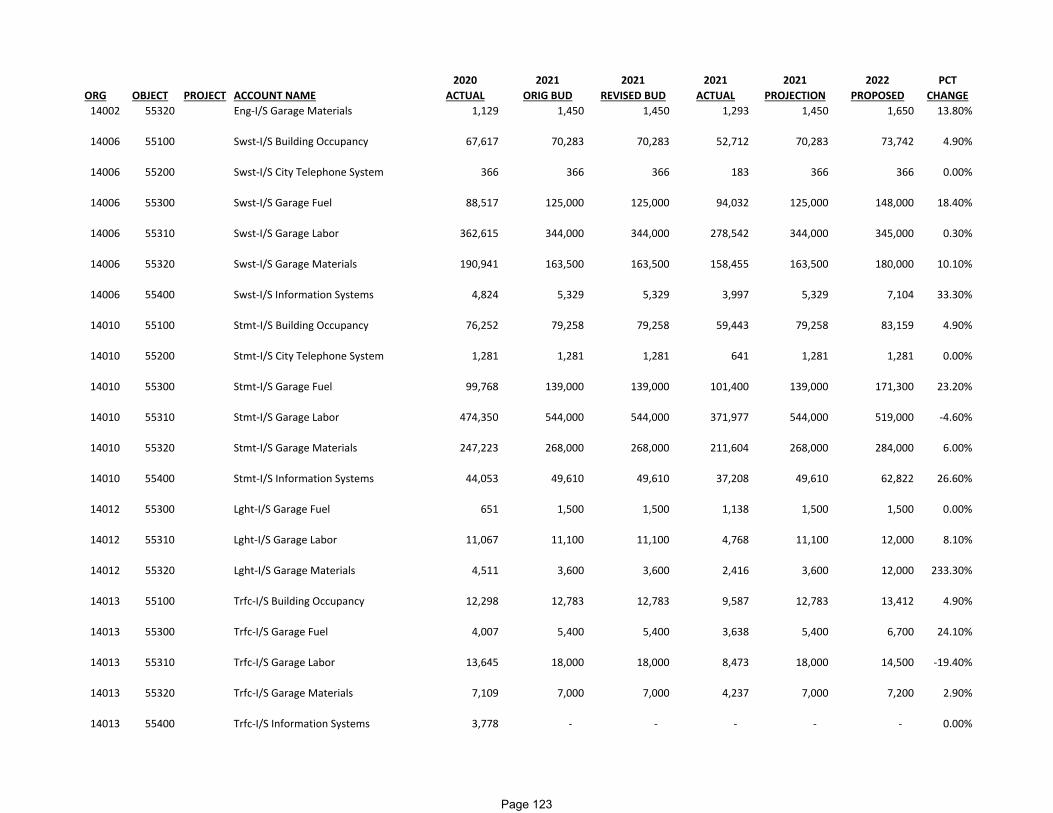
2020 2021 2021 2021 2021 2022 PCTORG OBJECT PROJECT ACCOUNT NAME ACTUAL ORIG BUD REVISED BUD ACTUAL PROJECTION PROPOSED CHANGE14002 55320 Eng‐I/S Garage Materials 1,129 1,450 1,450 1,293 1,450 1,650 13.80%
14006 55100 Swst‐I/S Building Occupancy 67,617 70,283 70,283 52,712 70,283 73,742 4.90%
14006 55200 Swst‐I/S City Telephone System 366 366 366 183 366 366 0.00%
14006 55300 Swst‐I/S Garage Fuel 88,517 125,000 125,000 94,032 125,000 148,000 18.40%
14006 55310 Swst‐I/S Garage Labor 362,615 344,000 344,000 278,542 344,000 345,000 0.30%
14006 55320 Swst‐I/S Garage Materials 190,941 163,500 163,500 158,455 163,500 180,000 10.10%
14006 55400 Swst‐I/S Information Systems 4,824 5,329 5,329 3,997 5,329 7,104 33.30%
14010 55100 Stmt‐I/S Building Occupancy 76,252 79,258 79,258 59,443 79,258 83,159 4.90%
14010 55200 Stmt‐I/S City Telephone System 1,281 1,281 1,281 641 1,281 1,281 0.00%
14010 55300 Stmt‐I/S Garage Fuel 99,768 139,000 139,000 101,400 139,000 171,300 23.20%
14010 55310 Stmt‐I/S Garage Labor 474,350 544,000 544,000 371,977 544,000 519,000 ‐4.60%
14010 55320 Stmt‐I/S Garage Materials 247,223 268,000 268,000 211,604 268,000 284,000 6.00%
14010 55400 Stmt‐I/S Information Systems 44,053 49,610 49,610 37,208 49,610 62,822 26.60%
14012 55300 Lght‐I/S Garage Fuel 651 1,500 1,500 1,138 1,500 1,500 0.00%
14012 55310 Lght‐I/S Garage Labor 11,067 11,100 11,100 4,768 11,100 12,000 8.10%
14012 55320 Lght‐I/S Garage Materials 4,511 3,600 3,600 2,416 3,600 12,000 233.30%
14013 55100 Trfc‐I/S Building Occupancy 12,298 12,783 12,783 9,587 12,783 13,412 4.90%
14013 55300 Trfc‐I/S Garage Fuel 4,007 5,400 5,400 3,638 5,400 6,700 24.10%
14013 55310 Trfc‐I/S Garage Labor 13,645 18,000 18,000 8,473 18,000 14,500 ‐19.40%
14013 55320 Trfc‐I/S Garage Materials 7,109 7,000 7,000 4,237 7,000 7,200 2.90%
14013 55400 Trfc‐I/S Information Systems 3,778 ‐ ‐ ‐ ‐ ‐ 0.00%
Page 123
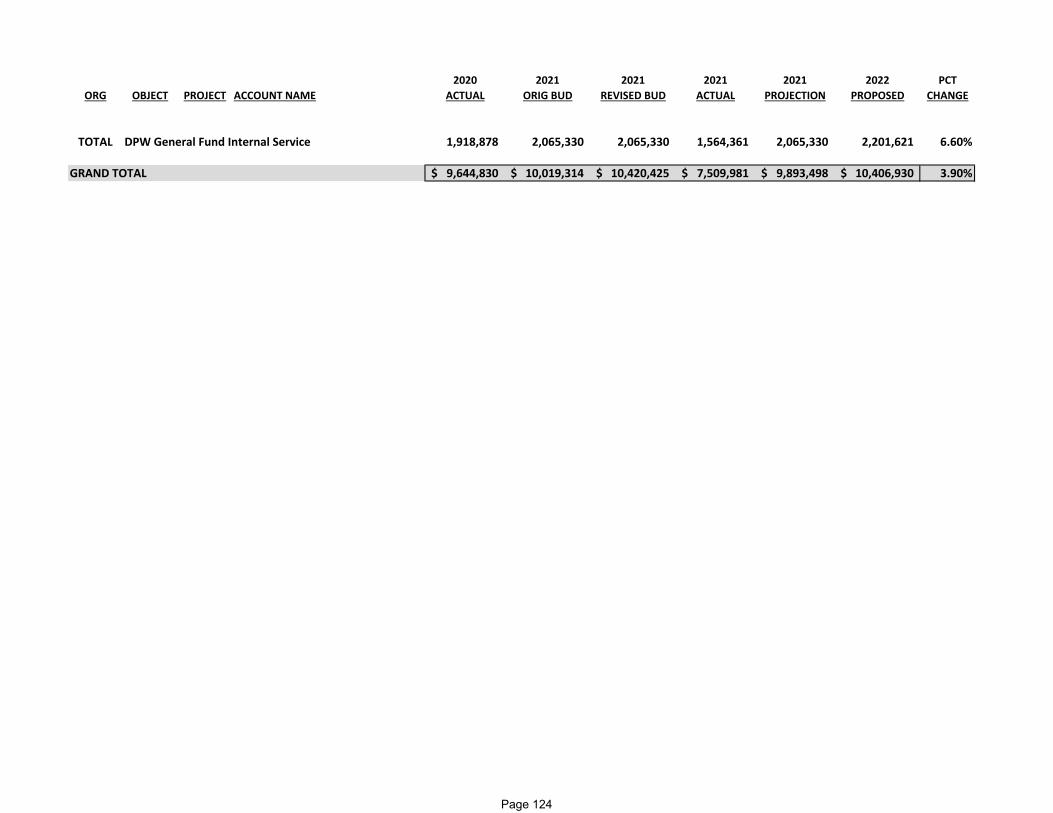
2020 2021 2021 2021 2021 2022 PCTORG OBJECT PROJECT ACCOUNT NAME ACTUAL ORIG BUD REVISED BUD ACTUAL PROJECTION PROPOSED CHANGE
TOTAL DPW General Fund Internal Service 1,918,878 2,065,330 2,065,330 1,564,361 2,065,330 2,201,621 6.60%
GRAND TOTAL 9,644,830$ 10,019,314$ 10,420,425$ 7,509,981$ 9,893,498$ 10,406,930$ 3.90%
Page 124

PARKS DEPARTMENT
Fund: 101-General Fund Department: 50-Parks Function: 50-Education and Recreation Orgs: 15001-15099
MISSION STATEMENT
The mission of the Department of Parks and Recreation is to preserve our parks and open spaces and provide essential recreational programs and cultural services in a safe, professional and friendly manner.
FUNCTION
Recreation Division - responsible for providing youth/adult sports, activities, special events and fundraisers. Staff is responsible for planning, implementing, and evaluating the programs as well as the over 250 part time staff and volunteers.
Youth Sports and Activities – Basketball, Softball, Volleyball, Track and Field, Kiddie Korner, Future, Play It Again, Bigs and Traditional Playgrounds, Main Gallery and snow sharks
Adult Sports and Activities – Basketball Softball, Volleyball, Pickle Ball and Kickball Special Events/Fundraisers – Movies in the Park, Hot Summer Nights, F/X Games, Monument Mash, Juneteenth Day and Bowling Fundraiser. Community Center – A total of five (5) community centers provide programming from youth to senior adults. The centers are placed in neighborhoods
scattered all of the city. Program consist of open gym activities, game room activities, art & Crafts, ceramics, senior clubs, etc. Public rental opportunities And outreach partnerships are encouraged
Parks Division - The parks maintenance staff maintains approximately 1,200 acres of parks, playgrounds and medians as well as providing services to public special events. The department also removes snow from 28 miles of alleyways, over 30 miles of sidewalks and department parking facilities. The parks division also maintains such parkland at North Beach, Monument Square, Horlick Athletic Field and Pershing Sports Facility. Forestry Division – Forestry staff maintains over 23,000 citywide trees. Maintenance includes planting trees, tree removals, emergency tree removals and tree pruning as well as EAB treatment of selected trees. Staff uses the Tree Keeper program system to inventory all city trees. Miscellaneous – Wustum Museum, Zoo and Golf Course (3) are under the umbrella of PRCS.
Page 125

PARKS DEPARTMENT
Fund: 101-General Fund Department: 50-Parks Function: 50-Education and Recreation Orgs: 15001-15099
SIGNIFICANT INITIATIVES RECENTLY ACCOMPLISHED
1. Worked with MIS to upgrade departments RECTRAC program. This program takes in our registration and reservation. 2. Our on-line registration option is up and running for our customers 3. Horlick Athletic Upgrades
a. Sound System, Baseball Field Netting with Batting Cage and new Trading Post 4. Paving of Cemetery Roads and Wustum Museum Parking Lot 5. Adopt-A-Park has 15 organizations and individuals under agreement at various park sites. 6. Reopening of Programming
a. Community Centers were reopened on June 2 b. Summer programming of Playgrounds, Volleyball and Softball c. Laurel Clark Fountain was reopened in July
7. PRCS staff provided virtual programming for Valentine’s Day and Easter Egg Hunt 8. 501c3 will meet its goal of $30,000 in donations, sponsorships and grants
2022 STRATEGIC INITIATIVES
1. Work with a firm to design and improve the look/function of park land overlooking Lake Michigan along the Pershing Park Drive, Michigan Pathway behind the Zoo and North Beach Park.
2. Hire a firm to prepare a master plan that will provide a detailed list of pathway sections and park sidewalks that will need maintenance or repair over a ten (10) year period.
3. Enhance the use of parks along the Root River by working with Root River Council to prepare a master plan to include park improvements, park signage, programming/events and marketing.
SIGNIFICANT FUNDING OR PROGRAM CHANGES IN 2022
1. Recreation – Increase in part time salaries of about $150,000 About $60,000 of this will allow PRCS to hire an additional six (6) Lifeguards. This will also allow PRCS to schedule lifeguards at Zoo
Beach on Saturday and Sundays The remainder relates to achieving a $15/hr. minimum wage for all employees including part timers.
2. Fees & Charges – No changes to our programming fees; Slight changes to the Private and Public Event Fees
Page 126
2022 Goal‐Setting Statement Department Name: Parks Department Head/Staff Name(s): Tom Molbeck
Goal Statement #1 Restore and/or enhance the lakefront city property
In order to restore and/or enhance the lakefront city property damaged by storms, the PRCS department (along with various other departments) will team with the Smithgroup for professional coastal and civil engineering services for the Coastal Resiliency and improvement Project at Shoop Park, Lake Michigan Pathway (Behind Zoo), North Beach Park (beach, English Street Outfall) Pershing Park (Revetment, Parking Lot, Bio‐swales) Samual Myers Park and Carre‐Hogle Park. Construction to begin at Michigan Pathway (Behind Zoo), Pershing Park (Revetment, Parking Lot, Bio‐swale) and North Beach in Early Spring 2022.
Goal Statement #2 Better maintain park sidewalks and Michigan/Root River Pathways
In order to better maintain our park sidewalks and Michigan/Root River Pathways, the PRCS Department will team with Neilsen Madsen + Barber (NMB – a Civil Engineering Company) to prepare a master plan that will provide a detailed list of pathway sections and park sidewalks that will need maintenance or repair over a ten (10) year period. This master plan will guide PRCS to the best way to lengthen the life of the surface and provide a safe environment for participants to enjoy. The master plan will be complete by July 2022 for the 2023 budget process.
Page 127
Goal Statement #3 Enhance the use of parks along the Root River
In order to enhance the use of parks along the Root River, the PRCS Department with team with the Root River Council to prepare a master plan to include park improvements, park signage, off street signage, informational signage, programming/events and marketing. These park enhancements and programming/events will assist with providing awareness of the parks to residents/visitors and increase the use of park along the river by 50%. This master plan will be on going but improvements will begin late Spring of 2022.
Page 128

Fund: 101 - General FundFunction: 50 - Education and RecreationDepartment: 40 - Parks DepartmentDivision: 5001-5099Org: 15001-15099
2021 20212020 Orignal Revised 2021 2022
Actual Budget Budget Estimated BudgetExpenditures by Appropriation Unit50GF1 Salaries & Fringes 3,264,328$ 3,495,927$ 3,495,927$ 3,498,927$ 3,881,546$ 50GF2 Operating Expenditures 1,448,066 1,473,575 1,492,814 1,546,538 1,570,277 50GF3 Inter-Departmental 1,400,823 1,430,088 1,430,088 1,430,088 1,577,860 50GF4 Capital Outlay - - - - -
Total Expenditures 6,113,217$ 6,399,590$ 6,418,829$ 6,475,553$ 7,029,683$
Expenditures by Division5001 Parks Admin 516,257$ 533,843$ 533,843$ 526,663$ 690,057$ 5002 Community Centers 1,421,351 1,472,483 1,472,483 1,474,312 1,665,810 5003 Parks 2,638,261 2,690,930 2,705,376 2,767,451 2,894,951 5004 Recreation 639,310 824,205 828,998 828,998 897,799 5098 Museum 311,072 345,180 345,180 345,180 347,135 5099 Zoo 586,966 532,949 532,949 532,949 533,931
Total Expenditures 6,113,217$ 6,399,590$ 6,418,829$ 6,475,553$ 7,029,683$
Community Centers by Location0014 Chavez 342,565$ 314,748$ 314,748$ 314,948$ 373,820$ 0015 Humble Park 121,300 129,028 129,028 129,596 145,906 0016 King 336,032 359,321 359,321 359,490 409,827 0017 Bryant 356,494 390,350 390,350 390,646 428,474 0018 Tyler Domer 264,960 279,036 279,036 279,632 307,783
Total Expenditures 1,421,351$ 1,472,483$ 1,472,483$ 1,474,312$ 1,665,810$
PARKS, RECREATION & CULTURAL SERVICESDepartmental Expenditure Summary
Parks Admin8%
Community Centers 23%
Parks 42%
Recreation 13%
Museum 6%Zoo 8%
2021 Costs by Division
Parks Admin10%
Community Centers 24%
Parks 41%
Recreation 13%
Museum 5%Zoo 7%
2022 Costs by Division
Page 129

2020 2021 2021 2021 2021 2022 PCTORG OBJECT PROJECT ACCOUNT NAME ACTUAL ORIG BUD REVISED BUD ACTUAL PROJECTION PROPOSED CHANGE
15001 50100 Prdr‐Salaries 236,297 250,818 250,818 214,564 250,818 376,716 50.20%
15001 50200 Prdr‐Part Time Salaries 27,100 ‐ ‐ ‐ ‐ ‐ 0.00%
15001 50300 Prdr‐Overtime ‐ ‐ ‐ 613 ‐ ‐ 0.00%
15001 51010 Prdr‐FICA 19,013 19,189 19,189 15,621 19,189 28,819 50.20%
15001 51100 Prdr‐WRS 17,900 16,932 16,932 14,179 16,932 24,486 44.60%
15001 51200 Prdr‐Health Care 63,180 84,240 84,240 63,180 84,240 84,240 0.00%
15001 51810 Prdr‐Mileage 477 1,000 1,000 761 1,000 1,000 0.00%
1500214 50100 Chvz‐Salaries 84,090 53,275 53,275 54,133 53,275 65,772 23.50%
1500214 50200 Chvz‐Part Time Salaries 35,642 47,847 47,847 36,397 47,847 58,517 22.30%
1500214 51010 Chvz‐FICA 9,036 7,630 7,630 6,609 7,630 9,511 24.70%
1500214 51100 Chvz‐WRS 6,855 3,783 3,783 4,874 3,783 4,513 19.30%
1500214 51200 Chvz‐Health Care 42,120 26,379 26,379 19,784 26,379 42,120 59.70%
1500214 51810 Chvz‐Mileage 570 960 960 634 960 960 0.00%
1500215 50100 Hmbl‐Salaries 197 ‐ ‐ ‐ ‐ ‐ 0.00%
1500215 50200 Hmbl‐Part Time Salaries 25,465 27,491 27,491 22,758 27,491 33,075 20.30%
1500215 51010 Hmbl‐FICA 1,963 3,643 3,643 1,741 3,643 2,523 ‐30.70%
1500215 51100 Hmbl‐WRS 988 957 957 801 957 556 ‐41.90%
PARK & RECREATION DETAIL EXPENDITURES
Page 130

2020 2021 2021 2021 2021 2022 PCTORG OBJECT PROJECT ACCOUNT NAME ACTUAL ORIG BUD REVISED BUD ACTUAL PROJECTION PROPOSED CHANGE
1500216 50100 King‐Salaries 65,912 64,771 64,771 51,487 64,771 67,124 3.60%
1500216 50200 King‐Part Time Salaries 47,261 58,593 58,593 31,529 58,593 70,956 21.10%
1500216 51010 King‐FICA 8,445 9,437 9,437 6,127 9,437 10,561 11.90%
1500216 51100 King‐WRS 5,881 4,746 4,746 4,585 4,746 4,823 1.60%
1500216 51200 King‐Health Care 21,060 21,060 21,060 15,795 21,060 21,060 0.00%
1500216 51810 King‐Mileage 118 600 600 45 600 600 0.00%
1500217 50100 Brnt‐Salaries 79,883 77,355 77,355 61,515 77,355 79,354 2.60%
1500217 50200 Brnt‐Part Time Salaries 37,079 60,014 60,014 52,927 60,014 73,411 22.30%
1500217 51010 Brnt‐FICA 8,650 10,512 10,512 8,482 10,512 11,686 11.20%
1500217 51100 Brnt‐WRS 6,212 5,609 5,609 5,707 5,609 5,710 1.80%
1500217 51200 Brnt‐Health Care 21,060 21,060 21,060 15,795 21,060 21,060 0.00%
1500217 51810 Brnt‐Mileage 167 500 500 ‐ 500 500 0.00%
1500218 50100 Tylr‐Salaries 75,425 77,355 77,355 59,418 77,355 79,472 2.70%
1500218 50200 Tylr‐Part Time Salaries 20,060 27,491 27,491 17,942 27,491 33,730 22.70%
1500218 51010 Tylr‐FICA 7,173 8,017 8,017 5,780 8,017 8,659 8.00%
1500218 51100 Tylr‐WRS 6,363 5,360 5,360 5,144 5,360 5,948 11.00%
1500218 51200 Tylr‐Health Care 21,060 21,060 21,060 15,795 21,060 21,060 0.00%
1500218 51810 Tylr‐Mileage 721 960 960 1,396 960 960 0.00%
15003 50100 Park‐Salaries 964,484 925,438 925,438 729,187 925,438 936,469 1.20%
15003 50200 Park‐Part Time Salaries 264,771 392,722 392,722 253,504 392,722 466,783 18.90%
Page 131

2020 2021 2021 2021 2021 2022 PCTORG OBJECT PROJECT ACCOUNT NAME ACTUAL ORIG BUD REVISED BUD ACTUAL PROJECTION PROPOSED CHANGE15003 50300 Park‐Overtime 7,345 15,000 15,000 22,796 19,000 20,000 33.30%
15003 51010 Park‐FICA 91,614 100,840 100,840 73,741 100,840 108,893 8.00%
15003 51100 Park‐WRS 75,774 66,736 66,736 57,813 66,736 75,388 13.00%
15003 51200 Park‐Health Care 299,052 273,780 273,780 205,335 273,780 252,720 ‐7.70%
15003 51600 Park‐Clothing Allowance 486 800 800 273 800 800 0.00%
15003 51810 Park‐Mileage 332 1,500 1,500 ‐ 500 500 ‐66.70%
15004 50100 Rec‐Salaries 26,572 84,718 84,718 59,788 84,718 ‐ ‐100.00%
15004 50200 Rec‐Part Time Salaries 434,701 531,811 531,811 415,278 531,811 685,878 29.00%
15004 50300 Rec‐Overtime 4,220 ‐ ‐ 5,611 ‐ ‐ 0.00%
15004 51010 Rec‐FICA 35,307 45,417 45,417 36,148 45,417 52,526 15.70%
15004 51100 Rec‐WRS 10,815 12,905 12,905 9,631 12,905 7,247 ‐43.80%
15004 51200 Rec‐Health Care 42,120 21,816 21,816 16,362 21,816 21,060 ‐3.50%
15004 51810 Rec‐Mileage 3,313 3,800 3,800 2,561 3,800 3,800 0.00%
TOTAL Parks General Fund Salary & Fringe 3,264,328 3,495,927 3,495,927 2,704,148 3,498,927 3,881,546 11.00%
15001 52210 Prdr‐Property/Equipment Rental 4,016 3,900 3,900 1,359 4,300 4,308 10.50%
15001 52220 Prdr‐Banking/Financial Charges 2,458 4,500 4,500 2,292 4,100 4,100 ‐8.90%
15001 52315 Prdr‐Advertising 3,398 8,380 8,380 5,602 5,000 8,370 ‐0.10%
15001 53100 Prdr‐Office Supplies 2,989 6,500 6,500 3,253 6,500 6,500 0.00%
15001 53100 10007 Office Supplies‐COVID 3,102 ‐ ‐ ‐ ‐ ‐ 0.00%
Page 132

2020 2021 2021 2021 2021 2022 PCTORG OBJECT PROJECT ACCOUNT NAME ACTUAL ORIG BUD REVISED BUD ACTUAL PROJECTION PROPOSED CHANGE
15001 53110 Prdr‐Postage & Shipping 1,000 2,000 2,000 1,531 2,000 2,000 0.00%
15001 53115 Prdr‐Publications & Subscrip 98 120 120 49 120 120 0.00%
15001 53160 Prdr‐Copying & Printing 550 1,200 1,200 1,588 1,200 1,200 0.00%
15001 53200 10007 Work Supplies‐COVID 318 ‐ ‐ ‐ ‐ ‐ 0.00%
15001 53265 Prdr‐Memberships 2,051 2,000 2,000 591 2,000 2,000 0.00%
15001 53800 Prdr‐Educ/Training/Conferences 99 2,600 2,600 ‐ 500 2,600 0.00%
15001 53810 Prdr‐Travel ‐ 1,700 1,700 ‐ ‐ 1,700 0.00%
15001 54200 Prdr‐Equip Repairs & Mainten 85 600 600 ‐ 600 600 0.00%
1500214 52200 Chvz‐Contracted Services 37,091 40,500 40,500 29,800 40,500 45,580 12.50%
1500214 53115 Chvz‐Publications & Subscrip 217 275 275 269 275 275 0.00%
1500214 53200 Chvz‐Work Supplies 874 1,000 1,000 354 1,000 1,000 0.00%
1500214 53210 Chvz‐Janitorial Supplies 1,795 2,300 2,300 662 2,300 2,300 0.00%
1500214 53230 Chvz‐Small Equipment 873 1,000 1,000 379 1,000 1,000 0.00%
1500214 53255 Licenses Permits & Fees 456 590 590 473 590 590 0.00%
1500214 54200 Chvz‐Equip Repairs & Mainten 3,897 4,000 4,000 2,375 4,200 4,372 9.30%
1500215 52200 Hmbl‐Contracted Services 15,228 15,000 15,000 9,945 15,000 19,479 29.90%
1500215 53200 Hmbl‐Work Supplies 354 400 400 444 400 400 0.00%
1500215 53210 Hmbl‐Janitorial Supplies 995 1,000 1,000 374 1,000 1,000 0.00%
1500215 53255 Hmbl‐Licenses Permits & Fees 456 590 590 473 590 590 0.00%
1500215 54200 Hmbl‐Equip Repairs & Mainten 1,931 2,592 2,592 1,507 3,160 2,604 0.50%
Page 133

2020 2021 2021 2021 2021 2022 PCTORG OBJECT PROJECT ACCOUNT NAME ACTUAL ORIG BUD REVISED BUD ACTUAL PROJECTION PROPOSED CHANGE
1500216 52200 King‐Contracted Services 32,978 34,664 34,664 27,106 34,664 47,640 37.40%
1500216 53115 King‐Publications & Subscrip ‐ 275 275 ‐ 275 275 0.00%
1500216 53200 King‐Work Supplies 1,209 1,000 1,000 687 1,000 1,000 0.00%
1500216 53210 King‐Janitorial Supplies 1,161 2,000 2,000 57 2,000 2,000 0.00%
1500216 53230 King‐Small Equipment 627 800 800 87 800 800 0.00%
1500216 53255 King‐Licenses Permits & Fees 456 590 590 473 590 590 0.00%
1500216 54200 King‐Equip Repairs & Mainten 2,165 4,200 4,200 1,657 4,369 4,470 6.40%
1500217 52200 Brnt‐Contracted Services 36,630 37,682 37,682 25,124 37,682 38,658 2.60%
1500217 53115 Brnt‐Publications & Subscrip 114 275 275 ‐ 275 275 0.00%
1500217 53200 Brnt‐Work Supplies 712 800 800 600 800 800 0.00%
1500217 53200 10007 Work Supplies 299 ‐ ‐ ‐ ‐ ‐ 0.00%
1500217 53210 Brnt‐Janitorial Supplies 1,363 2,000 2,000 673 2,000 2,000 0.00%
1500217 53230 Brnt‐Small Equipment 717 1,000 1,000 446 1,000 1,000 0.00%
1500217 53255 Brnt‐Licenses Permits & Fees 1,338 590 590 473 590 590 0.00%
1500217 54200 Brnt‐Equip Repairs & Mainten 2,284 5,000 5,000 3,199 5,295 5,070 1.40%
1500218 52200 Tylr‐Contracted Services 23,490 20,868 20,868 15,221 20,972 28,260 35.40%
1500218 53200 Tylr‐Work Supplies 361 400 400 405 700 650 62.50%
1500218 53210 Tylr‐Janitorial Supplies 965 1,000 1,000 40 1,000 1,000 0.00%
1500218 53230 Tylr‐Small Equipment 667 1,000 1,000 50 750 750 ‐25.00%
1500218 53255 Tylr‐Licenses Permits & Fees 456 590 590 473 590 590 0.00%
Page 134

2020 2021 2021 2021 2021 2022 PCTORG OBJECT PROJECT ACCOUNT NAME ACTUAL ORIG BUD REVISED BUD ACTUAL PROJECTION PROPOSED CHANGE
1500218 54200 Tylr‐Equip Repairs & Mainten 1,578 2,267 2,267 1,723 2,709 2,504 10.50%
15003 52200 Park‐Contracted Services 23,216 33,400 47,846 38,473 47,846 34,000 1.80%
15003 52210 Park‐Property/Equipment Rental 7,534 6,400 6,400 6,297 7,000 7,000 9.40%
15003 53160 Park‐Copying & Printing 87 300 300 66 150 300 0.00%
15003 53200 Park‐Work Supplies 6,150 8,000 8,000 4,261 8,000 8,000 0.00%
15003 53200 10007 Work Supplies‐COVID 19 980 ‐ ‐ ‐ ‐ ‐ 0.00%
15003 53210 Park‐Janitorial Supplies 5,725 6,000 6,000 5,880 6,000 6,000 0.00%
15003 53210 10007 Janitorial Supplies‐COVID 3,243 ‐ ‐ 440 ‐ ‐ 0.00%
15003 53230 Park‐Small Equipment 4,436 5,500 5,500 4,211 5,500 5,500 0.00%
15003 53300 Park‐Utilities 226,146 179,000 179,000 100,776 240,000 243,515 36.00%
15003 53800 Park‐Educ/Training/Conferences 502 1,800 1,800 ‐ ‐ 1,000 ‐44.40%
15003 53810 Park‐Travel ‐ 575 575 ‐ ‐ 500 ‐13.00%
15003 54100 Park‐Building Repairs & Mainte 34,653 42,000 42,000 6,869 42,000 42,000 0.00%
15003 54200 Park‐Equip Repairs & Mainten 4,224 4,300 4,300 1,573 4,300 4,300 0.00%
15003 54300 Park‐Grounds Repairs & Mainten 25,108 36,100 36,100 24,984 36,100 36,100 0.00%
15004 52200 Rec‐Contracted Services 6,751 15,000 16,595 2,730 16,595 15,000 0.00%
15004 52210 Rec‐Property/Equipment Rental 1,260 9,000 9,000 8,561 9,000 9,000 0.00%
15004 53200 Rec‐Work Supplies 32,244 45,000 45,600 20,572 45,600 45,000 0.00%
15004 53200 10007 Work Supplies‐COVID 12,893 ‐ ‐ 823 ‐ ‐ 0.00%
15004 53360 Rec‐External Comm Services 11,909 15,000 15,000 10,192 15,000 15,000 0.00%
Page 135
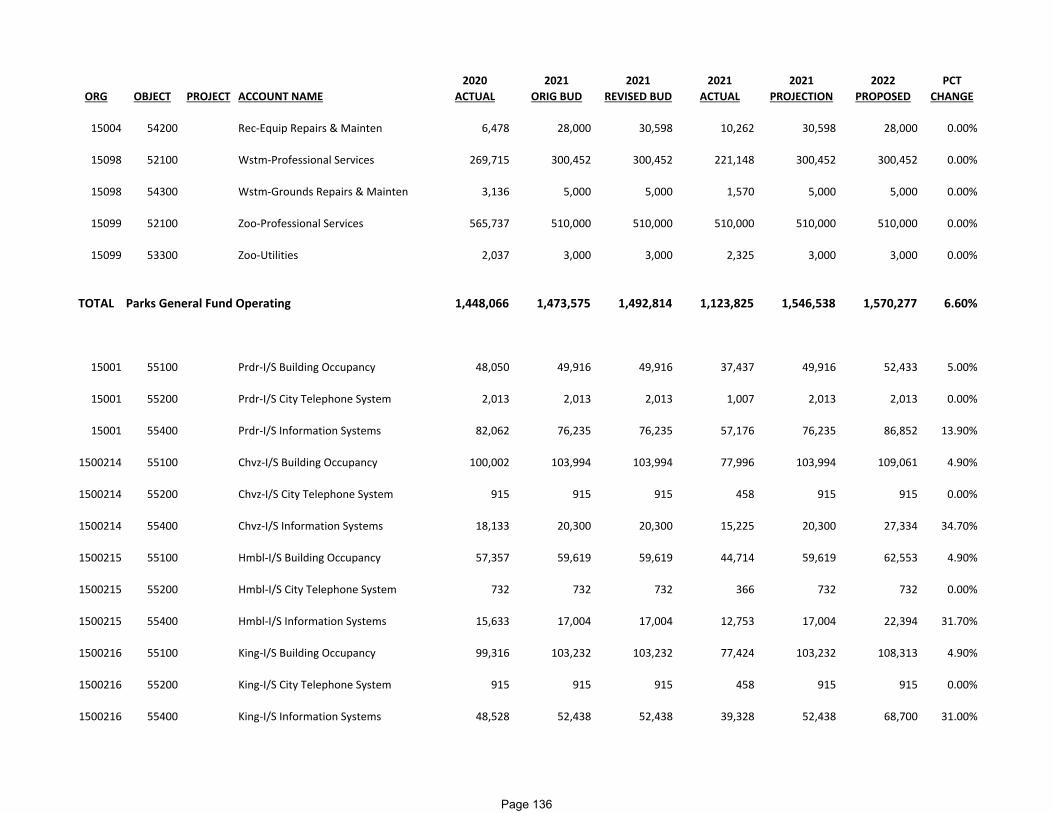
2020 2021 2021 2021 2021 2022 PCTORG OBJECT PROJECT ACCOUNT NAME ACTUAL ORIG BUD REVISED BUD ACTUAL PROJECTION PROPOSED CHANGE
15004 54200 Rec‐Equip Repairs & Mainten 6,478 28,000 30,598 10,262 30,598 28,000 0.00%
15098 52100 Wstm‐Professional Services 269,715 300,452 300,452 221,148 300,452 300,452 0.00%
15098 54300 Wstm‐Grounds Repairs & Mainten 3,136 5,000 5,000 1,570 5,000 5,000 0.00%
15099 52100 Zoo‐Professional Services 565,737 510,000 510,000 510,000 510,000 510,000 0.00%
15099 53300 Zoo‐Utilities 2,037 3,000 3,000 2,325 3,000 3,000 0.00%
TOTAL Parks General Fund Operating 1,448,066 1,473,575 1,492,814 1,123,825 1,546,538 1,570,277 6.60%
15001 55100 Prdr‐I/S Building Occupancy 48,050 49,916 49,916 37,437 49,916 52,433 5.00%
15001 55200 Prdr‐I/S City Telephone System 2,013 2,013 2,013 1,007 2,013 2,013 0.00%
15001 55400 Prdr‐I/S Information Systems 82,062 76,235 76,235 57,176 76,235 86,852 13.90%
1500214 55100 Chvz‐I/S Building Occupancy 100,002 103,994 103,994 77,996 103,994 109,061 4.90%
1500214 55200 Chvz‐I/S City Telephone System 915 915 915 458 915 915 0.00%
1500214 55400 Chvz‐I/S Information Systems 18,133 20,300 20,300 15,225 20,300 27,334 34.70%
1500215 55100 Hmbl‐I/S Building Occupancy 57,357 59,619 59,619 44,714 59,619 62,553 4.90%
1500215 55200 Hmbl‐I/S City Telephone System 732 732 732 366 732 732 0.00%
1500215 55400 Hmbl‐I/S Information Systems 15,633 17,004 17,004 12,753 17,004 22,394 31.70%
1500216 55100 King‐I/S Building Occupancy 99,316 103,232 103,232 77,424 103,232 108,313 4.90%
1500216 55200 King‐I/S City Telephone System 915 915 915 458 915 915 0.00%
1500216 55400 King‐I/S Information Systems 48,528 52,438 52,438 39,328 52,438 68,700 31.00%
Page 136
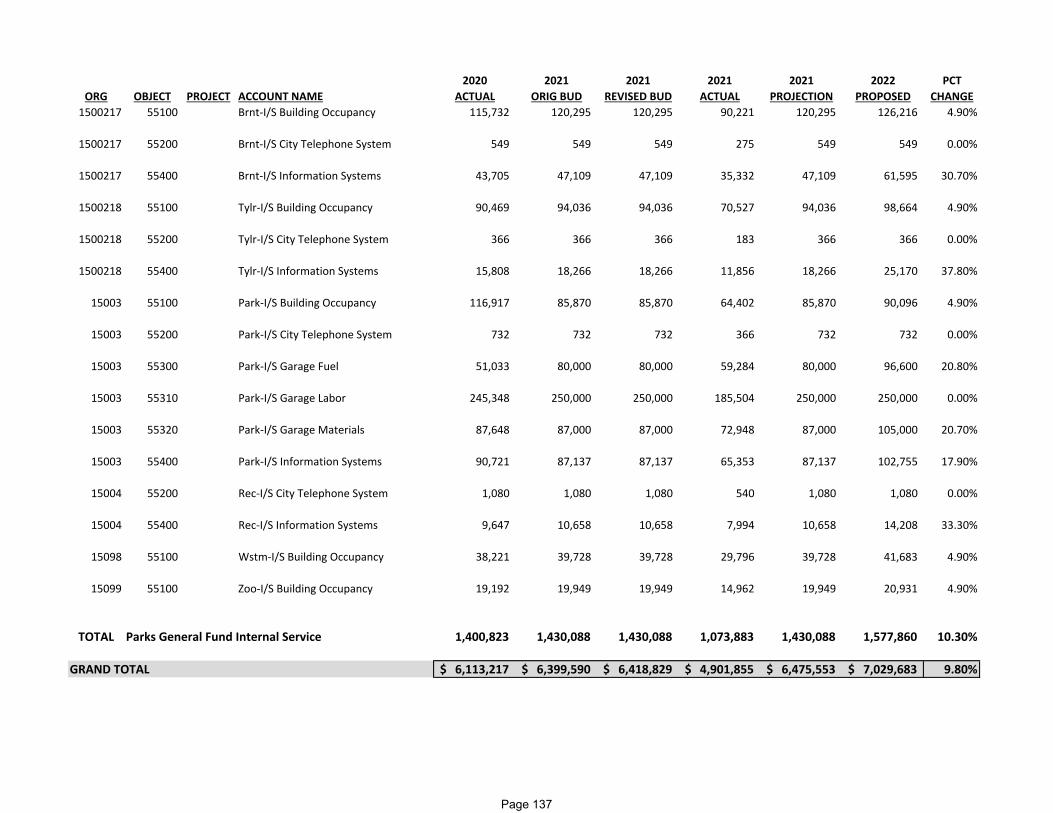
2020 2021 2021 2021 2021 2022 PCTORG OBJECT PROJECT ACCOUNT NAME ACTUAL ORIG BUD REVISED BUD ACTUAL PROJECTION PROPOSED CHANGE
1500217 55100 Brnt‐I/S Building Occupancy 115,732 120,295 120,295 90,221 120,295 126,216 4.90%
1500217 55200 Brnt‐I/S City Telephone System 549 549 549 275 549 549 0.00%
1500217 55400 Brnt‐I/S Information Systems 43,705 47,109 47,109 35,332 47,109 61,595 30.70%
1500218 55100 Tylr‐I/S Building Occupancy 90,469 94,036 94,036 70,527 94,036 98,664 4.90%
1500218 55200 Tylr‐I/S City Telephone System 366 366 366 183 366 366 0.00%
1500218 55400 Tylr‐I/S Information Systems 15,808 18,266 18,266 11,856 18,266 25,170 37.80%
15003 55100 Park‐I/S Building Occupancy 116,917 85,870 85,870 64,402 85,870 90,096 4.90%
15003 55200 Park‐I/S City Telephone System 732 732 732 366 732 732 0.00%
15003 55300 Park‐I/S Garage Fuel 51,033 80,000 80,000 59,284 80,000 96,600 20.80%
15003 55310 Park‐I/S Garage Labor 245,348 250,000 250,000 185,504 250,000 250,000 0.00%
15003 55320 Park‐I/S Garage Materials 87,648 87,000 87,000 72,948 87,000 105,000 20.70%
15003 55400 Park‐I/S Information Systems 90,721 87,137 87,137 65,353 87,137 102,755 17.90%
15004 55200 Rec‐I/S City Telephone System 1,080 1,080 1,080 540 1,080 1,080 0.00%
15004 55400 Rec‐I/S Information Systems 9,647 10,658 10,658 7,994 10,658 14,208 33.30%
15098 55100 Wstm‐I/S Building Occupancy 38,221 39,728 39,728 29,796 39,728 41,683 4.90%
15099 55100 Zoo‐I/S Building Occupancy 19,192 19,949 19,949 14,962 19,949 20,931 4.90%
TOTAL Parks General Fund Internal Service 1,400,823 1,430,088 1,430,088 1,073,883 1,430,088 1,577,860 10.30%
GRAND TOTAL 6,113,217$ 6,399,590$ 6,418,829$ 4,901,855$ 6,475,553$ 7,029,683$ 9.80%
Page 137

This page is intentionally left blank
Page 138
COMMUNITY DEVELOPMENT
Fund: 101-General Fund Department: 60-Community Development Function: 60-Community Development Orgs: 16001-16005
MISSION STATEMENT
The Department of City Development works to enhance the community by expanding the tax base, attracting employment opportunities, improving the City’s housing stock, and improving the quality of life for the citizens of the City of Racine.
FUNCTION
The Department of City Development has responsibilities in six program areas: Planning and Redevelopment, Neighborhood Services, Building and Code Compliance, Project Management and Administrative Services, Assessment Services, and Neighborhood Enhancement.
Planning and Redevelopment Division creates long-term land use plans for the City and implements the plans through land use regulation and redevelopment activities. The division’s staff is focused on the physical development of the City and creating opportunities for enhancement, historic preservation, and redevelopment. The staff coordinates will City departments in planning and redevelopment projects and provides guidance and interpretation of plans, codes and ordinances to the general public and the development community. The staff supports the Planning, Heritage, and Design Commission, Zoning and Building Board of Appeals, Community Development Authority, area business improvement districts, and industrial park development review committees, and other special planning committees and initiatives as assigned.
Neighborhood Services Division (formerly Housing and Community Development) administers federal community block grants and housing development programs for low to moderate individuals, provides a Fair Housing program to all residents, and works to address the housing and neighborhood development needs of the City’s most vulnerable areas. The staff works with the Community Development Committee and the Loan Board of Review.
Building and Code Compliance is responsible for is responsible for the administration of the building code and zoning ordinances within the city. This division is tasked with ensuring that all buildings and structures are safe and compliant with the current construction methods, standards, requirements and procedures. The building, plumbing, electrical code compliance inspectors conduct routine and requested inspections throughout the city.
Department staff address blight and neighborhood appearance and ensures that buildings are structurally safe in compliance with state and local regulations. The staff works with the Building Board of Appeals to ensure that the City’s buildings are safe.
Project Management and Administrative Services Division provides clerical, administrative and project management support to the department staff and management in the areas of Communication (internal and external), Record keeping (including research, data/file management, statutorily required reporting etc.) and property appeal/court case work file retention. The staff provides client-centered written and verbal contacts with the public, government officials, property
Page 139
COMMUNITY DEVELOPMENT
Fund: 101-General Fund Department: 60-Community Development Function: 60-Community Development Orgs: 16001-16005
owners, business and community leaders and others. It is responsible for implementing project tracking and other quality control measures throughout city development to facilitate seamless workflow progress across each of the division functions. The division oversees the scheduling of boards and committees; including developing documents for review, analysis and approval processes. Staff handles records requests, mass mailings (rents, assessment notices, public notices, etc.), property listings and other large scale clerical functions within the department. The support services team strives to utilize the significant skills, education, and diverse background of its employees to benefit the citizens of Racine.
Assessment Services Division is primarily responsible for conducting fair, equitable, and accurate assessments of all property within the municipality boundaries in accordance with Wisconsin Statues. The assessment division is entrusted with the responsibility to ensure that assessed values used for tax purposes are impartial and understandable and that the tax burden is distributed fairly. Additionally, this area provides public education to property owners regarding the appraisal process and their options for the appeal process. The assessment division will continually improve our services and customer relations through innovation, understanding systems and processes, knowing and valuing our client/customer needs. The assessment division also responds to requests presented by the City’s Board of Review.
Neighborhood Enhancement Division has established a program of regularly scheduled, systematic inspections of residential rental dwelling units within neighborhood stabilization and enhancement districts within the city to ensure that those units provide safe, decent, and sanitary living conditions for tenants living in the residential rental dwelling unit and to prevent further deterioration of those units. The division provides data and documentation to support the City of Racine’s effort to identify and reduce the number of chronic nuisance properties that occur within the city. This division encourages property owners who own and operate residential rental dwelling units to exercise their responsibility to ensure that the city ordinances governing the condition and maintenance of residential rental dwelling units are followed to protect the health, safety, and welfare of the public and prevent blighted conditions in city neighborhoods.
SIGNIFICANT INITIATIVES RECENTLY ACCOMPLISHED
1. Construction was completed and occupancy has begun at the Arabella Apartments, a 60-unit affordable multifamily development, which was assisted with significant financial assistance facilitated by the City Development Department.
2. The City Development Department secured around $1.2 million in Emergency Solutions Grant-Coronavirus Response (ESG-CV) and $1.9 million in Community Development Block Grant-Coronavirus Response (CDBG-CV) funds to be used by local agencies to prevent, prepare for, and respond to the COVID-19 pandemic.
3. Seven single-family homes developed or rehabilitated with City Development financing and/or site assemblage efforts have been sold in 2021. 4. Developed and initiated funding program for the use of around $300,000 of increment generated through TID #22.
Page 140
COMMUNITY DEVELOPMENT
Fund: 101-General Fund Department: 60-Community Development Function: 60-Community Development Orgs: 16001-16005
5. Oversaw the comprehensive change in City assessment software by fully implementing Market Drive as the system of record for City of Racine tax
assessments
2022 STRATEGIC INITIATIVES
1. Continuing implementation of the RENTS Ordinance through management of tenant protection services, including facilitating use of the rent escrow program and retaliation protection services, as well as funding neighborhood inspection services and the Neighborhood Enhancement Division.
2. Serving the community through timely and effective use of Federal Community Development Block Grant (CDBG), HOME Investment Partnerships (HOME) Program, and Emergency Solutions Grant (ESG) funds in light of the COVID-19 pandemic.
3. Completing an update to the City’s Comprehensive Plan per State Statute 66.1001. 4. Creating TID-specific and Citywide homeownership incentives for both the general public and City employees to increase the percentage of City
residents who are homeowners
SIGNIFICANT FUNDING OR PROGRAM CHANGES IN 2022
1. Initiating a land bank program in partnership with the CDA to acquire and revitalize tax delinquent single-family properties. 2. Two new inspector positions in the Neighborhood Enhancement Division $215,000
Page 141
2022 Goal‐Setting Statement Department Name: Planning Division Department Head/Staff Name(s): Bill Bowers
Goal Statement #1 Provide consistent direction on program design and administration on land use decisions by updating the Comprehensive Plan
In order to provide consistent direction to all City committees, boards, commissions, councils, departments, and staff on program design and administration on land use decisions, the Comprehensive Plan for the City of Racine: 2035 will be updated for City‐based, geo‐related and service programs by the PHDC Commission by July 31, 2022. Notes/comments for this statement: Updating of the City's comprehensive plan is a mandate of State Statute 66.1001 and is required to be undertaken every 10 years. The City's current comprehensive plan was adopted in by the Common Council in December of 2009. Failure to update the plan heightens the risk of the City's planning and land use decisions being found invalid if brought under legal challenge. In addition, many grant sources will not accept as supporting documentation any plans which are over ten years old.
Goal Statement #2 Promote economic development and expand tax base
In order to promote economic development and expand the tax base, the zoning ordinance will be amended to create a North Beach overlay district by the PHDC Commission in 2021. An expanded tax base will be realized over a five‐year period through increased property values of five percent, building additions and improvements valued in aggregate of $500,000, and new construction in excess of $2,000,000. The overlay district is targeted to be adopted, in concert with the comprehensive plan update process, by December 31, 2022.
Page 142

Notes/comments for this statement: Being a highly desirable area with great economic growth potential – and an area targeted for economic growth – development in the north beach neighborhood needs to be encouraged yet guarded so as not to curtail the wellbeing and comfort of subject and adjacent neighborhoods. Proper planning for this area can capitalize on the areas favorable attributes and grow the City's tax base.
Goal Statement #3 Stabilize and improve vital access corridor and area businesses
In order to stabilize and improve a vital access corridor and area businesses, the zoning ordinance will be amended to create a Racine Street overlay district by the PHDC Commission in 2022. In conjunction with this overlay, additional staffing and/or staffing reassignment will most likely be necessary to effectively implement the anticipated goals of this new district. The access corridor district is targeted to be adopted, in concert with the comprehensive plan update process, by December 31, 2022. Notes/comments for this statement: Stabilization and improvement of the vital Racine Street corridor will serve to improve the quality of life of those who reside in the corridor, and improve the front door for the valued employment hubs in the southside Racine and Uptown areas. The minimum goals it to ensure that the corridor’s appearance does not negatively impact employment levels and opportunities. The ultimate goals are to encourage existing businesses, expand their workforces, and attract new businesses. However, much of success related to these goals will be subject to external forces, such as COVID‐19 containment and the economic vitality of the state, nation, and world.
Page 143
This page is intentionally left blank
Page 144
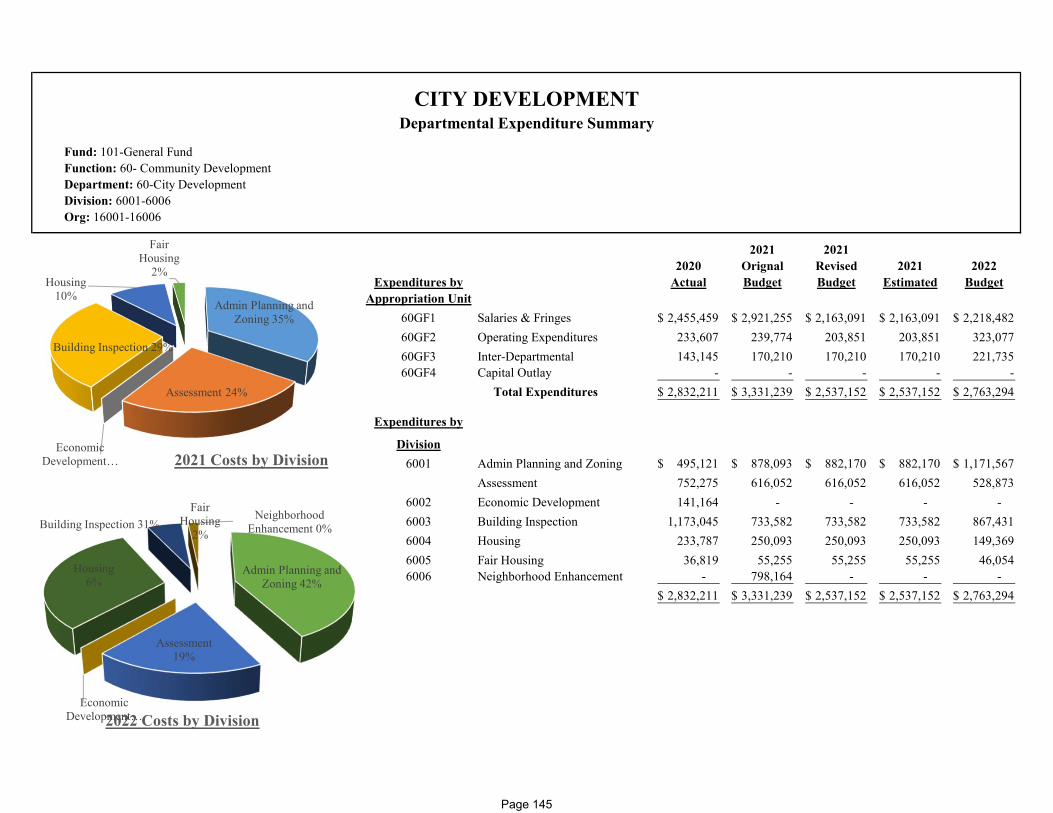
Fund: 101-General FundFunction: 60- Community DevelopmentDepartment: 60-City DevelopmentDivision: 6001-6006Org: 16001-16006
2021 20212020 Orignal Revised 2021 2022
Expenditures by Actual Budget Budget Estimated BudgetAppropriation Unit
60GF1 Salaries & Fringes 2,455,459$ 2,921,255$ 2,163,091$ 2,163,091$ 2,218,482$ 60GF2 Operating Expenditures 233,607 239,774 203,851 203,851 323,077 60GF3 Inter-Departmental 143,145 170,210 170,210 170,210 221,735 60GF4 Capital Outlay - - - - -
Total Expenditures 2,832,211$ 3,331,239$ 2,537,152$ 2,537,152$ 2,763,294$
Expenditures by
Division6001 Admin Planning and Zoning 495,121$ 878,093$ 882,170$ 882,170$ 1,171,567$
Assessment 752,275 616,052 616,052 616,052 528,873 6002 Economic Development 141,164 - - - - 6003 Building Inspection 1,173,045 733,582 733,582 733,582 867,431 6004 Housing 233,787 250,093 250,093 250,093 149,369 6005 Fair Housing 36,819 55,255 55,255 55,255 46,054 6006 Neighborhood Enhancement - 798,164 - - -
2,832,211$ 3,331,239$ 2,537,152$ 2,537,152$ 2,763,294$
CITY DEVELOPMENTDepartmental Expenditure Summary
Admin Planning and Zoning 35%
Assessment 24%
Economic Development…
Building Inspection 29%
Housing10%
Fair Housing
2%
2021 Costs by Division
Admin Planning and Zoning 42%
Assessment19%
Economic Development…
Building Inspection 31%
Housing6%
Fair Housing
2%
Neighborhood Enhancement 0%
2022 Costs by Division
Page 145

2020 2021 2021 2021 2021 2022 PCTORG OBJECT PROJECT ACCOUNT NAME ACTUAL ORIG BUD REVISED BUD ACTUAL PROJECTION PROPOSED CHANGE
11103 50100 Ases‐Salaries 434,443 341,136 341,136 215,297 341,136 289,906 ‐15.00%
11103 50200 Ases‐Part Time Salaries 18,090 27,934 27,934 16,115 27,934 ‐ ‐100.00%
11103 50300 Ases‐Overtime 5,611 ‐ ‐ 1,057 ‐ ‐ 0.00%
11103 51010 Ases‐FICA 34,068 29,024 29,024 17,218 29,024 22,770 ‐21.50%
11103 51100 Ases‐WRS 29,710 23,027 23,027 14,478 23,027 18,845 ‐18.20%
11103 51200 Ases‐Health Care 126,392 84,240 84,240 86,869 84,240 63,180 ‐25.00%
11103 51810 Ases‐Mileage 10,750 10,320 10,320 5,805 10,320 7,740 ‐25.00%
16001 50100 Cd‐Salaries 232,065 536,119 536,119 316,756 536,119 740,524 38.10%
16001 50200 Cd‐Part Time Salaries ‐ 15,538 15,538 ‐ 15,538 ‐ ‐100.00%
16001 51010 Cd‐FICA 17,008 42,628 42,628 23,507 42,628 56,848 33.40%
16001 51100 Cd‐WRS 15,557 36,187 36,187 20,569 36,187 48,132 33.00%
16001 51200 Cd‐Health Care 106,353 131,575 131,575 98,681 131,575 190,633 44.90%
16001 51810 Cd‐Mileage 1,184 6,090 6,090 5,009 6,090 3,080 ‐49.40%
16002 50100 Cd‐Ed Full Time Salaries 83,453 ‐ ‐ 9,357 ‐ ‐ 0.00%
16002 51010 Cd‐Ed FICA 5,954 ‐ ‐ 644 ‐ ‐ 0.00%
16002 51100 Cd‐Ed WRS 5,633 ‐ ‐ 632 ‐ ‐ 0.00%
16002 51200 Cd‐Ed Health Care 31,540 ‐ ‐ ‐ ‐ ‐ 0.00%
CITY DEVELOPMENT DETAIL EXPENDITURES
Page 146

2020 2021 2021 2021 2021 2022 PCTORG OBJECT PROJECT ACCOUNT NAME ACTUAL ORIG BUD REVISED BUD ACTUAL PROJECTION PROPOSED CHANGE16003 50100 Code‐Salaries 729,707 461,032 461,032 398,676 461,032 473,891 2.80%
16003 50200 Code‐Part Time Salaries 19,801 ‐ ‐ 1,735 ‐ ‐ 0.00%
16003 50300 Code‐Overtime 752 ‐ ‐ 276 ‐ ‐ 0.00%
16003 51010 Code‐FICA 56,054 36,303 36,303 29,168 36,303 37,285 2.70%
16003 51100 Code‐WRS 49,316 31,120 31,120 26,943 31,120 30,803 ‐1.00%
16003 51200 Code‐Health Care 210,600 105,300 105,300 78,975 105,300 105,300 0.00%
16003 51810 Code‐Mileage 27,565 13,500 13,500 13,042 13,500 13,500 0.00%
16004 50100 Hs‐Salaries 134,644 139,654 139,654 97,910 139,654 58,567 ‐58.10%
16004 51010 Hs‐FICA 9,395 10,735 10,735 7,056 10,735 4,532 ‐57.80%
16004 51100 Hs‐WRS 8,621 9,428 9,428 6,608 9,428 3,806 ‐59.60%
16004 51200 Hs‐Health Care 24,333 29,878 29,878 22,408 29,878 17,571 ‐41.20%
16004 51810 Hs‐Mileage 1,613 1,320 1,320 1,104 1,320 1,320 0.00%
16005 50100 Fhs‐Salaries 13,891 27,559 27,559 8,227 27,559 20,041 ‐27.30%
16005 51010 Fhs‐FICA 939 2,108 2,108 560 2,108 1,534 ‐27.20%
16005 51100 Fhs‐WRS 938 1,859 1,859 555 1,859 1,303 ‐29.90%
16005 51200 Fhs‐Health Care 9,477 9,477 9,477 7,108 9,477 7,371 ‐22.20%
16006 50100 Salaries ‐ 475,672 ‐ ‐ ‐ ‐ 0.00%
16006 50200 Fhs‐Part Time Salaries ‐ 25,104 ‐ ‐ ‐ ‐ 0.00%
16006 51010 Fhs‐FICA ‐ 39,547 ‐ ‐ ‐ ‐ 0.00%
16006 51100 WRS ‐ 32,108 ‐ ‐ ‐ ‐ 0.00%
Page 147
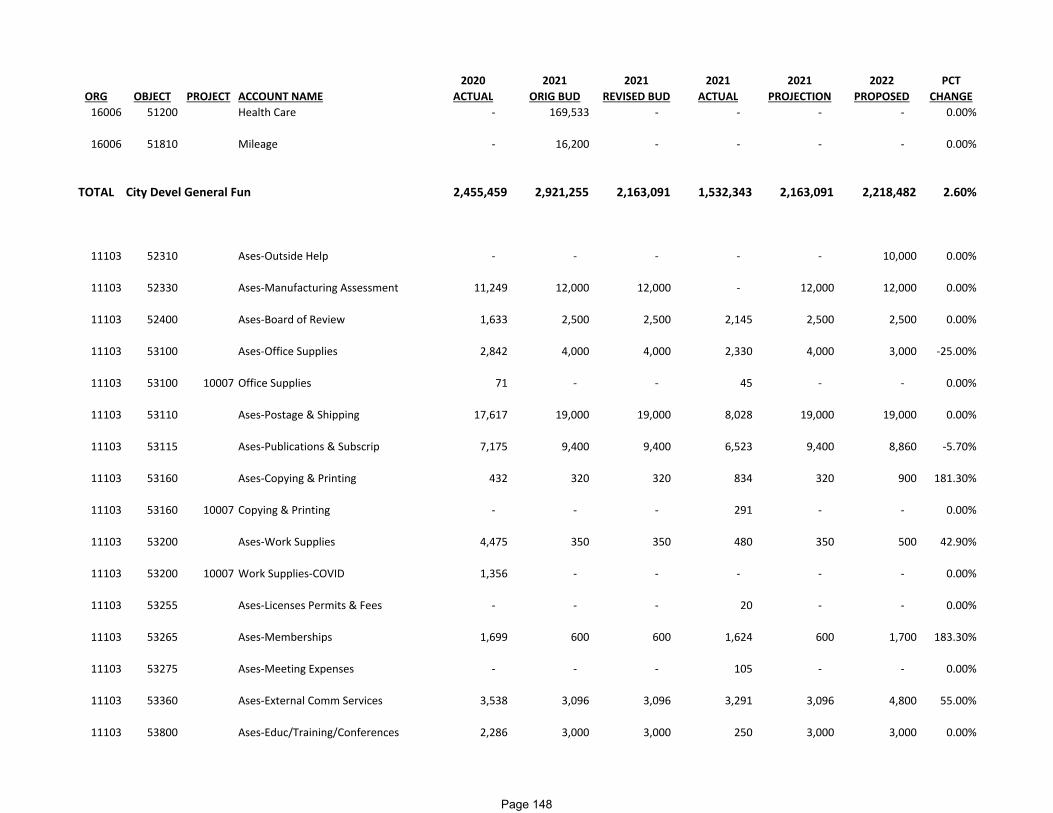
2020 2021 2021 2021 2021 2022 PCTORG OBJECT PROJECT ACCOUNT NAME ACTUAL ORIG BUD REVISED BUD ACTUAL PROJECTION PROPOSED CHANGE16006 51200 Health Care ‐ 169,533 ‐ ‐ ‐ ‐ 0.00%
16006 51810 Mileage ‐ 16,200 ‐ ‐ ‐ ‐ 0.00%
TOTAL City Devel General Fun 2,455,459 2,921,255 2,163,091 1,532,343 2,163,091 2,218,482 2.60%
11103 52310 Ases‐Outside Help ‐ ‐ ‐ ‐ ‐ 10,000 0.00%
11103 52330 Ases‐Manufacturing Assessment 11,249 12,000 12,000 ‐ 12,000 12,000 0.00%
11103 52400 Ases‐Board of Review 1,633 2,500 2,500 2,145 2,500 2,500 0.00%
11103 53100 Ases‐Office Supplies 2,842 4,000 4,000 2,330 4,000 3,000 ‐25.00%
11103 53100 10007 Office Supplies 71 ‐ ‐ 45 ‐ ‐ 0.00%
11103 53110 Ases‐Postage & Shipping 17,617 19,000 19,000 8,028 19,000 19,000 0.00%
11103 53115 Ases‐Publications & Subscrip 7,175 9,400 9,400 6,523 9,400 8,860 ‐5.70%
11103 53160 Ases‐Copying & Printing 432 320 320 834 320 900 181.30%
11103 53160 10007 Copying & Printing ‐ ‐ ‐ 291 ‐ ‐ 0.00%
11103 53200 Ases‐Work Supplies 4,475 350 350 480 350 500 42.90%
11103 53200 10007 Work Supplies‐COVID 1,356 ‐ ‐ ‐ ‐ ‐ 0.00%
11103 53255 Ases‐Licenses Permits & Fees ‐ ‐ ‐ 20 ‐ ‐ 0.00%
11103 53265 Ases‐Memberships 1,699 600 600 1,624 600 1,700 183.30%
11103 53275 Ases‐Meeting Expenses ‐ ‐ ‐ 105 ‐ ‐ 0.00%
11103 53360 Ases‐External Comm Services 3,538 3,096 3,096 3,291 3,096 4,800 55.00%
11103 53800 Ases‐Educ/Training/Conferences 2,286 3,000 3,000 250 3,000 3,000 0.00%
Page 148

2020 2021 2021 2021 2021 2022 PCTORG OBJECT PROJECT ACCOUNT NAME ACTUAL ORIG BUD REVISED BUD ACTUAL PROJECTION PROPOSED CHANGE
11103 54200 Ases‐Equip Repairs & Mainten 120 150 150 ‐ 150 150 0.00%
16001 52100 Cd‐Professional Services 54,976 5,000 9,077 4,207 9,077 18,974 109.00%
16001 52200 Cd‐Contracted Services 6,568 27,500 27,500 53,144 27,500 27,500 0.00%
16001 52210 Cd‐Property/Equipment Rental 1,129 3,000 3,000 847 3,000 3,000 0.00%
16001 52315 Cd‐Advertising 1,273 2,250 2,250 1,710 2,250 2,250 0.00%
16001 52350 Cd‐Special Programs/Events 52 ‐ ‐ ‐ ‐ ‐ 0.00%
16001 53100 Cd‐Office Supplies 584 1,800 1,800 2,246 1,800 1,000 ‐44.40%
16001 53100 10007 Office Supplies‐COVID 704 ‐ ‐ 401 ‐ ‐ 0.00%
16001 53110 Cd‐Postage & Shipping 647 1,200 1,200 3,201 1,200 1,200 0.00%
16001 53115 Cd‐Publications & Subscrip 157 300 300 60 300 300 0.00%
16001 53160 Cd‐Copying & Printing 1,706 1,750 1,750 2,164 1,750 1,750 0.00%
16001 53200 Cd‐Work Supplies 1,086 350 350 1,868 350 350 0.00%
16001 53200 10007 Work Supplies‐COVID 13,675 ‐ ‐ ‐ ‐ ‐ 0.00%
16001 53265 Cd‐Memberships 1,931 2,018 2,018 2,115 2,018 2,018 0.00%
16001 53360 Cd‐External Comm Services 2,443 1,938 1,938 3,138 1,938 1,938 0.00%
16001 53800 Cd‐Educ/Training/Conferences 2,659 4,690 4,690 750 4,690 4,690 0.00%
16001 53810 Cd‐Travel 535 5,800 5,800 ‐ 5,800 5,800 0.00%
16001 54200 Cd‐Equip Repairs & Mainten ‐ 200 200 ‐ 200 200 0.00%
16001 54300 Cd‐Grnds Repairs & Maintenance ‐ 15,000 15,000 19,951 15,000 15,000 0.00%
16002 52200 Cd‐Ed Contracted Services 150 ‐ ‐ ‐ ‐ ‐ 0.00%
Page 149

2020 2021 2021 2021 2021 2022 PCTORG OBJECT PROJECT ACCOUNT NAME ACTUAL ORIG BUD REVISED BUD ACTUAL PROJECTION PROPOSED CHANGE
16002 53265 Cd‐Memberships 558 ‐ ‐ ‐ ‐ ‐ 0.00%
16002 53300 Utilities 998 ‐ ‐ ‐ ‐ ‐ 0.00%
16002 53800 Cd‐Educatn/Training/Conferenc 2,610 ‐ ‐ ‐ ‐ ‐ 0.00%
16002 53810 Cd‐Travel 154 ‐ ‐ ‐ ‐ ‐ 0.00%
16002 54300 Cd‐Ed Grnds Repairs & Maintena 10,114 ‐ ‐ 11,156 ‐ ‐ 0.00%
16003 52100 Code‐Professional Services 1,954 1,000 1,000 4,347 1,000 1,000 0.00%
16003 52210 Code‐Property/Equipment Rental 523 3,000 3,000 1,370 3,000 3,000 0.00%
16003 52315 Code‐Advertising 3,327 600 600 184 600 600 0.00%
16003 52390 Code‐Raze Board Remove Build ‐ ‐ ‐ ‐ ‐ 100,000 0.00%
16003 53100 Code‐Office Supplies 4,075 3,500 3,500 9,296 3,500 3,500 0.00%
16003 53100 10007 Office Supplies‐COVID 883 ‐ ‐ 699 ‐ ‐ 0.00%
16003 53110 Code‐Postage & Shipping 6,922 4,500 4,500 4,698 4,500 4,500 0.00%
16003 53115 Code‐Publications & Subscrip 396 500 500 57 500 500 0.00%
16003 53160 Code‐Copying & Printing 3,511 1,500 1,500 3,909 1,500 1,500 0.00%
16003 53200 Code‐Work Supplies 868 1,000 1,000 158 1,000 1,000 0.00%
16003 53200 10007 Work Supplies‐COVID 159 ‐ ‐ 38 ‐ ‐ 0.00%
16003 53230 Code‐Small Equipment ‐ ‐ ‐ 134 ‐ ‐ 0.00%
16003 53265 Code‐Memberships 380 1,755 1,755 256 1,755 1,755 0.00%
16003 53360 Code‐External Comm Services 9,785 11,500 11,500 8,587 11,500 11,500 0.00%
16003 53800 Code‐Educ/Training/Conferences 2,727 2,020 2,020 2,699 2,020 2,020 0.00%
Page 150
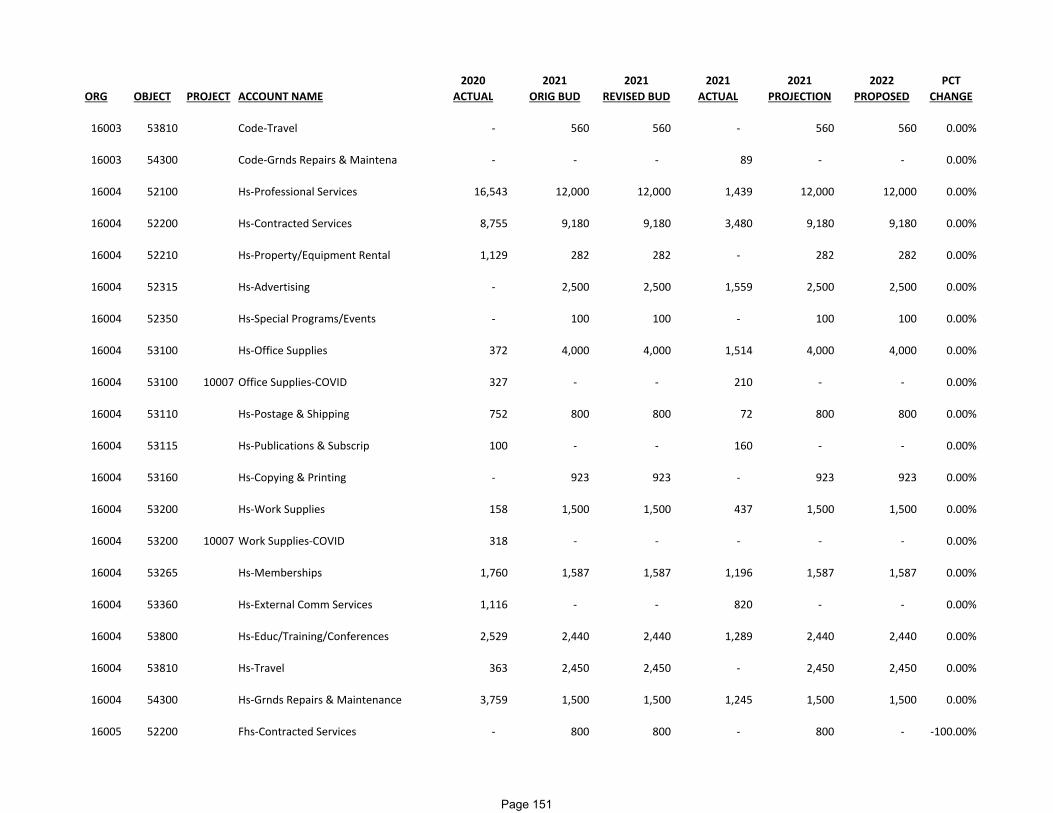
2020 2021 2021 2021 2021 2022 PCTORG OBJECT PROJECT ACCOUNT NAME ACTUAL ORIG BUD REVISED BUD ACTUAL PROJECTION PROPOSED CHANGE
16003 53810 Code‐Travel ‐ 560 560 ‐ 560 560 0.00%
16003 54300 Code‐Grnds Repairs & Maintena ‐ ‐ ‐ 89 ‐ ‐ 0.00%
16004 52100 Hs‐Professional Services 16,543 12,000 12,000 1,439 12,000 12,000 0.00%
16004 52200 Hs‐Contracted Services 8,755 9,180 9,180 3,480 9,180 9,180 0.00%
16004 52210 Hs‐Property/Equipment Rental 1,129 282 282 ‐ 282 282 0.00%
16004 52315 Hs‐Advertising ‐ 2,500 2,500 1,559 2,500 2,500 0.00%
16004 52350 Hs‐Special Programs/Events ‐ 100 100 ‐ 100 100 0.00%
16004 53100 Hs‐Office Supplies 372 4,000 4,000 1,514 4,000 4,000 0.00%
16004 53100 10007 Office Supplies‐COVID 327 ‐ ‐ 210 ‐ ‐ 0.00%
16004 53110 Hs‐Postage & Shipping 752 800 800 72 800 800 0.00%
16004 53115 Hs‐Publications & Subscrip 100 ‐ ‐ 160 ‐ ‐ 0.00%
16004 53160 Hs‐Copying & Printing ‐ 923 923 ‐ 923 923 0.00%
16004 53200 Hs‐Work Supplies 158 1,500 1,500 437 1,500 1,500 0.00%
16004 53200 10007 Work Supplies‐COVID 318 ‐ ‐ ‐ ‐ ‐ 0.00%
16004 53265 Hs‐Memberships 1,760 1,587 1,587 1,196 1,587 1,587 0.00%
16004 53360 Hs‐External Comm Services 1,116 ‐ ‐ 820 ‐ ‐ 0.00%
16004 53800 Hs‐Educ/Training/Conferences 2,529 2,440 2,440 1,289 2,440 2,440 0.00%
16004 53810 Hs‐Travel 363 2,450 2,450 ‐ 2,450 2,450 0.00%
16004 54300 Hs‐Grnds Repairs & Maintenance 3,759 1,500 1,500 1,245 1,500 1,500 0.00%
16005 52200 Fhs‐Contracted Services ‐ 800 800 ‐ 800 ‐ ‐100.00%
Page 151

2020 2021 2021 2021 2021 2022 PCTORG OBJECT PROJECT ACCOUNT NAME ACTUAL ORIG BUD REVISED BUD ACTUAL PROJECTION PROPOSED CHANGE
16005 52315 Fhs‐Advertising ‐ 400 400 ‐ 400 ‐ ‐100.00%
16005 53100 Fhs‐Office Supplies ‐ 200 200 ‐ 200 ‐ ‐100.00%
16005 53110 Fhs‐Postage & Shipping 12 50 50 8 50 ‐ ‐100.00%
16005 53115 Fhs‐Publications & Subscrip ‐ 100 100 ‐ 100 ‐ ‐100.00%
16005 53200 60013 Work Supplies 900 ‐ ‐ ‐ ‐ ‐ 0.00%
16005 53265 Fhs‐Memberships ‐ 25 25 ‐ 25 ‐ ‐100.00%
16005 53800 Fhs‐Educ/Training/Conferences ‐ 65 65 ‐ 65 ‐ ‐100.00%
16005 53810 Fhs‐Travel ‐ 225 225 ‐ 225 ‐ ‐100.00%
16006 52200 Contracted Services ‐ 25,000 ‐ ‐ ‐ ‐ 0.00%
16006 53100 Office Supplies ‐ 3,000 ‐ ‐ ‐ ‐ 0.00%
16006 53200 Work Supplies ‐ 5,000 ‐ ‐ ‐ ‐ 0.00%
16006 53360 External Comm Services ‐ 5,000 ‐ ‐ ‐ ‐ 0.00%
16006 53800 Educ/Training/Conferences ‐ 2,000 ‐ ‐ ‐ ‐ 0.00%
TOTAL City Devel Gen Fund Op 233,607 239,774 203,851 182,872 203,851 323,077 58.50%
11103 55100 Ases‐I/S Building Occupancy 18,588 19,310 19,310 14,483 19,310 20,284 5.00%
11103 55200 Ases‐I/S City Telephone System 1,300 1,300 1,300 650 1,300 1,300 0.00%
11103 55400 Ases‐I/S Information Systems 18,830 25,345 25,345 19,009 25,345 38,438 51.70%
16001 55100 Cd‐I/S Building Occupancy 16,543 17,186 17,186 12,890 17,186 18,052 5.00%
Page 152

2020 2021 2021 2021 2021 2022 PCTORG OBJECT PROJECT ACCOUNT NAME ACTUAL ORIG BUD REVISED BUD ACTUAL PROJECTION PROPOSED CHANGE16001 55200 Cd‐I/S City Telephone System 1,464 1,464 1,464 732 1,464 1,464 0.00%
16001 55400 Cd‐I/S Information Systems 14,819 18,510 18,510 13,883 18,510 26,864 45.10%
16003 55100 Code‐I/S Building Occupancy 18,712 19,439 19,439 14,579 19,439 20,418 5.00%
16003 55200 Code‐I/S City Telephone System 2,013 2,013 2,013 1,007 2,013 2,013 0.00%
16003 55400 Code‐I/S Information Systems 23,014 33,440 33,440 25,080 33,440 52,786 57.90%
16004 55100 Hs‐I/S Building Occupancy 11,973 12,260 12,260 9,195 12,260 12,536 2.30%
16004 55200 Hs‐I/S City Telephone System 549 549 549 275 549 549 0.00%
16004 55400 Hs‐I/S Information Systems 4,677 7,007 7,007 5,255 7,007 11,226 60.20%
16005 55100 Fhs‐I/S Building Occupancy 5,293 5,420 5,420 4,065 5,420 5,542 2.30%
16005 55200 Fhs‐I/S City Telephone System 366 366 366 183 366 366 0.00%
16005 55400 Fhs‐I/S Information Systems 5,004 6,601 6,601 4,951 6,601 9,897 49.90%
TOTAL City Devel General Fun 143,145 170,210 170,210 126,235 170,210 221,735 30.30%
GRAND TOTAL 2,832,211$ 3,331,239$ 2,537,152$ 1,841,450$ 2,537,152$ 2,763,294$ 8.90%
Page 153

This page is intentionally left blank
Page 154

RACINE PUBLIC LIBRARY
Fund: 220-Library Department: 55-Library Function: 50-Education and Recreation Orgs: 22055
MISSION STATEMENT The mission of the Racine Public Library is to lift up the lives of the people of the Racine community by embracing community diversity, promoting inclusions, creating opportunity, and by supporting the development of community literacy through a love of literature, learning and civic engagement. FUNCTION
The Racine Public Library (RPL) was established by the residents in 1897 to fulfill one of the cornerstones of democracy: an educated citizenry. It provides opportunities for every person to pursue a lifelong education. RPL is a learning institution, innovative and future-focused, supporting the love of reading and learning, and promoting curiosity and inquisitiveness for all ages. RPL is committed to equity, inclusion, and diversity.
RPL collects and preserves materials for free, equal access by all residents in a safe, neutral space where everyone is welcome and that reflects the community’s expectation for services. RPL has a highly trained staff who continually evaluate the community’s needs, collaborate with other organizations to serve the community outside the building’s walls, and to the best of their abilities provide residents with a positive experience. RPL staff members have open, clear, timely communication; are honest and accountable; act with integrity and professionalism; follow the American Library Association Code of Ethics; protect patron privacy, and promote intellectual freedom. SIGNIFICANT INITIATIVES RECENTLY ACCOMPLISHED
1. Hiring of a new Executive Director in December of 2020. 2. RPL developed, implemented and maintained a pandemic response to continue core services to the public while the physical building was closed. The
library doors were opened with the City of Racine Public Health Department’s guidance and with limited capacity on April 19th, 2021. 3. RPL began to implement their five-year strategic plan, specifically focusing on post-pandemic spaces/spatial changes, a new team responsibility map
and cross-training, and creating a new invitation and experience to the library. 4. RPL to roll out a new website and community engagement platform by end of September 2021. 5. RPL implemented a new organizational chart to allow the hiring of a Deputy Director, Head of Business Development, and a full-time Library Social
Worker, and significant cross-training across departments. These changes also placed heavy focus on eliminating barriers, changing hiring practices and updated job descriptions.
Page 155

RACINE PUBLIC LIBRARY
Fund: 220-Library Department: 55-Library Function: 50-Education and Recreation Orgs: 22055
6. Construction of RPL’s new multisensory space, quiet room, and nursing station to be completed by end of September 2021. 7. Received funding from the Racine Public Library Foundation for the purchase of laptops, Chromebooks, Wi-Fi hotspots to assist in our pandemic
response, as well as further technology geared towards STEAM, 3D printing, hands-on learning, etc. initiatives.
2022 STRATEGIC INITIATIVES
1. RPL to continue to implement the 20 Great Leaps, a five-year strategic plan 20 great leaps 2020.docx 2. RPL to complete by October 2022 the 2nd floor renovation which will include a new staircase from the main lobby to the 2nd floor, an Innovation Lab,
an audio/podcasting studio, a new Teen area, expanded Local History Room, Business Center, three additional study rooms, access to the building from Lake Avenue, a large meeting room, new shelving and furniture, new carpet, and new wayfinding. Funding for the renovation provided by the RPL Foundation and private trust funds.
3. RPL to welcome a 2nd mobile library to the fleet in early summer of 2022. This vehicle will be a hybrid mobile library functioning both as a book and techmobile. RPL to develop a plan for both mobile libraries to be fully on the road and conducting outreach, servicing the underserved portions of our community and service populations, and working with community centers, educational institutions, and other organizations to be onsite.
4. Completion of a communications and marketing plan, through rebuilding the RPL brand and adopting a design-based engagement process. 5. 2022 is the 125th anniversary of the Racine Public Library. RPL will celebrate the entire yearlong through fundraising efforts, receptions, programs
celebrating the past and supporting the needs and excitement of the future, displays, and recognizing all of the changes coming to the library. Perhaps if we’re not in a pandemic, we can share some pieces of cake too! 125th anniversary committee to be formed and planning to begin September 2021.
Page 156

2022 Goal‐Setting Statement Department Name: Library Department Head/Staff Name(s): Angela Zimmermann
Goal Statement #1 Create an irresistible destination for the Racine community, focusing on post‐pandemic library spaces
In order to create an irresistible destination for the Racine community and to focus on post‐pandemic library spaces, RPL is to complete by October 2022 a 2nd floor renovation which will include a new staircase from the main lobby to the 2nd floor, an Innovation Lab, an audio/podcasting studio, a new Teen area, expanded Local History Room, Business Center, three additional study rooms, access to the building from Lake Avenue, a large meeting room, new shelving and furniture, new carpet, and new wayfinding. Funding for the renovation provided by the RPL Foundation and private trust funds. This idea of a post‐pandemic library space also includes the addition of a 2nd mobile library (a hybrid book and tech‐mobile) to our fleet by early summer of 2022. Notes/comments for this statement: The increase in library visits will be based on a historical average, as there will be no data from 2020/2021 to use as a baseline. This was a goal of 2021 and the talks with the architects began fairly quickly after the new Executive Director started alongside the new vision for the library. Approval was received from the Library Board at the June 2021 Board meeting to move forward with the project. The design process is expected to last six months and construction to begin in February/March of 2022.
Goal Statement #2
In order to continue to create a new invitation to the library and the experience RPL offers, completion of a communications and marketing plan through rebuilding the RPL brand and adopting a design‐based engagement process by March of 2022.
Page 157

Notes/comments for this statement: This initiative may be completed sooner as this will be one of the initial goals for the Head of Business Development position who begins at RPL in September of 2021. RPL plans to conduct an audit of our current marketing and communications, administer surveys to better understand our target audiences, establish marketing objectives, define our communication and branding goal metrics, and finally execute the new communications/marketing plan.
Goal Statement #3 Provide quality and responsive services by refining the library resilience plan
In order to continue to provide quality and responsive services, the library will refine the library resilience plan which specifies services and engagement strategies that can be placed into action in the event of large scale interruption in services. Whether through post‐pandemic library spaces, expanded community outreach efforts, continuing to redefine and rethink library programming and experiences, serving as the community storyteller, and leading the development of community literacy in all forms.
Page 158
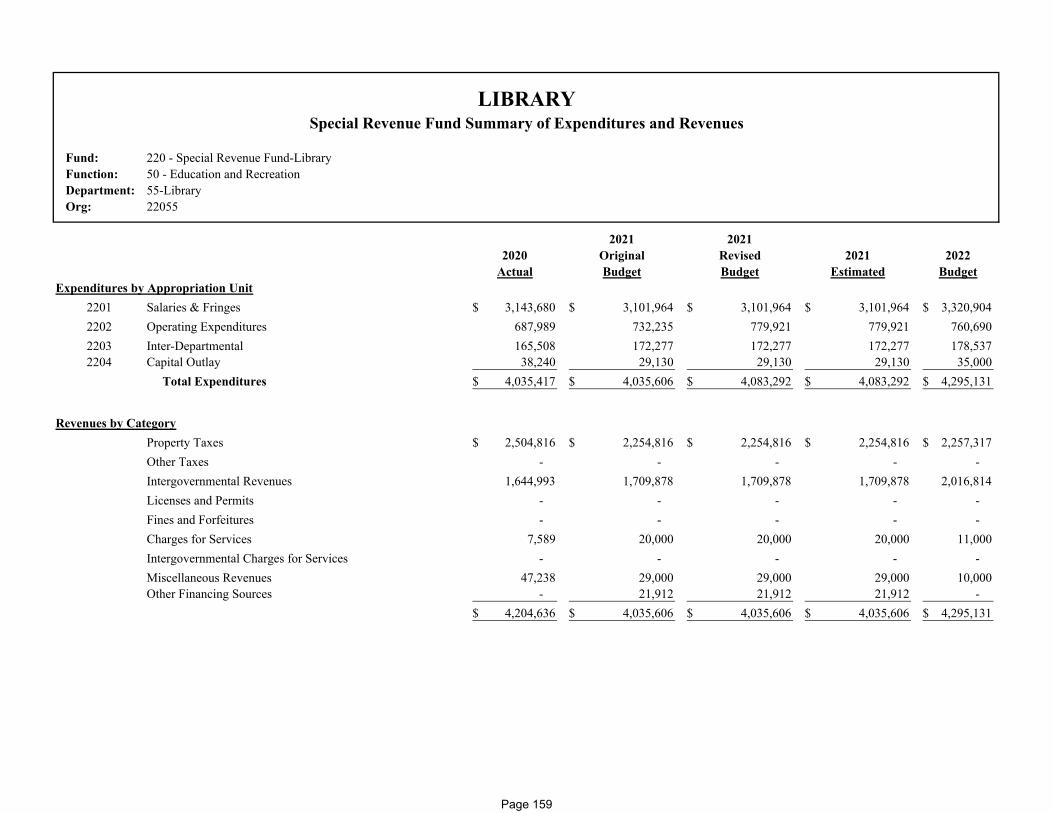
Fund: 220 - Special Revenue Fund-LibraryFunction: 50 - Education and RecreationDepartment: 55-LibraryOrg: 22055
2021 20212020 Original Revised 2021 2022
Actual Budget Budget Estimated BudgetExpenditures by Appropriation Unit
2201 Salaries & Fringes 3,143,680$ 3,101,964$ 3,101,964$ 3,101,964$ 3,320,904$ 2202 Operating Expenditures 687,989 732,235 779,921 779,921 760,690 2203 Inter-Departmental 165,508 172,277 172,277 172,277 178,537 2204 Capital Outlay 38,240 29,130 29,130 29,130 35,000
Total Expenditures 4,035,417$ 4,035,606$ 4,083,292$ 4,083,292$ 4,295,131$
Revenues by CategoryProperty Taxes 2,504,816$ 2,254,816$ 2,254,816$ 2,254,816$ 2,257,317$ Other Taxes - - - - - Intergovernmental Revenues 1,644,993 1,709,878 1,709,878 1,709,878 2,016,814 Licenses and Permits - - - - - Fines and Forfeitures - - - - - Charges for Services 7,589 20,000 20,000 20,000 11,000 Intergovernmental Charges for Services - - - - - Miscellaneous Revenues 47,238 29,000 29,000 29,000 10,000 Other Financing Sources - 21,912 21,912 21,912 -
4,204,636$ 4,035,606$ 4,035,606$ 4,035,606$ 4,295,131$
LIBRARYSpecial Revenue Fund Summary of Expenditures and Revenues
Page 159
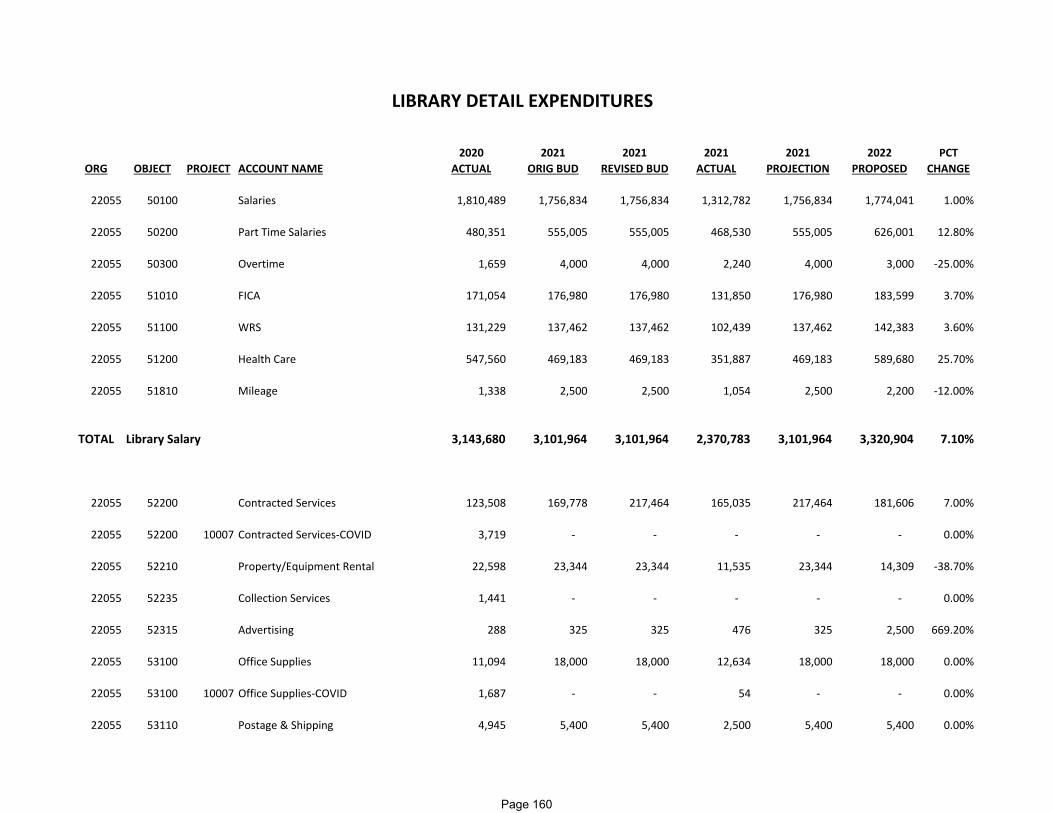
2020 2021 2021 2021 2021 2022 PCTORG OBJECT PROJECT ACCOUNT NAME ACTUAL ORIG BUD REVISED BUD ACTUAL PROJECTION PROPOSED CHANGE
22055 50100 Salaries 1,810,489 1,756,834 1,756,834 1,312,782 1,756,834 1,774,041 1.00%
22055 50200 Part Time Salaries 480,351 555,005 555,005 468,530 555,005 626,001 12.80%
22055 50300 Overtime 1,659 4,000 4,000 2,240 4,000 3,000 ‐25.00%
22055 51010 FICA 171,054 176,980 176,980 131,850 176,980 183,599 3.70%
22055 51100 WRS 131,229 137,462 137,462 102,439 137,462 142,383 3.60%
22055 51200 Health Care 547,560 469,183 469,183 351,887 469,183 589,680 25.70%
22055 51810 Mileage 1,338 2,500 2,500 1,054 2,500 2,200 ‐12.00%
TOTAL Library Salary 3,143,680 3,101,964 3,101,964 2,370,783 3,101,964 3,320,904 7.10%
22055 52200 Contracted Services 123,508 169,778 217,464 165,035 217,464 181,606 7.00%
22055 52200 10007 Contracted Services‐COVID 3,719 ‐ ‐ ‐ ‐ ‐ 0.00%
22055 52210 Property/Equipment Rental 22,598 23,344 23,344 11,535 23,344 14,309 ‐38.70%
22055 52235 Collection Services 1,441 ‐ ‐ ‐ ‐ ‐ 0.00%
22055 52315 Advertising 288 325 325 476 325 2,500 669.20%
22055 53100 Office Supplies 11,094 18,000 18,000 12,634 18,000 18,000 0.00%
22055 53100 10007 Office Supplies‐COVID 1,687 ‐ ‐ 54 ‐ ‐ 0.00%
22055 53110 Postage & Shipping 4,945 5,400 5,400 2,500 5,400 5,400 0.00%
LIBRARY DETAIL EXPENDITURES
Page 160
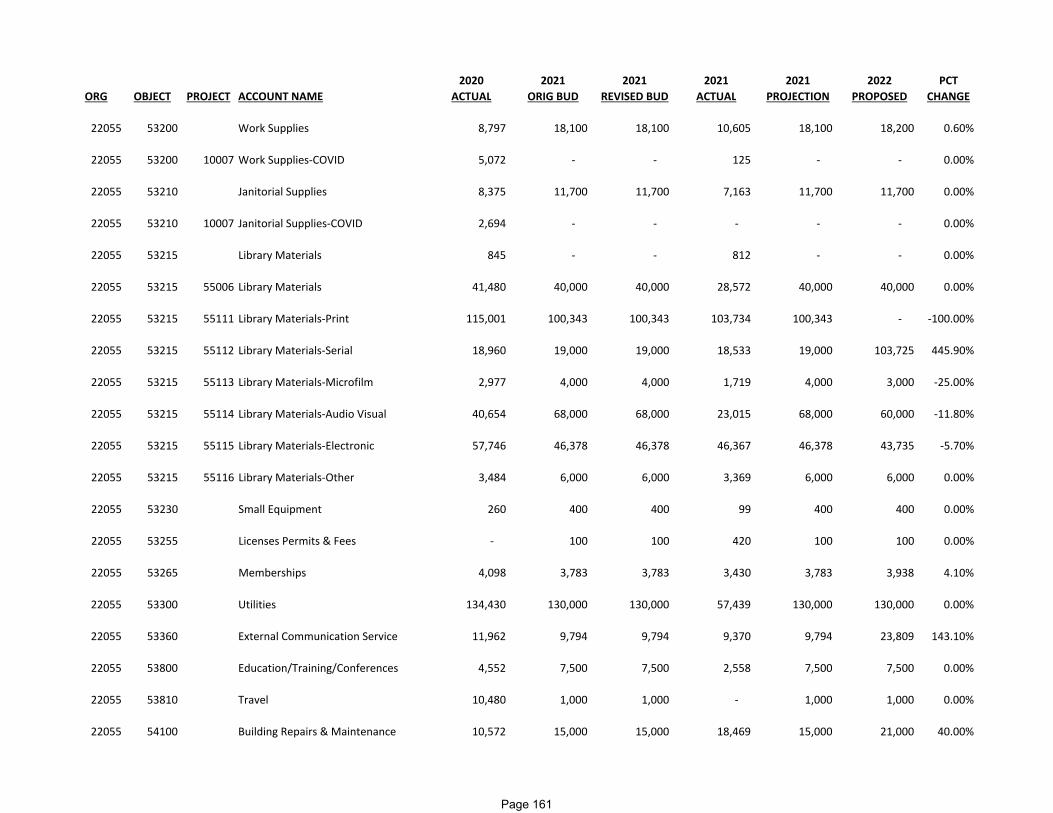
2020 2021 2021 2021 2021 2022 PCTORG OBJECT PROJECT ACCOUNT NAME ACTUAL ORIG BUD REVISED BUD ACTUAL PROJECTION PROPOSED CHANGE
22055 53200 Work Supplies 8,797 18,100 18,100 10,605 18,100 18,200 0.60%
22055 53200 10007 Work Supplies‐COVID 5,072 ‐ ‐ 125 ‐ ‐ 0.00%
22055 53210 Janitorial Supplies 8,375 11,700 11,700 7,163 11,700 11,700 0.00%
22055 53210 10007 Janitorial Supplies‐COVID 2,694 ‐ ‐ ‐ ‐ ‐ 0.00%
22055 53215 Library Materials 845 ‐ ‐ 812 ‐ ‐ 0.00%
22055 53215 55006 Library Materials 41,480 40,000 40,000 28,572 40,000 40,000 0.00%
22055 53215 55111 Library Materials‐Print 115,001 100,343 100,343 103,734 100,343 ‐ ‐100.00%
22055 53215 55112 Library Materials‐Serial 18,960 19,000 19,000 18,533 19,000 103,725 445.90%
22055 53215 55113 Library Materials‐Microfilm 2,977 4,000 4,000 1,719 4,000 3,000 ‐25.00%
22055 53215 55114 Library Materials‐Audio Visual 40,654 68,000 68,000 23,015 68,000 60,000 ‐11.80%
22055 53215 55115 Library Materials‐Electronic 57,746 46,378 46,378 46,367 46,378 43,735 ‐5.70%
22055 53215 55116 Library Materials‐Other 3,484 6,000 6,000 3,369 6,000 6,000 0.00%
22055 53230 Small Equipment 260 400 400 99 400 400 0.00%
22055 53255 Licenses Permits & Fees ‐ 100 100 420 100 100 0.00%
22055 53265 Memberships 4,098 3,783 3,783 3,430 3,783 3,938 4.10%
22055 53300 Utilities 134,430 130,000 130,000 57,439 130,000 130,000 0.00%
22055 53360 External Communication Service 11,962 9,794 9,794 9,370 9,794 23,809 143.10%
22055 53800 Education/Training/Conferences 4,552 7,500 7,500 2,558 7,500 7,500 0.00%
22055 53810 Travel 10,480 1,000 1,000 ‐ 1,000 1,000 0.00%
22055 54100 Building Repairs & Maintenance 10,572 15,000 15,000 18,469 15,000 21,000 40.00%
Page 161

2020 2021 2021 2021 2021 2022 PCTORG OBJECT PROJECT ACCOUNT NAME ACTUAL ORIG BUD REVISED BUD ACTUAL PROJECTION PROPOSED CHANGE
22055 54100 10007 Building Rep& Main‐COVID 19 1,590 ‐ ‐ ‐ ‐ ‐ 0.00%
22055 54200 Equipment Repairs & Maintenanc 15,331 15,000 15,000 14,183 15,000 16,000 6.70%
22055 54300 Grounds Repairs & Maintenance 9,650 12,000 12,000 9,627 12,000 13,000 8.30%
22055 54500 Software Maintenance 8,122 7,290 7,290 32,337 7,290 35,768 390.60%
22055 57800 10007 Computer Software‐covid 1,578 ‐ ‐ ‐ ‐ ‐ 0.00%
TOTAL Library Operating 687,989 732,235 779,921 584,181 779,921 760,690 3.90%
22055 55100 I/S Building Occupancy 142,384 145,801 145,801 109,351 145,801 149,076 2.20%
22055 55200 I/S City Telephone System 7,100 7,035 7,035 3,518 7,035 7,035 0.00%
22055 55300 I/S Garage Fuel 1,494 3,800 3,800 2,726 3,800 3,800 0.00%
22055 55310 I/S Garage Labor 3,538 5,000 5,000 1,794 5,000 4,000 ‐20.00%
22055 55320 I/S Garage Materials 2,507 1,000 1,000 438 1,000 1,500 50.00%
22055 55400 I/S Information Systems 8,485 9,641 9,641 7,231 9,641 13,126 36.10%
TOTAL Library Internal Service 165,508 172,277 172,277 125,057 172,277 178,537 3.60%
22055 57300 10007 Equipment 14,256 ‐ ‐ ‐ ‐ ‐ 0.00%
22055 57300 Equipment 7,138 15,000 15,000 26,371 15,000 22,000 46.70%
22055 57355 Computer Hardware 8,207 14,130 14,130 12,478 14,130 13,000 ‐8.00%
22055 57355 10007 Computer Hardware 5,388 ‐ ‐ ‐ ‐ ‐ 0.00%
Page 162

2020 2021 2021 2021 2021 2022 PCTORG OBJECT PROJECT ACCOUNT NAME ACTUAL ORIG BUD REVISED BUD ACTUAL PROJECTION PROPOSED CHANGE
22055 57800 Computer Software 3,251 ‐ ‐ ‐ ‐ ‐ 0.00%
TOTAL Library Capital Outlay 38,240 29,130 29,130 38,849 29,130 35,000 20.20%
GRAND TOTAL 4,035,417$ 4,035,606$ 4,083,292$ 3,118,870$ 4,083,292$ 4,295,131$ 6.40%
Page 163
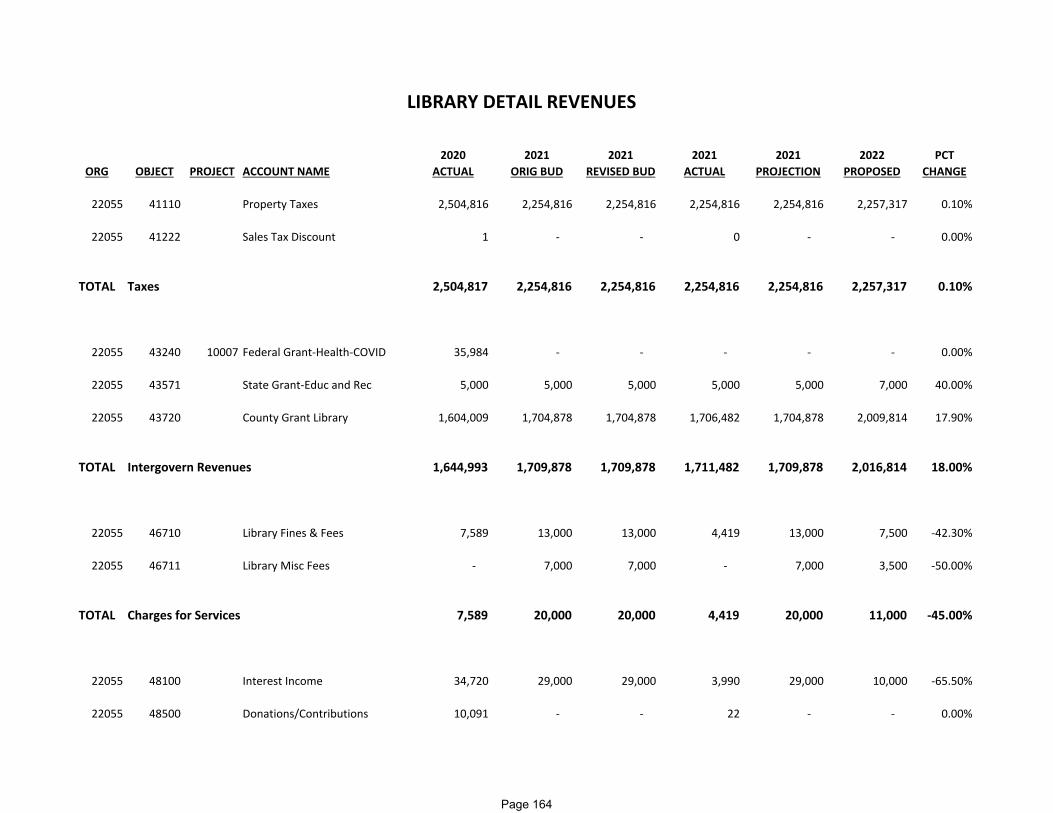
2020 2021 2021 2021 2021 2022 PCTORG OBJECT PROJECT ACCOUNT NAME ACTUAL ORIG BUD REVISED BUD ACTUAL PROJECTION PROPOSED CHANGE
22055 41110 Property Taxes 2,504,816 2,254,816 2,254,816 2,254,816 2,254,816 2,257,317 0.10%
22055 41222 Sales Tax Discount 1 ‐ ‐ 0 ‐ ‐ 0.00%
TOTAL Taxes 2,504,817 2,254,816 2,254,816 2,254,816 2,254,816 2,257,317 0.10%
22055 43240 10007 Federal Grant‐Health‐COVID 35,984 ‐ ‐ ‐ ‐ ‐ 0.00%
22055 43571 State Grant‐Educ and Rec 5,000 5,000 5,000 5,000 5,000 7,000 40.00%
22055 43720 County Grant Library 1,604,009 1,704,878 1,704,878 1,706,482 1,704,878 2,009,814 17.90%
TOTAL Intergovern Revenues 1,644,993 1,709,878 1,709,878 1,711,482 1,709,878 2,016,814 18.00%
22055 46710 Library Fines & Fees 7,589 13,000 13,000 4,419 13,000 7,500 ‐42.30%
22055 46711 Library Misc Fees ‐ 7,000 7,000 ‐ 7,000 3,500 ‐50.00%
TOTAL Charges for Services 7,589 20,000 20,000 4,419 20,000 11,000 ‐45.00%
22055 48100 Interest Income 34,720 29,000 29,000 3,990 29,000 10,000 ‐65.50%
22055 48500 Donations/Contributions 10,091 ‐ ‐ 22 ‐ ‐ 0.00%
LIBRARY DETAIL REVENUES
Page 164

2020 2021 2021 2021 2021 2022 PCTORG OBJECT PROJECT ACCOUNT NAME ACTUAL ORIG BUD REVISED BUD ACTUAL PROJECTION PROPOSED CHANGE22055 48900 Miscellaneous Revenue 2,427 ‐ ‐ 7,123 ‐ ‐ 0.00%
TOTAL Miscellaneous Revenue 47,238 29,000 29,000 11,135 29,000 10,000 ‐65.50%
22055 49300 Fund Balance Applied ‐ 21,912 21,912 ‐ 21,912 ‐ ‐100.00%
TOTAL Other Finance Sources ‐ 21,912 21,912 ‐ 21,912 ‐ ‐100.00%
GRAND TOTAL 4,204,636$ 4,035,606$ 4,035,606$ 3,981,852$ 4,035,606$ 4,295,131$ 6.40%
Page 165

This page is intentionally left blank
Page 166
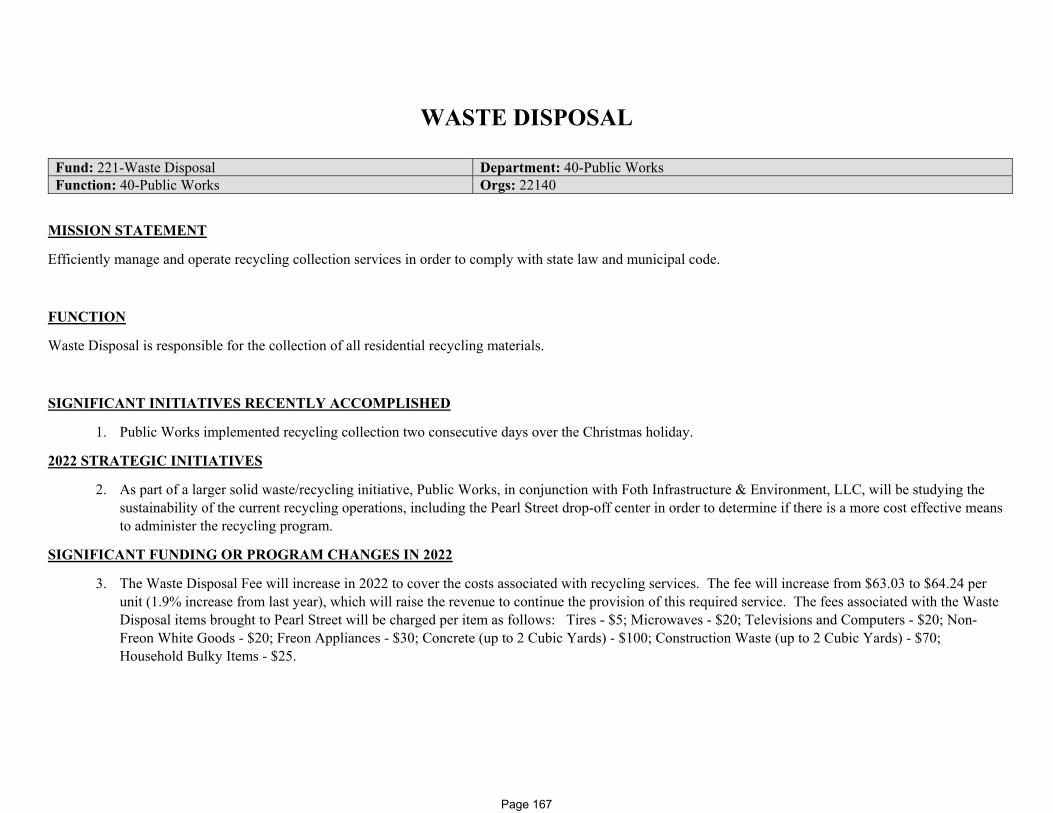
WASTE DISPOSAL
Fund: 221-Waste Disposal Department: 40-Public Works Function: 40-Public Works Orgs: 22140
MISSION STATEMENT
Efficiently manage and operate recycling collection services in order to comply with state law and municipal code.
FUNCTION
Waste Disposal is responsible for the collection of all residential recycling materials.
SIGNIFICANT INITIATIVES RECENTLY ACCOMPLISHED
1. Public Works implemented recycling collection two consecutive days over the Christmas holiday.
2022 STRATEGIC INITIATIVES
2. As part of a larger solid waste/recycling initiative, Public Works, in conjunction with Foth Infrastructure & Environment, LLC, will be studying the sustainability of the current recycling operations, including the Pearl Street drop-off center in order to determine if there is a more cost effective means to administer the recycling program.
SIGNIFICANT FUNDING OR PROGRAM CHANGES IN 2022
3. The Waste Disposal Fee will increase in 2022 to cover the costs associated with recycling services. The fee will increase from $63.03 to $64.24 per unit (1.9% increase from last year), which will raise the revenue to continue the provision of this required service. The fees associated with the Waste Disposal items brought to Pearl Street will be charged per item as follows: Tires - $5; Microwaves - $20; Televisions and Computers - $20; Non-Freon White Goods - $20; Freon Appliances - $30; Concrete (up to 2 Cubic Yards) - $100; Construction Waste (up to 2 Cubic Yards) - $70; Household Bulky Items - $25.
Page 167

This page is intentionally left blank
Page 168

Fund: 221 - Special Revenue Fund-Waste Removal ServicesFunction: 40 - Public WorksDepartment: 40-Public WorksOrg: 22140
2021 20212020 Original Revised 2021 2022
Actual Budget Budget Estimated BudgetExpenditures by Appropriation Unit
2211 Salaries & Fringes 729,398$ 843,176$ 843,176$ 843,176$ 901,183$ 2212 Operating Expenditures 894,024 936,458 957,114 958,514 920,400 2213 Inter-Departmental 358,716 390,158 390,158 390,158 431,559 2214 Capital Outlay - - - - -
Total Expenditures 1,982,138$ 2,169,792$ 2,190,448$ 2,191,848$ 2,253,142$
Revenues by CategoryProperty Taxes -$ -$ -$ -$ -$ Other Taxes - - - - - Intergovernmental Revenues 314,445 314,722 314,722 314,722 315,446 Licenses and Permits - - - - - Fines and Forfeitures - - - - - Charges for Services 1,710,831 1,850,070 1,850,070 1,850,070 1,887,696 Intergovernmental Charges for Services - - - - - Miscellaneous Revenues 19,499 5,000 5,000 5,000 50,000 Other Financing Sources - - - - -
2,044,775$ 2,169,792$ 2,169,792$ 2,169,792$ 2,253,142$
WASTE REMOVAL SERVICESSpecial Revenue Fund Summary of Expenditures and Revenues
Page 169
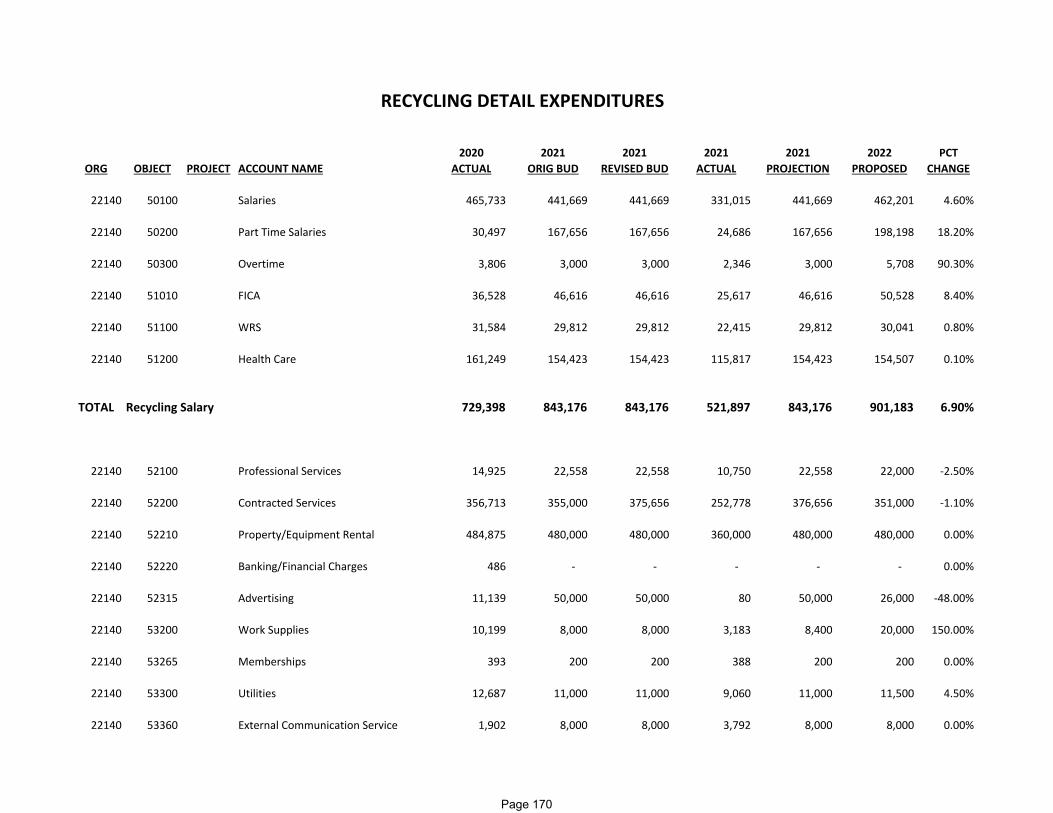
2020 2021 2021 2021 2021 2022 PCTORG OBJECT PROJECT ACCOUNT NAME ACTUAL ORIG BUD REVISED BUD ACTUAL PROJECTION PROPOSED CHANGE
22140 50100 Salaries 465,733 441,669 441,669 331,015 441,669 462,201 4.60%
22140 50200 Part Time Salaries 30,497 167,656 167,656 24,686 167,656 198,198 18.20%
22140 50300 Overtime 3,806 3,000 3,000 2,346 3,000 5,708 90.30%
22140 51010 FICA 36,528 46,616 46,616 25,617 46,616 50,528 8.40%
22140 51100 WRS 31,584 29,812 29,812 22,415 29,812 30,041 0.80%
22140 51200 Health Care 161,249 154,423 154,423 115,817 154,423 154,507 0.10%
TOTAL Recycling Salary 729,398 843,176 843,176 521,897 843,176 901,183 6.90%
22140 52100 Professional Services 14,925 22,558 22,558 10,750 22,558 22,000 ‐2.50%
22140 52200 Contracted Services 356,713 355,000 375,656 252,778 376,656 351,000 ‐1.10%
22140 52210 Property/Equipment Rental 484,875 480,000 480,000 360,000 480,000 480,000 0.00%
22140 52220 Banking/Financial Charges 486 ‐ ‐ ‐ ‐ ‐ 0.00%
22140 52315 Advertising 11,139 50,000 50,000 80 50,000 26,000 ‐48.00%
22140 53200 Work Supplies 10,199 8,000 8,000 3,183 8,400 20,000 150.00%
22140 53265 Memberships 393 200 200 388 200 200 0.00%
22140 53300 Utilities 12,687 11,000 11,000 9,060 11,000 11,500 4.50%
22140 53360 External Communication Service 1,902 8,000 8,000 3,792 8,000 8,000 0.00%
RECYCLING DETAIL EXPENDITURES
Page 170

2020 2021 2021 2021 2021 2022 PCTORG OBJECT PROJECT ACCOUNT NAME ACTUAL ORIG BUD REVISED BUD ACTUAL PROJECTION PROPOSED CHANGE
22140 53800 Education/Training/Conferences 704 1,200 1,200 245 1,200 1,200 0.00%
22140 54200 Equipment Repairs & Maintenanc ‐ 500 500 ‐ 500 500 0.00%
TOTAL Recycling Operating 894,024 936,458 957,114 640,276 958,514 920,400 ‐1.70%
22140 55100 I/S Building Occupancy 7,848 8,158 8,158 6,118 8,158 8,559 4.90%
22140 55300 I/S Garage Fuel 66,426 82,000 82,000 53,447 82,000 108,000 31.70%
22140 55310 I/S Garage Labor 188,686 210,000 210,000 134,376 210,000 210,000 0.00%
22140 55320 I/S Garage Materials 95,755 90,000 90,000 68,489 90,000 105,000 16.70%
TOTAL Recycling Internal Service 358,716 390,158 390,158 262,431 390,158 431,559 10.60%
GRAND TOTAL 1,982,138$ 2,169,792$ 2,190,448$ 1,424,604$ 2,191,848$ 2,253,142$ 3.80%
Page 171

2020 2021 2021 2021 2021 2022 PCTORG OBJECT PROJECT ACCOUNT NAME ACTUAL ORIG BUD REVISED BUD ACTUAL PROJECTION PROPOSED CHANGE
22140 43545 State Grant‐Recycling 314,445 314,722 314,722 315,698 314,722 315,446 0.20%
TOTAL Intergovern Revenues 314,445 314,722 314,722 315,698 314,722 315,446 0.20%
22140 46435 Recycling Fees 1,710,831 1,850,070 1,850,070 1,913,252 1,850,070 1,887,696 2.00%
TOTAL Charges for Services 1,710,831 1,850,070 1,850,070 1,913,252 1,850,070 1,887,696 2.00%
22140 48100 Interest Income 11,293 ‐ ‐ 1,890 ‐ ‐ 0.00%
22140 48307 Sale of Property‐Recycle Mat 8,207 5,000 5,000 45,879 5,000 50,000 900.00%
TOTAL Miscellaneous Revenue 19,499 5,000 5,000 47,769 5,000 50,000 900.00%
GRAND TOTAL 2,044,775$ 2,169,792$ 2,169,792$ 2,276,719$ 2,169,792$ 2,253,142$ 3.80%
RECYCLING DETAIL REVENUES
Page 172

MUNICIPAL COURT
Fund: 223-Municipal Court Department: 32-Municipal Function: 30-Public Safety Orgs: 22332
MISSION STATEMENT
The City of Racine Municipal Court is dedicated to administering justice in an equitable, impartial and timely manner in accordance with the rule of law. The Municipal Court shall provide the public and other agencies it serves with an accessible, safe, respectful environment in which to conduct business and resolve disputes. The Racine Municipal Court is also committed to promoting excellence, integrity and competence while ensuring public trust and confidence in the judicial system.
FUNCTION
The Municipal Court adjudicates alleged ordinance violations by accepting pleas, making and rendering judgments, setting those forfeitures not reserved for the Common Council, making decisions of law, ruling on objections, granting or denying motions and collecting forfeiture’s. The Municipal Court is responsible for being a buffer between the citizens and the police by assuring that defendants are not convicted unless they plead guilty or no contest to charges, or are proven guilty by admissible, clear, convincing and satisfactory evidence adduced at trial. SIGNIFICANT INITIATIVES RECENTLY ACCOMPLISHED
1. Successfully reopened court after Covid-19 and back-log of trials, status reviews and sentencings are up to date. 2. Telephonic arraignments were utilized during Covid-19, maintaining the consistent quality of customer service.
2022 STRATEGIC INITIATIVES
1. Transition the collection of forfeitures from the Police Department to the Municipal Court In as much as the Municipal Court is fully open again, until the 2022 budget is passed by the City Council, we are operating with two, rather than the traditional three full time clerks. Even then, we anticipate that the third position will only be a half-time position. Moreover, because the Chief Clerk vacancy was caused by the retirement of an individual who was with the Court since its inception and fully familiar with all aspects of Court operations, and replaced by an accomplished veteran employee of the City’s finance department who is new to the operation and functions of the Municipal Court, it is essential that we devote significant resources to all available training opportunities. Both the Wisconsin Municipal Judges Association and the Wisconsin Municipal Clerk Institute provide a number of invaluable in-person and webinar seminars, conferences and online training opportunities, which include training for TIPPS and other computer programs, state collection procedures and best practices for municipal courts. Indeed, because many municipalities in Wisconsin do not require their judges to be licensed attorneys, the Judges Association training is geared toward non-attorneys, including court clerks. For that reason, we have the opportunity to take advantage of many programs and should make a significant investment in such training.
Page 173

2022 Goal‐Setting Statement Department Name: Municipal Court Department Head/Staff Name(s): Judge Robert K. Weber
Goal Statement #1
Implement alternative juvenile prosecution through the City Council’s Youth Protection Resolution
In compliance with the City Council’s Youth Protection Resolution and its desire to implement alternatives to juvenile prosecution, the municipal judge, court staff and volunteers from other agencies, we intend to complete a study of various teen court alternatives utilized by other Wisconsin municipalities, and to implement a program unique to the needs of Racine.
Page 174
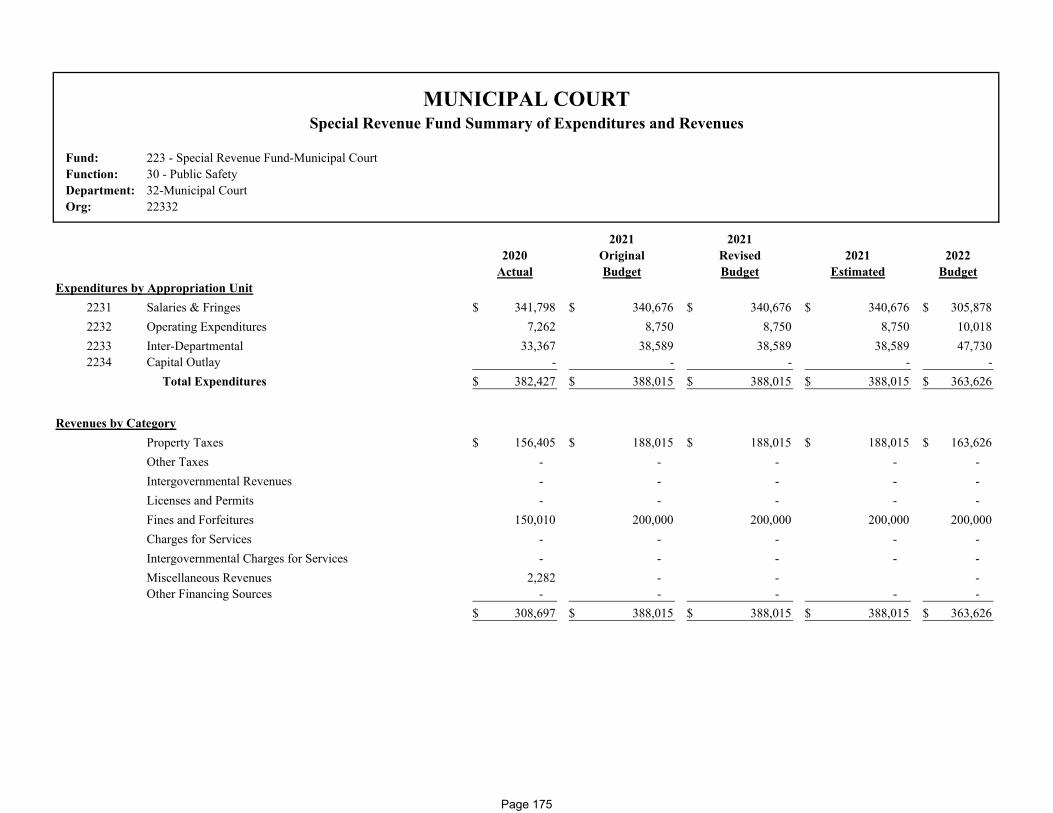
Fund: 223 - Special Revenue Fund-Municipal CourtFunction: 30 - Public SafetyDepartment: 32-Municipal CourtOrg: 22332
2021 20212020 Original Revised 2021 2022
Actual Budget Budget Estimated BudgetExpenditures by Appropriation Unit
2231 Salaries & Fringes 341,798$ 340,676$ 340,676$ 340,676$ 305,878$ 2232 Operating Expenditures 7,262 8,750 8,750 8,750 10,018 2233 Inter-Departmental 33,367 38,589 38,589 38,589 47,730 2234 Capital Outlay - - - - -
Total Expenditures 382,427$ 388,015$ 388,015$ 388,015$ 363,626$
Revenues by CategoryProperty Taxes 156,405$ 188,015$ 188,015$ 188,015$ 163,626$ Other Taxes - - - - - Intergovernmental Revenues - - - - - Licenses and Permits - - - - - Fines and Forfeitures 150,010 200,000 200,000 200,000 200,000 Charges for Services - - - - - Intergovernmental Charges for Services - - - - - Miscellaneous Revenues 2,282 - - - Other Financing Sources - - - - -
308,697$ 388,015$ 388,015$ 388,015$ 363,626$
MUNICIPAL COURTSpecial Revenue Fund Summary of Expenditures and Revenues
Page 175
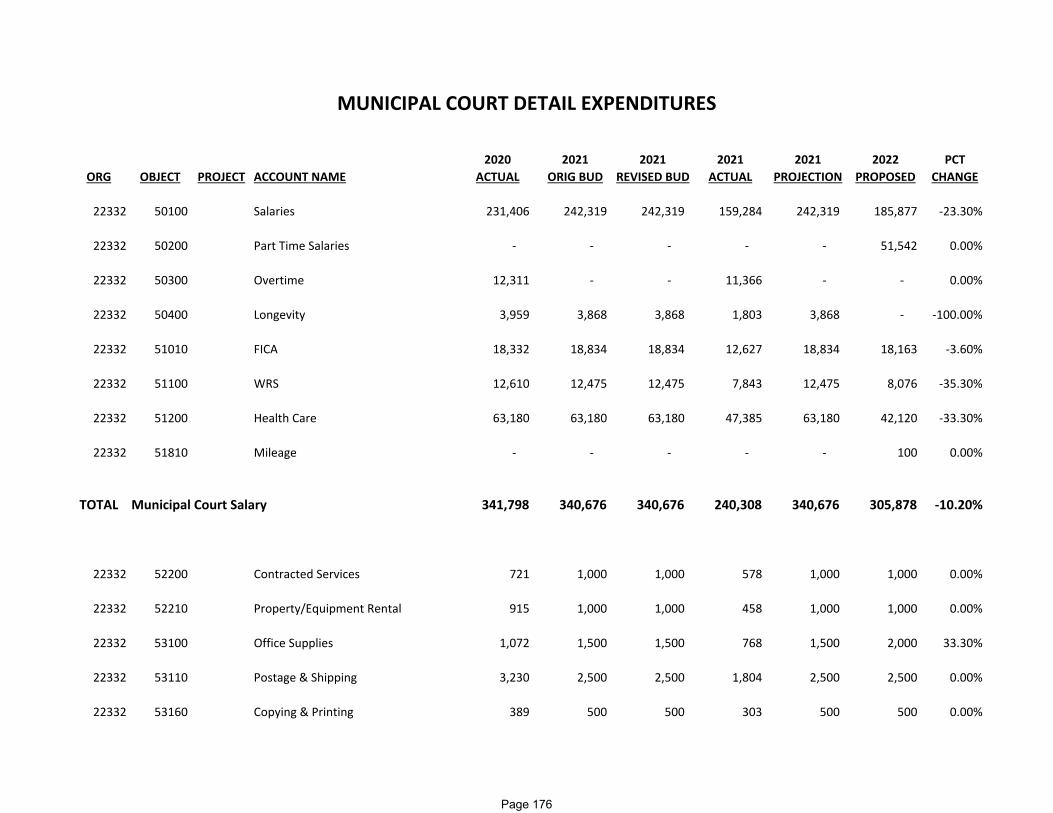
2020 2021 2021 2021 2021 2022 PCTORG OBJECT PROJECT ACCOUNT NAME ACTUAL ORIG BUD REVISED BUD ACTUAL PROJECTION PROPOSED CHANGE
22332 50100 Salaries 231,406 242,319 242,319 159,284 242,319 185,877 ‐23.30%
22332 50200 Part Time Salaries ‐ ‐ ‐ ‐ ‐ 51,542 0.00%
22332 50300 Overtime 12,311 ‐ ‐ 11,366 ‐ ‐ 0.00%
22332 50400 Longevity 3,959 3,868 3,868 1,803 3,868 ‐ ‐100.00%
22332 51010 FICA 18,332 18,834 18,834 12,627 18,834 18,163 ‐3.60%
22332 51100 WRS 12,610 12,475 12,475 7,843 12,475 8,076 ‐35.30%
22332 51200 Health Care 63,180 63,180 63,180 47,385 63,180 42,120 ‐33.30%
22332 51810 Mileage ‐ ‐ ‐ ‐ ‐ 100 0.00%
TOTAL Municipal Court Salary 341,798 340,676 340,676 240,308 340,676 305,878 ‐10.20%
22332 52200 Contracted Services 721 1,000 1,000 578 1,000 1,000 0.00%
22332 52210 Property/Equipment Rental 915 1,000 1,000 458 1,000 1,000 0.00%
22332 53100 Office Supplies 1,072 1,500 1,500 768 1,500 2,000 33.30%
22332 53110 Postage & Shipping 3,230 2,500 2,500 1,804 2,500 2,500 0.00%
22332 53160 Copying & Printing 389 500 500 303 500 500 0.00%
MUNICIPAL COURT DETAIL EXPENDITURES
Page 176
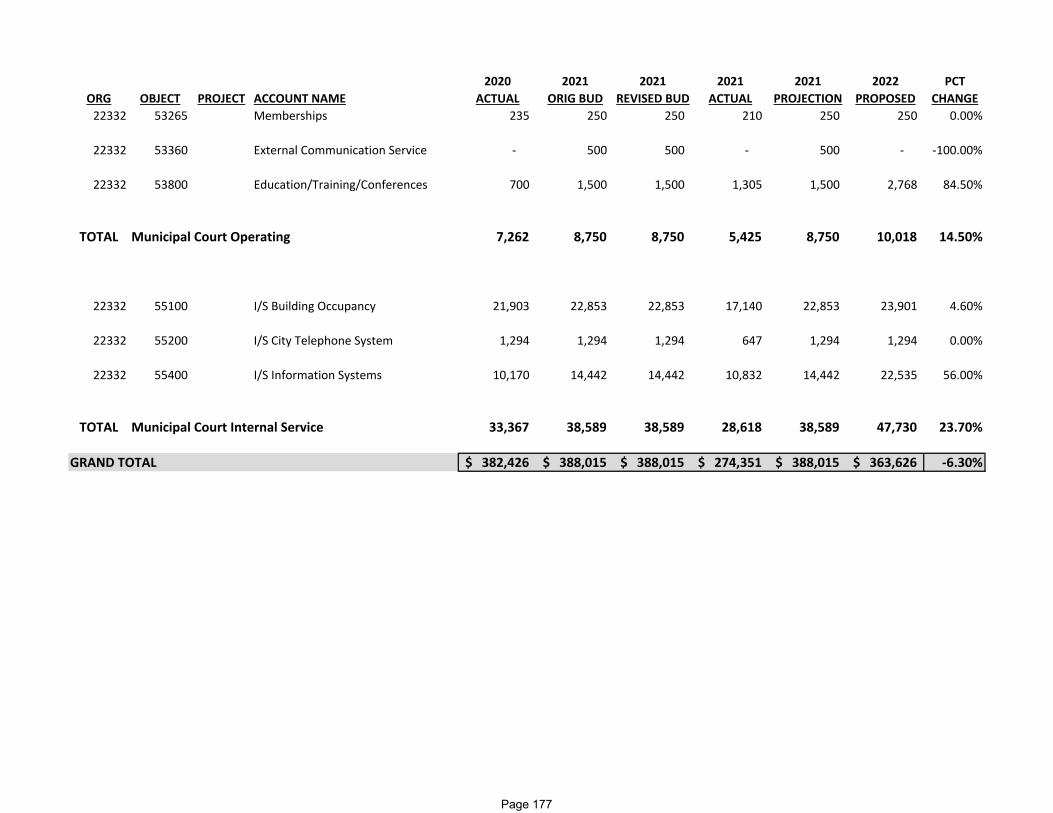
2020 2021 2021 2021 2021 2022 PCTORG OBJECT PROJECT ACCOUNT NAME ACTUAL ORIG BUD REVISED BUD ACTUAL PROJECTION PROPOSED CHANGE22332 53265 Memberships 235 250 250 210 250 250 0.00%
22332 53360 External Communication Service ‐ 500 500 ‐ 500 ‐ ‐100.00%
22332 53800 Education/Training/Conferences 700 1,500 1,500 1,305 1,500 2,768 84.50%
TOTAL Municipal Court Operating 7,262 8,750 8,750 5,425 8,750 10,018 14.50%
22332 55100 I/S Building Occupancy 21,903 22,853 22,853 17,140 22,853 23,901 4.60%
22332 55200 I/S City Telephone System 1,294 1,294 1,294 647 1,294 1,294 0.00%
22332 55400 I/S Information Systems 10,170 14,442 14,442 10,832 14,442 22,535 56.00%
TOTAL Municipal Court Internal Service 33,367 38,589 38,589 28,618 38,589 47,730 23.70%
GRAND TOTAL 382,426$ 388,015$ 388,015$ 274,351$ 388,015$ 363,626$ ‐6.30%
Page 177

2020 2021 2021 2021 2021 2022 PCTORG OBJECT PROJECT ACCOUNT NAME ACTUAL ORIG BUD REVISED BUD ACTUAL PROJECTION PROPOSED CHANGE
22332 41110 Property Taxes 156,405 188,015 188,015 188,015 188,015 163,626 ‐13.00%
TOTAL Taxes 156,405 188,015 188,015 188,015 188,015 163,626 ‐13.00%
22332 45110 Muni Court Fines 150,011 200,000 200,000 128,069 200,000 200,000 0.00%
TOTAL Fines and Forfeiture 150,011 200,000 200,000 128,069 200,000 200,000 0.00%
22332 48100 Interest Income 2,282 ‐ ‐ 181 ‐ ‐ 0.00%
TOTAL Miscellaneous Revenu 2,282 ‐ ‐ 181 ‐ ‐ 0.00%
GRAND TOTAL 308,697$ 388,015$ 388,015$ 316,265$ 388,015$ 363,626$ ‐6.30%
MUNICIPAL COURT DETAIL REVENUES
Page 178
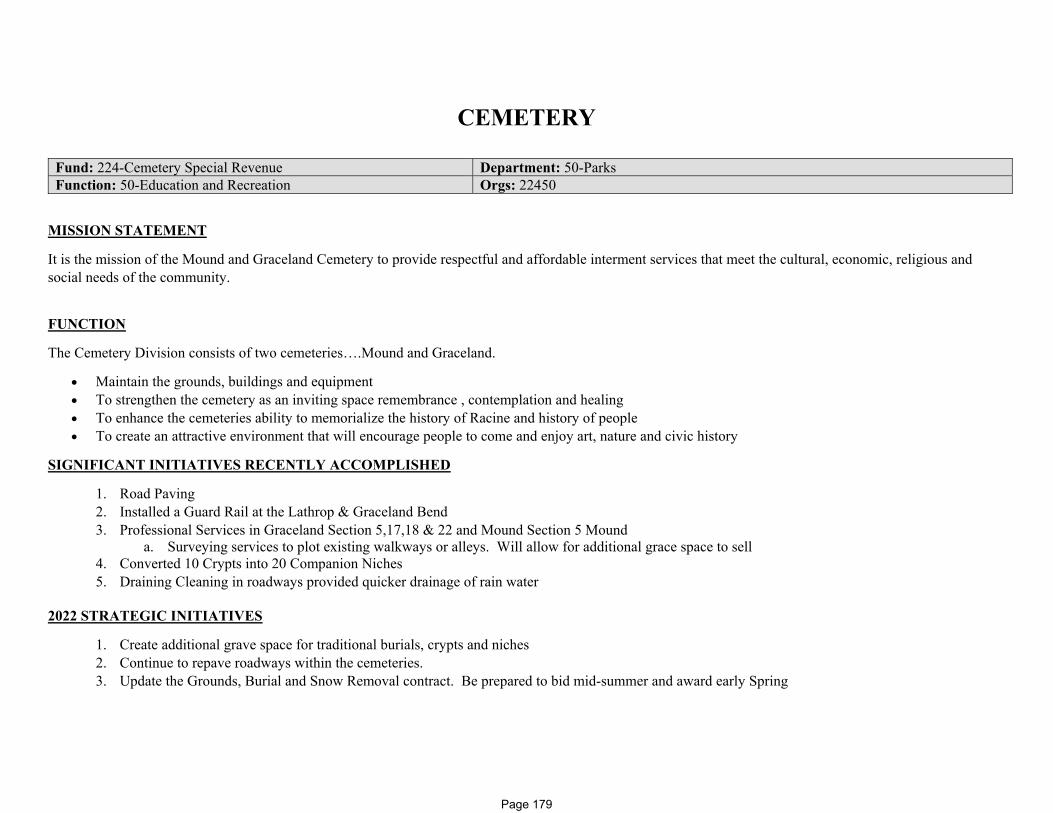
CEMETERY
Fund: 224-Cemetery Special Revenue Department: 50-Parks Function: 50-Education and Recreation Orgs: 22450
MISSION STATEMENT
It is the mission of the Mound and Graceland Cemetery to provide respectful and affordable interment services that meet the cultural, economic, religious and social needs of the community.
FUNCTION
The Cemetery Division consists of two cemeteries….Mound and Graceland.
Maintain the grounds, buildings and equipment To strengthen the cemetery as an inviting space remembrance , contemplation and healing To enhance the cemeteries ability to memorialize the history of Racine and history of people To create an attractive environment that will encourage people to come and enjoy art, nature and civic history
SIGNIFICANT INITIATIVES RECENTLY ACCOMPLISHED
1. Road Paving 2. Installed a Guard Rail at the Lathrop & Graceland Bend 3. Professional Services in Graceland Section 5,17,18 & 22 and Mound Section 5 Mound
a. Surveying services to plot existing walkways or alleys. Will allow for additional grace space to sell 4. Converted 10 Crypts into 20 Companion Niches 5. Draining Cleaning in roadways provided quicker drainage of rain water
2022 STRATEGIC INITIATIVES
1. Create additional grave space for traditional burials, crypts and niches 2. Continue to repave roadways within the cemeteries. 3. Update the Grounds, Burial and Snow Removal contract. Be prepared to bid mid-summer and award early Spring
Page 179

CEMETERY
Fund: 224-Cemetery Special Revenue Department: 50-Parks Function: 50-Education and Recreation Orgs: 22450
SIGNIFICANT FUNDING OR PROGRAM CHANGES IN 2022
1. Increase all fees & charges by 10% in 2022 to begin to get our fees more comparable with our neighboring cemeteries. 2. New fee: Temporary to Permanent
a. Tandem Crypt in Graceland Cemetery b. $300 In and $300 Out (Out will be free if they purchase a grave space in Mound or Graceland Cemeteries)
Page 180
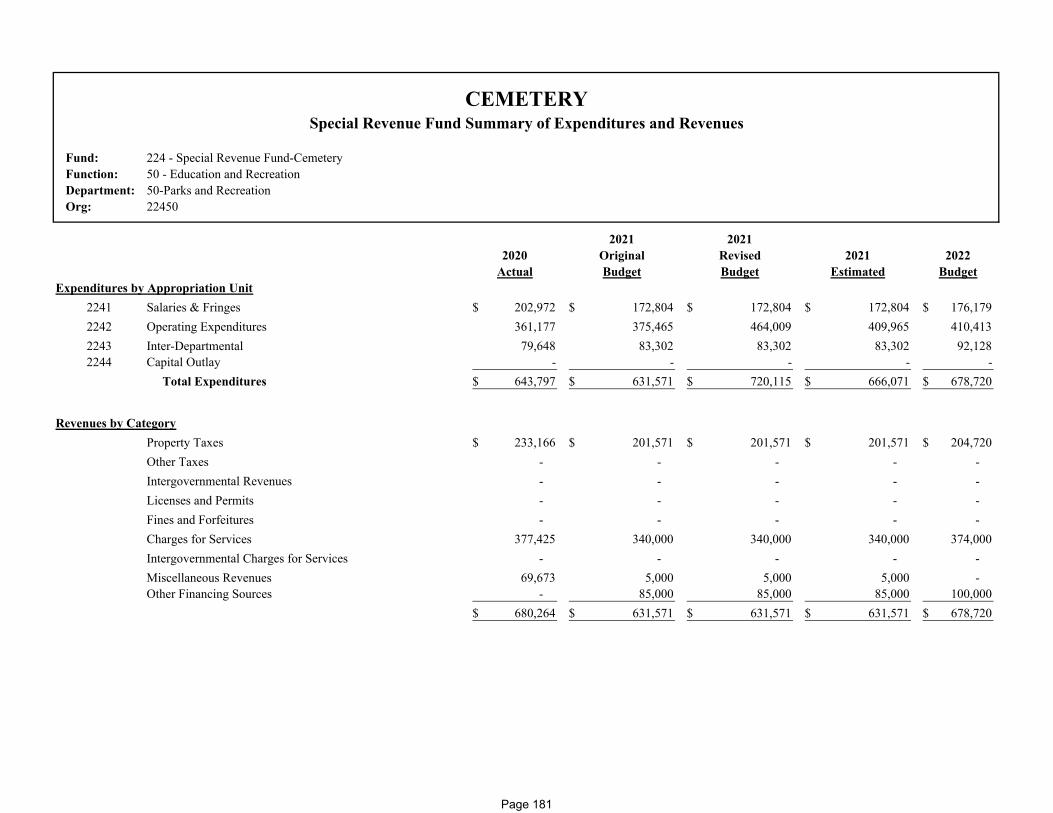
Fund: 224 - Special Revenue Fund-CemeteryFunction: 50 - Education and RecreationDepartment: 50-Parks and RecreationOrg: 22450
2021 20212020 Original Revised 2021 2022
Actual Budget Budget Estimated BudgetExpenditures by Appropriation Unit
2241 Salaries & Fringes 202,972$ 172,804$ 172,804$ 172,804$ 176,179$ 2242 Operating Expenditures 361,177 375,465 464,009 409,965 410,413 2243 Inter-Departmental 79,648 83,302 83,302 83,302 92,128 2244 Capital Outlay - - - - -
Total Expenditures 643,797$ 631,571$ 720,115$ 666,071$ 678,720$
Revenues by CategoryProperty Taxes 233,166$ 201,571$ 201,571$ 201,571$ 204,720$ Other Taxes - - - - - Intergovernmental Revenues - - - - - Licenses and Permits - - - - - Fines and Forfeitures - - - - - Charges for Services 377,425 340,000 340,000 340,000 374,000 Intergovernmental Charges for Services - - - - - Miscellaneous Revenues 69,673 5,000 5,000 5,000 - Other Financing Sources - 85,000 85,000 85,000 100,000
680,264$ 631,571$ 631,571$ 631,571$ 678,720$
CEMETERYSpecial Revenue Fund Summary of Expenditures and Revenues
Page 181
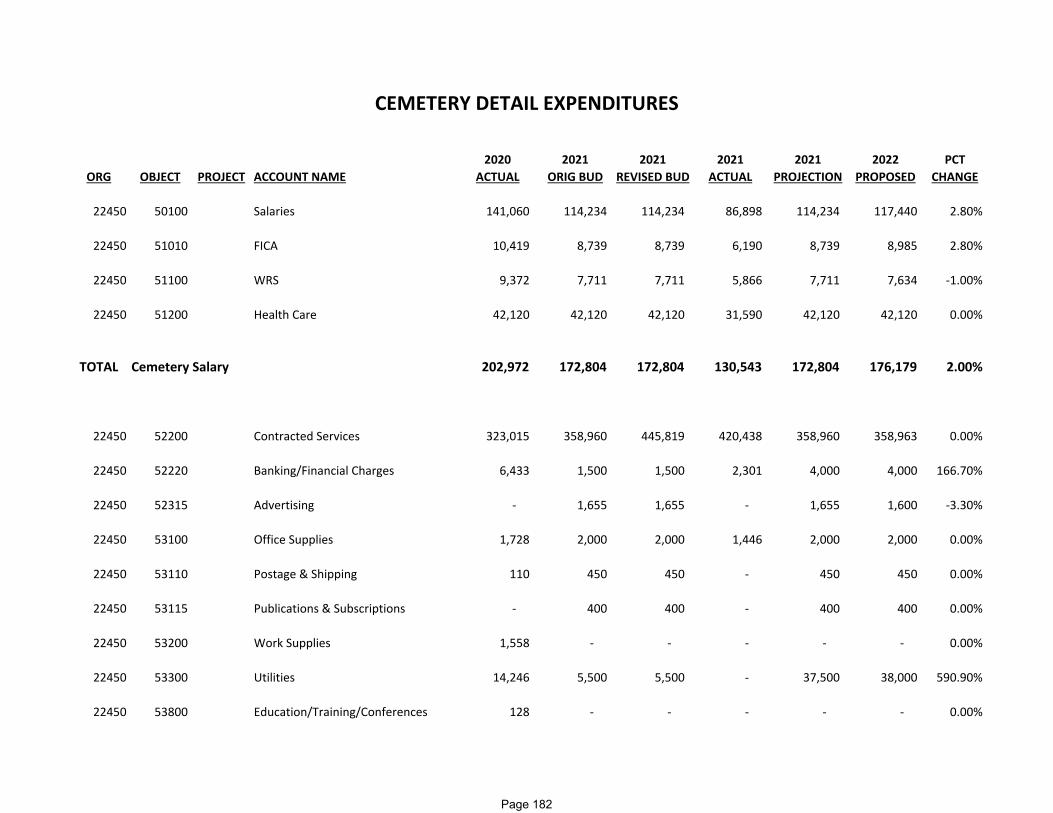
2020 2021 2021 2021 2021 2022 PCTORG OBJECT PROJECT ACCOUNT NAME ACTUAL ORIG BUD REVISED BUD ACTUAL PROJECTION PROPOSED CHANGE
22450 50100 Salaries 141,060 114,234 114,234 86,898 114,234 117,440 2.80%
22450 51010 FICA 10,419 8,739 8,739 6,190 8,739 8,985 2.80%
22450 51100 WRS 9,372 7,711 7,711 5,866 7,711 7,634 ‐1.00%
22450 51200 Health Care 42,120 42,120 42,120 31,590 42,120 42,120 0.00%
TOTAL Cemetery Salary 202,972 172,804 172,804 130,543 172,804 176,179 2.00%
22450 52200 Contracted Services 323,015 358,960 445,819 420,438 358,960 358,963 0.00%
22450 52220 Banking/Financial Charges 6,433 1,500 1,500 2,301 4,000 4,000 166.70%
22450 52315 Advertising ‐ 1,655 1,655 ‐ 1,655 1,600 ‐3.30%
22450 53100 Office Supplies 1,728 2,000 2,000 1,446 2,000 2,000 0.00%
22450 53110 Postage & Shipping 110 450 450 ‐ 450 450 0.00%
22450 53115 Publications & Subscriptions ‐ 400 400 ‐ 400 400 0.00%
22450 53200 Work Supplies 1,558 ‐ ‐ ‐ ‐ ‐ 0.00%
22450 53300 Utilities 14,246 5,500 5,500 ‐ 37,500 38,000 590.90%
22450 53800 Education/Training/Conferences 128 ‐ ‐ ‐ ‐ ‐ 0.00%
CEMETERY DETAIL EXPENDITURES
Page 182

2020 2021 2021 2021 2021 2022 PCTORG OBJECT PROJECT ACCOUNT NAME ACTUAL ORIG BUD REVISED BUD ACTUAL PROJECTION PROPOSED CHANGE22450 54300 Grounds Repairs & Maintenance 13,959 5,000 6,685 13,087 5,000 5,000 0.00%
TOTAL Cemetery Operating 361,177 375,465 464,009 437,272 409,965 410,413 9.30%
22450 55100 I/S Building Occupancy 65,977 68,578 68,578 51,433 68,578 71,954 4.90%
22450 55200 I/S City Telephone System 366 366 366 183 366 366 0.00%
22450 55300 I/S Garage Fuel 997 2,000 2,000 791 2,000 2,100 5.00%
22450 55310 I/S Garage Labor 2,105 1,200 1,200 2,191 1,200 2,500 108.30%
22450 55320 I/S Garage Materials 556 500 500 408 500 1,000 100.00%
22450 55400 I/S Information Systems 9,647 10,658 10,658 7,994 10,658 14,208 33.30%
TOTAL Cemetery Internal Service 79,648 83,302 83,302 62,999 83,302 92,128 10.60%
GRAND TOTAL 643,797$ 631,571$ 720,115$ 630,814$ 666,071$ 678,720$ 7.50%
Page 183

2020 2021 2021 2021 2021 2022 PCTORG OBJECT PROJECT ACCOUNT NAME ACTUAL ORIG BUD REVISED BUD ACTUAL PROJECTION BUDGET CHANGE
22450 41110 Property Taxes 233,166 201,571 201,571 201,571 201,571 204,720 1.60%
TOTAL Taxes 233,166 201,571 201,571 201,571 201,571 204,720 1.60%
22450 46540 Cemetery Charges 377,425 340,000 340,000 283,972 340,000 374,000 10.00%
TOTAL Charges for Services 377,425 340,000 340,000 283,972 340,000 374,000 10.00%
22450 48100 Interest Income 12,533 5,000 5,000 2,487 5,000 ‐ ‐100.00%
22450 48500 Donations/Contributions 57,140 ‐ ‐ ‐ ‐ ‐ 0.00%
TOTAL Miscellaneous Revenue 69,673 5,000 5,000 2,487 5,000 ‐ ‐100.00%
22450 49300 Fund Balance Applied ‐ 85,000 85,000 ‐ 85,000 100,000 17.60%
TOTAL Other Finance Sources ‐ 85,000 85,000 ‐ 85,000 100,000 17.60%
GRAND TOTAL 680,264$ 631,571$ 631,571$ 488,030$ 631,571$ 678,720$ 7.50%
CEMETERY DETAIL REVENUES
Page 184

NEIGHBORHOOD ENHANCEMENT DIVISION
Fund: 225-Neighborhood Enhancement Division Department: 60-Community Development Function: 60-Community Development Orgs: 22560
MISSION STATEMENT
Neighborhood Enhancement Division strives to make an impact on and improve the health, safety, and welfare of all neighborhoods by improving the City’s housing stock, and improving the quality of life for the citizens of the City of Racine.
FUNCTION
To establish regularly scheduled, systematic inspections of residential rental dwelling units within neighborhood stabilization and enhancement districts within the city to ensure that those units provide safe, decent, and sanitary living conditions for tenants living in the residential rental dwelling unit and to prevent further deterioration of those units. The division provides data and documentation to support the City of Racine’s effort to identify and reduce the number of chronic nuisance properties that occur within the city. This division encourages property owners who own and operate residential rental dwelling units to exercise their responsibility to ensure that the city ordinances governing the condition and maintenance of residential rental dwelling units are followed to protect the health, safety, and welfare of the public and prevent blighted conditions in city neighborhoods.
SIGNIFICANT FUNDING OR PROGRAM CHANGES IN 2022
Two additional code inspection full time positions have been added $215,000
Page 185
2022 Goal‐Setting Statement Department Name: City Development, Neighborhood Services Division Department Head/Staff Name(s): Bill Bowers (Director of City Development) and Matt Rejc (Assistant Director of City Development)
Goal Statement #1
Implement RENTS ordinance In order to successfully implement the RENTS Ordinance, the Neighborhood Services Division will fund at least 1,390 proactive inspections by July 31, 2022. This number represents roughly half of the estimated number of rental properties within the Neighborhood Strategy and Enhancement District, and the proactive inspections represent a key step towards maintaining the structural stability of the City’s housing stock.
Goal Statement #2 Create a self‐sustaining land banking program that will restore tax‐foreclosed residential properties and transfer them to new
homeowners
In order to foster the creation of a self‐sustaining land banking program that will restore tax‐foreclosed residential properties and transfer them to new homeowners on a large scale, the Neighborhood Services Division will create a system to increase the number of properties developed and prepared for sale to homebuyers by 12 by December 31 of 2022. The Neighborhood Services Division has financed, in whole or in part, the rehabilitation or construction of 7 units since 2020.
Page 186
Goal Statement #3 Increase the number of eligible applicants requesting funds by enhancing the Housing Repair Program application process In order to shepherd the rehabilitation of at least 35 homeowner‐occupied units to completion by December 31 of 2022, the Neighborhood Services Division will increase the number of eligible applicants requesting such funds by enhancing the Housing Repair Program application process through user interface upgrades to www.racinehousingloans.com and deploying Neighborhood TID funding in applicable areas. The City and CDA expect to approve 26 housing repair loans in 2021.
Page 187

This page is intentionally left blank
Page 188

Fund: 225 - Special Revenue Fund-Neighborhood Enhancement DivisionFunction: 60 - Community DevelopmentDepartment: 60-City DevelopmentOrg: 22560
2021 20212020 Original Revised 2021 2022
Actual Budget Budget Estimated BudgetExpenditures by Appropriation Unit
2251 Salaries & Fringes 947$ -$ 758,164$ 758,164$ 1,076,338$ 2252 Operating Expenditures 397,885 225,000 341,902 341,902 125,000 2253 Inter-Departmental - - - - - 2254 Capital Outlay - - - - -
Total Expenditures 398,832$ 225,000$ 1,100,066$ 1,100,066$ 1,201,338$
Revenues by CategoryProperty Taxes -$ -$ -$ -$ 109,681$ Other Taxes 107 - - - - Intergovernmental Revenues - - - - - Licenses and Permits - - 220,000 220,000 250,000 Fines and Forfeitures - - - - - Charges for Services 459,876 225,000 225,000 225,000 145,000 Intergovernmental Charges for Services - - - - - Miscellaneous Revenues 8,644 - - - - Other Financing Sources - - 578,164 508,764 696,657
468,627$ 225,000$ 1,023,164$ 953,764$ 1,201,338$
NEIGHBORHOOD ENHANCEMENT DIVISIONSpecial Revenue Fund Summary of Expenditures and Revenues
Page 189
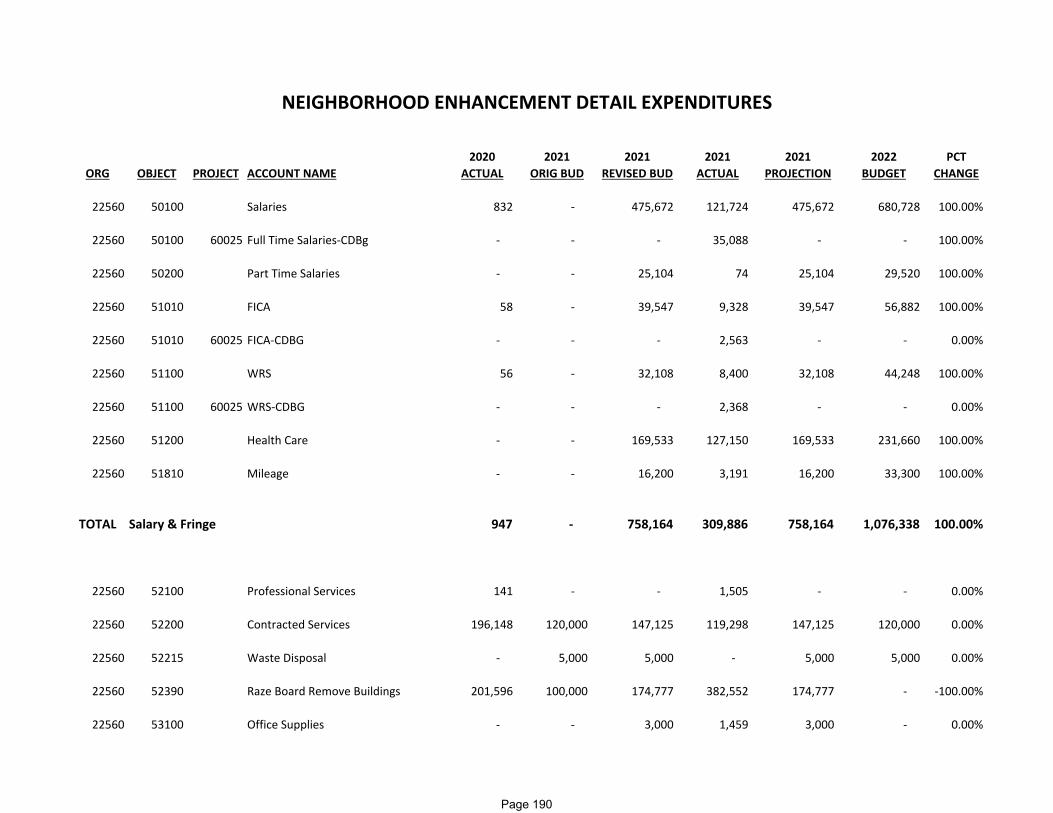
2020 2021 2021 2021 2021 2022 PCTORG OBJECT PROJECT ACCOUNT NAME ACTUAL ORIG BUD REVISED BUD ACTUAL PROJECTION BUDGET CHANGE
22560 50100 Salaries 832 ‐ 475,672 121,724 475,672 680,728 100.00%
22560 50100 60025 Full Time Salaries‐CDBg ‐ ‐ ‐ 35,088 ‐ ‐ 100.00%
22560 50200 Part Time Salaries ‐ ‐ 25,104 74 25,104 29,520 100.00%
22560 51010 FICA 58 ‐ 39,547 9,328 39,547 56,882 100.00%
22560 51010 60025 FICA‐CDBG ‐ ‐ ‐ 2,563 ‐ ‐ 0.00%
22560 51100 WRS 56 ‐ 32,108 8,400 32,108 44,248 100.00%
22560 51100 60025 WRS‐CDBG ‐ ‐ ‐ 2,368 ‐ ‐ 0.00%
22560 51200 Health Care ‐ ‐ 169,533 127,150 169,533 231,660 100.00%
22560 51810 Mileage ‐ ‐ 16,200 3,191 16,200 33,300 100.00%
TOTAL Salary & Fringe 947 ‐ 758,164 309,886 758,164 1,076,338 100.00%
22560 52100 Professional Services 141 ‐ ‐ 1,505 ‐ ‐ 0.00%
22560 52200 Contracted Services 196,148 120,000 147,125 119,298 147,125 120,000 0.00%
22560 52215 Waste Disposal ‐ 5,000 5,000 ‐ 5,000 5,000 0.00%
22560 52390 Raze Board Remove Buildings 201,596 100,000 174,777 382,552 174,777 ‐ ‐100.00%
22560 53100 Office Supplies ‐ ‐ 3,000 1,459 3,000 ‐ 0.00%
NEIGHBORHOOD ENHANCEMENT DETAIL EXPENDITURES
Page 190

2020 2021 2021 2021 2021 2022 PCTORG OBJECT PROJECT ACCOUNT NAME ACTUAL ORIG BUD REVISED BUD ACTUAL PROJECTION BUDGET CHANGE
22560 53100 10007 Office Supplies ‐ ‐ ‐ 185 ‐ ‐ 0.00%
22560 53200 Work Supplies ‐ ‐ 5,000 2,552 5,000 ‐ 0.00%
22560 53200 60025 Work Supplies‐CDBG ‐ ‐ ‐ 224 ‐ ‐ 0.00%
22560 53360 External Communication Service ‐ ‐ 5,000 ‐ 5,000 ‐ 0.00%
22560 53800 Education/Training/Conferences ‐ ‐ 2,000 ‐ 2,000 ‐ 0.00%
TOTAL Operating 397,885 225,000 341,902 507,775 341,902 125,000 ‐44.40%
GRAND TOTAL 398,831$ 225,000$ 1,100,066$ 817,661$ 1,100,066$ 1,201,338$ 433.90%
Page 191

2020 2021 2021 2021 2021 2022 PCTORG OBJECT PROJECT ACCOUNT NAME ACTUAL ORIG BUD REVISED BUD ACTUAL PROJECTION BUDGET CHANGE
22540 41222 Sales Tax Discount ‐ ‐ ‐ 181 ‐ ‐ 0.00%
22560 41110 Property Taxes ‐ ‐ ‐ ‐ ‐ 109,681 100.00%
22560 41222 Sales Tax Discount 107 ‐ ‐ ‐ ‐ ‐ 0.00%
TOTAL Taxes 107 ‐ ‐ 181 ‐ 109,681 100.00%
22560 44310 Property Inspection Fee ‐ ‐ 220,000 190,898 220,000 250,000 100.00%
TOTAL Licenses and Permits ‐ ‐ 220,000 190,898 220,000 250,000 100.00%
22560 46310 Highway/Street Charges 3,074 5,000 5,000 26,020 5,000 5,000 0.00%
22560 46440 Weed and Nuisance Control 208,876 110,000 110,000 130,844 110,000 140,000 27.30%
22560 46441 Board Up Buildings 5,885 10,000 10,000 ‐ 10,000 ‐ ‐100.00%
22560 46720 Charges‐Parks 9,700 ‐ ‐ 18,145 ‐ ‐ 0.00%
22560 46900 Razing & Removing 232,343 100,000 100,000 497,471 100,000 ‐ ‐100.00%
TOTAL Charges for Services 459,877 225,000 225,000 672,480 225,000 145,000 ‐35.60%
NEIGHBORHOOD ENHANCEMENT DETAIL REVENUES
Page 192

2020 2021 2021 2021 2021 2022 PCTORG OBJECT PROJECT ACCOUNT NAME ACTUAL ORIG BUD REVISED BUD ACTUAL PROJECTION BUDGET CHANGE
22560 48100 Interest Income 8,644 ‐ ‐ 1,344 ‐ ‐ 0.00%
22560 48910 Over/Short ‐ ‐ ‐ (12) ‐ ‐ 0.00%
TOTAL Miscellaneous Revenu 8,644 ‐ ‐ 1,332 ‐ ‐ 0.00%
22560 49210 Transfer from General Fund ‐ ‐ 78,164 ‐ ‐ ‐ 0.00%
22560 49220 Transfer from Special Revenue ‐ ‐ 500,000 ‐ 508,764 696,657 100.00%
TOTAL Other Financ Sources ‐ ‐ 578,164 ‐ 508,764 696,657 100.00%
GRAND TOTAL 468,627$ 225,000$ 1,023,164$ 864,892$ 953,764$ 1,201,338$ 433.90%
Page 193

This page is intentionally left blank
Page 194
SANITARY SEWER MAINTENANCE
Fund: 226-Sanitary Sewer Maintenance Department: 40-Public Works Function: 40-Public Works Orgs: 22640
MISSION STATEMENT
The Sanitary Sewer Maintenance (SSM) is a self-sustaining Special Revenue Fund enacted in 2008 to ensure the sanitary sewer collection system is in a good state of repair, effectively transport sewage to the wastewater treatment plant, and to protect the health of our citizenry and environment.
FUNCTION
The Sanitary Sewer Maintenance account funds the cost of repair and replacement to the sewer collection system and to sanitary sewer laterals from the right of way line to the sanitary sewer main.
SIGNIFICANT INITIATIVES RECENTLY ACCOMPLISHED
1. The SSM fund has replaced or repaired over 2,000 sanitary sewer laterals in the past 10 years. The SSM is addressing a ~$25 million backlog in sewer system deficiencies annually via repair, replacement or relining projects. This is achieved by programming approximately $2M in various investigative, engineering and rehabilitation strategies over the next decade. Lateral repair and replacement is increasing every year in numbers and dollar amount. In 2021 the lateral program will utilize an estimated 1/3 of the annual $2M, which reduces the programed amount available for mainline repairs and replacement. While this provides great service to individual property owners and I/I reduction in laterals, it means reduced funding to address the backlog of deficiencies in the overall collection system.
2022 STRATEGIC INITIATIVES
2. The SSM will continue its annual mission to reduce the backlog of deficiencies while also funding infrastructure associated with 2022 City Engineering projects and also addressing sanitary sewers on the WisDOT projects such as; Goold Street (Douglas Ave. to Main St.) & Durand Ave. - STH 11 (Kearney Ave. to STH 32) in 2022. The SSM will provide funding to address exceedances at the RWWTP to reduce I/I and provide north side storage of peak flow to free the City of Racine from sanitary sewer extension moratoriums imposed by the RWWU Commission.
Page 195
SANITARY SEWER MAINTENANCE
Fund: 226-Sanitary Sewer Maintenance Department: 40-Public Works Function: 40-Public Works Orgs: 22640
SIGNIFICANT FUNDING OR PROGRAM CHANGES IN 2022
3. The SSM fund receives ~$800,000 annually in RWWU surcharge revenue to assist with the aging infrastructure. The SSM fund (currently at $75/lateral) is the only other revenue source to address aging infrastructure costs. The cost to repair and replace infrastructure gets more expensive every year. The SSM fund salaries and fringes has increased by almost $200,000 to pay for the transfer of engineering staff costs from the levy. In addition, the cost of sanitary sewer lateral repair and replacement has risen another $100,000 in 2021. The SSM fund is budgeting for an additional $400,000 annually in RWWU surcharge revenue to address peak flow exceedance issues at the RWWTP. These funds will be used to address various storage and I/I reduction projects to keep the City of Racine from any imposed moratoriums on sewer extensions by the Racine Wastewater Utility Commission.
Page 196
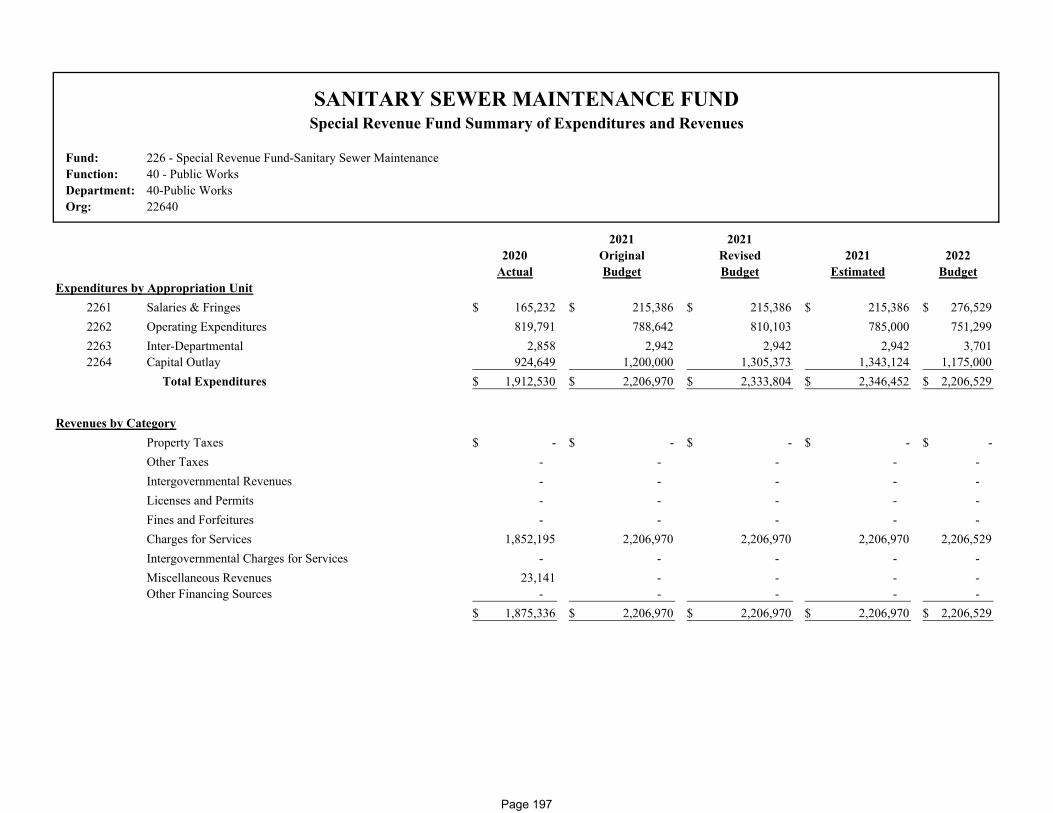
Fund: 226 - Special Revenue Fund-Sanitary Sewer MaintenanceFunction: 40 - Public WorksDepartment: 40-Public WorksOrg: 22640
2021 20212020 Original Revised 2021 2022
Actual Budget Budget Estimated BudgetExpenditures by Appropriation Unit
2261 Salaries & Fringes 165,232$ 215,386$ 215,386$ 215,386$ 276,529$ 2262 Operating Expenditures 819,791 788,642 810,103 785,000 751,299 2263 Inter-Departmental 2,858 2,942 2,942 2,942 3,701 2264 Capital Outlay 924,649 1,200,000 1,305,373 1,343,124 1,175,000
Total Expenditures 1,912,530$ 2,206,970$ 2,333,804$ 2,346,452$ 2,206,529$
Revenues by CategoryProperty Taxes -$ -$ -$ -$ -$ Other Taxes - - - - - Intergovernmental Revenues - - - - - Licenses and Permits - - - - - Fines and Forfeitures - - - - - Charges for Services 1,852,195 2,206,970 2,206,970 2,206,970 2,206,529 Intergovernmental Charges for Services - - - - - Miscellaneous Revenues 23,141 - - - - Other Financing Sources - - - - -
1,875,336$ 2,206,970$ 2,206,970$ 2,206,970$ 2,206,529$
SANITARY SEWER MAINTENANCE FUNDSpecial Revenue Fund Summary of Expenditures and Revenues
Page 197

2020 2021 2021 2021 2021 2022 PCTORG OBJECT PROJECT ACCOUNT NAME ACTUAL ORIG BUD REVISED BUD ACTUAL PROJECTION BUDGET CHANGE
22640 50100 Salaries 87,817 156,104 156,104 104,702 156,104 200,417 28.40%
22640 51010 FICA 6,420 11,943 11,943 7,590 11,943 15,332 28.40%
22640 51100 WRS 5,708 10,537 10,537 7,067 10,537 13,027 23.60%
22640 51200 Health Care 65,286 35,802 35,802 26,852 35,802 46,753 30.60%
22640 51810 Mileage ‐ 1,000 1,000 ‐ 1,000 1,000 0.00%
TOTAL Sanitary Sewer Maint Salary & Fringe 165,232 215,386 215,386 146,211 215,386 276,529 28.40%
22640 52100 Professional Services 16,588 28,642 50,103 21,461 25,000 30,000 4.70%
22640 52200 Contracted Services ‐ 5,000 5,000 ‐ 5,000 5,000 0.00%
22640 52215 Waste Disposal ‐ ‐ ‐ 85 ‐ ‐ 0.00%
22640 53100 Office Supplies ‐ 500 500 ‐ 500 500 0.00%
22640 53160 Copying & Printing ‐ 500 500 ‐ 500 500 0.00%
22640 53200 Work Supplies ‐ 500 500 500 500 500 0.00%
22640 53265 Memberships ‐ 250 250 464 250 250 0.00%
22640 53360 External Communication Service 595 1,500 1,500 1,648 1,500 1,500 0.00%
22640 53430 Refunds ‐ 500 500 ‐ 500 500 0.00%
SANITARY SEWER MAINTENANCE DETAIL EXPENDITURES
Page 198

2020 2021 2021 2021 2021 2022 PCTORG OBJECT PROJECT ACCOUNT NAME ACTUAL ORIG BUD REVISED BUD ACTUAL PROJECTION BUDGET CHANGE22640 53800 Education/Training/Conferences ‐ 1,000 1,000 ‐ 1,000 1,000 0.00%
22640 53810 Travel ‐ 250 250 ‐ 250 250 0.00%
22640 54400 Infrastructure Repairs 802,608 750,000 750,000 467,737 750,000 711,299 ‐5.20%
TOTAL Sanitary Sewer Maint Operating 819,791 788,642 810,103 491,894 785,000 751,299 ‐4.70%
22640 55400 I/S Information Systems 2,858 2,942 2,942 2,207 2,942 3,701 25.80%
TOTAL Sanitary Sewer Maint Internal Service 2,858 2,942 2,942 2,207 2,942 3,701 25.80%
22640 57500 Paving ‐ ‐ ‐ 49,128 ‐ 200,000 0.00%
22640 57560 Sanitary Sewers 924,649 1,200,000 1,305,373 741,248 1,343,124 975,000 ‐18.80%
TOTAL Sanitary Sewer Maint Outlay 924,649 1,200,000 1,305,373 790,376 1,343,124 1,175,000 ‐2.10%
GRAND TOTAL 1,912,530$ 2,206,970$ 2,333,803$ 1,430,687$ 2,346,452$ 2,206,529$ 0.00%
Page 199

2020 2021 2021 2021 2021 2022 PCTORG OBJECT PROJECT ACCOUNT NAME ACTUAL ORIG BUD REVISED BUD ACTUAL PROJECTION BUDGET CHANGE
22640 46410 Sanitary Sewer Charges 1,852,195 2,206,970 2,206,970 2,201,925 2,206,970 2,206,529 0.00%
TOTAL Charges for Services 1,852,195 2,206,970 2,206,970 2,201,925 2,206,970 2,206,529 0.00%
22640 48100 Interest Income 23,141 ‐ ‐ 2,740 ‐ ‐ 0.00%
TOTAL Miscellaneous Revenue 23,141 ‐ ‐ 2,740 ‐ ‐ 0.00%
GRAND TOTAL 1,875,337$ 2,206,970$ 2,206,970$ 2,204,665$ 2,206,970$ 2,206,529$ 0.00%
SANITARY SEWER MAINTENANCE DETAIL REVENUES
Page 200

PUBLIC HEALTH LABORATORY
Fund: 227-Health Lab Department: 20-Health Function: 20-Health Orgs: 22720
MISSION STATEMENT
Provide comprehensive services, education, and advocacy for the protection, promotion, and improvement of the community’s health and environment.
FUNCTION AND FINANCIAL SUPPORT
The Laboratory Division ensures the integrity of the City’s natural resources are maintained; seeking a sustainable balance between public health protection, utility, and environmental preservation in order to improve quality of life within the community and contribute to enhancement of the Great Lakes basin. The Laboratory Division provides regulatory management, comprehensive water quality assessment, pollution source identification, site remediation / restoration, best management practice, planning, grant / technical writing services, and rapid molecular analytical support to multiple department programs. Laboratory services also extend to engagements, as collaborators or supporting roles, with the federal governments of the US and Canada, State agencies, academic institutions, regional planning commissions, local municipal agencies, and for-profit / non-profit organizations in Wisconsin and Illinois. Financial support is comprised of tax levy dollars, storm water utility funds, grants and contracts awarded to the Laboratory and / or its partner agencies, as well as fees collected for services rendered. Grant applications are written / co-written / reviewed by Laboratory personnel and all awards directly or indirectly benefit the City of Racine. Contracts entered into with various agencies / organizations are utilized to undertake research, conduct monitoring, provide expert advice, review / write grant applications, provide placement for student interns, support projects / events, speak at engagements, participate in site assessments and act in the role of scientific advisor. Fee for service testing is primarily generated through the analysis of surface water samples for recreational safety, beneficial use, and /or general water quality impairment investigations. This is supplemented by requests for analysis of treated or processed surface and ground water for individuals and other organizations.
Page 201

This page is intentionally left blank
Page 202

Fund: 227 - Special Revenue Fund-Health LabFunction: 20 - HealthDepartment: 20-HealthOrg: 22720
2021 20212020 Original Revised 2021 2022
Actual Budget Budget Estimated BudgetExpenditures by Appropriation Unit
2271 Salaries & Fringes 385,637$ 215,826$ 215,826$ 215,826$ 85,093$ 2272 Operating Expenditures 18,889 28,650 28,650 28,650 22,575 2273 Inter-Departmental 39,647 40,814 40,814 40,814 47,432 2274 Capital Outlay - - - - -
Total Expenditures 444,173$ 285,290$ 285,290$ 285,290$ 155,100$
Revenues by CategoryProperty Taxes 406,810$ 235,290$ 235,290$ 235,290$ 130,100$ Other Taxes - - - - - Intergovernmental Revenues - - - - - Licenses and Permits - - - - - Fines and Forfeitures - - - - - Charges for Services 3,115 - - - - Intergovernmental Charges for Services - - - - - Miscellaneous Revenues 6,985 - - - - Other Financing Sources - 50,000 50,000 50,000 25,000
416,910$ 285,290$ 285,290$ 285,290$ 155,100$
HEALTH LABSpecial Revenue Fund Summary of Expenditures and Revenues
Page 203

2020 2021 2021 2021 2021 2022 PCTORG OBJECT PROJECT ACCOUNT NAME ACTUAL ORIG BUD REVISED BUD ACTUAL PROJECTION BUDGET CHANGE
22720 50100 Salaries 259,307 142,713 142,713 114,274 142,713 59,462 ‐58.30%
22720 50200 Part Time Salaries 123 3,541 3,541 ‐ 3,541 ‐ ‐100.00%
22720 50300 Overtime 11,423 ‐ ‐ 224 ‐ ‐ 0.00%
22720 51010 FICA 19,639 12,107 12,107 8,002 12,107 4,550 ‐62.40%
22720 51100 WRS 18,150 9,633 9,633 7,539 9,633 3,865 ‐59.90%
22720 51200 Health Care 76,769 46,332 46,332 34,749 46,332 16,216 ‐65.00%
22720 51810 Mileage 226 1,500 1,500 109 1,500 1,000 ‐33.30%
TOTAL Health Lab Salary & Fringe 385,637 215,826 215,826 164,897 215,826 85,093 ‐60.60%
22720 52100 Professional Services 1,076 1,500 1,500 412 1,500 1,000 ‐33.30%
22720 53100 Office Supplies 137 350 350 200 350 350 0.00%
22720 53110 Postage & Shipping 203 325 325 355 325 ‐ ‐100.00%
22720 53115 Publications & Subscriptions 50 125 125 ‐ 125 100 ‐20.00%
22720 53200 Work Supplies 9,664 18,200 18,200 14,586 18,200 18,000 ‐1.10%
22720 53265 Memberships ‐ 150 150 ‐ 150 125 ‐16.70%
HEALTH LAB DETAIL EXPENDITURES
Page 204
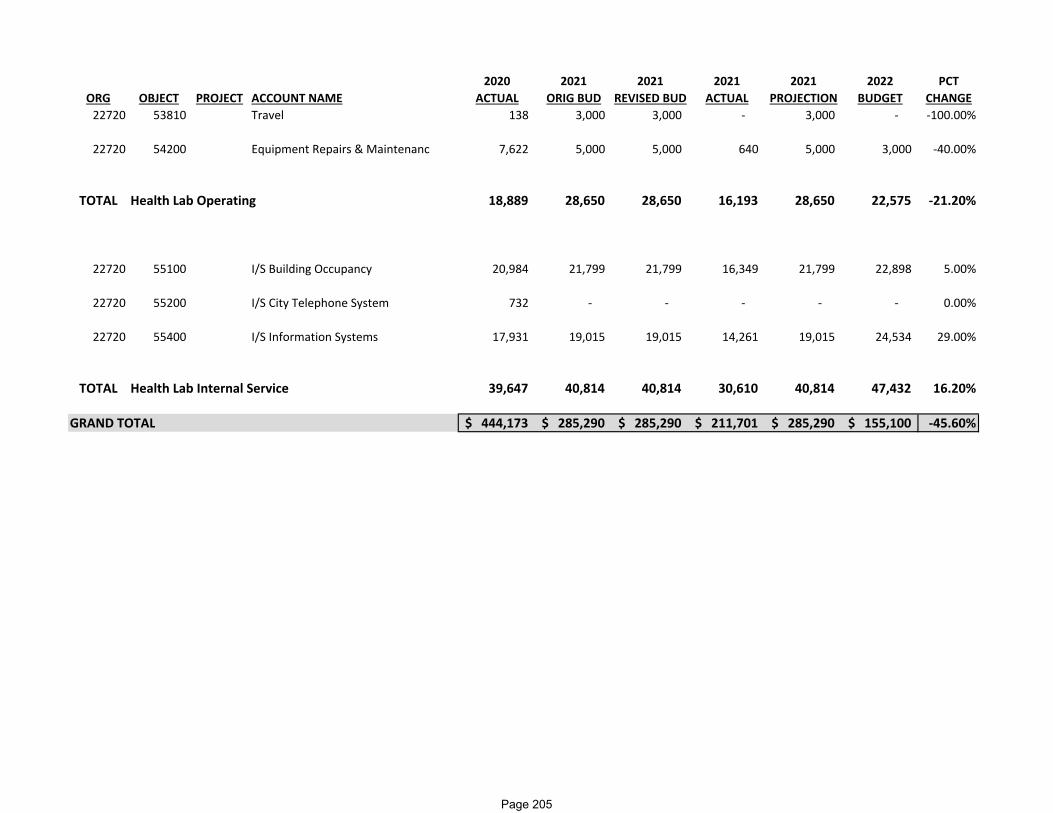
2020 2021 2021 2021 2021 2022 PCTORG OBJECT PROJECT ACCOUNT NAME ACTUAL ORIG BUD REVISED BUD ACTUAL PROJECTION BUDGET CHANGE22720 53810 Travel 138 3,000 3,000 ‐ 3,000 ‐ ‐100.00%
22720 54200 Equipment Repairs & Maintenanc 7,622 5,000 5,000 640 5,000 3,000 ‐40.00%
TOTAL Health Lab Operating 18,889 28,650 28,650 16,193 28,650 22,575 ‐21.20%
22720 55100 I/S Building Occupancy 20,984 21,799 21,799 16,349 21,799 22,898 5.00%
22720 55200 I/S City Telephone System 732 ‐ ‐ ‐ ‐ ‐ 0.00%
22720 55400 I/S Information Systems 17,931 19,015 19,015 14,261 19,015 24,534 29.00%
TOTAL Health Lab Internal Service 39,647 40,814 40,814 30,610 40,814 47,432 16.20%
GRAND TOTAL 444,173$ 285,290$ 285,290$ 211,701$ 285,290$ 155,100$ ‐45.60%
Page 205
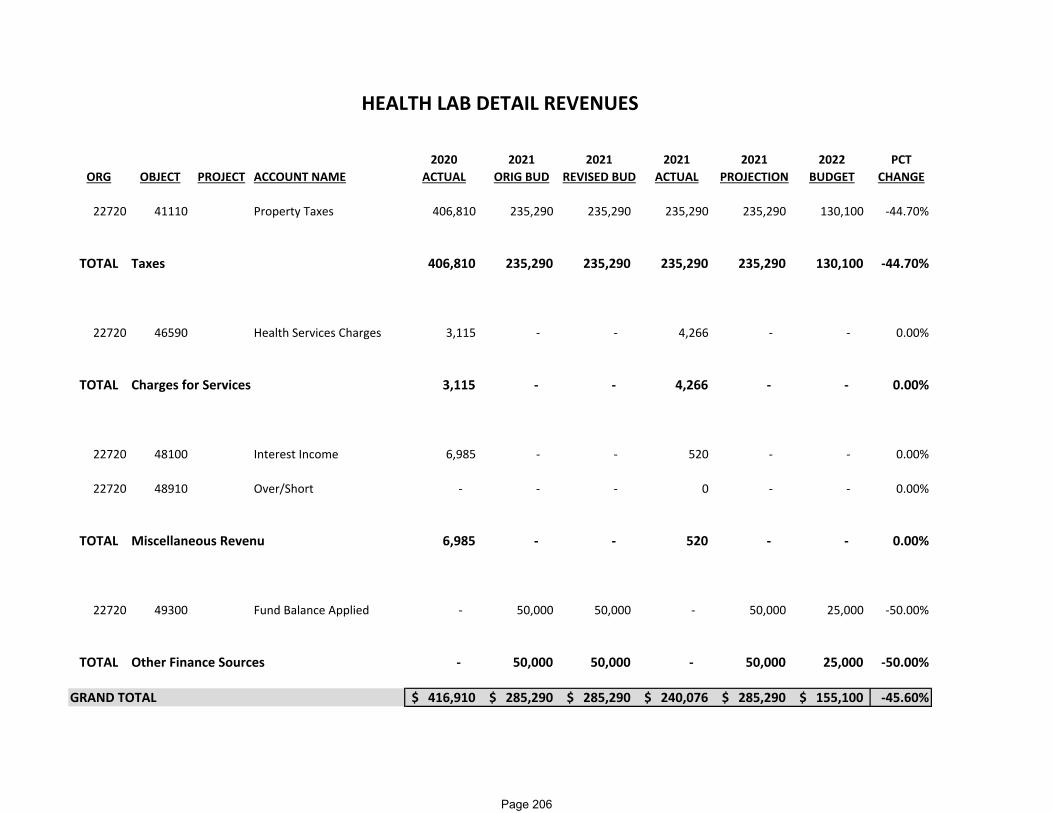
2020 2021 2021 2021 2021 2022 PCTORG OBJECT PROJECT ACCOUNT NAME ACTUAL ORIG BUD REVISED BUD ACTUAL PROJECTION BUDGET CHANGE
22720 41110 Property Taxes 406,810 235,290 235,290 235,290 235,290 130,100 ‐44.70%
TOTAL Taxes 406,810 235,290 235,290 235,290 235,290 130,100 ‐44.70%
22720 46590 Health Services Charges 3,115 ‐ ‐ 4,266 ‐ ‐ 0.00%
TOTAL Charges for Services 3,115 ‐ ‐ 4,266 ‐ ‐ 0.00%
22720 48100 Interest Income 6,985 ‐ ‐ 520 ‐ ‐ 0.00%
22720 48910 Over/Short ‐ ‐ ‐ 0 ‐ ‐ 0.00%
TOTAL Miscellaneous Revenu 6,985 ‐ ‐ 520 ‐ ‐ 0.00%
22720 49300 Fund Balance Applied ‐ 50,000 50,000 ‐ 50,000 25,000 ‐50.00%
TOTAL Other Finance Sources ‐ 50,000 50,000 ‐ 50,000 25,000 ‐50.00%
GRAND TOTAL 416,910$ 285,290$ 285,290$ 240,076$ 285,290$ 155,100$ ‐45.60%
HEALTH LAB DETAIL REVENUES
Page 206

ROOM TAX
Fund: 228-Room Tax Special Revenue Department: 60-Community Development Function: 60-Community Development Orgs: 22860
MISSION
The Mission of the Room Tax Fund is to utilize the Room Tax revenues assessed and collected in the City to support tourism development and promotion in the most cost-effective and impactful means possible. Ultimately to further expand the economic activity and impact generated in the City as a result of visitor spending and over-night lodging stays by individuals and families traveling to Racine from outside the region.
FUNCTION
This fund is used to accounts for all proceeds from Room Taxes received by the City from the Room Tax levied and imposed by the City (at a rate of 8% of gross receipts) against the retail furnishing of rooms and lodging within the city, consistent with Section 66.75, Wis. Stats, as amended and all expenditures including payments to the established tourism entity. Expenditures in the fund must be in accordance with the Room Tax Policy dated 05/01/2018 and are prioritized as follows:
1. To first repay any outstanding debt service on tangible municipal development which supports visitor spending and overnight lodging. 2. With funds remaining, to provide 60% toward identified and budgeted tourism support activities pursued by the City or its agencies. 3. Then, with the remaining 40% of Funds, to solicit and award community non-profit agencies (Supporting Tourism Allocation of Room Tax) grants which
further enhance or promote tourism and visitor spending.
SIGNIFICANT INITIATIVES RECENTLY ACCOMPLISHED
1. Funding for the small business grant program as COVID response 2. Room tax revenue is still down in 2021 due to COVID
2022 STRATEGIC INITIATIVES
Receive room taxes at pre COVID levels to be able to plan for allocation of the funds for 2023
Page 207

This page is intentionally left blank
Page 208

Fund: 228 - Special Revenue Fund-Room TaxFunction: 60 - Community DevelopmentDepartment: 60-City DevelopmentOrg: 22860
2021 20212020 Original Revised 2021 2022
Actual Budget Budget Estimated BudgetExpenditures by Appropriation Unit
2281 Salaries & Fringes -$ -$ -$ -$ -$ 2282 Operating Expenditures 375,434 389,500 409,500 409,500 389,500 2283 Inter-Departmental - - - - - 2284 Capital Outlay - - - - -
Total Expenditures 375,434$ 389,500$ 409,500$ 409,500$ 389,500$
Revenues by CategoryProperty Taxes -$ -$ -$ -$ -$ Other Taxes 234,366 367,000 367,000 397,000 367,000 Intergovernmental Revenues - - - - - Licenses and Permits - - - - - Fines and Forfeitures - - - - - Charges for Services - - - - - Intergovernmental Charges for Services - - - - - Miscellaneous Revenues 103,319 22,500 22,500 22,500 22,500 Other Financing Sources - - - - -
337,685$ 389,500$ 389,500$ 419,500$ 389,500$
ROOM TAXSpecial Revenue Fund Summary of Expenditures and Revenues
Page 209

2020 2021 2021 2021 2021 2022 PCTORG OBJECT PROJECT ACCOUNT NAME ACTUAL ORIG BUD REVISED BUD ACTUAL PROJECTION BUDGET CHANGE
22860 52200 Contracted Services 85,737 76,000 96,000 51,340 96,000 76,000 0.00%
22860 52420 Redevelopment Assistance 148,421 ‐ ‐ ‐ ‐ ‐ 0.00%
22860 52450 Room Tax Allocation 138,676 277,950 277,950 160,623 277,950 277,950 0.00%
22860 52460 Room Tax Grants ‐ 35,550 35,550 ‐ 35,550 35,550 0.00%
22860 53265 Memberships 2,600 ‐ ‐ 2,600 ‐ ‐ 0.00%
TOTAL Room Tax Operating 375,434 389,500 409,500 214,563 409,500 389,500 0.00%
GRAND TOTAL 375,434$ 389,500$ 409,500$ 214,563$ 409,500$ 389,500$ 0.00%
ROOM TAX DETAIL EXPENDITURES
Page 210

2020 2021 2021 2021 2021 2022 PCTORG OBJECT PROJECT ACCOUNT NAME ACTUAL ORIG BUD REVISED BUD ACTUAL PROJECTION BUDGET CHANGE
22860 41210 Room Taxes 174,057 327,000 327,000 210,656 327,000 327,000 0.00%
22860 41211 Airbnb Room Tax 60,309 40,000 40,000 68,649 70,000 40,000 0.00%
TOTAL Taxes 234,366 367,000 367,000 279,305 397,000 367,000 0.00%
22860 48100 Interest Income 3,319 ‐ ‐ 922 ‐ ‐ 0.00%
22860 48500 Donations/Contributions 100,000 22,500 22,500 20,000 22,500 22,500 0.00%
TOTAL Miscellaneous Revenue 103,319 22,500 22,500 20,922 22,500 22,500 0.00%
GRAND TOTAL 337,684$ 389,500$ 389,500$ 300,227$ 419,500$ 389,500$ 0.00%
ROOM TAX DETAIL REVENUES
Page 211

This page is intentionally left blank
Page 212

DEBT SERVICE
Fund: 300-Debt Service Department: 70-Debt Service Function: 65-Debt Service Orgs: 30001
MISSION STATEMENT
Prudently manage the outstanding debt of the City while maintaining a strong debt rating and minimizing the interest paid and the tax levy impact on the City taxpayer.
FUNCTION
Debt service funds are setup to account for the accumulation of resources used for the payment of principal, interest, and fiscal charges associated with all Municipal debt. These debts were incurred for many purposes including, but not limited to, annual capital and infrastructure improvements, equipment purchases, Tax Incremental District improvements. The City typically borrows between $12 and $15 million a year, although that can fluctuate based on the capital needs each year. Interest payments are due bi-annually generally on June 1, and December 1, and principal payments are due annually, generally December 1. Each year with the annual borrowing, the City’s financial advisor provides the Finance Committee Common Council with an overall short and long term debt service plan based on current debt outstanding and assumptions built from the City’s 10 year capital improvement plan.
SIGNIFICANT INITIATIVES RECENTLY ACCOMPLISHED
Issued 2021 Note Anticipation note for capital projects $15,205,000 in September of 2021.
2022 STRATEGIC INITIATIVES
Funding for 2022 includes debt repayment schedule consistent with previous years. Redevelopment projects and revitalization projects may require the City to borrow more in the upcoming years. The City continues to investigate possibilities for refinancing old high interest rate obligations.
SIGNIFICANT FUNDING OR PROGRAM CHANGES IN 2022
None
Page 213

This page is intentionally left blank
Page 214

Fund: 300 - Debt Service FundFunction: 65 - Debt ServiceDepartment: 70-Debt ServiceOrg: 30001
2021 20212020 Original Revised 2021 2022
Actual Budget Budget Estimated BudgetExpenditures by Appropriation Unit
3001 Salaries & Fringes -$ -$ -$ -$ -$ 3002 Operating Expenditures 42,701,276 20,648,440 20,648,440 20,648,440 19,482,040 3003 Inter-Departmental - - - - - 3004 Capital Outlay - - - - -
Total Expenditures 42,701,276$ 20,648,440$ 20,648,440$ 20,648,440$ 19,482,040$
Revenues by CategoryProperty Taxes 16,211,230$ 19,500,000$ 19,500,000$ 19,500,000$ 18,600,000$ Other Taxes - - - - - Intergovernmental Revenues - - - - - Licenses and Permits - - - - - Fines and Forfeitures - - - - - Charges for Services - - - - - Intergovernmental Charges for Services - - - - - Miscellaneous Revenues 239,547 29,127 29,127 29,127 - Other Financing Sources 26,202,010 1,119,313 1,119,313 1,119,313 882,040
42,652,787$ 20,648,440$ 20,648,440$ 20,648,440$ 19,482,040$
DEBT SERVICEDebt Service Fund Summary of Expenditures and Revenues
Page 215
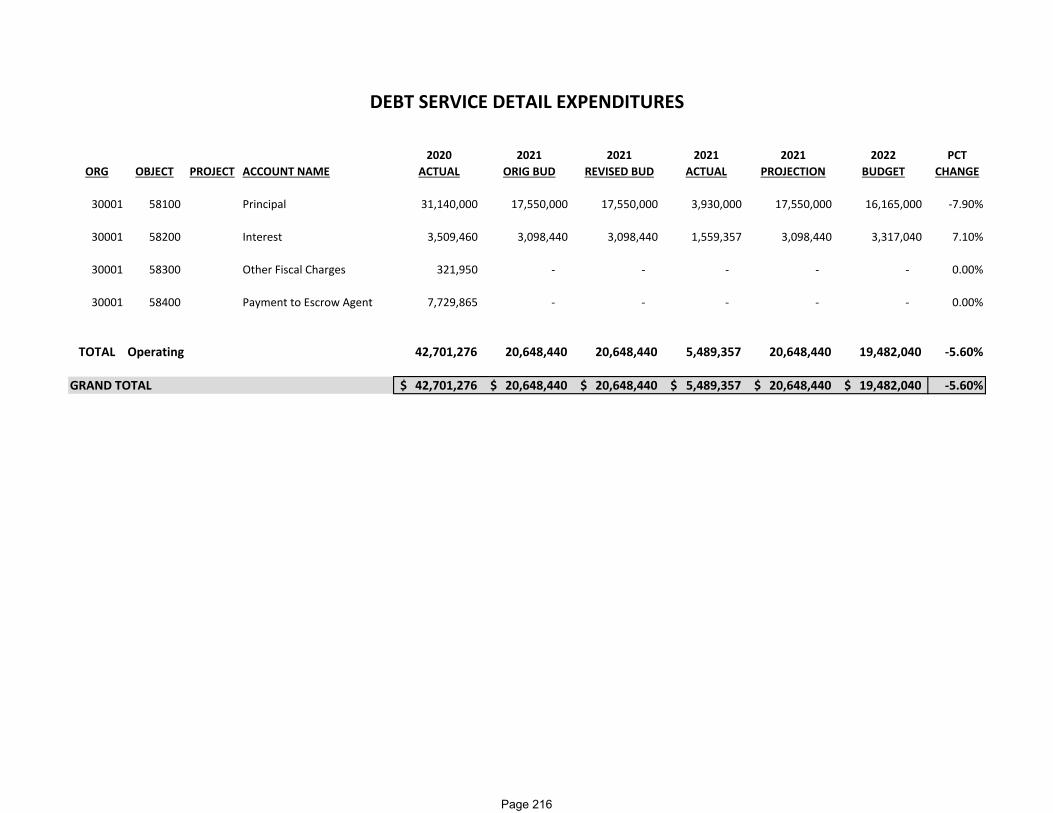
2020 2021 2021 2021 2021 2022 PCTORG OBJECT PROJECT ACCOUNT NAME ACTUAL ORIG BUD REVISED BUD ACTUAL PROJECTION BUDGET CHANGE
30001 58100 Principal 31,140,000 17,550,000 17,550,000 3,930,000 17,550,000 16,165,000 ‐7.90%
30001 58200 Interest 3,509,460 3,098,440 3,098,440 1,559,357 3,098,440 3,317,040 7.10%
30001 58300 Other Fiscal Charges 321,950 ‐ ‐ ‐ ‐ ‐ 0.00%
30001 58400 Payment to Escrow Agent 7,729,865 ‐ ‐ ‐ ‐ ‐ 0.00%
TOTAL Operating 42,701,276 20,648,440 20,648,440 5,489,357 20,648,440 19,482,040 ‐5.60%
GRAND TOTAL 42,701,276$ 20,648,440$ 20,648,440$ 5,489,357$ 20,648,440$ 19,482,040$ ‐5.60%
DEBT SERVICE DETAIL EXPENDITURES
Page 216
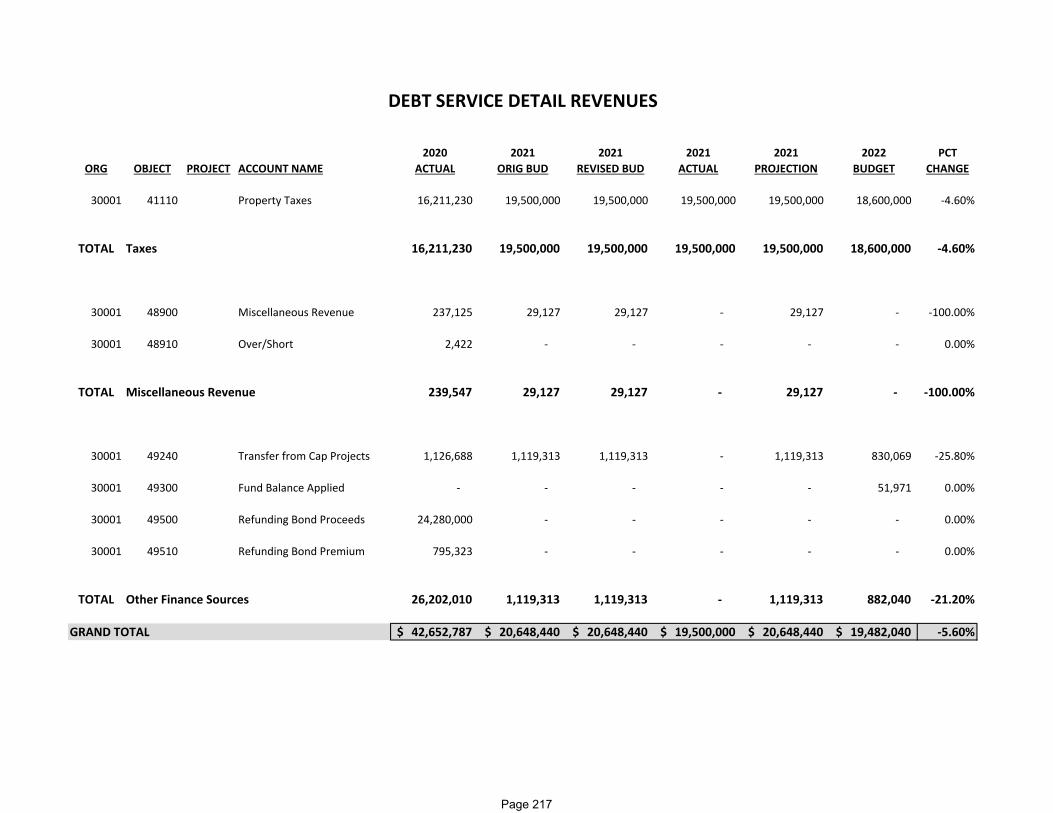
2020 2021 2021 2021 2021 2022 PCTORG OBJECT PROJECT ACCOUNT NAME ACTUAL ORIG BUD REVISED BUD ACTUAL PROJECTION BUDGET CHANGE
30001 41110 Property Taxes 16,211,230 19,500,000 19,500,000 19,500,000 19,500,000 18,600,000 ‐4.60%
TOTAL Taxes 16,211,230 19,500,000 19,500,000 19,500,000 19,500,000 18,600,000 ‐4.60%
30001 48900 Miscellaneous Revenue 237,125 29,127 29,127 ‐ 29,127 ‐ ‐100.00%
30001 48910 Over/Short 2,422 ‐ ‐ ‐ ‐ ‐ 0.00%
TOTAL Miscellaneous Revenue 239,547 29,127 29,127 ‐ 29,127 ‐ ‐100.00%
30001 49240 Transfer from Cap Projects 1,126,688 1,119,313 1,119,313 ‐ 1,119,313 830,069 ‐25.80%
30001 49300 Fund Balance Applied ‐ ‐ ‐ ‐ ‐ 51,971 0.00%
30001 49500 Refunding Bond Proceeds 24,280,000 ‐ ‐ ‐ ‐ ‐ 0.00%
30001 49510 Refunding Bond Premium 795,323 ‐ ‐ ‐ ‐ ‐ 0.00%
TOTAL Other Finance Sources 26,202,010 1,119,313 1,119,313 ‐ 1,119,313 882,040 ‐21.20%
GRAND TOTAL 42,652,787$ 20,648,440$ 20,648,440$ 19,500,000$ 20,648,440$ 19,482,040$ ‐5.60%
DEBT SERVICE DETAIL REVENUES
Page 217

This page is intentionally left blank
Page 218
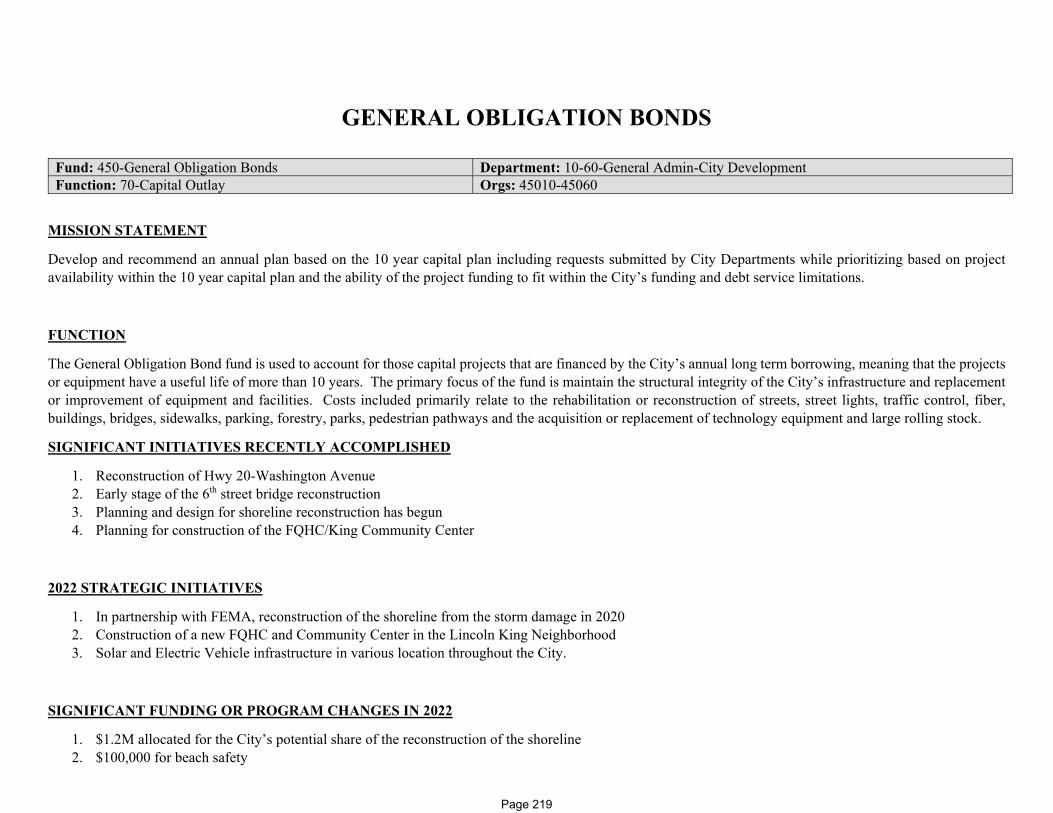
GENERAL OBLIGATION BONDS
Fund: 450-General Obligation Bonds Department: 10-60-General Admin-City Development Function: 70-Capital Outlay Orgs: 45010-45060
MISSION STATEMENT
Develop and recommend an annual plan based on the 10 year capital plan including requests submitted by City Departments while prioritizing based on project availability within the 10 year capital plan and the ability of the project funding to fit within the City’s funding and debt service limitations.
FUNCTION
The General Obligation Bond fund is used to account for those capital projects that are financed by the City’s annual long term borrowing, meaning that the projects or equipment have a useful life of more than 10 years. The primary focus of the fund is maintain the structural integrity of the City’s infrastructure and replacement or improvement of equipment and facilities. Costs included primarily relate to the rehabilitation or reconstruction of streets, street lights, traffic control, fiber, buildings, bridges, sidewalks, parking, forestry, parks, pedestrian pathways and the acquisition or replacement of technology equipment and large rolling stock.
SIGNIFICANT INITIATIVES RECENTLY ACCOMPLISHED
1. Reconstruction of Hwy 20-Washington Avenue 2. Early stage of the 6th street bridge reconstruction 3. Planning and design for shoreline reconstruction has begun 4. Planning for construction of the FQHC/King Community Center
2022 STRATEGIC INITIATIVES
1. In partnership with FEMA, reconstruction of the shoreline from the storm damage in 2020 2. Construction of a new FQHC and Community Center in the Lincoln King Neighborhood 3. Solar and Electric Vehicle infrastructure in various location throughout the City.
SIGNIFICANT FUNDING OR PROGRAM CHANGES IN 2022
1. $1.2M allocated for the City’s potential share of the reconstruction of the shoreline 2. $100,000 for beach safety
Page 219

This page is intentionally left blank
Page 220

Fund: 450 - General Obligation BondsFunction: 70 - Capital OutlayOrg: 45010-45055
2021 20212020 Original Revised 2021 2022
Actual Budget Budget Estimated BudgetExpenditures by Appropriation Unit
Salaries & Fringes 748,669$ 744,059$ 744,059$ 744,059$ 684,175$ Operating Expenditures - - - - - Inter-Departmental - - - - - Capital Outlay 10,672,399 8,765,000 13,286,836 11,447,972 9,111,500 Debt Service - - - - - Other Financing Uses 1,321,605 2,270,000 4,034,814 2,270,000 1,074,200
Total Expenditures 12,742,673$ 11,779,059$ 18,065,709$ 14,462,031$ 10,869,875$
Expenditures by DepartmentGeneral Government 1,434,683$ 2,295,000$ 4,201,665$ 2,295,000$ 1,174,200$ Fire 83,669 205,000 263,681 213,681 125,000 Police 199,085 100,000 150,000 100,000 - Public Works 8,047,436 5,311,059 8,012,297 7,632,387 7,191,175 Parks 2,533,979 3,843,000 5,313,066 4,195,963 2,379,500 Library 443,821 25,000 125,000 25,000 -
Total Expenditures 12,742,673$ 11,779,059$ 18,065,709$ 14,462,031$ 10,869,875$
Revenues by CategoryProperty Taxes -$ -$ -$ -$ -$ Intergovernmental Revenues - - - - - Licenses and Permits - - - - - Fines and Forfeitures - - - - - Charges for Services - - - - - Intergovernmental Charges for Services - - - - - Miscellaneous Revenues 1,318,082 - - - - Other Financing Sources 10,832,577 11,779,059 11,779,059 11,779,059 10,869,875
12,150,659$ 11,779,059$ 11,779,059$ 11,779,059$ 10,869,875$
GENERAL OBLIGATION BONDSCapital Project Fund Summary of Expenditures and Revenues
General Government11% Fire
1%Police0%
Public Works66%
Parks…
Library0%
2022 Expenditures by Department
General Government…
Fire 2%
Police1%
Public Works45%
Parks33%
Library0%
2021 Expenditures by Department
Page 221

ORG OBJ PROJECT DESCRIPTION AMOUNT45010 57300 Office Furniture, Fixtures & Equipment‐Room 207 100,000$ 45010 59600 BUS‐Office Maintenance Garage 35,000 45010 59600 BUS‐Paratransits 37,200 45010 59700 MIS‐Fiber, Cameras, IOT 362,000 45010 59700 MIS‐Smart City Infrastructure 250,000 45010 59700 MIS‐Wireless Access Points 80,000 45010 59700 MIS‐IT Infrastructure Upgrades 310,000
General Administration 1,174,200$
45030 57200 Fire Station 6 ‐ Roof/Floor Repairs 60,000$ 45030 57300 Station #6 Emergency Generator 30,000 45030 57350 Radio System Upgrades 35,000
Fire Department 125,000$
45040 50100 Full Time Salaries 456,306$ 45040 50200 Part Time Salaries 71,458 45040 51010 FICA 40,375 45040 51100 Wisconsin Retirement 33,060 45040 51200 Heatlh Insurance 82,976 45040 57110 Environmental Remediation 25,000 45040 57110 Fuel Site PS 50,000 45040 57110 Transfer Station Study 100,000 45040 57110 11th Street Preparation 100,000 45040 57110 Pavement Management Services 100,000 45040 57110 Lake to Wisconsin Two Way Conversion 100,000 45040 57110 DPW Campus Relocation 150,000
General Obligation Bond FundGeneral Obligation Debt Project Costs
Summarized by Department
Page 222

ORG OBJ PROJECT DESCRIPTION AMOUNT
General Obligation Bond FundGeneral Obligation Debt Project Costs
Summarized by Department
45040 57110 Bike Lane Improvements 25,000 45040 57110 Warning Siren Replacement 30,000 45040 57110 City Wide Building Consolitation 100,000 45040 57200 FCA Fire and Golf Analysis 45,000 45040 57200 City Hall Elevator 12,000 45040 57200 Tyler Domer 20,000 45040 57200 Traffic 5,000 45040 57200 Trades Shop 15,500 45040 57200 Street Mainenance 21,000 45040 57200 Solid Waste Garage 65,000 45040 57200 Safety Building 100,000 45040 57200 MLK Center 30,000 45040 57200 Heritage Museum 10,000 45040 57200 Equipment Maintenance Garage 13,000 45040 57200 City Hall 4,000 45040 57200 Chavez CC 5,000 45040 57200 Central Heating Plant 65,000 45040 57200 City Hall ADA Accommodations South Entrance 30,000 45040 57500 Concrete ‐ Paving ‐ Misc. Locations 200,000 45040 57500 Concrete ‐ Alley Paving 61,500 45040 57500 College Ave Intersections 300,000 45040 57500 Asphalt ‐ Alley Resurfacing 16,000 45040 57500 40003 Goold Main to STH 32 (STP) 280,000 45040 57500 40003 Durand‐Kearney to 32 75,000 45040 57500 40003 N. Main Goold to Melvin (STP‐U) 20,000 45040 57515 Crosswalk Ramps 100,000 45040 57520 Replace City Circuits 65,000 45040 57520 Replace Decorative Poles 100,000 45040 57520 Retrofit Decorative LED Lighting 20,000 45040 57520 Traffic Signal LED Lamp Replacement 15,000
Page 223
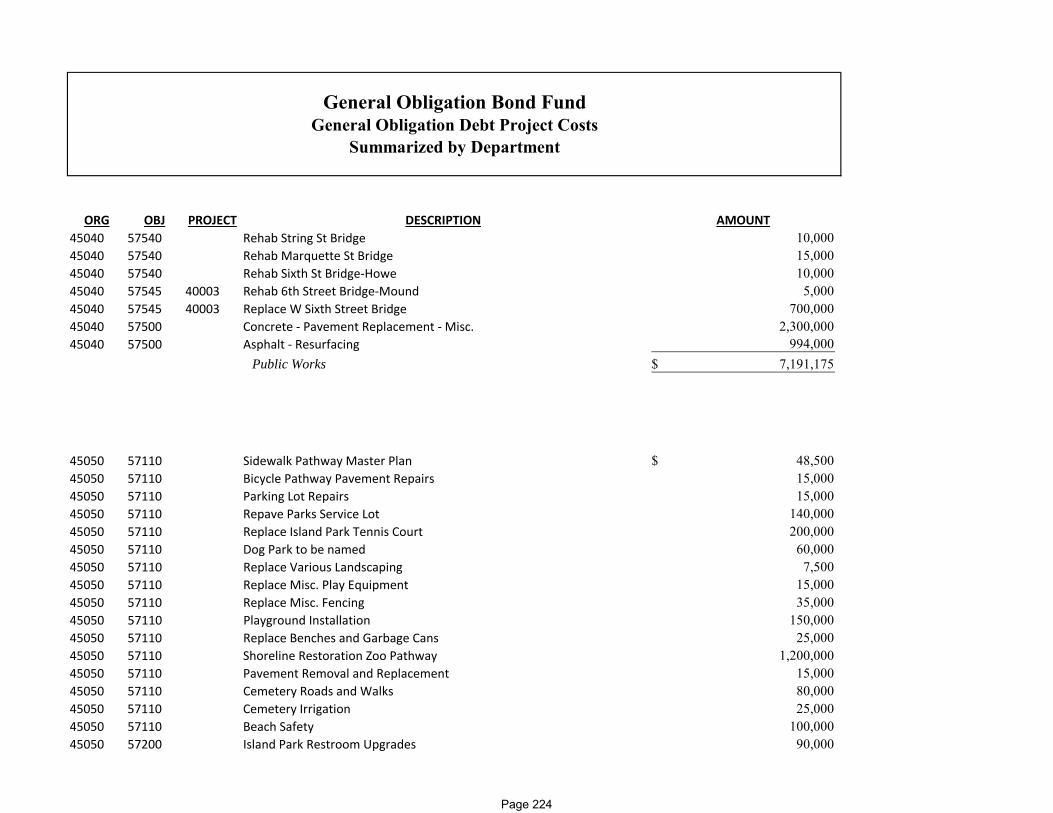
ORG OBJ PROJECT DESCRIPTION AMOUNT
General Obligation Bond FundGeneral Obligation Debt Project Costs
Summarized by Department
45040 57540 Rehab String St Bridge 10,000 45040 57540 Rehab Marquette St Bridge 15,000 45040 57540 Rehab Sixth St Bridge‐Howe 10,000 45040 57545 40003 Rehab 6th Street Bridge‐Mound 5,000 45040 57545 40003 Replace W Sixth Street Bridge 700,000 45040 57500 Concrete ‐ Pavement Replacement ‐ Misc. 2,300,000 45040 57500 Asphalt ‐ Resurfacing 994,000
Public Works 7,191,175$
45050 57110 Sidewalk Pathway Master Plan 48,500$ 45050 57110 Bicycle Pathway Pavement Repairs 15,000 45050 57110 Parking Lot Repairs 15,000 45050 57110 Repave Parks Service Lot 140,000 45050 57110 Replace Island Park Tennis Court 200,000 45050 57110 Dog Park to be named 60,000 45050 57110 Replace Various Landscaping 7,500 45050 57110 Replace Misc. Play Equipment 15,000 45050 57110 Replace Misc. Fencing 35,000 45050 57110 Playground Installation 150,000 45050 57110 Replace Benches and Garbage Cans 25,000 45050 57110 Shoreline Restoration Zoo Pathway 1,200,000 45050 57110 Pavement Removal and Replacement 15,000 45050 57110 Cemetery Roads and Walks 80,000 45050 57110 Cemetery Irrigation 25,000 45050 57110 Beach Safety 100,000 45050 57200 Island Park Restroom Upgrades 90,000
Page 224

ORG OBJ PROJECT DESCRIPTION AMOUNT
General Obligation Bond FundGeneral Obligation Debt Project Costs
Summarized by Department
45050 57200 Solbraa Shelter 58,500 45050 57200 Horlick Athletic Field Improvements 100,000
Parks and Recreation 2,379,500$
Total Project Costs 10,869,875$
General Administration11%
Fire Department$125,000
Public Works$7,191,175
Parks and Recreation$2,379,500
Project Costs by Department
Salary and Fringes 6%
Land Improvements
27%
Buildings 7%
Equipment 1%
Paving and Sidewalks 39%
Street Lighting and Traffic Control 3%
Bridges 7%
Transfer to Other Funds
10%
Costs by Purpose
Page 225

2020 2021 2021 2021 2021 2022 PCTORG OBJECT PROJECT ACCOUNT NAME ACTUAL ORIG BUD REVISED BUD ACTUAL PROJECTION BUDGET CHANGE
45010 56400 Recaptured Funds ‐ ‐ 614,814 ‐ ‐ ‐ 0.00%
45010 57110 Land Improvements 4,929 ‐ ‐ ‐ ‐ ‐ 0.00%
45010 57300 Equipment 108,149 25,000 166,851 63,011 25,000 100,000 300.00%
45010 58300 Other Fiscal Charges 56,357 ‐ ‐ 58,632 ‐ ‐ 0.00%
45010 59600 Transfer to Enterprise 350,449 900,000 1,650,000 ‐ 900,000 72,200 ‐92.00%
45010 59700 Transfer to Internal Service 914,799 1,370,000 1,770,000 15,050 1,370,000 1,002,000 ‐26.90%
TOTAL City Administration 1,434,683 2,295,000 4,201,665 136,694 2,295,000 1,174,200 ‐48.80%
45030 57200 Fire‐Building Improvements 83,669 30,000 38,681 37,231 38,681 60,000 100.00%
45030 57300 Equipment ‐ 50,000 50,000 42,504 50,000 30,000 ‐40.00%
45030 57310 Fire‐Equipment‐Vehicles ‐ ‐ 50,000 ‐ ‐ ‐ 0.00%
45030 57350 Fire ‐Communications Equipment ‐ 125,000 125,000 125,000 125,000 35,000 ‐72.00%
TOTAL Fire Department 83,669 205,000 263,681 204,736 213,681 125,000 ‐39.00%
45031 57200 Pd‐Building Improvements ‐ 100,000 100,000 1,485 100,000 ‐ ‐100.00%
45031 57300 Pd‐Equipment 15,312 ‐ ‐ ‐ ‐ ‐ 0.00%
45031 57310 Pd‐Equipment‐Vehicles ‐ ‐ 50,000 ‐ ‐ ‐ 0.00%
BONDED CAPITAL PROJECTS DETAIL EXPENDITURES
Page 226

2020 2021 2021 2021 2021 2022 PCTORG OBJECT PROJECT ACCOUNT NAME ACTUAL ORIG BUD REVISED BUD ACTUAL PROJECTION BUDGET CHANGE45031 57350 Pd‐Communications Equipment 183,773 ‐ ‐ ‐ ‐ ‐ 0.00%
TOTAL Police Department 199,085 100,000 150,000 1,485 100,000 ‐ ‐100.00%
45040 50100 Full Time Salaries 461,761 478,339 478,339 344,776 478,339 456,306 ‐4.60%
45040 50200 Part Time Salaries 7,284 73,545 73,545 6,328 73,545 71,458 ‐2.80%
45040 50300 Overtime 2,635 ‐ ‐ ‐ ‐ ‐ 0.00%
45040 51010 FICA 34,408 42,220 42,220 25,387 42,220 40,375 ‐4.40%
45040 51100 WRS 31,401 33,943 33,943 23,264 33,943 33,060 ‐2.60%
45040 51200 Health Care 124,254 109,512 109,512 82,134 109,512 82,976 ‐24.20%
45040 51810 Mileage ‐ 6,500 6,500 2,777 6,500 ‐ ‐100.00%
45040 57110 Dpw‐Land Improvements 167,015 145,000 784,253 164,386 189,965 780,000 437.90%
45040 57200 Dpw‐Building Improvements 1,512,283 1,805,000 2,409,378 1,630,286 2,162,811 440,500 ‐75.60%
45040 57300 Dpw‐Equipment 48,900 ‐ 16,100 16,100 10,000 ‐ 0.00%
45040 57500 Dpw‐Paving 3,057,054 372,000 414,373 510,744 442,904 3,871,500 940.70%
45040 57500 40003 Paving 1,959,209 1,002,000 1,993,346 2,005,101 2,458,654 375,000 ‐62.60%
45040 57510 Dpw‐Curb and Gutter 8,568 ‐ ‐ ‐ ‐ ‐ 0.00%
45040 57515 Dpw‐Sidewalks 163,054 68,000 90,132 299,334 206,954 100,000 47.10%
45040 57520 Dpw‐Street Lighting 143,125 220,000 449,114 260,018 349,114 200,000 ‐9.10%
45040 57530 Dpw‐Traffic Control 275,729 330,000 408,894 220,456 408,894 ‐ ‐100.00%
45040 57540 Dpw‐Bridges‐Local ‐ 25,000 25,000 25,000 25,000 35,000 40.00%
45040 57545 40003 Bridges‐State 44,949 600,000 616,909 610,899 606,909 705,000 17.50%
Page 227
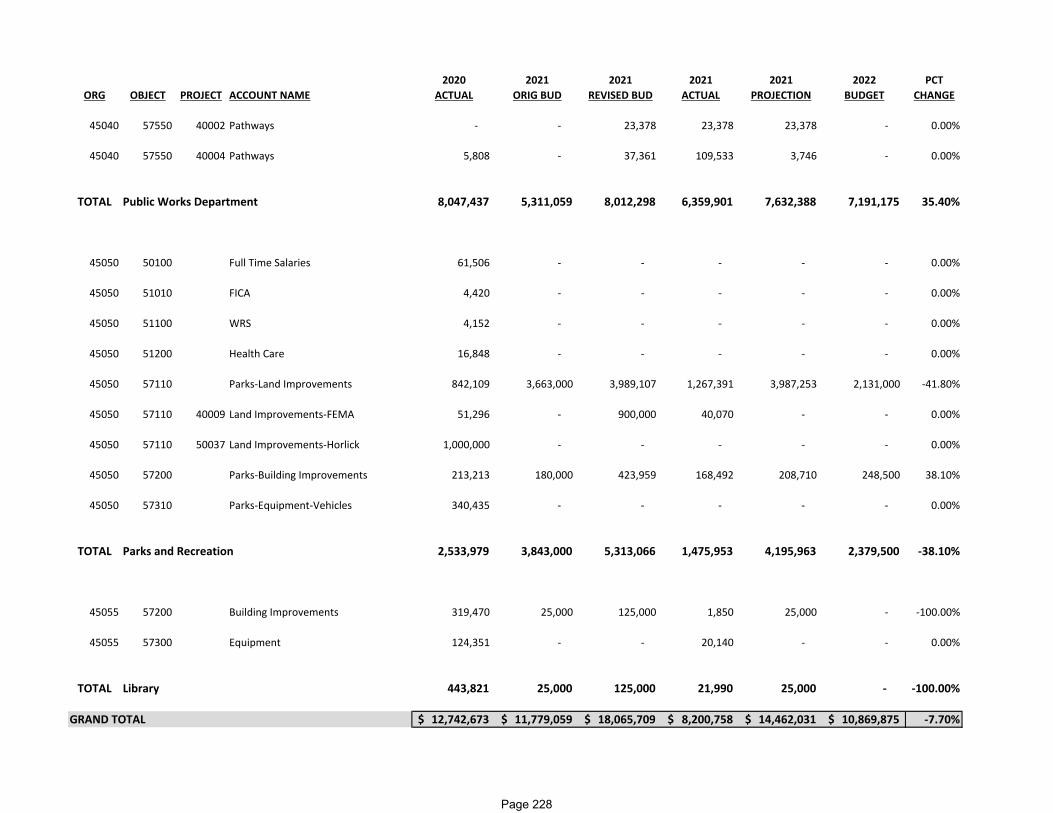
2020 2021 2021 2021 2021 2022 PCTORG OBJECT PROJECT ACCOUNT NAME ACTUAL ORIG BUD REVISED BUD ACTUAL PROJECTION BUDGET CHANGE
45040 57550 40002 Pathways ‐ ‐ 23,378 23,378 23,378 ‐ 0.00%
45040 57550 40004 Pathways 5,808 ‐ 37,361 109,533 3,746 ‐ 0.00%
TOTAL Public Works Department 8,047,437 5,311,059 8,012,298 6,359,901 7,632,388 7,191,175 35.40%
45050 50100 Full Time Salaries 61,506 ‐ ‐ ‐ ‐ ‐ 0.00%
45050 51010 FICA 4,420 ‐ ‐ ‐ ‐ ‐ 0.00%
45050 51100 WRS 4,152 ‐ ‐ ‐ ‐ ‐ 0.00%
45050 51200 Health Care 16,848 ‐ ‐ ‐ ‐ ‐ 0.00%
45050 57110 Parks‐Land Improvements 842,109 3,663,000 3,989,107 1,267,391 3,987,253 2,131,000 ‐41.80%
45050 57110 40009 Land Improvements‐FEMA 51,296 ‐ 900,000 40,070 ‐ ‐ 0.00%
45050 57110 50037 Land Improvements‐Horlick 1,000,000 ‐ ‐ ‐ ‐ ‐ 0.00%
45050 57200 Parks‐Building Improvements 213,213 180,000 423,959 168,492 208,710 248,500 38.10%
45050 57310 Parks‐Equipment‐Vehicles 340,435 ‐ ‐ ‐ ‐ ‐ 0.00%
TOTAL Parks and Recreation 2,533,979 3,843,000 5,313,066 1,475,953 4,195,963 2,379,500 ‐38.10%
45055 57200 Building Improvements 319,470 25,000 125,000 1,850 25,000 ‐ ‐100.00%
45055 57300 Equipment 124,351 ‐ ‐ 20,140 ‐ ‐ 0.00%
TOTAL Library 443,821 25,000 125,000 21,990 25,000 ‐ ‐100.00%
GRAND TOTAL 12,742,673$ 11,779,059$ 18,065,709$ 8,200,758$ 14,462,031$ 10,869,875$ ‐7.70%
Page 228

2020 2021 2021 2021 2021 2022 PCTORG OBJECT PROJECT ACCOUNT NAME ACTUAL ORIG BUD REVISED BUD ACTUAL PROJECTION BUDGET CHANGE
45010 48100 Interest Income 118,082 ‐ ‐ 27,912 ‐ ‐ 0.00%
45050 48500 50037 Donations/Contributions‐Horlic 1,200,000 ‐ ‐ ‐ ‐ ‐ 0.00%
TOTAL Miscellaneous Revenue 1,318,082 ‐ ‐ 27,912 ‐ ‐ 0.00%
45010 49100 Bond Proceeds 10,775,500 11,779,059 11,779,059 11,783,300 11,779,059 10,869,875 ‐7.70%
45010 49110 Bond Premium 57,077 ‐ ‐ 62,645 ‐ ‐ 0.00%
TOTAL Other Finance Sources 10,832,577 11,779,059 11,779,059 11,845,945 11,779,059 10,869,875 ‐7.70%
GRAND TOTAL 12,150,659$ 11,779,059$ 11,779,059$ 11,873,856$ 11,779,059$ 10,869,875$ ‐7.70%
BONDED CAPITAL PROJECTS DETAIL REVENUES
Page 229

This page is intentionally left blank
Page 230

EQUIPMENT REPLACEMENT FUND
Fund: 451-Equipment Replacement Fund Department: 10-60-General Admin-City Development Function: 70-Capital Outlay Orgs: 45110-45160
MISSION STATEMENT
Develop and recommend an equipment replacement plan based on the 10 year capital plan including requests submitted by City Departments while prioritizing based on the ability of the funding to fit within the City’s funding and debt service limitations.
FUNCTION
The Equipment Replacement fund is used to account for those items that have useful lives of less than 10 years and are financed by the City’s annual short term borrowing The primary focus of the fund is maintain a consistent replacement schedule for various equipment within the City in attempts to stabilize maintenance costs. Costs included relate to the replacement or purchase of small equipment, vehicles, and minor land and building improvements. Small equipment includes items like camera’s, laptops, computers and tasers. Vehicles include wheel loaders, rescue squads, dump trucks and pickups. Minor land and building improvements include planting, tree felling, lighting, painting, carpet, cabinets and office equipment.
SIGNIFICANT INITIATIVES RECENTLY ACCOMPLISHED
Close to two thirds of 2021 funding was used for Police, Fire, DPW and Parks vehicles and heavy equipment, supplying our employees with the necessary tools required to carry out their assigned duties.
2022 STRATEGIC INITIATIVES
2022 spending mirrors the same types of expenditures seen in prior years with most of the funding going to the Police Department and Information Technology.
SIGNIFICANT FUNDING OR PROGRAM CHANGES IN 2022
$450,000 in the Police Department in 2022 to begin the replacement of body cameras, tasers, dash camera’s. This is a multi year commitment that is reflected in the 10 year plan.
Page 231

This page is intentionally left blank
Page 232

Fund: 451 - Equipment Replacement FundFunction: 70 - Capital OutlayOrg: 45110-45155
2021 20212020 Original Revised 2021 2022
Actual Budget Budget Estimated BudgetExpenditures by Appropriation Unit
Salaries & Fringes -$ -$ -$ -$ -$ Operating Expenditures 57,840 - - - - Inter-Departmental - - - - - Capital Outlay 3,164,667 3,240,200 4,290,562 3,890,865 3,101,000 Debt Service - - - - - Other Financing Uses 515,250 320,000 520,000 320,000 829,000 Total Expenditures 3,737,757$ 3,560,200$ 4,810,562$ 4,210,865$ 3,930,000$
Expenditures by Department10 General Government 559,233$ 320,000$ 520,000$ 320,000$ 869,000$ 30 Fire 224,646 375,000 780,699 778,199 209,500 31 Police 354,608 868,000 1,203,596 953,596 1,045,000 40 Public Works 2,238,377 1,378,000 1,444,415 1,444,415 1,329,000 50 Parks 360,893 619,200 861,852 714,655 477,500 55 Library - - - - -
Total Expenditures 3,737,757$ 3,560,200$ 4,810,562$ 4,210,865$ 3,930,000$
Revenues by CategoryProperty Taxes -$ -$ -$ -$ -$ Intergovernmental Revenues - - - - - Licenses and Permits - - - - - Fines and Forfeitures - - - - - Charges for Services - - - - - Intergovernmental Charges for Services - - - - - Miscellaneous Revenues 190,486 138,500 138,500 138,500 118,500 Other Financing Sources 3,529,500 3,421,700 3,421,700 3,421,700 3,811,500
3,719,986$ 3,560,200$ 3,560,200$ 3,560,200$ 3,930,000$
EQUIPMENT REPLACEMENT FUNDCapital Project Fund Summary of Expenditures and Revenues
Page 233

ORG OBJ PROJECT DESCRIPTION AMOUNT
45110 57800 Aerial Photography 40,000$ 45110 59700 Small Equipment 40,000 45110 59700 PC Replacements 150,000 45110 59700 Switch Replacement 60,000 45110 59700 Computer Hardware 80,000 45110 59700 Computer Software 320,000 45110 59700 Budget Transparency Software 50,000 45110 59700 Plan Review Software 65,000 45110 59700 Help Desk Solution 14,000 45110 59700 Contract Management Software 50,000
General Administration 869,000$
45130 57300 Communications Equipment Batteres 25,000$ 45130 57300 Defibulators 85,000 45130 57300 Replacement SCBA Tanks 25,000 45130 57300 Tomar Preemption Emitters 10,000 45130 57300 Surface Cold Water Rescue Suites 4,500 45130 57300 Underwater Rescue Dry Suits 10,000 45130 57310 Safety Officer Care 50,000
Fire Department 209,500$
45131 57300 MDC Replacement 40,000$ 45131 57300 Staff Officer Locker Rooms 65,000 45131 57300 Solar Powered Speed Signs 40,000 45131 57300 AXON Products Body Cams, Tasers, Dash Cams 450,000 45131 57310 Police Vehicles 450,000
Police Department 1,045,000$
EQUIPMENT REPLACEMENT FUNDSummarized by Department
Page 234
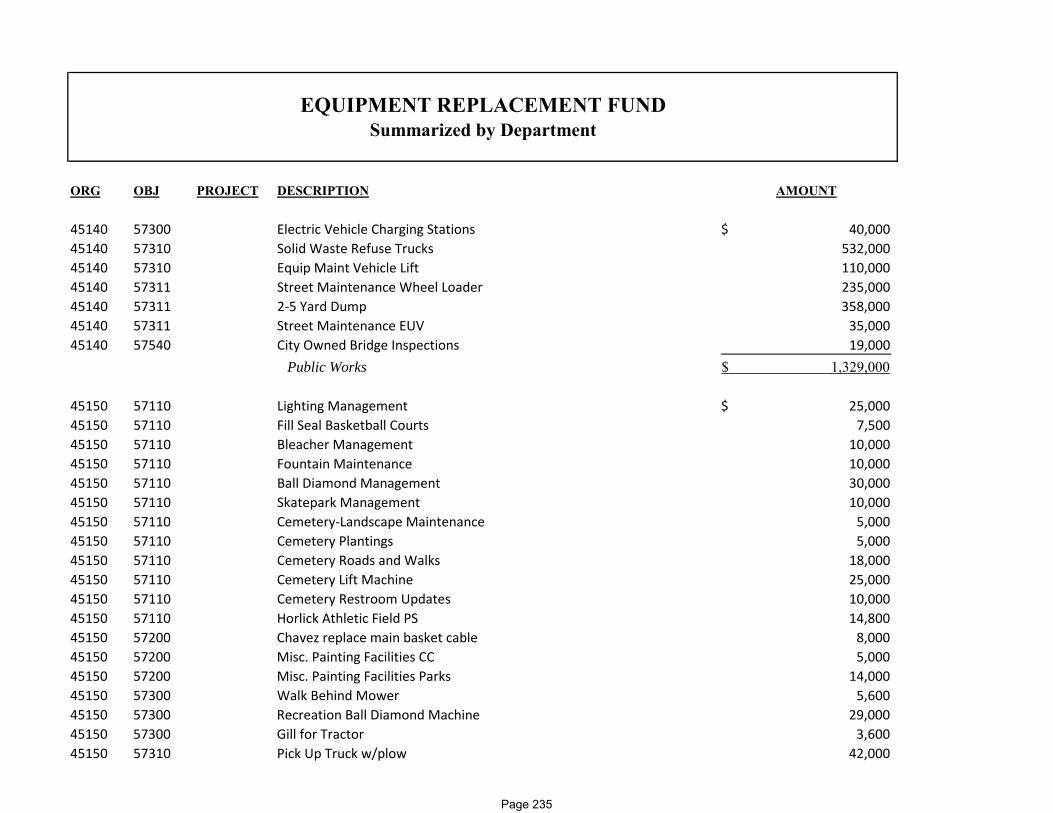
ORG OBJ PROJECT DESCRIPTION AMOUNT
EQUIPMENT REPLACEMENT FUNDSummarized by Department
45140 57300 Electric Vehicle Charging Stations 40,000$ 45140 57310 Solid Waste Refuse Trucks 532,000 45140 57310 Equip Maint Vehicle Lift 110,000 45140 57311 Street Maintenance Wheel Loader 235,000 45140 57311 2‐5 Yard Dump 358,000 45140 57311 Street Maintenance EUV 35,000 45140 57540 City Owned Bridge Inspections 19,000
Public Works 1,329,000$
45150 57110 Lighting Management 25,000$ 45150 57110 Fill Seal Basketball Courts 7,500 45150 57110 Bleacher Management 10,000 45150 57110 Fountain Maintenance 10,000 45150 57110 Ball Diamond Management 30,000 45150 57110 Skatepark Management 10,000 45150 57110 Cemetery‐Landscape Maintenance 5,000 45150 57110 Cemetery Plantings 5,000 45150 57110 Cemetery Roads and Walks 18,000 45150 57110 Cemetery Lift Machine 25,000 45150 57110 Cemetery Restroom Updates 10,000 45150 57110 Horlick Athletic Field PS 14,800 45150 57200 Chavez replace main basket cable 8,000 45150 57200 Misc. Painting Facilities CC 5,000 45150 57200 Misc. Painting Facilities Parks 14,000 45150 57300 Walk Behind Mower 5,600 45150 57300 Recreation Ball Diamond Machine 29,000 45150 57300 Gill for Tractor 3,600 45150 57310 Pick Up Truck w/plow 42,000
Page 235
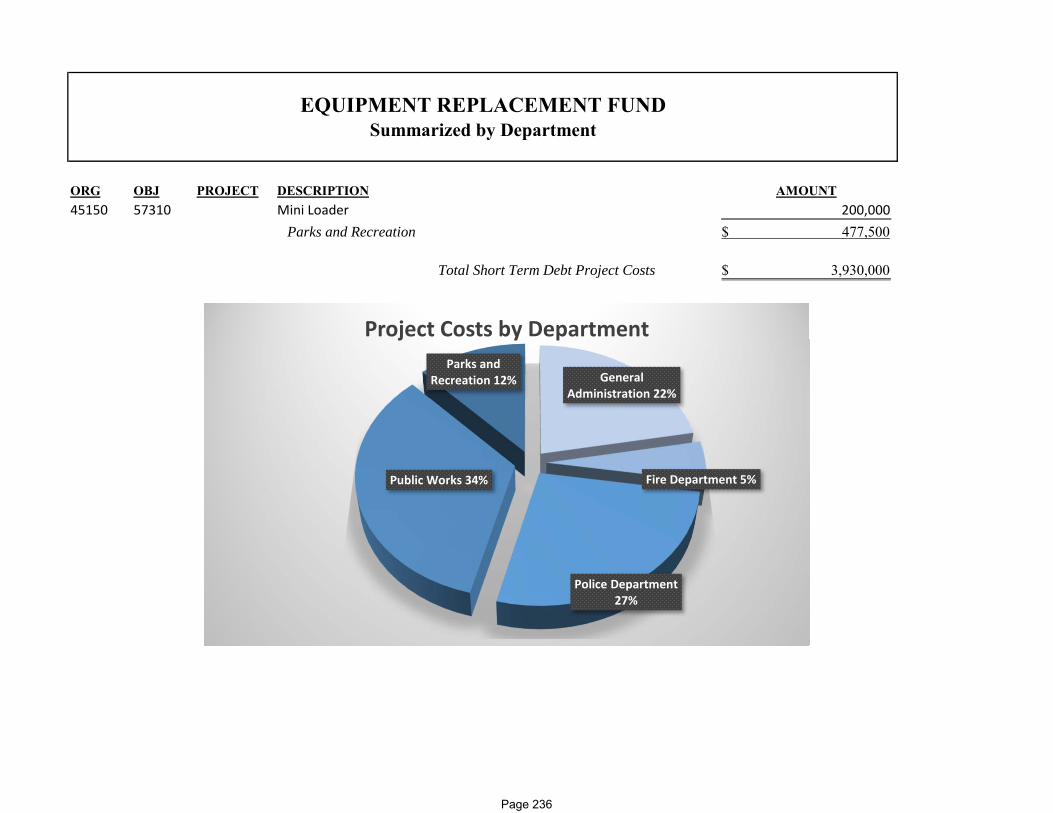
ORG OBJ PROJECT DESCRIPTION AMOUNT
EQUIPMENT REPLACEMENT FUNDSummarized by Department
45150 57310 Mini Loader 200,000 Parks and Recreation 477,500$
Total Short Term Debt Project Costs 3,930,000$
General Administration 22%
Fire Department 5%
Police Department27%
Public Works 34%
Parks and Recreation 12%
Project Costs by Department
Page 236

2020 2021 2021 2021 2021 2022 PCTORG OBJECT PROJECT ACCOUNT NAME ACTUAL ORIG BUD REVISED BUD ACTUAL PROJECTION BUDGET CHANGE
45110 57300 Equipment 31,800 ‐ ‐ ‐ ‐ ‐ 0.00%
45110 57300 10007 Equipment‐COVID RFID 12,183 ‐ ‐ ‐ ‐ ‐ 0.00%
45110 57800 Computer Software ‐ ‐ ‐ ‐ ‐ 40,000 0.00%
45110 59700 Transfer to Internal Service 515,250 320,000 520,000 ‐ 320,000 829,000 159.10%
TOTAL City Administration 559,233 320,000 520,000 ‐ 320,000 869,000 171.60%
45130 57210 Building Improvements‐PS ‐ 15,000 15,000 10,724 15,000 ‐ ‐100.00%
45130 57300 Fire‐Equipment 220,313 310,000 319,018 253,702 319,018 159,500 ‐48.50%
45130 57310 Fire‐Equipment‐Vehicles ‐ 50,000 444,181 444,181 444,181 50,000 0.00%
45130 57350 Fire‐Communications Equipment 4,334 ‐ 2,500 1,484 ‐ ‐ 0.00%
TOTAL Fire Department 224,646 375,000 780,699 710,091 778,199 209,500 ‐44.10%
45131 57300 Pd‐Equipment 209,691 231,000 231,000 142,981 231,000 595,000 157.60%
45131 57310 Pd‐Equipment‐Vehicles 144,917 450,000 785,596 566,375 535,596 450,000 0.00%
45131 57355 Pd‐Computer Hardware ‐ 187,000 187,000 169,957 187,000 ‐ ‐100.00%
TOTAL Police Department 354,608 868,000 1,203,596 879,313 953,596 1,045,000 20.40%
EQUIPMENT REPLACEMENT DETAIL EXPENDITURES
Page 237

2020 2021 2021 2021 2021 2022 PCTORG OBJECT PROJECT ACCOUNT NAME ACTUAL ORIG BUD REVISED BUD ACTUAL PROJECTION BUDGET CHANGE
45140 52100 Dpw‐Professional Services 1,875 ‐ ‐ ‐ ‐ ‐ 0.00%
45140 52100 40009 Professional Services‐FEMA 55,965 ‐ ‐ ‐ ‐ ‐ 0.00%
45140 57300 Dpw‐Equipment ‐ 80,000 80,000 80,201 80,000 40,000 ‐50.00%
45140 57301 Dpw‐Equipment‐Highway 206,399 1,000 1,000 ‐ 1,000 ‐ ‐100.00%
45140 57310 Dpw‐Equipment‐Vehicles 1,061,596 560,000 535,000 479,943 535,000 642,000 14.60%
45140 57311 Dpw‐Equipment Vehicles‐Highway 877,084 737,000 828,415 791,335 828,415 628,000 ‐14.80%
45140 57540 Bridges‐Local 22,205 ‐ ‐ ‐ ‐ 19,000 0.00%
45140 57545 40003 Bridges‐State 13,253 ‐ ‐ ‐ ‐ ‐ 0.00%
TOTAL Public Works Department 2,238,377 1,378,000 1,444,415 1,351,479 1,444,415 1,329,000 ‐3.60%
45150 57110 Parks‐Land Improvements 50,962 111,500 266,148 83,858 141,148 170,300 52.70%
45150 57200 Parks‐Building Improvements 1,728 50,000 50,000 14,997 50,000 27,000 ‐46.00%
45150 57300 Parks‐Equipment 54,450 217,700 217,700 190,272 217,700 38,200 ‐82.50%
45150 57310 Parks‐Equipment‐Vehicles 253,753 240,000 328,004 280,376 305,807 242,000 0.80%
TOTAL Parks and Recreation 360,893 619,200 861,852 569,503 714,655 477,500 ‐22.90%
GRAND TOTAL 3,737,757$ 3,560,200$ 4,810,562$ 3,510,386$ 4,210,865$ 3,930,000$ 10.40%
Page 238

2020 2021 2021 2021 2021 2022 PCTORG OBJECT PROJECT ACCOUNT NAME ACTUAL ORIG BUD REVISED BUD ACTUAL PROJECTION BUDGET CHANGE
45110 48100 Interest Income 6,814 ‐ ‐ 3,430 ‐ ‐ 0.00%
45130 48309 Sale of Property‐Other‐Fire 2,405 ‐ ‐ 404 ‐ ‐ 0.00%
45131 48301 Sale of Property‐PD 30,585 50,000 50,000 50,178 50,000 50,000 0.00%
45140 48303 Sale of Property‐DPW 92,519 88,500 88,500 16,398 88,500 50,500 ‐42.90%
45140 48305 Sale of Property‐Solid Waste ‐ ‐ ‐ ‐ ‐ 18,000 0.00%
45150 48309 Sale of Property‐Other‐Parks 58,163 ‐ ‐ 61,893 ‐ ‐ 0.00%
TOTAL Miscellaneous Revenue 190,486 138,500 138,500 132,302 138,500 118,500 ‐14.40%
45110 49100 Bond Proceeds 3,529,500 3,421,700 3,421,700 3,421,700 3,421,700 3,811,500 11.40%
TOTAL Other Finance Sources 3,529,500 3,421,700 3,421,700 3,421,700 3,421,700 3,811,500 11.40%
GRAND TOTAL 3,719,986$ 3,560,200$ 3,560,200$ 3,554,002$ 3,560,200$ 3,930,000$ 10.40%
EQUIPMENT REPLACEMENT DETAIL REVENUES
Page 239

This page is intentionally left blank
Page 240

INTERGOVERNMENTAL REVENUE SHARING
Fund: 452-Intergovernmental Revenue Sharing Department: 60-Community Development Function: 60-Community Development Orgs: 45260
MISSION STATEMENT
Intergovernmental Revenue Sharing Funds are intended to be used to supplement and foster economic development in the City of Racine.
FUNCTION
Fund accounts for the revenues and expenditures associated with the Revenue Sharing portion of the Racine Area Intergovernmental Sanitary Sewer Service, Revenue Sharing, Cooperating and Settlement Agreement. Revenues are mainly received from Caledonia, Mt. Pleasant and Sturtevant.
SIGNIFICANT INITIATIVES RECENTLY ACCOMPLISHED
Funding assists with all of the developments throughout the City including Horlick (Belle City Square), Porters, and Hovde.
2021 STRATEGIC INITIATIVES
The City is on the cusp of several potential development projects. Individual projects and circumstances may provide opportunities for these funds to be used in beneficial means to the City.
SIGNIFICANT FUNDING OR PROGRAM CHANGES IN 2022
None
Page 241

This page is intentionally left blank
Page 242

Fund: 452 - Intergovernmental Revenue SharingFunction: 70 - Capital OutlayOrg: 45260
2021 20212020 Original Revised 2021 2022
Actual Budget Budget Estimated BudgetExpenditures by Appropriation Unit
Salaries & Fringes -$ -$ -$ -$ -$ Operating Expenditures 1,255,302 3,145,120 3,442,346 3,446,117 2,165,045 Inter-Departmental - - - - - Capital Outlay 137,718 750,000 750,000 750,000 - Debt Service - - - - - Other Financing Uses 20,000 222,500 222,500 222,500 122,500 Total Expenditures 1,413,020$ 4,117,620$ 4,414,846$ 4,418,617$ 2,287,545$
Revenues by CategoryProperty Taxes -$ -$ -$ -$ -$ Intergovernmental Revenues 2,038,590 2,027,562 2,027,562 2,027,562 2,187,545 Licenses and Permits - - - - - Fines and Forfeitures - - - - - Charges for Services - - - - - Intergovernmental Charges for Services 749,149 - - - - Miscellaneous Revenues 213,519 63,300 63,300 63,300 100,000 Other Financing Sources - 2,026,758 2,026,758 2,026,758 -
3,001,258$ 4,117,620$ 4,117,620$ 4,117,620$ 2,287,545$
INTERGOVERNMENTAL REVENUE SHARINGCapital Project Fund Summary of Expenditures and Revenues
Page 243
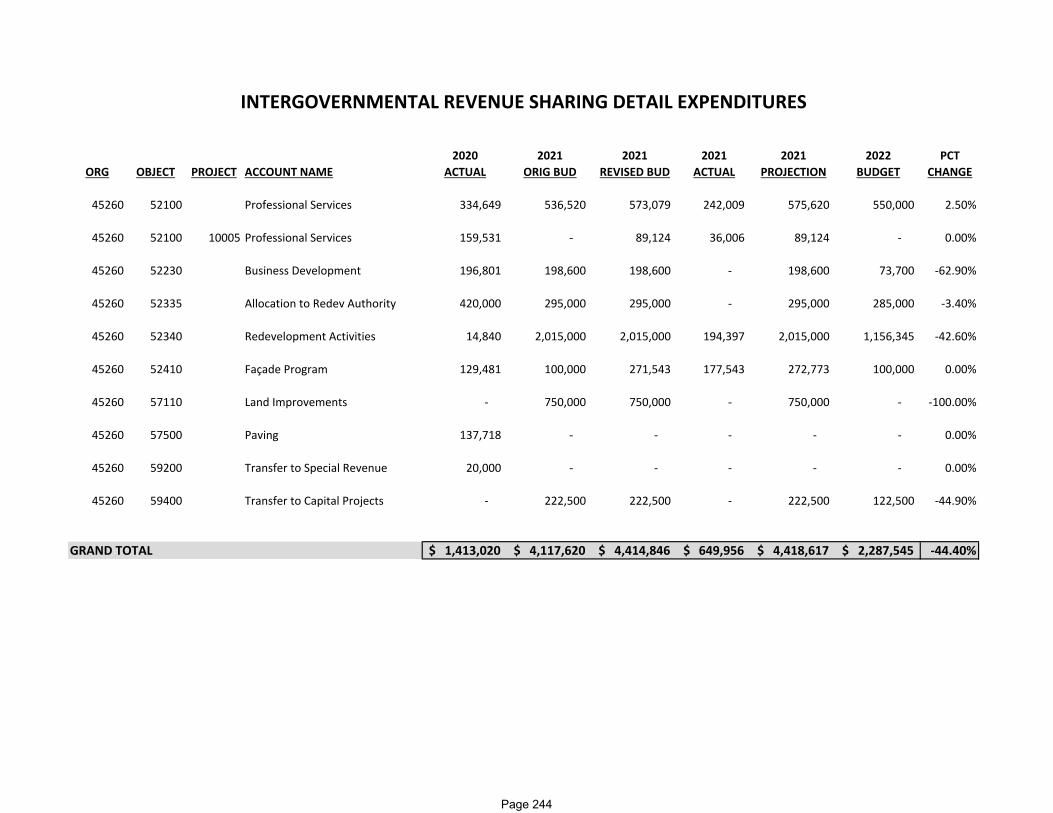
2020 2021 2021 2021 2021 2022 PCTORG OBJECT PROJECT ACCOUNT NAME ACTUAL ORIG BUD REVISED BUD ACTUAL PROJECTION BUDGET CHANGE
45260 52100 Professional Services 334,649 536,520 573,079 242,009 575,620 550,000 2.50%
45260 52100 10005 Professional Services 159,531 ‐ 89,124 36,006 89,124 ‐ 0.00%
45260 52230 Business Development 196,801 198,600 198,600 ‐ 198,600 73,700 ‐62.90%
45260 52335 Allocation to Redev Authority 420,000 295,000 295,000 ‐ 295,000 285,000 ‐3.40%
45260 52340 Redevelopment Activities 14,840 2,015,000 2,015,000 194,397 2,015,000 1,156,345 ‐42.60%
45260 52410 Façade Program 129,481 100,000 271,543 177,543 272,773 100,000 0.00%
45260 57110 Land Improvements ‐ 750,000 750,000 ‐ 750,000 ‐ ‐100.00%
45260 57500 Paving 137,718 ‐ ‐ ‐ ‐ ‐ 0.00%
45260 59200 Transfer to Special Revenue 20,000 ‐ ‐ ‐ ‐ ‐ 0.00%
45260 59400 Transfer to Capital Projects ‐ 222,500 222,500 ‐ 222,500 122,500 ‐44.90%
GRAND TOTAL 1,413,020$ 4,117,620$ 4,414,846$ 649,956$ 4,418,617$ 2,287,545$ ‐44.40%
INTERGOVERNMENTAL REVENUE SHARING DETAIL EXPENDITURES
Page 244

2020 2021 2021 2021 2021 2022 PCTORG OBJECT PROJECT ACCOUNT NAME ACTUAL ORIG BUD REVISED BUD ACTUAL PROJECTION BUDGET CHANGE
45260 43790 Intergovernmental Rev Sharing 2,038,590 2,027,562 2,027,562 2,027,562 2,027,562 2,187,545 7.90%
45260 47331 Intergov Charges‐Streets 749,149 ‐ ‐ ‐ ‐ ‐ 0.00%
45260 48100 Interest Income 110,094 3,300 3,300 29,539 3,300 ‐ ‐100.00%
45260 48110 Other Interest 103,425 60,000 60,000 ‐ 60,000 100,000 66.70%
45260 49300 Fund Balance Applied ‐ 2,026,758 2,026,758 ‐ 2,026,758 ‐ ‐100.00%
GRAND TOTAL 3,001,257$ 4,117,620$ 4,117,620$ 2,057,101$ 4,117,620$ 2,287,545$ ‐44.40%
INTERGOVERNMENTAL REVENUE SHARING DETAIL REVENUES
Page 245
This page is intentionally left blank
Page 246

TRANSIT SYSTEM
Fund: 602-Belle Urban Transit System Enterprise Department: 82-Transit System Function: 40-Public Works Orgs: 60282-60282021
MISSION STATEMENT
Provide and encourage the use of alternative forms of transportation for reasons of economic opportunity, education, equity, development, and sustainability.
FUNCTION
The Racine area public transit system, or RY̊DE, seeks to provide safe, secure, reliable, convenient, and efficient bus service to the citizens and visitors of the City of Racine and surrounding municipalities, students of the Racine Unified School District, and Dial-A-Ride-Transit paratransit van service to persons with a disability preventing them from riding a bus.
SIGNIFICANT INITIATIVES RECENTLY ACCOMPLISHED
1. Signed contracts to purchase nine electric buses (with detailed specifications) and charging equipment, lease bus batteries and install the charging equipment. Revised all grant agreements to reflect specifics of the electric bus program.
2. Began designing electrical system upgrade and installation of the charging equipment for the electric bus program, relying on the expertise of the bus manufacturer and electrical utility.
3. Signed a contract for a new automatic vehicle locator and dispatch system – the nervous system of the transit system. The system will provide current (real time) information to passengers and dispatchers, and provide compliance data for the Federal Transit Administration.
4. Installed new radios in all buses. 5. Received and began operation of four new replacement diesel buses.
Page 247

TRANSIT SYSTEM
Fund: 602-Belle Urban Transit System Enterprise Department: 82-Transit System Function: 40-Public Works Orgs: 60282-60282021
2022 STRATEGIC INITIATIVES
1. Receive and begin revenue operation of electric buses. 2. Use introduction of electric buses and passenger information system to market RYDE as a technological force. 3. Design and installation of solar fields and battery storage for charging of electric bus fleet.
SIGNIFICANT FUNDING OR PROGRAM CHANGES IN 2022
1. Continue using CARES Act funds to offset lost revenues and city funding.
Page 248
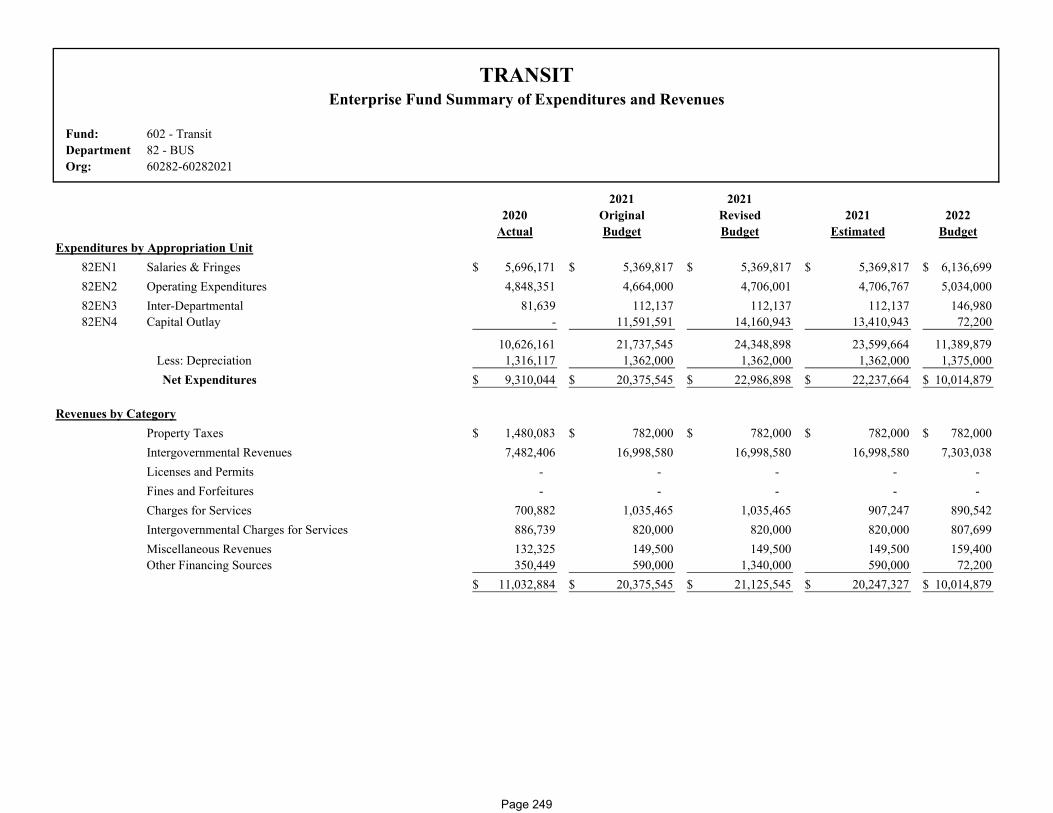
Fund: 602 - TransitDepartment 82 - BUSOrg: 60282-60282021
2021 20212020 Original Revised 2021 2022
Actual Budget Budget Estimated BudgetExpenditures by Appropriation Unit
82EN1 Salaries & Fringes 5,696,171$ 5,369,817$ 5,369,817$ 5,369,817$ 6,136,699$ 82EN2 Operating Expenditures 4,848,351 4,664,000 4,706,001 4,706,767 5,034,000 82EN3 Inter-Departmental 81,639 112,137 112,137 112,137 146,980 82EN4 Capital Outlay - 11,591,591 14,160,943 13,410,943 72,200
10,626,161 21,737,545 24,348,898 23,599,664 11,389,879 Less: Depreciation 1,316,117 1,362,000 1,362,000 1,362,000 1,375,000
Net Expenditures 9,310,044$ 20,375,545$ 22,986,898$ 22,237,664$ 10,014,879$
Revenues by CategoryProperty Taxes 1,480,083$ 782,000$ 782,000$ 782,000$ 782,000$ Intergovernmental Revenues 7,482,406 16,998,580 16,998,580 16,998,580 7,303,038 Licenses and Permits - - - - - Fines and Forfeitures - - - - - Charges for Services 700,882 1,035,465 1,035,465 907,247 890,542 Intergovernmental Charges for Services 886,739 820,000 820,000 820,000 807,699 Miscellaneous Revenues 132,325 149,500 149,500 149,500 159,400 Other Financing Sources 350,449 590,000 1,340,000 590,000 72,200
11,032,884$ 20,375,545$ 21,125,545$ 20,247,327$ 10,014,879$
TRANSITEnterprise Fund Summary of Expenditures and Revenues
Page 249
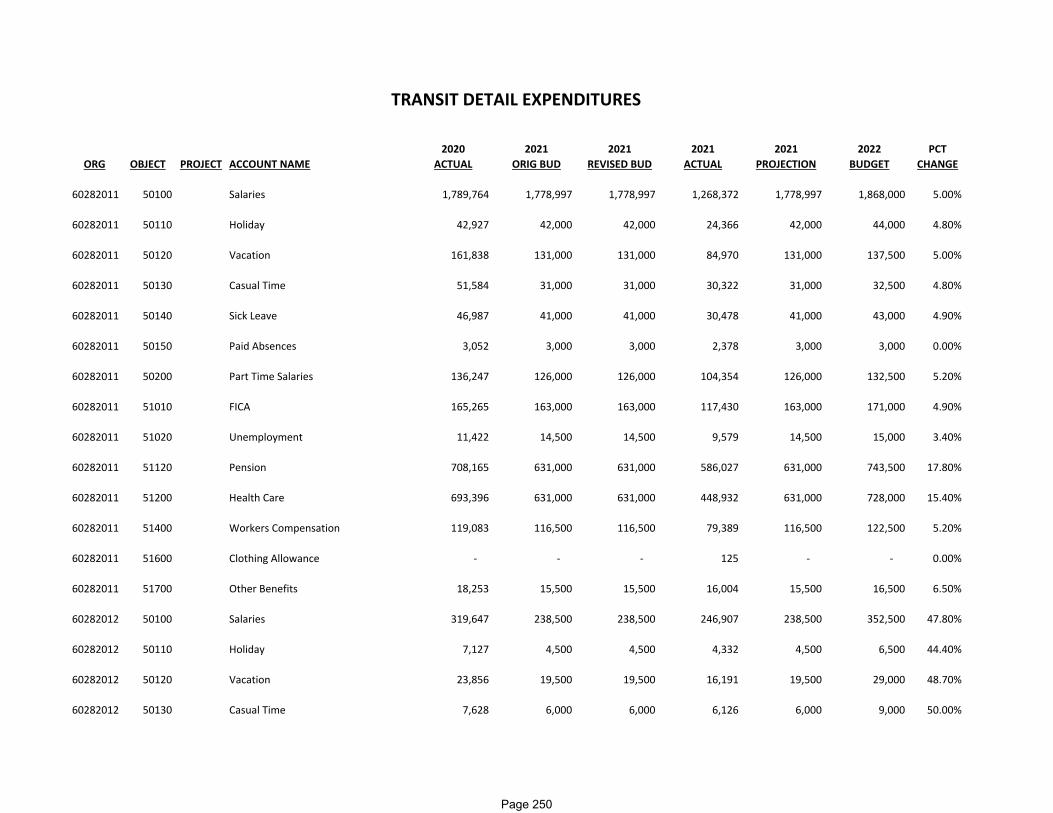
2020 2021 2021 2021 2021 2022 PCTORG OBJECT PROJECT ACCOUNT NAME ACTUAL ORIG BUD REVISED BUD ACTUAL PROJECTION BUDGET CHANGE
60282011 50100 Salaries 1,789,764 1,778,997 1,778,997 1,268,372 1,778,997 1,868,000 5.00%
60282011 50110 Holiday 42,927 42,000 42,000 24,366 42,000 44,000 4.80%
60282011 50120 Vacation 161,838 131,000 131,000 84,970 131,000 137,500 5.00%
60282011 50130 Casual Time 51,584 31,000 31,000 30,322 31,000 32,500 4.80%
60282011 50140 Sick Leave 46,987 41,000 41,000 30,478 41,000 43,000 4.90%
60282011 50150 Paid Absences 3,052 3,000 3,000 2,378 3,000 3,000 0.00%
60282011 50200 Part Time Salaries 136,247 126,000 126,000 104,354 126,000 132,500 5.20%
60282011 51010 FICA 165,265 163,000 163,000 117,430 163,000 171,000 4.90%
60282011 51020 Unemployment 11,422 14,500 14,500 9,579 14,500 15,000 3.40%
60282011 51120 Pension 708,165 631,000 631,000 586,027 631,000 743,500 17.80%
60282011 51200 Health Care 693,396 631,000 631,000 448,932 631,000 728,000 15.40%
60282011 51400 Workers Compensation 119,083 116,500 116,500 79,389 116,500 122,500 5.20%
60282011 51600 Clothing Allowance ‐ ‐ ‐ 125 ‐ ‐ 0.00%
60282011 51700 Other Benefits 18,253 15,500 15,500 16,004 15,500 16,500 6.50%
60282012 50100 Salaries 319,647 238,500 238,500 246,907 238,500 352,500 47.80%
60282012 50110 Holiday 7,127 4,500 4,500 4,332 4,500 6,500 44.40%
60282012 50120 Vacation 23,856 19,500 19,500 16,191 19,500 29,000 48.70%
60282012 50130 Casual Time 7,628 6,000 6,000 6,126 6,000 9,000 50.00%
TRANSIT DETAIL EXPENDITURES
Page 250
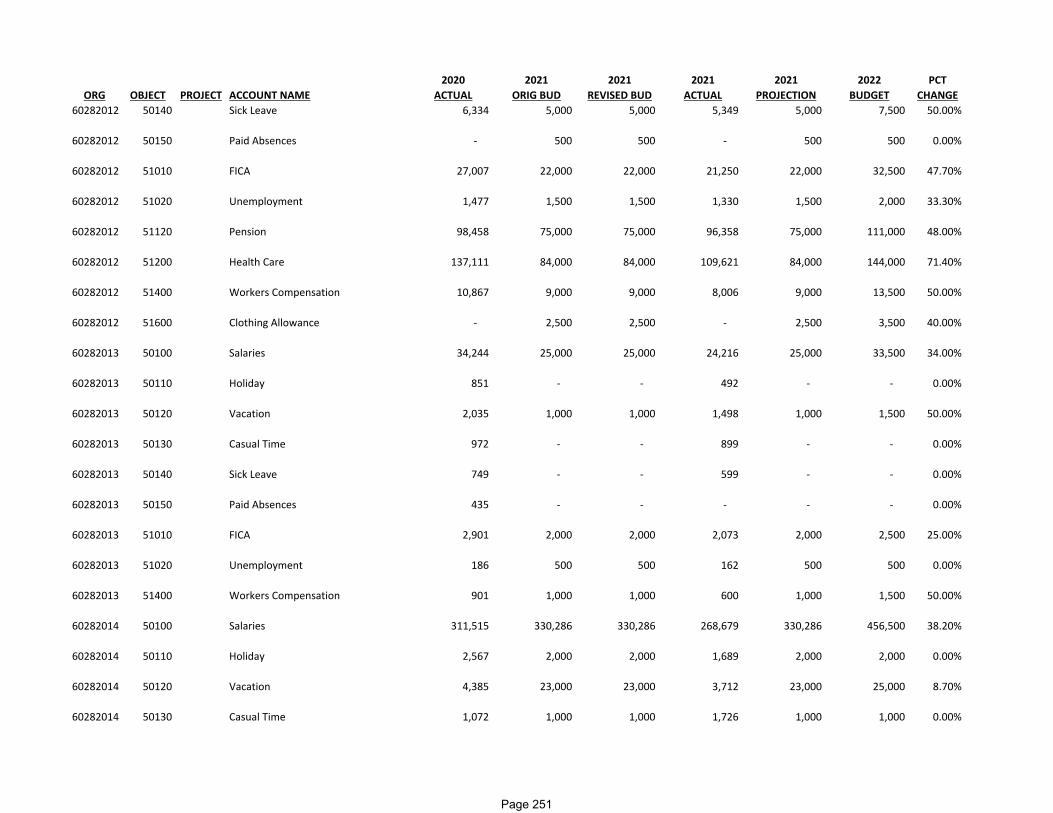
2020 2021 2021 2021 2021 2022 PCTORG OBJECT PROJECT ACCOUNT NAME ACTUAL ORIG BUD REVISED BUD ACTUAL PROJECTION BUDGET CHANGE
60282012 50140 Sick Leave 6,334 5,000 5,000 5,349 5,000 7,500 50.00%
60282012 50150 Paid Absences ‐ 500 500 ‐ 500 500 0.00%
60282012 51010 FICA 27,007 22,000 22,000 21,250 22,000 32,500 47.70%
60282012 51020 Unemployment 1,477 1,500 1,500 1,330 1,500 2,000 33.30%
60282012 51120 Pension 98,458 75,000 75,000 96,358 75,000 111,000 48.00%
60282012 51200 Health Care 137,111 84,000 84,000 109,621 84,000 144,000 71.40%
60282012 51400 Workers Compensation 10,867 9,000 9,000 8,006 9,000 13,500 50.00%
60282012 51600 Clothing Allowance ‐ 2,500 2,500 ‐ 2,500 3,500 40.00%
60282013 50100 Salaries 34,244 25,000 25,000 24,216 25,000 33,500 34.00%
60282013 50110 Holiday 851 ‐ ‐ 492 ‐ ‐ 0.00%
60282013 50120 Vacation 2,035 1,000 1,000 1,498 1,000 1,500 50.00%
60282013 50130 Casual Time 972 ‐ ‐ 899 ‐ ‐ 0.00%
60282013 50140 Sick Leave 749 ‐ ‐ 599 ‐ ‐ 0.00%
60282013 50150 Paid Absences 435 ‐ ‐ ‐ ‐ ‐ 0.00%
60282013 51010 FICA 2,901 2,000 2,000 2,073 2,000 2,500 25.00%
60282013 51020 Unemployment 186 500 500 162 500 500 0.00%
60282013 51400 Workers Compensation 901 1,000 1,000 600 1,000 1,500 50.00%
60282014 50100 Salaries 311,515 330,286 330,286 268,679 330,286 456,500 38.20%
60282014 50110 Holiday 2,567 2,000 2,000 1,689 2,000 2,000 0.00%
60282014 50120 Vacation 4,385 23,000 23,000 3,712 23,000 25,000 8.70%
60282014 50130 Casual Time 1,072 1,000 1,000 1,726 1,000 1,000 0.00%
Page 251

2020 2021 2021 2021 2021 2022 PCTORG OBJECT PROJECT ACCOUNT NAME ACTUAL ORIG BUD REVISED BUD ACTUAL PROJECTION BUDGET CHANGE
60282014 50140 Sick Leave 1,292 2,000 2,000 1,014 2,000 2,000 0.00%
60282014 50200 Part Time Salaries 272 ‐ ‐ ‐ ‐ ‐ 0.00%
60282014 51010 FICA 23,277 27,268 27,268 20,742 27,268 29,500 8.20%
60282014 51020 Unemployment 907 1,500 1,500 1,089 1,500 1,500 0.00%
60282014 51100 WRS 4,132 3,766 3,766 4,354 3,766 3,699 ‐1.80%
60282014 51120 Pension 30,894 12,000 12,000 14,592 12,000 24,000 100.00%
60282014 51200 Health Care 107,075 191,000 191,000 111,904 191,000 174,500 ‐8.60%
60282014 51400 Workers Compensation 4,526 5,000 5,000 3,336 5,000 5,500 10.00%
60282014 51700 Other Benefits 1,610 ‐ ‐ ‐ ‐ ‐ 0.00%
60282014 51810 Mileage (154) 1,000 1,000 ‐ 1,000 1,000 0.00%
60282014 51820 Safety Glasses 1,507 2,000 2,000 762 2,000 2,000 0.00%
60282021 50100 Salaries 261,435 277,500 277,500 153,045 277,500 291,500 5.00%
60282021 50110 Holiday 3,046 1,000 1,000 1,663 1,000 1,000 0.00%
60282021 50120 Vacation 12,610 8,000 8,000 5,947 8,000 8,500 6.30%
60282021 50130 Casual Time 1,682 1,000 1,000 604 1,000 1,000 0.00%
60282021 50140 Sick Leave 2,048 2,000 2,000 432 2,000 2,000 0.00%
60282021 50200 Part Time Salaries 44,554 44,000 44,000 34,398 44,000 46,000 4.50%
60282021 51010 FICA 23,698 25,000 25,000 14,082 25,000 26,500 6.00%
60282021 51020 Unemployment 2,317 5,000 5,000 1,578 5,000 5,500 10.00%
60282021 51100 WRS 436 ‐ ‐ ‐ ‐ ‐ 0.00%
60282021 51120 Pension 121,328 111,000 111,000 75,895 111,000 116,500 5.00%
Page 252
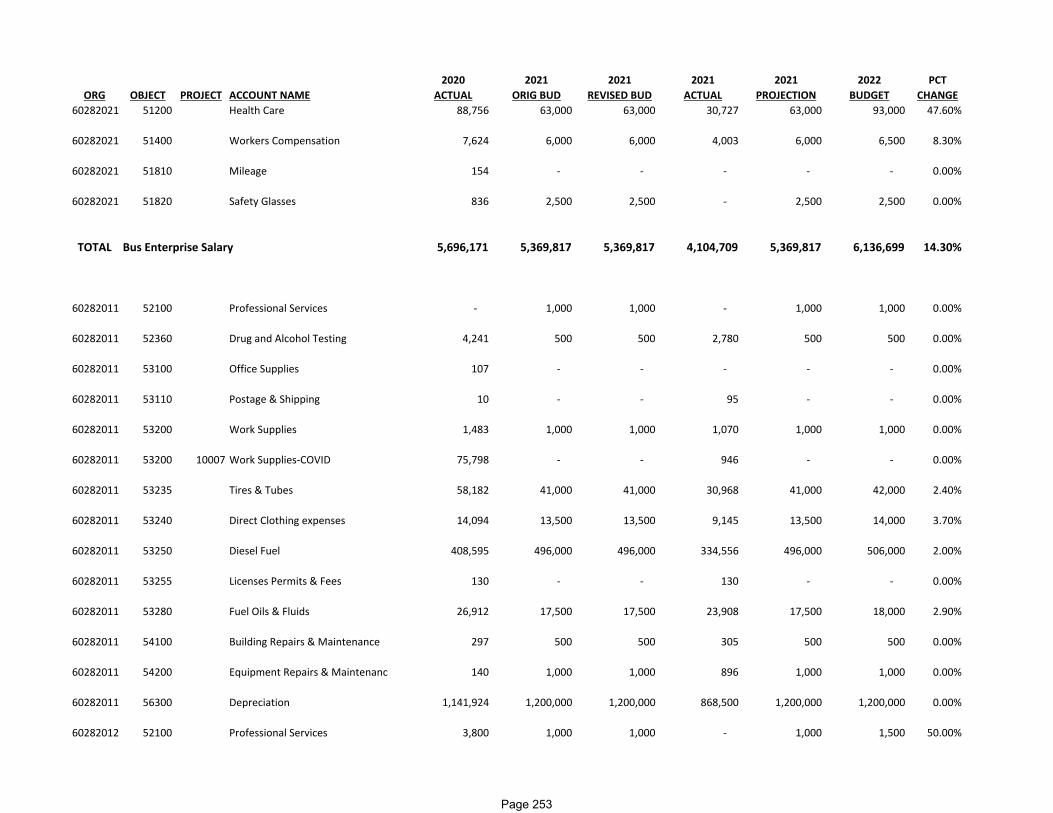
2020 2021 2021 2021 2021 2022 PCTORG OBJECT PROJECT ACCOUNT NAME ACTUAL ORIG BUD REVISED BUD ACTUAL PROJECTION BUDGET CHANGE
60282021 51200 Health Care 88,756 63,000 63,000 30,727 63,000 93,000 47.60%
60282021 51400 Workers Compensation 7,624 6,000 6,000 4,003 6,000 6,500 8.30%
60282021 51810 Mileage 154 ‐ ‐ ‐ ‐ ‐ 0.00%
60282021 51820 Safety Glasses 836 2,500 2,500 ‐ 2,500 2,500 0.00%
TOTAL Bus Enterprise Salary 5,696,171 5,369,817 5,369,817 4,104,709 5,369,817 6,136,699 14.30%
60282011 52100 Professional Services ‐ 1,000 1,000 ‐ 1,000 1,000 0.00%
60282011 52360 Drug and Alcohol Testing 4,241 500 500 2,780 500 500 0.00%
60282011 53100 Office Supplies 107 ‐ ‐ ‐ ‐ ‐ 0.00%
60282011 53110 Postage & Shipping 10 ‐ ‐ 95 ‐ ‐ 0.00%
60282011 53200 Work Supplies 1,483 1,000 1,000 1,070 1,000 1,000 0.00%
60282011 53200 10007 Work Supplies‐COVID 75,798 ‐ ‐ 946 ‐ ‐ 0.00%
60282011 53235 Tires & Tubes 58,182 41,000 41,000 30,968 41,000 42,000 2.40%
60282011 53240 Direct Clothing expenses 14,094 13,500 13,500 9,145 13,500 14,000 3.70%
60282011 53250 Diesel Fuel 408,595 496,000 496,000 334,556 496,000 506,000 2.00%
60282011 53255 Licenses Permits & Fees 130 ‐ ‐ 130 ‐ ‐ 0.00%
60282011 53280 Fuel Oils & Fluids 26,912 17,500 17,500 23,908 17,500 18,000 2.90%
60282011 54100 Building Repairs & Maintenance 297 500 500 305 500 500 0.00%
60282011 54200 Equipment Repairs & Maintenanc 140 1,000 1,000 896 1,000 1,000 0.00%
60282011 56300 Depreciation 1,141,924 1,200,000 1,200,000 868,500 1,200,000 1,200,000 0.00%
60282012 52100 Professional Services 3,800 1,000 1,000 ‐ 1,000 1,500 50.00%
Page 253

2020 2021 2021 2021 2021 2022 PCTORG OBJECT PROJECT ACCOUNT NAME ACTUAL ORIG BUD REVISED BUD ACTUAL PROJECTION BUDGET CHANGE
60282012 52170 General Liability Insurance 76,048 66,500 66,500 76,768 66,500 95,500 43.60%
60282012 52175 Insurance Recoveries (47,163) (17,500) (17,500) (42,870) (17,500) (25,000) 42.90%
60282012 52200 Contracted Services ‐ 3,500 3,500 ‐ 3,500 5,000 42.90%
60282012 53200 Work Supplies 13,935 9,000 9,000 12,942 9,000 13,000 44.40%
60282012 53210 Janitorial Supplies 29 ‐ ‐ 12 ‐ ‐ 0.00%
60282012 53240 Direct Clothing expenses 13,535 1,000 1,000 2,241 1,000 1,500 50.00%
60282012 53245 Vehicle Parts ‐ 4,000 4,000 ‐ 4,000 5,500 37.50%
60282012 53280 Fuel Oils & Fluids 8,623 6,000 6,000 3,642 6,000 8,500 41.70%
60282012 53300 Utilities 11,790 13,500 13,500 6,489 13,500 19,500 44.40%
60282012 54100 Building Repairs & Maintenance 245 500 500 ‐ 500 500 0.00%
60282012 54200 Equipment Repairs & Maintenanc 515,601 287,500 303,047 313,424 303,047 413,000 43.70%
60282012 56300 Depreciation 28,804 29,000 29,000 12,600 29,000 29,000 0.00%
60282013 52210 Property/Equipment Rental 1,529 ‐ ‐ 1,149 ‐ ‐ 0.00%
60282013 52215 Waste Disposal 9,817 9,000 9,000 8,733 9,000 11,500 27.80%
60282013 53100 Office Supplies 101 ‐ ‐ ‐ ‐ ‐ 0.00%
60282013 53110 Postage & Shipping 10 ‐ ‐ ‐ ‐ ‐ 0.00%
60282013 53200 Work Supplies 8,730 9,000 10,557 7,316 10,557 11,500 27.80%
60282013 53200 10007 Work Supplies‐COVID 42,168 ‐ ‐ 29,020 ‐ 51,500 0.00%
60282013 53210 Janitorial Supplies 3,084 3,000 3,000 2,677 3,000 4,000 33.30%
60282013 53330 Utilities‐Water 3,483 ‐ ‐ 2,810 ‐ ‐ 0.00%
60282013 54100 Building Repairs & Maintenance 49,194 55,000 67,358 44,006 67,358 71,500 30.00%
Page 254

2020 2021 2021 2021 2021 2022 PCTORG OBJECT PROJECT ACCOUNT NAME ACTUAL ORIG BUD REVISED BUD ACTUAL PROJECTION BUDGET CHANGE
60282013 54200 Equipment Repairs & Maintenanc 23,772 20,000 20,000 19,489 20,766 26,000 30.00%
60282013 54300 Grounds Repairs & Maintenance 10,673 9,000 9,000 13,304 9,000 11,500 27.80%
60282013 56300 Depreciation 26,723 14,000 14,000 15,300 14,000 27,000 92.90%
60282014 52100 Professional Services 21,011 25,000 25,000 16,585 25,000 26,000 4.00%
60282014 52120 Audit Services 9,045 16,000 16,000 10,000 16,000 17,000 6.30%
60282014 52170 General Liability Insurance 273,709 270,000 270,000 276,298 270,000 283,000 4.80%
60282014 52200 Contracted Services 2,579 2,500 2,500 1,918 2,500 2,500 0.00%
60282014 52210 Property/Equipment Rental 1,575 1,500 1,500 1,181 1,500 1,500 0.00%
60282014 52220 Banking/Financial Charges 1,297 ‐ ‐ 227 ‐ ‐ 0.00%
60282014 52280 Purchased Transportation 1,304,003 1,300,000 1,300,000 986,099 1,300,000 1,363,500 4.90%
60282014 52290 Management Fee 161,839 153,500 153,500 119,584 153,500 161,000 4.90%
60282014 52300 City Services 146,525 142,000 142,000 121,500 142,000 149,000 4.90%
60282014 52315 Advertising 22,519 50,000 50,000 21,053 50,000 52,500 5.00%
60282014 53100 Office Supplies 5,887 3,000 3,000 7,445 3,000 3,000 0.00%
60282014 53110 Postage & Shipping 2,110 1,000 1,000 1,522 1,000 1,000 0.00%
60282014 53115 Publications & Subscriptions 275 500 500 295 500 500 0.00%
60282014 53160 Copying & Printing 440 2,500 2,500 645 2,500 2,500 0.00%
60282014 53200 Work Supplies 6,409 7,000 7,000 4,359 7,000 7,500 7.10%
60282014 53210 Janitorial Supplies 56 ‐ ‐ (24) ‐ ‐ 0.00%
60282014 53240 Direct Clothing expenses ‐ 500 500 ‐ 500 500 0.00%
60282014 53265 Memberships 4,732 6,000 6,000 756 6,000 6,500 8.30%
Page 255

2020 2021 2021 2021 2021 2022 PCTORG OBJECT PROJECT ACCOUNT NAME ACTUAL ORIG BUD REVISED BUD ACTUAL PROJECTION BUDGET CHANGE
60282014 53300 Utilities 2,579 5,000 5,000 1,580 5,000 5,000 0.00%
60282014 53315 Utilities‐Electric 20,300 19,000 19,000 9,750 19,000 20,000 5.30%
60282014 53320 Utilities‐Heat 15,893 28,000 28,000 13,130 28,000 29,500 5.40%
60282014 53330 Utilities‐Water 12,589 7,500 7,500 8,334 7,500 8,000 6.70%
60282014 53360 External Communication Service 401 1,000 1,000 863 1,000 1,000 0.00%
60282014 53460 Miscellaneous Expenses 179 500 500 216 500 500 0.00%
60282014 53800 Education/Training/Conferences 3,464 3,000 3,000 795 3,000 3,000 0.00%
60282014 53810 Travel ‐ 1,000 1,000 784 1,000 1,000 0.00%
60282014 54100 Building Repairs & Maintenance 11,616 ‐ 8,850 10,200 8,850 ‐ 0.00%
60282014 54200 Equipment Repairs & Maintenanc ‐ ‐ ‐ (382) ‐ ‐ 0.00%
60282014 54300 Grounds Repairs & Maintenance 775 ‐ ‐ 375 ‐ ‐ 0.00%
60282014 54500 Software Maintenance 17,283 42,500 42,500 5,480 42,500 44,500 4.70%
60282014 56300 Depreciation 55,550 56,000 56,000 39,600 56,000 56,000 0.00%
60282021 52100 Professional Services 2,219 3,000 3,000 ‐ 3,000 3,000 0.00%
60282021 52120 Audit Services 955 2,000 2,000 ‐ 2,000 2,000 0.00%
60282021 52170 General Liability Insurance 57,790 57,000 57,000 58,337 57,000 56,000 ‐1.80%
60282021 52215 Waste Disposal 1,037 ‐ ‐ ‐ ‐ ‐ 0.00%
60282021 52290 Management Fee 17,092 18,000 18,000 ‐ 18,000 17,500 ‐2.80%
60282021 52300 City Services 15,475 19,000 19,000 ‐ 19,000 18,500 ‐2.60%
60282021 53100 Office Supplies 622 500 500 ‐ 500 500 0.00%
60282021 53110 Postage & Shipping 223 ‐ ‐ ‐ ‐ ‐ 0.00%
Page 256

2020 2021 2021 2021 2021 2022 PCTORG OBJECT PROJECT ACCOUNT NAME ACTUAL ORIG BUD REVISED BUD ACTUAL PROJECTION BUDGET CHANGE
60282021 53160 Copying & Printing 46 500 500 ‐ 500 500 0.00%
60282021 53200 Work Supplies 922 1,500 1,500 ‐ 1,500 1,500 0.00%
60282021 53210 Janitorial Supplies 326 500 500 ‐ 500 500 0.00%
60282021 53235 Tires & Tubes 1,690 3,500 3,500 1,570 3,500 3,500 0.00%
60282021 53240 Direct Clothing expenses 4,132 2,500 2,500 1,095 2,500 2,500 0.00%
60282021 53265 Memberships 500 ‐ ‐ ‐ ‐ ‐ 0.00%
60282021 53280 Fuel Oils & Fluids 1,080 500 500 1,060 500 500 0.00%
60282021 53300 Utilities 272 500 500 ‐ 500 500 0.00%
60282021 53315 Utilities‐Electric 2,144 2,500 2,500 ‐ 2,500 2,500 0.00%
60282021 53320 Utilities‐Heat 1,678 4,500 4,500 ‐ 4,500 4,500 0.00%
60282021 53330 Utilities‐Water 1,697 1,000 1,000 ‐ 1,000 1,000 0.00%
60282021 53360 External Communication Service 2,428 1,500 1,500 2,145 1,500 1,500 0.00%
60282021 53460 Miscellaneous Expenses 19 3,500 3,500 ‐ 3,500 3,500 0.00%
60282021 53800 Education/Training/Conferences 366 ‐ ‐ ‐ ‐ ‐ 0.00%
60282021 54100 Building Repairs & Maintenance 6,422 8,500 8,500 ‐ 8,500 8,500 0.00%
60282021 54200 Equipment Repairs & Maintenanc 15,861 20,000 23,689 13,762 23,689 19,500 ‐2.50%
60282021 54300 Grounds Repairs & Maintenance 1,127 1,000 1,000 ‐ 1,000 1,000 0.00%
60282021 54500 Software Maintenance 8,029 10,000 10,000 5,170 10,000 10,000 0.00%
60282021 56300 Depreciation 63,116 63,000 63,000 27,000 63,000 63,000 0.00%
TOTAL Bus Enterprise Operati 4,848,351 4,664,000 4,706,001 3,572,658 4,706,767 5,034,000 7.90%
Page 257
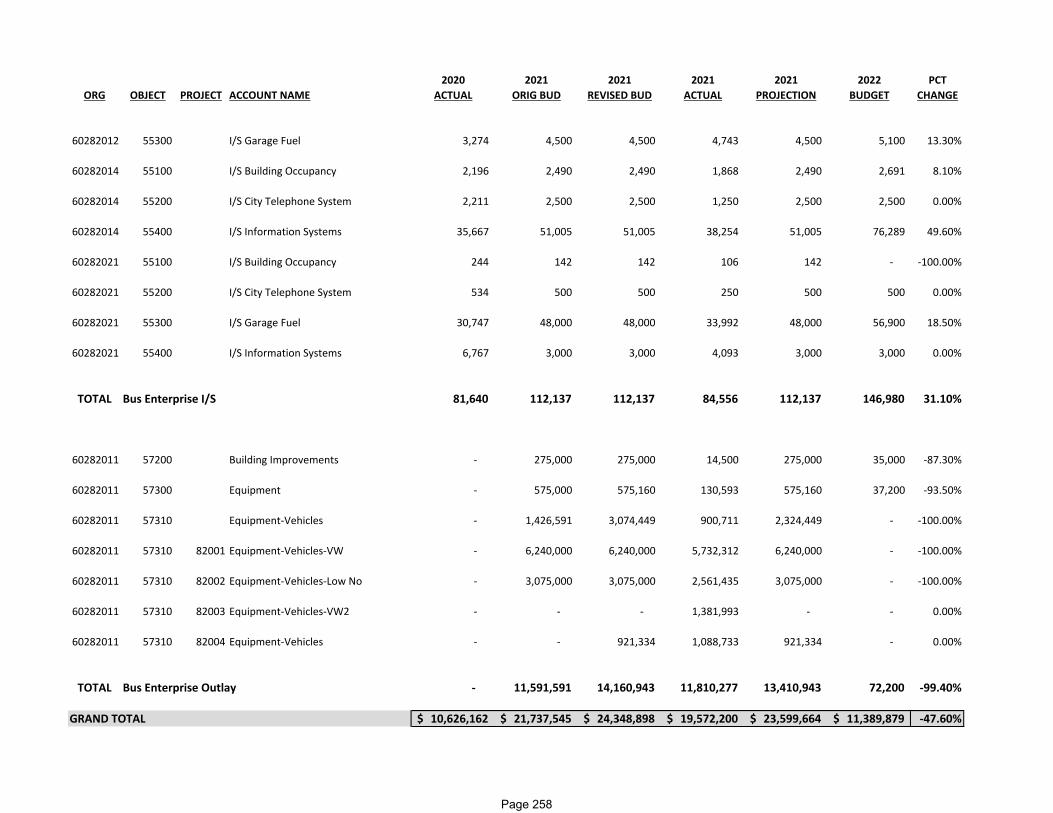
2020 2021 2021 2021 2021 2022 PCTORG OBJECT PROJECT ACCOUNT NAME ACTUAL ORIG BUD REVISED BUD ACTUAL PROJECTION BUDGET CHANGE
60282012 55300 I/S Garage Fuel 3,274 4,500 4,500 4,743 4,500 5,100 13.30%
60282014 55100 I/S Building Occupancy 2,196 2,490 2,490 1,868 2,490 2,691 8.10%
60282014 55200 I/S City Telephone System 2,211 2,500 2,500 1,250 2,500 2,500 0.00%
60282014 55400 I/S Information Systems 35,667 51,005 51,005 38,254 51,005 76,289 49.60%
60282021 55100 I/S Building Occupancy 244 142 142 106 142 ‐ ‐100.00%
60282021 55200 I/S City Telephone System 534 500 500 250 500 500 0.00%
60282021 55300 I/S Garage Fuel 30,747 48,000 48,000 33,992 48,000 56,900 18.50%
60282021 55400 I/S Information Systems 6,767 3,000 3,000 4,093 3,000 3,000 0.00%
TOTAL Bus Enterprise I/S 81,640 112,137 112,137 84,556 112,137 146,980 31.10%
60282011 57200 Building Improvements ‐ 275,000 275,000 14,500 275,000 35,000 ‐87.30%
60282011 57300 Equipment ‐ 575,000 575,160 130,593 575,160 37,200 ‐93.50%
60282011 57310 Equipment‐Vehicles ‐ 1,426,591 3,074,449 900,711 2,324,449 ‐ ‐100.00%
60282011 57310 82001 Equipment‐Vehicles‐VW ‐ 6,240,000 6,240,000 5,732,312 6,240,000 ‐ ‐100.00%
60282011 57310 82002 Equipment‐Vehicles‐Low No ‐ 3,075,000 3,075,000 2,561,435 3,075,000 ‐ ‐100.00%
60282011 57310 82003 Equipment‐Vehicles‐VW2 ‐ ‐ ‐ 1,381,993 ‐ ‐ 0.00%
60282011 57310 82004 Equipment‐Vehicles ‐ ‐ 921,334 1,088,733 921,334 ‐ 0.00%
TOTAL Bus Enterprise Outlay ‐ 11,591,591 14,160,943 11,810,277 13,410,943 72,200 ‐99.40%
GRAND TOTAL 10,626,162$ 21,737,545$ 24,348,898$ 19,572,200$ 23,599,664$ 11,389,879$ ‐47.60%
Page 258

2020 2021 2021 2021 2021 2022 PCTORG OBJECT PROJECT ACCOUNT NAME ACTUAL ORIG BUD REVISED BUD ACTUAL PROJECTION BUDGET CHANGE
60282 41110 Property Taxes 1,480,083 782,000 782,000 782,000 782,000 782,000 0.00%
TOTAL Taxes 1,480,083 782,000 782,000 782,000 782,000 782,000 0.00%
60282011 43310 82002 Fed Grant‐Transit Low No ‐ 3,075,000 3,075,000 ‐ 3,075,000 ‐ ‐100.00%
60282011 43691 82001 State Grant‐Transit‐VW ‐ 6,240,000 6,240,000 ‐ 6,240,000 ‐ ‐100.00%
60282021 43691 State Grant‐Transit 94,000 86,000 86,000 101,513 86,000 101,500 18.00%
60282 43300 Federal Grant‐Transit 5,324,860 3,987,489 3,987,489 967,918 3,987,489 5,268,832 32.10%
60282 43310 Federal Grant‐Transit Capital ‐ 1,686,591 1,686,591 710,619 1,686,591 ‐ ‐100.00%
60282 43310 82004 Federal Grant‐Transit Capital ‐ ‐ ‐ 730,171 ‐ ‐ 0.00%
60282 43691 State Grant‐Transit 2,063,546 1,923,500 1,923,500 483,175 1,923,500 1,932,706 0.50%
TOTAL Intergovern Revenues 7,482,406 16,998,580 16,998,580 2,993,396 16,998,580 7,303,038 ‐57.00%
60282021 46350 Dart Farebox 42,613 108,000 108,000 56,018 108,000 81,500 ‐24.50%
60282 46350 Farebox 206,172 443,386 443,386 239,037 443,386 387,820 ‐12.50%
60282 46351 Fares‐Passes 101,477 176,511 176,511 108,392 176,511 147,304 ‐16.50%
60282 46352 Fares‐Tickets 44,910 98,850 98,850 45,675 98,850 58,410 ‐40.90%
60282 46353 Fares‐School District 208,532 128,218 128,218 175 ‐ 150,000 17.00%
TRANSIT DETAIL REVENUES
Page 259
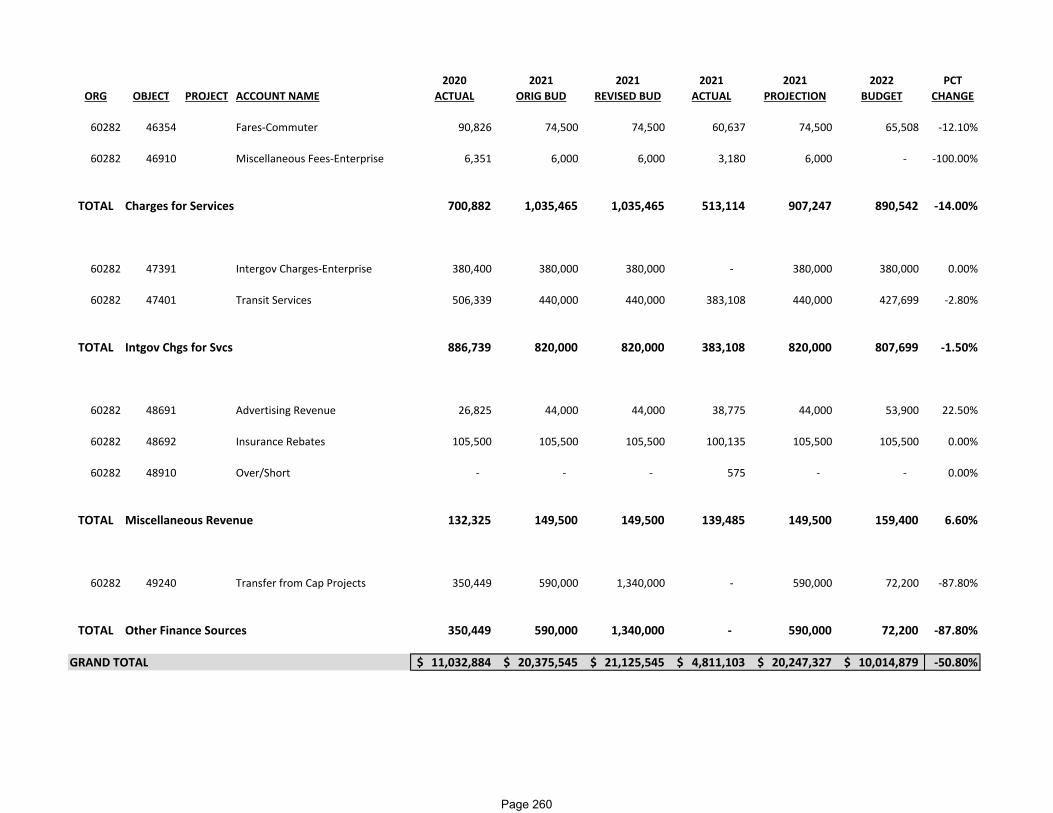
2020 2021 2021 2021 2021 2022 PCTORG OBJECT PROJECT ACCOUNT NAME ACTUAL ORIG BUD REVISED BUD ACTUAL PROJECTION BUDGET CHANGE
60282 46354 Fares‐Commuter 90,826 74,500 74,500 60,637 74,500 65,508 ‐12.10%
60282 46910 Miscellaneous Fees‐Enterprise 6,351 6,000 6,000 3,180 6,000 ‐ ‐100.00%
TOTAL Charges for Services 700,882 1,035,465 1,035,465 513,114 907,247 890,542 ‐14.00%
60282 47391 Intergov Charges‐Enterprise 380,400 380,000 380,000 ‐ 380,000 380,000 0.00%
60282 47401 Transit Services 506,339 440,000 440,000 383,108 440,000 427,699 ‐2.80%
TOTAL Intgov Chgs for Svcs 886,739 820,000 820,000 383,108 820,000 807,699 ‐1.50%
60282 48691 Advertising Revenue 26,825 44,000 44,000 38,775 44,000 53,900 22.50%
60282 48692 Insurance Rebates 105,500 105,500 105,500 100,135 105,500 105,500 0.00%
60282 48910 Over/Short ‐ ‐ ‐ 575 ‐ ‐ 0.00%
TOTAL Miscellaneous Revenue 132,325 149,500 149,500 139,485 149,500 159,400 6.60%
60282 49240 Transfer from Cap Projects 350,449 590,000 1,340,000 ‐ 590,000 72,200 ‐87.80%
TOTAL Other Finance Sources 350,449 590,000 1,340,000 ‐ 590,000 72,200 ‐87.80%
GRAND TOTAL 11,032,884$ 20,375,545$ 21,125,545$ 4,811,103$ 20,247,327$ 10,014,879$ ‐50.80%
Page 260
PARKING SYSTEM
Fund: 603-Parking System Enterprise Department: 83-Parking System Function: 40-Public Works Orgs: 60383
MISSION STATEMENT
Encourage the use and development of Racine’s commercial districts by providing and allocating parking spaces for motor vehicles and collecting parking fee revenue by the most efficient means.
FUNCTION
The Parking System is an enterprise which regulates parking in the various business districts. This enterprise is responsible for the installation and maintenance of revenue collection equipment (both on and off street); oversight of the mobile payment app; the maintenance of parking lots and ramps under the jurisdiction of the Parking System including ground maintenance, cleaning, general maintenance and snow removal; and the collection of hourly, daily, and monthly fees. The Parking System is regulated by the Public Works and Services Committee with the general operation of the system being overseen by the Commissioner of Public Works.
SIGNIFICANT INITIATIVES RECENTLY ACCOMPLISHED
1. Supported downtown development efforts. 2. Developed plans to encourage the use of the phone app on Wisconsin Ave. 3. Researched alternative technologies and management arrangements for parking business units. 4. Reduced parking field staff from four to two.
2022 STRATEGIC INITIATIVES
1. Continue reinventing how we collect revenue from on-street and surface parking lot parking spaces with fewer staff. 2. Remaining initiatives from the 2019 Downtown Pedestrians, Plaza, and Parking Plan, include promoting ramp parking through signage and increasing
parking rates on Main. St.; providing free parking at the library.
Page 261

PARKING SYSTEM
Fund: 603-Parking System Enterprise Department: 83-Parking System Function: 40-Public Works Orgs: 60383
SIGNIFICANT FUNDING OR PROGRAM CHANGES IN 2022.
1. Procurement of services to manage off-street facilities with existing Parking Access-Revenue Control (PARK) equipment. 2. Procurement of services to manage rental of all off-street facilities without existing Parking Access-Revenue Control (PARK) equipment. 3. Procurement of contracted services to provide snow & ice control for all off-street facilities within the Parking System, except abutting sidewalks &
stairwells.
Page 262
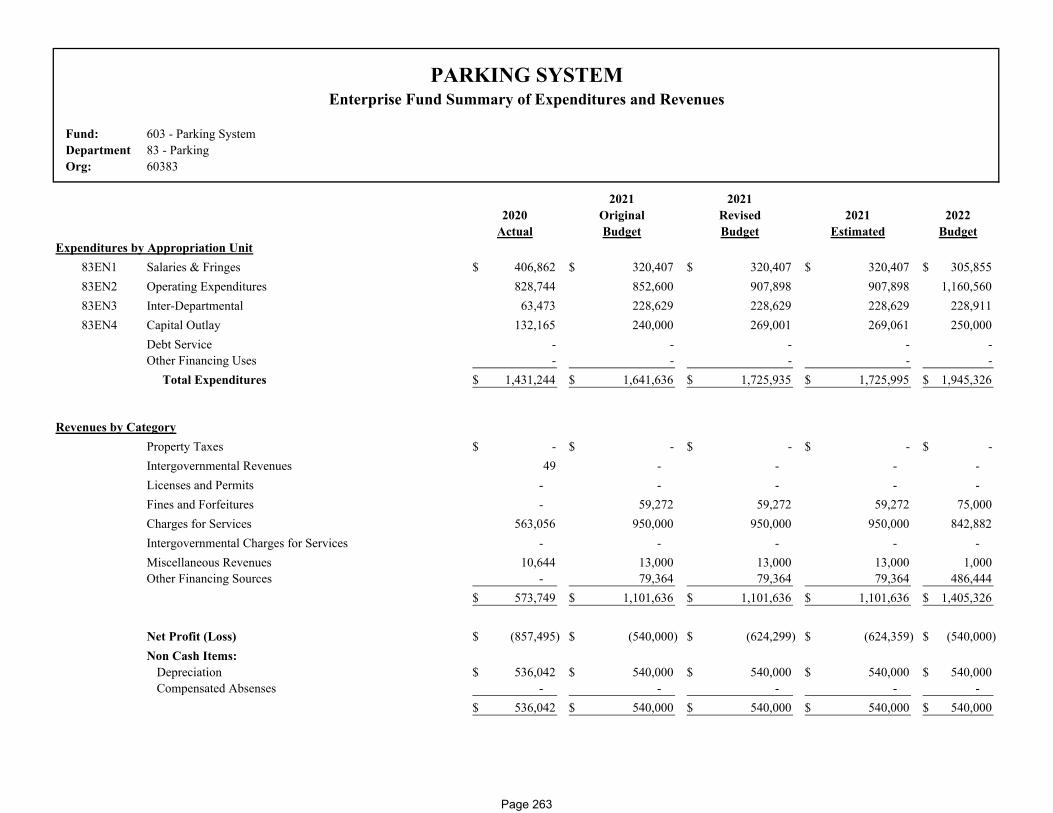
Fund: 603 - Parking SystemDepartment 83 - ParkingOrg: 60383
2021 20212020 Original Revised 2021 2022
Actual Budget Budget Estimated BudgetExpenditures by Appropriation Unit
83EN1 Salaries & Fringes 406,862$ 320,407$ 320,407$ 320,407$ 305,855$ 83EN2 Operating Expenditures 828,744 852,600 907,898 907,898 1,160,560 83EN3 Inter-Departmental 63,473 228,629 228,629 228,629 228,911 83EN4 Capital Outlay 132,165 240,000 269,001 269,061 250,000
Debt Service - - - - - Other Financing Uses - - - - - Total Expenditures 1,431,244$ 1,641,636$ 1,725,935$ 1,725,995$ 1,945,326$
Revenues by CategoryProperty Taxes -$ -$ -$ -$ -$ Intergovernmental Revenues 49 - - - - Licenses and Permits - - - - - Fines and Forfeitures - 59,272 59,272 59,272 75,000 Charges for Services 563,056 950,000 950,000 950,000 842,882 Intergovernmental Charges for Services - - - - - Miscellaneous Revenues 10,644 13,000 13,000 13,000 1,000 Other Financing Sources - 79,364 79,364 79,364 486,444
573,749$ 1,101,636$ 1,101,636$ 1,101,636$ 1,405,326$
Net Profit (Loss) (857,495)$ (540,000)$ (624,299)$ (624,359)$ (540,000)$ Non Cash Items:
Depreciation 536,042$ 540,000$ 540,000$ 540,000$ 540,000$ Compensated Absenses - - - - -
536,042$ 540,000$ 540,000$ 540,000$ 540,000$
PARKING SYSTEMEnterprise Fund Summary of Expenditures and Revenues
Page 263
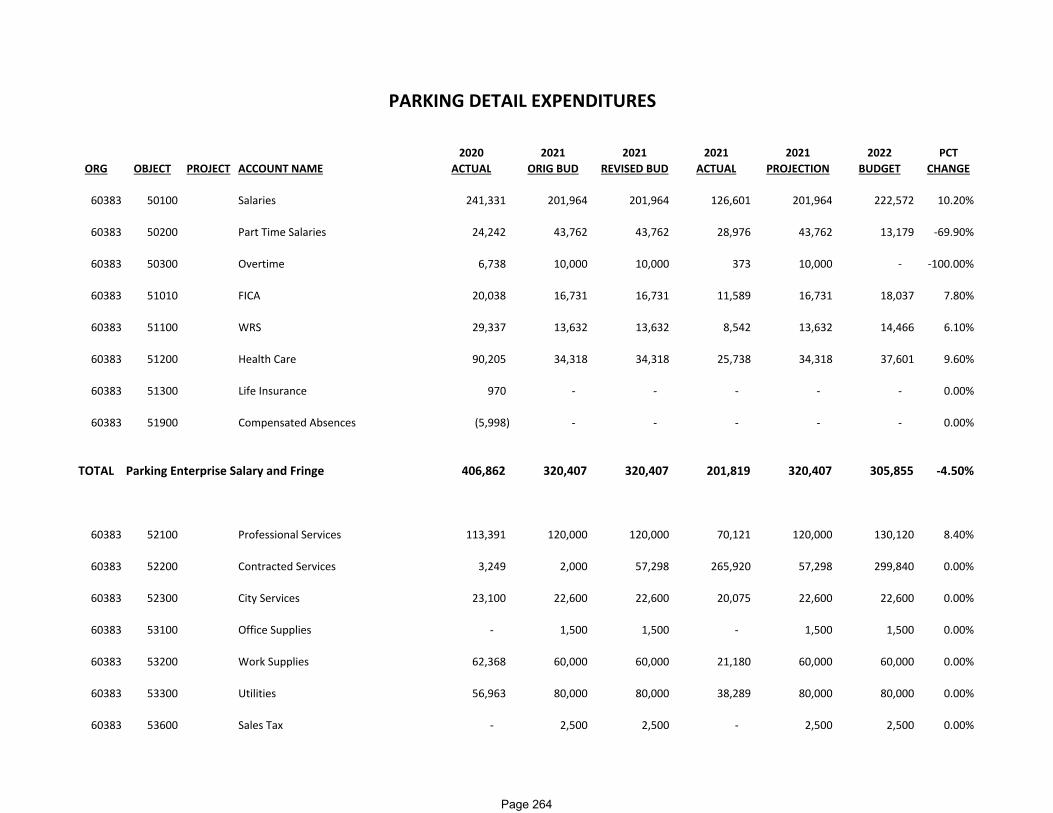
2020 2021 2021 2021 2021 2022 PCTORG OBJECT PROJECT ACCOUNT NAME ACTUAL ORIG BUD REVISED BUD ACTUAL PROJECTION BUDGET CHANGE
60383 50100 Salaries 241,331 201,964 201,964 126,601 201,964 222,572 10.20%
60383 50200 Part Time Salaries 24,242 43,762 43,762 28,976 43,762 13,179 ‐69.90%
60383 50300 Overtime 6,738 10,000 10,000 373 10,000 ‐ ‐100.00%
60383 51010 FICA 20,038 16,731 16,731 11,589 16,731 18,037 7.80%
60383 51100 WRS 29,337 13,632 13,632 8,542 13,632 14,466 6.10%
60383 51200 Health Care 90,205 34,318 34,318 25,738 34,318 37,601 9.60%
60383 51300 Life Insurance 970 ‐ ‐ ‐ ‐ ‐ 0.00%
60383 51900 Compensated Absences (5,998) ‐ ‐ ‐ ‐ ‐ 0.00%
TOTAL Parking Enterprise Salary and Fringe 406,862 320,407 320,407 201,819 320,407 305,855 ‐4.50%
60383 52100 Professional Services 113,391 120,000 120,000 70,121 120,000 130,120 8.40%
60383 52200 Contracted Services 3,249 2,000 57,298 265,920 57,298 299,840 0.00%
60383 52300 City Services 23,100 22,600 22,600 20,075 22,600 22,600 0.00%
60383 53100 Office Supplies ‐ 1,500 1,500 ‐ 1,500 1,500 0.00%
60383 53200 Work Supplies 62,368 60,000 60,000 21,180 60,000 60,000 0.00%
60383 53300 Utilities 56,963 80,000 80,000 38,289 80,000 80,000 0.00%
60383 53600 Sales Tax ‐ 2,500 2,500 ‐ 2,500 2,500 0.00%
PARKING DETAIL EXPENDITURES
Page 264

2020 2021 2021 2021 2021 2022 PCTORG OBJECT PROJECT ACCOUNT NAME ACTUAL ORIG BUD REVISED BUD ACTUAL PROJECTION BUDGET CHANGE
60383 53800 Education/Training/Conferences ‐ 500 500 ‐ 500 500 0.00%
60383 53810 Travel ‐ 1,000 1,000 ‐ 1,000 1,000 0.00%
60383 54100 Building Repairs & Maintenance 7,802 2,500 2,500 2,745 2,500 2,500 0.00%
60383 54200 Equipment Repairs & Maintenanc 3,370 10,000 10,000 3,980 10,000 10,000 0.00%
60383 54300 Grounds Repairs & Maintenance 22,460 10,000 10,000 25,048 10,000 10,000 0.00%
60383 56300 Depreciation 536,042 540,000 540,000 ‐ 540,000 540,000 0.00%
TOTAL Parking Enterprise Operating 828,744 852,600 907,898 447,358 907,898 1,160,560 36.10%
60383 55100 I/S Building Occupancy 39,130 40,673 40,673 30,505 40,673 42,675 4.90%
60383 55200 I/S City Telephone System 700 500 500 250 500 500 0.00%
60383 55300 I/S Garage Fuel 3,089 5,200 5,200 2,340 5,200 5,900 13.50%
60383 55310 I/S Garage Labor 10,422 16,800 16,800 5,805 16,800 14,000 ‐16.70%
60383 55320 I/S Garage Materials 3,449 5,000 5,000 1,981 5,000 3,500 ‐30.00%
60383 55400 I/S Information Systems 6,684 6,956 6,956 5,217 6,956 8,836 27.00%
60383 55500 Equipment/Storage Rent ‐ 4,500 4,500 ‐ 4,500 4,500 0.00%
60383 55600 Snow Removal ‐ 149,000 149,000 105,000 149,000 149,000 0.00%
TOTAL Parking Enterprise Internal Service 63,473 228,629 228,629 151,099 228,629 228,911 0.10%
60383 57200 Building Improvements 57,987 205,000 234,001 209,271 234,061 250,000 22.00%
Page 265
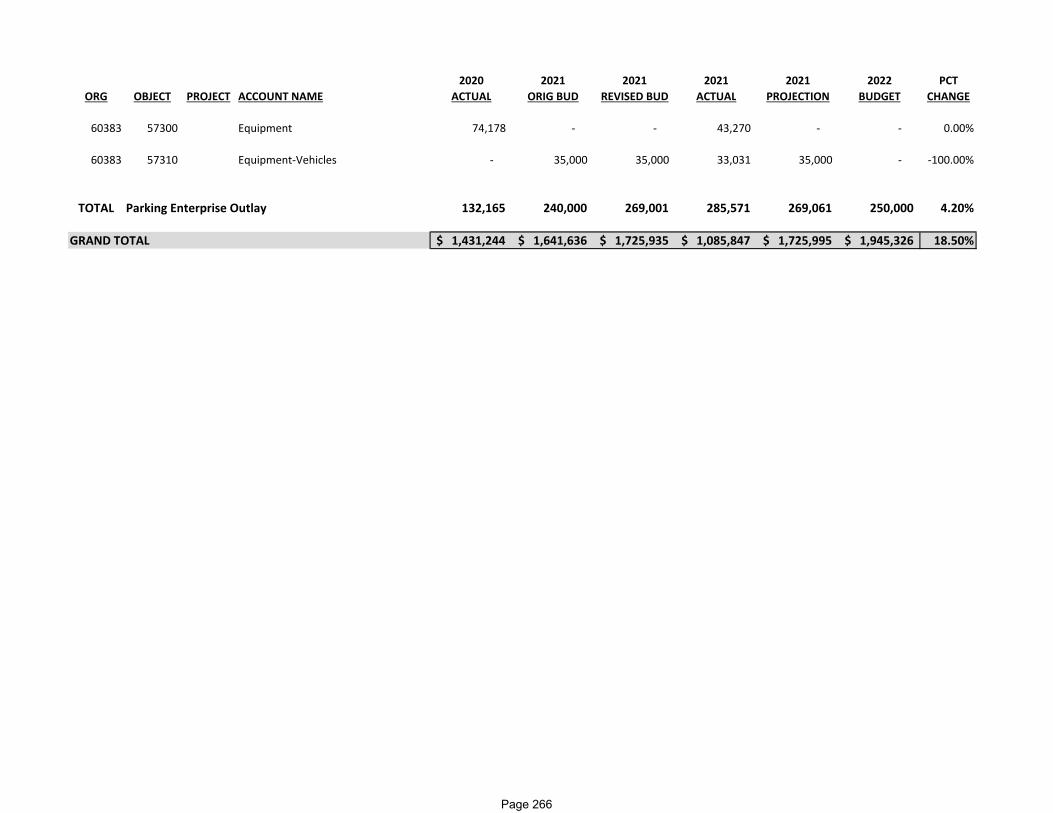
2020 2021 2021 2021 2021 2022 PCTORG OBJECT PROJECT ACCOUNT NAME ACTUAL ORIG BUD REVISED BUD ACTUAL PROJECTION BUDGET CHANGE
60383 57300 Equipment 74,178 ‐ ‐ 43,270 ‐ ‐ 0.00%
60383 57310 Equipment‐Vehicles ‐ 35,000 35,000 33,031 35,000 ‐ ‐100.00%
TOTAL Parking Enterprise Outlay 132,165 240,000 269,001 285,571 269,061 250,000 4.20%
GRAND TOTAL 1,431,244$ 1,641,636$ 1,725,935$ 1,085,847$ 1,725,995$ 1,945,326$ 18.50%
Page 266

2020 2021 2021 2021 2021 2022 PCTORG OBJECT PROJECT ACCOUNT NAME ACTUAL ORIG BUD REVISED BUD ACTUAL PROJECTION BUDGET CHANGE
60383 41222 Sales Tax Discount 49 ‐ ‐ 34 ‐ ‐ 0.00%
TOTAL Taxes 49 ‐ ‐ 34 ‐ ‐ 0.00%
60383 45130 Parking Fines ‐ 59,272 59,272 ‐ 59,272 75,000 26.50%
60383 45222 Judgments/Damages‐Parking ‐ ‐ ‐ 135 ‐ ‐ 0.00%
TOTAL Fines and Forfeiture ‐ 59,272 59,272 135 59,272 75,000 26.50%
60383 46330 Parking Ramp Charges 322,991 520,000 520,000 326,739 520,000 448,000 ‐13.80%
60383 46331 Parking Meter Charges 213,339 400,000 400,000 174,116 400,000 353,882 ‐11.50%
60383 46332 Parking Charges‐Other 26,726 30,000 30,000 30,635 30,000 41,000 36.70%
TOTAL Charges for Services 563,055 950,000 950,000 531,490 950,000 842,882 ‐11.30%
60383 48100 Interest Income 10,644 13,000 13,000 262 13,000 1,000 ‐92.30%
TOTAL Miscellaneous Revenue 10,644 13,000 13,000 262 13,000 1,000 ‐92.30%
PARKING DETAIL REVENUES
Page 267
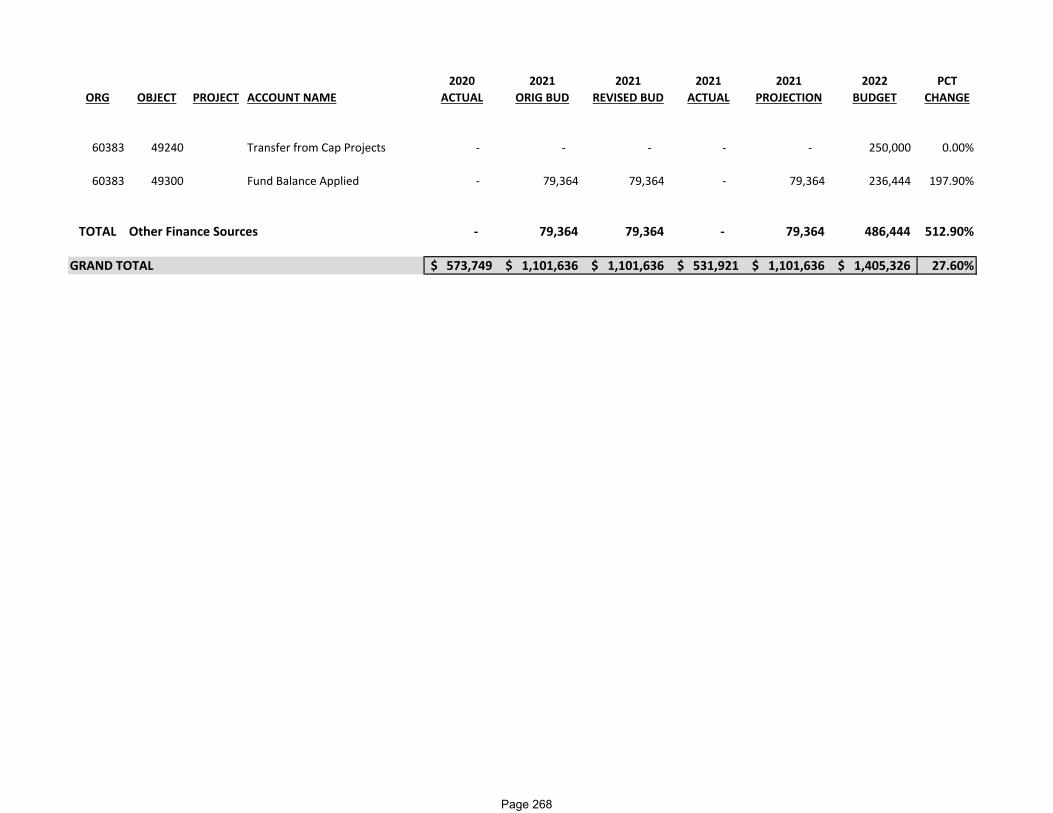
2020 2021 2021 2021 2021 2022 PCTORG OBJECT PROJECT ACCOUNT NAME ACTUAL ORIG BUD REVISED BUD ACTUAL PROJECTION BUDGET CHANGE
60383 49240 Transfer from Cap Projects ‐ ‐ ‐ ‐ ‐ 250,000 0.00%
60383 49300 Fund Balance Applied ‐ 79,364 79,364 ‐ 79,364 236,444 197.90%
TOTAL Other Finance Sources ‐ 79,364 79,364 ‐ 79,364 486,444 512.90%
GRAND TOTAL 573,749$ 1,101,636$ 1,101,636$ 531,921$ 1,101,636$ 1,405,326$ 27.60%
Page 268
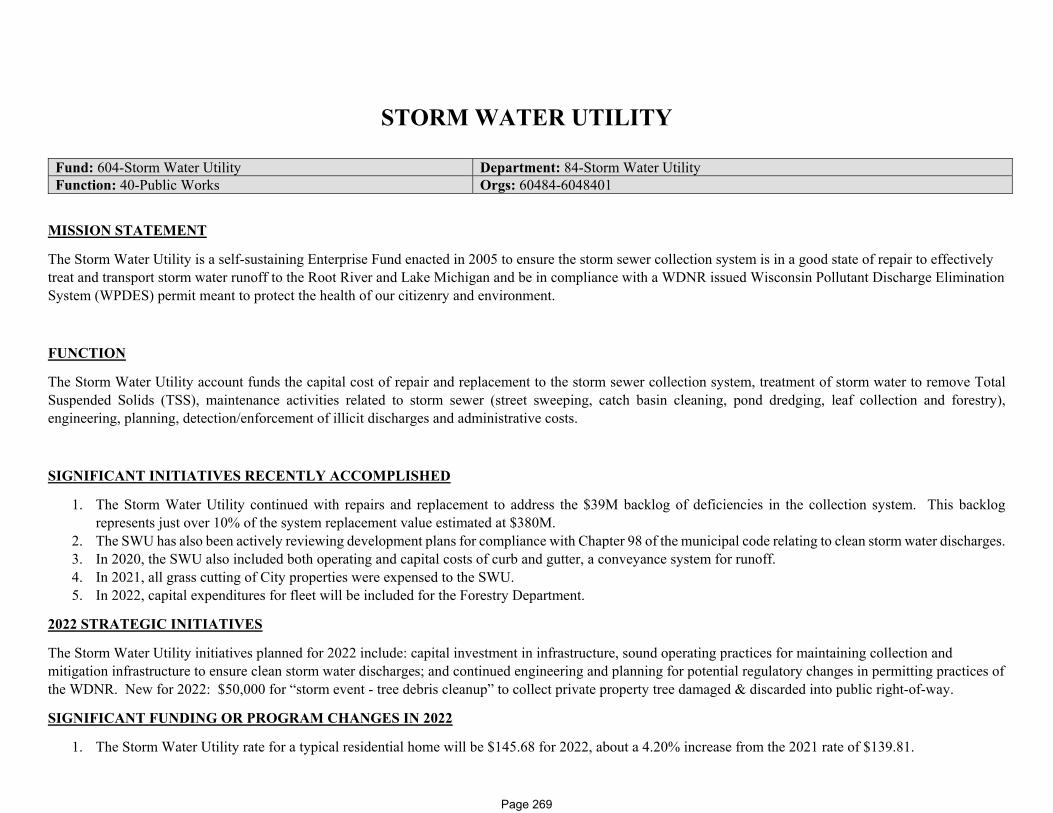
STORM WATER UTILITY
Fund: 604-Storm Water Utility Department: 84-Storm Water Utility Function: 40-Public Works Orgs: 60484-6048401
MISSION STATEMENT
The Storm Water Utility is a self-sustaining Enterprise Fund enacted in 2005 to ensure the storm sewer collection system is in a good state of repair to effectively treat and transport storm water runoff to the Root River and Lake Michigan and be in compliance with a WDNR issued Wisconsin Pollutant Discharge Elimination System (WPDES) permit meant to protect the health of our citizenry and environment.
FUNCTION
The Storm Water Utility account funds the capital cost of repair and replacement to the storm sewer collection system, treatment of storm water to remove Total Suspended Solids (TSS), maintenance activities related to storm sewer (street sweeping, catch basin cleaning, pond dredging, leaf collection and forestry), engineering, planning, detection/enforcement of illicit discharges and administrative costs.
SIGNIFICANT INITIATIVES RECENTLY ACCOMPLISHED
1. The Storm Water Utility continued with repairs and replacement to address the $39M backlog of deficiencies in the collection system. This backlog represents just over 10% of the system replacement value estimated at $380M.
2. The SWU has also been actively reviewing development plans for compliance with Chapter 98 of the municipal code relating to clean storm water discharges. 3. In 2020, the SWU also included both operating and capital costs of curb and gutter, a conveyance system for runoff. 4. In 2021, all grass cutting of City properties were expensed to the SWU. 5. In 2022, capital expenditures for fleet will be included for the Forestry Department.
2022 STRATEGIC INITIATIVES
The Storm Water Utility initiatives planned for 2022 include: capital investment in infrastructure, sound operating practices for maintaining collection and mitigation infrastructure to ensure clean storm water discharges; and continued engineering and planning for potential regulatory changes in permitting practices of the WDNR. New for 2022: $50,000 for “storm event - tree debris cleanup” to collect private property tree damaged & discarded into public right-of-way.
SIGNIFICANT FUNDING OR PROGRAM CHANGES IN 2022
1. The Storm Water Utility rate for a typical residential home will be $145.68 for 2022, about a 4.20% increase from the 2021 rate of $139.81.
Page 269

This page is intentionally left blank
Page 270

Fund: 604 - Storm Water UtilityDepartment 84 - Storm Water UtilityOrg: 60484-6048401
2021 20212020 Original Revised 2021 2022
Actual Budget Budget Estimated BudgetExpenditures by Appropriation Unit
84EN1 Salaries & Fringes 2,255,858$ 2,232,161$ 2,232,161$ 2,232,711$ 2,254,942$ 84EN2 Operating Expenditures 2,136,466 2,676,481 2,786,908 2,784,348 2,892,495 84EN3 Inter-Departmental 1,031,900 1,126,103 1,126,103 1,126,103 1,135,728 84EN4 Capital Outlay 242,820 2,527,000 3,003,935 3,112,471 2,810,000
Other Financing Uses - - - - - Total Expenditures 5,667,044$ 8,561,745$ 9,149,107$ 9,255,633$ 9,093,165$
Expenditures by Division60484 Storm Water 4,598,599$ 7,356,196$ 7,881,698$ 7,990,234$ 7,696,463$
6048401 Forestry 1,068,445 1,205,549 1,267,409 1,265,399 1,396,702 5,667,044$ 8,561,745$ 9,149,107$ 9,255,633$ 9,093,165$
Revenues by CategoryProperty Taxes -$ -$ -$ -$ -$ Intergovernmental Revenues - - - - - Licenses and Permits - - - - - Fines and Forfeitures - - - - - Charges for Services 6,432,341 6,962,120 6,962,120 6,962,120 7,154,102 Intergovernmental Charges for Services 2,730 - - - - Miscellaneous Revenues 80,422 153,625 153,625 153,625 189,000 Other Financing Sources - - - - 304,063
6,515,493$ 7,115,745$ 7,115,745$ 7,115,745$ 7,647,165$
Net Profit (Loss) 848,449$ (1,446,000)$ (2,033,362)$ (2,139,888)$ (1,446,000)$ Non Cash Items:
Depreciation 1,448,686$ 1,446,000$ 1,446,000$ 1,446,000$ 1,446,000$ Compensated Absenses - - - - -
1,448,686$ 1,446,000$ 1,446,000$ 1,446,000$ 1,446,000$
STORM WATER UTILITYEnterprise Fund Summary of Expenditures and Revenues
Page 271

2020 2021 2021 2021 2021 2022 PCTORG OBJECT PROJECT ACCOUNT NAME ACTUAL ORIG BUD REVISED BUD ACTUAL PROJECTION BUDGET CHANGE
6048401 50100 Full Time Salaries 480,726 477,918 477,918 346,821 477,918 484,667 1.40%
6048401 50200 Part Time Salaries 79,902 108,516 108,516 71,977 108,516 131,520 21.20%
6048401 50300 Overtime 350 ‐ ‐ 225 ‐ 5,000 0.00%
6048401 51010 FICA 41,901 44,860 44,860 31,073 44,860 47,522 5.90%
6048401 51100 WRS 35,204 35,338 35,338 24,846 35,338 33,771 ‐4.40%
6048401 51200 Health Care 126,360 84,240 84,240 63,180 84,240 84,240 0.00%
6048401 51600 Clothing Allowance 484 ‐ ‐ ‐ 550 550 0.00%
6048401 51830 13003 Employee Reimbursement‐Cyber 578 ‐ ‐ ‐ ‐ ‐ 0.00%
60484 50100 Salaries 975,790 1,013,846 1,013,846 452,331 1,013,846 995,281 ‐1.80%
60484 50200 Part Time Salaries 6,978 5,062 5,062 3,090 5,062 15,379 203.80%
60484 50300 Overtime 20,276 5,000 5,000 2,869 5,000 ‐ ‐100.00%
60484 51010 FICA 73,303 77,941 77,941 33,237 77,941 77,312 ‐0.80%
60484 51100 WRS 165,995 68,436 68,436 30,730 68,436 64,695 ‐5.50%
60484 51200 Health Care 240,545 310,004 310,004 232,503 310,004 314,005 1.30%
60484 51300 Life Insurance 2,550 ‐ ‐ ‐ ‐ ‐ 0.00%
60484 51810 Mileage 2,337 1,000 1,000 830 1,000 1,000 0.00%
60484 51900 Compensated Absences 2,579 ‐ ‐ ‐ ‐ ‐ 0.00%
STORM WATER UTILITY DETAIL EXPENDITURES
Page 272
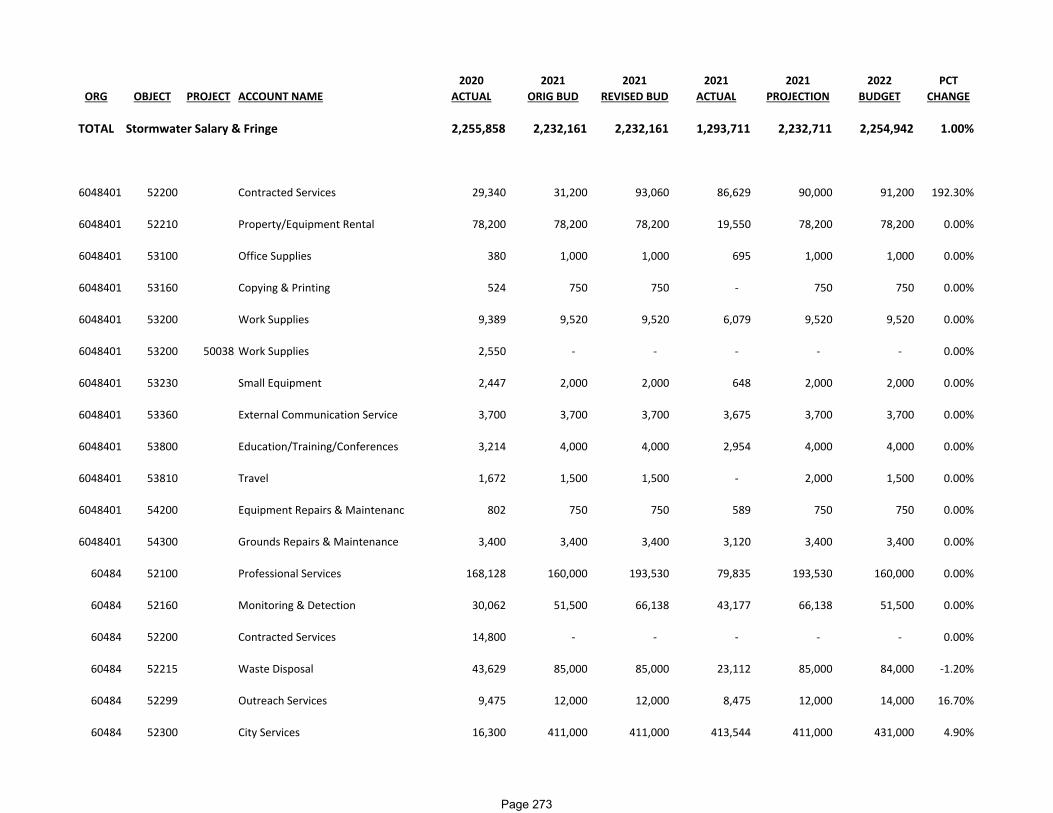
2020 2021 2021 2021 2021 2022 PCTORG OBJECT PROJECT ACCOUNT NAME ACTUAL ORIG BUD REVISED BUD ACTUAL PROJECTION BUDGET CHANGE
TOTAL Stormwater Salary & Fringe 2,255,858 2,232,161 2,232,161 1,293,711 2,232,711 2,254,942 1.00%
6048401 52200 Contracted Services 29,340 31,200 93,060 86,629 90,000 91,200 192.30%
6048401 52210 Property/Equipment Rental 78,200 78,200 78,200 19,550 78,200 78,200 0.00%
6048401 53100 Office Supplies 380 1,000 1,000 695 1,000 1,000 0.00%
6048401 53160 Copying & Printing 524 750 750 ‐ 750 750 0.00%
6048401 53200 Work Supplies 9,389 9,520 9,520 6,079 9,520 9,520 0.00%
6048401 53200 50038 Work Supplies 2,550 ‐ ‐ ‐ ‐ ‐ 0.00%
6048401 53230 Small Equipment 2,447 2,000 2,000 648 2,000 2,000 0.00%
6048401 53360 External Communication Service 3,700 3,700 3,700 3,675 3,700 3,700 0.00%
6048401 53800 Education/Training/Conferences 3,214 4,000 4,000 2,954 4,000 4,000 0.00%
6048401 53810 Travel 1,672 1,500 1,500 ‐ 2,000 1,500 0.00%
6048401 54200 Equipment Repairs & Maintenanc 802 750 750 589 750 750 0.00%
6048401 54300 Grounds Repairs & Maintenance 3,400 3,400 3,400 3,120 3,400 3,400 0.00%
60484 52100 Professional Services 168,128 160,000 193,530 79,835 193,530 160,000 0.00%
60484 52160 Monitoring & Detection 30,062 51,500 66,138 43,177 66,138 51,500 0.00%
60484 52200 Contracted Services 14,800 ‐ ‐ ‐ ‐ ‐ 0.00%
60484 52215 Waste Disposal 43,629 85,000 85,000 23,112 85,000 84,000 ‐1.20%
60484 52299 Outreach Services 9,475 12,000 12,000 8,475 12,000 14,000 16.70%
60484 52300 City Services 16,300 411,000 411,000 413,544 411,000 431,000 4.90%
Page 273
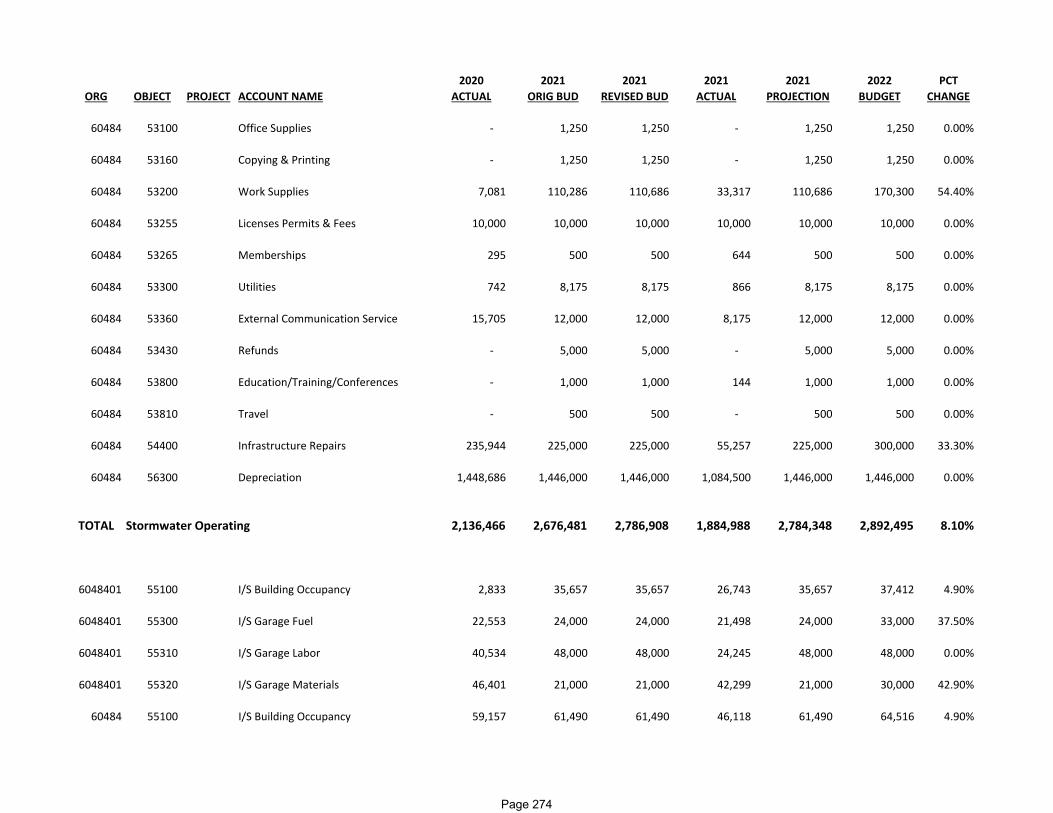
2020 2021 2021 2021 2021 2022 PCTORG OBJECT PROJECT ACCOUNT NAME ACTUAL ORIG BUD REVISED BUD ACTUAL PROJECTION BUDGET CHANGE
60484 53100 Office Supplies ‐ 1,250 1,250 ‐ 1,250 1,250 0.00%
60484 53160 Copying & Printing ‐ 1,250 1,250 ‐ 1,250 1,250 0.00%
60484 53200 Work Supplies 7,081 110,286 110,686 33,317 110,686 170,300 54.40%
60484 53255 Licenses Permits & Fees 10,000 10,000 10,000 10,000 10,000 10,000 0.00%
60484 53265 Memberships 295 500 500 644 500 500 0.00%
60484 53300 Utilities 742 8,175 8,175 866 8,175 8,175 0.00%
60484 53360 External Communication Service 15,705 12,000 12,000 8,175 12,000 12,000 0.00%
60484 53430 Refunds ‐ 5,000 5,000 ‐ 5,000 5,000 0.00%
60484 53800 Education/Training/Conferences ‐ 1,000 1,000 144 1,000 1,000 0.00%
60484 53810 Travel ‐ 500 500 ‐ 500 500 0.00%
60484 54400 Infrastructure Repairs 235,944 225,000 225,000 55,257 225,000 300,000 33.30%
60484 56300 Depreciation 1,448,686 1,446,000 1,446,000 1,084,500 1,446,000 1,446,000 0.00%
TOTAL Stormwater Operating 2,136,466 2,676,481 2,786,908 1,884,988 2,784,348 2,892,495 8.10%
6048401 55100 I/S Building Occupancy 2,833 35,657 35,657 26,743 35,657 37,412 4.90%
6048401 55300 I/S Garage Fuel 22,553 24,000 24,000 21,498 24,000 33,000 37.50%
6048401 55310 I/S Garage Labor 40,534 48,000 48,000 24,245 48,000 48,000 0.00%
6048401 55320 I/S Garage Materials 46,401 21,000 21,000 42,299 21,000 30,000 42.90%
60484 55100 I/S Building Occupancy 59,157 61,490 61,490 46,118 61,490 64,516 4.90%
Page 274
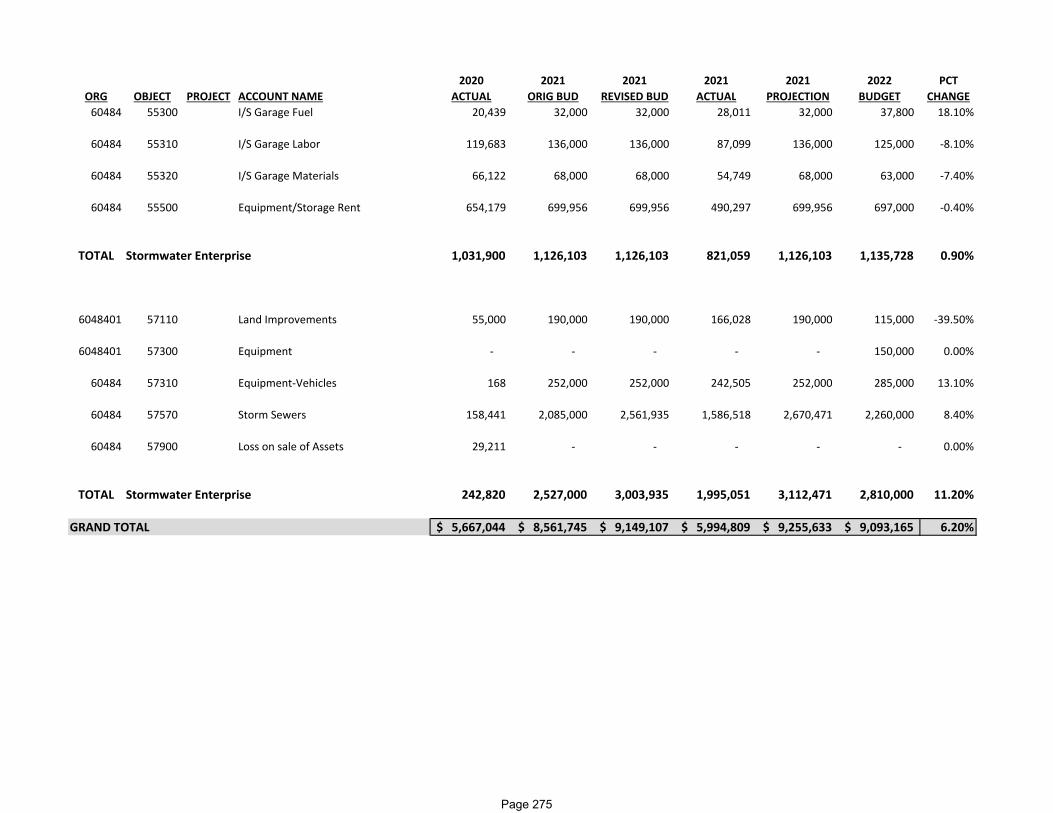
2020 2021 2021 2021 2021 2022 PCTORG OBJECT PROJECT ACCOUNT NAME ACTUAL ORIG BUD REVISED BUD ACTUAL PROJECTION BUDGET CHANGE60484 55300 I/S Garage Fuel 20,439 32,000 32,000 28,011 32,000 37,800 18.10%
60484 55310 I/S Garage Labor 119,683 136,000 136,000 87,099 136,000 125,000 ‐8.10%
60484 55320 I/S Garage Materials 66,122 68,000 68,000 54,749 68,000 63,000 ‐7.40%
60484 55500 Equipment/Storage Rent 654,179 699,956 699,956 490,297 699,956 697,000 ‐0.40%
TOTAL Stormwater Enterprise 1,031,900 1,126,103 1,126,103 821,059 1,126,103 1,135,728 0.90%
6048401 57110 Land Improvements 55,000 190,000 190,000 166,028 190,000 115,000 ‐39.50%
6048401 57300 Equipment ‐ ‐ ‐ ‐ ‐ 150,000 0.00%
60484 57310 Equipment‐Vehicles 168 252,000 252,000 242,505 252,000 285,000 13.10%
60484 57570 Storm Sewers 158,441 2,085,000 2,561,935 1,586,518 2,670,471 2,260,000 8.40%
60484 57900 Loss on sale of Assets 29,211 ‐ ‐ ‐ ‐ ‐ 0.00%
TOTAL Stormwater Enterprise 242,820 2,527,000 3,003,935 1,995,051 3,112,471 2,810,000 11.20%
GRAND TOTAL 5,667,044$ 8,561,745$ 9,149,107$ 5,994,809$ 9,255,633$ 9,093,165$ 6.20%
Page 275
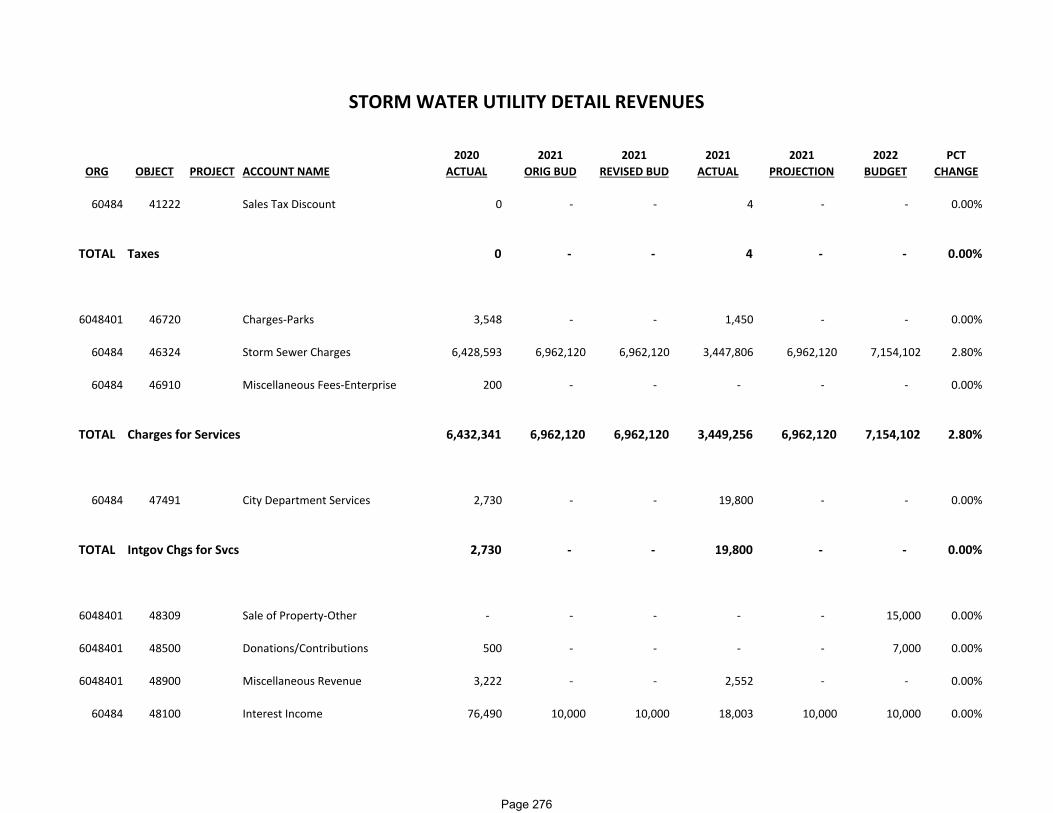
2020 2021 2021 2021 2021 2022 PCTORG OBJECT PROJECT ACCOUNT NAME ACTUAL ORIG BUD REVISED BUD ACTUAL PROJECTION BUDGET CHANGE
60484 41222 Sales Tax Discount 0 ‐ ‐ 4 ‐ ‐ 0.00%
TOTAL Taxes 0 ‐ ‐ 4 ‐ ‐ 0.00%
6048401 46720 Charges‐Parks 3,548 ‐ ‐ 1,450 ‐ ‐ 0.00%
60484 46324 Storm Sewer Charges 6,428,593 6,962,120 6,962,120 3,447,806 6,962,120 7,154,102 2.80%
60484 46910 Miscellaneous Fees‐Enterprise 200 ‐ ‐ ‐ ‐ ‐ 0.00%
TOTAL Charges for Services 6,432,341 6,962,120 6,962,120 3,449,256 6,962,120 7,154,102 2.80%
60484 47491 City Department Services 2,730 ‐ ‐ 19,800 ‐ ‐ 0.00%
TOTAL Intgov Chgs for Svcs 2,730 ‐ ‐ 19,800 ‐ ‐ 0.00%
6048401 48309 Sale of Property‐Other ‐ ‐ ‐ ‐ ‐ 15,000 0.00%
6048401 48500 Donations/Contributions 500 ‐ ‐ ‐ ‐ 7,000 0.00%
6048401 48900 Miscellaneous Revenue 3,222 ‐ ‐ 2,552 ‐ ‐ 0.00%
60484 48100 Interest Income 76,490 10,000 10,000 18,003 10,000 10,000 0.00%
STORM WATER UTILITY DETAIL REVENUES
Page 276

2020 2021 2021 2021 2021 2022 PCTORG OBJECT PROJECT ACCOUNT NAME ACTUAL ORIG BUD REVISED BUD ACTUAL PROJECTION BUDGET CHANGE60484 48303 Sale of Property‐Storm Water ‐ 23,625 23,625 87,635 23,625 3,000 ‐87.30%
60484 48900 Miscellaneous Revenue 211 120,000 120,000 ‐ 120,000 154,000 28.30%
60484 48910 Over/Short (1) ‐ ‐ ‐ ‐ ‐ 0.00%
TOTAL Miscellaneous Revenue 80,422 153,625 153,625 108,189 153,625 189,000 23.00%
60484 49300 Fund Balance Applied ‐ ‐ ‐ ‐ ‐ 304,063 0.00%
TOTAL Other Financ Sources ‐ ‐ ‐ ‐ ‐ 304,063 0.00%
GRAND TOTAL 6,515,493$ 7,115,745$ 7,115,745$ 3,577,249$ 7,115,745$ 7,647,165$ 7.50%
Page 277

This page is intentionally left blank
Page 278

CIVIC CENTRE
Fund: 606-Civic Centre Department: 86-Civic Centre Function: 50-Education and Recreation Orgs: 60686
FUNCTION
The Racine Civic Centre is a combination of the Festival Park and Memorial Hall. Festival Park has indoor space of 18,000 square feet and approximately five acres of outdoor park event areas including the Paul P Harris Rotary Park. Memorial Hall is a historic facility that features 4 major event areas and a total of over 17,000 square feet. Nestled on the shored of Lake Michigan, the Racine Civic Centre offers the perfect setting for community events, weddings, banquets, concerts, meetings and more. The operations of the Racine Civic Centre are managed by Venuworks, a private management company.
Page 279

This page is intentionally left blank
Page 280

Fund: 606 - Civic CenterDepartment 86 - Civic CenterOrg: 60686
2021 20212020 Original Revised 2021 2022
Actual Budget Budget Estimated BudgetExpenditures by Appropriation Unit
86EN1 Salaries & Fringes -$ -$ -$ -$ -$ 86EN2 Operating Expenditures 642,643 661,000 661,097 661,097 649,000 86EN3 Inter-Departmental - - - - - 86EN4 Capital Outlay - 375,000 375,000 375,000
Other Financing Uses - - - - - Total Expenditures 642,643$ 1,036,000$ 1,036,097$ 1,036,097$ 649,000$
Revenues by CategoryProperty Taxes 296,000$ 296,000$ 296,000$ 296,000$ 299,000$ Intergovernmental Revenues - - - - - Licenses and Permits - - - - - Fines and Forfeitures - - - - - Charges for Services - - - - - Intergovernmental Charges for Services - - - - - Miscellaneous Revenues - - - - - Other Financing Sources - 375,000 375,000 375,000 -
296,000$ 671,000$ 671,000$ 671,000$ 299,000$
Net Profit (Loss) (346,643)$ (365,000)$ (365,097)$ (365,097)$ (350,000)$ Non Cash Items:
Depreciation 347,740$ 365,000$ 365,000$ 365,000$ 350,000$ Compensated Absenses - - - - -
347,740$ 365,000$ 365,000$ 365,000$ 350,000$
CIVIC CENTREEnterprise Fund Summary of Expenditures and Revenues
Page 281
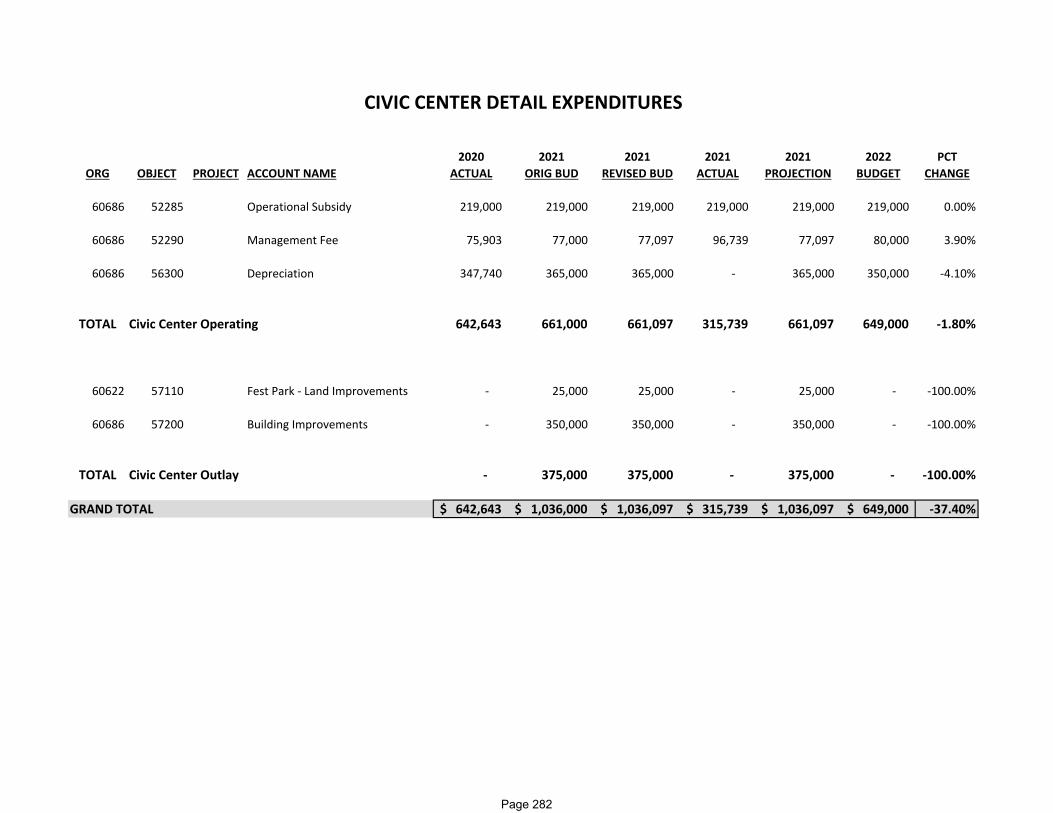
2020 2021 2021 2021 2021 2022 PCTORG OBJECT PROJECT ACCOUNT NAME ACTUAL ORIG BUD REVISED BUD ACTUAL PROJECTION BUDGET CHANGE
60686 52285 Operational Subsidy 219,000 219,000 219,000 219,000 219,000 219,000 0.00%
60686 52290 Management Fee 75,903 77,000 77,097 96,739 77,097 80,000 3.90%
60686 56300 Depreciation 347,740 365,000 365,000 ‐ 365,000 350,000 ‐4.10%
TOTAL Civic Center Operating 642,643 661,000 661,097 315,739 661,097 649,000 ‐1.80%
60622 57110 Fest Park ‐ Land Improvements ‐ 25,000 25,000 ‐ 25,000 ‐ ‐100.00%
60686 57200 Building Improvements ‐ 350,000 350,000 ‐ 350,000 ‐ ‐100.00%
TOTAL Civic Center Outlay ‐ 375,000 375,000 ‐ 375,000 ‐ ‐100.00%
GRAND TOTAL 642,643$ 1,036,000$ 1,036,097$ 315,739$ 1,036,097$ 649,000$ ‐37.40%
CIVIC CENTER DETAIL EXPENDITURES
Page 282
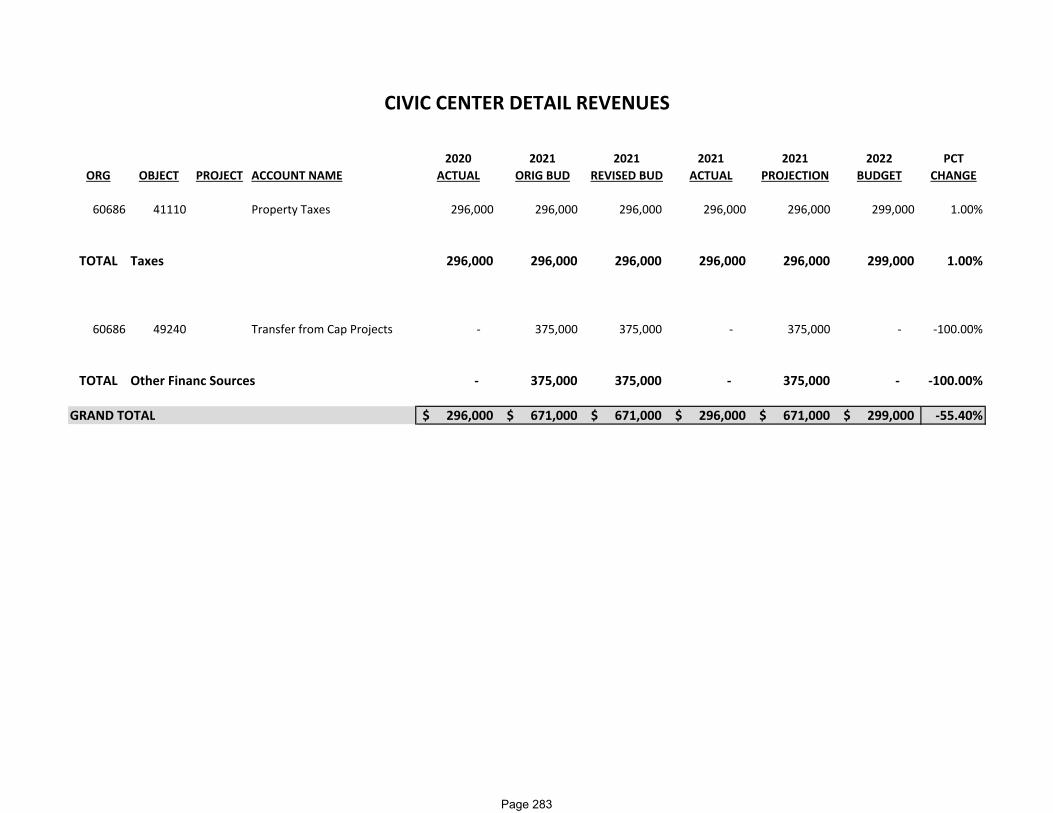
2020 2021 2021 2021 2021 2022 PCTORG OBJECT PROJECT ACCOUNT NAME ACTUAL ORIG BUD REVISED BUD ACTUAL PROJECTION BUDGET CHANGE
60686 41110 Property Taxes 296,000 296,000 296,000 296,000 296,000 299,000 1.00%
TOTAL Taxes 296,000 296,000 296,000 296,000 296,000 299,000 1.00%
60686 49240 Transfer from Cap Projects ‐ 375,000 375,000 ‐ 375,000 ‐ ‐100.00%
TOTAL Other Financ Sources ‐ 375,000 375,000 ‐ 375,000 ‐ ‐100.00%
GRAND TOTAL 296,000$ 671,000$ 671,000$ 296,000$ 671,000$ 299,000$ ‐55.40%
CIVIC CENTER DETAIL REVENUES
Page 283

This page is intentionally left blank
Page 284
RADIO COMMUNICATION RESOURCES
Fund: 607-Radio Communication Resources Enterprise Department: 87-Radio Communications Function: 30-Public Safety Orgs: 60787
MISSION STATEMENT
The City's Radio Communication Resources Department is responsible for developing, installing, and maintaining radio communication networks and equipment for Racine Police, Fire, EMS, DPW, as well as Racine County Joint Dispatch and many other governmental units and departments within the City and County of Racine. Our department is dedicated to providing high quality professional services at the lowest possible cost to ensure that dispatch and communication systems are secure, resilient, interoperable, and cost-effective to meet the needs of our public safety and governmental users. By coordinating county-wide wireless technology services within a single enterprise operation, we strive to maximize efficiencies, reduce technology system costs, foster inter-agency cooperation, and maintain radio interoperability.
FUNCTION
The Radio Communication Resources department is an element of the Racine Police Department reporting to the Chief of Police. Our department handles all wireless communication technology needs for the Racine Police Department, Racine County Joint Dispatch, and most public safety agencies within Racine County. Our duties include:
1. Managing the day-to-day operation, repair and maintenance of all PD, FD, DPW radio systems, communication networks and related equipment. Includes over 1200 portable and mobile radios and 47 radio base station transmitters at 20 locations across the City and County.
2. Maintain and ensure the proper operation of Racine County Communication Center dispatch console equipment, fire station alerting and severe weather siren activation systems.
3. Repair and troubleshooting of radio systems, microwave and fiber networks, portables, mobiles, towers, site facilities, and emergency backup systems. 4. This includes 24/7 response for radio system, dispatch center, and radio network issues. 5. Install, repair, troubleshoot, and maintain all squad car radio and technology equipment for the Racine Police Department, including lighting, sirens, radar,
video, computer equipment, and body-worn cameras. Repair and maintain squad equipment for other client agencies as requested. 6. Provide training, technical support, design, engineering, long‐term planning and project management services to public safety agencies based on their
specific needs.
7. Manage Federal Communication Commission (FCC) licensing, registration, and compliance for all City, County, and Township radio frequencies, towers & facilities.
Page 285
RADIO COMMUNICATION RESOURCES
Fund: 607-Radio Communication Resources Enterprise Department: 87-Radio Communications Function: 30-Public Safety Orgs: 60787
SIGNIFICANT INITIATIVES RECENTLY ACCOMPLISHED
1. Completion of Racine Police Department digital radio upgrade project. 2. Work with RCCC Joint Dispatch to replace microwave transport networks at several sites as part of a multi-year technology replacement project. 3. Retrofit and integrate new technology network modems and squad video equipment (body-worn camera docks into existing RAPID squads.
2022 STRATEGIC INITIATIVES
1. Continue development of long-term technology upgrade planning for first-responder communication equipment, networks, and dispatch within the City and County.
2. Continue retrofits/upgrades of new technology wireless modems, license plate readers, radar, and squad video systems/body-worn camera docks into RAPID squads.
3. Continue to review existing channels, equipment, sites and functions, and evaluating future first-responder / stakeholder needs for voice and data services.
SIGNIFICANT FUNDING OR PROGRAM CHANGES IN 2022
No significant budgetary changes are anticipated for 2022
Page 286
2022 Goal‐Setting Statement Department Name: Radio Communication Resources Department Head/Staff Name(s): Chief Maurice Robinson/ Deputy Chief Jessie Metoyer
Goal Statement #1 Continue development of long‐term technology upgrade planning for first‐responder communication equipment, networks, and dispatch within the City and County.
Goal Statement #2
Continue retrofits/upgrades of new technology wireless modems, license plate readers, radar, and squad video systems/body‐worn camera docks into RAPD squads.
Goal Statement #3 Continue to review existing channels, equipment, sites and functions, and evaluating future first‐responder / stakeholder needs for voice and data services.
Page 287

This page is intentionally left blank
Page 288
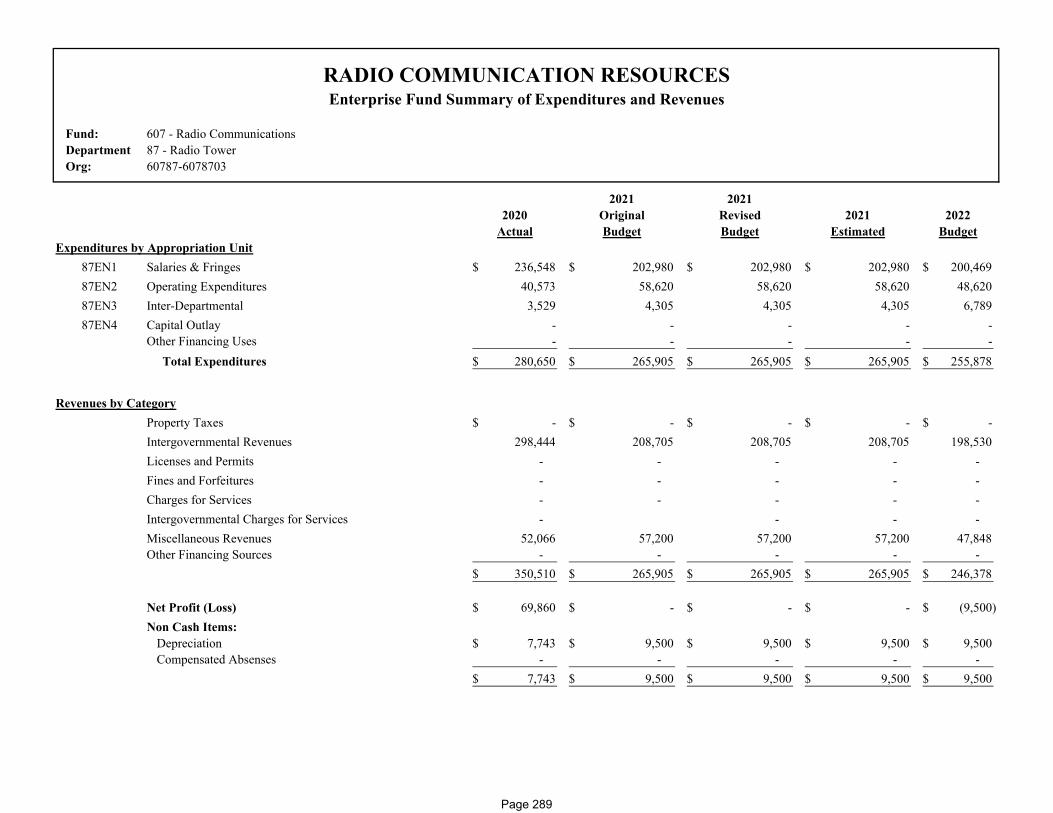
Fund: 607 - Radio CommunicationsDepartment 87 - Radio TowerOrg: 60787-6078703
2021 20212020 Original Revised 2021 2022
Actual Budget Budget Estimated BudgetExpenditures by Appropriation Unit
87EN1 Salaries & Fringes 236,548$ 202,980$ 202,980$ 202,980$ 200,469$ 87EN2 Operating Expenditures 40,573 58,620 58,620 58,620 48,620 87EN3 Inter-Departmental 3,529 4,305 4,305 4,305 6,789 87EN4 Capital Outlay - - - - -
Other Financing Uses - - - - - Total Expenditures 280,650$ 265,905$ 265,905$ 265,905$ 255,878$
Revenues by CategoryProperty Taxes -$ -$ -$ -$ -$ Intergovernmental Revenues 298,444 208,705 208,705 208,705 198,530 Licenses and Permits - - - - - Fines and Forfeitures - - - - - Charges for Services - - - - - Intergovernmental Charges for Services - - - - Miscellaneous Revenues 52,066 57,200 57,200 57,200 47,848 Other Financing Sources - - - - -
350,510$ 265,905$ 265,905$ 265,905$ 246,378$
Net Profit (Loss) 69,860$ -$ -$ -$ (9,500)$ Non Cash Items:
Depreciation 7,743$ 9,500$ 9,500$ 9,500$ 9,500$ Compensated Absenses - - - - -
7,743$ 9,500$ 9,500$ 9,500$ 9,500$
RADIO COMMUNICATION RESOURCESEnterprise Fund Summary of Expenditures and Revenues
Page 289
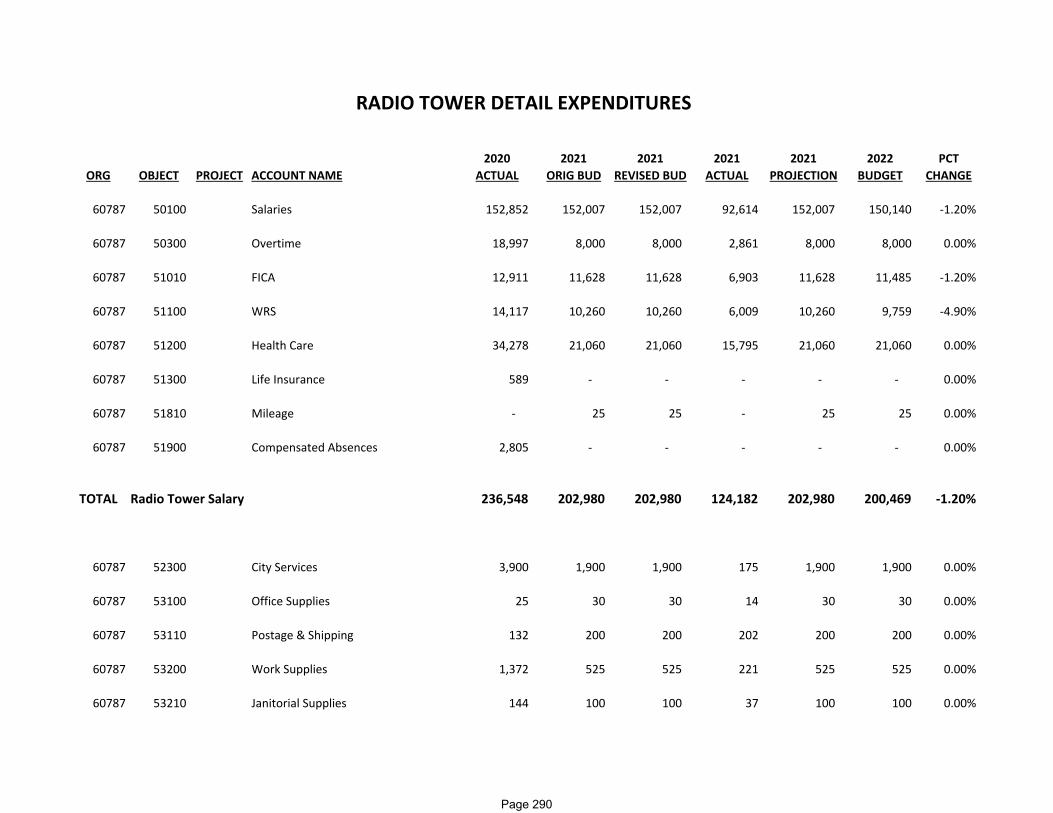
2020 2021 2021 2021 2021 2022 PCTORG OBJECT PROJECT ACCOUNT NAME ACTUAL ORIG BUD REVISED BUD ACTUAL PROJECTION BUDGET CHANGE
60787 50100 Salaries 152,852 152,007 152,007 92,614 152,007 150,140 ‐1.20%
60787 50300 Overtime 18,997 8,000 8,000 2,861 8,000 8,000 0.00%
60787 51010 FICA 12,911 11,628 11,628 6,903 11,628 11,485 ‐1.20%
60787 51100 WRS 14,117 10,260 10,260 6,009 10,260 9,759 ‐4.90%
60787 51200 Health Care 34,278 21,060 21,060 15,795 21,060 21,060 0.00%
60787 51300 Life Insurance 589 ‐ ‐ ‐ ‐ ‐ 0.00%
60787 51810 Mileage ‐ 25 25 ‐ 25 25 0.00%
60787 51900 Compensated Absences 2,805 ‐ ‐ ‐ ‐ ‐ 0.00%
TOTAL Radio Tower Salary 236,548 202,980 202,980 124,182 202,980 200,469 ‐1.20%
60787 52300 City Services 3,900 1,900 1,900 175 1,900 1,900 0.00%
60787 53100 Office Supplies 25 30 30 14 30 30 0.00%
60787 53110 Postage & Shipping 132 200 200 202 200 200 0.00%
60787 53200 Work Supplies 1,372 525 525 221 525 525 0.00%
60787 53210 Janitorial Supplies 144 100 100 37 100 100 0.00%
RADIO TOWER DETAIL EXPENDITURES
Page 290

2020 2021 2021 2021 2021 2022 PCTORG OBJECT PROJECT ACCOUNT NAME ACTUAL ORIG BUD REVISED BUD ACTUAL PROJECTION BUDGET CHANGE60787 53265 Memberships 96 100 100 ‐ 100 100 0.00%
60787 53300 Utilities 9,148 9,240 9,240 6,669 9,240 9,240 0.00%
60787 53360 External Communication Service ‐ 2,050 2,050 552 2,050 2,050 0.00%
60787 54100 Building Repairs & Maintenance 417 475 475 ‐ 475 475 0.00%
60787 54200 Equipment Repairs & Maintenanc 17,596 30,500 30,500 22,865 30,500 20,500 ‐32.80%
60787 56200 Contingency ‐ 4,000 4,000 ‐ 4,000 4,000 0.00%
60787 56300 Depreciation 7,743 9,500 9,500 ‐ 9,500 9,500 0.00%
TOTAL Radio Tower Operating 40,573 58,620 58,620 30,736 58,620 48,620 ‐17.10%
60787 55300 I/S Garage Fuel 332 400 400 198 400 600 50.00%
60787 55310 I/S Garage Labor ‐ ‐ ‐ 60 ‐ 300 0.00%
60787 55320 I/S Garage Materials ‐ ‐ ‐ ‐ ‐ 300 0.00%
60787 55400 I/S Information Systems 3,197 3,905 3,905 2,929 3,905 5,589 43.10%
TOTAL Radio Tower I/S 3,529 4,305 4,305 3,187 4,305 6,789 57.70%
GRAND TOTAL 280,650$ 265,905$ 265,905$ 158,105$ 265,905$ 255,878$ ‐3.80%
Page 291
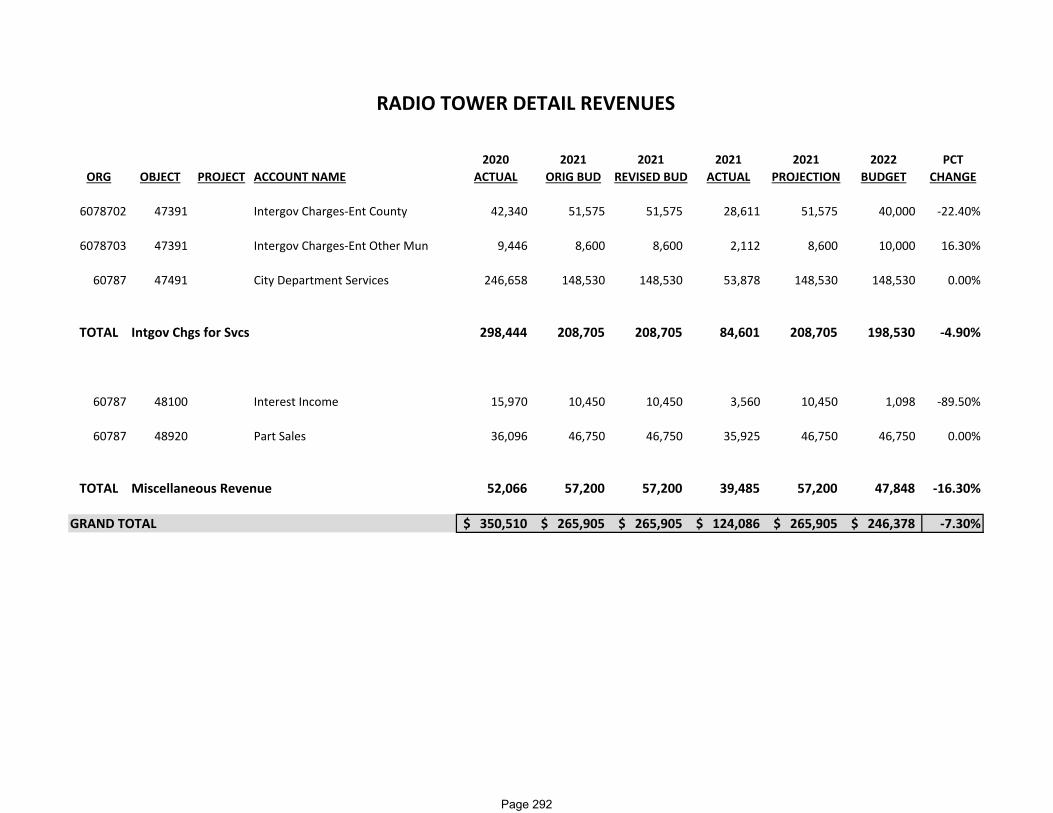
2020 2021 2021 2021 2021 2022 PCTORG OBJECT PROJECT ACCOUNT NAME ACTUAL ORIG BUD REVISED BUD ACTUAL PROJECTION BUDGET CHANGE
6078702 47391 Intergov Charges‐Ent County 42,340 51,575 51,575 28,611 51,575 40,000 ‐22.40%
6078703 47391 Intergov Charges‐Ent Other Mun 9,446 8,600 8,600 2,112 8,600 10,000 16.30%
60787 47491 City Department Services 246,658 148,530 148,530 53,878 148,530 148,530 0.00%
TOTAL Intgov Chgs for Svcs 298,444 208,705 208,705 84,601 208,705 198,530 ‐4.90%
60787 48100 Interest Income 15,970 10,450 10,450 3,560 10,450 1,098 ‐89.50%
60787 48920 Part Sales 36,096 46,750 46,750 35,925 46,750 46,750 0.00%
TOTAL Miscellaneous Revenue 52,066 57,200 57,200 39,485 57,200 47,848 ‐16.30%
GRAND TOTAL 350,510$ 265,905$ 265,905$ 124,086$ 265,905$ 246,378$ ‐7.30%
RADIO TOWER DETAIL REVENUES
Page 292

2021 20212020 Original Revised 2021 2022
Actual Budget Budget Estimated BudgetExpenditures by Appropriation Unit
Salaries & Fringes 3,610,331$ 3,998,000$ 3,998,000$ 3,400,000$ 4,106,000$ Operating Expenditures 15,616,353 15,265,000 15,265,000 15,179,000 15,696,000 Inter-Departmental - - - - - Capital Outlay - - - - - Other Financing Uses 1,563,085 1,437,000 1,437,000 1,993,000 1,698,000 Total Expenditures 20,789,769$ 20,700,000$ 20,700,000$ 20,572,000$ 21,500,000$
Revenues by CategoryProperty Taxes -$ -$ -$ -$ -$ Intergovernmental Revenues - - - - - Licenses and Permits - - - - - Fines and Forfeitures - - - - - Charges for Services 21,422,304 22,782,123 22,782,123 21,882,000 22,782,123 Intergovernmental Charges for Services - - - - - Miscellaneous Revenues 381,803 1,317,174 1,317,174 72,000 1,167,735 Other Financing Sources - - - - -
21,804,107$ 24,099,297$ 24,099,297$ 21,954,000$ 23,949,858$
Net Profit (Loss) 1,014,338$ 3,399,297$ 3,399,297$ 1,382,000$ 2,449,858$ Non Cash Items:
Depreciation/Amortization 5,495,192$ 5,200,000$ 5,200,000$ 5,500,000$ 5,600,000$ Compensated Absenses - - - - -
5,495,192$ 5,200,000$ 5,200,000$ 5,500,000$ 5,600,000$
WATER UTILITYUtility Fund Summary of Expenditures and Revenues
Page 293

Page 294
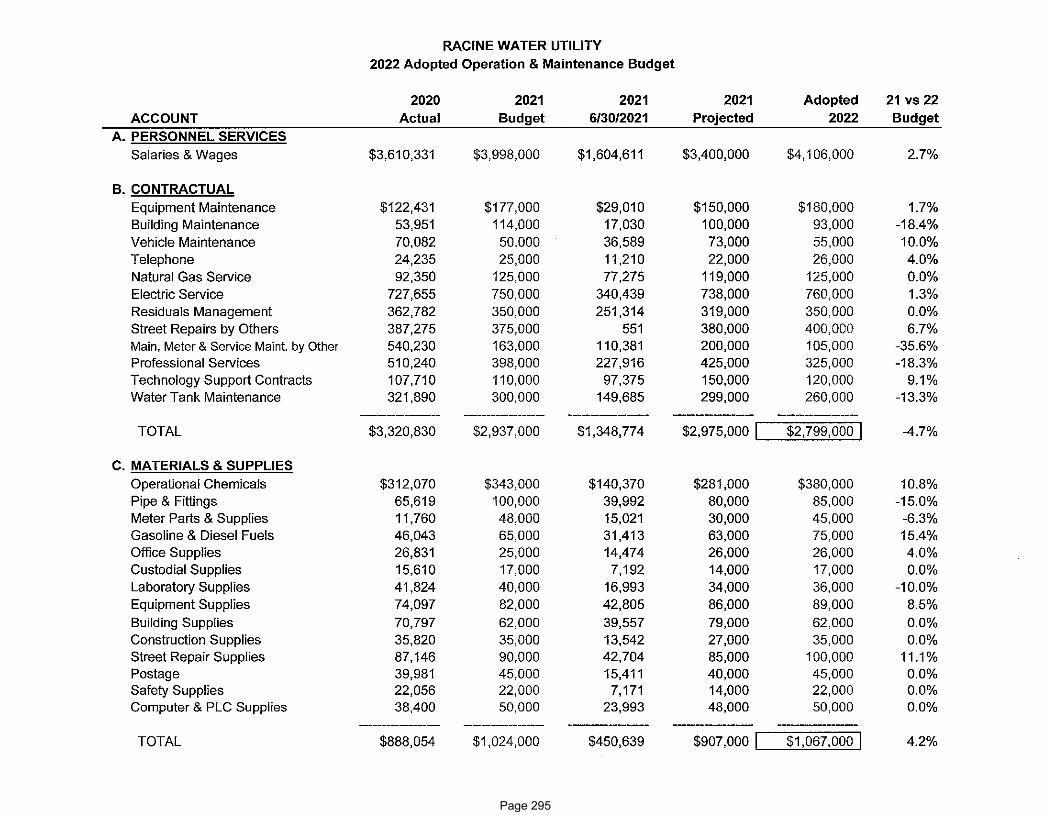
Page 295

Page 296

Page 297

This page is intentionally left blank
Page 298

2021 20212020 Original Revised 2021 2022
Actual Budget Budget Estimated BudgetExpenditures by Appropriation Unit
Salaries & Fringes 3,118,045$ 3,241,000$ 3,241,000$ 2,800,000$ 3,424,000$ Operating Expenditures 8,031,465 8,765,964 8,765,964 8,979,000 8,984,911 Inter-Departmental - - - - - Capital Outlay - - - - - Other Financing Uses 845,266 684,000 684,000 679,000 528,000 Total Expenditures 11,994,776$ 12,690,964$ 12,690,964$ 12,458,000$ 12,936,911$
Revenues by CategoryProperty Taxes -$ -$ -$ -$ -$ Intergovernmental Revenues - - - - - Licenses and Permits - - - - - Fines and Forfeitures - - - - - Charges for Services 12,867,152 12,172,497 12,172,497 11,857,000 12,975,908 Intergovernmental Charges for Services - - - - - Miscellaneous Revenues 2,474,153 2,183,352 2,183,352 2,131,750 2,026,820 Other Financing Sources - - - - -
15,341,305$ 14,355,849$ 14,355,849$ 13,988,750$ 15,002,728$
Net Profit (Loss) 3,346,529$ 1,664,885$ 1,664,885$ 1,530,750$ 2,065,817$ Non Cash Items:
Depreciation/Amortization 2,246,123$ 2,246,964$ 2,246,964$ 2,250,000$ 2,264,911$ Compensated Absenses - - - - -
2,246,123$ 2,246,964$ 2,246,964$ 2,250,000$ 2,264,911$
WASTEWATER UTILITYUtility Fund Summary of Expenditures and Revenues
Page 299

Page 300

Page 301
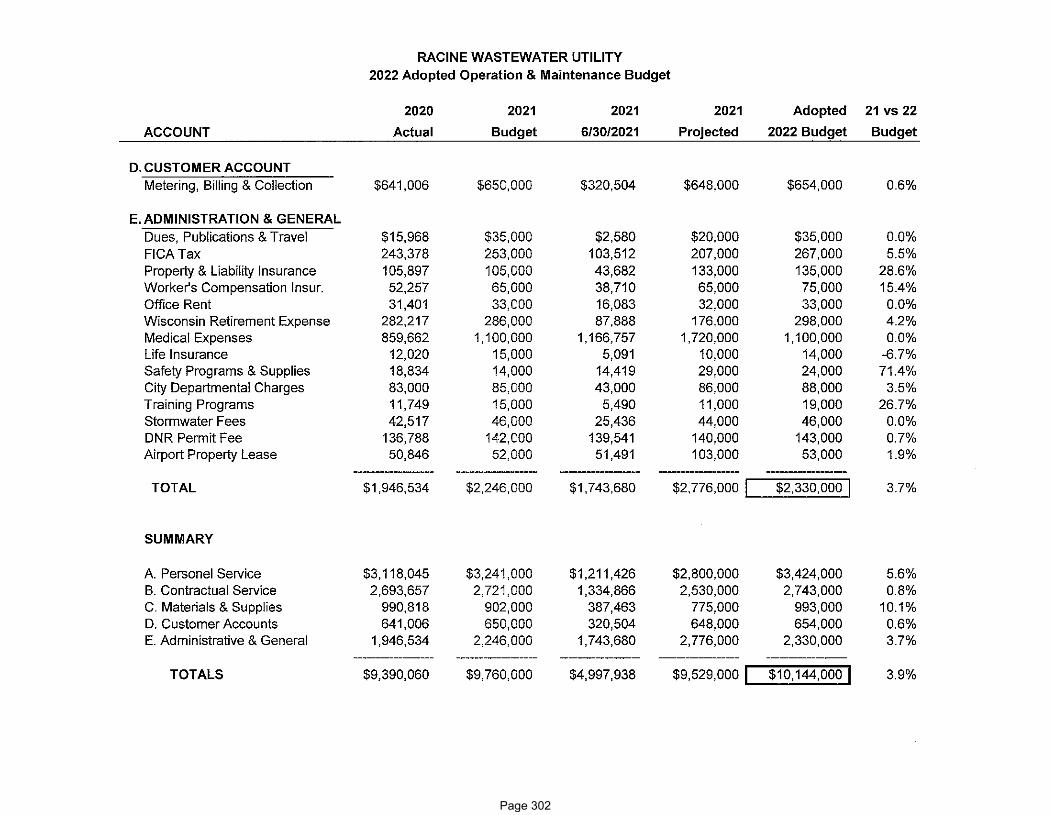
Page 302
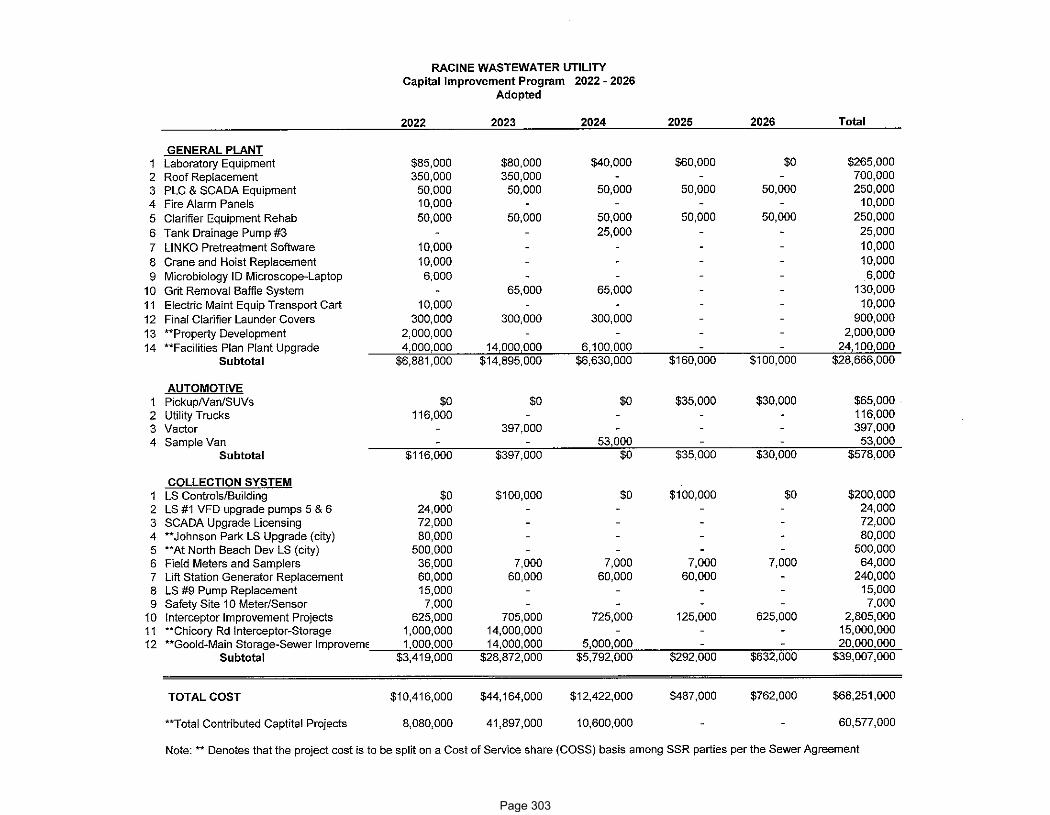
Page 303

This page is intentionally left blank
Page 304
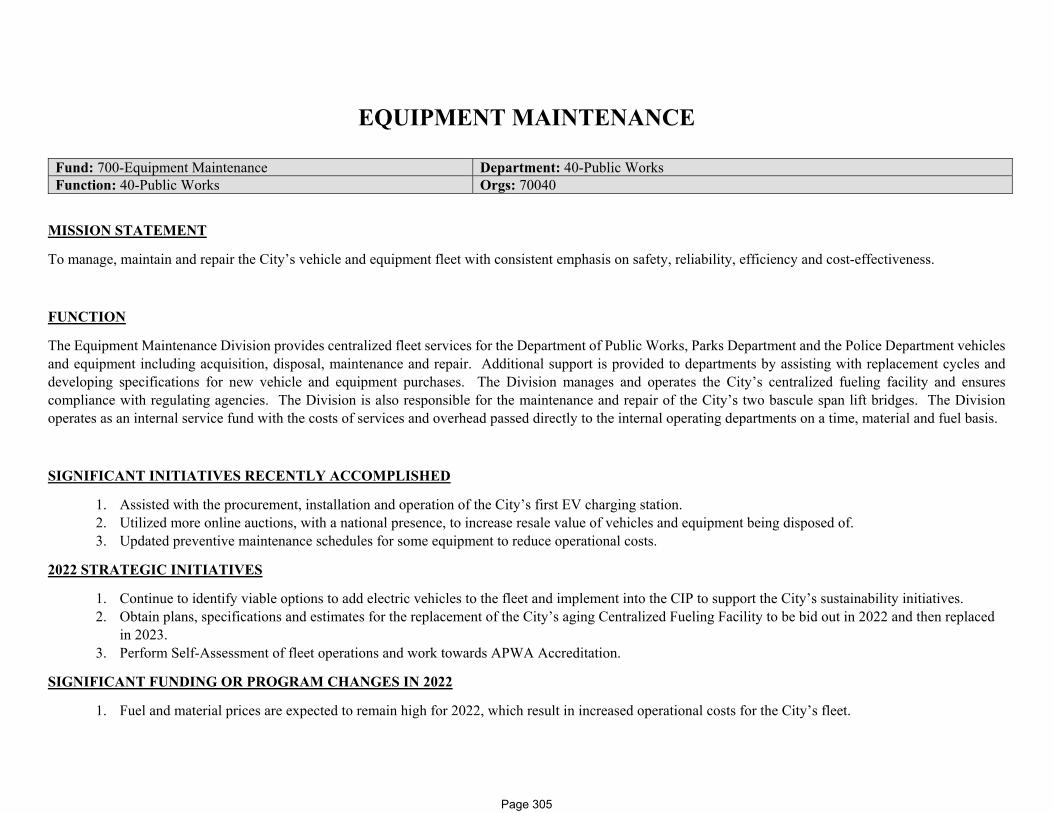
EQUIPMENT MAINTENANCE
Fund: 700-Equipment Maintenance Department: 40-Public Works Function: 40-Public Works Orgs: 70040
MISSION STATEMENT
To manage, maintain and repair the City’s vehicle and equipment fleet with consistent emphasis on safety, reliability, efficiency and cost-effectiveness.
FUNCTION
The Equipment Maintenance Division provides centralized fleet services for the Department of Public Works, Parks Department and the Police Department vehicles and equipment including acquisition, disposal, maintenance and repair. Additional support is provided to departments by assisting with replacement cycles and developing specifications for new vehicle and equipment purchases. The Division manages and operates the City’s centralized fueling facility and ensures compliance with regulating agencies. The Division is also responsible for the maintenance and repair of the City’s two bascule span lift bridges. The Division operates as an internal service fund with the costs of services and overhead passed directly to the internal operating departments on a time, material and fuel basis.
SIGNIFICANT INITIATIVES RECENTLY ACCOMPLISHED
1. Assisted with the procurement, installation and operation of the City’s first EV charging station. 2. Utilized more online auctions, with a national presence, to increase resale value of vehicles and equipment being disposed of. 3. Updated preventive maintenance schedules for some equipment to reduce operational costs.
2022 STRATEGIC INITIATIVES
1. Continue to identify viable options to add electric vehicles to the fleet and implement into the CIP to support the City’s sustainability initiatives. 2. Obtain plans, specifications and estimates for the replacement of the City’s aging Centralized Fueling Facility to be bid out in 2022 and then replaced
in 2023. 3. Perform Self-Assessment of fleet operations and work towards APWA Accreditation.
SIGNIFICANT FUNDING OR PROGRAM CHANGES IN 2022
1. Fuel and material prices are expected to remain high for 2022, which result in increased operational costs for the City’s fleet.
Page 305

This page is intentionally left blank
Page 306

Fund: 700 - Equipment Maintenance GarageFunction: 40 - Public WorksOrg: 70040
2021 20212020 Original Revised 2021 2022
Actual Budget Budget Estimated BudgetExpenditures by Appropriation Unit
7001 Salaries & Fringes 1,997,457$ 2,017,361$ 2,017,361$ 1,751,540$ 2,063,397$ 7002 Operating Expenditures 1,641,422 1,864,200 1,892,304 2,094,300 2,135,300 7003 Inter-Departmental 134,012 135,592 135,592 135,592 151,714 7004 Capital Outlay 7,299 8,000 8,000 8,000 8,000
Other Financing Uses - - - - - Total Expenditures 3,780,190$ 4,025,153$ 4,053,257$ 3,989,432$ 4,358,411$
Revenues by CategoryProperty Taxes -$ -$ -$ -$ -$ Intergovernmental Revenues 22,436 25,000 25,000 23,900 24,500 Licenses and Permits - - - - - Fines and Forfeitures - - - - - Charges for Services 122,448 169,000 169,000 169,000 207,800 Intergovernmental Charges for Services 3,367,782 3,793,250 3,793,250 3,656,650 3,980,050 Miscellaneous Revenues 3,127 500 500 (2,500) 500 Other Financing Sources - 37,403 37,403 37,403 56,561
3,515,793$ 4,025,153$ 4,025,153$ 3,884,453$ 4,269,411$
Net Profit (Loss) (264,397)$ -$ (28,104)$ (104,979)$ (89,000)$ Non Cash Items:
Depreciation 88,430$ 98,000$ 98,000$ 98,000$ 89,000$ Compensated Absenses - - - - -
88,430$ 98,000$ 98,000$ 98,000$ 89,000$
EQUIPMENT MAINTENANCE GARAGEInternal Service Fund Summary of Expenditures and Revenues
Page 307
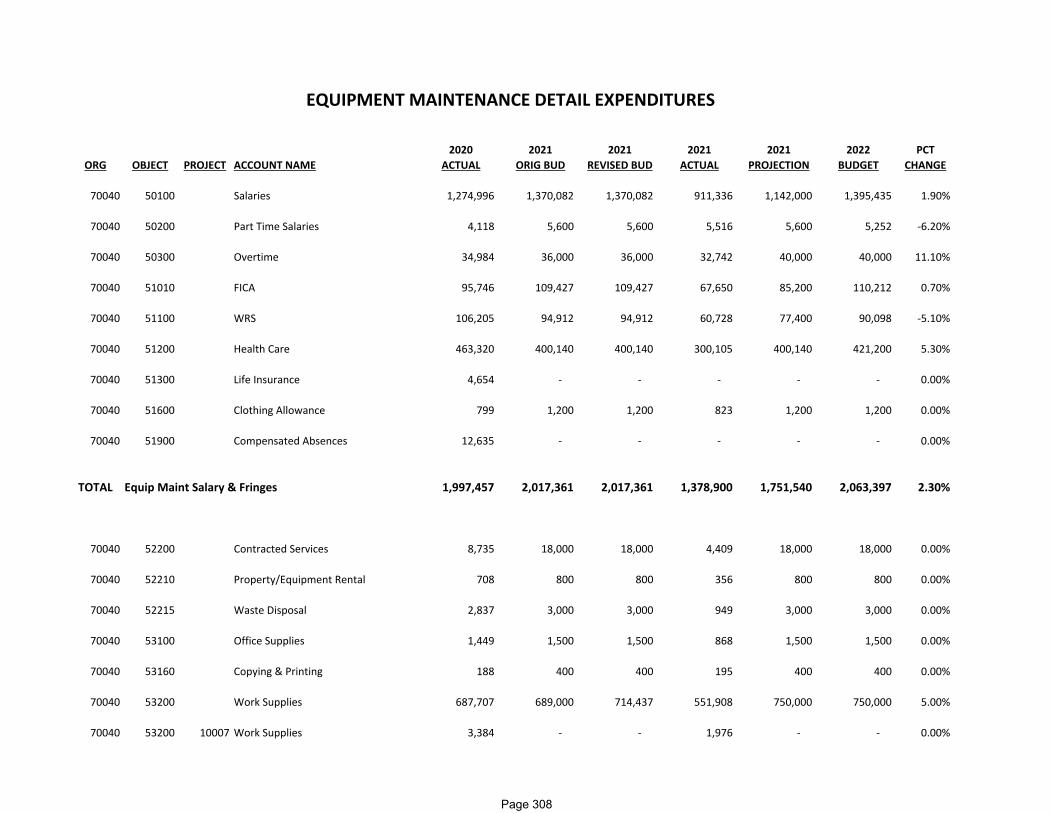
2020 2021 2021 2021 2021 2022 PCTORG OBJECT PROJECT ACCOUNT NAME ACTUAL ORIG BUD REVISED BUD ACTUAL PROJECTION BUDGET CHANGE
70040 50100 Salaries 1,274,996 1,370,082 1,370,082 911,336 1,142,000 1,395,435 1.90%
70040 50200 Part Time Salaries 4,118 5,600 5,600 5,516 5,600 5,252 ‐6.20%
70040 50300 Overtime 34,984 36,000 36,000 32,742 40,000 40,000 11.10%
70040 51010 FICA 95,746 109,427 109,427 67,650 85,200 110,212 0.70%
70040 51100 WRS 106,205 94,912 94,912 60,728 77,400 90,098 ‐5.10%
70040 51200 Health Care 463,320 400,140 400,140 300,105 400,140 421,200 5.30%
70040 51300 Life Insurance 4,654 ‐ ‐ ‐ ‐ ‐ 0.00%
70040 51600 Clothing Allowance 799 1,200 1,200 823 1,200 1,200 0.00%
70040 51900 Compensated Absences 12,635 ‐ ‐ ‐ ‐ ‐ 0.00%
TOTAL Equip Maint Salary & Fringes 1,997,457 2,017,361 2,017,361 1,378,900 1,751,540 2,063,397 2.30%
70040 52200 Contracted Services 8,735 18,000 18,000 4,409 18,000 18,000 0.00%
70040 52210 Property/Equipment Rental 708 800 800 356 800 800 0.00%
70040 52215 Waste Disposal 2,837 3,000 3,000 949 3,000 3,000 0.00%
70040 53100 Office Supplies 1,449 1,500 1,500 868 1,500 1,500 0.00%
70040 53160 Copying & Printing 188 400 400 195 400 400 0.00%
70040 53200 Work Supplies 687,707 689,000 714,437 551,908 750,000 750,000 5.00%
70040 53200 10007 Work Supplies 3,384 ‐ ‐ 1,976 ‐ ‐ 0.00%
EQUIPMENT MAINTENANCE DETAIL EXPENDITURES
Page 308

2020 2021 2021 2021 2021 2022 PCTORG OBJECT PROJECT ACCOUNT NAME ACTUAL ORIG BUD REVISED BUD ACTUAL PROJECTION BUDGET CHANGE
70040 53210 Janitorial Supplies 1,971 1,500 1,500 1,646 2,000 2,000 33.30%
70040 53240 Direct clothing expenses 8,224 8,000 8,000 4,967 8,000 8,000 0.00%
70040 53280 Fuel Oils & Fluids 827,493 1,031,600 1,031,600 846,948 1,200,000 1,250,000 21.20%
70040 53360 External Communication Service 635 1,400 1,400 8,223 1,600 1,600 14.30%
70040 53800 Education/Training/Conferences 332 4,000 6,667 31 4,000 4,000 ‐40.00%
70040 54200 Equipment Repairs & Maintenanc 9,329 7,000 7,000 4,278 7,000 7,000 0.00%
70040 56300 Depreciation 88,430 98,000 98,000 73,500 98,000 89,000 ‐9.20%
TOTAL Equip Maint Operating 1,641,422 1,864,200 1,892,304 1,500,254 2,094,300 2,135,300 12.80%
70040 55100 I/S Building Occupancy 70,062 72,824 72,824 54,618 72,824 76,408 4.90%
70040 55200 I/S City Telephone System 1,300 1,300 1,300 650 1,300 1,300 0.00%
70040 55400 I/S Information Systems 62,650 61,468 61,468 46,101 61,468 74,006 20.40%
TOTAL Equip Maint Internal Service 134,012 135,592 135,592 101,369 135,592 151,714 11.90%
70040 57300 Equipment 6,775 8,000 8,000 3,631 8,000 8,000 0.00%
70040 57310 Equipment‐Vehicles 525 ‐ ‐ ‐ ‐ ‐ 0.00%
TOTAL Equip Maint Outlay 7,299 8,000 8,000 3,631 8,000 8,000 0.00%
GRAND TOTAL 3,780,189$ 4,025,153$ 4,053,257$ 2,984,155$ 3,989,432$ 4,358,411$ 7.50%
Page 309
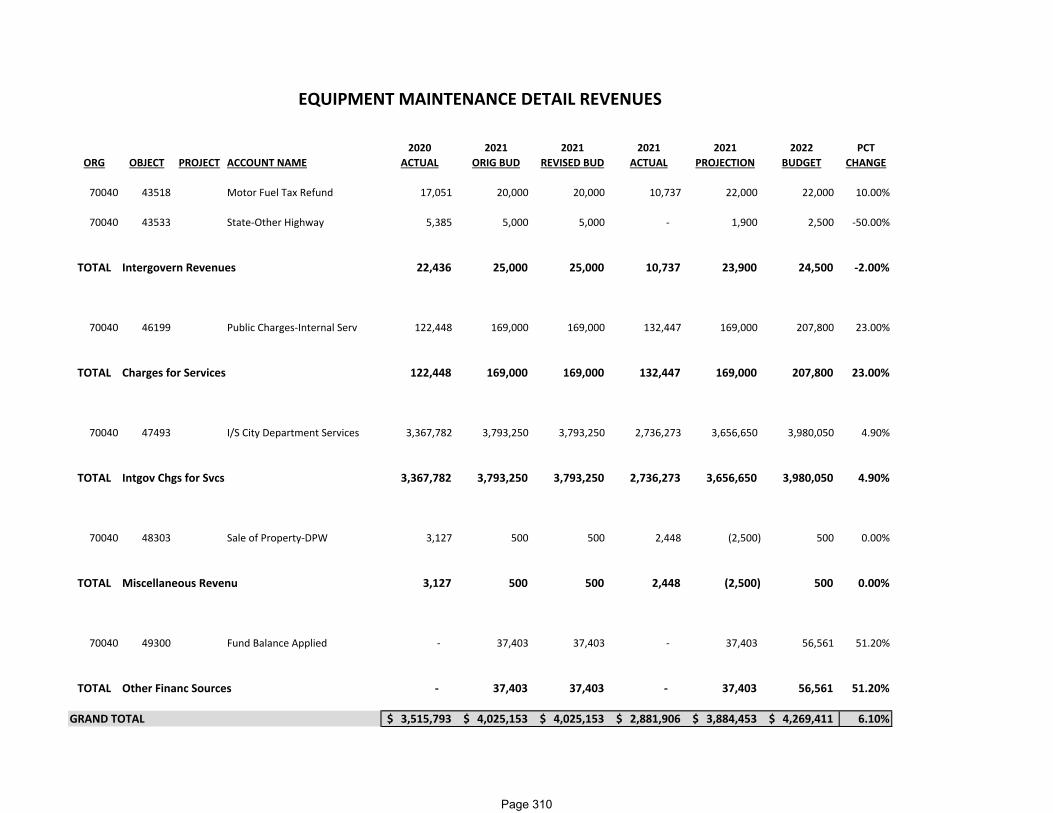
2020 2021 2021 2021 2021 2022 PCTORG OBJECT PROJECT ACCOUNT NAME ACTUAL ORIG BUD REVISED BUD ACTUAL PROJECTION BUDGET CHANGE
70040 43518 Motor Fuel Tax Refund 17,051 20,000 20,000 10,737 22,000 22,000 10.00%
70040 43533 State‐Other Highway 5,385 5,000 5,000 ‐ 1,900 2,500 ‐50.00%
TOTAL Intergovern Revenues 22,436 25,000 25,000 10,737 23,900 24,500 ‐2.00%
70040 46199 Public Charges‐Internal Serv 122,448 169,000 169,000 132,447 169,000 207,800 23.00%
TOTAL Charges for Services 122,448 169,000 169,000 132,447 169,000 207,800 23.00%
70040 47493 I/S City Department Services 3,367,782 3,793,250 3,793,250 2,736,273 3,656,650 3,980,050 4.90%
TOTAL Intgov Chgs for Svcs 3,367,782 3,793,250 3,793,250 2,736,273 3,656,650 3,980,050 4.90%
70040 48303 Sale of Property‐DPW 3,127 500 500 2,448 (2,500) 500 0.00%
TOTAL Miscellaneous Revenu 3,127 500 500 2,448 (2,500) 500 0.00%
70040 49300 Fund Balance Applied ‐ 37,403 37,403 ‐ 37,403 56,561 51.20%
TOTAL Other Financ Sources ‐ 37,403 37,403 ‐ 37,403 56,561 51.20%
GRAND TOTAL 3,515,793$ 4,025,153$ 4,025,153$ 2,881,906$ 3,884,453$ 4,269,411$ 6.10%
EQUIPMENT MAINTENANCE DETAIL REVENUES
Page 310
INFORMATION SYSTEMS
Fund: 701-Information Systems Internal Service Department: 13-Information Systems Function: 10-General Government Orgs: 70113
MISSION STATEMENT
To assist City and Public Safety departments in their technological goals and initiatives so they can function in the most efficient way possible. To identify and assist in areas of process modernization on a departmental and inter-departmental scale. To support and assist departmental users and stakeholders in the use and understanding of software, technological processes, and City data. To design and maintain an adequate and forward-thinking infrastructure. To prioritize a secure network environment and ensure compliance with Public Safety and Finance audits. To enable and promote open and integrated data and communication between departments.
FUNCTION
The Management Information Systems (MIS) Department is responsible for administering, integrating, maintaining City and Public Safety software and applications, for the planning, setup, and implementation of new software and applications in conjunction with key stakeholders, for the discontinuation of old and outdated software and applications. MIS is responsible for providing timely and efficient end-user support regarding software and applications, as well as for hardware such as PCs, laptops, printers, tablets, cell phones, and other devices and peripherals. MIS is responsible for maintaining a secure network through up-to-date firewalls, anti-virus, web-filtration, network monitoring and backup systems. MIS is responsible for user setup and maintenance, controlling permission levels and access both on the network and within various systems. MIS assists various departments with application creation, development, integration, reporting, and data maintenance.
SIGNIFICANT INITIATIVES RECENTLY ACCOMPLISHED
1. Security & Disaster Recovery a. Security Awareness: Reduced organizational phish-prone percentage from 15.7% to 4.9% (phish-prone % = how likely one is to open a
malicious email hyperlink, attachment, or respond to the individual) b. Veeam Backup Implementation c. VMWare Implementation d. DUO: Multi-Factor Authentication program purchased with intention to implement by year end e. Evaluating and Vetting Updated Firewall Solution to be implemented by year end
2. Smart Cities a. Expansion of Public WiFi to Wustum, RAM, and Community Centers
3. Departmental Program Implementations (completed or on track to be completed by year end) a. RecTrac/WebTrac Implementation - Parks b. Munis 2019.1 Implementation - Finance
Page 311
INFORMATION SYSTEMS
Fund: 701-Information Systems Internal Service Department: 13-Information Systems Function: 10-General Government Orgs: 70113
c. Ascent Implementation – Finance d. Market Drive Implementation – Assessor’s e. FirstNet and LifePak Implementation – Fire Dept f. TMS: FLSA and Absences Implementation – Fire Dept
2022 STRATEGIC INITIATIVES
1. RENTS Process Reviews and Enhancement 2. Smart Cities
a. Cityworks Online Portal b. Munis Online Portal c. Racine 311 Application d. Public WiFi Expansion – COP Houses
3. FirstNet Implementation – Police Dept 4. O365 Full Implementation 5. Asset Management Overhaul 6. Infrastructure Upgrades
SIGNIFICANT FUNDING OR PROGRAM CHANGES IN 2022
Departmental Re-Organization:
1. Addition of Part Time Student Support Technician 2. Addition of a Full Time Support Technician 3. Professional Services includes $82,000 for aerial fly over that happens every three years.
Page 312
2022 Goal‐Setting Statement Department Name: MIS –Information Systems Department Head/Staff Name(s): Adele Edwards
Goal Statement #1 Assess the City’s current technology, MIS staff skills, process, procedures, etc.
Prior to implementing Smart City Initiatives, the City needs the technical infrastructure to support the initiatives. This goal will provide a road map of what needs to be done to provide the City with the technical infrastructure, as well as the staff skills, process, and procedures, so MIS can continue to provide excellent services to the City Departments and citizens of Racine and take on new Smart City Initiatives. Expected to be completed in 1 year. At least every 3 years, another assessment needs to be completed.
Goal Statement #2
Advancing and improving current technology, systems, MIS skills, etc.
Start advancing and improving the technical infrastructure to provide a foundation for Smart City Initiatives based on the assessment done in Goal 1. The MIS department must continue to add new software, hardware, system, technology, and services; improve the use of current systems, as well as improve their skills, processes, and procedures. This goal will continue to evolve as new capabilities are need for new Smart City Initiatives. Examples include completion and enhancement of implementations from last year (Cityworks, Munis, Racine 311) and continuing to partner with Department of Public Works regarding the City’s fiber (a key infrastructure for Smart City Initiatives) and road or building projects.
Page 313

Goal Statement #3 Assessment and continued collaboration to complete Smart City Initiatives
The City had begun collaborative efforts with Racine citizens, Gateway Technical College, University of Wisconsin Parkside and Madison, and other groups that were stopped due to COVID‐19. An assessment of where those collaborations are and what needs to be done to complete projects will be undertaken. Then plans will created and implemented to complete the initiatives. The Autonomous Vehicle Initiative is one example. Additionally, new collaborators will be sought for innovative initiative ideas and projects.
Page 314

Fund: 701 - Information SystemsFunction: 10 -General Government Org: 70113
2021 20212020 Original Revised 2021 2022
Actual Budget Budget Estimated BudgetExpenditures by Appropriation Unit
7011 Salaries & Fringes 1,012,605$ 1,044,857$ 1,044,857$ 1,044,857$ 1,171,171$ 7012 Operating Expenditures 1,900,998 1,064,900 1,078,900 1,078,900 1,304,425 7013 Inter-Departmental 41,945 43,480 43,480 43,480 45,532 7014 Capital Outlay 482,513 1,690,000 2,376,598 1,839,512 1,831,000
Other Financing Uses - - - - . Total Expenditures 3,438,061$ 3,843,237$ 4,543,835$ 4,006,749$ 4,352,128$
Revenues by CategoryProperty Taxes -$ -$ -$ -$ -$ Intergovernmental Revenues 27,786 - - - - Licenses and Permits - - - - - Fines and Forfeitures - - - - - Charges for Services 30,250 33,000 33,000 33,000 33,000 Intergovernmental Charges for Services 1,654,027 1,927,237 1,927,237 1,927,237 2,488,128 Miscellaneous Revenues 524,641 - - - - Other Financing Sources 1,430,049 1,690,000 2,290,000 1,690,000 1,831,000
3,666,753$ 3,650,237$ 4,250,237$ 3,650,237$ 4,352,128$
Net Profit (Loss) 228,692$ (193,000)$ (293,598)$ (356,512)$ -$ Non Cash Items:
Depreciation/Amortization 284,546$ 193,000$ 193,000$ 193,000$ 287,000$ Compensated Absenses - - - - -
284,546$ 193,000$ 193,000$ 193,000$ 287,000$
INFORMATION SYSTEMSInternal Service Fund Summary of Expenditures and Revenues
Page 315

2020 2021 2021 2021 2021 2022 PCTORG OBJECT PROJECT ACCOUNT NAME ACTUAL ORIG BUD REVISED BUD ACTUAL PROJECTION BUDGET CHANGE
70113 50100 Salaries 667,991 751,430 751,430 414,897 751,430 835,305 11.20%
70113 50200 Part Time Salaries ‐ ‐ ‐ ‐ ‐ 6,760 0.00%
70113 50300 Overtime 15,545 ‐ ‐ 2,094 ‐ ‐ 0.00%
70113 50300 13001 Overtime ‐ ‐ ‐ 32 ‐ ‐ 0.00%
70113 51010 FICA 49,707 55,190 55,190 29,426 55,190 64,211 16.30%
70113 51010 13001 FICA ‐ ‐ ‐ 1 ‐ ‐ 0.00%
70113 51100 WRS 66,265 48,697 48,697 27,646 48,697 54,295 11.50%
70113 51100 13001 WRS ‐ ‐ ‐ 2 ‐ ‐ 0.00%
70113 51200 Health Care 210,600 189,540 189,540 142,155 189,540 210,600 11.10%
70113 51300 Life Insurance 2,352 ‐ ‐ ‐ ‐ ‐ 0.00%
70113 51900 Compensated Absences 145 ‐ ‐ ‐ ‐ ‐ 0.00%
TOTAL MIS Salary & Fringes 1,012,605 1,044,857 1,044,857 616,253 1,044,857 1,171,171 12.10%
70113 52100 Professional Services 48,295 75,000 75,000 44,860 75,000 156,000 108.00%
70113 52100 10007 Professional Services‐COVID 13,478 ‐ ‐ 5,695 ‐ ‐ 0.00%
70113 52100 13002 Professional Services‐Smart 3,000 ‐ 14,000 14,000 14,000 ‐ 0.00%
70113 52100 13003 Professional Services‐Cyber 487,089 ‐ ‐ ‐ ‐ ‐ 0.00%
INFORMATION TECHNOLOGY DETAIL EXPENDITURES
Page 316

2020 2021 2021 2021 2021 2022 PCTORG OBJECT PROJECT ACCOUNT NAME ACTUAL ORIG BUD REVISED BUD ACTUAL PROJECTION BUDGET CHANGE
70113 53100 Office Supplies 360 150 150 68 150 150 0.00%
70113 53110 Postage & Shipping 12 150 150 141 150 150 0.00%
70113 53200 Work Supplies 294 ‐ ‐ ‐ ‐ ‐ 0.00%
70113 53200 13003 Work Supplies‐Cyber Attack 1,159 ‐ ‐ ‐ ‐ ‐ 0.00%
70113 53265 Memberships 347 100 100 81 100 100 0.00%
70113 53360 External Communication Service 149,285 124,500 124,500 105,211 124,500 125,000 0.40%
70113 53800 Education/Training/Conferences 1,182 3,000 3,000 925 3,000 23,500 683.30%
70113 53810 Travel ‐ ‐ ‐ 3 ‐ ‐ 0.00%
70113 54200 Equipment Repairs & Maintenanc 7,329 ‐ ‐ ‐ ‐ ‐ 0.00%
70113 54500 Software Maintenance 614,170 669,000 669,000 498,431 669,000 712,525 6.50%
70113 54500 13003 Software Maintenance‐Cyber 290,450 ‐ ‐ ‐ ‐ ‐ 0.00%
70113 56100 Amortization 161,198 123,000 123,000 ‐ 123,000 162,000 31.70%
70113 56300 Depreciation 123,348 70,000 70,000 ‐ 70,000 125,000 78.60%
TOTAL MIS Operating 1,900,998 1,064,900 1,078,900 669,415 1,078,900 1,304,425 22.50%
70113 55100 I/S Building Occupancy 39,383 40,918 40,918 30,688 40,918 42,970 5.00%
70113 55200 I/S City Telephone System 2,562 2,562 2,562 1,281 2,562 2,562 0.00%
TOTAL MIS Interdepartmental 41,945 43,480 43,480 31,969 43,480 45,532 4.70%
Page 317

2020 2021 2021 2021 2021 2022 PCTORG OBJECT PROJECT ACCOUNT NAME ACTUAL ORIG BUD REVISED BUD ACTUAL PROJECTION BUDGET CHANGE
70113 57300 Equipment 101,079 ‐ 600,000 25,862 ‐ ‐ 0.00%
70113 57300 10007 Equipment 12,630 ‐ ‐ 194 ‐ ‐ 0.00%
70113 57300 13003 Equipment‐‐Cyber 200,753 ‐ ‐ ‐ ‐ ‐ 0.00%
70113 57355 Computer Hardware 82,392 1,165,000 1,229,198 87,110 1,292,112 1,332,000 14.30%
70113 57355 13002 Computer Hardware 76,345 ‐ ‐ ‐ ‐ ‐ 0.00%
70113 57800 Computer Software 9,313 525,000 547,400 597,670 547,400 499,000 ‐5.00%
TOTAL MIS Outlay 482,513 1,690,000 2,376,598 710,836 1,839,512 1,831,000 8.30%
GRAND TOTAL 3,438,061$ 3,843,237$ 4,543,835$ 2,028,473$ 4,006,749$ 4,352,128$ 13.20%
Page 318

2020 2021 2021 2021 2021 2022 PCTORG OBJECT PROJECT ACCOUNT NAME ACTUAL ORIG BUD REVISED BUD ACTUAL PROJECTION BUDGET CHANGE
70113 43240 10007 Federal Grant‐Health‐COVID 27,786 ‐ ‐ ‐ ‐ ‐ 0.00%
TOTAL Intergovern Revenues 27,786 ‐ ‐ ‐ ‐ ‐ 0.00%
70113 46199 Public Charges‐Internal Serv 30,250 33,000 33,000 27,500 33,000 33,000 0.00%
TOTAL Charges for Services 30,250 33,000 33,000 27,500 33,000 33,000 0.00%
70113 47493 I/S City Department Services 1,654,027 1,927,237 1,927,237 1,445,428 1,927,237 2,488,128 29.10%
TOTAL Intgov Chgs for Svcs 1,654,027 1,927,237 1,927,237 1,445,428 1,927,237 2,488,128 29.10%
70113 48900 Miscellaneous Revenue 524,641 ‐ ‐ ‐ ‐ ‐ 0.00%
TOTAL Miscellaneous Revenue 524,641 ‐ ‐ ‐ ‐ ‐ 0.00%
70113 49240 Transfer from Cap Projects 1,430,049 1,690,000 2,290,000 ‐ 1,690,000 1,831,000 8.30%
TOTAL Other Financ Sources 1,430,049 1,690,000 2,290,000 ‐ 1,690,000 1,831,000 8.30%
GRAND TOTAL 3,666,753$ 3,650,237$ 4,250,237$ 1,472,928$ 3,650,237$ 4,352,128$ 19.20%
INFORMATION TECHNOLOGY DETAIL REVENUES
Page 319

This page is intentionally left blank
Page 320
BUILDING COMPLEX
Fund: 702-Building Complex Internal Service Department: 40-Public Works Function: 40-Public Works Orgs: 70240
MISSION STATEMENT
To responsibly maintain and operate City of Racine owned facilities. Building complex functions focus on safety, equity, efficiency, sustainability, and the environment, while meeting/exceeding our customers’ needs. It is our mission to succeed and we are here to serve.
FUNCTION
The Building Complex team provides maintenance, operational services, access management, regulatory compliance, receiving, and emergency response for City of Racine owned facilities.
SIGNIFICANT INITIATIVES RECENTLY ACCOMPLISHED
1. Completion of the 2021 Facility Condition Assessment (FCA). 2. By end of year 2021, the Building Automation System (BAS) upgrade to Metasys User Interface (MUI) will be complete.
2022 STRATEGIC INITIATIVES
1. Train essential team members on Metasys User Interface (MUI) and completely phase out Metasys Extended Architecture (MEA) access. 2. Fine tune Metasys User Interface (MUI) to ensure efficient and reliable operation of all automated systems.
SIGNIFICANT FUNDING OR PROGRAM CHANGES IN 2022
1. The Building Complex team has been reduced by one (electrical worker) and the City Electrician’s team has been increased by one electrician. The associated vehicle (van) has already been physically transferred from the Building Complex to the City Electricians.
Page 321

This page is intentionally left blank
Page 322
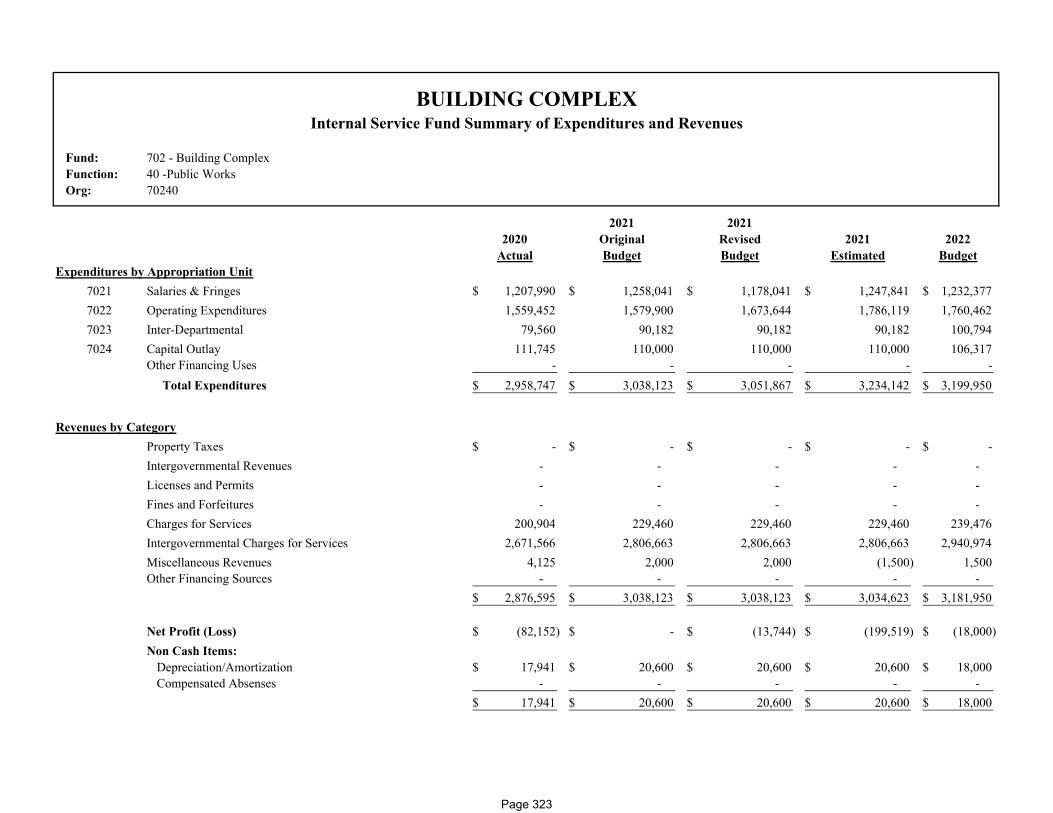
Fund: 702 - Building ComplexFunction: 40 -Public WorksOrg: 70240
2021 20212020 Original Revised 2021 2022
Actual Budget Budget Estimated BudgetExpenditures by Appropriation Unit
7021 Salaries & Fringes 1,207,990$ 1,258,041$ 1,178,041$ 1,247,841$ 1,232,377$ 7022 Operating Expenditures 1,559,452 1,579,900 1,673,644 1,786,119 1,760,462 7023 Inter-Departmental 79,560 90,182 90,182 90,182 100,794 7024 Capital Outlay 111,745 110,000 110,000 110,000 106,317
Other Financing Uses - - - - - Total Expenditures 2,958,747$ 3,038,123$ 3,051,867$ 3,234,142$ 3,199,950$
Revenues by CategoryProperty Taxes -$ -$ -$ -$ -$ Intergovernmental Revenues - - - - - Licenses and Permits - - - - - Fines and Forfeitures - - - - - Charges for Services 200,904 229,460 229,460 229,460 239,476 Intergovernmental Charges for Services 2,671,566 2,806,663 2,806,663 2,806,663 2,940,974 Miscellaneous Revenues 4,125 2,000 2,000 (1,500) 1,500 Other Financing Sources - - - - -
2,876,595$ 3,038,123$ 3,038,123$ 3,034,623$ 3,181,950$
Net Profit (Loss) (82,152)$ -$ (13,744)$ (199,519)$ (18,000)$ Non Cash Items:
Depreciation/Amortization 17,941$ 20,600$ 20,600$ 20,600$ 18,000$ Compensated Absenses - - - - -
17,941$ 20,600$ 20,600$ 20,600$ 18,000$
BUILDING COMPLEXInternal Service Fund Summary of Expenditures and Revenues
Page 323
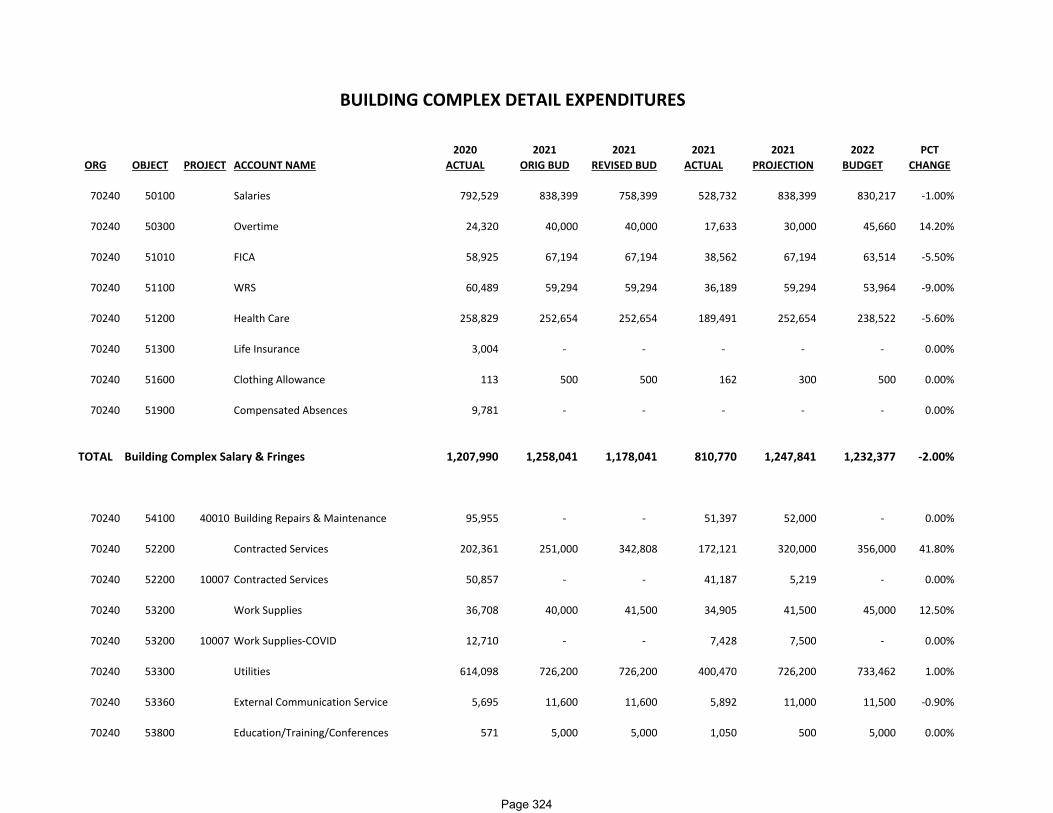
2020 2021 2021 2021 2021 2022 PCTORG OBJECT PROJECT ACCOUNT NAME ACTUAL ORIG BUD REVISED BUD ACTUAL PROJECTION BUDGET CHANGE
70240 50100 Salaries 792,529 838,399 758,399 528,732 838,399 830,217 ‐1.00%
70240 50300 Overtime 24,320 40,000 40,000 17,633 30,000 45,660 14.20%
70240 51010 FICA 58,925 67,194 67,194 38,562 67,194 63,514 ‐5.50%
70240 51100 WRS 60,489 59,294 59,294 36,189 59,294 53,964 ‐9.00%
70240 51200 Health Care 258,829 252,654 252,654 189,491 252,654 238,522 ‐5.60%
70240 51300 Life Insurance 3,004 ‐ ‐ ‐ ‐ ‐ 0.00%
70240 51600 Clothing Allowance 113 500 500 162 300 500 0.00%
70240 51900 Compensated Absences 9,781 ‐ ‐ ‐ ‐ ‐ 0.00%
TOTAL Building Complex Salary & Fringes 1,207,990 1,258,041 1,178,041 810,770 1,247,841 1,232,377 ‐2.00%
70240 54100 40010 Building Repairs & Maintenance 95,955 ‐ ‐ 51,397 52,000 ‐ 0.00%
70240 52200 Contracted Services 202,361 251,000 342,808 172,121 320,000 356,000 41.80%
70240 52200 10007 Contracted Services 50,857 ‐ ‐ 41,187 5,219 ‐ 0.00%
70240 53200 Work Supplies 36,708 40,000 41,500 34,905 41,500 45,000 12.50%
70240 53200 10007 Work Supplies‐COVID 12,710 ‐ ‐ 7,428 7,500 ‐ 0.00%
70240 53300 Utilities 614,098 726,200 726,200 400,470 726,200 733,462 1.00%
70240 53360 External Communication Service 5,695 11,600 11,600 5,892 11,000 11,500 ‐0.90%
70240 53800 Education/Training/Conferences 571 5,000 5,000 1,050 500 5,000 0.00%
BUILDING COMPLEX DETAIL EXPENDITURES
Page 324

2020 2021 2021 2021 2021 2022 PCTORG OBJECT PROJECT ACCOUNT NAME ACTUAL ORIG BUD REVISED BUD ACTUAL PROJECTION BUDGET CHANGE
70240 53810 Travel ‐ 1,500 1,500 ‐ ‐ 1,500 0.00%
70240 54100 Building Repairs & Maintenance 342,823 350,000 350,141 267,999 425,000 400,000 14.30%
70240 54100 10007 Building Repairs & Maintenance 11,309 ‐ ‐ 1,575 1,600 ‐ 0.00%
70240 54200 Equipment Repairs &Maintenance 168,424 174,000 174,295 137,450 175,000 190,000 9.20%
70240 56300 Depreciation 17,941 20,600 20,600 ‐ 20,600 18,000 ‐12.60%
TOTAL Building Complex Operating 1,559,452 1,579,900 1,673,644 1,121,473 1,786,119 1,760,462 11.40%
70240 55200 I/S City Telephone System 2,379 2,379 2,379 1,190 2,379 2,379 0.00%
70240 55300 I/S Garage Fuel 11,386 15,200 15,200 12,007 15,200 18,600 22.40%
70240 55310 I/S Garage Labor 26,432 32,000 32,000 14,271 32,000 29,000 ‐9.40%
70240 55320 I/S Garage Materials 18,150 16,500 16,500 9,853 16,500 18,000 9.10%
70240 55400 I/S Information Systems 21,213 24,103 24,103 18,077 24,103 32,815 36.10%
TOTAL Building Complex I/S 79,560 90,182 90,182 55,398 90,182 100,794 11.80%
70240 57200 Building Improvements 111,745 100,000 100,000 61,145 100,000 91,317 ‐8.70%
70240 57300 Equipment ‐ 10,000 10,000 8,669 10,000 15,000 50.00%
TOTAL Building Complex Outlay 111,745 110,000 110,000 69,814 110,000 106,317 ‐3.30%
GRAND TOTAL 2,958,747$ 3,038,123$ 3,051,867$ 2,057,456$ 3,234,142$ 3,199,950$ 5.30%
Page 325
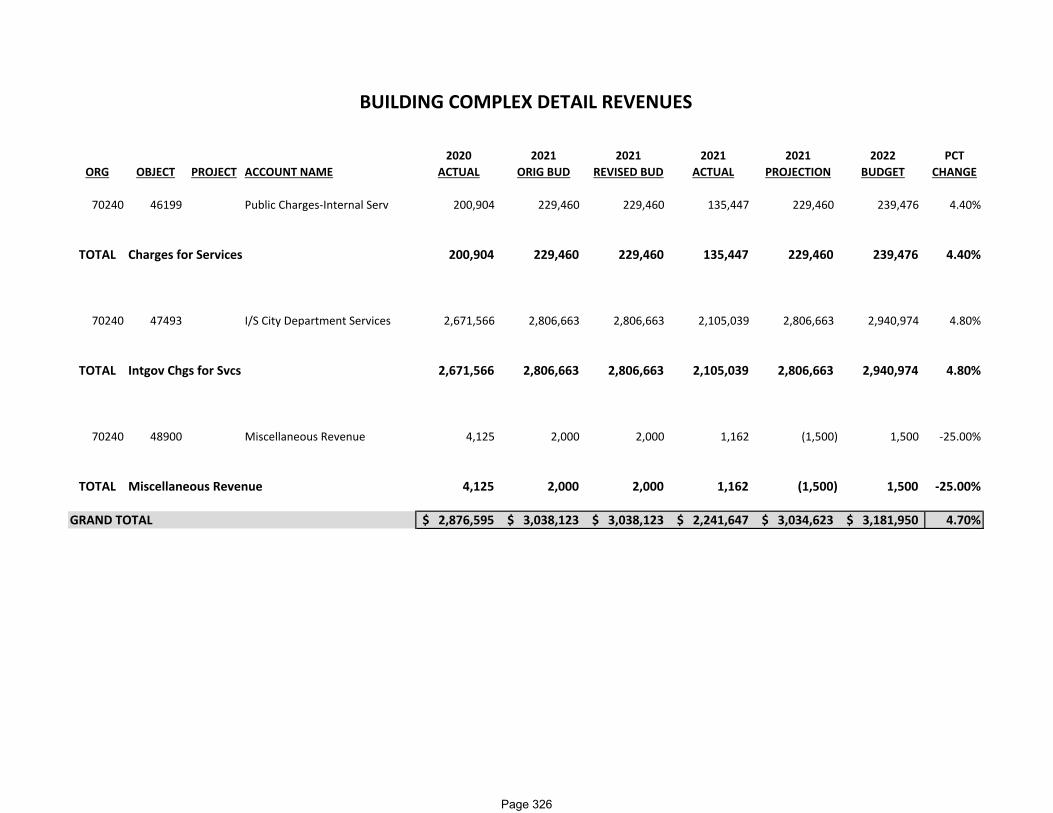
2020 2021 2021 2021 2021 2022 PCTORG OBJECT PROJECT ACCOUNT NAME ACTUAL ORIG BUD REVISED BUD ACTUAL PROJECTION BUDGET CHANGE
70240 46199 Public Charges‐Internal Serv 200,904 229,460 229,460 135,447 229,460 239,476 4.40%
TOTAL Charges for Services 200,904 229,460 229,460 135,447 229,460 239,476 4.40%
70240 47493 I/S City Department Services 2,671,566 2,806,663 2,806,663 2,105,039 2,806,663 2,940,974 4.80%
TOTAL Intgov Chgs for Svcs 2,671,566 2,806,663 2,806,663 2,105,039 2,806,663 2,940,974 4.80%
70240 48900 Miscellaneous Revenue 4,125 2,000 2,000 1,162 (1,500) 1,500 ‐25.00%
TOTAL Miscellaneous Revenue 4,125 2,000 2,000 1,162 (1,500) 1,500 ‐25.00%
GRAND TOTAL 2,876,595$ 3,038,123$ 3,038,123$ 2,241,647$ 3,034,623$ 3,181,950$ 4.70%
BUILDING COMPLEX DETAIL REVENUES
Page 326
INSURANCE
Fund: 703-Insurance Internal Service Department: 12-Non Departmental Function: 10-General Government Orgs: 70312
MISSION STATEMENT
To promote, maintain, and improve the health and well-being of those covered by the City’s self funded health plan in a fiscally responsible manner.
FUNCTION
The City is self-insured for both medical and prescription for all active employees and pre Medicare retirees. The plan administrators for the self -funded plan are United Health Care (Medical) and CVS (Prescription). The City purchases a Medicare advantage insurance plan for Medicare eligible retirees. There are approximately 590 active employees, and 917 retirees and their dependents covered on the City’s health plan.
The insurance fund is used to account for all revenues and expenditures associated with the City’s health and dental plans for the active and retired employees and their dependents. Expenses captured include medical, dental, prescription, wellness, clinic and administration costs. Revenues captured include active employee and retiree premium contributions, insurance rebates, and interdepartmental charges.
A premium equivalent charge for each covered employee in each department is used to allocate healthcare costs to the individual departments. This is an allocation method used to represent the estimated cost per department based on their employee makeup at the time the budget is developed.
SIGNIFICANT INITIATIVES RECENTLY ACCOMPLISHED
City funded H.S.A contributions made to over 500 active employees Transitioned to a new benefits broker Continued to see significant savings from the implementation of the high deductible health plan Expanded the wellness incentive in response to COVID-19
2021 STRATEGIC INITIATIVES
City funded H.S.A contributions to active non represented employees Thorough review and update of the employee handbook while examining new benefit options for employees.
Page 327
INSURANCE
Fund: 703-Insurance Internal Service Department: 12-Non Departmental Function: 10-General Government Orgs: 70312
SIGNIFICANT FUNDING OR PROGRAM CHANGES IN 2022
Budgeted reduction in claims costs due to implementation of high deductible health plan Use of fund balance/reserves to provide HSA contributions to active non represented employees
Page 328
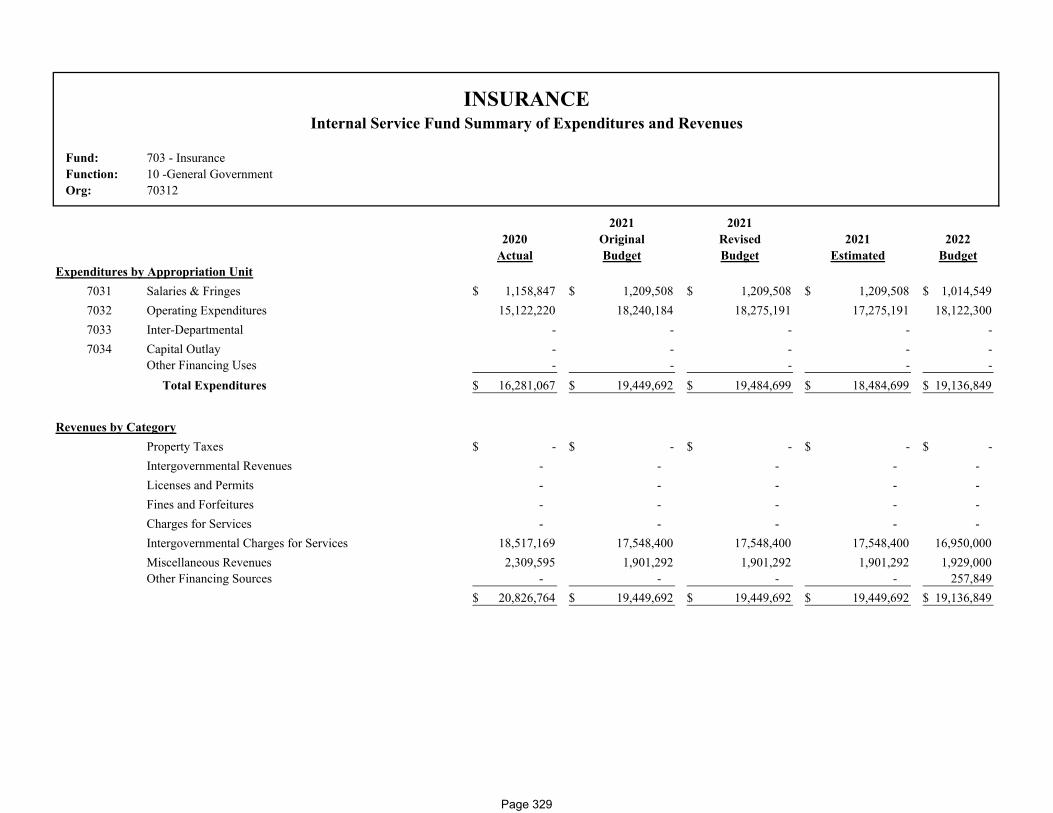
Fund: 703 - InsuranceFunction: 10 -General GovernmentOrg: 70312
2021 20212020 Original Revised 2021 2022
Actual Budget Budget Estimated BudgetExpenditures by Appropriation Unit
7031 Salaries & Fringes 1,158,847$ 1,209,508$ 1,209,508$ 1,209,508$ 1,014,549$ 7032 Operating Expenditures 15,122,220 18,240,184 18,275,191 17,275,191 18,122,300 7033 Inter-Departmental - - - - - 7034 Capital Outlay - - - - -
Other Financing Uses - - - - - Total Expenditures 16,281,067$ 19,449,692$ 19,484,699$ 18,484,699$ 19,136,849$
Revenues by CategoryProperty Taxes -$ -$ -$ -$ -$ Intergovernmental Revenues - - - - - Licenses and Permits - - - - - Fines and Forfeitures - - - - - Charges for Services - - - - - Intergovernmental Charges for Services 18,517,169 17,548,400 17,548,400 17,548,400 16,950,000 Miscellaneous Revenues 2,309,595 1,901,292 1,901,292 1,901,292 1,929,000 Other Financing Sources - - - - 257,849
20,826,764$ 19,449,692$ 19,449,692$ 19,449,692$ 19,136,849$
INSURANCEInternal Service Fund Summary of Expenditures and Revenues
Page 329

2020 2021 2021 2021 2021 2022 PCTORG OBJECT PROJECT ACCOUNT NAME ACTUAL ORIG BUD REVISED BUD ACTUAL PROJECTION BUDGET CHANGE
70312 50100 Salaries 105,118 202,332 202,332 89,131 202,332 220,071 8.80%
70312 50200 Part Time Salaries ‐ ‐ ‐ 643 ‐ ‐ 0.00%
70312 50300 Overtime ‐ ‐ ‐ 606 ‐ ‐ 0.00%
70312 51010 FICA 41,657 48,413 48,413 38,680 48,413 20,419 ‐57.80%
70312 51100 WRS 5,915 17,661 17,661 5,551 17,661 14,304 ‐19.00%
70312 51200 Health Care 42,464 52,822 52,822 39,616 52,822 53,855 2.00%
70312 51700 Other Benefits 838,436 700,000 700,000 585,621 700,000 525,000 ‐25.00%
70312 51830 Employee Reimbursement 125,256 188,280 188,280 145,228 188,280 180,900 ‐3.90%
TOTAL Insurance Salary & Fringes 1,158,847 1,209,508 1,209,508 905,076 1,209,508 1,014,549 ‐16.10%
70312 52165 Disability Insurance ‐ ‐ ‐ ‐ ‐ 215,000 0.00%
70312 52100 Professional Services 48,715 55,784 90,791 77,345 90,791 183,300 101.90%
70312 52115 Medicare Advantage Premium 2,300,489 2,280,000 2,280,000 1,962,414 2,280,000 2,280,000 0.00%
70312 52125 Dental Premium 164,614 175,200 175,200 112,724 175,200 156,000 ‐11.00%
70312 52130 Stop Loss Premium 773,898 812,400 812,400 517,825 812,400 812,400 0.00%
70312 52135 Stop Loss Recovery (76,480) (300,000) (300,000) ‐ (300,000) (75,000) ‐75.00%
70312 52140 Health Claims 8,063,009 11,000,000 11,000,000 4,583,333 10,000,000 10,300,000 ‐6.40%
70312 52145 Health Claims Administration 653,084 696,000 696,000 489,830 696,000 624,000 ‐10.30%
INSURANCE DETAIL EXPENDITURES
Page 330

2020 2021 2021 2021 2021 2022 PCTORG OBJECT PROJECT ACCOUNT NAME ACTUAL ORIG BUD REVISED BUD ACTUAL PROJECTION BUDGET CHANGE
70312 52150 Prescription Claims 1,549,358 1,800,000 1,800,000 1,304,991 1,800,000 1,800,000 0.00%
70312 52155 Clinic Expenses 340,965 390,000 390,000 109,944 390,000 446,000 14.40%
70312 52200 Contracted Services 35,964 34,800 34,800 30,965 34,800 37,600 8.00%
70312 52430 Medicare Part B Reimbursement 1,268,604 1,280,000 1,280,000 1,003,053 1,280,000 1,328,000 3.80%
70312 53295 Wellness Program ‐ 16,000 16,000 500 16,000 15,000 ‐6.30%
TOTAL Insurance Operating 15,122,220 18,240,184 18,275,191 10,192,924 17,275,191 18,122,300 ‐0.80%
GRAND TOTAL 16,281,067$ 19,449,692$ 19,484,699$ 11,098,000$ 18,484,699$ 19,136,849$ ‐1.80%
Page 331
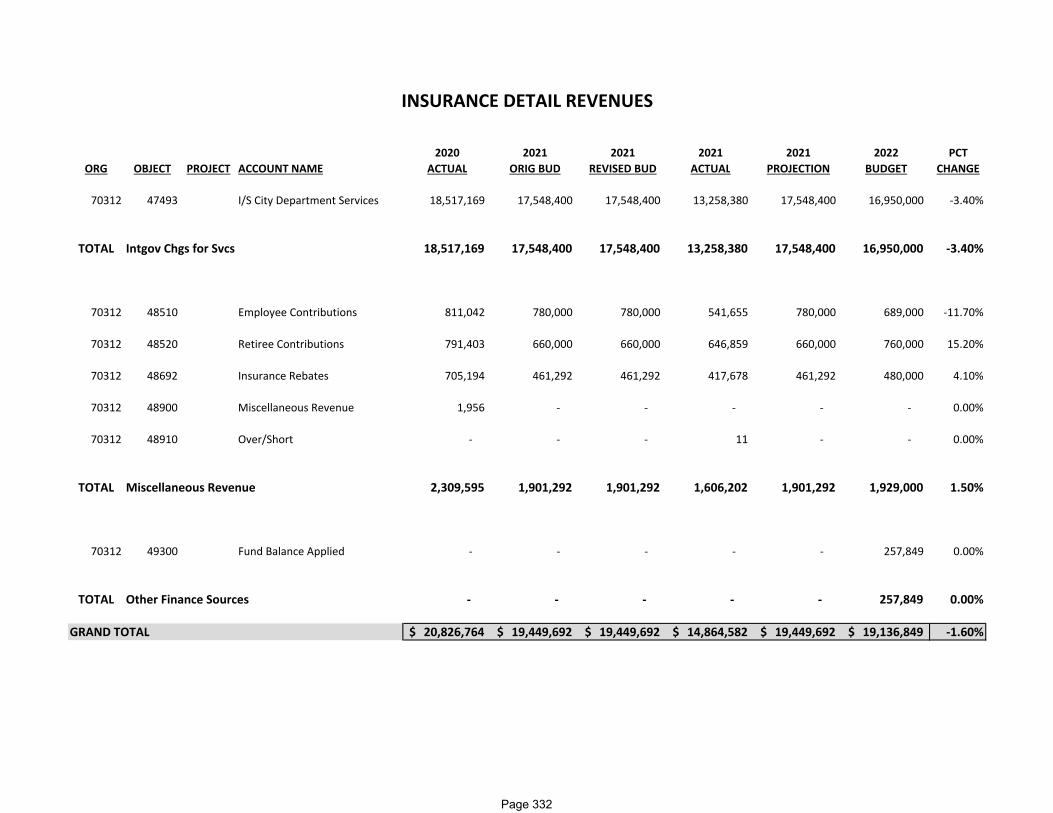
2020 2021 2021 2021 2021 2022 PCTORG OBJECT PROJECT ACCOUNT NAME ACTUAL ORIG BUD REVISED BUD ACTUAL PROJECTION BUDGET CHANGE
70312 47493 I/S City Department Services 18,517,169 17,548,400 17,548,400 13,258,380 17,548,400 16,950,000 ‐3.40%
TOTAL Intgov Chgs for Svcs 18,517,169 17,548,400 17,548,400 13,258,380 17,548,400 16,950,000 ‐3.40%
70312 48510 Employee Contributions 811,042 780,000 780,000 541,655 780,000 689,000 ‐11.70%
70312 48520 Retiree Contributions 791,403 660,000 660,000 646,859 660,000 760,000 15.20%
70312 48692 Insurance Rebates 705,194 461,292 461,292 417,678 461,292 480,000 4.10%
70312 48900 Miscellaneous Revenue 1,956 ‐ ‐ ‐ ‐ ‐ 0.00%
70312 48910 Over/Short ‐ ‐ ‐ 11 ‐ ‐ 0.00%
TOTAL Miscellaneous Revenue 2,309,595 1,901,292 1,901,292 1,606,202 1,901,292 1,929,000 1.50%
70312 49300 Fund Balance Applied ‐ ‐ ‐ ‐ ‐ 257,849 0.00%
TOTAL Other Finance Sources ‐ ‐ ‐ ‐ ‐ 257,849 0.00%
GRAND TOTAL 20,826,764$ 19,449,692$ 19,449,692$ 14,864,582$ 19,449,692$ 19,136,849$ ‐1.60%
INSURANCE DETAIL REVENUES
Page 332

TELEPHONE SYSTEM
Fund: 704-Telephone Internal Service Department: 40-Public Works Function: 40-Public Works Orgs: 70440
MISSION STATEMENT
To continue with the most cost effective means to provide telephone services to all City facilities.
FUNCTION
The Telephone System is responsible for providing all land line telephone service and maintenance in all facilities operated by the City of Racine that cannot provide IP related services.
SIGNIFICANT INITIATIVES RECENTLY ACCOMPLISHED
Continued the current land line service under the existing State bid service rates.
2022 STRATEGIC INITIATIVES
Will continue land line service under the existing State bid service rates. If any sites can be modified to VoIP service, this would lower this cost. Work to move this fund into the Information Technology Budget in 2023
SIGNIFICANT FUNDING OR PROGRAM CHANGES IN 2022
This is covered by State bid rates, so no changes currently available for this service.
Page 333

This page is intentionally left blank
Page 334

Fund: 704 - TelephoneFunction: 40 -Public WorksOrg: 70440
2021 20212020 Original Revised 2021 2022
Actual Budget Budget Estimated BudgetExpenditures by Appropriation Unit
7041 Salaries & Fringes -$ -$ -$ -$ -$ 7042 Operating Expenditures 203,276 112,392 112,392 112,392 112,100 7043 Inter-Departmental - - - - - 7044 Capital Outlay - - - - -
Other Financing Uses - - - - - Total Expenditures 203,276$ 112,392$ 112,392$ 112,392$ 112,100$
Revenues by CategoryProperty Taxes -$ -$ -$ -$ -$ Intergovernmental Revenues - - - - - Licenses and Permits - - - - - Fines and Forfeitures - - - - - Charges for Services 18,252 14,832 14,832 14,832 18,252 Intergovernmental Charges for Services 98,184 97,560 97,560 97,560 93,848 Miscellaneous Revenues - - - - - Other Financing Sources - - - - -
116,436$ 112,392$ 112,392$ 112,392$ 112,100$
Net Profit (Loss) (86,840)$ -$ -$ -$ -$ Non Cash Items:
Depreciation/Amortization 1,950$ -$ -$ -$ -$ Compensated Absenses - - - - -
1,950$ -$ -$ -$ -$
TELEPHONEInternal Service Fund Summary of Expenditures and Revenues
Page 335

2020 2021 2021 2021 2021 2022 PCTORG OBJECT PROJECT ACCOUNT NAME ACTUAL ORIG BUD REVISED BUD ACTUAL PROJECTION BUDGET CHANGE
70440 53300 Utilities ‐ ‐ ‐ 542 ‐ ‐ 0.00%
70440 53360 External Communication Service 197,681 107,400 107,400 39,319 107,400 107,100 ‐0.30%
70440 54200 Equipment Repairs & Maintenanc 3,645 4,992 4,992 1,602 4,992 5,000 0.20%
70440 56300 Depreciation 1,950 ‐ ‐ ‐ ‐ ‐ 0.00%
TOTAL Telephone Operating 203,276 112,392 112,392 41,462 112,392 112,100 ‐0.30%
GRAND TOTAL 203,276$ 112,392$ 112,392$ 41,462$ 112,392$ 112,100$ ‐0.30%
TELEPHONE DETAIL EXPENDITURES
Page 336

2020 2021 2021 2021 2021 2022 PCTORG OBJECT PROJECT ACCOUNT NAME ACTUAL ORIG BUD REVISED BUD ACTUAL PROJECTION BUDGET CHANGE
70440 46199 Public Charges‐Internal Serv 18,252 14,832 14,832 13,689 14,832 18,252 23.10%
TOTAL Charges for Services 18,252 14,832 14,832 13,689 14,832 18,252 23.10%
70440 47493 I/S City Department Services 98,184 97,560 97,560 48,780 97,560 93,848 ‐3.80%
TOTAL Intgov Chgs for Svcs 98,184 97,560 97,560 48,780 97,560 93,848 ‐3.80%
GRAND TOTAL 116,436$ 112,392$ 112,392$ 62,469$ 112,392$ 112,100$ ‐0.30%
TELEPHONE DETAIL REVENUES
Page 337

This page is intentionally left blank
Page 338
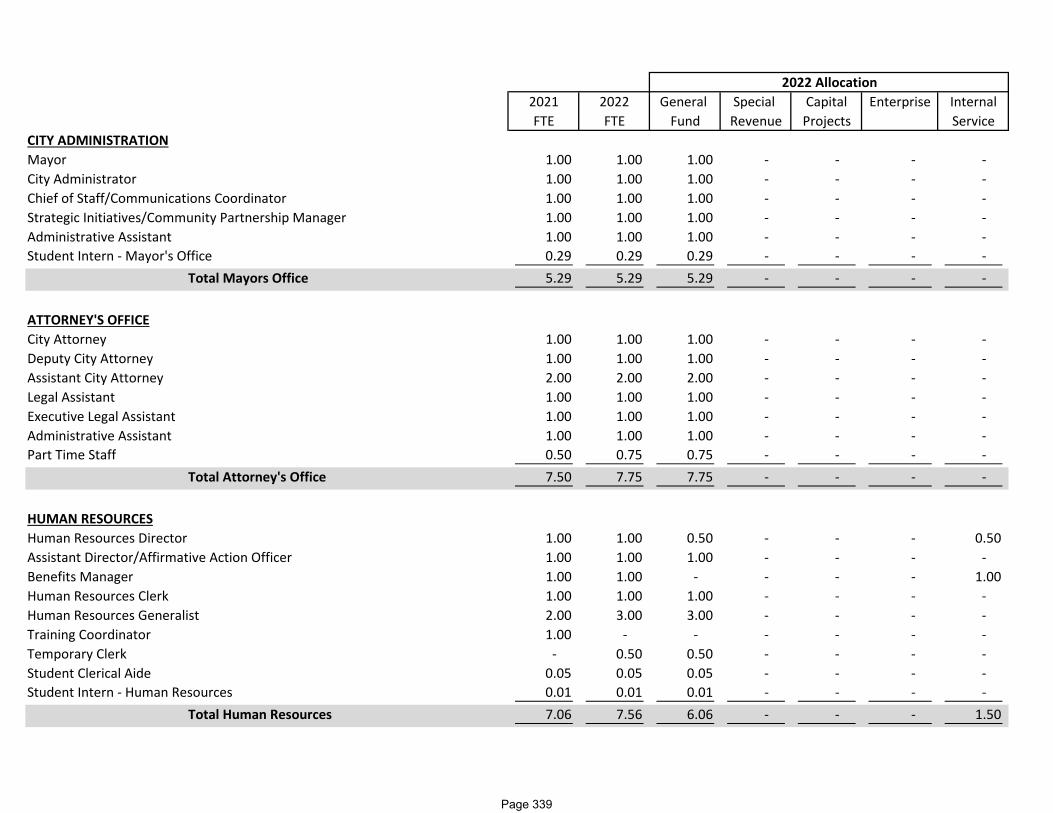
2021 2022 General Special Capital Enterprise InternalFTE FTE Fund Revenue Projects Service
CITY ADMINISTRATIONMayor 1.00 1.00 1.00 ‐ ‐ ‐ ‐ City Administrator 1.00 1.00 1.00 ‐ ‐ ‐ ‐ Chief of Staff/Communications Coordinator 1.00 1.00 1.00 ‐ ‐ ‐ ‐ Strategic Initiatives/Community Partnership Manager 1.00 1.00 1.00 ‐ ‐ ‐ ‐ Administrative Assistant 1.00 1.00 1.00 ‐ ‐ ‐ ‐ Student Intern ‐ Mayor's Office 0.29 0.29 0.29 ‐ ‐ ‐ ‐
Total Mayors Office 5.29 5.29 5.29 ‐ ‐ ‐ ‐
ATTORNEY'S OFFICECity Attorney 1.00 1.00 1.00 ‐ ‐ ‐ ‐ Deputy City Attorney 1.00 1.00 1.00 ‐ ‐ ‐ ‐ Assistant City Attorney 2.00 2.00 2.00 ‐ ‐ ‐ ‐ Legal Assistant 1.00 1.00 1.00 ‐ ‐ ‐ ‐ Executive Legal Assistant 1.00 1.00 1.00 ‐ ‐ ‐ ‐ Administrative Assistant 1.00 1.00 1.00 ‐ ‐ ‐ ‐ Part Time Staff 0.50 0.75 0.75 ‐ ‐ ‐ ‐
Total Attorney's Office 7.50 7.75 7.75 ‐ ‐ ‐ ‐
HUMAN RESOURCESHuman Resources Director 1.00 1.00 0.50 ‐ ‐ ‐ 0.50 Assistant Director/Affirmative Action Officer 1.00 1.00 1.00 ‐ ‐ ‐ ‐ Benefits Manager 1.00 1.00 ‐ ‐ ‐ ‐ 1.00 Human Resources Clerk 1.00 1.00 1.00 ‐ ‐ ‐ ‐ Human Resources Generalist 2.00 3.00 3.00 ‐ ‐ ‐ ‐ Training Coordinator 1.00 ‐ ‐ ‐ ‐ ‐ ‐ Temporary Clerk ‐ 0.50 0.50 ‐ ‐ ‐ ‐ Student Clerical Aide 0.05 0.05 0.05 ‐ ‐ ‐ ‐ Student Intern ‐ Human Resources 0.01 0.01 0.01 ‐ ‐ ‐ ‐
Total Human Resources 7.06 7.56 6.06 ‐ ‐ ‐ 1.50
2022 Allocation
Page 339
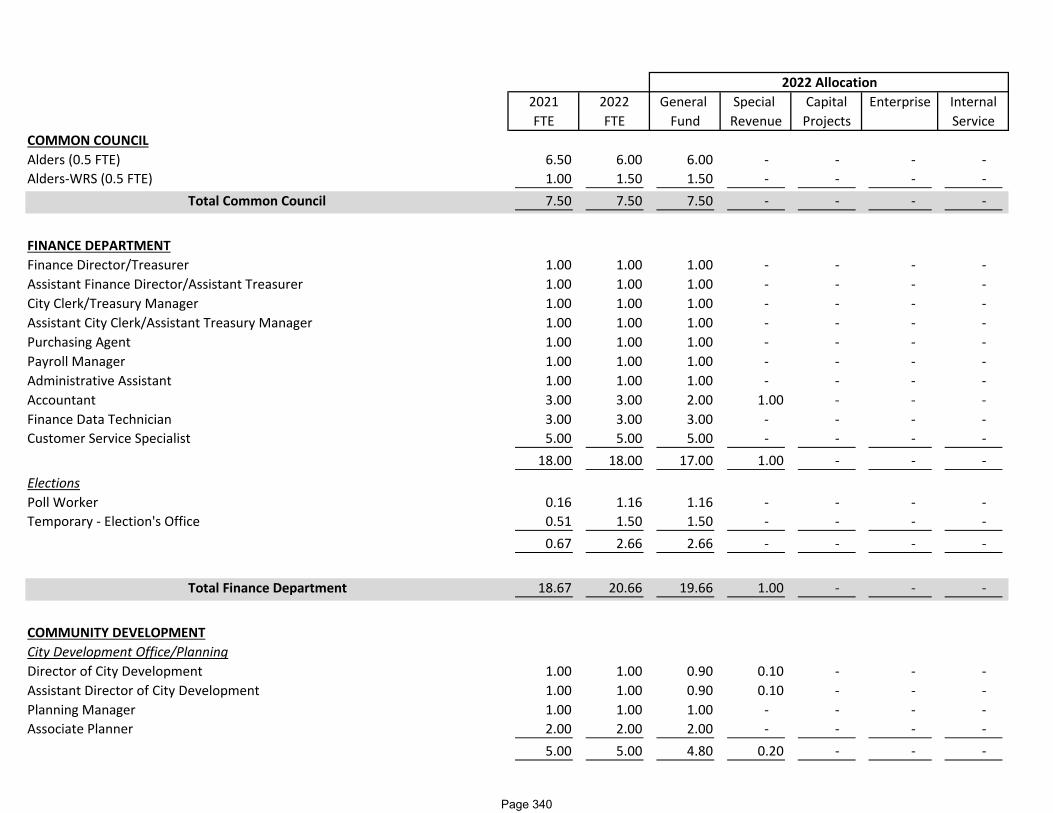
2021 2022 General Special Capital Enterprise InternalFTE FTE Fund Revenue Projects Service
2022 Allocation
COMMON COUNCILAlders (0.5 FTE) 6.50 6.00 6.00 ‐ ‐ ‐ ‐ Alders‐WRS (0.5 FTE) 1.00 1.50 1.50 ‐ ‐ ‐ ‐
Total Common Council 7.50 7.50 7.50 ‐ ‐ ‐ ‐
FINANCE DEPARTMENTFinance Director/Treasurer 1.00 1.00 1.00 ‐ ‐ ‐ ‐ Assistant Finance Director/Assistant Treasurer 1.00 1.00 1.00 ‐ ‐ ‐ ‐ City Clerk/Treasury Manager 1.00 1.00 1.00 ‐ ‐ ‐ ‐ Assistant City Clerk/Assistant Treasury Manager 1.00 1.00 1.00 ‐ ‐ ‐ ‐ Purchasing Agent 1.00 1.00 1.00 ‐ ‐ ‐ ‐ Payroll Manager 1.00 1.00 1.00 ‐ ‐ ‐ ‐ Administrative Assistant 1.00 1.00 1.00 ‐ ‐ ‐ ‐ Accountant 3.00 3.00 2.00 1.00 ‐ ‐ ‐ Finance Data Technician 3.00 3.00 3.00 ‐ ‐ ‐ ‐ Customer Service Specialist 5.00 5.00 5.00 ‐ ‐ ‐ ‐
18.00 18.00 17.00 1.00 ‐ ‐ ‐ ElectionsPoll Worker 0.16 1.16 1.16 ‐ ‐ ‐ ‐ Temporary ‐ Election's Office 0.51 1.50 1.50 ‐ ‐ ‐ ‐
0.67 2.66 2.66 ‐ ‐ ‐ ‐
Total Finance Department 18.67 20.66 19.66 1.00 ‐ ‐ ‐
COMMUNITY DEVELOPMENTCity Development Office/PlanningDirector of City Development 1.00 1.00 0.90 0.10 ‐ ‐ ‐ Assistant Director of City Development 1.00 1.00 0.90 0.10 ‐ ‐ ‐ Planning Manager 1.00 1.00 1.00 ‐ ‐ ‐ ‐ Associate Planner 2.00 2.00 2.00 ‐ ‐ ‐ ‐
5.00 5.00 4.80 0.20 ‐ ‐ ‐
Page 340

2021 2022 General Special Capital Enterprise InternalFTE FTE Fund Revenue Projects Service
2022 Allocation
Project Management/Support Services DivisionSupport Services Manager 1.00 1.00 1.00 Assessment Technician 1.00 ‐ ‐ Assessment Clerk 0.50 1.00 1.00 Permit Technician 1.00 1.00 1.00 Clerk‐Typist II 1.00 1.00 ‐ 1.00 ‐ ‐ ‐ Secretary III 1.00 1.00 1.00 ‐ ‐ ‐ ‐ Student Intern 0.50 ‐ ‐ ‐ ‐ ‐ ‐
6.00 5.00 4.00 1.00 ‐ ‐ ‐ Housing and Community Development DivisionManager of Housing and Community Development ‐ ‐ ‐ ‐ ‐ ‐ ‐ Manager of Neighborhood Services 1.00 1.00 ‐ 1.00 ‐ ‐ ‐ Community Development Compliance Specialist 1.00 1.00 ‐ 1.00 ‐ ‐ ‐ Community Development Specialist 1.00 1.00 ‐ 1.00 ‐ ‐ ‐ Housing Technician 1.00 1.00 0.25 0.75 ‐ ‐ ‐ Consumer Lending Specialist 1.00 1.00 1.00 ‐ ‐ ‐ ‐
5.00 5.00 1.25 3.75 ‐ ‐ ‐ Building and Code Compliance DivisionChief Building Inspector 1.00 1.00 1.00 ‐ ‐ ‐ ‐ Assistant Director/Chief Building Inspector ‐ ‐ ‐ ‐ ‐ ‐ ‐ Building Inspector III 1.00 1.00 1.00 ‐ ‐ ‐ ‐ Building Inspector II 2.00 2.00 2.00 ‐ ‐ ‐ ‐ Building Inspector I ‐ ‐ ‐ ‐ ‐ ‐ ‐ Electrical Inspector II 1.00 1.00 1.00 ‐ ‐ ‐ ‐ Plumbing Inspector II 1.00 1.00 1.00 ‐ ‐ ‐ ‐
6.00 6.00 6.00 ‐ ‐ ‐ ‐ Assessment DivisionChief Assessor 1.00 1.00 1.00 ‐ ‐ ‐ ‐ Real Estate Assessor II 2.00 2.00 2.00 ‐ ‐ ‐ ‐ Assessment Technician ‐ 1.00 1.00 ‐ ‐ ‐ ‐
3.00 4.00 4.00 ‐ ‐ ‐ ‐
Page 341
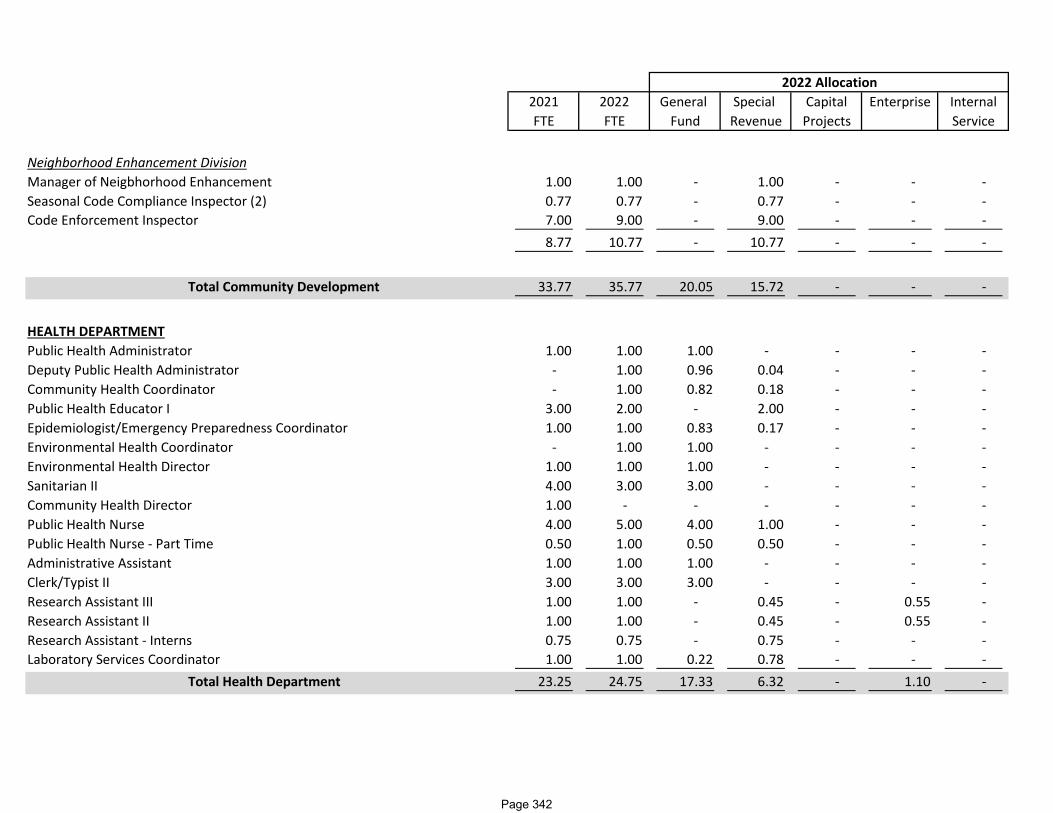
2021 2022 General Special Capital Enterprise InternalFTE FTE Fund Revenue Projects Service
2022 Allocation
Neighborhood Enhancement DivisionManager of Neigbhorhood Enhancement 1.00 1.00 ‐ 1.00 ‐ ‐ ‐ Seasonal Code Compliance Inspector (2) 0.77 0.77 ‐ 0.77 ‐ ‐ ‐ Code Enforcement Inspector 7.00 9.00 ‐ 9.00 ‐ ‐ ‐
8.77 10.77 ‐ 10.77 ‐ ‐ ‐
Total Community Development 33.77 35.77 20.05 15.72 ‐ ‐ ‐
HEALTH DEPARTMENTPublic Health Administrator 1.00 1.00 1.00 ‐ ‐ ‐ ‐ Deputy Public Health Administrator ‐ 1.00 0.96 0.04 ‐ ‐ ‐ Community Health Coordinator ‐ 1.00 0.82 0.18 ‐ ‐ ‐ Public Health Educator I 3.00 2.00 ‐ 2.00 ‐ ‐ ‐ Epidemiologist/Emergency Preparedness Coordinator 1.00 1.00 0.83 0.17 ‐ ‐ ‐ Environmental Health Coordinator ‐ 1.00 1.00 ‐ ‐ ‐ ‐ Environmental Health Director 1.00 1.00 1.00 ‐ ‐ ‐ ‐ Sanitarian II 4.00 3.00 3.00 ‐ ‐ ‐ ‐ Community Health Director 1.00 ‐ ‐ ‐ ‐ ‐ ‐ Public Health Nurse 4.00 5.00 4.00 1.00 ‐ ‐ ‐ Public Health Nurse ‐ Part Time 0.50 1.00 0.50 0.50 ‐ ‐ ‐ Administrative Assistant 1.00 1.00 1.00 ‐ ‐ ‐ ‐ Clerk/Typist II 3.00 3.00 3.00 ‐ ‐ ‐ ‐ Research Assistant III 1.00 1.00 ‐ 0.45 ‐ 0.55 ‐ Research Assistant II 1.00 1.00 ‐ 0.45 ‐ 0.55 ‐ Research Assistant ‐ Interns 0.75 0.75 ‐ 0.75 ‐ ‐ ‐ Laboratory Services Coordinator 1.00 1.00 0.22 0.78 ‐ ‐ ‐
Total Health Department 23.25 24.75 17.33 6.32 ‐ 1.10 ‐
Page 342

2021 2022 General Special Capital Enterprise InternalFTE FTE Fund Revenue Projects Service
2022 Allocation
FIRE DEPARTMENTFire Chief 1.00 1.00 1.00 ‐ ‐ ‐ ‐ Assistant Fire Chief ‐ Fire Prevention and Special Projects ‐ 1.00 1.00 Battalion Chief 3.00 3.00 3.00 ‐ ‐ ‐ ‐ Division Chief ‐ EMS and Paramedic Training ‐ 1.00 1.00 ‐ ‐ ‐ ‐ Division Chief ‐ Fire Suppression and Technical Rescue Training 1.00 1.00 1.00 ‐ ‐ ‐ ‐ Division Chief ‐ Fire Prevention and Community Risk Reduction 1.00 ‐ ‐ ‐ ‐ ‐ ‐ Division Chief ‐ Professional Standards 1.00 ‐ ‐ ‐ ‐ ‐ ‐ Captain ‐ Paramedic 3.00 4.00 4.00 ‐ ‐ ‐ ‐ Captain ‐ Fire Prevention Bureau 1.00 1.00 1.00 ‐ ‐ ‐ ‐ Captain 7.00 6.00 6.00 ‐ ‐ ‐ ‐ Lieutenant ‐ Paramedic 5.00 8.00 8.00 ‐ ‐ ‐ ‐ Lieutenant ‐ Fire Prevention Bureau 3.00 3.00 3.00 ‐ ‐ ‐ ‐ Lieutenant ‐ EMS 1.00 ‐ ‐ ‐ ‐ ‐ ‐ Lieutenant 13.00 12.00 12.00 ‐ ‐ ‐ ‐ Driver/Operator ‐ Paramedic 9.00 12.00 12.00 ‐ ‐ ‐ ‐ Driver/Operator 24.00 21.00 21.00 ‐ ‐ ‐ ‐ Private ‐ Paramedic 9.00 ‐ ‐ ‐ ‐ ‐ ‐ Private 46.00 54.00 54.00 ‐ ‐ ‐ ‐ Fleet Maintenance Supervisor 1.00 1.00 1.00 ‐ ‐ ‐ ‐ Executive Assistant‐Chief Officers 1.00 1.00 1.00 ‐ ‐ ‐ ‐ Administrative Assistant 1.00 1.00 1.00 ‐ ‐ ‐ ‐ Executive Assistant‐Administration 1.00 1.00 1.00 ‐ ‐ ‐ ‐ Student Clerical Aide 0.50 0.50 0.50 ‐ ‐ ‐ ‐
Total Fire Department 132.50 132.50 132.50 ‐ ‐ ‐ ‐
POLICE DEPARTMENTSworn ForceChief of Police 1.00 1.00 1.00 ‐ ‐ ‐ ‐ Assistant Chief of Police 1.00 1.00 1.00 ‐ ‐ ‐ ‐ Deputy Chief of Police 3.00 3.00 3.00 ‐ ‐ ‐ ‐ Captain 1.00 1.00 1.00 ‐ ‐ ‐ ‐
Page 343

2021 2022 General Special Capital Enterprise InternalFTE FTE Fund Revenue Projects Service
2022 Allocation
LIEUTENANT 9.00 9.00 9.00 ‐ ‐ ‐ ‐ SERGEANT 24.00 24.00 24.00 ‐ ‐ ‐ ‐ INVESTIGATOR 32.00 32.00 32.00 ‐ ‐ ‐ ‐ TRAFFIC INVESTIGATOR 5.00 5.00 5.00 ‐ ‐ ‐ ‐ CRIMINALIST 2.00 2.00 2.00 ‐ ‐ ‐ ‐ POLICE OFFICER 111.00 111.00 111.00 ‐ ‐ ‐ ‐
189.00 189.00 189.00 ‐ ‐ ‐ ‐ CiviliansCustomer Service Manager 1.00 1.00 1.00 ‐ ‐ ‐ ‐ Support Services Manager 1.00 1.00 1.00 ‐ ‐ ‐ ‐ Public Safety IT Systems Manager 1.00 1.00 1.00 ‐ ‐ ‐ ‐ Customer Service Representative 6.00 6.00 6.00 ‐ ‐ ‐ ‐ Administrative Assistant 1.00 1.00 1.00 ‐ ‐ ‐ ‐ Trama Service Counsler 1.00 1.00 ‐ ‐ ‐ ‐ 1.00 Abandoned Vehicle 1.00 1.00 1.00 ‐ ‐ ‐ ‐ Evidence Property Clerk 2.00 2.00 2.00 ‐ ‐ ‐ ‐ Clerk IV 3.00 3.00 3.00 ‐ ‐ ‐ ‐ Clerk/Typist IV 1.00 1.00 1.00 ‐ ‐ ‐ ‐ Secretary II 1.00 1.00 1.00 ‐ ‐ ‐ ‐ Crime Analyst 1.00 1.00 1.00 ‐ ‐ ‐ ‐ Identification Clerk 1.00 1.00 1.00 ‐ ‐ ‐ ‐ Clerk/Typist II ‐ Records 4.00 4.00 4.00 ‐ ‐ ‐ ‐ Clerk/Typist II ‐ Warrant Clerk 1.00 1.00 1.00 ‐ ‐ ‐ ‐ Clerk/Typist II ‐ Subpoena Clerk 1.00 1.00 1.00 ‐ ‐ ‐ ‐ Court Clerk I 1.00 1.00 1.00 ‐ ‐ ‐ ‐ Crossing Guard 7.75 7.75 7.75 ‐ ‐ ‐ ‐ Crossing Guard ‐ WRS 0.62 0.62 0.62 ‐ ‐ ‐ ‐ Crossing Guard ‐ Relief 0.32 0.32 0.32 ‐ ‐ ‐ ‐
Page 344

2021 2022 General Special Capital Enterprise InternalFTE FTE Fund Revenue Projects Service
2022 Allocation
Community Service Officer Supervisor 1.00 1.00 1.00 ‐ ‐ ‐ ‐ Community Service Officer 3.00 3.00 3.00 ‐ ‐ ‐ ‐
40.69 40.69 39.69 ‐ ‐ ‐ 1.00
Total Police Department 229.69 229.69 228.69 ‐ ‐ ‐ 1.00
RADIO COMMUNICATIONS RESOURCESRadio Technician I 1.00 1.00 ‐ ‐ ‐ 1.00 ‐ Radio Technician II 1.00 1.00 ‐ ‐ ‐ 1.00 ‐
Total Radio Communications 2.00 2.00 ‐ ‐ ‐ 2.00 ‐
DEPARTMENT OF PUBLIC WORKSDPW AdministrationCommissioner of Public Works 1.00 1.00 0.75 0.15 ‐ 0.10 Assistant Commissioner of Public Works 1.00 1.00 0.10 0.40 0.30 0.15 0.05 City Engineer 1.00 1.00 0.03 ‐ 0.97 ‐ ‐ Administrative Assistant 1.00 1.00 0.70 0.15 ‐ 0.15 ‐ Clerk‐Typist II 1.00 1.00 Transit Manager ‐ 1.00 1.00 Transit and Parking Manager 1.00 ‐ ‐ ‐ ‐ ‐ ‐
5.00 6.00 1.58 0.70 1.27 2.40 0.05 Engineering DepartmentCIVIL ENGINEER IV 4.00 4.00 ‐ ‐ 3.00 1.00 ‐ CIVIL ENGINEER II 1.00 1.00 ‐ ‐ 1.00 ‐ ‐ ENGINEERING TECHNICIAN II 3.00 3.00 ‐ ‐ 3.00 ‐ ‐ ENGINEERING TECHNICIAN I 1.00 1.00 ‐ ‐ 1.00 ‐ ‐ STUDENT ENGINEERING INTERN 0.15 0.15 ‐ ‐ ‐ 0.15 ‐ CONSTRUCTION INSPECTOR 1.99 1.99 ‐ ‐ 1.99 ‐ ‐
11.14 11.14 ‐ ‐ 9.99 1.15 ‐
Page 345
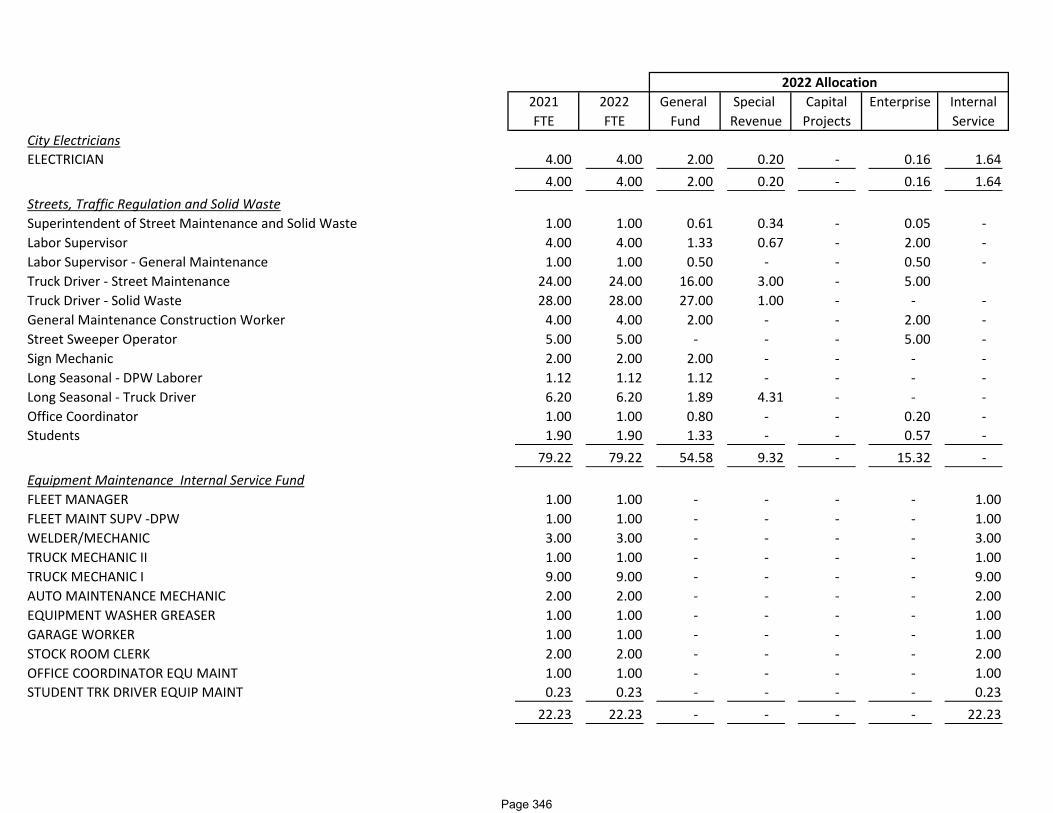
2021 2022 General Special Capital Enterprise InternalFTE FTE Fund Revenue Projects Service
2022 Allocation
City ElectriciansELECTRICIAN 4.00 4.00 2.00 0.20 ‐ 0.16 1.64
4.00 4.00 2.00 0.20 ‐ 0.16 1.64 Streets, Traffic Regulation and Solid WasteSuperintendent of Street Maintenance and Solid Waste 1.00 1.00 0.61 0.34 ‐ 0.05 ‐ Labor Supervisor 4.00 4.00 1.33 0.67 ‐ 2.00 ‐ Labor Supervisor ‐ General Maintenance 1.00 1.00 0.50 ‐ ‐ 0.50 ‐ Truck Driver ‐ Street Maintenance 24.00 24.00 16.00 3.00 ‐ 5.00 Truck Driver ‐ Solid Waste 28.00 28.00 27.00 1.00 ‐ ‐ ‐ General Maintenance Construction Worker 4.00 4.00 2.00 ‐ ‐ 2.00 ‐ Street Sweeper Operator 5.00 5.00 ‐ ‐ ‐ 5.00 ‐ Sign Mechanic 2.00 2.00 2.00 ‐ ‐ ‐ ‐ Long Seasonal ‐ DPW Laborer 1.12 1.12 1.12 ‐ ‐ ‐ ‐ Long Seasonal ‐ Truck Driver 6.20 6.20 1.89 4.31 ‐ ‐ ‐ Office Coordinator 1.00 1.00 0.80 ‐ ‐ 0.20 ‐ Students 1.90 1.90 1.33 ‐ ‐ 0.57 ‐
79.22 79.22 54.58 9.32 ‐ 15.32 ‐ Equipment Maintenance Internal Service FundFLEET MANAGER 1.00 1.00 ‐ ‐ ‐ ‐ 1.00 FLEET MAINT SUPV ‐DPW 1.00 1.00 ‐ ‐ ‐ ‐ 1.00 WELDER/MECHANIC 3.00 3.00 ‐ ‐ ‐ ‐ 3.00 TRUCK MECHANIC II 1.00 1.00 ‐ ‐ ‐ ‐ 1.00 TRUCK MECHANIC I 9.00 9.00 ‐ ‐ ‐ ‐ 9.00 AUTO MAINTENANCE MECHANIC 2.00 2.00 ‐ ‐ ‐ ‐ 2.00 EQUIPMENT WASHER GREASER 1.00 1.00 ‐ ‐ ‐ ‐ 1.00 GARAGE WORKER 1.00 1.00 ‐ ‐ ‐ ‐ 1.00 STOCK ROOM CLERK 2.00 2.00 ‐ ‐ ‐ ‐ 2.00 OFFICE COORDINATOR EQU MAINT 1.00 1.00 ‐ ‐ ‐ ‐ 1.00 STUDENT TRK DRIVER EQUIP MAINT 0.23 0.23 ‐ ‐ ‐ ‐ 0.23
22.23 22.23 ‐ ‐ ‐ ‐ 22.23
Page 346

2021 2022 General Special Capital Enterprise InternalFTE FTE Fund Revenue Projects Service
2022 Allocation
Building Complex Internal Service FundFacilities Manager 1.00 1.00 ‐ ‐ 0.40 ‐ 0.60 Maintenance Supervisor 1.00 1.00 ‐ ‐ ‐ ‐ 1.00 Senior Building Complex Maintenance Worker 1.00 1.00 ‐ ‐ ‐ ‐ 1.00 Building Complex Maintenance Worker 4.00 4.00 ‐ ‐ ‐ ‐ 4.00 Plumber 1.00 1.00 ‐ ‐ ‐ ‐ 1.00 Electrician 1.00 1.00 ‐ ‐ ‐ ‐ 1.00 Carpenter 1.00 1.00 ‐ ‐ ‐ ‐ 1.00 HVAC Mechanic 1.00 1.00 ‐ ‐ ‐ ‐ 1.00
11.00 11.00 ‐ ‐ 0.40 ‐ 10.60 Parking System Enterprise FundParking Meter Collector 1.00 1.00 ‐ ‐ ‐ 1.00 ‐ Parking Meter Maintenance Worker 1.00 1.00 ‐ ‐ ‐ 1.00 ‐ Parking System Utility Worker ‐ ‐ ‐ ‐ ‐ ‐ ‐ Parking System Maintenance Worker ‐ ‐ ‐ ‐ ‐ ‐ ‐ Students ‐ ‐ ‐ ‐ ‐ ‐ ‐ Coin Counters 0.08 0.08 ‐ ‐ ‐ 0.08 ‐
2.08 2.08 ‐ ‐ ‐ 2.08 ‐
Total Department of Public Works 134.67 135.67 58.16 10.22 11.66 21.11 34.52
DEPARTMENT OF PARKS, RECREATION AND CULTURAL SERVICESParks and Recreation AdministrationParks, Recreation and Cultural Services Director 1.00 1.00 1.00 ‐ ‐ ‐ ‐ Administrative Assistant 1.00 1.00 1.00 ‐ ‐ ‐ ‐ Secretary I 2.00 2.00 2.00 ‐ ‐ ‐ ‐
4.00 4.00 4.00 ‐ ‐ ‐ ‐ Parks DepartmentSuperintendent ‐ Parks Maintenance 1.00 1.00 1.00 ‐ ‐ ‐ ‐ Labor Supervisor I ‐ Parks 2.00 2.00 2.00 ‐ ‐ ‐ ‐ Parks and Facilities Specialist ‐ ‐ ‐ ‐ ‐ ‐ ‐
Page 347

2021 2022 General Special Capital Enterprise InternalFTE FTE Fund Revenue Projects Service
2022 Allocation
Parks Equipment Mechanic I 1.00 1.00 1.00 ‐ ‐ ‐ ‐ Equipment Operator 11.00 11.00 11.00 ‐ ‐ ‐ ‐ Long Seasonal ‐ Parks 11.82 12.31 9.85 ‐ ‐ 2.46 ‐ Students Truck Drivers ‐ Parks 2.12 1.64 1.26 ‐ ‐ 0.38 ‐ Arborist 7.00 7.00 ‐ ‐ ‐ 7.00 ‐ Labor Supervisor II ‐ Forestry 1.00 1.00 ‐ ‐ ‐ 1.00 ‐ Student Interns ‐ Arborist 0.01 ‐ ‐ ‐ ‐ ‐ ‐
36.95 36.95 26.11 ‐ ‐ 10.84 ‐ Recreation DepartmentSuperintendent ‐ Recreation and Cultural Services 1.00 1.00 1.00 ‐ ‐ ‐ ‐ Community Center Specialist I ‐ Recreation 0.28 0.33 0.33 ‐ ‐ ‐ ‐ Community Center Specialist I ‐ Recreation ‐ WRS 0.04 0.04 0.04 ‐ ‐ ‐ ‐ Community Center Specialist II ‐ Recreation 0.19 0.25 0.25 ‐ ‐ ‐ ‐ Lifeguard Supervisor 0.67 0.94 0.94 ‐ ‐ ‐ ‐ Lead Head Lifeguard ‐ WRS 0.27 0.27 0.27 ‐ ‐ ‐ ‐ Head Lifeguard 0.09 0.27 0.27 ‐ ‐ ‐ ‐ Head Lifeguard ‐ WRS ‐ ‐ ‐ ‐ ‐ ‐ ‐ Lifeguard 3.58 4.05 4.05 ‐ ‐ ‐ ‐ Playground Leader 4.60 4.60 4.60 ‐ ‐ ‐ ‐ Playground Specialist I 0.66 1.69 1.69 ‐ ‐ ‐ ‐ PRCS Internship/Program Specialist I ‐ ‐ ‐ ‐ ‐ ‐ ‐ Program Leader 0.14 0.21 0.21 ‐ ‐ ‐ ‐ Program Specialist I 0.14 0.02 0.02 ‐ ‐ ‐ ‐ Program Supervisor ‐ Main Gallery 0.04 0.04 0.02 0.02 ‐ ‐ ‐ Artist Assistant ‐ Main Gallery 0.22 0.27 0.18 0.09 ‐ ‐ ‐ Young Artist ‐ Main Gallery 1.73 1.75 ‐ 1.75 ‐ ‐ ‐ Recreation Program Coordinator I 0.01 0.66 0.66 ‐ ‐ ‐ ‐ Recreation Program Coordinator I ‐ WRS ‐ ‐ ‐ ‐ ‐ ‐ ‐ Recreation Program Coordinator II ‐ ‐ ‐ ‐ ‐ ‐ ‐ Recreation Program Coordinator II ‐ WRS ‐ ‐ ‐ ‐ ‐ ‐ ‐ Recreation Program Coordinator III 2.48 1.21 1.21 ‐ ‐ ‐ ‐ Referees ‐ Adult Basketball 0.24 0.24 0.24 ‐ ‐ ‐ ‐
Page 348

2021 2022 General Special Capital Enterprise InternalFTE FTE Fund Revenue Projects Service
2022 Allocation
Sports Facility Supervisor I 0.75 0.66 0.66 ‐ ‐ ‐ ‐ Student Intern Arborist ‐ ‐ ‐ ‐ ‐ ‐ ‐ Student Intern Parks ‐ ‐ ‐ ‐ ‐ ‐ ‐ Timer ‐ Scorer 0.71 0.67 0.67 ‐ ‐ ‐ ‐ Umpire ‐ Adult Slow Pitch 12 inch 0.60 0.61 0.61 ‐ ‐ ‐ ‐ Umpire ‐ Adult Slow Pitch 12 inch ‐ WRS ‐ ‐ ‐ ‐ ‐ ‐ ‐ Volleyball Official ‐ Adult 0.17 0.20 0.20 ‐ ‐ ‐ ‐ Volleyball Official ‐ Adult ‐ WRS ‐ ‐ ‐ ‐ ‐ ‐ ‐ Youth Basketball Referee I 0.28 0.20 0.20 ‐ ‐ ‐ ‐ Youth Basketball Referee II 0.06 0.08 0.08 ‐ ‐ ‐ ‐ Youth Basketball Referee GR 2‐4 PG ‐ ‐ ‐ ‐ ‐ ‐ ‐ Youth Basketball Referee 5‐8 p/Game ‐ ‐ ‐ ‐ ‐ ‐ ‐ Youth Softball Umpire I 0.01 ‐ ‐ ‐ ‐ ‐ ‐ Youth Softball Umpire II 0.01 ‐ ‐ ‐ ‐ ‐ ‐ Youth Softball Umpire GR 6‐8 p/Game ‐ ‐ ‐ ‐ ‐ ‐ ‐ Youth Tall/Coach Pit/Umpire Per Game ‐ ‐ ‐ ‐ ‐ ‐ ‐ Kid Pitch Umpire 4th and 5th ‐ ‐ ‐ ‐ ‐ ‐ ‐
18.97 20.26 18.40 1.86 ‐ ‐ ‐ CemeteryLabor Supervisor I ‐ Cemetery 1.00 1.00 ‐ 1.00 ‐ ‐ ‐ Office Manager 1.00 1.00 ‐ 1.00 ‐ ‐ ‐
2.00 2.00 ‐ 2.00 ‐ ‐ ‐ Community CentersChevez ‐ Community Center Supervisor 1.00 1.00 1.00 ‐ ‐ ‐ ‐ Chavez ‐ Community Center Specialist I 0.69 0.49 0.49 ‐ ‐ ‐ ‐ Chavez ‐ Community Center Specialist I ‐ WRS ‐ ‐ ‐ ‐ ‐ ‐ ‐ Chavez ‐ Community Center Specialist II 0.50 1.19 1.19 ‐ ‐ ‐ ‐ Chavez ‐ Community Center Specialist II ‐ WRS 0.10 0.10 0.10 ‐ ‐ ‐ ‐ Humble ‐ Community Center Specialist I 0.75 0.67 0.67 ‐ ‐ ‐ ‐ Humble ‐ Community Center Specialist I ‐ WRS ‐ ‐ ‐ ‐ ‐ ‐ ‐ Humble ‐ Community Center Specialist II 1.00 0.25 0.25 ‐ ‐ ‐ ‐ Humble ‐ Community Center Specialist II ‐ WRS 0.04 0.04 0.04 ‐ ‐ ‐ ‐
Page 349
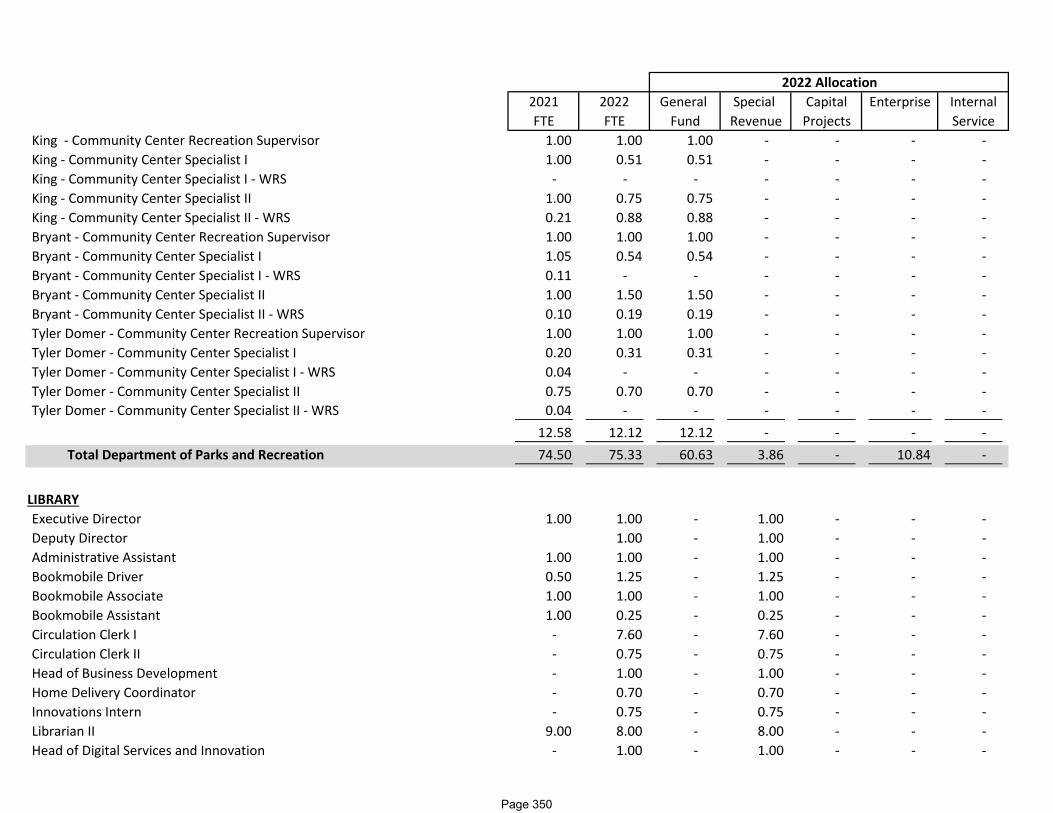
2021 2022 General Special Capital Enterprise InternalFTE FTE Fund Revenue Projects Service
2022 Allocation
King ‐ Community Center Recreation Supervisor 1.00 1.00 1.00 ‐ ‐ ‐ ‐ King ‐ Community Center Specialist I 1.00 0.51 0.51 ‐ ‐ ‐ ‐ King ‐ Community Center Specialist I ‐ WRS ‐ ‐ ‐ ‐ ‐ ‐ ‐ King ‐ Community Center Specialist II 1.00 0.75 0.75 ‐ ‐ ‐ ‐ King ‐ Community Center Specialist II ‐ WRS 0.21 0.88 0.88 ‐ ‐ ‐ ‐ Bryant ‐ Community Center Recreation Supervisor 1.00 1.00 1.00 ‐ ‐ ‐ ‐ Bryant ‐ Community Center Specialist I 1.05 0.54 0.54 ‐ ‐ ‐ ‐ Bryant ‐ Community Center Specialist I ‐ WRS 0.11 ‐ ‐ ‐ ‐ ‐ ‐ Bryant ‐ Community Center Specialist II 1.00 1.50 1.50 ‐ ‐ ‐ ‐ Bryant ‐ Community Center Specialist II ‐ WRS 0.10 0.19 0.19 ‐ ‐ ‐ ‐ Tyler Domer ‐ Community Center Recreation Supervisor 1.00 1.00 1.00 ‐ ‐ ‐ ‐ Tyler Domer ‐ Community Center Specialist I 0.20 0.31 0.31 ‐ ‐ ‐ ‐ Tyler Domer ‐ Community Center Specialist I ‐ WRS 0.04 ‐ ‐ ‐ ‐ ‐ ‐ Tyler Domer ‐ Community Center Specialist II 0.75 0.70 0.70 ‐ ‐ ‐ ‐ Tyler Domer ‐ Community Center Specialist II ‐ WRS 0.04 ‐ ‐ ‐ ‐ ‐ ‐
12.58 12.12 12.12 ‐ ‐ ‐ ‐ Total Department of Parks and Recreation 74.50 75.33 60.63 3.86 ‐ 10.84 ‐
LIBRARYExecutive Director 1.00 1.00 ‐ 1.00 ‐ ‐ ‐ Deputy Director 1.00 ‐ 1.00 ‐ ‐ ‐ Administrative Assistant 1.00 1.00 ‐ 1.00 ‐ ‐ ‐ Bookmobile Driver 0.50 1.25 ‐ 1.25 ‐ ‐ ‐ Bookmobile Associate 1.00 1.00 ‐ 1.00 ‐ ‐ ‐ Bookmobile Assistant 1.00 0.25 ‐ 0.25 ‐ ‐ ‐ Circulation Clerk I ‐ 7.60 ‐ 7.60 ‐ ‐ ‐ Circulation Clerk II ‐ 0.75 ‐ 0.75 ‐ ‐ ‐ Head of Business Development ‐ 1.00 ‐ 1.00 ‐ ‐ ‐ Home Delivery Coordinator ‐ 0.70 ‐ 0.70 ‐ ‐ ‐ Innovations Intern ‐ 0.75 ‐ 0.75 ‐ ‐ ‐ Librarian II 9.00 8.00 ‐ 8.00 ‐ ‐ ‐ Head of Digital Services and Innovation ‐ 1.00 ‐ 1.00 ‐ ‐ ‐
Page 350

2021 2022 General Special Capital Enterprise InternalFTE FTE Fund Revenue Projects Service
2022 Allocation
Library Assistant 8.00 7.00 ‐ 7.00 ‐ ‐ ‐ Library Associate 1.00 1.00 ‐ 1.00 ‐ ‐ ‐ Library Associate II 1.00 1.00 ‐ 1.00 ‐ ‐ ‐ Business Manager 0.60 0.60 ‐ 0.60 ‐ ‐ ‐ Library Social Worker ‐ 1.00 ‐ 1.00 ‐ ‐ ‐ Page 1.20 1.20 ‐ 1.20 ‐ ‐ ‐ Outreach and Marketing Assistant ‐ 0.88 ‐ 0.88 ‐ ‐ ‐ Processing Clerk I 0.68 0.70 ‐ 0.70 ‐ ‐ ‐ Public Service Associate ‐ 1.13 ‐ 1.13 ‐ ‐ ‐ Reference Clerk II 1.44 1.75 ‐ 1.75 ‐ ‐ ‐ Stationary Engineer 1.00 1.00 ‐ 1.00 ‐ ‐ ‐ Van Driver 0.65 0.65 ‐ 0.65 ‐ ‐ ‐ Manager ‐ Adult and Youth Services 1.00 ‐ ‐ ‐ ‐ ‐ ‐ Manager ‐ Circulation and Extension Services 1.00 ‐ ‐ ‐ ‐ ‐ ‐ Computer Technician 1.00 ‐ ‐ ‐ ‐ ‐ ‐ Professional Substitute 0.79 ‐ ‐ ‐ ‐ ‐ ‐ Desk Clerk I 2.20 ‐ ‐ ‐ ‐ ‐ ‐ Desk Clerk II 0.56 ‐ ‐ ‐ ‐ ‐ ‐ Extension Clerk I ‐ ‐ ‐ ‐ ‐ ‐ ‐ Program Services Marketing Assistant 0.50 ‐ ‐ ‐ ‐ ‐ ‐ Shelving Clerk I 4.83 ‐ ‐ ‐ ‐ ‐ ‐
Total Library 40.95 43.21 ‐ 43.21 ‐ ‐ ‐
MUNICIPAL COURTMunicipal Judge 0.50 0.50 ‐ 0.50 ‐ ‐ ‐ Court Clerk I 2.00 1.50 ‐ 1.50 ‐ ‐ ‐ Court Clerk II 1.00 1.00 ‐ 1.00 ‐ ‐ ‐
Total Municipal Court 3.50 3.00 ‐ 3.00 ‐ ‐ ‐
Page 351
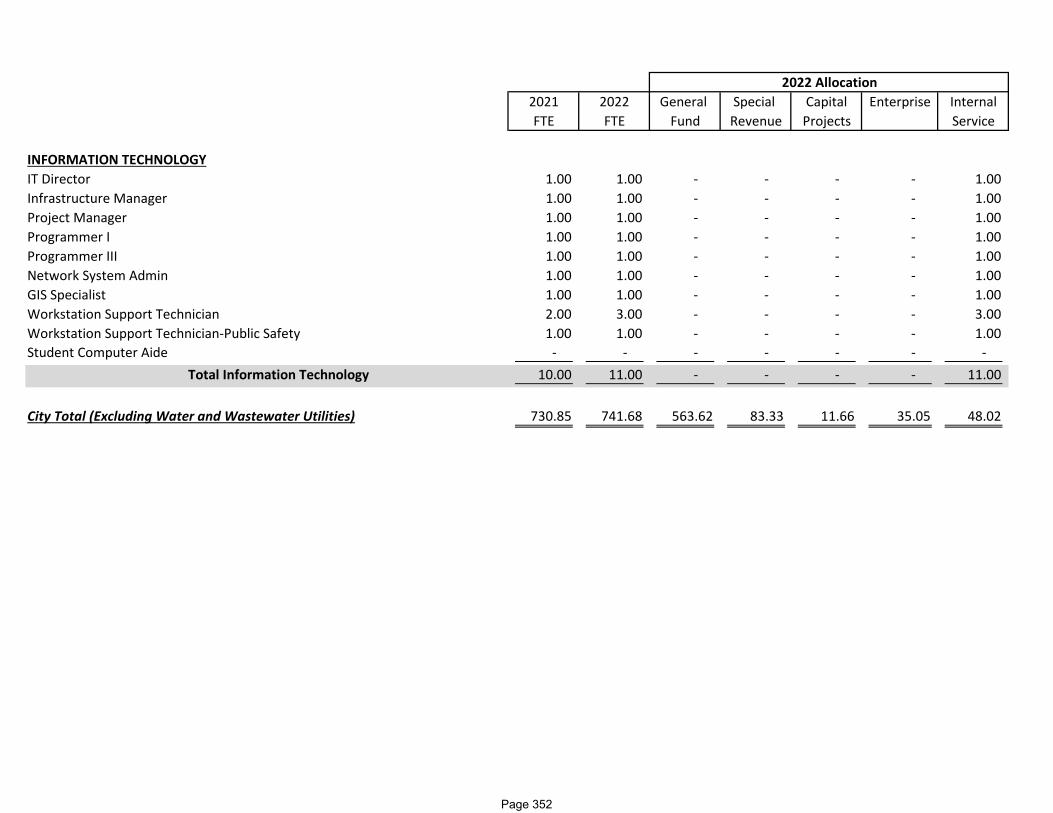
2021 2022 General Special Capital Enterprise InternalFTE FTE Fund Revenue Projects Service
2022 Allocation
INFORMATION TECHNOLOGYIT Director 1.00 1.00 ‐ ‐ ‐ ‐ 1.00 Infrastructure Manager 1.00 1.00 ‐ ‐ ‐ ‐ 1.00 Project Manager 1.00 1.00 ‐ ‐ ‐ ‐ 1.00 Programmer I 1.00 1.00 ‐ ‐ ‐ ‐ 1.00 Programmer III 1.00 1.00 ‐ ‐ ‐ ‐ 1.00 Network System Admin 1.00 1.00 ‐ ‐ ‐ ‐ 1.00 GIS Specialist 1.00 1.00 ‐ ‐ ‐ ‐ 1.00 Workstation Support Technician 2.00 3.00 ‐ ‐ ‐ ‐ 3.00 Workstation Support Technician‐Public Safety 1.00 1.00 ‐ ‐ ‐ ‐ 1.00 Student Computer Aide ‐ ‐ ‐ ‐ ‐ ‐ ‐
Total Information Technology 10.00 11.00 ‐ ‐ ‐ ‐ 11.00
City Total (Excluding Water and Wastewater Utilities) 730.85 741.68 563.62 83.33 11.66 35.05 48.02
Page 352

2020 2021 2022 ChangeFINANCE DEPARTMENTTreasuryNSF‐Returned check Fee 35.00 35.00 35.00 ‐$ Check Stop Payment 25.00 25.00 25.00 ‐$ Check Reissue Fee 10.00 10.00 10.00 ‐$
Payroll ‐$ Child Support Withholding fee (per check) 3.00 3.00 3.00 ‐$
City Clerk ‐$ Tax Search Fee 40.00 40.00 40.00 ‐$ Tax Search Email or Fax Results 1.00 1.00 1.00 ‐$ Tax Search Fee (Rush) 55.00 55.00 55.00 ‐$ Class "A"‐Beer 100.00 100.00 100.00 ‐$ Class "B"‐Beer 100.00 100.00 100.00 ‐$ "Class C"‐ Wine Restaurant 100.00 100.00 100.00 ‐$ "Class B"‐Clubs 100.00 100.00 100.00 ‐$ Class B‐Short Term 10.00 10.00 10.00 ‐$ Class B‐ Wine/ Beer Walk 10.00 10.00 10.00 ‐$ Provisional Operator 15.00 15.00 15.00 ‐$ Class B‐ Temp Extension of Premise 10.00 10.00 10.00 ‐$ Class D‐Bartenders (2 Year License) 75.00 75.00 75.00 ‐$ "Class A"‐Liquor Stores 500.00 500.00 500.00 ‐$ "Class B"‐Liquor Taverns 500.00 500.00 500.00 ‐$ "Class B" Waitlist 1,000.00 1,000.00 1,000.00 ‐$ "Class B" ‐ Reserve License 10,000.00 10,000.00 15,000.00 5,000.00$ Premise Description Change Fee 50.00 50.00 ‐$ Liquor Late Fee $25.00/Day $25.00/Day $25.00/Day ‐Theatre Licenses 550.00 550.00 550.00 ‐$ Dance Hall (Per Location) 100.00 100.00 100.00 ‐$ Cigarette ("Class B" & Class"B") 50.00 50.00 50.00 ‐$ Cigarette (No Class B License) 100.00 100.00 100.00 ‐$ Cigarette Late Fee (Per Location) 50.00 50.00 50.00 ‐$ Hawkers & Peddlers ‐ Push Cart/By Foot/Stand 3 Days or Less 35.00 50.00 50.00 ‐$ Hawkers & Peddlers ‐ Seasonal Stand (up to 4 months) 110.00 150.00 150.00 ‐$ Hawkers & Peddlers ‐ Vehicle (up to 2 tons) 50.00 100.00 100.00 ‐$ Hawkers & Peddlers ‐ Vehicle (2‐3 tons) 100.00 150.00 150.00 ‐$ Hawkers & Peddlers ‐ Vehicle (3‐4 tons) 150.00 200.00 200.00 ‐$
Proposed 2022 Fee Schedule and Comparison to Prior Years
Page 353

2020 2021 2022 Change
Proposed 2022 Fee Schedule and Comparison to Prior Years
Hawkers & Peddlers ‐ Vehicle (over 4 tons) 200.00 250.00 250.00 ‐$ Hawkers & Peddlers ‐ ID Badge 10.00 10.00 10.00 ‐$ Hawkers & Peddlers Late ‐ Not submitted within 1 week period 75.00 75.00 75.00 ‐$ Hawkers & Peddlers Late ‐ Not submitted within 2 week period 50.00 50.00 50.00 ‐$ Gas Station 100.00 100.00 100.00 ‐$ Public Passenger Business 150.00 150.00 150.00 ‐$ Public Passenger Vehicle (Per Vehicle) 25.00 25.00 25.00 ‐$ Public Passenger Drivers License 50.00 50.00 50.00 ‐$ Amusement Center $300.00+20.00 per
device $300.00+20.00 per
device $300.00+20.00 per
device ‐
Amusement Device (Per Device‐ includes Pool Tables in 2020) 40.00 40.00 40.00 ‐$ Bowling Alleys (Per Alley) 25.00 25.00 25.00 ‐$ Change of Agent/Transfer 10.00 10.00 10.00 ‐$ Carnival License per ride (Per Day ‐ Maximum fee $300) 10.00 10.00 10.00 ‐$ Pawnbroker 500.00 500.00 750.00 250.00$ Secondhand Jewelry 500.00 500.00 750.00 250.00$ Secondhand Mall or Flea Market 1,000.00 1,000.00 1,250.00 250.00$ Secondhand Article 500.00 500.00 750.00 250.00$ Massage Establishment Permit 175.00 175.00 175.00 ‐$ Non registrant Massage Therapist 60.00 60.00 60.00 ‐$ Adult Oriented Establishment 1,000.00 1,000.00 1,000.00 ‐$ Adult Oriented Establishment Per Booth Over 20 Booths 100.00 100.00 100.00 ‐$ Christmas Tree License 50.00 50.00 50.00 ‐$ Sidewalk Café Permit 100.00 100.00 100.00 ‐$ Sidewalk Café Permit w/ liquor 125.00 125.00 125.00 ‐$ Motor Vehicle Towing Business 100.00 150.00 150.00 ‐$ Motor Vehicle Towing (Per Vehicle) 15.00 30.00 30.00 ‐$ Misc License Late Fee 50.00 50.00$ Publication Fees 40.00 40.00 40.00 ‐$ Tax Exempt Fees (Per Owner ‐ Even Years Only) 30.00 30.00 30.00 ‐$ Record Check 15.00 15.00 15.00 ‐$ Copies (Per Page) 0.25 0.25 0.25 ‐$ License Reprint (Per License) 10.00 10.00 10.00 ‐$ Notary (Per Notary Page) 5.00 5.00 5.00 ‐$ Special Common Council Meeting (Per Meeting) 500.00 500.00 500.00 ‐$ Waste Tire Generator (Per Vehicle) 150.00 150.00 150.00 ‐$
Page 354

2020 2021 2022 Change
Proposed 2022 Fee Schedule and Comparison to Prior Years
Waste Tire Transporter (Per Vehicle) 30.00 50.00 50.00 ‐$ Rental Registration (Per Property) 10.00 10.00 10.00 ‐$ Commercial Registration (Per Property) 25.00 25.00 25.00 ‐$ Foreclosure Registration (Per Property) 200.00 200.00 200.00 ‐$ Re‐Inspection of Steet Opening 50.00 50.00$ Block Party $25.00 25.00 ‐$ Block Party Late Fee 25.00 25.00$ Street Closing $150 per block ‐Street Opening $150 per excavation or $2.50 per lineal foot ‐Deposit Permanent Pavement‐ resufaced with asphalt 400.00 400.00$ Deposit Permanent Pavement 400.00 400.00$ Deposit Bituminous concrete 200.00 200.00$ Deposit Deep oil mat 200.00 200.00$ Deposit Crushed stone or gravel 40.00 40.00$ Unimproved Street 20.00 20.00$ Sidewalk Opening Deposit 250.00 250.00$ Street Opening Late Fee 25.00 25.00$ Sidewalk Permit 25.00 25.00$ Sidewalk Late Fee 10.00 10.00$ Tempoary No Parking Signs $1.00 $5.00 4.00$ Meter Bag $8 Per Day $15 Per Day ‐Disabled Parking Sign $100.00 and fees ‐Autistic Child Sign $100.00 and fees ‐Deaf Child Sign $100.00 and fees ‐Blind Child Sign $100.00 and fees ‐Solicitor Badge‐ Door to Door No Cash Exchange (New License) $25 25.00$ Premise Description Fee ‐ 50.00 50.00 ‐$
Page 355
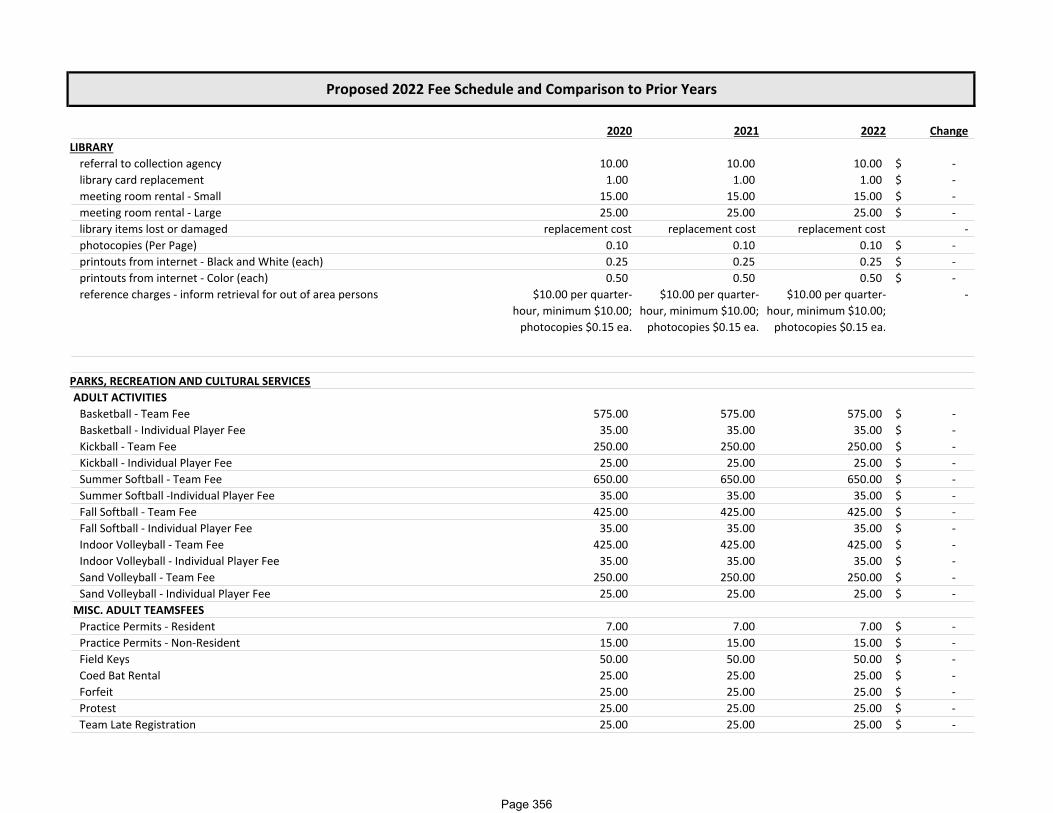
2020 2021 2022 Change
Proposed 2022 Fee Schedule and Comparison to Prior Years
LIBRARYreferral to collection agency 10.00 10.00 10.00 ‐$ library card replacement 1.00 1.00 1.00 ‐$ meeting room rental ‐ Small 15.00 15.00 15.00 ‐$ meeting room rental ‐ Large 25.00 25.00 25.00 ‐$ library items lost or damaged replacement cost replacement cost replacement cost ‐photocopies (Per Page) 0.10 0.10 0.10 ‐$ printouts from internet ‐ Black and White (each) 0.25 0.25 0.25 ‐$ printouts from internet ‐ Color (each) 0.50 0.50 0.50 ‐$ reference charges ‐ inform retrieval for out of area persons $10.00 per quarter‐
hour, minimum $10.00; photocopies $0.15 ea.
$10.00 per quarter‐hour, minimum $10.00; photocopies $0.15 ea.
$10.00 per quarter‐hour, minimum $10.00; photocopies $0.15 ea.
‐
PARKS, RECREATION AND CULTURAL SERVICESADULT ACTIVITIESBasketball ‐ Team Fee 575.00 575.00 575.00 ‐$ Basketball ‐ Individual Player Fee 35.00 35.00 35.00 ‐$ Kickball ‐ Team Fee 250.00 250.00 250.00 ‐$ Kickball ‐ Individual Player Fee 25.00 25.00 25.00 ‐$ Summer Softball ‐ Team Fee 650.00 650.00 650.00 ‐$ Summer Softball ‐Individual Player Fee 35.00 35.00 35.00 ‐$ Fall Softball ‐ Team Fee 425.00 425.00 425.00 ‐$ Fall Softball ‐ Individual Player Fee 35.00 35.00 35.00 ‐$ Indoor Volleyball ‐ Team Fee 425.00 425.00 425.00 ‐$ Indoor Volleyball ‐ Individual Player Fee 35.00 35.00 35.00 ‐$ Sand Volleyball ‐ Team Fee 250.00 250.00 250.00 ‐$ Sand Volleyball ‐ Individual Player Fee 25.00 25.00 25.00 ‐$
MISC. ADULT TEAMSFEESPractice Permits ‐ Resident 7.00 7.00 7.00 ‐$ Practice Permits ‐ Non‐Resident 15.00 15.00 15.00 ‐$ Field Keys 50.00 50.00 50.00 ‐$ Coed Bat Rental 25.00 25.00 25.00 ‐$ Forfeit 25.00 25.00 25.00 ‐$ Protest 25.00 25.00 25.00 ‐$ Team Late Registration 25.00 25.00 25.00 ‐$
Page 356

2020 2021 2022 Change
Proposed 2022 Fee Schedule and Comparison to Prior Years
YOUTH ACTIVITIESSoftball ‐ Resident 40.00 40.00 40.00 ‐$ Softball ‐ Non‐Resident 60.00 60.00 60.00 ‐$ Softball ‐ Late Registration 10.00 10.00 10.00 ‐$ Basketball ‐ Resident 40.00 40.00 40.00 ‐$ Basketball ‐ Non‐Resident 60.00 60.00 60.00 ‐$ Basketball ‐ Late Registration 10.00 10.00 10.00 ‐$ Playgrounds ‐ Resident 75.00 75.00 75.00 ‐$ Playgrounds ‐ Non‐Resident 105.00 105.00 105.00 ‐$
BOAT LAUNCH ‐ DAILY PASSESNon‐Motorized ‐ Resident 8.00 8.00 8.00 ‐$ Non‐Motorized ‐ Non‐Resident 12.00 12.00 12.00 ‐$ Less than 20' ‐ Resident 12.00 12.00 12.00 ‐$ Less than 20' ‐ Non‐Resident 18.00 18.00 18.00 ‐$ 20' but less than 26' ‐ Resident 15.00 15.00 15.00 ‐$ 20' but less than 26' ‐ Non‐Resident 22.00 22.00 22.00 ‐$ 26' or longer ‐ Resident 18.00 18.00 18.00 ‐$ 26' or longer ‐ Non‐Resident 27.00 27.00 27.00 ‐$
BOAT LAUNCH ‐ SEASON PASSESNon‐Motorized ‐ Resident 65.00 65.00 65.00 ‐$ Non‐Motorized ‐ Non‐Resident 95.00 95.00 95.00 ‐$ Less than 20' ‐ Resident 90.00 90.00 90.00 ‐$ Less than 20' ‐ Non‐Resident 135.00 135.00 135.00 ‐$ 20' but less than 26' ‐ Resident 105.00 105.00 105.00 ‐$ 20' but less than 26' ‐ Non‐Resident 155.00 155.00 155.00 ‐$ 26' or longer ‐ Resident 145.00 145.00 145.00 ‐$ 26' or longer ‐ Non‐Resident 215.00 215.00 215.00 ‐$
ATHLETIC FIELD RENTALHorlick Adult Baseball per game ‐ Resident 200.00 220.00 220.00 ‐$ Horlick Adult Baseball per game ‐ Non‐Resident 300.00 330.00 330.00 ‐$ Horlick Youth Baseball per game ‐ Resident ‐ 125.00 125.00 ‐$ Horlick Youth Baseball per game ‐ Non‐Resident ‐ 190.00 190.00 ‐$ Football Per game ‐ Resident 450.00 800.00 800.00 ‐$ Football Per game ‐ Non‐Resident 675.00 1,200.00 1,200.00 ‐$ Pershing Outside open field per game ‐ Resident 50.00 50.00 50.00 ‐$ Pershing Outside open field per game ‐ Non‐Resident 75.00 75.00 75.00 ‐$
Page 357
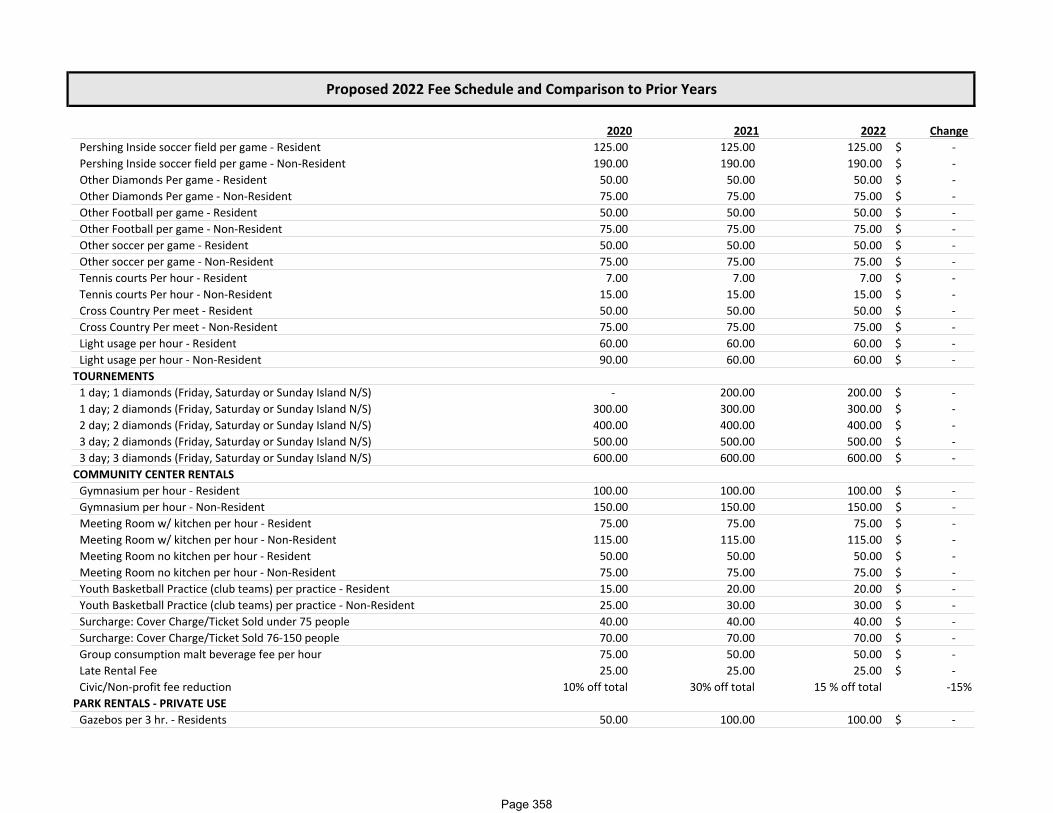
2020 2021 2022 Change
Proposed 2022 Fee Schedule and Comparison to Prior Years
Pershing Inside soccer field per game ‐ Resident 125.00 125.00 125.00 ‐$ Pershing Inside soccer field per game ‐ Non‐Resident 190.00 190.00 190.00 ‐$ Other Diamonds Per game ‐ Resident 50.00 50.00 50.00 ‐$ Other Diamonds Per game ‐ Non‐Resident 75.00 75.00 75.00 ‐$ Other Football per game ‐ Resident 50.00 50.00 50.00 ‐$ Other Football per game ‐ Non‐Resident 75.00 75.00 75.00 ‐$ Other soccer per game ‐ Resident 50.00 50.00 50.00 ‐$ Other soccer per game ‐ Non‐Resident 75.00 75.00 75.00 ‐$ Tennis courts Per hour ‐ Resident 7.00 7.00 7.00 ‐$ Tennis courts Per hour ‐ Non‐Resident 15.00 15.00 15.00 ‐$ Cross Country Per meet ‐ Resident 50.00 50.00 50.00 ‐$ Cross Country Per meet ‐ Non‐Resident 75.00 75.00 75.00 ‐$ Light usage per hour ‐ Resident 60.00 60.00 60.00 ‐$ Light usage per hour ‐ Non‐Resident 90.00 60.00 60.00 ‐$
TOURNEMENTS1 day; 1 diamonds (Friday, Saturday or Sunday Island N/S) ‐ 200.00 200.00 ‐$ 1 day; 2 diamonds (Friday, Saturday or Sunday Island N/S) 300.00 300.00 300.00 ‐$ 2 day; 2 diamonds (Friday, Saturday or Sunday Island N/S) 400.00 400.00 400.00 ‐$ 3 day; 2 diamonds (Friday, Saturday or Sunday Island N/S) 500.00 500.00 500.00 ‐$ 3 day; 3 diamonds (Friday, Saturday or Sunday Island N/S) 600.00 600.00 600.00 ‐$
COMMUNITY CENTER RENTALSGymnasium per hour ‐ Resident 100.00 100.00 100.00 ‐$ Gymnasium per hour ‐ Non‐Resident 150.00 150.00 150.00 ‐$ Meeting Room w/ kitchen per hour ‐ Resident 75.00 75.00 75.00 ‐$ Meeting Room w/ kitchen per hour ‐ Non‐Resident 115.00 115.00 115.00 ‐$ Meeting Room no kitchen per hour ‐ Resident 50.00 50.00 50.00 ‐$ Meeting Room no kitchen per hour ‐ Non‐Resident 75.00 75.00 75.00 ‐$ Youth Basketball Practice (club teams) per practice ‐ Resident 15.00 20.00 20.00 ‐$ Youth Basketball Practice (club teams) per practice ‐ Non‐Resident 25.00 30.00 30.00 ‐$ Surcharge: Cover Charge/Ticket Sold under 75 people 40.00 40.00 40.00 ‐$ Surcharge: Cover Charge/Ticket Sold 76‐150 people 70.00 70.00 70.00 ‐$ Group consumption malt beverage fee per hour 75.00 50.00 50.00 ‐$ Late Rental Fee 25.00 25.00 25.00 ‐$ Civic/Non‐profit fee reduction 10% off total 30% off total 15 % off total ‐15%
PARK RENTALS ‐ PRIVATE USEGazebos per 3 hr. ‐ Residents 50.00 100.00 100.00 ‐$
Page 358

2020 2021 2022 Change
Proposed 2022 Fee Schedule and Comparison to Prior Years
Gazebos per 3 hr. ‐ Non‐Residents 150.00 150.00$ Pavilions w/restrooms & electricity per day ‐ Resident 125.00 125.00 125.00 ‐$ Pavilions w/restrooms & electricity per day ‐ Non‐Resident 185.00 185.00 185.00 ‐$ Pavilions no restrooms $ electricity per day ‐ Resident 100.00 100.00 100.00 ‐$ Pavilions no restrooms $ electricity per day ‐ Non‐Resident 150.00 150.00 150.00 ‐$ Pavilions(Small) no restrooms & electricity per day ‐ Resident 75.00 75.00$ Pavilions (small) no restrooms & electricity per day ‐ Non‐Resident 110.00 110.00$ Sign & Banner Placement at Parks per 30 days 90.00 90.00 90.00 ‐$ Music License (Amplified Sound) Fee per reservation 65.00 65.00 65.00 ‐$ Group consumption malt beverage fee per reservation 30.00 50.00 50.00 ‐$ Late Rental Fee 25.00 25.00 25.00 ‐$
PARK RENTALS ‐ PUBLIC EVENTSApplication Fee (For new public events only) ‐ 25.00 25.00 ‐$ Island/Lincoln/Lockwood Public Event Level Fees added to base fee: ‐$ Civic/Non‐profit 10% 30% 15% ‐15%Level I ‐ Resident 375.00 365.00 365.00 ‐$ Level I ‐ Non‐Resident 565.00 550.00 550.00 ‐$ Level II ‐ Resident 550.00 445.00 445.00 ‐$ Level II ‐ Non‐Resident 825.00 670.00 670.00 ‐$ Level III ‐ Resident 750.00 585.00 585.00 ‐$ Level III ‐ Non‐Resident 1,125.00 880.00 880.00 ‐$ Level IV ‐ Resident 1,000.00 885.00 885.00 ‐$ Level IV ‐ Non‐Resident 1,500.00 1,330.00 1,330.00 ‐$ Late Fee 100.00 100.00 100.00 ‐$
North Beach/Pershing Park Public Event Level Fees:Level I & Civic/Non‐profit 10% 30% 15% ‐15%Level I ‐ Resident 550.00 550.00 550.00 ‐$ Level I ‐ Non‐Resident 825.00 825.00 825.00 ‐$ Level II ‐ Resident 725.00 650.00 650.00 ‐$ Level II ‐ Non‐Resident 1,090.00 975.00 975.00 ‐$ Level III ‐ Resident 1,050.00 1,000.00 1,000.00 ‐$ Level III ‐ Non‐Resident 1,575.00 1,500.00 1,500.00 ‐$ Level IV ‐ Resident 1,750.00 1,600.00 1,600.00 ‐$ Level IV ‐ Non‐Resident 2,625.00 2,400.00 2,400.00 ‐$
Incidental Locations per DayCrosswalk Park/Harris Plaza/Monument Sq.; SJ Pkway ‐ Resident 100.00 100.00 100.00 ‐$
Page 359

2020 2021 2022 Change
Proposed 2022 Fee Schedule and Comparison to Prior Years
Crosswalk Park/Harris Plaza/Monument Sq.; SJ Pkway ‐ Non‐Resident 150.00 150.00 150.00 ‐$
Monument Square Drive Closure ‐ Resident 220.00 220.00$ Monument Square Drive Closure ‐ Non‐Resident 220.00 220.00$ Pathways Lake Michigan/Root River ‐ Resident 100.00 100.00 100.00 ‐$ Pathways Lake Michigan/Root River ‐ Non‐Resident 150.00 150.00 150.00 ‐$ Parking Lots Per Space ‐ Resident 2.00 2.00 2.00 ‐$ Parking Lots Per Space ‐ Non‐Resident 4.00 4.00 40.00 36.00$
Stage on Wheels ‐ resident & non‐profit only (Per one Day) 400.00 400.00 400.00 ‐$ additional open close per day 200.00 200.00 200.00 ‐$ additional staging ‐ one time fee 50.00 50.00 50.00 ‐$
WPRA Attraction ‐ per ticket (WPRA Directs Pricing and we receive a percentage of sales)Six Flags 1 Day Dictated by WPRA Dictated by WPRA ‐$ Six Flags WPRA Week Dictated by WPRA Dictated by WPRA ‐$ Six Flags Season Pass Dictated by WPRA Dictated by WPRA ‐$ Milw Zoo Adult Dictated by WPRA Dictated by WPRA ‐$ Milw Zoo Child Dictated by WPRA Dictated by WPRA ‐$ Noah's Ark Dictated by WPRA Dictated by WPRA ‐$ Upper Dells tour Adult Dictated by WPRA Dictated by WPRA ‐$ Upper Dells tour Child Dictated by WPRA Dictated by WPRA ‐$ Pirates Cove Golf Dictated by WPRA Dictated by WPRA ‐$ Mt Olympus Dictated by WPRA Dictated by WPRA ‐$ Jet Boat Adv Adult Dictated by WPRA Dictated by WPRA ‐$ Jet Boat Adv Child Dictated by WPRA Dictated by WPRA ‐$ Wisconsin Ducks Adult Dictated by WPRA Dictated by WPRA ‐$ Wisconsin Ducks Child Dictated by WPRA Dictated by WPRA ‐$
Copy Charges (Per Page) 0.25 0.25 0.25 ‐$ Waste Wood Delivery (Per Delivery) 78.83 78.83 78.83 ‐$ NSF Fee (Per Check) 35.00 50.00 50.00 ‐$
Page 360

2020 2021 2022 Change
Proposed 2022 Fee Schedule and Comparison to Prior Years
CEMETERYPRICE LISTAdult Grave ‐ Resident 1,025.00 1,075.00 1,130.00 55.00$ Adult Grave ‐ Non‐Resident 1,130.00 1,185.00 1,245.00 60.00$ Child Grave ‐ 3 Yrs. & Older ‐ Resident 970.00 1,020.00 1,070.00 50.00$ Child Grave ‐ 3 Yrs. & Older ‐ Non‐Resident 1,060.00 1,115.00 1,170.00 55.00$ Cremation Grave ‐ Resident 630.00 660.00 695.00 35.00$ Cremation Grave ‐ Non‐Resident 695.00 730.00 765.00 35.00$ Infant Grave ‐ 2 Years & Younger N/A N/A N/A ‐$ Adult Internment ‐ Resident 1,120.00 1,175.00 1,235.00 60.00$ Adult Internment ‐ Non‐Resident 1,235.00 1,295.00 1,360.00 65.00$ Infant Internment 265.00 280.00 295.00 15.00$ Child Internment ‐ Resident 865.00 910.00 955.00 45.00$ Child Internment ‐ Non‐Resident 955.00 1,002.00 1,050.00 48.00$ Cremation Internment ‐ Resident 705.00 740.00 775.00 35.00$ Cremation Internment ‐ Non‐Resident 775.00 815.00 855.00 40.00$ Double Depth 1st Burial ‐ Resident 475.00 500.00 525.00 25.00$ Double Depth 1st Burial ‐ Non‐Resident 520.00 545.00 570.00 25.00$ Crypt Entombment ‐ Resident 950.00 1,000.00 1,050.00 50.00$ Crypt Entombment ‐ Non‐Resident 1,040.00 1,090.00 1,145.00 55.00$ Crypt Entombment ‐ Resident 300.00 300.00$ Crypt Entombment ‐ Non‐Resident 300.00 300.00$ Niche Inurnment ‐ Resident 630.00 660.00 695.00 35.00$ Niche Inurnment ‐ Non‐Resident 695.00 730.00 765.00 35.00$ Adult Disinterment 2,210.00 2,320.00 2,435.00 115.00$ Child Disinterment 2,000.00 2,100.00 2,205.00 105.00$ Infant Disinterment 1,210.00 1,270.00 1,335.00 65.00$ Cremation Disinterment 1,030.00 1,080.00 1,135.00 55.00$ Disentombment ‐ Crypts 1,836.00 1,925.00 2,020.00 95.00$ Disinterment ‐ Niches 785.00 825.00 865.00 40.00$ Graveside Lowering Device 71.00 74.00 210.00 136.00$ Cremation Stand/Set Up 41.00 42.00 45.00 3.00$
WEEKEND FEEAfter 3:00 pm/half hr. 110.00 115.00 120.00 5.00$
SATURDAY SERVICE FEES9 am to 12 Noon 390.00 410.00 430.00 20.00$
Page 361
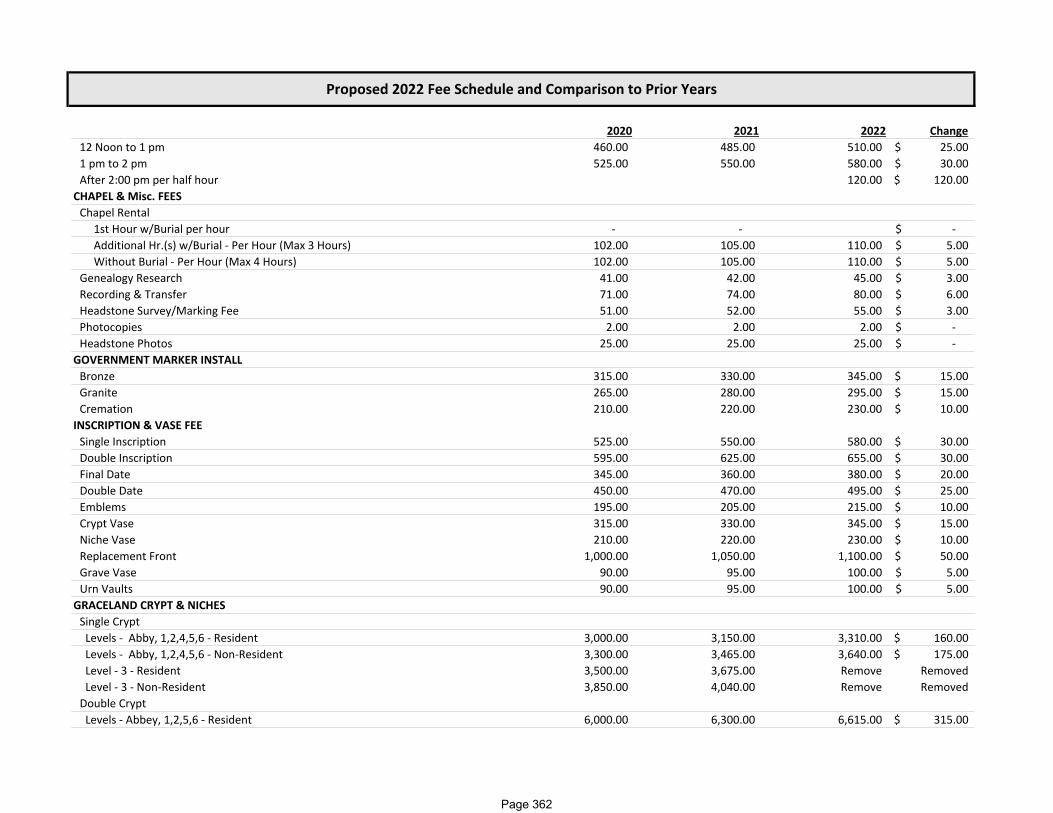
2020 2021 2022 Change
Proposed 2022 Fee Schedule and Comparison to Prior Years
12 Noon to 1 pm 460.00 485.00 510.00 25.00$ 1 pm to 2 pm 525.00 550.00 580.00 30.00$ After 2:00 pm per half hour 120.00 120.00$
CHAPEL & Misc. FEESChapel Rental 1st Hour w/Burial per hour ‐ ‐ ‐$ Additional Hr.(s) w/Burial ‐ Per Hour (Max 3 Hours) 102.00 105.00 110.00 5.00$ Without Burial ‐ Per Hour (Max 4 Hours) 102.00 105.00 110.00 5.00$ Genealogy Research 41.00 42.00 45.00 3.00$ Recording & Transfer 71.00 74.00 80.00 6.00$ Headstone Survey/Marking Fee 51.00 52.00 55.00 3.00$ Photocopies 2.00 2.00 2.00 ‐$ Headstone Photos 25.00 25.00 25.00 ‐$
GOVERNMENT MARKER INSTALLBronze 315.00 330.00 345.00 15.00$ Granite 265.00 280.00 295.00 15.00$ Cremation 210.00 220.00 230.00 10.00$
INSCRIPTION & VASE FEESingle Inscription 525.00 550.00 580.00 30.00$ Double Inscription 595.00 625.00 655.00 30.00$ Final Date 345.00 360.00 380.00 20.00$ Double Date 450.00 470.00 495.00 25.00$ Emblems 195.00 205.00 215.00 10.00$ Crypt Vase 315.00 330.00 345.00 15.00$ Niche Vase 210.00 220.00 230.00 10.00$ Replacement Front 1,000.00 1,050.00 1,100.00 50.00$ Grave Vase 90.00 95.00 100.00 5.00$ Urn Vaults 90.00 95.00 100.00 5.00$
GRACELAND CRYPT & NICHESSingle Crypt Levels ‐ Abby, 1,2,4,5,6 ‐ Resident 3,000.00 3,150.00 3,310.00 160.00$ Levels ‐ Abby, 1,2,4,5,6 ‐ Non‐Resident 3,300.00 3,465.00 3,640.00 175.00$ Level ‐ 3 ‐ Resident 3,500.00 3,675.00 Remove Removed Level ‐ 3 ‐ Non‐Resident 3,850.00 4,040.00 Remove RemovedDouble Crypt Levels ‐ Abbey, 1,2,5,6 ‐ Resident 6,000.00 6,300.00 6,615.00 315.00$
Page 362

2020 2021 2022 Change
Proposed 2022 Fee Schedule and Comparison to Prior Years
Levels ‐ Abbey, 1,2,5,6 ‐ Non‐Resident 6,600.00 6,930.00 7,275.00 345.00$ Level ‐ 3,4 ‐ Resident 6,500.00 6,825.00 Remove Removed Level ‐ 3,4 ‐ Nonresident 7,150.00 7,510.00 Remove RemovedSingle Niche Levels ‐ A,B,C,H,I,J,K ‐ Resident 1,300.00 1,365.00 1,435.00 70.00$ Levels ‐ A,B,C,H,I,J,K ‐ Non‐Resident 1,430.00 1,500.00 1,575.00 75.00$ Levels ‐ D,E,F,G ‐ Resident 1,400.00 1,470.00 Remove Removed Levels ‐ D,E,F,G ‐ Non‐Resident 1,540.00 1,620.00 Remove Removed
MOUND CRYPT & NICHESBuilding Aa End Cap West Companion ‐ A ‐ J (Resident) 2,000.00 2,100.00 2,205.00 105.00$ Companion ‐ A ‐ J (Non‐Resident) 2,200.00 2,310.00 2,425.00 115.00$ Companion ‐ D,E,F,G ‐ Resident 2,600.00 2,730.00 Remove Removed Companion ‐ D,E,F,G ‐ Non‐Resident 2,860.00 3,005.00 Remove RemovedBuilding Aa End Cap West Single ‐ A ‐ J (Resident) 2,000.00 1,365.00 1,435.00 70.00$ Single ‐ A ‐ J (Non‐Resident) 2,200.00 1,500.00 1,575.00 75.00$ Single ‐ D,E,F,G ‐ Resident 2,600.00 1,470.00 Remove Removed Single ‐ D,E,F,G ‐ Non‐Resident 2,860.00 1,620.00 Remove RemovedBuilding Ab Fountain View Tandem Crypts ‐ A ‐ E (Resident) 6,000.00 6,300.00 6,615.00 315.00$ Tandem Crypts ‐ A ‐ E (Non‐Resident) 6,600.00 6,930.00 7,275.00 345.00$ Tandem Crypts ‐ C ‐ Resident 6,500.00 6,825.00 Remove Removed Tandem Crypts ‐ C ‐ Non‐Resident 7,150.00 7,510.00 Remove RemovedBuilding Ac Court Yard West Companion Niches ‐ A ‐ J (Resident) 2,000.00 2,100.00 2,205.00 105.00$ Companion Niches ‐ A ‐ J (Non‐Resident) 2,200.00 2,310.00 2,425.00 115.00$ Companion Niches ‐ D,E,F,G ‐ Resident 2,600.00 2,730.00 Remove Removed Companion Niches ‐ D,E,F,G ‐ Non‐Resident 2,860.00 3,005.00 Remove RemovedBuilding Ac Court Yard West Companion Crypts ‐ A ‐ E (Resident) 6,500.00 6,825.00 7,165.00 340.00$ Companion Crypts ‐ A ‐ E (Non‐Resident) 7,150.00 7,510.00 7,885.00 375.00$ Companion Crypts ‐ C ‐ Resident 7,000.00 7,350.00 Remove Removed Companion Crypts ‐ C ‐ Non‐Resident 7,700.00 8,085.00 Remove RemovedBuilding Ad Court Yard North Tandem Crypts ‐ A ‐ E (Resident) 6,000.00 6,300.00 6,615.00 315.00$
Page 363
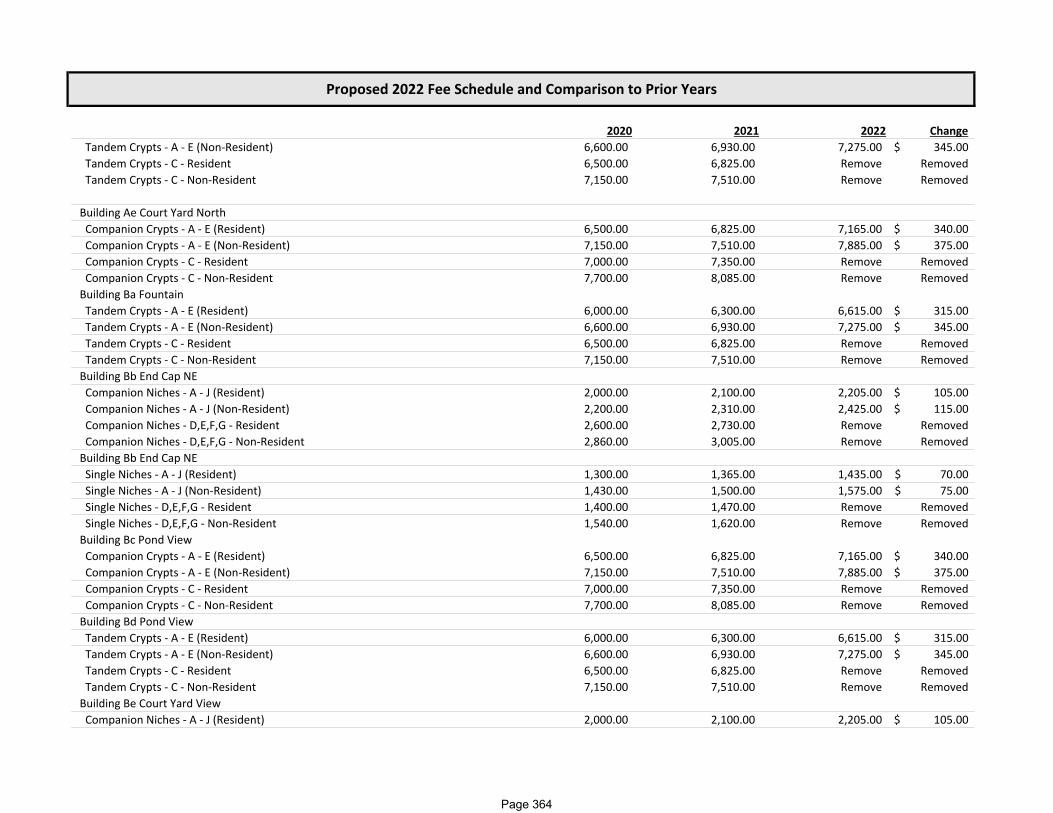
2020 2021 2022 Change
Proposed 2022 Fee Schedule and Comparison to Prior Years
Tandem Crypts ‐ A ‐ E (Non‐Resident) 6,600.00 6,930.00 7,275.00 345.00$ Tandem Crypts ‐ C ‐ Resident 6,500.00 6,825.00 Remove Removed Tandem Crypts ‐ C ‐ Non‐Resident 7,150.00 7,510.00 Remove Removed
Building Ae Court Yard North Companion Crypts ‐ A ‐ E (Resident) 6,500.00 6,825.00 7,165.00 340.00$ Companion Crypts ‐ A ‐ E (Non‐Resident) 7,150.00 7,510.00 7,885.00 375.00$ Companion Crypts ‐ C ‐ Resident 7,000.00 7,350.00 Remove Removed Companion Crypts ‐ C ‐ Non‐Resident 7,700.00 8,085.00 Remove RemovedBuilding Ba Fountain Tandem Crypts ‐ A ‐ E (Resident) 6,000.00 6,300.00 6,615.00 315.00$ Tandem Crypts ‐ A ‐ E (Non‐Resident) 6,600.00 6,930.00 7,275.00 345.00$ Tandem Crypts ‐ C ‐ Resident 6,500.00 6,825.00 Remove Removed Tandem Crypts ‐ C ‐ Non‐Resident 7,150.00 7,510.00 Remove RemovedBuilding Bb End Cap NE Companion Niches ‐ A ‐ J (Resident) 2,000.00 2,100.00 2,205.00 105.00$ Companion Niches ‐ A ‐ J (Non‐Resident) 2,200.00 2,310.00 2,425.00 115.00$ Companion Niches ‐ D,E,F,G ‐ Resident 2,600.00 2,730.00 Remove Removed Companion Niches ‐ D,E,F,G ‐ Non‐Resident 2,860.00 3,005.00 Remove RemovedBuilding Bb End Cap NE Single Niches ‐ A ‐ J (Resident) 1,300.00 1,365.00 1,435.00 70.00$ Single Niches ‐ A ‐ J (Non‐Resident) 1,430.00 1,500.00 1,575.00 75.00$ Single Niches ‐ D,E,F,G ‐ Resident 1,400.00 1,470.00 Remove Removed Single Niches ‐ D,E,F,G ‐ Non‐Resident 1,540.00 1,620.00 Remove RemovedBuilding Bc Pond View Companion Crypts ‐ A ‐ E (Resident) 6,500.00 6,825.00 7,165.00 340.00$ Companion Crypts ‐ A ‐ E (Non‐Resident) 7,150.00 7,510.00 7,885.00 375.00$ Companion Crypts ‐ C ‐ Resident 7,000.00 7,350.00 Remove Removed Companion Crypts ‐ C ‐ Non‐Resident 7,700.00 8,085.00 Remove RemovedBuilding Bd Pond View Tandem Crypts ‐ A ‐ E (Resident) 6,000.00 6,300.00 6,615.00 315.00$ Tandem Crypts ‐ A ‐ E (Non‐Resident) 6,600.00 6,930.00 7,275.00 345.00$ Tandem Crypts ‐ C ‐ Resident 6,500.00 6,825.00 Remove Removed Tandem Crypts ‐ C ‐ Non‐Resident 7,150.00 7,510.00 Remove RemovedBuilding Be Court Yard View Companion Niches ‐ A ‐ J (Resident) 2,000.00 2,100.00 2,205.00 105.00$
Page 364

2020 2021 2022 Change
Proposed 2022 Fee Schedule and Comparison to Prior Years
Companion Niches ‐ A ‐ J (Non‐Resident) 2,200.00 2,310.00 2,425.00 115.00$ Companion Niches ‐ D,E,F,G ‐ Resident 2,600.00 2,730.00 Remove Removed Companion Niches ‐ D,E,F,G ‐ Non‐Resident 2,860.00 3,005.00 Remove Removed
Building Be Court Yard View Companion Crypts ‐ A ‐ E (Resident) 6,500.00 6,825.00 7,165.00 340.00$ Companion Crypts ‐ A ‐ E (Non‐Resident) 7,150.00 7,510.00 7,885.00 375.00$ Companion Crypts ‐ C ‐ Resident 7,000.00 7,350.00 Remove Removed Companion Crypts ‐ C ‐ Non‐Resident 7,700.00 8,085.00 Remove RemovedBuilding Ca Court Yard South Single Crypts ‐ A ‐ E (Resident) 3,000.00 3,150.00 3,310.00 160.00$ Single Crypts ‐ A ‐ E (Non‐Resident) 3,300.00 3,465.00 3,640.00 175.00$ Single Crypts ‐ C ‐ Resident 3,500.00 3,675.00 Remove Removed Single Crypts ‐ C ‐ Non‐Resident 3,850.00 4,040.00 Remove RemovedBuilding Cb Court Yard South Companion Crypts ‐ A ‐ E (Resident) 6,500.00 6,825.00 7,165.00 340.00$ Companion Crypts ‐ A ‐ E (Non‐Resident) 7,150.00 7,510.00 7,885.00 375.00$ Companion Crypts ‐ C ‐ Resident 7,000.00 7,350.00 Remove Removed Companion Crypts ‐ C ‐ Non‐Resident 7,700.00 8,085.00 Remove Removed
Page 365
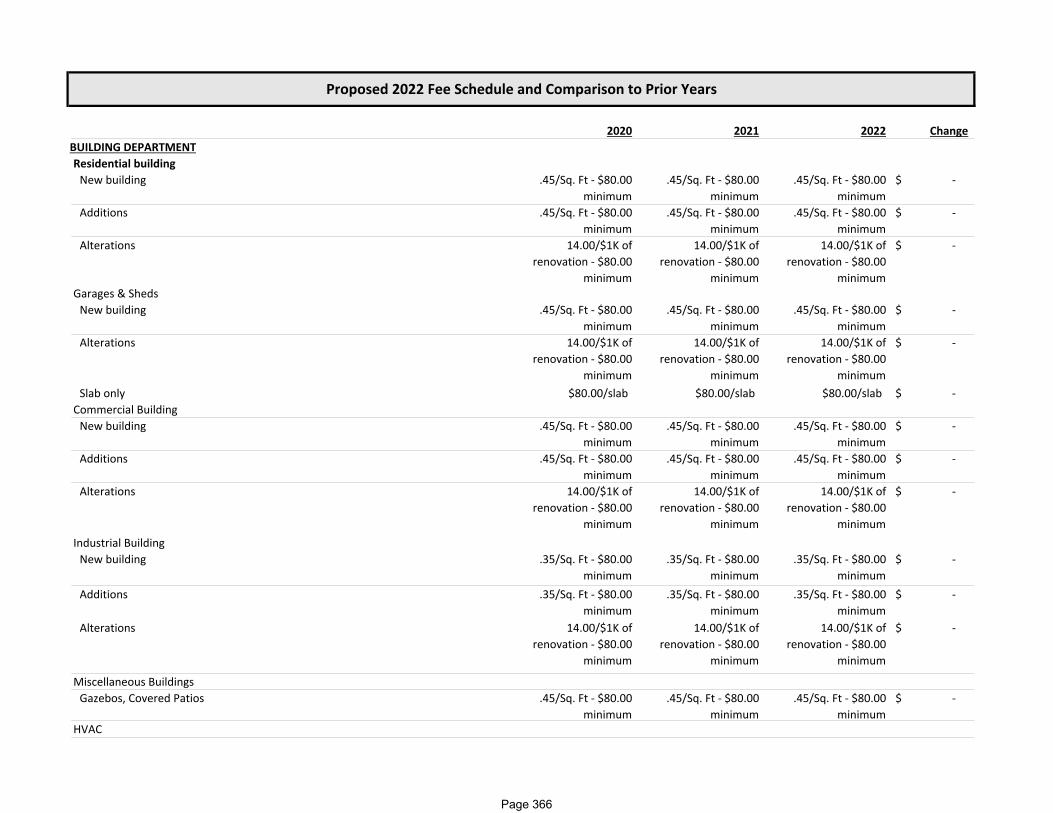
2020 2021 2022 Change
Proposed 2022 Fee Schedule and Comparison to Prior Years
BUILDING DEPARTMENTResidential buildingNew building .45/Sq. Ft ‐ $80.00
minimum .45/Sq. Ft ‐ $80.00
minimum .45/Sq. Ft ‐ $80.00
minimum ‐$
Additions .45/Sq. Ft ‐ $80.00 minimum
.45/Sq. Ft ‐ $80.00 minimum
.45/Sq. Ft ‐ $80.00 minimum
‐$
Alterations 14.00/$1K of renovation ‐ $80.00
minimum
14.00/$1K of renovation ‐ $80.00
minimum
14.00/$1K of renovation ‐ $80.00
minimum
‐$
Garages & ShedsNew building .45/Sq. Ft ‐ $80.00
minimum .45/Sq. Ft ‐ $80.00
minimum .45/Sq. Ft ‐ $80.00
minimum ‐$
Alterations 14.00/$1K of renovation ‐ $80.00
minimum
14.00/$1K of renovation ‐ $80.00
minimum
14.00/$1K of renovation ‐ $80.00
minimum
‐$
Slab only $80.00/slab $80.00/slab $80.00/slab ‐$ Commercial BuildingNew building .45/Sq. Ft ‐ $80.00
minimum .45/Sq. Ft ‐ $80.00
minimum .45/Sq. Ft ‐ $80.00
minimum ‐$
Additions .45/Sq. Ft ‐ $80.00 minimum
.45/Sq. Ft ‐ $80.00 minimum
.45/Sq. Ft ‐ $80.00 minimum
‐$
Alterations 14.00/$1K of renovation ‐ $80.00
minimum
14.00/$1K of renovation ‐ $80.00
minimum
14.00/$1K of renovation ‐ $80.00
minimum
‐$
Industrial BuildingNew building .35/Sq. Ft ‐ $80.00
minimum .35/Sq. Ft ‐ $80.00
minimum .35/Sq. Ft ‐ $80.00
minimum ‐$
Additions .35/Sq. Ft ‐ $80.00 minimum
.35/Sq. Ft ‐ $80.00 minimum
.35/Sq. Ft ‐ $80.00 minimum
‐$
Alterations 14.00/$1K of renovation ‐ $80.00
minimum
14.00/$1K of renovation ‐ $80.00
minimum
14.00/$1K of renovation ‐ $80.00
minimum
‐$
Miscellaneous BuildingsGazebos, Covered Patios .45/Sq. Ft ‐ $80.00
minimum .45/Sq. Ft ‐ $80.00
minimum .45/Sq. Ft ‐ $80.00
minimum ‐$
HVAC
Page 366
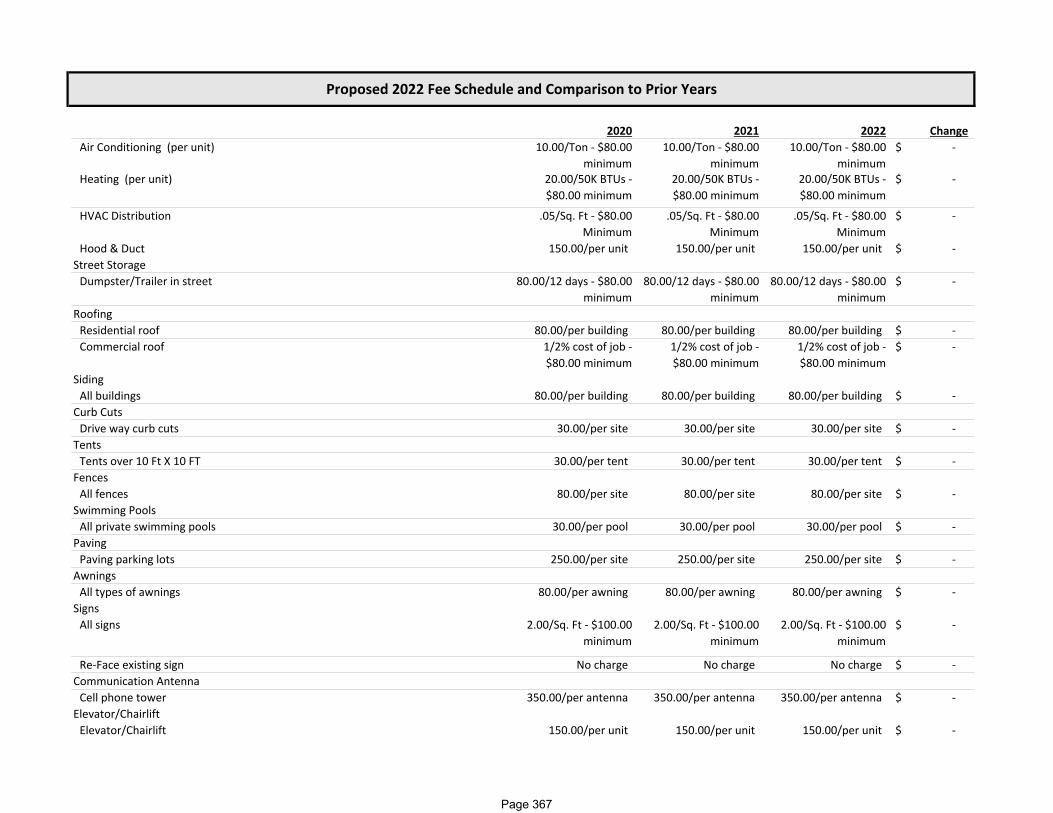
2020 2021 2022 Change
Proposed 2022 Fee Schedule and Comparison to Prior Years
Air Conditioning (per unit) 10.00/Ton ‐ $80.00 minimum
10.00/Ton ‐ $80.00 minimum
10.00/Ton ‐ $80.00 minimum
‐$
Heating (per unit) 20.00/50K BTUs ‐ $80.00 minimum
20.00/50K BTUs ‐ $80.00 minimum
20.00/50K BTUs ‐ $80.00 minimum
‐$
HVAC Distribution .05/Sq. Ft ‐ $80.00 Minimum
.05/Sq. Ft ‐ $80.00 Minimum
.05/Sq. Ft ‐ $80.00 Minimum
‐$
Hood & Duct 150.00/per unit 150.00/per unit 150.00/per unit ‐$ Street StorageDumpster/Trailer in street 80.00/12 days ‐ $80.00
minimum 80.00/12 days ‐ $80.00
minimum 80.00/12 days ‐ $80.00
minimum ‐$
RoofingResidential roof 80.00/per building 80.00/per building 80.00/per building ‐$ Commercial roof 1/2% cost of job ‐
$80.00 minimum 1/2% cost of job ‐ $80.00 minimum
1/2% cost of job ‐ $80.00 minimum
‐$
SidingAll buildings 80.00/per building 80.00/per building 80.00/per building ‐$
Curb CutsDrive way curb cuts 30.00/per site 30.00/per site 30.00/per site ‐$
TentsTents over 10 Ft X 10 FT 30.00/per tent 30.00/per tent 30.00/per tent ‐$
FencesAll fences 80.00/per site 80.00/per site 80.00/per site ‐$
Swimming PoolsAll private swimming pools 30.00/per pool 30.00/per pool 30.00/per pool ‐$
PavingPaving parking lots 250.00/per site 250.00/per site 250.00/per site ‐$
AwningsAll types of awnings 80.00/per awning 80.00/per awning 80.00/per awning ‐$
SignsAll signs 2.00/Sq. Ft ‐ $100.00
minimum 2.00/Sq. Ft ‐ $100.00
minimum 2.00/Sq. Ft ‐ $100.00
minimum ‐$
Re‐Face existing sign No charge No charge No charge ‐$ Communication AntennaCell phone tower 350.00/per antenna 350.00/per antenna 350.00/per antenna ‐$
Elevator/ChairliftElevator/Chairlift 150.00/per unit 150.00/per unit 150.00/per unit ‐$
Page 367

2020 2021 2022 Change
Proposed 2022 Fee Schedule and Comparison to Prior Years
Wrecking PermitOne & two family residential 200.00/per building 200.00/per building 200.00/per building ‐$ Garages (Detached) 50.00/per building 50.00/per building 50.00/per building ‐$ All other buildings .20/per Sq. Ft ‐ $80.00
minimum .20/per Sq. Ft ‐ $80.00
minimum .20/per Sq. Ft ‐ $80.00
minimum ‐$
Moving BuildingsPrimary Building 300.00/per building 300.00/per building 300.00/per building ‐$ Accessory Buildings 125.00/per building 125.00/per building 125.00/per building ‐$
Early Start PermitBegin work before plan review is done 300.00/per building 300.00/per building 300.00/per building ‐$
Start work without permitAll construction 2X permit cost 2X permit cost 2X permit cost ‐$
Plan ReviewAll buildings .17/per Sq. Ft ‐ $80.00
minimum .17/per Sq. Ft ‐ $80.00
minimum .17/per Sq. Ft ‐ $80.00
minimum ‐$
Revisions (To previous plans) 100.00/project 100.00/project 100.00/project ‐$ HVAC, Lighting, Structural, Energy Plans .05/Sq. Ft ‐ $80.00
minimum .05/Sq. Ft ‐ $80.00
minimum .05/Sq. Ft ‐ $80.00
minimum ‐$
Wisconsin State Seal for dwellingsState seal that goes on dwelling permits 35.00/per seal 35.00/per seal 35.00/per seal ‐$
Erosion control permit1 & 2 family residential structure 175.00/per building 175.00/per building 175.00/per building ‐$ Multi family, Commercial, Industrial 300.00/per site 300.00/per site 300.00/per site ‐$
5.00/1000 Sq. Ft 5.00/1000 Sq. Ft 5.00/1000 Sq. Ft ‐$ disturbed lot area disturbed lot area disturbed lot area ‐$
Page 368
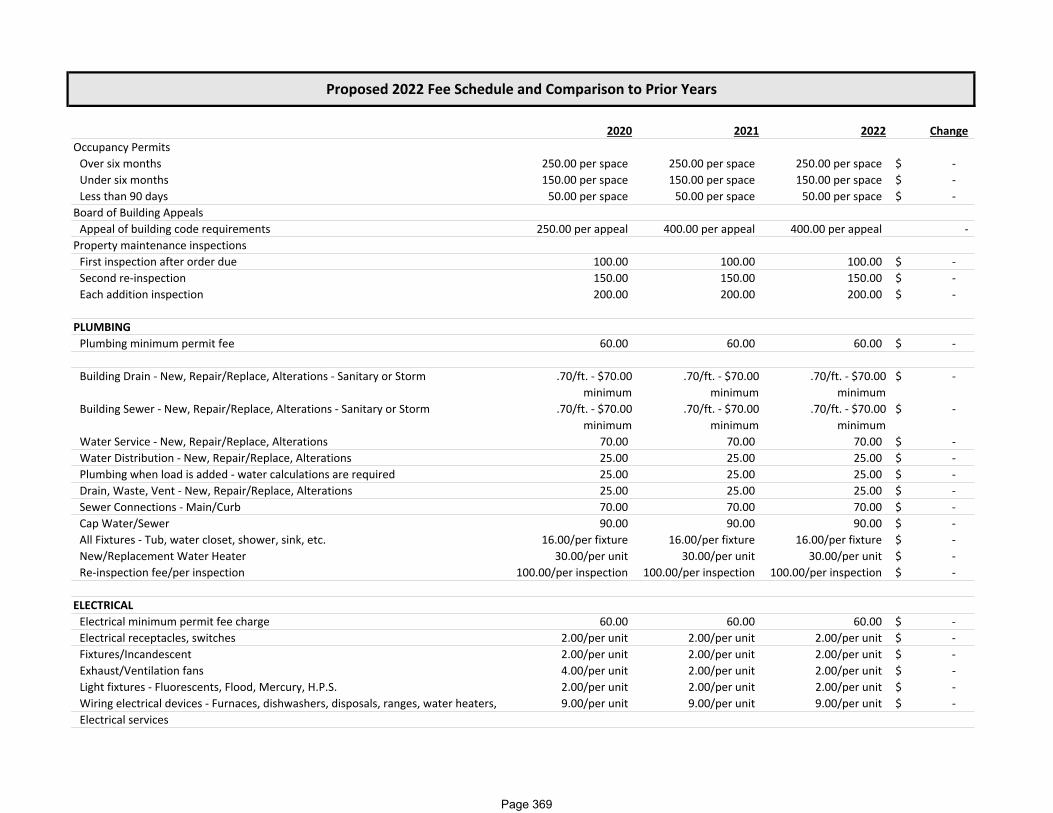
2020 2021 2022 Change
Proposed 2022 Fee Schedule and Comparison to Prior Years
Occupancy PermitsOver six months 250.00 per space 250.00 per space 250.00 per space ‐$ Under six months 150.00 per space 150.00 per space 150.00 per space ‐$ Less than 90 days 50.00 per space 50.00 per space 50.00 per space ‐$
Board of Building AppealsAppeal of building code requirements 250.00 per appeal 400.00 per appeal 400.00 per appeal ‐
Property maintenance inspectionsFirst inspection after order due 100.00 100.00 100.00 ‐$ Second re‐inspection 150.00 150.00 150.00 ‐$ Each addition inspection 200.00 200.00 200.00 ‐$
PLUMBING Plumbing minimum permit fee 60.00 60.00 60.00 ‐$
.70/ft. ‐ $70.00 minimum
.70/ft. ‐ $70.00 minimum
.70/ft. ‐ $70.00 minimum
‐$
.70/ft. ‐ $70.00 minimum
.70/ft. ‐ $70.00 minimum
.70/ft. ‐ $70.00 minimum
‐$
Water Service ‐ New, Repair/Replace, Alterations 70.00 70.00 70.00 ‐$ Water Distribution ‐ New, Repair/Replace, Alterations 25.00 25.00 25.00 ‐$ Plumbing when load is added ‐ water calculations are required 25.00 25.00 25.00 ‐$ Drain, Waste, Vent ‐ New, Repair/Replace, Alterations 25.00 25.00 25.00 ‐$ Sewer Connections ‐ Main/Curb 70.00 70.00 70.00 ‐$ Cap Water/Sewer 90.00 90.00 90.00 ‐$ All Fixtures ‐ Tub, water closet, shower, sink, etc. 16.00/per fixture 16.00/per fixture 16.00/per fixture ‐$ New/Replacement Water Heater 30.00/per unit 30.00/per unit 30.00/per unit ‐$ Re‐inspection fee/per inspection 100.00/per inspection 100.00/per inspection 100.00/per inspection ‐$
ELECTRICALElectrical minimum permit fee charge 60.00 60.00 60.00 ‐$ Electrical receptacles, switches 2.00/per unit 2.00/per unit 2.00/per unit ‐$ Fixtures/Incandescent 2.00/per unit 2.00/per unit 2.00/per unit ‐$ Exhaust/Ventilation fans 4.00/per unit 2.00/per unit 2.00/per unit ‐$ Light fixtures ‐ Fluorescents, Flood, Mercury, H.P.S. 2.00/per unit 2.00/per unit 2.00/per unit ‐$
9.00/per unit 9.00/per unit 9.00/per unit ‐$ Electrical services
Building Drain ‐ New, Repair/Replace, Alterations ‐ Sanitary or Storm
Building Sewer ‐ New, Repair/Replace, Alterations ‐ Sanitary or Storm
Wiring electrical devices ‐ Furnaces, dishwashers, disposals, ranges, water heaters,
Page 369

2020 2021 2022 Change
Proposed 2022 Fee Schedule and Comparison to Prior Years
0 through 100 amperes 50.00/each 50.00/each 50.00/each ‐$ 101 through 400 amperes 80.00/each 80.00/each 80.00/each ‐$ 401 through 1,200 amperes 150.00/each 150.00/each 150.00/each ‐$ 1,201 and up 250.00/each 250.00/each 250.00/each ‐$
Electrical servicesPrimary 250.00/each 250.00/each 250.00/each ‐$ Temporary 50.00/each 50.00/each 50.00/each ‐$
Wiring electrical appliances ‐ Air conditioners, coolers 10.00/each 10.00/each 10.00/each ‐$ Wiring electrical appliances ‐ Motors 1.00/per hp 1.00/per hp 1.00/per hp ‐$
20.00/each 20.00/each 20.00/each ‐$ Wiring electric heaters ‐ Space, baseboard, etc. 5.00/each 5.00/each 5.00/each ‐$ Wiring electric appliances ‐ Electric furnaces, ovens .50/kW .50/kW .50/kW ‐$ Wiring electric signs ‐ Neon, Unit signs 8.00/each 8.00/each 8.00/each ‐$ Wiring electric signs ‐ Plug‐in strips, light trac systems .70/Ft .70/Ft .70/Ft ‐$ Electric feeders or sub feedersNo. 6 to 3/0 10.00/each 10.00/each 10.00/each ‐$ 4/0 and above 18.00/each 18.00/each 18.00/each ‐$
Electric wiring ‐ Fuel dispensing pumps 18.00/each 18.00/each 18.00/each ‐$ Electric wiring ‐ Busways, wireways 2.00/Ft 2.00/Ft 2.00/Ft ‐$ Electric wiring ‐ Swimming Pool wiring 50.00/each 50.00/each 50.00/each ‐$ Electric wiring ‐ Solar/Wind systems 5.00/KW 5.00/KW 5.00/KW ‐$ Electric wiring ‐ Smoke Detectors, fire alarm systems 4.50/each 4.50/each 4.50/each ‐$
40.00/each 40.00/each 40.00/each ‐$ Re‐inspection feeNo access 100.00 100.00 100.00 ‐$ Non‐compliance 100.00 100.00 100.00 ‐$ Failure to call for final inspection 100.00 100.00 100.00 ‐$
Initial permit fee in addition to other charges 35.00 35.00 35.00 ‐$
Wiring electrical equipment ‐ Capacitors, transformers, welders , generators
Electric wiring ‐ To change, alter, repair, or correct electrical where none of the
Page 370

2020 2021 2022 Change
Proposed 2022 Fee Schedule and Comparison to Prior Years
CITY DEVELOPMENTEconomic DevelopmentTax Increment Application Fee for $1M or more 1% of TIF Assistance
Request 1% of TIF Assistance
Request 1% of TIF Assistance
Request ‐$
PlanningPreliminary Subdivision Plats 300.00 + 15.00 per
parcel 300.00 + 15.00 per
parcel 300.00 + 15.00 per
parcel ‐$
Final Subdivision Plats 200.00 + 15.00 per parcel
200.00 + 15.00 per parcel
200.00 + 15.00 per parcel
‐$
Certified Survey Map 170.00 + 50.00 per parcel
170.00 + 50.00 per parcel
170.00 + 50.00 per parcel
‐$
Conditional Use (new conditional use) permit 795.00 795.00 795.00 ‐$ 150.00 150.00 150.00 ‐$
1,445.00 1,445.00 1,445.00 ‐$ Rezoning Application 830.00 830.00 830.00 ‐$ Comp Plan Amendment (Proposed) 945.00 945.00 945.00 ‐$ Administrative Review (Proposed) 150.00 150.00 150.00 ‐$ Access Corridor Review (Proposed) 150.00 150.00 150.00 ‐$ Zoning Compliance Letter (Proposed) 250.00 250.00 250.00 ‐$ Variance Application 400.00 400.00 400.00 ‐$
$20 ONE TIME fee , no annual fee for renewals
$20 ONE TIME fee , no annual fee for renewals
$20 ONE TIME fee , no annual fee for renewals
‐$
Neighborhood ServicesLoan Fees:CDBG Owner‐Occupied rental rehab loan $300 ($75 non‐
refundable) $300 ($75 non‐
refundable) $300 ($75 non‐
refundable) ‐$
Non‐Federal Owner‐Occupied Loan $300 ($75 non‐refundable)
$300 ($75 non‐refundable)
$300 ($75 non‐refundable)
‐$
Non‐Federal Loan for Over‐Income Owners $300 ($75 non‐refundable)
$300 ($75 non‐refundable)
$300 ($75 non‐refundable)
‐$
Racine Energy Efficiency Program (REEP) loan $300 ($75 non‐refundable)
$300 ($75 non‐refundable)
$300 ($75 non‐refundable)
‐$
CDBG Rental Rehab Loan 500.00 500.00 500.00 ‐$ CDBG Multifamily Revolving Loan Fund 500.00 500.00 500.00 ‐$
Conditional Use Permit (Proposed ‐ as remedy for non‐compliance after‐the‐fact)
Temporary ROW Encroachments (flags, benches, flower pots in front of businesses).
Conditional Use permit (Proposed) same use, transfer to new owner)
Page 371
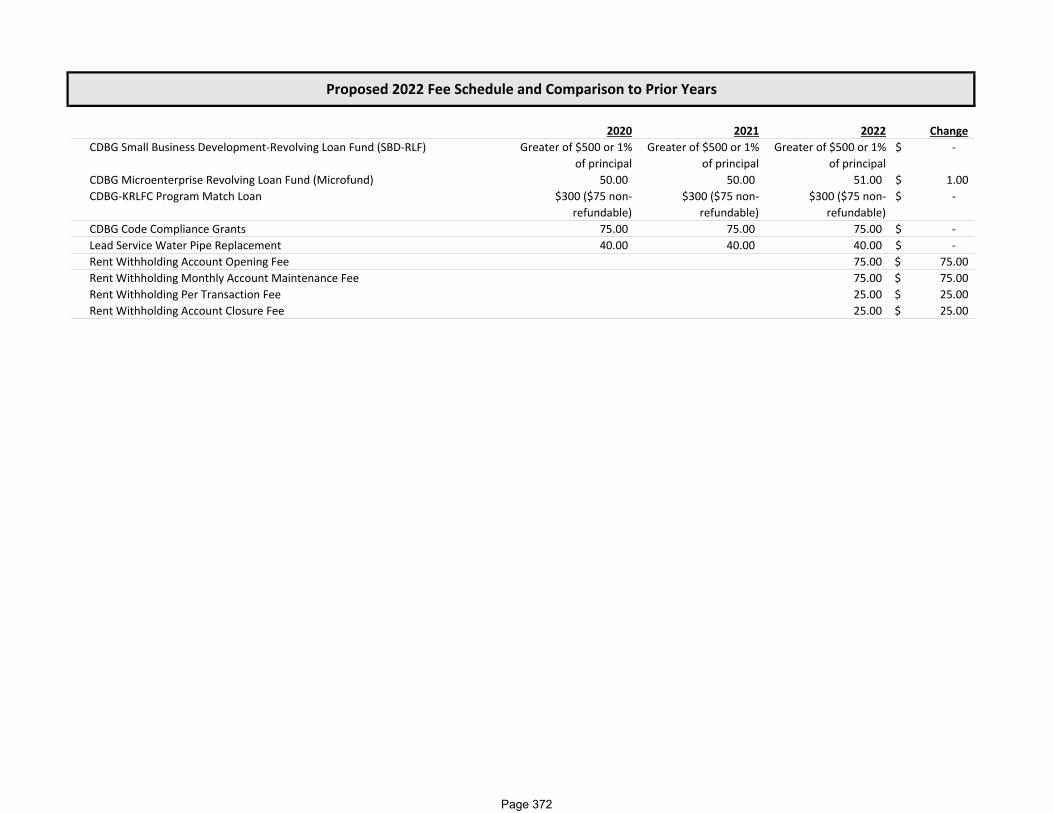
2020 2021 2022 Change
Proposed 2022 Fee Schedule and Comparison to Prior Years
CDBG Small Business Development‐Revolving Loan Fund (SBD‐RLF) Greater of $500 or 1% of principal
Greater of $500 or 1% of principal
Greater of $500 or 1% of principal
‐$
CDBG Microenterprise Revolving Loan Fund (Microfund) 50.00 50.00 51.00 1.00$ CDBG‐KRLFC Program Match Loan $300 ($75 non‐
refundable) $300 ($75 non‐
refundable) $300 ($75 non‐
refundable) ‐$
CDBG Code Compliance Grants 75.00 75.00 75.00 ‐$ Lead Service Water Pipe Replacement 40.00 40.00 40.00 ‐$ Rent Withholding Account Opening Fee 75.00 75.00$ Rent Withholding Monthly Account Maintenance Fee 75.00 75.00$ Rent Withholding Per Transaction Fee 25.00 25.00$ Rent Withholding Account Closure Fee 25.00 25.00$
Page 372
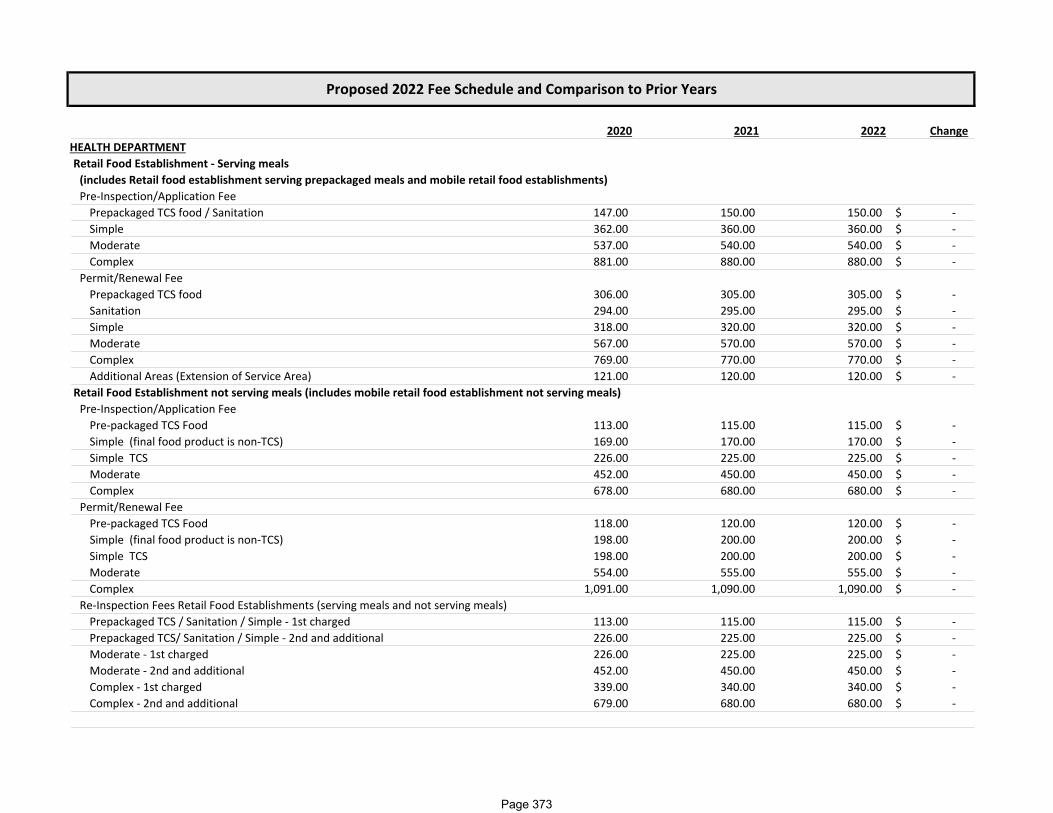
2020 2021 2022 Change
Proposed 2022 Fee Schedule and Comparison to Prior Years
HEALTH DEPARTMENTRetail Food Establishment ‐ Serving meals (includes Retail food establishment serving prepackaged meals and mobile retail food establishments)Pre‐Inspection/Application FeePrepackaged TCS food / Sanitation 147.00 150.00 150.00 ‐$ Simple 362.00 360.00 360.00 ‐$ Moderate 537.00 540.00 540.00 ‐$ Complex 881.00 880.00 880.00 ‐$
Permit/Renewal FeePrepackaged TCS food 306.00 305.00 305.00 ‐$ Sanitation 294.00 295.00 295.00 ‐$ Simple 318.00 320.00 320.00 ‐$ Moderate 567.00 570.00 570.00 ‐$ Complex 769.00 770.00 770.00 ‐$ Additional Areas (Extension of Service Area) 121.00 120.00 120.00 ‐$
Retail Food Establishment not serving meals (includes mobile retail food establishment not serving meals)Pre‐Inspection/Application FeePre‐packaged TCS Food 113.00 115.00 115.00 ‐$ Simple (final food product is non‐TCS) 169.00 170.00 170.00 ‐$ Simple TCS 226.00 225.00 225.00 ‐$ Moderate 452.00 450.00 450.00 ‐$ Complex 678.00 680.00 680.00 ‐$
Permit/Renewal FeePre‐packaged TCS Food 118.00 120.00 120.00 ‐$ Simple (final food product is non‐TCS) 198.00 200.00 200.00 ‐$ Simple TCS 198.00 200.00 200.00 ‐$ Moderate 554.00 555.00 555.00 ‐$ Complex 1,091.00 1,090.00 1,090.00 ‐$
Re‐Inspection Fees Retail Food Establishments (serving meals and not serving meals)Prepackaged TCS / Sanitation / Simple ‐ 1st charged 113.00 115.00 115.00 ‐$ Prepackaged TCS/ Sanitation / Simple ‐ 2nd and additional 226.00 225.00 225.00 ‐$ Moderate ‐ 1st charged 226.00 225.00 225.00 ‐$ Moderate ‐ 2nd and additional 452.00 450.00 450.00 ‐$ Complex ‐ 1st charged 339.00 340.00 340.00 ‐$ Complex ‐ 2nd and additional 679.00 680.00 680.00 ‐$
Page 373
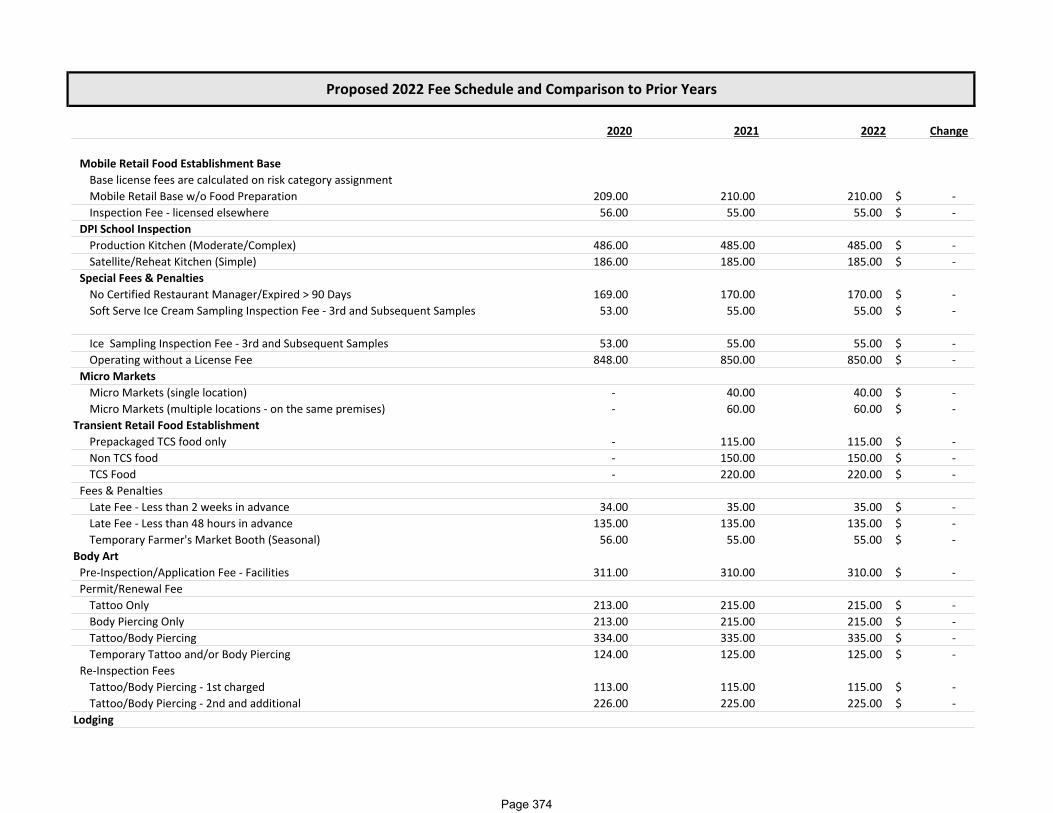
2020 2021 2022 Change
Proposed 2022 Fee Schedule and Comparison to Prior Years
Mobile Retail Food Establishment Base Base license fees are calculated on risk category assignment Mobile Retail Base w/o Food Preparation 209.00 210.00 210.00 ‐$ Inspection Fee ‐ licensed elsewhere 56.00 55.00 55.00 ‐$
DPI School Inspection Production Kitchen (Moderate/Complex) 486.00 485.00 485.00 ‐$ Satellite/Reheat Kitchen (Simple) 186.00 185.00 185.00 ‐$
Special Fees & PenaltiesNo Certified Restaurant Manager/Expired > 90 Days 169.00 170.00 170.00 ‐$ Soft Serve Ice Cream Sampling Inspection Fee ‐ 3rd and Subsequent Samples 53.00 55.00 55.00 ‐$
Ice Sampling Inspection Fee ‐ 3rd and Subsequent Samples 53.00 55.00 55.00 ‐$ Operating without a License Fee 848.00 850.00 850.00 ‐$
Micro Markets Micro Markets (single location) ‐ 40.00 40.00 ‐$ Micro Markets (multiple locations ‐ on the same premises) ‐ 60.00 60.00 ‐$
Transient Retail Food EstablishmentPrepackaged TCS food only ‐ 115.00 115.00 ‐$ Non TCS food ‐ 150.00 150.00 ‐$ TCS Food ‐ 220.00 220.00 ‐$
Fees & PenaltiesLate Fee ‐ Less than 2 weeks in advance 34.00 35.00 35.00 ‐$ Late Fee ‐ Less than 48 hours in advance 135.00 135.00 135.00 ‐$ Temporary Farmer's Market Booth (Seasonal) 56.00 55.00 55.00 ‐$
Body ArtPre‐Inspection/Application Fee ‐ Facilities 311.00 310.00 310.00 ‐$ Permit/Renewal FeeTattoo Only 213.00 215.00 215.00 ‐$ Body Piercing Only 213.00 215.00 215.00 ‐$ Tattoo/Body Piercing 334.00 335.00 335.00 ‐$ Temporary Tattoo and/or Body Piercing 124.00 125.00 125.00 ‐$
Re‐Inspection FeesTattoo/Body Piercing ‐ 1st charged 113.00 115.00 115.00 ‐$ Tattoo/Body Piercing ‐ 2nd and additional 226.00 225.00 225.00 ‐$
Lodging
Page 374
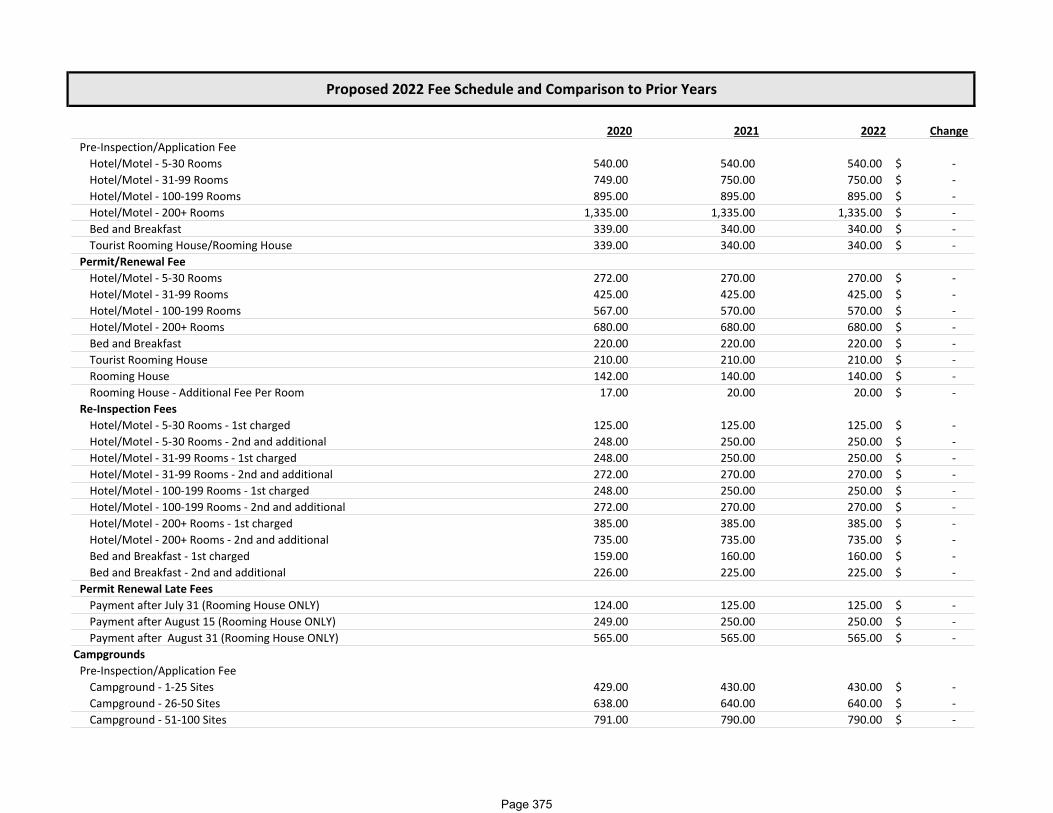
2020 2021 2022 Change
Proposed 2022 Fee Schedule and Comparison to Prior Years
Pre‐Inspection/Application FeeHotel/Motel ‐ 5‐30 Rooms 540.00 540.00 540.00 ‐$ Hotel/Motel ‐ 31‐99 Rooms 749.00 750.00 750.00 ‐$ Hotel/Motel ‐ 100‐199 Rooms 895.00 895.00 895.00 ‐$ Hotel/Motel ‐ 200+ Rooms 1,335.00 1,335.00 1,335.00 ‐$ Bed and Breakfast 339.00 340.00 340.00 ‐$ Tourist Rooming House/Rooming House 339.00 340.00 340.00 ‐$
Permit/Renewal FeeHotel/Motel ‐ 5‐30 Rooms 272.00 270.00 270.00 ‐$ Hotel/Motel ‐ 31‐99 Rooms 425.00 425.00 425.00 ‐$ Hotel/Motel ‐ 100‐199 Rooms 567.00 570.00 570.00 ‐$ Hotel/Motel ‐ 200+ Rooms 680.00 680.00 680.00 ‐$ Bed and Breakfast 220.00 220.00 220.00 ‐$ Tourist Rooming House 210.00 210.00 210.00 ‐$ Rooming House 142.00 140.00 140.00 ‐$ Rooming House ‐ Additional Fee Per Room 17.00 20.00 20.00 ‐$
Re‐Inspection FeesHotel/Motel ‐ 5‐30 Rooms ‐ 1st charged 125.00 125.00 125.00 ‐$ Hotel/Motel ‐ 5‐30 Rooms ‐ 2nd and additional 248.00 250.00 250.00 ‐$ Hotel/Motel ‐ 31‐99 Rooms ‐ 1st charged 248.00 250.00 250.00 ‐$ Hotel/Motel ‐ 31‐99 Rooms ‐ 2nd and additional 272.00 270.00 270.00 ‐$ Hotel/Motel ‐ 100‐199 Rooms ‐ 1st charged 248.00 250.00 250.00 ‐$ Hotel/Motel ‐ 100‐199 Rooms ‐ 2nd and additional 272.00 270.00 270.00 ‐$ Hotel/Motel ‐ 200+ Rooms ‐ 1st charged 385.00 385.00 385.00 ‐$ Hotel/Motel ‐ 200+ Rooms ‐ 2nd and additional 735.00 735.00 735.00 ‐$ Bed and Breakfast ‐ 1st charged 159.00 160.00 160.00 ‐$ Bed and Breakfast ‐ 2nd and additional 226.00 225.00 225.00 ‐$
Permit Renewal Late FeesPayment after July 31 (Rooming House ONLY) 124.00 125.00 125.00 ‐$ Payment after August 15 (Rooming House ONLY) 249.00 250.00 250.00 ‐$ Payment after August 31 (Rooming House ONLY) 565.00 565.00 565.00 ‐$
CampgroundsPre‐Inspection/Application FeeCampground ‐ 1‐25 Sites 429.00 430.00 430.00 ‐$ Campground ‐ 26‐50 Sites 638.00 640.00 640.00 ‐$ Campground ‐ 51‐100 Sites 791.00 790.00 790.00 ‐$
Page 375
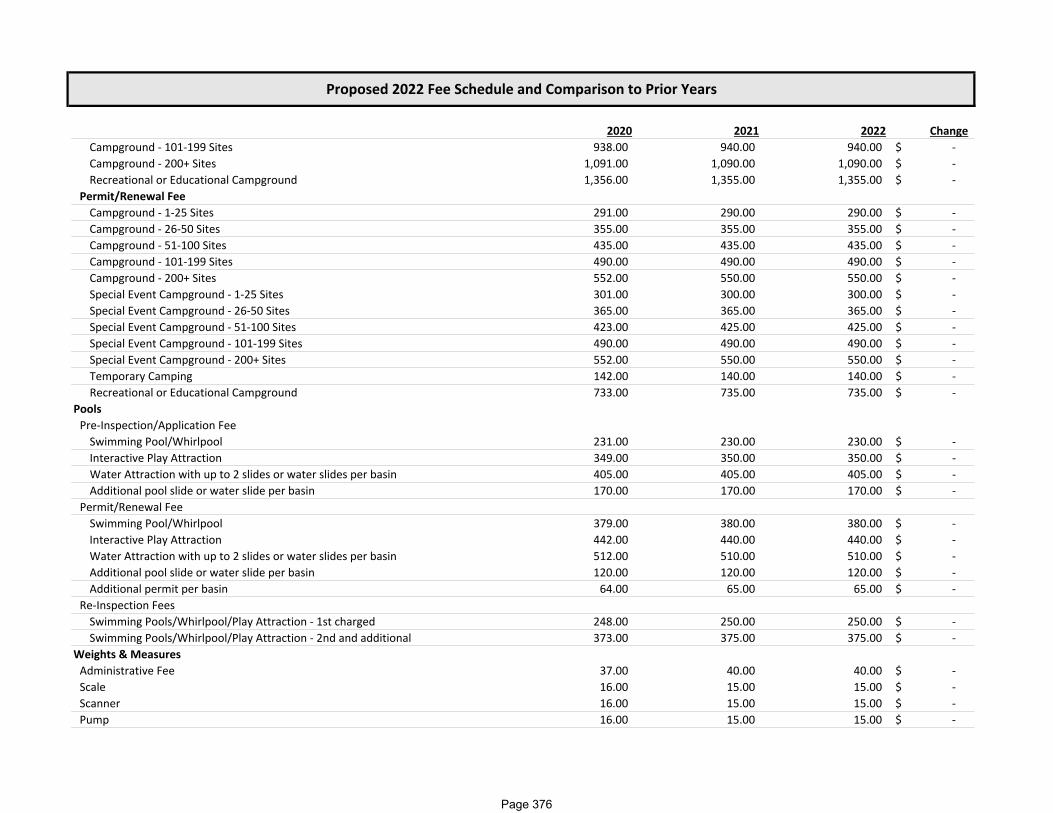
2020 2021 2022 Change
Proposed 2022 Fee Schedule and Comparison to Prior Years
Campground ‐ 101‐199 Sites 938.00 940.00 940.00 ‐$ Campground ‐ 200+ Sites 1,091.00 1,090.00 1,090.00 ‐$ Recreational or Educational Campground 1,356.00 1,355.00 1,355.00 ‐$
Permit/Renewal FeeCampground ‐ 1‐25 Sites 291.00 290.00 290.00 ‐$ Campground ‐ 26‐50 Sites 355.00 355.00 355.00 ‐$ Campground ‐ 51‐100 Sites 435.00 435.00 435.00 ‐$ Campground ‐ 101‐199 Sites 490.00 490.00 490.00 ‐$ Campground ‐ 200+ Sites 552.00 550.00 550.00 ‐$ Special Event Campground ‐ 1‐25 Sites 301.00 300.00 300.00 ‐$ Special Event Campground ‐ 26‐50 Sites 365.00 365.00 365.00 ‐$ Special Event Campground ‐ 51‐100 Sites 423.00 425.00 425.00 ‐$ Special Event Campground ‐ 101‐199 Sites 490.00 490.00 490.00 ‐$ Special Event Campground ‐ 200+ Sites 552.00 550.00 550.00 ‐$ Temporary Camping 142.00 140.00 140.00 ‐$ Recreational or Educational Campground 733.00 735.00 735.00 ‐$
PoolsPre‐Inspection/Application FeeSwimming Pool/Whirlpool 231.00 230.00 230.00 ‐$ Interactive Play Attraction 349.00 350.00 350.00 ‐$ Water Attraction with up to 2 slides or water slides per basin 405.00 405.00 405.00 ‐$ Additional pool slide or water slide per basin 170.00 170.00 170.00 ‐$
Permit/Renewal FeeSwimming Pool/Whirlpool 379.00 380.00 380.00 ‐$ Interactive Play Attraction 442.00 440.00 440.00 ‐$ Water Attraction with up to 2 slides or water slides per basin 512.00 510.00 510.00 ‐$ Additional pool slide or water slide per basin 120.00 120.00 120.00 ‐$ Additional permit per basin 64.00 65.00 65.00 ‐$
Re‐Inspection FeesSwimming Pools/Whirlpool/Play Attraction ‐ 1st charged 248.00 250.00 250.00 ‐$ Swimming Pools/Whirlpool/Play Attraction ‐ 2nd and additional 373.00 375.00 375.00 ‐$
Weights & MeasuresAdministrative Fee 37.00 40.00 40.00 ‐$ Scale 16.00 15.00 15.00 ‐$ Scanner 16.00 15.00 15.00 ‐$ Pump 16.00 15.00 15.00 ‐$
Page 376
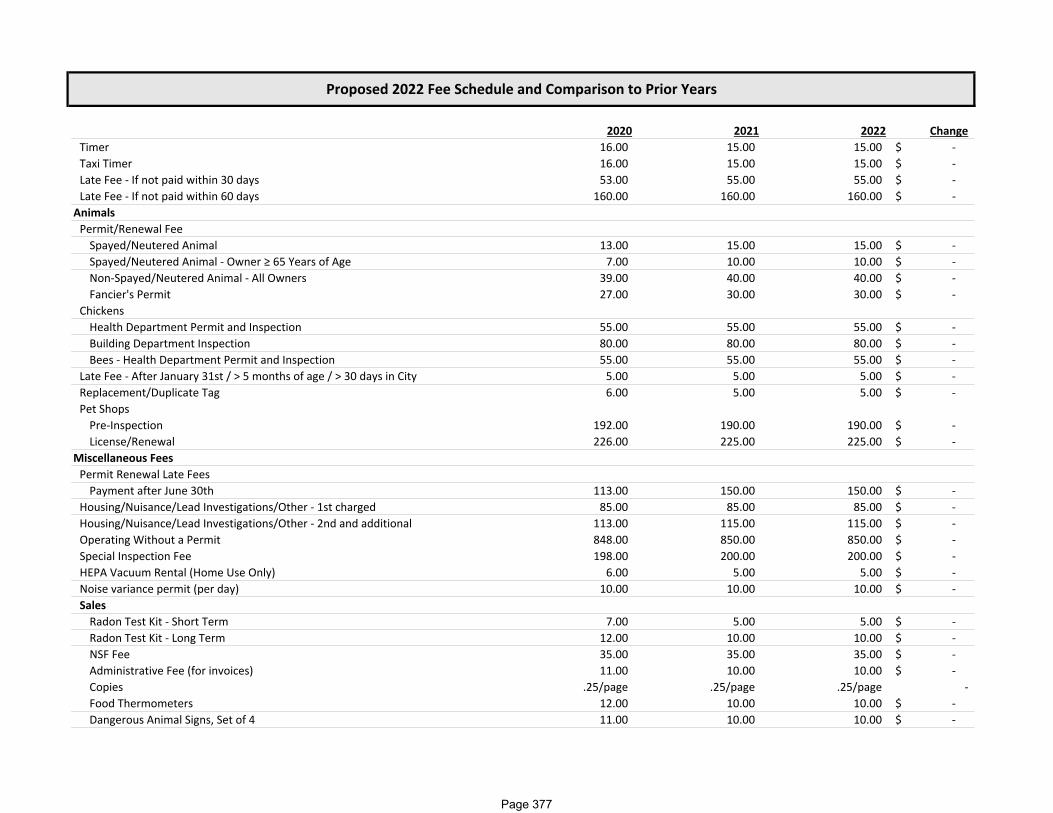
2020 2021 2022 Change
Proposed 2022 Fee Schedule and Comparison to Prior Years
Timer 16.00 15.00 15.00 ‐$ Taxi Timer 16.00 15.00 15.00 ‐$ Late Fee ‐ If not paid within 30 days 53.00 55.00 55.00 ‐$ Late Fee ‐ If not paid within 60 days 160.00 160.00 160.00 ‐$
AnimalsPermit/Renewal FeeSpayed/Neutered Animal 13.00 15.00 15.00 ‐$ Spayed/Neutered Animal ‐ Owner ≥ 65 Years of Age 7.00 10.00 10.00 ‐$ Non‐Spayed/Neutered Animal ‐ All Owners 39.00 40.00 40.00 ‐$ Fancier's Permit 27.00 30.00 30.00 ‐$
ChickensHealth Department Permit and Inspection 55.00 55.00 55.00 ‐$ Building Department Inspection 80.00 80.00 80.00 ‐$ Bees ‐ Health Department Permit and Inspection 55.00 55.00 55.00 ‐$
Late Fee ‐ After January 31st / > 5 months of age / > 30 days in City 5.00 5.00 5.00 ‐$ Replacement/Duplicate Tag 6.00 5.00 5.00 ‐$ Pet ShopsPre‐Inspection 192.00 190.00 190.00 ‐$ License/Renewal 226.00 225.00 225.00 ‐$
Miscellaneous FeesPermit Renewal Late FeesPayment after June 30th 113.00 150.00 150.00 ‐$
Housing/Nuisance/Lead Investigations/Other ‐ 1st charged 85.00 85.00 85.00 ‐$ Housing/Nuisance/Lead Investigations/Other ‐ 2nd and additional 113.00 115.00 115.00 ‐$ Operating Without a Permit 848.00 850.00 850.00 ‐$ Special Inspection Fee 198.00 200.00 200.00 ‐$ HEPA Vacuum Rental (Home Use Only) 6.00 5.00 5.00 ‐$ Noise variance permit (per day) 10.00 10.00 10.00 ‐$ SalesRadon Test Kit ‐ Short Term 7.00 5.00 5.00 ‐$ Radon Test Kit ‐ Long Term 12.00 10.00 10.00 ‐$ NSF Fee 35.00 35.00 35.00 ‐$ Administrative Fee (for invoices) 11.00 10.00 10.00 ‐$ Copies .25/page .25/page .25/page ‐Food Thermometers 12.00 10.00 10.00 ‐$ Dangerous Animal Signs, Set of 4 11.00 10.00 10.00 ‐$
Page 377

2020 2021 2022 Change
Proposed 2022 Fee Schedule and Comparison to Prior Years
Neon Yellow Collar for Dangerous Animal Requirement 16.00 15.00 15.00 ‐$ Duplicate Permit 17.00 20.00 20.00 ‐$
Community HealthChildhood Immunizations ‐ Per Individual 20.00 20.00 20.00 ‐$ Adult Immunizations Call for pricing and
availability. Call for pricing and
availability. Call for pricing and
availability. TB Skin Tests 15.00 15.00 15.00 ‐$ STD Clinic 20.00 20.00 20.00 ‐$
LaboratoryWater Microbiology Testing ‐ QuantificationHeterotropic Plate Count 30.00 30.00 30.00 ‐$
Water Microbiology Testing ‐ Presence / AbsenceTotal Coliform and E.coli (Presence / Absence) 29.00 30.00 30.00 ‐$ Enterococci (Presence / Absence) 31.00 30.00 30.00 ‐$
Water Microbiology Testing ‐ Detection / QuantificationTotal Coliform & E.coli (Enumeration) in Drinking Water 37.00 35.00 35.00 ‐$ E. coli (Quantification) in Surface Water 37.00 35.00 35.00 ‐$ Total or Fecal Coliforms (Quantification) 37.00 35.00 35.00 ‐$ Enterococci (Quantification) 39.00 40.00 40.00 ‐$ Culture & ID – Pathogens (e.g. E.coli O157:H7) call call call
Inorganic / Organic Testing ‐ QuantificationpHSpecific Conductivity 10.00 10.00 10.00 ‐$ Turbidity 10.00 10.00 10.00 ‐$ Total Suspended Solids 15.00 15.00 15.00 ‐$ Total Residual Chlorine 24.00 25.00 25.00 ‐$ Detergents 10.00 10.00 10.00 ‐$ Copper 13.00 15.00 15.00 ‐$ Nickel 13.00 15.00 15.00 ‐$ Phenols 13.00 15.00 15.00 ‐$
Page 378

2020 2021 2022 Change
Proposed 2022 Fee Schedule and Comparison to Prior Years
FIRE DEPARTMENT Automatic Dialers 150.00 150.00 150.00 ‐$ Audible Alarms 150.00 150.00 150.00 ‐$ Intentional False Alarms 300.00 300.00 300.00 ‐$ BLS On Scene Care or Invalid Assistance 300.00 300.00 300.00 ‐$ BLS On Scene Care or Invalid Assistance (Non‐Resident) 337.50 337.50 337.50 ‐$ BLS Response and Transport 825.00 825.00 825.00 ‐$ BLS Response and Transport (Non‐Resident) 1,012.50 1,012.50 1,012.50 ‐$ ALS Response and Transport 1,012.50 1,012.50 1,012.50 ‐$ ALS Response and Transport (Non‐Resident) 1,200.00 1,200.00 1,200.00 ‐$ ALS Response and No Transport 1,162.50 1,162.50 1,162.50 ‐$ ALS Response and No Transport (Non Resident) 1,350.00 1,350.00 1,350.00 ‐$ ALS Tier 2 Response and Transport 1,162.50 1,162.50 1,162.50 ‐$ ALS Tier 2 Response and Transport (Non‐Resident) 1,350.00 1,350.00 1,350.00 ‐$ Loaded Mileage Rate from scene to hospital (Per Mile) 15.00 15.00 15.00 ‐$ Loaded Mileage Rate from scene to hospital 13.75 13.75 13.75 ‐$ Loaded Mileage Rate from scene to hospital (Non Resident) 14.75 14.75 14.75 ‐$ Billable Supplies ‐ Comi‐Tube intubation 135.00 135.00 135.00 ‐$ Billable Supplies ‐ Defibrillation 150.00 150.00 150.00 ‐$ Billable Supplies ‐ IV Therapy 90.00 90.00 90.00 ‐$ Billable Supplies ‐ ET Intubation 135.00 135.00 135.00 ‐$ Billable Supplies ‐ Routine Disposables 60.00 60.00 60.00 ‐$ Billable Supplies Oxygen Cannula (0 to 4 liters/minute) 15.00 15.00 15.00 ‐$ Billable Supplies Oxygen Mask (5 plus liters/minute) 22.50 22.50 22.50 ‐$ Excessive Weight Patients over 400 pounds 150.00 150.00 150.00 ‐$ Bariatric Expendable Supplies ‐ Hover Mat 100.00 100.00 ‐$ Blue Code drug resuscitation 75.00 75.00 75.00 ‐$ Blue Code Lucus Device 150.00 150.00 150.00 ‐$ Supplemental Oxygen other than Cannula or Mask 97.50 97.50 97.50 ‐$ Excessive Facility Calls ‐ More than 10 calls annually? 225.00 225.00 225.00 ‐$ Spinal Immobilization 225.00 225.00 225.00 ‐$ Vehicle Fire requiring a single engine response 750.00 750.00 750.00 ‐$ Motor Vehicle Accident Level 1 300.00 300.00 300.00 ‐$ Motor Vehicle Accident Level 2 450.00 450.00 450.00 ‐$ Motor Vehicle Accident Level 3 750.00 750.00 750.00 ‐$
Page 379

2020 2021 2022 Change
Proposed 2022 Fee Schedule and Comparison to Prior Years
Use of firefighting foam / per 5 gallons 225.00 225.00 225.00 ‐$ False Alarm Penalty / Determined Annually January 1 to December 31 ‐$ First Incident NC NC NC ‐$ Second Incident NC NC NC ‐$ Third Incident 75.00 75.00 75.00 ‐$ Fourth Incident 75.00 75.00 75.00 ‐$ Fifth Incident 112.50 112.50 112.50 ‐$ Sixth Incident 112.50 112.50 112.50 ‐$ Seventh Incident 150.00 150.00 150.00 ‐$ Eighth Incident 150.00 150.00 150.00 ‐$ Ninth Incident 300.00 300.00 300.00 ‐$ Tenth Incident 300.00 300.00 300.00 ‐$ Eleventh and each subsequent incident 450.00 450.00 450.00 ‐$ Penalty for Violation of Chapter Not less than 37.50 37.50 37.50 ‐$ Not more than 750.00 750.00 750.00 ‐$ Payment of Forfeiture in lieu of court appearance Negligent Fire 375.00 375.00 375.00 ‐$ Required Appliances 225.00 225.00 225.00 ‐$ Adopted codes and standards 225.00 225.00 225.00 ‐$ Administrative code violation 225.00 225.00 225.00 ‐$ Blocked Exit (per violation) 75.00 75.00 75.00 ‐$ Blocked Aisle (per violation) 75.00 75.00 75.00 ‐$ Exit light out (per violation) 37.50 37.50 37.50 ‐$ Fireworks 225.00 225.00 225.00 ‐$ Open Fire Violation 225.00 225.00 225.00 ‐$ Access to fire hydrant 225.00 225.00 225.00 ‐$ Hood and duct permit 225.00 225.00 225.00 ‐$ Hood and duct installation 225.00 225.00 225.00 ‐$ Hood and duct maintenance 225.00 225.00 225.00 ‐$ Sprinkler maintenance 225.00 225.00 225.00 ‐$ Blocking sprinkler connection 75.00 75.00 75.00 ‐$ Extinguisher installation 225.00 225.00 225.00 ‐$ Extinguisher maintenance 37.50 37.50 37.50 ‐$ Permit to service 225.00 225.00 225.00 ‐$ Fire detection system installation & maintenance 225.00 225.00 225.00 ‐$
Page 380