city of richmond garden city lands biophysical inventory ...€¦ · 1.3 local and regional context...
TRANSCRIPT

Submitted by:
342 West 8th Avenue Vancouver, BC
V5Y 3X2 Project Team: Diamond Head Consulting Ltd. Upland Consulting Ltd. Northwest Hydraulic Consultants Ltd.
City of Richmond Garden City Lands Biophysical Inventory and Analysis
July 24, 2013
Submitted to:
City of Richmond 6911 No. 3 Road
Richmond, BC V6Y 2C1

CITY OF RICHMOND – GARDEN CITY LANDS BIOPHYSICAL INVENTORY AND ANALYSIS
i
Table of Contents
1 PROJECT DESCRIPTION ............................................................................................... 1
1.1 Introduction to the Project ...............................................................................................................1
1.2 Project Objectives .............................................................................................................................1
1.3 Local and Regional Context ...............................................................................................................1
2 ASSESSMENT METHODS ............................................................................................. 7
2.1 Regulatory Context, Environmental Planning and Management ......................................................7
2.2 Limitations of Assignment .................................................................................................................7
2.3 Methods ............................................................................................................................................7
3 EXISTING ENVIRONMENT .......................................................................................... 11
3.1 Physical Environment ...................................................................................................................... 11
3.2 Biological Environment ................................................................................................................... 26
4 POTENTIAL LAND USE ............................................................................................... 44
4.1 Risk Factors ..................................................................................................................................... 44
4.2 Agricultural Uses and Limitations .................................................................................................... 46
4.3 Agricultural Land Use: Suitability, Capability, Feasibility ................................................................ 50
4.4 Green Infrastructure ....................................................................................................................... 60
4.5 Land Use .......................................................................................................................................... 63
5 CONSERVATION AND AGRICULTURE CONSIDERATIONS .............................................. 64
5.1 Conservation ................................................................................................................................... 64
5.2 Agricultural Activity in Peat Soils ..................................................................................................... 64
5.3 Status Quo – Do Nothing ................................................................................................................. 70
APPENDIX A – RESOURCES ................................................................................................... 71
APPENDIX B –PEAT DEPTH MEASUREMENTS ......................................................................... 73
APPENDIX C – SOIL SAMPLE PLOT LOCATIONS ....................................................................... 74
APPENDIX D – SOIL ANALYSIS ............................................................................................... 77
APPENDIX E – HYDROLOGY PHOTOS ..................................................................................... 78
APPENDIX F - DESIGN STORM EVENTS FROM KWL (2011) ...................................................... 82
APPENDIX G - IDF CURVE FROM ENVIRONMENT CANADA ..................................................... 83
APPENDIX H - VEGETATION .................................................................................................. 84

CITY OF RICHMOND – GARDEN CITY LANDS BIOPHYSICAL INVENTORY AND ANALYSIS
ii
APPENDIX I - AGRICULTURE SITE ASSESSMENT FIELD NOTES AND PHOTOS ............................ 88
APPENDIX J – PROJECTED CLIMATE CHANGE IN THE METRO VANCOUVER REGION ................ 92
APPENDIX K – SUMMARY OF AGRICULTURAL ACTIVITIES IN RICHMOND, BC .......................... 93
APPENDIX L – POTENTIAL FARMING GOVERNANCE MODELS FOR GCL ................................... 96

CITY OF RICHMOND – GARDEN CITY LANDS BIOPHYSICAL INVENTORY AND ANALYSIS
iii
List of Tables Table 1. Climate data (1971 – 2000) from Richmond Nature Park weather station .....................................11 Table 2. Average cumulative GDDs for Richmond .........................................................................................12 Table 3. Characteristics of soils likely found on site ......................................................................................14 Table 4. Elevations near the drainage ditch (datum as per the City of Richmond survey)............................23 Table 5. Bird species identified on GCL .........................................................................................................37 Table 6. Potential mammal species on GCL ...................................................................................................38 Table 7. Reptile and amphibian species encountered in Richmond Nature Park/DND Lands (2002) ...........40 Table 8. Significant plant species in Lulu Island Bog ......................................................................................41 Table 9. Opportunities and constraints for different permitted land uses on GCL .......................................46 Table 10. Suitability of Permitted Uses for the Agricultural Land Reserve on the Garden City Lands ..........50 Table 11. Potential climate change impacts on agriculture ..........................................................................68 Table 12. Peat depth......................................................................................................................................73 Table 13. Soil sample plots ............................................................................................................................74 Table 14. Projected climate change in the Metro Vancouver region ............................................................92
List of Figures Figure 1. Overview map of Garden City Lands ................................................................................................2 Figure 2. Historical limits of Greater Lulu Bog
1 ................................................................................................3
Figure 3. Regional land use designations ........................................................................................................3 Figure 4. Agricultural capability map (improved classifications) ...................................................................21 Figure 5. City of Richmond major system network from KWL (2011). Study area outlined in red................23 Figure 6. City of Richmond drainage infrastructure, detailed view (GIS Inquiry, March 2013) .....................24 Figure 7. Hydrology and drainage map of GCL ..............................................................................................26 Figure 8. Vegetation analysis map .................................................................................................................35 Figure 9. Wildlife/Habitat Analysis Map ........................................................................................................43 Figure 10. Potential green infrastructure for GCL .........................................................................................62 Figure 11. Potential land use .........................................................................................................................63 Figure 12. Peat depth sample locations ........................................................................................................73 Figure 13. Soil Sample Plot Locations ............................................................................................................74

CITY OF RICHMOND – GARDEN CITY LANDS BIOPHYSICAL INVENTORY AND ANALYSIS
1
1 Project Description
1.1 Introduction to the Project
Garden City Lands (GCL) is a vacant 136.5 acre (55.2 hectare) City-owned property purchased in 2010 that is located within the Agricultural Land Reserve (ALR) in Richmond. A six step public planning process to determine a common shared vision for future use of the GCL was officially endorsed by the City in October, 2012. In 2007, Council adopted three themes to guide the development of a proposed 65 acre park that was part of a previous plan which would have seen the Lands exempted from the Agricultural Land Reserve (ALR). These themes were Community Wellness and Enabling Healthy Lifestyles, Urban Agriculture, and Environmental Sustainability. Given that the City of Richmond now owns the whole 136.5 acre site and the Lands are staying within the ALR, these themes will be tested for their validity and relevance as part of the public engagement process. Stage One of the process includes the first 3 planning steps including Inventory and Analysis, Identification of Opportunities and Constraints, and development of a Vision and Guiding Principles. This report summarises information collected for Stage One of the planning process: the Biophysical Inventory and Analysis. Work was completed by a professional consulting team with expertise in ecology, wildlife, habitat assessment, hydrology and agrology. Inventory and assessment information contained in this report will provide a foundation of knowledge for the City of Richmond, other consultants, and the general public as this planning process moves forward.
1.2 Project Objectives
This biophysical inventory and analysis provides:
A thorough, clear and defendable understanding and knowledge of the existing site biological and physical features and processes; ecosystem(s) structures, functions and locations; key factors impacting current and future viability and health of the land; and relationships to adjacent land uses. A thorough understanding of the potential impacts on the land and key ecosystems of a
range of land use scenarios identified by City staff and through the public engagement process. A well-defined, transparent, and easily understood documentation and presentation of the
information gathering process and inventory results that can be used for communication and dialogue with a peer review group, City staff, Council and the public.
1.3 Local and Regional Context
1.3.1 Location
Garden City Lands is located within the Agricultural Land Reserve in the Richmond City Centre Area. The property is bounded by Alderbridge Way, No.4 Road, Westminster Hwy and Garden City Road. Department of National Defense (DND) lands and the Richmond Nature Park (RNP) lie to the east and low density treed properties lie to the north. The other three surrounding sides

CITY OF RICHMOND – GARDEN CITY LANDS BIOPHYSICAL INVENTORY AND ANALYSIS
2
of the property have been or will be developed into high density residential and commercial uses as part of the City’s Official Community Plan.
Figure 1. Overview map of Garden City Lands
1.3.2 Ecological Significance of GCL
Bogs are recognized as unique wetland ecosystems due to the specialized plants they support. GCL were once part of the Greater Lulu Island Bog ecosystem (see Figure 2). This raised bog developed over centuries and originally covered a much larger area of Richmond prior to European settlement1. However, much of this bog has been lost due to urbanization, agriculture, and peat mining (Figure 3). Drainage and flood control measures have altered the hydrology of the bog. Today, the most significant tract of remnant bog habitat remaining in Richmond is found on DND property and the RNP. The eastern portion of GCL was a part of this bog ecosystem, but has been modified by human activity. This land has been retained as semi-natural open space and still has many of the ecological characteristics (soil, plants) indicative of bog ecosystems. GCL is also an important linkage to more natural bog habitat to the east.
1 Davis, N. and R. Klinkenberg, 2008. A biophysical inventory and evaluation of the Lulu Island bog,
Richmond, BC. A project of the Richmond Nature Park Society Ecology Committee.

CITY OF RICHMOND – GARDEN CITY LANDS BIOPHYSICAL INVENTORY AND ANALYSIS
3
Figure 2. Historical limits of Greater Lulu Bog1
This particular bog ecosystem is unique due to its proximity to Richmond’s urban centre. In fact, GCL is included in the City Centre planning area. This close proximity to some of the City’s most developed and populated areas provides an excellent opportunity to showcase urban bog ecosystems and the potential to meet a variety of land use objectives.
Figure 3. Regional land use designations2
2 Metro Vancouver. 2011. Regional Land use Designations. Retrieved March 12, 2013.
http://www.metrovancouver.org/planning/development/strategy/LandUseDesignationMapsJan11/Map2RegionalLandUseDesignationsLarge.pdf

CITY OF RICHMOND – GARDEN CITY LANDS BIOPHYSICAL INVENTORY AND ANALYSIS
4
What is a Wetland? Wetlands are defined as lands seasonally or permanently covered by shallow water, including those where the water table is at or close to the surface. The abundance of water results in formation of unique soil conditions and presence of water-tolerant plants. There are five major types of wetlands: bogs, marshes, swamps, fens and shallow open waters
3. Bogs are differentiated from other wetlands by the accumulation of peat (partially decomposed plant
material) and acidic soil conditions. Land on the east side of GCL has bog-like conditions, including presence of peat deposits and many plant species adapted to acidic soils. However, drainage has resulted in seasonal lowering of the water table and drying of this ecosystem over time. Garden City Lands was once likely the transition zone between bog habitat and marsh habitat, the other wetland type identified on the west side of the property. Marshes are lowland areas that are periodically flooded and commonly have sedges, rushes, and grasses as major vegetation. Historically, these marshlands would have likely been saltwater; however, human activity such as dyking has resulted in a transformation into a remnant freshwater marsh.
Wetland preservation is an important regional goal4. Since the mid 1800’s, almost three quarters of wetlands in the Lower Fraser Valley have been converted for other purposes5. Approximately 29,000 hectares of wetland existed in the Fraser Lowlands. The Fraser Lowlands cover about 3,000 km2 in southwest BC. Metro Vancouver is currently mapping the Lower Mainland’s remaining wetland ecosystems as part of its Sensitive Ecosystems Inventory (SEI). Results of this mapping indicate that for the 20 year period between 1989 and 2009, an average of 67 hectares of wetlands was lost annually6. Conversion for agricultural use accounted for the highest proportion of wetland loss.
1.3.3 History of Land Use and Agriculture
GCL has an interesting and varied history of land use. GCL was part of the Dominion Rifle Range in the early 20th century, and was a favourite place for community foraging (e.g. wild blueberry picking, Christmas tree cutting) and duck hunting. In 1949, radio transmitters and a telecommunications workshop were built on the Lands to provide communication services for mariners. The towers have since been removed from the site, although some footings still remain and cables are thought to be buried in some areas of the site. Placement of fill has occurred on portions of the property (notably the northwest corner). This, in
combination with drainage infrastructure that has been installed around a portion of the periphery of the site, is affecting hydrology and soils. Introduced plant species, some of which are invasive, are displacing natural vegetation on much of the site. Current management by the City of Richmond involves regular mowing, although this activity has ceased for 2013.
3 Environment Canada. 2013. Retrieved July 12, 2013. http://www.ec.gc.ca/tho-
wlo/default.asp?lang=En&n=B4669525-1#_definitions 4 Metro Vancouver. 2011. Ecological Health Action Plan. Retrieved May 10, 2013.
http://www.metrovancouver.org/planning/development/ecologicalhealth/EcologicalHealthDocs/ECOHealthActionPlan_Nov2011.pdf 5 Boyle, C.A., L. Lavkulich, H. Schreier & E. Kiss. 1997. Changes in Land Cover and Subsequent Effects on
Lower Fraser Basin Ecosystems from 1827 to 1990. Environmental Management, 21(2), 185-196 6 Wilson, Sara J. 2010. Natural Capital in BC’s Lower Mainland: Valuing the Benefits from Nature. David
Suzuki Foundation.
Photo: Garden City Lands (1954)

CITY OF RICHMOND – GARDEN CITY LANDS BIOPHYSICAL INVENTORY AND ANALYSIS
5
GCL is not currently under agricultural production, nor is there any history of cultivation on the site. During early settlement on Lulu Island, peat bogs of the central and eastern regions were considered to be detrimental to the interests of farming. Peat mining and burning in the mid-1900s, assisted in converting Lulu Island boglands into suitable farmland. In the late 1940s, during the height of peat mining activity on the island, Lulu Island produced up to 50% of Canada's peat products. The empty fields that remained were initially suitable for commercial cranberry production and later for blueberry and raspberry operations. Organic (peat) soils are currently used extensively for berry and vegetable production in Richmond and with proper management will produce excellent crops year after year. Hundreds of acres adjacent to the GCL site (east of No. 4 Rd. between Francis Rd. and Westminster Highway) contain many small parcels growing blueberries. 1.3.4 Land Use Planning
The City of Richmond adopted its 2041 Official Community Plan (OCP) in November, 2012. The OCP establishes the vision and policies to guide land use and help meet the environmental, social and economic goals of the community. The City has highlighted its concern for its valuable bog ecosystems (and the associated loss of local biodiversity) due to climate change, urbanization, agricultural intensification, and invasive species. The majority of DND land is designated in the OCP as a Freshwater Wetland Environmentally Sensitive Area (ESA). Additional land in Richmond Nature Park and to the southeast is also designated as Freshwater Wetland. Development Permit Areas have been established on private land designated as an ESA. These DPAs are in place to preserve vegetation and soils, and maintain pre-development hydrology, drainage patterns and water quality. Richmond supports creation of an Ecological Network and complementary Green Infrastructure Network to guide land use, preserve natural areas, enhance biodiversity, and ensure benefits from ecological services associated with sites such as GCL. This approach would also enhance adjacent natural areas by improving ecological connectivity. This includes upland forest habitat north of GCL, which is also designated as an ESA. As the City’s overarching planning document, the OCP provides a contextual framework for Garden City Lands. The overall Land Use designation is Conservation which allows for a variety of uses including agricultural, recreation, and park uses. Some major themes from the OCP that are applicable to Garden City Lands include:
Retain agricultural land;
Provide parks and open space;
Improve Ecological Network and services;
Create sustainable infrastructure to support agriculture and meet community needs;
Promote urban agriculture and advance food security;
Support activities that improve economic resiliency and sustainable resource use;
Improve accessibility and walkability;
Adapt to climate change;
Improve opportunities for recreation and community wellness; and
Promote healthy and connected neighbourhoods.

CITY OF RICHMOND – GARDEN CITY LANDS BIOPHYSICAL INVENTORY AND ANALYSIS
6
Surrounding land uses must be considered carefully due to the size and prominence of GCL and its potential to meet a variety of development and conservation objectives. Garden City Lands are part of the City Centre Neighbourhood, which includes land to the west and south. Current zoning of the GCL is AG1 (Agriculture). West of Garden City Road, zoning permits medium to high density apartment development, mixed use and limited commercial development. South of Westminster Highway, the neighbourhood is zoned for a mix of high density, low rise apartments and townhouses, and single detached homes. Some mixed use and institutional uses are also permitted. The West Cambie neighbourhood exists north of Alderbridge Way. Zoning adjacent to GCL permits commercial, park, and low density neighbourhood residential development. DND land on the east side is part of the East Richmond Neighbourhood. DND is zoned AG1; however, it is predominantly forested or open bog habitat. 1.3.5 Support for Regional Food Production Initiatives
Metro Vancouver has been supportive of increasing regional food production for a number of years. In 2008, Metro Vancouver hosted a dialogue series called “Building a Resilient Food System.” Many more workshops and dialogue sessions followed, and were key components of the development of a regional food strategy, the Regional Food System Strategy, which was adopted in 2011. The Strategy was developed to increase awareness regarding how food is produced, distributed, consumed and wasted, as well as to enable a more collaborative approach to solve challenges within the food system. The five goals in the Regional Food System Strategy are:
1. Increased capacity to produce food close to home
2. Improve the financial viability of the food sector
3. People make healthy and sustainable food choices
4. Everyone has access to healthy, culturally diverse and affordable food
5. A food system consistent with ecological health
The Regional Food System Strategy provides direction for Metro Vancouver and member municipalities to consider farming as a relevant land use providing benefits to the public, particularly through the protection of agricultural land for food production, expansion of agricultural production, investment in new farmers, and commercial urban food production.

CITY OF RICHMOND – GARDEN CITY LANDS BIOPHYSICAL INVENTORY AND ANALYSIS
7
2 Assessment Methods
2.1 Regulatory Context, Environmental Planning and Management
Acts, Regulations and Bylaws that may apply to this project were reviewed and include:
Federal Migratory Birds Convention Act [1994] and attendant Migratory Birds Regulation [1994] that protects migratory birds, their eggs and nests;
Provincial Wildlife Act [1996] CHAPTER 488 - Section 34(a), (b), and (c) prohibits the taking of birds, eggs, and nests;
Provincial Water Act, 1996;
Agriculture Land Reserve Act (RSBC 1996);
City of Richmond Official Community Plan. 2041 OCP Bylaw 9000 (2012);
City of Richmond Zoning Bylaw 8500 (2009);
City of Richmond Engineering Design Specifications, Section 3.0 – Storm Drainage (2008);
City of Richmond. Floodplain Designation and Protection. Bylaw No. 8204. (2008)
2.2 Limitations of Assignment
This investigation is based solely on our site visits conducted between February and July of 2013, and a literature review of other environmental reports for this area;
A detailed wildlife inventory requires extensive trapping and observation during all seasons. Due to restricted timelines and scope for this study, potential species occurrence was determined based on an assessment of habitat features and quality;
A complete hydrologic investigation incorporating hydrogeology (subsurface flows) would require a comprehensive drilling and monitoring program. Given the time and budget constraints of this project, this was not completed;
The agricultural capability assessment was performed over three site visits in February (which included soil sampling), May, and July 2013. Agricultural site visit memos and photos are provided in Appendix I.
2.3 Methods
Garden City Lands were inventoried and assessed based on the biophysical components and other values identified on and adjacent to the site:
Physical Environment Biological Environment Human Environment
Topography Geology/Soil Hydrology Climate Biogeoclimatic
Classification
Vegetation Wildlife
Residential, Commercial
Infrastructure Agriculture
Land was delineated into smaller homogenous landscape units (polygons) based on information collected during the inventory. This analysis was completed for four broad categories:

CITY OF RICHMOND – GARDEN CITY LANDS BIOPHYSICAL INVENTORY AND ANALYSIS
8
Vegetation, Agricultural Capability, Hydrology/Drainage, and Biodiversity. Landscape units in each category were ranked according to their relative value or associated opportunities and constraints for conservation and development. Rankings are subjective using professional judgment based on analysis of the information collected during the inventory and analysis stage.
2.3.1 Methods for Biophysical Assessment
The Biophysical Inventory and Evaluation of Lulu Island Bog (2008), published by the Richmond Nature Park Society, was consulted as it provides an excellent source of information of local flora, fauna and other values potentially associated with GCL. Field assessments of terrestrial ecology were completed on February 22, May 2 and July 4, 2013. The site was stratified into areas with similar plant communities. All plants and mosses within each area were identified. Taxonomy for the vascular plants follows The Illustrated Flora of British Columbia (2002), for plants that are included in those volumes. Peat depth was determined across the site based on a survey following a grid pattern. Three linear transects running east to west were established 190 metres apart. Peat depth was measured every 50 metres by either excavating a soil pit or using a metal probe. While on site, all signs of wildlife were noted. The scope of this project does not allow for a detailed wildlife survey which would otherwise include trapping and surveying throughout the year. 2.3.2 Methods for Agricultural and Soils Assessment
The agricultural and soils assessment component involved fieldwork, soil testing, mapping interpretation, and a review of background documents. Two Professional Agrologists visited the site on February 16, 2013 and took field notes, photographs, and obtained soil samples for laboratory analysis. Additional site visits took place on May 10, 2013 and July 10, 2013. A summary of site visit notes and photos are provided in Appendix I. Agricultural map unit areas were delineated based on changes in topography or other distinguishable features. Five separate agricultural map unit areas were chosen for sampling based on agriculturally-viable locations (streams, standing water, and gravel fill areas were not sampled). The following methodology was used while collecting the samples:
Vegetation residue was removed from the top layer of the soil.
A shovel was used to excavate small soil pits to a depth of 10cm - 20cm. This represents the depth to which most soil is tilled and contains the majority of the crop’s roots (Bertrand et al., 1991).
For each of the 5 sampling sites, up to ten subsamples were collected in a bucket to represent one composite sample. Stones and roots were removed, and the soil was mixed thoroughly.
Approximately 1 L of soil was removed from the bucket and placed into a labelled and sealed plastic bag.
Soil samples were shipped to Pacific Soils Analysis (PSA) in Richmond, BC and were analyzed by PSA to determine soil fertility for agricultural capability. Macronutrients, micronutrients, and other physical and chemical soil properties were included in the analysis.

CITY OF RICHMOND – GARDEN CITY LANDS BIOPHYSICAL INVENTORY AND ANALYSIS
9
The Agriculture Capability rating system was used to identify crop suitability and note any challenges to farming on the site. The Agricultural Capability system is a method designed to enable consistent and objective assessment of land based on inherent limitations for crop. It was developed in the 1960s as part of the Canada Land Inventory (CLI). Agriculture Capability ratings are based on soil, landscape, and climate properties, not crop yield data, and limitations may or may not be altered by management. Agriculture Capability ratings can be used to help determine appropriate crop choices, realistic target yields and assess and mitigate site-specific risks such as flooding, stoniness, steep slopes, or nutrient loss. In this classification, mineral and organic soils are each grouped into seven classes on the basis of soil and climate characteristics according to their potential for agricultural use. Lands in Classes 1 to 4 inclusive are considered capable of sustained agricultural production of most crops. Class 5 lands are considered capable of producing forage crops or specially adapted crops. Class 6 lands are capable of providing only pasture for livestock. Class 7 lands generally are incapable of use for either crops or livestock (they are usually rocky outcrops or wetlands). However, it is important to note that many successful farms in BC are located on Class 7 soils, indicating that some crops may be suited to sites that many others are not. In particular, cranberries and vineyards can often do well in Class 6 and 7 soils. Soils labeled with the letter “O” before the class number indicate organic (peat) soils. Unimproved ratings are based on the conditions that exist at the time of the survey, without irrigation or other management systems in place. Improved ratings indicate the potential capability after existing limitations and/or hazards have been adequately alleviated. Improvements may include land grading, drainage, irrigation, diking, stone removal, salinity alleviation, subsoiling, and/or the addition of fertilizers or other soil amendments. Other important assumptions that are made based on the classification system include:
Soils will be managed and cropped under a largely mechanized system.
Water is available for irrigation.
The following are not considered in the classification: distance to market, available transportation facilities, labour, location, farm size, type of ownership, cultural patterns, skill or resources of individual operators, and hazard of crop damage by storms.
The classification does not include capability ratings for trees, fruit orchards, vineyards/grapes, ornamental plants, recreation, or wildlife.
A preliminary interpretation of agricultural viability was developed based on the results of the field visit, sampling analysis, and literature review.
2.3.3 Methods for Hydrological and Drainage Assessment
Northwest Hydraulic Consultants (NHC) conducted the drainage inventory and analysis of the Garden City Lands. The ultimate goal was to determine the capacity of the Lands for varied agricultural and recreational uses. To support this goal, the following tasks were undertaken:
a field visit;
a review of available documents including bylaws, policy, and existing reports;

CITY OF RICHMOND – GARDEN CITY LANDS BIOPHYSICAL INVENTORY AND ANALYSIS
10
a simplified hydrologic analysis including rainfall analysis and runoff estimations, and a generalized hydrologic characterization.

CITY OF RICHMOND – GARDEN CITY LANDS BIOPHYSICAL INVENTORY AND ANALYSIS
11
3 Existing Environment
3.1 Physical Environment
3.1.1 Climate and Biogeoclimatic Ecosystem Classification
Garden City Lands is located within the Moist Maritime Coastal Douglas-fir (CDFmm) Subzone according to the Biogeoclimatic Ecosystem Classification (BEC) of BC. This subzone is in the rain shadow of the Vancouver Island Mountains and is characterized by warm, dry summers and mild wet winters. The growing season is long with pronounced water deficits in the summer.
Total annual rainfall has been recorded as 1,239.5 mm with total annual snowfall at 37.9 cm at the Environment Canada weather station in Richmond Nature Park7. The majority of the precipitation (69%) falls between October 1 and March 31 every year. From an agricultural perspective, there is often too much water in the winter and not enough in the summer, requiring both drainage and irrigation systems to be kept in place. Potential changes to this precipitation temperature regime due to climate change is presented in Appendix J. Table 1 summarizes climatic characteristics based on climate normals data from 1971-2000 at the Richmond Nature Park weather station. Table 1. Climate data (1971 – 2000) from Richmond Nature Park weather station
Richmond Nature Park Station Elevation (m) 3.0
Longitude 123°05'35.000" W
Latitude 49°10'15.000" N
Average daily summer maximum temperature (July/Aug) 23.8
Average daily winter maximum temperature (Jan/Feb) 6.4
Days per year with minimum temperatures less than 0oC 63.9
Days per year with maximum temperatures greater than 20oC 96.2
Days per year with maximum temperatures greater than 0oC 361.2
Days per year of rain 179.4
Total annual rainfall (mm) 1239.5
Days per year of snow 7.3
Total annual snowfall (cm) 37.9
Degree days greater than 10oC 987.3
Degree days greater than 5oC 2194.3
Growing degree days (GDDs) are a measure of heat accumulation to predict plant development rates (such as when crops will mature or bear fruit), and are therefore important considerations for farmers. Growing degrees are the number of temperature degrees above a certain threshold base temperature, which varies among crop species. The base temperature is that temperature below which plant growth is zero. For the ecozone of Richmond the base temperature is 10oC. Growing degrees are calculated each day as maximum temperature plus the minimum temperature divided by 2 (or the mean temperature), minus the base temperature. GDUs are accumulated by adding each day’s GDs contribution as the season progresses. The following
7 Environment Canada. Feb 4, 2013. Canadian Climate Normals – Richmond Nature Park. Retrieved March
7, 2013. http://climate.weatheroffice.gc.ca/climate_normals/results_e.html?stnID=837&lang=e&dCode=0&province=BC&provBut=Search&month1=0&month2=12

CITY OF RICHMOND – GARDEN CITY LANDS BIOPHYSICAL INVENTORY AND ANALYSIS
12
average cumulative GDDs for each month are calculated for Richmond using a base temperature of 10oC. Table 2. Average cumulative GDDs for Richmond
Richmond Nature Park
Average Daily GDD
Jan Feb Mar Apr May Jun Jul Aug Sep Oct Nov Dec Annual Totals
0.0 0.0 0.0 0.0 130.2 174.0 279.0 248.0 144.0 9.3 0.0 0.0 984.5
3.1.2 Topography
GCL is mainly flat with an elevation less than three (3) metres above mean sea level. Exceptions include the northwest corner, which is an area of historical fill that is now elevated above the rest of the site. Areas adjacent to roadways are also slightly higher in elevation due to placement of construction fill. No natural streams flow through the property.
Photo: Topography of the site is mostly flat Photo: The northwest corner and road edges are slightly
elevated above the rest of GCL from fill
3.1.3 Geology/Soil
Peat
Raised bogs typical of this part of the Lower Mainland are characterized by peat deposits. Peat is organic soil, primarily consisting of decayed or partially decayed vegetation found in bogs. Sphagnum moss is typically the most significant component of peat; however, peat found on GCL has a high composition of Carex (sedge). Peat is a critical factor influencing plant communities, which typically contain plants adapted to nutrient poor, acidic conditions. Peat forms at a very slow rate in bog ecosystems, estimated at 0.5 to 1 mm per year. Peat depth varies between 50 and 100 cm on Garden City Lands (see Appendix B). Generally, peat is deepest in the northeast corner of the site. Peat depth decreases slightly to the west and south.
Photo: Surface rooted profile of peat

CITY OF RICHMOND – GARDEN CITY LANDS BIOPHYSICAL INVENTORY AND ANALYSIS
13
Soil Types
Soil types are categorized based on distinguishing characteristics and criteria that dictate soil management techniques. Soil classification facilitates the organization and communication of information about soils, and the understanding of relationships between soils and environmental factors. Differences in soils are the result of the interaction of many factors: climate, organisms, parent material, topography and time. Developed from unconsolidated deposits of Pleistocene or Recent Age, the lowlands of Richmond consist of poorly drained deltaic and organic deposits. They are located below 6 metres elevation (often even lower) and soil forming materials consist of glacial till, glaciomarine deposits, and gravelly and sandy raised littoral and beach deposits. Silt loam, silty clay loam, or silty clay overly fine to medium sands. Organic peat deposits are 0.6 - 6 metres deep; those less than 1.6 metres deep are composed of a mixture of decomposed reeds, sedges, and woody plants overlain by sphagnum moss. The Garden City Lands are characterized by deep (more than 1.5 metres) organic soils and a high water table. Although soil from the Garden City Lands was not included during the soil surveys of the 1980s, soils near the site provide an indication of characteristics of soils likely to be found on site (see Table 3).
CITY OF RICHMOND – GARDEN CITY LANDS BIOPHYSICAL INVENTORY AND ANALYSIS
14
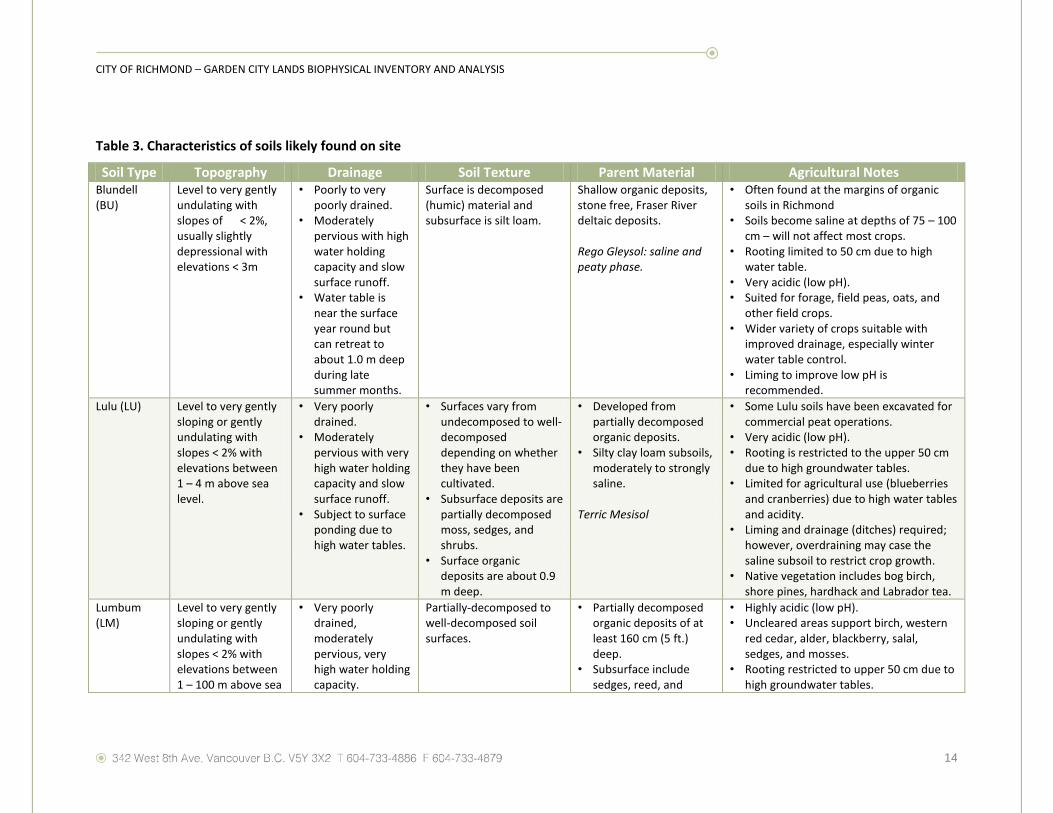
Table 3. Characteristics of soils likely found on site
Soil Type Topography Drainage Soil Texture Parent Material Agricultural Notes Blundell (BU)
Level to very gently undulating with slopes of < 2%, usually slightly depressional with elevations < 3m
• Poorly to very poorly drained.
• Moderately pervious with high water holding capacity and slow surface runoff.
• Water table is near the surface year round but can retreat to about 1.0 m deep during late summer months.
Surface is decomposed (humic) material and subsurface is silt loam.
Shallow organic deposits, stone free, Fraser River deltaic deposits. Rego Gleysol: saline and peaty phase.
• Often found at the margins of organic soils in Richmond
• Soils become saline at depths of 75 – 100 cm – will not affect most crops.
• Rooting limited to 50 cm due to high water table.
• Very acidic (low pH). • Suited for forage, field peas, oats, and
other field crops. • Wider variety of crops suitable with
improved drainage, especially winter water table control.
• Liming to improve low pH is recommended.
Lulu (LU) Level to very gently sloping or gently undulating with slopes < 2% with elevations between 1 – 4 m above sea level.
• Very poorly drained.
• Moderately pervious with very high water holding capacity and slow surface runoff.
• Subject to surface ponding due to high water tables.
• Surfaces vary from undecomposed to well-decomposed depending on whether they have been cultivated.
• Subsurface deposits are partially decomposed moss, sedges, and shrubs.
• Surface organic deposits are about 0.9 m deep.
• Developed from partially decomposed organic deposits.
• Silty clay loam subsoils, moderately to strongly saline.
Terric Mesisol
• Some Lulu soils have been excavated for commercial peat operations.
• Very acidic (low pH). • Rooting is restricted to the upper 50 cm
due to high groundwater tables. • Limited for agricultural use (blueberries
and cranberries) due to high water tables and acidity.
• Liming and drainage (ditches) required; however, overdraining may case the saline subsoil to restrict crop growth.
• Native vegetation includes bog birch, shore pines, hardhack and Labrador tea.
Lumbum (LM)
Level to very gently sloping or gently undulating with slopes < 2% with elevations between 1 – 100 m above sea
• Very poorly drained, moderately pervious, very high water holding capacity.
Partially-decomposed to well-decomposed soil surfaces.
• Partially decomposed organic deposits of at least 160 cm (5 ft.) deep.
• Subsurface include sedges, reed, and
• Highly acidic (low pH). • Uncleared areas support birch, western
red cedar, alder, blackberry, salal, sedges, and mosses.
• Rooting restricted to upper 50 cm due to high groundwater tables.

CITY OF RICHMOND – GARDEN CITY LANDS BIOPHYSICAL INVENTORY AND ANALYSIS
15
level. • Water table is near or at the soil surface during winter months and summer rainfall events.
mosses. • Mineral sediments are
clayey deltaic, silty floodplain, or clayey glaciomarine deposits.
• Subsoils are saline. Typic Mesisol
• Agricultural production limited by high water tables, drainage required.
• Open ditch drainage preferred over tile drainage.
• Suitable crops include blueberries, cranberries, and forage.
• Carrots, lettuce, potatoes, and other vegetables possible if water table is controlled.
• Overdraining may cause subsidence and decomposition.
Richmond (RC)
Flat to gently undulating, slope < 2% and elevations < 3 m above sea level.
• Very poorly drained, moderately pervious, high water holding capacity.
• Groundwater tables high except during summer growing season months.
• Surface ponding common after rainfall events.
Surfaces vary from moderately to well-decomposed, depending on cultivation.
• Subsurface is 40 – 160 cm of well-decomposed organic material overlying deltaic deposits.
• Mineral soils underlying the peat are silt loam, silty clay loam, and are saline in areas close to the Fraser River.
• High sulphur levels in the subsurface mineral soils.
Terric Humisol
• Richmond soils occur mainly at the margins of the organic soil areas.
• Deep peat areas have been excavated from these soils.
• Highly acidic (low pH). • Uncultivated areas support sedges,
reeds, birch, blackberries, moss, and grass.
• Rooting restricted to upper 50 cm due to high water tables.
• Agriculture limited due to acidity and poor drainage. Crops include blueberries, cranberries, or forage.
• Tile drains not generally recommended because it can be disrupted by settling and shrinkage of organic materials.
• Overdraining will cause subsidence, decomposition of organic matters, and will bring saline level up into the rooting zone.
• Organic soils that have been completely dried are difficult to re-wet.
• If drainage is achieved these soils can be used to cultivate carrots, lettuce, potatoes, and other vegetables.
Triggs (TR) Nearly level, slightly • Very poorly Layer of sphagnum moss • At least 2.0 m of deep • Very acidic (low pH).

CITY OF RICHMOND – GARDEN CITY LANDS BIOPHYSICAL INVENTORY AND ANALYSIS
16
depressional, or very gently sloping < 2% and elevations < 3 m above sea level.
drained, water table is at or near surface most of the year.
• Soils are moderately pervious and have very high water holding capacity.
at the surface underlain by 20 cm of undecomposed organic material.
undecomposed organic matter (mainly sphagnum and other mosses), with some woody material also present.
• Underlying mineral deposits are medium or fine textured Fraser River floodplain sediments.
Typic Fribrisol
• Natural vegetation includes birch, pine, hardhack, sphagnum and other mosses.
• Rooting restricted to upper 30 cm. • Generally not suited to most agricultural
crop unless reclamation occurs. • Blueberries and cranberries require less
amounts of management. • Drainage (open ditches) and liming
required. • If the organic material gets too dry it can
be difficult to re-wet.

CITY OF RICHMOND – GARDEN CITY LANDS BIOPHYSICAL INVENTORY AND ANALYSIS
17
3.1.3 Site Investigation of Soil Characteristics
GCL is located within the Lulu Island Bog, a remnant of a larger raised bog ecosystem located on Lulu Island and therefore the soils are primarily peat, or organic. Organic soils develop from plant residues and have been preserved by a high water table. Many generations of plants, growing for decades fall into the water in which they were growing and become preserved due to the lack of oxygen. This slow process requires about 500 years to accumulate 30 cm of organic soil8. Five soil samples were prepared for quantitative analysis using the standard saturated media extract method. Results are presented in detail in Appendix C and D.
Organic Matter Results
Organic matter (OM) refers to decomposed vegetation (leaves, roots, etc.) that has been incorporated into the soil, usually found in the topmost layers. The amount of OM in a soil is dependent upon climate (precipitation and temperature), drainage patterns, existing vegetation, and soil management techniques. Maintenance of OM in agricultural soils is very important because it helps retain soil moisture and holds nutrients to be released slowly in available forms by microorganisms to plants. OM also assists in reducing soil erosion and maintenance of good soil structure and aeration. Mineral soils can have as little as 1% OM or less, while peat soils can have 100% OM. A soil is considered to have very high OM when levels reach 30% or more and is labeled as “organic” or “peat” soils9. Sampling results indicate OM levels of 84-93% within the rooting zone (upper 15 cm) in the GCL.
Soil pH
Peat soils are acidic, characterized by pH levels often below 4.5. Soil samples obtained from the GCL indicated a range of pH values from 3.5 – 4.1. Given the acidic nature and high organic matter of the peat soil, the diversity of crops suited to grow in the soil is limited unless amended. While the pH is not directly responsible for production potential in most vegetable crops, it is a key determinant for nutrient availability and thus production. Liming soil to a pH of 4.8-5.0 is generally required for agriculture production in organic soils. The initial amount of lime required to bring the pH of the peat soil to such a level will be much greater than the amounts required to maintain that pH once it has been reached. In general, before vegetable production is initiated, very high rates of lime are required - as much as 20,000 kg/ha - whereas later maintenance requirements may be more in the order of 2,000 kg/ha10.
8 Ontario Ministry of Agriculture, Food, and Rural Affairs. Factsheet: Management of Organic Soils.
http://www.omafra.gov.on.ca/english/crops/facts/93-053.htm 9 Luttmerding, H.A. and P.N. Sprout, 1969. Soil Survey of Delta and Richmond Municipalities. Preliminary
report No. 10 of the Lower Fraser Valley Soil Survey. Soils Division, BC Department of Agriculture, Kelowna, BC. 10 Management and Conservation Practices for Vegetable Production on Peat Soils. Eastern Canada Soil
and Water Conservation Centre (ECSWCC). 1997.

CITY OF RICHMOND – GARDEN CITY LANDS BIOPHYSICAL INVENTORY AND ANALYSIS
18
Soil Fertility
Mineral content of the peatland is important to its fertility (the amount of plant-available nutrients), as the mineral particles are a source of many nutrients. There is usually a very small amount of mineral material that washes or blows into the bog from the surrounding landscape. Peats that are on river flats, however, can have a much higher mineral content if sediments are deposited during flooding. Results from particle size analysis of GCL soils indicate 6-15% fine mineral sediments. When a bog obtains its moisture from groundwater nutrients, levels tend to be higher compared to peatland that obtains water and nutrients primarily from precipitation. Bogs tend to be nutrient-poor resulting in a limited diversity of naturally occurring plant species. Soil fertility test results of GCL soils indicate that it is likely there is a mix of groundwater and precipitation feeding the site. In particular, available nitrogen levels were found to be higher than would normally be expected in a precipitation-fed bog. This is consistent with the drainage inventory findings. If the site is cultivated, fertilizer requirements will be crop-dependent and the levels of required nutrients will change throughout the growing season and from one season to the next. It is important to note that the excess or deficiency of a single nutrient can affect the availability of other nutrients. Accurate identification of nutrient deficiencies in vegetable crops grown on peat soils can be difficult (e.g. a calcium deficiency can appear very similar to nitrogen deficiency in some crops). Therefore, annual soil tests are important, especially on newly developed peat soils. After peat soils have been cropped for several years, levels of potassium and phosphorus may increase and, if applications do not change, may become excessive. An effective nutrient management system would help to minimize environmental impacts from excess nutrient runoff into waterways. Total available nitrogen (ammonium and nitrate-N) of soil samples was surprisingly high when compared to the electrical conductivity (EC), with a considerably high proportion of nitrate-N thus exhibiting significant nitrification activity (the oxidation of ammonia into nitrite and nitrate by soil bacteria). The nitrate to ammonia ratio is a key indicator of soil aeration and also a determinant for crop suitability. Total nitrogen of the soil ranges from 1% to 1.7%, which would be rated as high to very high for crop production, thus being extremely fertile and most likely not requiring N fertilization for the first year for most crops. Available phosphorus (P) is medium to high for samples 1 through 4 (low for sample 5) when compared with the ranges of EC results. Available P is overall well-balanced with the available nitrogen values. Potassium (K) is somewhat low relative to the high nitrogen values; however, low K levels are not surprising given that the site has not been fertilized or cultivated and available K levels tend to be low in open grassy fields with rain and weathering. Calcium and magnesium levels are both in the medium to high range relative to the EC. Micronutrients (Fe, Cu, Zn, Mn, B) are all in the medium to high range indicating good fertility available for many crops.

CITY OF RICHMOND – GARDEN CITY LANDS BIOPHYSICAL INVENTORY AND ANALYSIS
19
3.1.4 Agricultural Capability
Although the site was not previously included in the provincial agricultural capability mapping, interpolating these ratings is possible based on results from adjacent sites and previous assessments by the Agricultural Land Commission.
Soils on site were assessed to be Organic Class 3 (O2 improved) and Organic Class 4 (O3 improved) based on limitations relating to acidity, drainage, and the presence of deep layers of organic matter. These ratings are in alignment with assessed ratings provided by the Agricultural Land Commission in 200911. Based on observations and soil testing made during site visits and soil sampling in February 2013, there are no significant limitations that would restrict agricultural use of soils on the GCL site. The site is comprised mainly of prime agricultural soils (best soils are Classes 1, 2, and 3). The eastern half of the site can be described as Class Organic2 while the western portion is a mix of Class 3 and Class Organic3. About 10-15% of the site is listed as Class 7 (no agricultural capability) due to fill being placed in the northwestern corner and for a few access driveways. Subclasses W (excess water and high water tables) and D (undesirable soil structure in some pockets) are found on the site. The high water table is the main limitation to crop production on the site, and drainage will be required throughout to ensure that the water table is brought below crop rooting depth (30 – 60 cm) during planting, growing, and harvesting seasons (March to October). While the depth of the peat soils varies throughout the site, this is not considered to be more of a limitation to crop production in any particular area. This is due to the fact that the peat is at least as deep as the rooting zone (i.e. > 60 cm) throughout the site and therefore any limitations due to peat depth are consistent throughout. All of GCL (with the exception of fill areas) is therefore rated high value for agriculture when soil is improved (i.e. drainage and irrigation is made available). The land is capable of supporting many different crop types with few restrictions. When considered in context with other values on site (wildlife, vegetation), the area in the centre of the GCL property, with lower wildlife and habitat values than elsewhere on site, is very suitable for agricultural use. This area may also be buffered on three sides by other land uses. See Section 4 for a more complete discussion regarding possible land use on the GCL.
11
Agricultural Land Commission, 2009. Exclusion application – Garden City Lands, ALC File #O-38099. Decision, February 12, 2009.

CITY OF RICHMOND – GARDEN CITY LANDS BIOPHYSICAL INVENTORY AND ANALYSIS
20
Photos: GCL in late February (top), May (middle), and July 2013 (bottom).

CITY OF RICHMOND – GARDEN CITY LANDS BIOPHYSICAL INVENTORY AND ANALYSIS
21
Agricultural Capability Analysis
N Scale: 200 m
Agricultural Capability Analysis
Agricultural Capability – Description of Improved Classification Values
GCL consists of a mix of prime soils (best soils are Classes 1, 2, and 3) and some that are unsuited for most farming endeavours (Class 7 – due to fill in the NW corner of the property and pre-existing driveways). Class O2: Organic soils capable of producing a wide range of crops. Minor restrictions of soil or climate may reduce capability but pose no major difficulties in management. Class O3: Organic soils capable of producing a fairly wide range of crops under good management practices. Soil and/or climate limitations are somewhat restrictive. Class 3: Mineral soils capable of producing a fairly wide range of crops under good management practices. Soil and/or climate limitations are somewhat restrictive. Class 7: This land has no capability for soil bound agriculture. Subclass W: Excess water (groundwater). Subclass D: Undesirable soil structure in some pockets.
Agricultural Capability Ratings - General
High Value (Green): This area has minimal restrictions to the cultivation of a wide variety of crops. Low pH values (acidity) indicate suitability to blueberry production, however liming may be used to neutralize soils, thereby increasing the suitability for vegetables, grains, or other crops. Drainage (ditches) may be used to lower the groundwater table to reduce soil wetness. Medium-High Value (Light Green): This area has somewhat restrictive limitation to crop cultivation. It is generally wetter than the dark green area but can be also be managed by appropriate soil drainage techniques. Medium Value (Yellow): This area is suitable to a range of crops however it differs from the rest of the site but the presence of a mix of mineral and organic soils. The soil structure may be compromised in some areas due to compaction by vehicles and/or the presence of ephemeral waterways. With some basic drainage and ongoing maintenance a range of crops may be cultivated. Low-Medium Value (Orange): Not identified Low Value (Red): These areas are characterized by driveways and/or filled areas that are unsuitable for crop production. However, livestock buildings or other farm shelters may be appropriately sited here.
Figure 4. Agricultural capability map (improved classifications)

CITY OF RICHMOND – GARDEN CITY LANDS BIOPHYSICAL INVENTORY AND ANALYSIS
22
3.1.4 Hydrology
Introduction
The GCL, being largely undeveloped, will act hydrologically different than the neighbouring parcels of land. Water enters the site from direct precipitation, no other sources (stream flow or stormwater infrastructure inputs) are known, although there may be some groundwater movement from offsite to the GCL. Water likely exits the site through infiltration, but primarily through the City of Richmond drainage network. The site covers two catchments, with the western portion of the site being in the Gilbert Road catchment, and the eastern portion of the site lying within the No. 4 Rd catchment12.
Site Investigation
A field investigation was conducted by NHC February 22, 2013 to characterize the drainage regime on the Garden City Lands. Drainage features, directions, and control structures are mapped on Figure 7. The main surface drainage features on the site are drainage ditches, stormwater catch basins, swales, and natural depressions. No subsurface investigation was completed as part of this project due to scheduling and budgetary constraints. Some minimal commentary on the hydrogeology is included in the assessment based on previously reported site investigations and inferred from surface water movement.
Perimeter Ditch A ditch runs along the south boundary of the site, parallel to Westminster Highway (see Appendix E: Photo 1a, 1b). The ditch is sloped such that the western half flows west, with a slope of approximately 0.002 m/m, and the eastern half flows east, also with a slope of approximately 0.002 m/m (City of Richmond topographic survey, January 2013). The survey shows an irregular thalweg profile likely due to the localised accumulation of debris and vegetation. The ditch has a regular triangular shape with side slopes of 2:1 H:V and a typical depth of 1.5 metres. Approximately 0.2 m of water was in the channel during the site visit. On the western edge, the ditch flows through a corrugated steel pipe (CSP) culvert, approximately 600mm in diameter (1c). Fill has been placed over the culvert to provide access to the site from Westminster Highway. Considerable debris was present at the culvert’s inlet (1c). The ditch exits the site through a 600 mm concrete culvert, located near the intersection of Westminster Highway and Garden City Road (1d). The culvert was partially obstructed by debris composed of long grass and litter (1e). There is an abrupt 1 m rise in ditch elevation upstream of the concrete culvert (1e). Near this location, water was pooling off the north side of the ditch (1f). Similarly, on the eastern edge the ditch flows into the No. 4 Road stormwater pipe. There is considerable debris blocking the entrance (1g). Once water has entered the City of Richmond stormwater system at this point, it will eventually be pumped out into the Fraser River at the No. 4 Rd. North pump station.

CITY OF RICHMOND – GARDEN CITY LANDS BIOPHYSICAL INVENTORY AND ANALYSIS
23
Table 4. Elevations near the drainage ditch (datum as per the City of Richmond survey)
Location Elevation (m)
Top of Road (Westminster Hwy.) 1.86
Highest High Watermark 1.57
High Watermark 0.97
Water Level in the Ditch 0.88
Bottom of the Ditch 0.64
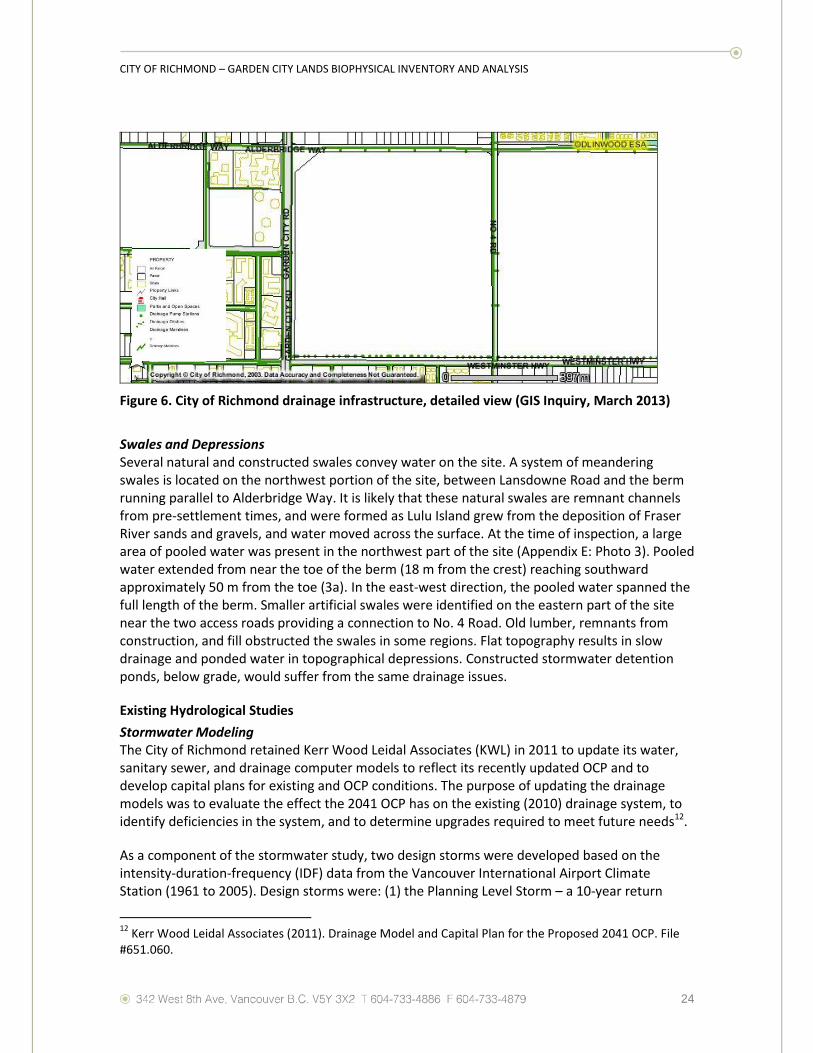
Catch Basins A series of stormwater catch basins is located along the west boundary of the site, parallel to Garden City Road. At the time of inspection, water levels in the catch basins were approximately 0.5 m below the ground surface. Many of the catch basins were partially or fully covered by long grass and sediment (Appendix C: Photos 2a, 2c). Pooled water was observed in areas near the catch basins (2b, 2d). While ten catch basins were located in total, there are likely additional ones that were not detected because they were covered by long grass and sediment. It is assumed that the catch basins connect to the major trunk of the City of Richmond drainage system running along Garden City Road and eventually feeding into the Gilbert Road North Pump Station as shown in Figure 5. However, no catch basins are shown on the City of Richmond’s drainage infrastructure mapping at this location (see Figure 6).
Figure 5. City of Richmond major system network from KWL (2011). Study area outlined in red.
CITY OF RICHMOND – GARDEN CITY LANDS BIOPHYSICAL INVENTORY AND ANALYSIS
24
Figure 6. City of Richmond drainage infrastructure, detailed view (GIS Inquiry, March 2013)
Swales and Depressions Several natural and constructed swales convey water on the site. A system of meandering swales is located on the northwest portion of the site, between Lansdowne Road and the berm running parallel to Alderbridge Way. It is likely that these natural swales are remnant channels from pre-settlement times, and were formed as Lulu Island grew from the deposition of Fraser River sands and gravels, and water moved across the surface. At the time of inspection, a large area of pooled water was present in the northwest part of the site (Appendix E: Photo 3). Pooled water extended from near the toe of the berm (18 m from the crest) reaching southward approximately 50 m from the toe (3a). In the east-west direction, the pooled water spanned the full length of the berm. Smaller artificial swales were identified on the eastern part of the site near the two access roads providing a connection to No. 4 Road. Old lumber, remnants from construction, and fill obstructed the swales in some regions. Flat topography results in slow drainage and ponded water in topographical depressions. Constructed stormwater detention ponds, below grade, would suffer from the same drainage issues.
Existing Hydrological Studies
Stormwater Modeling The City of Richmond retained Kerr Wood Leidal Associates (KWL) in 2011 to update its water, sanitary sewer, and drainage computer models to reflect its recently updated OCP and to develop capital plans for existing and OCP conditions. The purpose of updating the drainage models was to evaluate the effect the 2041 OCP has on the existing (2010) drainage system, to identify deficiencies in the system, and to determine upgrades required to meet future needs12.
As a component of the stormwater study, two design storms were developed based on the intensity-duration-frequency (IDF) data from the Vancouver International Airport Climate Station (1961 to 2005). Design storms were: (1) the Planning Level Storm – a 10-year return
12
Kerr Wood Leidal Associates (2011). Drainage Model and Capital Plan for the Proposed 2041 OCP. File #651.060.

CITY OF RICHMOND – GARDEN CITY LANDS BIOPHYSICAL INVENTORY AND ANALYSIS
25
period, 24-hour design storm based on the winter IDF data and (2) the Site Level Storm – a 10-year return period, 2-hour design storm. Both design storms are shown in Appendix F and based on the annual IDF data (Appendix G). Results from the model were based on a projected increase in impervious surfaces for various land types.
The model was run for existing drainage infrastructure under both the existing and the projected 2041 OCP land use conditions. Based on the model results using the 2041 OCP land use conditions, drainage deficiencies and required improvements were identified. Further model runs included the required improvements to the drainage system and these results were used to develop a drainage infrastructure upgrade strategy to meet the 2041 OCP needs.
Drainage system deficiencies were identified using the results from the 2041 OCP projected land use conditions. At each node (manhole), results were characterized as either surface flooding, inadequate freeboard (<0.45m), or acceptable. Based on these results, a preliminary upgrading program was established, modeled, and subsequently refined to yield acceptable water levels.
The report shows that without improvements to the drainage system, under the 2041 OCP land conditions, surface flooding is expected to occur at all the major nodes located along the North and West limits of the study area. These nodes are located along Alderbridge Way and Garden City Road. While the proposed upgrades decrease the amount of surface flooding in many areas in the City, the study area appears to experience the same level of surface flooding as without the improvements. The City of Richmond (Andy Bell, Personal Communication) noted that the City has not verified the modeling specifically for the Richmond Garden City Lands area, and that this area of the model in particular needs further investigation. Data collected as part of this current study, including the site topographic survey, should help with the model improvements.
Simplified Hydrological Analysis
The Rational Method was used to give a preliminary estimate of the anticipated surface water flows on the site during a 10-year 24-hour storm event. Given a runoff coefficient of 0.1 for flat undeveloped agricultural land and a rainfall intensity of 3 mm/hr for the 10-year 24-hour storm event (a City of Richmond planning level storm), the site is expected to receive surface water flows of about 0.05 m3/s. More detailed analyses can be undertaken using computer models available to the City of Richmond. At present, it is assumed that under saturated conditions observed during field visits, no precipitation would be infiltrated and all would enter the City of Richmond stormwater collection system.
Summary
At the time of inspection, the eastern half of the site was noticeably drier than the western half. The largest area of ponded water was in the northwest quarter of the site. Drainage appeared to exit the site (into the City’s stormwater system) via the ditch along the south perimeter and through the catch basins along the west perimeter. No concentrated sources of drainage were observed coming onto the site. Overall direction of flow off the site was westward through the catch basins and southwestward through the ditch. The southeastern quadrant of the site appears to drain through the ditch into the No. 4 Road stormwater pipe.
CITY OF RICHMOND – GARDEN CITY LANDS BIOPHYSICAL INVENTORY AND ANALYSIS
26
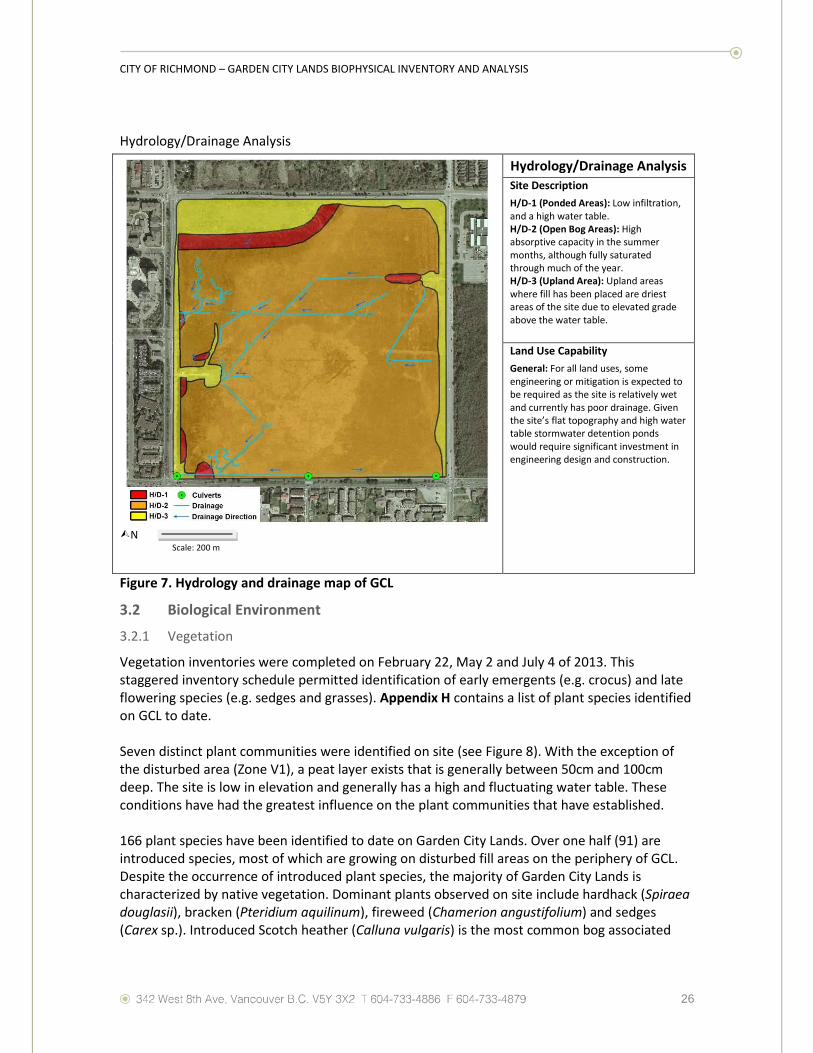
Hydrology/Drainage Analysis
N Scale: 200 m
Hydrology/Drainage Analysis
Site Description
H/D-1 (Ponded Areas): Low infiltration, and a high water table. H/D-2 (Open Bog Areas): High absorptive capacity in the summer months, although fully saturated through much of the year. H/D-3 (Upland Area): Upland areas where fill has been placed are driest areas of the site due to elevated grade above the water table.
Land Use Capability
General: For all land uses, some engineering or mitigation is expected to be required as the site is relatively wet and currently has poor drainage. Given the site’s flat topography and high water table stormwater detention ponds would require significant investment in engineering design and construction.
Figure 7. Hydrology and drainage map of GCL
3.2 Biological Environment
3.2.1 Vegetation
Vegetation inventories were completed on February 22, May 2 and July 4 of 2013. This staggered inventory schedule permitted identification of early emergents (e.g. crocus) and late flowering species (e.g. sedges and grasses). Appendix H contains a list of plant species identified on GCL to date. Seven distinct plant communities were identified on site (see Figure 8). With the exception of the disturbed area (Zone V1), a peat layer exists that is generally between 50cm and 100cm deep. The site is low in elevation and generally has a high and fluctuating water table. These conditions have had the greatest influence on the plant communities that have established. 166 plant species have been identified to date on Garden City Lands. Over one half (91) are introduced species, most of which are growing on disturbed fill areas on the periphery of GCL. Despite the occurrence of introduced plant species, the majority of Garden City Lands is characterized by native vegetation. Dominant plants observed on site include hardhack (Spiraea douglasii), bracken (Pteridium aquilinum), fireweed (Chamerion angustifolium) and sedges (Carex sp.). Introduced Scotch heather (Calluna vulgaris) is the most common bog associated

CITY OF RICHMOND – GARDEN CITY LANDS BIOPHYSICAL INVENTORY AND ANALYSIS
27
species. Note that hardhack, if left unmowed, will grow up to almost two meters and shade out most smaller plants; the grass grows almost as high. Other plants identified on GCL that are associated with ecological conditions found in bogs include cloudberry (Rubus chamaemorus), bog-rosemary (Andromeda polifolia), Labrador tea (Rhododendron groenlandicum), bog laurel (Kalmia microphylla), bog blueberry (Vaccinium uliginosum), and velvet-leaved blueberry (Vaccinium myrtilloides). Cloudberry and bog-rosemary (Andromeda polifolia) are rare plants in southwestern British Columbia. These species, along with velvet-leaved blueberry, are more northerly, boreal plants isolated in the bogs of the Lower Mainland after the Pleistocene glaciers retreated. Velvet-leaved blueberry is fairly common in the eastern portion of GCL. Cloudberry is found scattered in a few spots within the bog, and bog-rosemary was found only in one small area on the north side. All three are close to the southern extremity of their ranges for western North America. Cloudberry does not reach Washington state. It grows as far south as Burns Bog. Bog-rosemary and velvet-leaved blueberry are
extremely rare in Washington. Typically, bogs support peat mosses of the genus Sphagnum. Two species were identified in GCL. Zones V-2, V-3 and V-4 have sporadic occurrences of Spagnum pacificum, a species often associated with disturbed areas or areas with poor soils. Sphagnum capillifolium is more frequently associated with raised bog ecosystems; however, only one small hummock was identified in zone V-3. Other mosses and lichens also occur. These include Orthotrichum, Grimmia, Tortula, Bryum and Physcia. European birch is established on GCL, but has been managed by regular mowing in the past. One species of mushroom (Amanita fulva, or a closely related species) commonly associated with birch was identified. It has been suggested that the North American form may actually be a closely undescribed species and not the true A. fulva, which may be restricted to Europe. This mushroom is known to occur at Richmond Nature house, also near birch.
Zone V-1
Areas on the perimeter of GCL have been subject to historical disturbance. The largest of these areas is a fill site located in the northwest corner, which is approximately 380 m by 90 m in area. The elevation of this zone is several metres higher than surrounding land. This zone possesses the greatest plant biodiversity (i.e. the largest number of plant species). This is due to the fact that it is a zone of fill material, and almost all the plants here are introduced weedy species. Weeds are very prolific in such disturbed areas. Dominant plants are introduced grasses. Zone V1 also extends along the west and east sides of GCL on fill areas associated with construction of
Photo: velvet-leaved blueberry (Vaccinium myrtilloides)
Photo: Amanita fulva

CITY OF RICHMOND – GARDEN CITY LANDS BIOPHYSICAL INVENTORY AND ANALYSIS
28
perimeter and access roads. These include two roads (one on the east and one on the west side) that lead to former radio tower sites. One native orchid species was observed: hooded ladies’ tresses (Spiranthes romanzoffiana). Four of these plants were identified on the south side of the eastern access road. This orchid sometimes grows in disturbed sites such as those found on GCL.
Photo: Large-leaved lupine (Lupinus polyphyllus)
Photo: St. John’s wort (Hypericum perforatum)
Photo: Compass plant (Lactuca serriola)
Photo: Fill area in the northwest corner of the site (early May)
Zone V-2
This plant community is found in a freshwater marsh zone adjacent to Garden City Road. This area is associated with a high water table, which supports plant species more tolerant of hydrophilic conditions. Numerous stormwater intakes are present along Garden City Road; however, water still tends to accumulate and pool at the surface particularly during winter and spring. The most common plants are wetland monocots. This site has three distinct zones each characterized by dominant vegetation present: common rush (Juncus effusus), Sitka sedge (Carex sitchensis), and reed Canarygrass (an introduced grass).
Photo: Sitka sedge (Carex sitchensis)

CITY OF RICHMOND – GARDEN CITY LANDS BIOPHYSICAL INVENTORY AND ANALYSIS
29
Photo: This zone supports species tolerant of hydrophilic conditions such as rushes, sedges and reedcanary grass (photo taken in
early May)arealong the east perimeter of the site
Zone V-3
This plant community is found on the eastern portion of the site. Soil conditions in this area are slightly drier than zones V-2 and V-4. The peat layer is typically deeper than elsewhere. Plants associated with this area are more tolerant of acidic conditions that are typical of bog ecosystems. Introduced Scotch heather is the most dominant plant species; other less common species include hardhack, bog laurel, and salal. Regionally rare bog-rosemary, cloudberry and velvet-leaved blueberry also occur in this zone. Two other species of blueberry also occur in this zone: bog blueberry (Vaccinium uliginosum) and the introduced high bush blueberry (Vaccinium corymbosum).
Photo: Scotch heather (Calluna vulgaris)
Photo: Cloudberry (Rubus chamaemorus)
Photo: Chamisso’s cotton-grass (Eriophorum chamissonis)

CITY OF RICHMOND – GARDEN CITY LANDS BIOPHYSICAL INVENTORY AND ANALYSIS
30
Photo: Scotch heather, bog laurel, blueberry sp., and salal are common. Birch forest on DND land is evident in background. Photo taken in early May.
Zone V-4
This plant community occupies a low-lying wetland site that is dominated by sitka sedge and bracken fern.
Photo: Sitka sedge is dominant species in this zone (photo taken in early May)
Zone V-5
This zone occurs in the southwest corner of the site. Hardhack is a dominant species. Other common plant species include fireweed and bracken fern.

CITY OF RICHMOND – GARDEN CITY LANDS BIOPHYSICAL INVENTORY AND ANALYSIS
31
Photo: Fireweed and bracken fern (photo taken early May)
Zone V-6
This small zone near the center of the site contains a mix of hardhack and sitka sedge. If not mowed, hardhack will likely out-compete the sedge. Several large patches of Sphagnum pacificum occur here.
Photo: Fireweed (Chamerion angustifolium) showing an impressive display of flowers
Photo: Hardhack (Spiraea douglasii)
Photo: Bracken (Pteridium aquilinum) can grow in tall, dense patches
Photo: Sphagnum pacificum

CITY OF RICHMOND – GARDEN CITY LANDS BIOPHYSICAL INVENTORY AND ANALYSIS
32
Photo: Hardhack, sedge, bracken and sphagnum are common
Zone V-7
This zone occurs in the north-central part of GCL. Bracken fern and hardhack are dominant plant species. There is also a significant amount of velvet-leaved blueberry.
Photo: Bracken fern, hardhack, fireweed and blueberry are common
Introduced Plant Species
The Lulu Island Bog Biophysical Inventory identified introduced plant species that were significant due to their ability to alter bog ecosystems. Priority introduced species identified on GCL include:
European birch (Betula pendula) Highbush blueberry (Vaccinium corymbosum)
Photo: Skullcap mushroom (Galerina sp.)

CITY OF RICHMOND – GARDEN CITY LANDS BIOPHYSICAL INVENTORY AND ANALYSIS
33
Purple loosestrife (Lythrum salicaria) European mountain ash (Sorbus aucuparia) Japanese knotweed ( Scotch heather (Calluna vulgaris) Himalayan blackberry (Rubus discolor) Evergreen blackberry (Rubus laciniatus)
Scotch heather and highbush blueberry are the most established of these species and are restricted to the east side of GCL, closest to DND lands. European birch is common on the east side of the site; however, it has been managed by regular mowing. Evergreen blackberry occurs sporadically throughout the site. Others are found in relatively low numbers. There is a large patch of Himalayan blackberry in zone V-7. Purple loosestrife was identified in zone V-2. Japanese knotweed occurs in zone V-1 (northwest corner). Additional introduced and invasive species are identified in Appendix H, which contains a complete list of vascular plants, mosses, liverworts and lichens identified on GCL.
Succession of the Bog Plant Community
The Lulu Island Bog report speculates on the condition the plant community on Lulu Island prior to European Settlement.1 Away from the influences of the river’s edge, the bog likely consisted of mostly grasses and shrubs including hardhack, willows, Pacific crabapple, and rose. Trees growing on the bog would be scattered or in small groups. Shore pine (Pinus contorta) would likely be most common, due to its ability to grow on the wet and acidic substrate. Human influence, including drainage, agricultural development, fire and harvesting of vegetation and peat, has slowly changed the plant communities now found on the GCL, and DND and RNP lands. The greatest influence has been the drying of the bog which has changed growing conditions allowing for succession towards a plant community adapted to acidic conditions, but with a lower moisture regime. One of the most significant changes in this ecosystem has been the establishment of other trees species. Many forested areas of the original bog are now dominated by birch. Birch present in Lulu Island bog can be difficult to identify, and are often considered a hybridization of paper birch (Betula papyrifera) and European paper birch (Betula pendula). Shore pine (Pinus contorta var. contorta) which is naturally associated with bog ecosystems is present as a minor tree component. Adjacent commercial blueberry farming has resulted in the establishment of highbush blueberry. Scotch heather is another introduced species that has spread quickly in these natural areas. Garden City Lands was likely part of a transition zone between the natural bog to the east and a historical intertidal brackish marsh found to the west1. This assumption is supported by the distinct change in plant communities currently evident between the east and west sides of the site. Plant species typically associated with bog ecosystems are found on the east side of the site, closest to DND lands; native sedges occur to the west. The peat substrate, which has accumulated over centuries, is composed mainly of sedge material. The nature of many marshes has changed to support freshwater plant species due to recent dyking in Richmond, which is restricting tidal influence. Freshwater marshland on GCL is currently maintained by the high water table through much of the year.

CITY OF RICHMOND – GARDEN CITY LANDS BIOPHYSICAL INVENTORY AND ANALYSIS
34
Birch has begun to establish on GCL, but to this point has been managed with mowing. If mowing is discontinued, the eastern portion of the site will likely develop into a plant community similar to that on adjacent DND lands. Existing vegetation would grow to develop a dense shrub layer; trees (mostly birch, some pine) would regenerate to form a moderately dense stand. There are few signs of tree regeneration in the wetter, western portions of the site. The sedge community in this area is expected to persist as long as there are no changes affecting the high water table.

CITY OF RICHMOND – GARDEN CITY LANDS BIOPHYSICAL INVENTORY AND ANALYSIS
35
Vegetation Analysis
N Scale: 200 m
Vegetation Analysis
Plant Communities
V-1: Elevated fill area supporting a diversity of mostly introduced plant species, including grasses which are most dominant; no species of significance; no peat present; Could be restored to a native plant community but will require maintenance to manage invasive species. Relative Vegetation Value: Low (Red)
V-2: Area with a high water table and seasonal pools providing site conditions suitable for plant species that are more tolerant of hydrophilic conditions, including sedge, common rush and reed canarygrass; moderate plant diversity; peat depth ~60 cm. Relative Vegetation Value: Medium (Yellow)
V-3: Plants associated with this area are more tolerant of acidic conditions that are more typical of bog ecosystems; closely linked to habitat on DND lands; dominant plant species include Scotch heather, hardhack, salal, and three blueberry species; peat is deepest (~80-100cm) compared to the rest of the site; potential for partial restoration of native plant community. Relative Vegetation Value: Medium – High (Light Green)
V-4: Area with a high water table providing site conditions suitable for plant species that are more tolerant of hydrophilic conditions; poor drainage; low plant species diversity and is almost entirely dominated by a Sitka sedge; peat depth ~60 cm; restoration is restricted to hydrophilic species unless drainage is improved. Relative Vegetation Value: Low - Medium (Orange)
V-5: Moderate plant diversity; dominated by hardhack, bracken fern and fireweed; low percentage of introduced species. Relative Vegetation Value: Low - Medium (Orange)
V-6: Area contains a mix of hardhack and Sitka sedge, and larger patches of Sphagnum pacificum; low percentage of introduced species. Relative Vegetation Value: Low - Medium (Orange)
V-7: Moderate plant diversity and low percentage of introduced species; plant community includes hardhack, bracken and velvet-leaved blueberry. Some sphagnum is also evident; low percentage of introduced species. Relative Vegetation Value: Low - Medium (Orange)
Figure 8. Vegetation analysis map

CITY OF RICHMOND – GARDEN CITY LANDS BIOPHYSICAL INVENTORY AND ANALYSIS
36
3.2.2 Wildlife/Habitat
Habitat
A detailed wildlife survey was not conducted for this inventory and analysis. However, potential wildlife presence was determined based on an assessment of existing habitat quality (in addition to any incidental observations while on site). Habitat suitability refers to the current ability of an area to support a specific species. Suitability is influenced by a variety of factors including biophysical conditions, human disturbance or seasonal effects (e.g. flooding). Garden City Lands is classified as open habitat typified by grasses, sedges, rushes and shrubs. Vegetation cover is influenced by regular mowing which prevents the establishment of trees and taller shrubs. Lack of hiding cover, vertical structure (trees, taller shrubs), and coarse, woody debris habitat will affect species presence and distribution. Some species present in the area will have larger home ranges that include both the GCL and adjacent forested bog ecosystems to the east (e.g. DND lands) and north. No permanent waterbodies occur on GCL to support fish populations. Forest cover (pine, birch, bog) on DND land and Richmond Nature Park will support higher diversity of species. Although bog habitat is present on GCL, it has been subject to significant disturbance. In addition, bogs are associated with acidic conditions which may also influence species present. Winter flooding on the west side of GCL results in periods of standing water, which provides seasonal habitat for certain species. GCL is located adjacent to DND lands to the east, and is a semi-natural extension of the bog ecosystem. Maintaining large areas of natural habitat is fundamental to the preservation of healthy wildlife populations, particularly those species with large home ranges. Habitat disturbance and fragmentation resulting from human activity can affect local wildlife, particularly in urban areas. GCL cannot support a high diversity of wildlife species due to its modified condition and relatively small size; however, many birds and larger mammal species will include GCL as part of a larger range that includes natural bog habitat to the east. Connectivity between GCL and DND lands is affected by Number 4 Road which is a barrier to wildlife movement (behavioural modification, collision mortality, loss of habitat, and fenceline).
Bird Species
The number and diversity of bird species on GCL is limited due to lack of tree and taller shrub and grass cover.

CITY OF RICHMOND – GARDEN CITY LANDS BIOPHYSICAL INVENTORY AND ANALYSIS
37
Photo: Red-winged blackbird in west marsh area Photo: A common yellowthroat was calling from this lone, unmowed shrub patch on the east side of GCL
Table 5 is a summary of birds identified on GCL on May 2, 2013, as part of the biophysical survey. Barn swallow and barn owl are two species at risk identified on site. Both are on the provincial blue-list and are considered to a of special concern (formerly vulnerable). Most activity occurs in the wetlands on the west side of the GCL. Adjusting the mowing schedule outside of the breeding and nesting season, in addition to leaving some areas intact, will benefit some bird species. Forest habitat on adjacent DND land and trees on residential land to the north will provide more suitable opportunities for nesting and perching. Raptors are present in the area on a semi-permanent to permanent basis, and some will likely use open areas in the GCL for hunting. An active red-tailed hawk nest and another raptor nest of an unidentified species (likely Cooper’s hawk) are located north of GCL.
Photo: Red-winged blackbird in west marsh area Photo: A common yellowthroat was calling from this lone, unmowed shrub patch on the east side of GCL
Table 5. Bird species identified on GCL
Common Name Scientific Name Location/Comments Common yellowthroat Geothlypis trichas Wetland habitat on west side of GCL Red-winged blackbird Agelaius phoeniceus Wetland habitat on west side of GCL
European starling Sturnus vulgaris Introduced species Northwestern crow Corvus caurinus Common generalist species
Barn swallow Hirundo rustica Wetland habitat on west side of GCL Violet-green swallow Tachycineta thalassina Common throughout GCL

CITY OF RICHMOND – GARDEN CITY LANDS BIOPHYSICAL INVENTORY AND ANALYSIS
38
Song sparrow Melospiza melodia Common Killdeer Charadrius vociferus Mostly present in seasonally flooded areas in the west part
of the GCL
Northern harrier Circus cyaneus Use open areas for hunting Red-tailed hawk Buteo jamaicensis Active nest north of GCL; likely uses open areas in GCL for
hunting
American robin Turdus migratorius Uncommon; likely nests off-site White-crowned sparrow Zonotrichia leucophrys Uncommon
House sparrow Passer domesticus Introduced species Mallard Anas platyrhynchos Mostly present in seasonally flooded areas in the west part
of the GCL
A comprehensive bird survey was undertaken for the Lulu Island Bog Study. The study included DND lands and the Richmond Nature Park. In 2002-2003, eight surveys were conducted on DND lands, resulting in identification of 41 bird species. Many of these are associated with forest and wetland habitat; however, a diversity of bird species will use GCL for part or most of the year. Many of these birds are associated with open or edge habitat types. Potential species include orange-crowned warbler and rough-legged hawk.
Mammal Species
Lack of vegetative cover and other features, such as coarse, woody debris, will likely limit the diversity of mammal species that inhabit this site. Small burrowing mammals (rodents and insectivores) associated with open habitat types are most common. Small mammal burrows and runs are abundant on drier areas, particularly the north and south central zones, and the east bog component. Zones with high water table (e.g. marshlands and sedge dominated habitats) have noticeably fewer burrows. Mole hills are found in the drier, elevated disturbed fill area in the northwest corner of GCL. Other species will incorporate GCL as part of a larger home range. Forest habitat to the east will support medium to large mammal species and provide security cover and opportunities for denning. Black-tailed deer inhabit the adjacent DND lands and may use the GCL lands for forage and browsing. Coyote scat is common throughout the CGL lands indicating that this area is highly productive for hunting. Remains of small mammals were found in all coyote scat. An extensive live trapping program was conducted on the Lulu Island Bog Properties in 2004, which included Department of Defence Lands and the Richmond Nature Park. This survey confirmed presence of numerous mammal species in these areas. Table 6 contains a list of potential mammal species that may occur in GCL, in addition to species that were identified on adjacent DND/RNP land. Two squirrel species, Douglas Squirrel (Tamiasciurus douglasii) and Eastern Grey Squirrel (Sciurus carolinensis) are common in adjacent forest areas but have not been included for the GCL due to lack of tree cover. Table 6. Potential mammal species on GCL
Common Name Scientific Name Location/Comments Common Shrew Sorex cinereus Vagrant Shrew Sorex vagrans DND - P; RNP - P
Dusky Shrew Sorex monticolus DND - P; RNP - P Townsend’s Vole Microtus townsendii DND - P; RNP - P

CITY OF RICHMOND – GARDEN CITY LANDS BIOPHYSICAL INVENTORY AND ANALYSIS
39
Norway Rat Rattus norvegicus Black Rat Rattus rattus DND - P
Deer Mouse Peromyscus maniculatus DND - P; RNP - P Western Jumping Mouse Zapus princeps
Pacific Jumping Mouse Zapus trinotatus Coast Mole Scapanus orarius GCL (mounds in northwest corner)
Eastern Cottontail Sylvilagus floridanus Raccoon Procyon lotor
Striped Skunk Mephitis mephitis RNP - P Coyote Canis latrans GCL (scat identified; part of larger range)
Bats Black-tailed Deer Ococoileus hemionus columbianus DND, RNP
RNP – Richmond Nature Park; DND – Department of National Defense Lands; P – Present (Live-trapped)
Photo: Rodent burrow
Amphibian & Reptile Species
Presence of amphibian and snake species in GCL is possible, although conditions are not optimum. No amphibians were identified during the biophysical survey. Critical habitat features required by many amphibians include semi-permanent water features and wetlands. Standing water is present on the western portion of GCL for part of the winter and spring. If standing water persists long enough for breeding to occur and larval development to be completed, amphibian populations may be sustained. Drainage ditches may also support amphibians or act as movement corridors to adjacent habitat areas. Reptiles potentially present include species of garter snake. These snakes have a diverse diet that includes insects, worms, frogs, and small rodents. Some species of garter snake (Wandering Garter Snake) are more closely associated with water than others; and are likely not present on GCL. Acidic conditions related to bog conditions may have some influence on populations; however, this has not been determined. Reptile and amphibian surveys were conducted in Richmond Nature Park and adjacent DND lands as part of the Lulu Island Bog Biophysical Inventory. Eight species were identified (Table 7). No salamanders were identified during these surveys; however, they are known to occur in other bog environments, such as Burns Bog. Turtles are unlikely to occur in GCL due to absence of year round waterbodies.
Photo: Excavation of coast mole

CITY OF RICHMOND – GARDEN CITY LANDS BIOPHYSICAL INVENTORY AND ANALYSIS
40
Table 7. Reptile and amphibian species encountered in Richmond Nature Park/DND Lands (2002)
Common Name Scientific Name Location/Presence Pacific Chorus Frog Pseudacris regilla RNP - U, DND - U American Bullfrog Rana catesbeiana RNP - U, DND - U
Green Frog Rana clamitans RNP - C, DND - U Red-eared Slider Trachemys scripta RNP - U, DND - N
Painted Turtle Chrysemys picta RNP – E, DND - N Western Terrestrial (Wandering) Garter Snake
Thamnophis elegans RNP – Q, DND - Q
Northwestern Garter Snake Thamnophis ordinoides RNP - C, DND - C Common Garter Snake Thamnophis sirtalis RNP - C, DND - U
RNP – Richmond Nature Park; DND – Department of National Defense Lands; C – Common; U – Uncommon; Q – Questionable Presence; N – Not Detected; E – Extirpated
Insects
An inventory of insects was not part of the scope of this report; however, the number and variety of insects species represents a significant component of biodiversity on GCL.
Photo: This moth species appears to feed extensively on hardhack.
Photo: Bees are common on GCL; this one was observed pollinating fireweed.
3.2.3 Ecological Communities and Species at Risk
The BC Conservation Data Centre (CDC) records BC’s most vulnerable vertebrate animals, vascular plants and ecological communities. Each is assigned to a provincial Red or Blue list according to their provincial conservation status rank. Species or populations at high risk of extinction or extirpation are placed on the Red list and are candidates for formal endangered species status. Blue-listed elements are considered vulnerable to human activity and natural events. Yellow-listed species are not considered at risk.

CITY OF RICHMOND – GARDEN CITY LANDS BIOPHYSICAL INVENTORY AND ANALYSIS
41
Ecological Communities at Risk
Plant communities associated with the GCL have been significantly modified due to ongoing disturbance over many years. Plants indicative of bog ecosystems are present; however, a significant number of species are introduced. The plant community on the east side of GCL has some species associated with bog ecosystems; however, it is too disturbed to be considered functionally intact. Remnants of the Lulu Island bog ecosystem do exist on DND land. Although some site disturbance has occurred (e.g. fires, vegetation clearing, drainage, and construction) true bog communities are still represented in this area. This includes the Pinus contorta/Sphagnum plant community, which is Red-listed by the British Columbia Conservation Data Center.
Plants Species at Risk
No species at risk were identified on Garden City Lands. The Conservation Data Centre identifies four Red or Blue-listed species within five kilometres of Garden City Lands. These species are predominantly associated with riparian habitat. Additional significant plant species that were identified in the Lulu Island Bog Study, which includes DND land and the Richmond Nature Park, are listed in Table 8.
Cloudberry, bog rosemary, chamissois cotton-grass, and velvet-leaved blueberry are probably the most significant plant species found during this survey. These species are considered regionally rare in the Lower Mainland, where there is a disjunct, isolated population in some bog ecosystems. Velvet-leaved blueberry is probably an ice age relict, which managed to survive in our bogs due to lack of competition from more warmth demanding plants. It is generally found in the eastern half of British Columbia and the Lower Mainland is essentially the southern boundary of its range; one small population is known from Washington State. Cloudberry and bog rosemary are also considered more northerly species.
Table 8. Significant plant species in Lulu Island Bog
Common Name Scientific Name Provincial
Status Distance from site
northern water-meal Wolffia borealis Red <3 km pointed rush Juncus oxymeris Blue <5 km
flowering quillwort Lilaea scilloides Blue <5 km Vancouver Island Beggarticks Bidens amplissima Blue <5 km, Lulu Island
Bog rosemary Andromeda polifolia Yellow RNP Chamissois cotton-grass Eriophorum chamissonis Yellow DND
Cloudberry Rubus chamaemorus Yellow DND Few-flowered sedge Carex pauciflora Yellow DND
Velvet-leaved blueberry Vacinnium myrtilloides Yellow DND, RNP White beak-rush Rhynchospora alba Yellow DND, RNP
DND – Department of National Defense, RNP – Richmond Nature Park
Wildlife Species at Risk
At least two wildlife species at risk have been identified on GCL: the barn swallow (Hirundo rustica) and the barn owl (Tyto alba). Both of these species are blue-listed. Barn swallows were observed numerous times during the field surveys, particularly on the northwest corner of GCL. A barn owl has been recorded on GCL (part of a larger range) by the Canadian Wildlife Service.

CITY OF RICHMOND – GARDEN CITY LANDS BIOPHYSICAL INVENTORY AND ANALYSIS
42
Numerous other species at risk were identified in the Lulu Island Bog Biophysical Inventory. Although habitat on GCL has been significantly modified, it is possible that some of these species’ ranges may extend onto Garden City Lands. Lack of forest cover and permanent water features will likely restrict most species, but some birds may occur infrequently. One example is the band-tailed pigeon (Columba fasciata), which is a blue-listed species previously located in the Richmond Nature Park.
Wildlife/Habitat Analysis
Biodiversity refers to the variety of species and ecosystems and the ecological processes of which they are a part13. Addressing biodiversity conservation in environmental management and land use planning is challenging. Plants (trees, shrubs, herbs, grasses, etc) and wildlife (mammals, birds, fish, amphibians, reptiles, insects, etc) are the most recognized components of biodiversity. Despite their visibility, they represent only a small proportion of the total number of species and biomass (amount of living matter) in nature. Smaller organisms such as fungi, algae, bacteria, and invertebrates comprise most of the diversity and biomass in natural ecosystems. Identifying and inventorying the innumerable species is not practical. For the purposes of this study, the term “biodiversity” is used as a relative indicator of the abundance of these more visible species and overall habitat quality. Habitat quality can be assessed based on different measures. Naturalness refers to the degree of ecological disturbance on the landscape caused by human activity or other processes (e.g. spread of invasive species). Connectivity refers to the ability for species to move and share genes with populations in adjacent natural areas. Habitat size is also a limiting constraint. The diversity of plant species in bog ecosystems (including GCL) is naturally lower as growing conditions limit the number of species. Many plants found on site are also introduced. Wildlife abundance and diversity is limited by existing habitat and lack of cover. Habitat loss has resulted in local extirpations of some species. Some larger species once common in the Lower Mainland require home ranges much larger than what is available at present. For many remaining wildlife species, GCL is part of a larger home range that includes adjacent natural areas.
13
Minister of Supply and Services Canada. 1995. Canadian Biodiversity Strategy. http://www.biodivcanada.ca/560ED58E-0A7A-43D8-8754-C7DD12761EFA/CBS_e.pdf
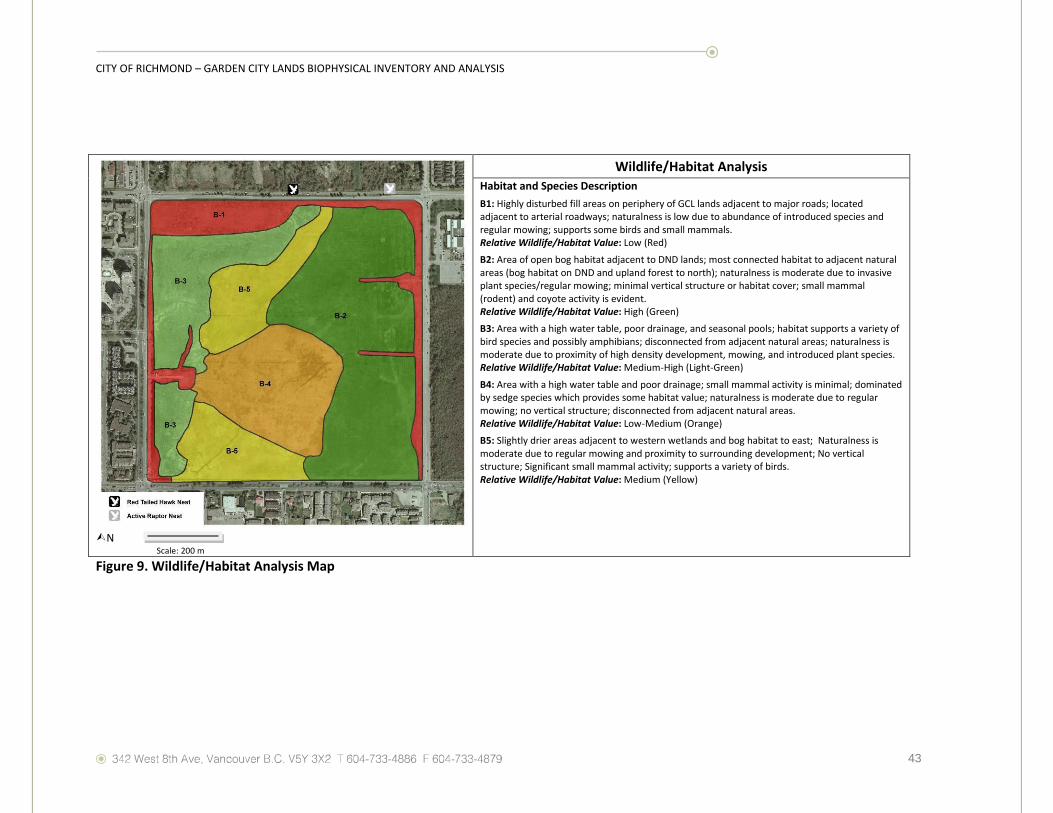
CITY OF RICHMOND – GARDEN CITY LANDS BIOPHYSICAL INVENTORY AND ANALYSIS
43
N Scale: 200 m
Wildlife/Habitat Analysis
Habitat and Species Description
B1: Highly disturbed fill areas on periphery of GCL lands adjacent to major roads; located adjacent to arterial roadways; naturalness is low due to abundance of introduced species and regular mowing; supports some birds and small mammals. Relative Wildlife/Habitat Value: Low (Red)
B2: Area of open bog habitat adjacent to DND lands; most connected habitat to adjacent natural areas (bog habitat on DND and upland forest to north); naturalness is moderate due to invasive plant species/regular mowing; minimal vertical structure or habitat cover; small mammal (rodent) and coyote activity is evident. Relative Wildlife/Habitat Value: High (Green)
B3: Area with a high water table, poor drainage, and seasonal pools; habitat supports a variety of bird species and possibly amphibians; disconnected from adjacent natural areas; naturalness is moderate due to proximity of high density development, mowing, and introduced plant species. Relative Wildlife/Habitat Value: Medium-High (Light-Green)
B4: Area with a high water table and poor drainage; small mammal activity is minimal; dominated by sedge species which provides some habitat value; naturalness is moderate due to regular mowing; no vertical structure; disconnected from adjacent natural areas. Relative Wildlife/Habitat Value: Low-Medium (Orange)
B5: Slightly drier areas adjacent to western wetlands and bog habitat to east; Naturalness is moderate due to regular mowing and proximity to surrounding development; No vertical structure; Significant small mammal activity; supports a variety of birds. Relative Wildlife/Habitat Value: Medium (Yellow)
Figure 9. Wildlife/Habitat Analysis Map

CITY OF RICHMOND – GARDEN CITY LANDS BIOPHYSICAL INVENTORY AND ANALYSIS
44
4 Potential Land Use
There are a variety of potential land uses for GCL; however, suitability, capability and feasibility must be determined to ensure the right use is matched with the appropriate site. This section describes risks, opportunities and constraints for different land uses, and other considerations (e.g. green infrastructure) to help guide future land use planning decisions. A generalized site suitability map is also provided. General considerations for land use on GCL include:
A variety of land uses are possible depending on amount of mitigation/modification desired.
More intensive land use and agricultural development will be more expensive and likely more detrimental to ecological integrity.
Different risks must be considered (e.g. climate change, flooding, human disturbance).
Some potential land uses may conflict with one another (e.g. best agricultural land is also highest value for biodiversity).
4.1 Risk Factors
4.1.1 Climate Change
Although difficult to predict, there are indications that local climate conditions and weather patterns may be changing significantly from recorded norms. Potential trends include drier, hotter summers and more frequent extreme weather events. Potential future impacts to the natural area include changes to the hydrological regime, water table and/or available soil moisture, and increased salinity resulting from saltwater intrusion under a sea level rise scenario. In addition to impacts on agriculture (crop selection, irrigation requirements, and yield), this may alter site conditions enough to affect aquatic and riparian habitat, and certain tree species and other native vegetation. Risk associated with extreme weather events, such as windstorms, may also affect individual trees and stand dynamics. Projected climate change impacts for the Metro Vancouver region are presented in Appendix J. 4.1.2 Flooding
The GCL along with all of Lulu Island lies in the Fraser River and Georgia Strait floodplains. At such, it has an associated flood hazard. In light of the City’s geographical position, the City has opted to ‘protect’ the island through a comprehensive system of dikes and related infrastructure14. This is as opposed to accommodating or retreating from the potential flood. In light of the City’s approach to the flood hazard, and given the location of the GCL near the centroid of Lulu Island, the primary constraint related to flood hazard is the requirement that any structures be built above the flood construction level, which is currently 2.9 m.15 A related opportunity, especially under a scenario of sea level rise which may be as high as 1.2 m by 2100,16 would be to showcase flood-resilient land uses. These uses might include flood resilient agricultural crops, recreational uses, and flood-resilient infrastructure.
14
Arlington Group et al 2012. Sea Level Rise Primer: A Toolkit to Build Adaptive Capacity on Canada’s South Coasts. Draft Version, May 9, 2012. 15
City of Richmond 2008. Floodplain Designation and Protection. Bylaw No. 8204 16
Ausenco Sandwell 2011. Climate Change Adaptation Guidelines for Sea Dikes and Coastal Flood Hazard Land Use (3 Volumes) Prepared for BC Ministry of Forests, Lands, and Natural Resources.

CITY OF RICHMOND – GARDEN CITY LANDS BIOPHYSICAL INVENTORY AND ANALYSIS
45
4.1.3 Human Disturbance and Habitat Modification
Human activity on or adjacent to the GCL has potential to cause significant environmental impacts:
Drainage, cultivation, and other development have already affected the ecological integrity of the bog ecosystem;
Introduction of invasive plant species is affecting plant composition;
Vegetation management (e.g. mowing) is maintaining plant communities and hindering natural succession processes;
Noise, light pollution, and other disturbances caused by vehicular and foot traffic likely have impacts on local wildlife behaviour.
Future use and development of GCL lands will likely result in additional environmental impacts. Cumulative effects should be evaluated to ensure ecological values are protected where appropriate.

CITY OF RICHMOND – GARDEN CITY LANDS BIOPHYSICAL INVENTORY AND ANALYSIS
46
4.2 Agricultural Uses and Limitations
The opportunities and constraints analysis builds on the inventory and risk factors to determine the significance and implications/limitations of identified environmental values for a range of permitted uses on ALR land. More detailed analysis of permitted agricultural uses and associated considerations is provided in Table 10. A summary of agricultural statistics for the Richmond area is provided for context in Appendix K and a discussion of potential farming governance models for the GCL is presented in Appendix L. Table 9. Opportunities and constraints for different permitted land uses on GCL
FACTOR
PERMITTED USE ON ALR
Horticulture Livestock Facilities Infrastructure Recreation/Education/
Tourism Biodiversity
Conservation Vegetable field crops Berry crops Fruit trees Nut trees Agroforestry Community Garden plots Floriculture Nursery crops
Livestock production Equestrian centre/
stable Pet
breeding/kennel Finfish aquaculture
in ponds Finfish aquaculture
in tanks
Greenhouses Mushroom facility Livestock structures Production/storage
facility Compost facility
Drainage/irrigation/stormwater detention ponds Trails Boardwalks Roads Parking stalls/lots Power/hydroelectricity
Agri-tourism (including a Farmers Market Stand) Passive recreation Research facility Educational
programming Heritage preservation Winery/cidery
Habitat restoration Wildlife refuge Nature park
General Lack of existing trees, shrubs, and other large vegetation make agroforestry impractical. Nearby farms on similar soils
grow blueberries, cranberries, and some vegetable crops.
Animal husbandry practices generally require an on-site year-round caretaker. All livestock will require shelter and fencing at a minimum.
Greenhouses and production/storage facilities would extend the growing season and create value-added opportunities for agricultural products created on site, thereby increasing potential revenues.
The use of the site for community garden plots, a farmers market, educational programming, and/or a research facility may require parking spaces and power.
According to the ALR regulations, any building footprint for the purposes of recreation/education/ tourism must be <100 m2
Existing species diversity and naturalness is low to moderate. Most areas have potential to improve habitat quality through rest-oration. Habitat enhancement and maintaining connect-ivity is critical.
Drainage/ Hydrology
Infrastructure required to lower water table (drainage tiles, ditches) (H) Infrastructure required for
efficient irrigation during growing season (H) Any infrastructure changes
Access to drinking water required for livestock (H) Access to large
amounts of freshwater required to
Facilities may require potable water, sewage systems (H). Compost facilities will
need to be sited in an area that has adequate drainage so
The addition of any impervious surfaces (roads, parking stalls) will increase rainfall runoff onto the site; this might be mitigated through BMPs for stormwater (M). Installation of subsurface
Facilities may require potable water, sewage system (H) Any facilities will impact
the imperviousness of the soil, and will likely increase runoff from the
Distribution and longevity of seasonal pools influenced by existing drainage and infrastructure (L) Plant communities
and natural

CITY OF RICHMOND – GARDEN CITY LANDS BIOPHYSICAL INVENTORY AND ANALYSIS
47
(drainage or irrigation) will impact the status quo of the stormwater system. Additional studies (model runs) should be completed to ensure that this would not impact the pumping requirements at either the No. 4 Road North or Gilbert Road North Pump Stations. (M)
establish and run finfish aquaculture operations (H) Any infrastructure
changes (freshwater imported to the site will also have to be cleaned and drained) will impact the status quo of the stormwater and /or sewerage system. Additional studies (model runs) should be completed to ensure that this would not impact the pumping requirements at either the No. 4 Road North or Gilbert Road North Pump Stations. (M)
that water ponding is avoided (M) Any facilities will
impact the imperviousness of the soil, and will likely increase runoff from the site into the City’s stormwater system, unless mitigated. (M)
drainage systems (tiles) and/or drainage ditches within the site and along the boundary of the site will improve the site from a structural perspective by drawing the watertable down (H). Any infrastructure changes
(drainage or irrigation) will impact the status quo of the stormwater system. Additional studies (model runs) should be completed to ensure that this would not impact the pumping requirements at either the No. 4 Road North or Gilbert Road North Pump Stations. (M) Stormwater detention ponds
are likely impractical at this site due to the need to keep groundwater and surface water separate for water quality and aesthetics. In addition, a water source would be required during the summer months to maintain the ponds. However, with significant engineering, stormwater detention ponds may be possible.
site into the City’s stormwater system, unless mitigated. (M)
succession directly influenced by the hydrology on site (H) Presence of year
round water features would increase biodiversity (M) Diversity of species
increases with a combination of drier and wetter sites (L)
Soil Organic (peat) soils have specific soil nutrient management requirements (M) Mineral soils may require
subsoiling (M) Soil pH is acidic, therefore
liming will be necessary for most crops. Blueberries thrive in acidic soil
conditions. Potential lead contamination
is soil resulting from use of GCL as former DND rifle range (L)
Organic (peat) soils are spongy and structure may deteriorate if used for pasture of large numbers of horses, cows, pigs, sheep, or goats (M)
The sponginess of the peat soils creates a fair amount of subsidence when placing any structural buildings on the site. Proper engineering techniques will be required if any structures are built (H).
Proper engineering techniques will need to be followed for development of any roads or parking stalls/lots. It is likely that fill would need to be placed to assist with subsidence of peat soils (H)
Research topics could centre on cultivation of crops in a peat soil/bog environment (L)
Acidic soil conditions limits plant diversity and may affect abundance and distribution of some wildlife species (L)

CITY OF RICHMOND – GARDEN CITY LANDS BIOPHYSICAL INVENTORY AND ANALYSIS
48
Vegetation Introduced/invasive plant species may outcompete crop plants and affect soil composition (M)
Most abundant native plants are typically not grazed or are considered poor forage (e.g. hardhack); sedge is considered fair to good forage before maturity (L) Invasive reedcanary
grass good forage species in spring, summer (L) Plants including
Labrador tea toxic to livestock (L) Livestock likely to
spread invasive species (M)
Vegetation removal will be required for development of facilities (M)
Vegetation removal will be required for the development of trails, roads, or parking stalls/lots (M)
Research/education could focus on the vegetation communities associated with the bog ecosystem (L) Interpretive possibilities
(e.g. nature trail) in bog community on east side and ponded areas on west side (H)
Introduced/invasive plant species can outcompete native plant species affecting biodiversity (H)
Wildlife Risk from exposure to insect pests (L) and predation of crops by birds and rodents; however, netting and other techniques can be used to minimize this risk (M) May be a lack of pollinators in
the local vicinity (L) Conversion of existing natural
habitat to cropland (M)
Risk of predation, especially poultry by coyotes (L)
Construction of buildings and storage facilities may attract rodents (L) Habitat loss (M) Noise and light
pollution may affect wildlife behaviour (L)
Risk of wildlife mortality resulting from increased vehicle traffic (L) Habitat loss resulting from
construction of new infrastructure (L) Upgrades or changes to
stormwater infrastructure may impact seasonal pools and affect wildlife populations (L)
Increased disturbance between human/pet and wildlife. (L)
Regular mowing results in lack of plant cover and structural diversity (e.g. tall shrubs, trees). This limits habitat potential (H) Retaining connectivity
to adjacent natural areas important for species diversity (M)
ESAs Drainage and cultivation of (a portion of) the bog would be required for crop cultivation (M). Altering the water table would
affect growing conditions in adjacent natural areas (M)
Animal manure would need to be managed property to ensure runoff is not entering waterways (M).
Engineering specifications may require some of the peat bog to be excavated prior to building any structures (M)
Setbacks from waterways would be required (L) Introduction of overland
pollutants and deleterious substances (M)
Opportunity for some bog restoration and enhancement (H) Opportunity for
research into use of urban bogs for stormwater management (H)
Conservation of natural habitat supports wildlife populations in adjacent natural areas (M)
Climate Change
Warmer, drier summers and wetter, milder winters expected which may affect crop selection and irrigation requirements (L)
Livestock produce GHGs which contributes to climate change (L)
Structures require energy for heating and lighting (L)
Any infrastructure changes that impact the stormwater system should be reviewed in light of climate change. Additional investigations and model runs
Loss of seasonal pools may affect popula-tions of local wildlife (e.g. amphibians, waterfowl) (L)

CITY OF RICHMOND – GARDEN CITY LANDS BIOPHYSICAL INVENTORY AND ANALYSIS
49
Sea level rise may, over time, result in salt intrusion, which would impact the capability of the soils. (M)
(MIKE URBAN model) should be completed with consideration of the change to land use and anticipated changes in climate. (M)
Change in plant species composition, including introduction of new plants, may affect biodiversity (L)
Other Potential access restrictions for farm equipment (M) Buried cables, old foundations,
and debris scattered throughout site (L) Vandalism and theft (L-M)
Dog kennels and/or pet breeding may not be an appropriate use given the proximity of the site to residential areas and the inherent noise associated with these operations (L) Disturbance and
harassment to livestock (L-M)
The portion of the site already covered by sand and gravel fill (NW corner) is suitable for facility development (H) Vandalism and theft
(L)
Potential conflicts between City traffic and farm equipment on major roads (M) Vandalism and theft (L)
Given the climate requirements and long term production timeline associated with wine grapes, a winery/cidery may not be the most suitable option for the site. Research and education
could be conducted simultaneously by opening up a portion of the site to an incubator farm program (or similar), as has been done at Terra Nova.
Importance Factor: L (Low), M (Medium), H (High)

CITY OF RICHMOND – GARDEN CITY LANDS BIOPHYSICAL INVENTORY AND ANALYSIS
50
4.3 Agricultural Land Use: Suitability, Capability, Feasibility
Table 10 provides suitability rankings, considerations, and relative cost of implementation for different permitted uses of agricultural land. Only uses allowed by the Agricultural Land Commission for the Agricultural Land Reserve are listed. Relative cost of implementation assumes subsurface drainage will be installed. Table 10. Suitability of Permitted Uses for the Agricultural Land Reserve on the Garden City Lands
Crop Production
Crop
Suitability Ranking
Considerations Relative Cost of Implementation
Root Vegetables (potato, onion, carrot, radish,
beets)
High
Soil pH will require amending (liming) and soils will require drainage;
Annual soil fertility testing and nutrient program recommended;
Liming, fertilizer, seeds;
May require addition/mixing of mineral soils into peat for improved structure.
Medium-Low
Green Vegetables
(Lettuce, celery, cabbage,
broccoli, spinach, herbs)
High
Soil pH will require amending (liming) and soils will require drainage;
Annual soil fertility testing and nutrient program;
Liming, fertilizer, seeds;
May require addition/mixing of mineral soils into peat for improved structure.
Medium-Low
Blueberries High
Likes peat’s acidic soils but will require drainage and annual soil fertility testing;
Pest control required;
Predation from birds and small mammals will need to be mitigated through netting, sprinklers, or other deterrents;
Some liming, fertilizer;
Blueberry plants may be expensive (depending on age at time of purchase);
Total set up costs approx. $30,000/acre or $1.2 million for 40 acres.
Medium-High

CITY OF RICHMOND – GARDEN CITY LANDS BIOPHYSICAL INVENTORY AND ANALYSIS
51
Strawberries High
Soil pH will require amending (liming) and soils will require drainage;
Annual soil fertility testing and nutrient program recommended;
Liming, fertilizer, plants;
Raised beds or hills may be required for production to be feasible;
Will require netting or other bird deterrents;
Basic capital investment similar to blueberries.
Medium
Peas Moderate
Susceptible to frost, soils too acidic;
Liming, fertilizer, seeds;
May require addition/mixing of mineral soils into peat for improved structure;
Raised beds may be required for production to be feasible.
Medium-Low
Corn Moderate
Requires deep water table;
Summers may not be warm enough for adequate production;
Liming, fertilizer, seeds;
May require addition/mixing of mineral soils into peat for improved structure.
Medium-Low
Cereal grains Moderate
Requires deep water table;
Liming, fertilizer, seeds;
May require addition/mixing of mineral soils into peat for improved structure.
Medium-Low
Pumpkins, zucchini, squash
Moderate
Susceptible to frost, soils too acidic and will need amending;
Liming, fertilizer, seeds;
May require addition/mixing of mineral soil into peat to improve structure;
Raised beds may be required for production to be feasible.
Medium-Low
Cranberries Moderate
Likes wet conditions but requires flooding, therefore water input requirements may be too high and will require sophisticated dyke and ditch development for the site;
Likes slightly acidic soils;
Enhanced drainage and flooding infrastructure;
Cost of plants may be high.
High
Raspberries Moderate
Prefers sandy soils and requires high nitrogen inputs;
Liming, fertilizer, plants;
May require addition/mixing of mineral soil into peat to improve structure;
Will require netting or other bird deterrents.
Medium

CITY OF RICHMOND – GARDEN CITY LANDS BIOPHYSICAL INVENTORY AND ANALYSIS
52
Field flowers Moderate
Perennials may suffer in high water tables – most flowers do not tolerate water logging;
Soil pH will require amending – peat has been known to burn the roots of bulb flowers;
Growing flowers in raised beds may help boost production;
Susceptible to predation by slugs;
Liming, fertilizer, plants;
May require addition/mixing of mineral soils into peat for improved structure;
Raised beds may be required for production to be feasible.
Medium
Tomato Low Highly susceptible to frost – moist peatlands are known to frost over more
often than mineral soils during the spring and fall months;
Summer months may not be warm enough for field tomatoes.
Low-Medium
Peppers Low Highly susceptible to frost – moist peatlands are known to frost over more
often than mineral soils during the spring and fall months;
Summer months may not be warm enough for field peppers.
Low-Medium
Eggplant Low Highly susceptible to frost – moist peatlands are known to frost over more
often than mineral soils during the spring and fall months;
Summer months may not be warm enough for field eggplant.
Low-Medium
Melon Low Highly susceptible to frost – moist peatlands are known to frost over more
often than mineral soils during the spring and fall months;
Summer months may not be warm enough for melons.
Low-Medium
Fruit trees (orchards)
Low Takes many years to establish and requires a very low water table;
Requires deep mineral soils for deep rooting requirements.
Hives and colonies.
High
Grape vines (winery)
Low
Takes many years to establish and requires a very low water table;
Climate is too wet and summers not hot enough for most grape varieties to produce well;
Susceptible to frost – moist peatlands are known to frost over more often than mineral soils during the spring and fall months.
High

CITY OF RICHMOND – GARDEN CITY LANDS BIOPHYSICAL INVENTORY AND ANALYSIS
53
Livestock Production
Livestock
Suitability Ranking
Considerations Relative Cost of Implementation
Honey bees High Hives and colonies;
Will benefit agricultural and non-agricultural plants through increased presence of pollinators.
Medium-low
Poultry (broilers, layers, turkeys)
Moderate
Egg quota will need to be purchased if more than 99 layers are housed on site.
Risk of possible predation by wildlife is high (coyotes, hawks, etc);
Caretaker will be required on site 24/7 for animal well-being and to prevent theft and/or vandalism;
Coops, shelters, fencing, drinking water, heating;
Costs of purchasing birds;
Odour and dust emissions (may affect agricultural crops)
Cost of purchasing egg quota if necessary.
Medium
Large animals: Horses
Low
Caretaker will be required on site 24/7 for animal well-being and to prevent theft and/or vandalism;
Development of fencing, stables, riding rings;
May require trail development;
Drinking water, heating for shelters;
Will require grass, hay, alfalfa, or other forage crops for grazing;
Odour;
Costs of purchasing animals.
High

CITY OF RICHMOND – GARDEN CITY LANDS BIOPHYSICAL INVENTORY AND ANALYSIS
54
Large animals: Cattle (dairy and/or beef)
Low
Quota system will need to be purchased for dairy production;
Approximately 25 acres of grass/hay production is typically required for an average herd of dairy cattle. This provides food for the animals and adequate land for manure application;
Caretaker will be required on site 24/7 for animal well-being and to prevent theft and/or vandalism;
Fencing, barns;
Drinking water, heating for shelters;
Will require grass, hay, alfalfa, or other forage crops for grazing;
Costs of purchasing animals;
Odour;
Cost of purchasing quota if necessary.
High
Medium sized animals: Pigs, sheep, goats
Low
Predation by wildlife (coyotes) is possible;
Contamination of waterways by manure is possible unless composting and management techniques are employed;
Caretaker will be required on site 24/7 for animal well-being and to prevent theft and/or vandalism;
Fencing, barns;
Drinking water, heating for shelters;
Will require grass, hay, alfalfa, or other forage crops for grazing;
Odour;
Costs of purchasing animals.
High
Other animals: Llamas, alpacas,
emus, deer Low
Predation by wildlife (coyotes) is possible;
Caretaker will be required on site 24/7 for animal well-being and to prevent theft and/or vandalism;
Fencing, barns;
Drinking water, heating for shelters;
Will require grass, hay, alfalfa, or other forage crops for grazing;
Odour;
Costs of purchasing animals.
High
Land-based finfish
aquaculture Low
The size and weight of tanks could impact subsidence of peat, therefore excavation and fill will likely be required;
Large amounts of fresh water will be required to be pumped to the site to run the operation, which may be cost-prohibitive;
Caretaker will be required on site 24/7 to prevent theft and/or vandalism;
Tank infrastructure set up and development;
Fish stocking costs.
High

CITY OF RICHMOND – GARDEN CITY LANDS BIOPHYSICAL INVENTORY AND ANALYSIS
55
Greenhouses
Structure Suitability Ranking
Considerations Relative Cost of Implementation
Hoop houses High
Greens, strawberries, and a variety of starter plants;
Fertilizer demands and green waste produced may be high, depending on crops grown;
Ideally a caretaker will be on site 24/7 to prevent theft and/or vandalism;
Set up and maintenance costs;
Irrigation infrastructure may be required.
Medium-Low
Poly houses Moderate
Ideal crops include: greens, strawberries, nursery stock, vine vegetables (tomatoes, cucumbers, peppers), and/or flowers;
Fertilizer demands and green waste produced may be high, depending on crops grown;
Ideally a caretaker will be on site 24/7 to prevent theft and/or vandalism;
Set up and maintenance costs;
Excavation and fill may be required;
Heating and irrigation infrastructure required;
Waste management/composting systems may be required.
Medium-High
Glass houses Low
Ideal crops include: nursery stock, vine vegetables (tomatoes, cucumbers, peppers), and/or flowers;
High yield production may be in excess of seasonal market demand;
Glass house floors may be soil-based (organic production) or concrete;
Caretaker will be required on site 24/7 to prevent theft and/or vandalism;
High tech glass greenhouses and associated infrastructure can cost approximately $1 million per acre;
Excavation and fill required;
Heating and irrigation infrastructure required;
Waste management/composting systems required
Very High

CITY OF RICHMOND – GARDEN CITY LANDS BIOPHYSICAL INVENTORY AND ANALYSIS
56
Other Uses Permitted on Agricultural Land
Use
Suitability Ranking
Considerations Relative Cost of Implementation
Farm retail sales
High
A farm stand could be located on site and could offer products grown on the site for sale;
Staffing the booth may be required to reduce theft and vandalism;
Electricity and water servicing;
Parking will likely be required;
Medium
Agri-tourism High
Integration of site-based agriculture, education, and/or recreation could result in successful agri-tourism initiatives such as tours, slow food hikes/cycles, culinary events, and local food celebrations (Feast of Fields, etc.);
Electricity and water servicing required;
Parking will likely be required.
Medium
Biodiversity conservation,
passive recreation,
heritage, wildlife and
scenery viewing
purposes
High
The area occupied by associated buildings and structures must not exceed 100 m
2 unless otherwise approved by the Agricultural Land Commission;
Habitat restoration may be required, incl. invasive species management;
Trail/boardwalk construction;
Interpretive signage;
Parking;
Monitoring for vandalism and dumping.
Medium-Low
Use of an open land park
High
This is similar to the status quo;
Continued servicing (mowing) will likely be required;
Parking and other required infrastructure;
Monitoring for vandalism and dumping.
Low

CITY OF RICHMOND – GARDEN CITY LANDS BIOPHYSICAL INVENTORY AND ANALYSIS
57
Botanical garden
High
Hoop housing required to grow nursery stock;
On-site water, energy, and waste systems will need to be considered;
Heating and irrigation infrastructure required;
Parking will likely be required;
Medium
Education and research
High
Opportunities exist for partnerships with local and regional education institutions;
The area occupied by associated buildings and structures must not exceed 100 m
2 unless otherwise approved by the Agricultural Land Commission;
Electricity and water servicing;
Parking will likely be required.
Medium
Storing, packing,
preparing, or processing
Moderate
Truck/large vehicle access will need to be considered;
Excavation and fill of the building site will be required;
On-site water, energy, and waste systems will need to be considered;
Parking stalls will likely be required;
Electricity and other servicing will be required;
High
Large scale compost
operations Moderate
Location may not be suitable due to proximity to residential and commercial areas and the inherent noise and odour involved in large scale composting operations;
Truck/large vehicle access will need to be considered;
Excavation and fill of the building site will be required;
On-site water, energy, and waste systems will need to be considered;
Parking stalls will likely be required;
Electricity and other servicing will be required;
High

CITY OF RICHMOND – GARDEN CITY LANDS BIOPHYSICAL INVENTORY AND ANALYSIS
58
Production and development
of biological products used
in Integrated Pest
Management programs
Moderate
Requirements for infrastructure depend on scale of the IPM operations;
Breeding specific insects may or may not be beneficial to nearby farms;
Electricity and water servicing;
Parking will likely be required.
Medium
Mushroom operations
Low
Caretaker will be required on site 24/7 to prevent theft and/or vandalism;
Truck/large vehicle access will need to be considered;
Excavation and fill of the building site will be required;
On-site water, energy, and waste systems will need to be considered;
Parking stalls will likely be required;
Electricity and other servicing will be required;
High
Petting zoo Low
Predation by wildlife (coyotes) is possible;
Contamination of waterways by manure is possible unless composting and management techniques are employed;
Caretaker will be required on site 24/7 for animal well-being and to prevent theft and/or vandalism;
Application to ALC for non-farm use may be required;
Fencing and barns;
Drinking water, heating for shelters;
Will require grass, hay, alfalfa, or other forage crops for grazing;
Costs of purchasing animals;
Electricity and water servicing;
Parking will likely be required.
High
Pet breeding and/or kennel
Low
Location is not suitable due to proximity to residential and commercial areas and the inherent noise involved in kennel and breeding operations;
Caretaker will be required on site 24/7 for animal well-being and to prevent theft and/or vandalism;
On-site water, energy, and waste systems;
Parking stalls will likely be required;
Electricity and other servicing will be required.
Medium

CITY OF RICHMOND – GARDEN CITY LANDS BIOPHYSICAL INVENTORY AND ANALYSIS
59
Winery/cidery Low
The climatic and soil conditions of the GCL site are not conducive to growing grapes, therefore an associated winery/cidery is not appropriate;
Excavation and fill of the building site will be required;
On-site water, energy, and waste systems will need to be considered;
Parking stalls will likely be required;
Electricity and other servicing will be required.
High
Agroforestry, nut and tree
orchards. Low
Lack of trees on site make agroforestry initiatives unsuitable for the GCL;
Peat soils are not conducive for fruit or nut tree orchards due to high water tables, lack of deep rooting zone, subsidence over time, and soil acidity;
Trees will take many years to mature before being productive.
Subsoiling and liming required;
Excavation possibly required to increase rooting depth;
Purchasing and planting trees;
Maintenance.
High
Land application of
compost and/or
biosolids
Low
Location may not be suitable due to proximity to residential and commercial areas and the inherent noise and odour involved in large scale applications of biosolids and/or compost;
Potential impacts on the bog ecosystem and/or waterways may also be a concern;
Truck/large vehicle access will need to be considered;
Equipment purchasing.
Medium-low

CITY OF RICHMOND – GARDEN CITY LANDS BIOPHYSICAL INVENTORY AND ANALYSIS
60
4.4 Green Infrastructure
Green infrastructure can refer to the engineered structures (e.g. green buildings, stormwater detention ponds, bioswales) that mimic natural processes or a network of interconnected natural areas and corridors that maintain important ecological functions and provide benefits to people and wildlife. GCL provides opportunities to incorporate both aspects to achieve a variety of co-benefits. 4.4.1 Green Infrastructure (Engineered)
Low Impact Development The City of Richmond's OCP promotes green infrastructure and low impact development across the municipality. The goal of this type of construction is to mitigate the impact of any development on the natural environment, and in some instances improve the status quo, through increased infiltration from green roofs, and pervious structures that decrease stormwater runoff and improve water quality for example. Given the three preferred themed uses for the site: Community Wellness and Enabling Healthy Lifestyles, Urban Agriculture, and Environmental Sustainability, clearly a low impact development strategy should be practiced. Stormwater Detention Stormwater detention ponds are one proposed use for the GCL lands. Stormwater detention is clearly a valuable potential use for the site given the significant pumping infrastructure used by the City to drain Lulu Island. Any low-technology infrastructure, like stormwater detention ponds, that reduces pumping requirements would be beneficial to the City. The City has previously constructed stormwater detention ponds at Garden City Park (in 2005). Onsite stormwater detention, to either capture water from the site or from surrounding land parcels, is likely impractical at this site, without significant infrastructure and cost. The water table is at or near grade throughout the winter months, when stormwater detention is needed. This condition means that any ponds would have to be built above grade (using dike structures). Dikes constructed on the peat and sand/silt soils would sink over time, and would therefore have to be engineered for these conditions at great cost. Also, dikes require a significant land base to meet basic design standards of 3:1 H:V side slopes; therefore, even a small 1 metre high dike may need to be as much as 9 m wide. Given the ecological values in some parts of the GCL, there may be a need to protect the groundwater from contaminants found within the stormwater runoff with an impermeable membrane, ultimately defeating the purpose of the ponds, which would ideally infiltrate to ground. Furthermore, the ponds would require a non-groundwater source of water throughout the year to maintain water quality and aesthetics. Because there are no natural streams on the GCL lands, irrigation would be required using the City’s water system (at great cost). Further direction on stormwater practices should be available in the upcoming City Integrated Stormwater Management Plan. This may provide further guidance as to whether the obstacles to this type of land use (significant cost, groundwater/surface water separation, long-term maintenance cost) may be outweighed by the benefits (as per conversation with City Engineering Department).

CITY OF RICHMOND – GARDEN CITY LANDS BIOPHYSICAL INVENTORY AND ANALYSIS
61
4.4.2 Green Infrastructure (Natural)
The City supports creation of an Ecological Network to promote ecosystem services, connectivity and green infrastructure. GCL provides a significant opportunity to develop a major GIN (Green Infrastructure Network) ‘hub’ that will complement site and neighbourhood planning, and help meet other objectives including conservation, recreation, and infrastructure improvements. Hubs are larger natural or semi-natural areas that provide important wildlife habitat and additional ecological and recreational benefits for people. Corridors provide linkages between hubs and smaller ‘sites’ to increase connectivity and facilitate movement between patches. Figure 10 identifies a proposed network based on the opportunities and constraints identified on GCL as part of the biophysical inventory and analysis, and OCP conceptual maps showing neighbourhood links, greenways, and parks. Primary linkages are to DND lands/Richmond Nature Park to the east and another north to the upland forest. The priority for these linkages is conservation; although some passive recreation (e.g. trails) is appropriate particularly for the north corridor. Naturalization of primary linkages should be emphasized. Strategies may include ecological restoration and enhancement, removal of movement barriers, traffic calming, and minimizing human disturbance and activity. Secondary linkages are to the west and south. These linkages have a combined recreation/conservation purpose. Corridors should be wide enough to provide a comfortable buffer from surrounding uses and retain sufficient habitat for wildlife movement. Incorporating some seasonal ponds on the west side of GCL should be considered. Trails and boardwalks can be constructed to appropriate standards to support active transportation and other passive recreation pursuits. Opportunities for nature interpretation should also be pursued.

CITY OF RICHMOND – GARDEN CITY LANDS BIOPHYSICAL INVENTORY AND ANALYSIS
62
LEGEND N
Figure 10. Potential green infrastructure for GCL

CITY OF RICHMOND – GARDEN CITY LANDS BIOPHYSICAL INVENTORY AND ANALYSIS
63
4.5 Land Use
GCL is a large area that can accommodate a variety of land uses. However, different factors must be considered to determine what and where. This assessment of conservation and development options is primarily based on the vegetation, agricultural capability, hydrological/drainage and wildlife/habitat values and the opportunities/constraints analysis. These analyses provide a good indication of the suitability and capability of the land to support a particular land use, and the types of trade-offs required to optimize land use. Suitability refers to the current ability of the land to accommodate a particular land use. Capability refers to the potential ability of land, generally following certain management actions (e.g. soil modification). Access, existing infrastructure, adjacent land uses, urban design, safety, and potential disturbances are other considerations that will influence land use. Figure 11 provides a generalized site suitability map for potential land uses, by general classification based on the biophysical inventory and analysis. This conceptual map is for example purposes only.
N Scale: 200 m
Potential Land Use/Rationale LU-1 (Biodiversity Conservation): These areas have the highest wildlife and habitat value on GCL. Bog habitat on the east side is semi-contiguous with DND lands on east side (fragmented by No.4 Road). Wetland on the west side of GCL provides good habitat for a diversity of bird species. Both areas have a relatively high diversity of native vegetation, including significant plants. Additionally, these areas provide a natural buffer between residential areas and interior agriculture area (LU-3). Restoration potential is good.
LU-2 (Recreation, Tourism, Education): These areas provide good opportunities to meet mutual objectives for biodiversity conservation, agriculture, and recreation. Potential for agri-tourism may be explored, particularly in the northeast corner where less drainage is required. These sites are ideally located close to residential zones, roads, and conservation areas. They also provide important linkages to local/regional green infrastructure network.
LU-3 (Agriculture): All of GCL (with the exception of fill areas) is rated relatively high value for agriculture when soil is improved. Land is capable of supporting many different crop types with few restrictions; however, some mitigation (e.g. draining) will be required. Livestock is not recommended. The area identified as LU-3 has lower wildlife and habitat value than elsewhere on site, and is very suitable for agricultural use. This area is buffered on three sides by other land uses.
LU-4 (Facilities): These are upland historical fill areas that are already pre-loaded for site development (e.g. buildings, infrastructure). There is existing road access to these areas. The largest of these areas is in the northwest corner of the property, closest to the adjacent commercial district.
LU-5 (Infrastructure): Site drainage is generally directed to this location. Potential for a stormwater detention pond may be explored; however, hydrological limitations described in this report must be considered.
Figure 11. Potential land use

CITY OF RICHMOND – GARDEN CITY LANDS BIOPHYSICAL INVENTORY AND ANALYSIS
64
5 Conservation and Agriculture Considerations
This section provides a more detailed discussion of the limitations for conservation and agriculture on GCL. Potential strategies for mitigation are provided.
5.1 Conservation
Prior to European settlement, the GCL supported a plant community that occupied a transitional zone between the Lulu Island bog to the east and a large tidal influenced wetland to the west1. The east side of GCL provides the best opportunity for conservation of bog habitat, based on its current vegetative condition. This area supports the greatest diversity of native bog plant species and the deepest peat accumulations found on site. Habitat value is also high due to connectivity to DND lands and the upland forested community to the north. Naturalization and ecological restoration is encouraged to improve habitat value and function of this bog ecosystem. Marshland on the west side of GCL also provides good opportunity for conservation due to the unique habitat it provides to a variety of bird species. Significant drainage would be required in this area to accommodate other land uses. Ecological restoration and enhancement can improve habitat value and ecosystem function and support establishment of green infrastructure, parks, trails and other recreation amenities. Restoration also allows us to benefit from the “free” services that functional ecosystems provide. For example, urban forests and wetlands can reduce infrastructure and maintenance costs for stormwater management, increase property values and improve quality of life. Passive restoration is one option for the site. Passive restoration means ceasing activities that cause disturbance and allowing natural regeneration to take place. This is a low cost option that can provide tangible benefits. One of the most significant disturbance agents on GCL is mowing. If mowing is discontinued and this area is left to grow naturally, it is expected that plant communities will develop similar to those on DND land. Birch is most likely to establish and dominate the tree canopy. Shore pine, which is naturally associated with bog ecosystems, may be present as a minor species. The understory shrub community will develop to provide significant ground cover supporting a variety of bird and other wildlife species. Alternatively, more active restoration efforts could be enacted, particularly in areas with the highest habitat value (east and west sides of GCL). Active restoration efforts are higher cost and more labour intensive; however, they are often necessary to achieve certain objectives (such as control of invasive species).The east portion of the site could be managed to prevent further establishment of species not native to the original bog ecosystem. Introduced Scotch heather is already pervasive in this area, and is likely not a feasible candidate for removal. European Birch could be managed (cutting or pulling) to maintain more open native bog habitat. Shore pine could be planted in small groups with open shrub communities between. Maintenance of this type of system would require ongoing effort; however, it would provide an opportunity for interpretation of native bog ecosystems and related restoration efforts.
5.2 Agricultural Activity in Peat Soils
In their natural state peat bogs are unsuitable for crop production because they are acidic, have low nutrient levels, and are saturated with water. However, these conditions can be overcome with proper

CITY OF RICHMOND – GARDEN CITY LANDS BIOPHYSICAL INVENTORY AND ANALYSIS
65
development and management for agriculture. Furthermore, many of the peat's physical properties benefit crop productivity. Some of the beneficial properties include lack of stones, high porosity and water holding capacity, good aeration when drained, and a structure that favours root penetration and mechanical cultivation with limited resistance17. To produce a high yielding, healthy crop, peat soil should be managed in a way that:
Maintains or improves the ability of water to move in (infiltration) and through the peat (drainage), or from the soil surface (evapotranspiration).
Maintains or improves the plant's ability to grow a good root system and take up nutrients (water table and pH control).
Provides adequate soil aeration.
Minimizes compaction, erosion and crusting of the soil. The following discussion provides context regarding some limitations to farming in peat soils and provides examples of best practices to minimize restrictions to crop cultivation in the GCL. 5.2.1 Subsidence and Compaction
Once a peat bog is cultivated, decomposition is accelerated and the volume of peat will decrease over time. The result is subsidence, or a decrease in the depth or thickness of the peat soil. The rate of subsidence is determined by the decomposition rate and the loss of soil from the surface. Although berries and vegetables can be grown on peat soils that are less than 1 m (3 feet) deep, it is best to have greater depth to facilitate drainage. An average subsidence rate of 2.5 cm (1 inch) per year was measured at a cultivated farm in Sainte-Clotilde, Quebec after 35 years of cultivation.18 In southwestern Quebec mesisols, subsidence rate was found to be 5 to 8 cm per year during the first 6 to 8 years after development, but stabilized near 1 cm per year after 50 years. Maintaining high water tables and flooding reduces subsidence but these practices can be risky for water sensitive crops or when agricultural production occurs during the early spring or fall. Saturated soils are susceptible to damage from traffic and tillage, leaves the soil surface susceptible to structural degradation, and damages the roots of vegetable crops, sometimes causing plant death19. Farming equipment (tractors, ATVs, tillers) can also cause compaction problems arising from trafficking on wet peat soils; therefore the selection of appropriate equipment will be required. Compaction leads to reduced air and water movement, and eventually restricted workability of the soil. A four wheel drive tractor with dual tires on the front and back is adequate under most conditions. Tractors equipped with tracks and ATVs (all- terrain-vehicles) can be used to reduce pressure applied at the soil surface from wheels. Much of the soil damage occurs when vehicles are turning. Cultivation should not be attempted when soils are wet because puddling and excessive compaction is likely to occur with heavy machinery. Fall and winter cover crops are beneficial to prevent puddling by winter precipitation.
17
Eastern Canada Soil and Water Conservation Centre (ECSWCC), 1997. Management and Conservation Practices for Vegetable Production on Peat Soils. 18
Eastern Canada Soil and Water Conservation Centre (ECSWCC), 1997. Management and Conservation Practices for Vegetable Production on Peat Soils. 19
BC Ministry of Agriculture, 2012. Vegetable Production Guide - Beneficial Management Practices for Commercial Growers in British Columbia. http://productionguide.agrifoodbc.ca/guides/17

CITY OF RICHMOND – GARDEN CITY LANDS BIOPHYSICAL INVENTORY AND ANALYSIS
66
The use of minimum tillage equipment or no-till practices is suggested as one means of reducing compaction and subsidence20. Excess tillage should be avoided because it can dry the soil surface and accelerate the decomposition of the peat. Tillage with any implement and particularly rotary cultivators, such as rotovators, increases the breakdown of peat soils, and a compacted crust forms on top, thereby inhibiting seedling emergence. As the soil becomes more compacted, its ability to drain is further reduced causing wetter conditions at the soil surface, which may, in turn, cause more compaction. To slow the transition to a more decomposed and more compacted peat it is therefore important to avoid over draining, over tilling, and over fertilizing once the bog has been cultivated. The sponginess of peat soils also means that any farm buildings (barns, stables, greenhouses, other structures) will need to be situated in a location that has had the peat excavated and fill placed on site in order to create a solid foundation and meet proper engineering specifications. All building plans should be developed in consultation with a hydrologist and engineer. Parking areas should also be created in areas that have had proper fill placed on the site. 5.2.2 Agricultural Drainage
Peat bogs develop because there is an excess of water within the landscape due to climate (i.e. high precipitation and cool temperatures) and restricted drainage, therefore without management there will be excess soil moisture from an agricultural point of view. The downward movement of water is restricted because of the high water table and limited to evaporation from the soil surface, transpiration from the plants, evapotranspiration due to wind, and lateral movement within the bog or to outlets. Poor drainage is most damaging to perennial crops during wet winter months but annuals can also be affected. Effects of poor drainage include21:
Restriction of root growth
Poor seed germination
Uneven maturity
Reduction of soil aeration
Reduction of nitrification
Calcium, nitrogen, and other nutrients are leached from soil by fluctuating water table
The water table at the GCL is high nearly year round. Lulu Island is dyked against floods from the river and storm surges. The primary drainage systems are open canals or box culverts. Pump stations are also located at the extremity of the north-south gravity drainage canals. At low tide, water may simply drain by gravity through the ditches, canals, and other water conveyance mechanisms. At high tides and during peak flows, however, pumping mechanisms are required to get the water into the Fraser River22. Additional site drainage is therefore required to remove water from the peat soils of the GCL and lower the water table. Minimal requirements will include a perimeter ditch surrounding the agricultural site
20
BC Ministry of Agriculture, 2012. Vegetable Production Guide - Beneficial Management Practices for Commercial Growers in British Columbia. http://productionguide.agrifoodbc.ca/guides/17. 21
Luttmerding, H.A. and P.N. Sprout, 1969. Soil Survey of Delta and Richmond Municipalities. Preliminary report No. 10 of the Lower Fraser Valley Soil Survey. Soils Division, BC Department of Agriculture, Kelowna, BC. 22
City of Richmond, 2002. Agricultural Profile of the City of Richmond: Section 3.0 Human modifications to the Agricultural Lands. http://www.richmond.ca/__shared/assets/section36306.pdf

CITY OF RICHMOND – GARDEN CITY LANDS BIOPHYSICAL INVENTORY AND ANALYSIS
67
(this already exists on the south side of the GCL site) and lateral ditches which cross the area within the perimeter ditch. These ditches will be connected to a drainage outlet. The general recommended spacing of lateral ditches is at 1 m (3 feet) deep and 10 - 15 m (30 - 45 feet) apart.23However, lateral ditches define the working width of the fields; therefore they must be compatible with the equipment available for tillage, spraying, etc. Secondary or subsurface drainage is recommended to enhance the flow of water from the peat to the open ditches. Mole drainage is the most efficient drainage operation in humic peats. Mole drains are preferred over tile drains due primarily to the high cost of the plastic tile and because it is very expensive to replace tile drains if they fill with sediments, lose their grade with subsidence, or become too close to the surface as the bog subsides. By comparison, mole drains can be re-established with relative ease. However, in order for secondary drainage (mole drains) to work effectively the primary drainage system would need to be maintained to ensure the water table does not block the mole drains.
5.2.3 Irrigation
Despite the need for adequate drainage, in the summer months many farms require irrigation. The City serves the irrigation needs of the agricultural sector through much of the same infrastructure it uses for general drainage24. Irrigation opportunities for farming on the GCL site are available from a trunk line that runs westward from Garden City Road and a trunk line that runs along No. 4 road from south of Steveston Hwy flowing north to a drainage discharge structure on the north arm of the Fraser River25,26. Irrigation water can also be obtained from drainage ditches and on-site water storage (rainwater tanks). Irrigation water taken from pumped wells is not recommended because it is likely be to saline, especially after extended periods of pumping.
5.2.4 Climate Change and Agriculture
Farmers are accustomed to the weather influencing their activities and weather-dependent decisions are a part of farming life. Adapting to climate change, however, involves a more systematic assessment and response. Agriculture is highly vulnerable to changes in climatic conditions and even small shifts could have significant consequences for farm viability and food production.
Although there is general consensus regarding the potential impacts of climate change, how these might impact specific microclimates is uncertain. Some possible effects are summarized in the table below. Potential climate change impacts to the Metro Vancouver region are presented in Appendix J. Sea level rise is also of primary concern. Over the next 100 years, as sea levels rise, soil salinity and flooding may become limitations to farming on the GCL site. Salinity is measured by the electrical conductivity of the soil. As measured during the site visit in February 2013, all soil samples indicated non-saline conditions in the rooting zone. However many of the soils in Richmond are weakly to moderately saline at depths of 1.2 metres or more. This is a result of sea water entering the deep soil
23
City of Richmond, 2002. Agricultural Profile of the City of Richmond: Section 3.0 Human modifications to the Agricultural Lands. http://www.richmond.ca/__shared/assets/section36306.pdf. 24
City of Richmond, 2003. Richmond’s Agricultural Viability Report. 25
City of Richmond, 2003. Richmond’s Agricultural Viability Report. 26
Agricultural Land Commission, 2009. Garden City Lands Exclusion Application decision report.

CITY OF RICHMOND – GARDEN CITY LANDS BIOPHYSICAL INVENTORY AND ANALYSIS
68
profiles27. Since the rooting zone is not affected there is essentially no risk to crop production at the present time.
Table 11. Potential climate change impacts on agriculture
Climate Change Condition Potential Agricultural Impacts
Changing hydrological regime, decrease in summer precipitation
Decrease in productivity and quality of crops and livestock under water stress, increased costs, reduction in water supply (at times of high demand), increase in management complexity
Increasing precipitation and variability of precipitation (especially in spring & fall)
Interruptions to planting, input applications and harvesting, increase in excessive moisture and site-specific flood risk, increase in pressure on drainage and water management, interruptions to pollination, decrease in light levels, increase in nutrient and input leaching, increase in management complexity
Changing crop suitability ranges Inconsistent productivity, quality & therefore prices; increase in suitability for new varieties of forage and field vegetable crops, increase in suitability of new crops
Changes in pests and diseases Increase in winter survival rates, increase in number of cycles in a year, introduction of new pests and diseases, increase in management costs, complexity, uncertainty, increase in delays or prevention of pollination
Increase in extreme weather events (storms, wind, extreme heat)
Decrease in productivity and quality, increase in building maintenance and damage costs, decrease in heating costs, increase in cooling and ventilation costs, interruptions to regional infrastructure and supply lines
Climate change impacts to other growing regions
Increase in feed or other input costs, increase in demand for food production/local food
Increase in sea level (and related natural subsidence of Lulu Island)
Will raise the water table, possible into the rooting zone. Salinity of the groundwater may also increase.
5.2.5 Environmental Considerations for Agriculture in the GCL
Draining, tilling and fertilizing accelerate the decomposition process of peat soils resulting in increased carbon dioxide being released to the atmosphere. However, undrained peatlands produce methane which may have a greater impact than the total contribution of all the carbon gases from the area once it is drained28. Water quality may be affected if excess nutrients are applied to the crops. The initial development of a peatland soil may require high rates of fertilizer and therefore risk to water quality may be highest in the
27
Luttmerding, H.A. and P.N. Sprout, 1969. Soil Survey of Delta and Richmond Municipalities. Preliminary report No. 10 of the Lower Fraser Valley Soil Survey. Soils Division, BC Department of Agriculture, Kelowna, BC. 28
Eastern Canada Soil and Water Conservation Centre (ECSWCC), 1997. Management and Conservation Practices for Vegetable Production on Peat Soils.

CITY OF RICHMOND – GARDEN CITY LANDS BIOPHYSICAL INVENTORY AND ANALYSIS
69
first few growing seasons. This risk can be minimized by following a fertility program based on regular soil testing and using fall and winter cover crops. Erosion can be a risk when cultivating peat soils. The removal of surface vegetation may result in exposed peat particles leaving the bog and being transported into the drainage system. This can be minimized by avoiding tilling the soil unless necessary. There are three basic conservation practices which can be employed to minimize the impacts of agricultural operations within peat bogs:
Do not over drain.
Do not over till.
Do not over fertilize. 5.2.6 Caretaker Housing
The use of GCL for agricultural purposes may require an on-site caretaker to oversee production, especially if livestock or high-value infrastructure (e.g. greenhouses) are involved. Even if only crop production (horticulture) is pursued, a caretaker can help to minimize vandalism and theft concerns and allow for more direct communication with members of the public. Current zoning allows for a possibility of having an on-farm caretaker living on the property year-round in a mobile home or other non-permanent structure. However, sewage hook-ups, hydro, and other servicing requirements would need to be carefully considered. This would provide additional security and around-the-clock “eyes on the farm.” A summary of potential farming governance models, some of which address farm worker and/or caretaker housing, are presented in Appendix L. 5.2.7 Linkages with Existing Programs
Partnerships and a range of governance models may occur with a number of different community groups, organizations, institutions and agencies. Over the last six years, the City has established partnerships with non-profit societies such as the Sharing Farm Society, Richmond Schoolyard Society and Richmond Food Security Society who are running successful and innovative programs in Richmond. Many of these programs are located in Terra Nova Rural Park and at the Gilbert Road Nursery site as well as a number of community gardens throughout the city. Kwantlen Polytechnic University Farm School will be working with the City on providing new incubator farming opportunities in other areas in city. A new program Bachelor in Applied Science in Sustainable Agriculture was recently established by the University and may provide opportunities for partnerships in the future.

CITY OF RICHMOND – GARDEN CITY LANDS BIOPHYSICAL INVENTORY AND ANALYSIS
70
5.3 Status Quo – Do Nothing
One option that may be considered is the status quo. Current management practices (including regular mowing) may be continued, in addition to passive recreation activities on the site. Status quo management will likely continue to see encroachment of introduced and invasive plant species, with corresponding reduction in native plant cover. Populations of wildlife species currently present will likely persist; although continued drainage and potential climate change scenarios (e.g. warmer, drier summers) may affect water table and persistence of aquatic features.

CITY OF RICHMOND – GARDEN CITY LANDS BIOPHYSICAL INVENTORY AND ANALYSIS
71
Appendix A – Resources
The following resources were consulted to identify and evaluate biophysical components and other values (e.g. environmental, agricultural) associated with GCL:
Agriculture and Agri-Food Canada (AAFC), 1998. The Canadian System of Soil Classification, 3rd Edition. http://sis.agr.gc.ca/cansis/taxa/cssc3/intro.html
Agricultural Land Commission, 2009. Exclusion application – Garden City Lands, ALC File #O-38099. Decision, February 12, 2009.
Agricultural Land Commission, 2010. Agriculture Capability Detailed Description: Explanatory Notes. http://www.alc.gov.bc.ca/alr/Ag_Cap_Details.htm
Arlington Group et al 2012. Sea Level Rise Primer: A Toolkit to Build Adaptive Capacity on Canada’s South Coasts. Draft Version, May 9, 2012.
Ausenco Sandwell 2011. Climate Change Adaptation Guidelines for Sea Dikes and Coastal Flood Hazard Land Use (3 Volumes) Prepared for BC Ministry of Forests, Lands, and Natural Resources.
BC Ministry of Agriculture, 2012. Vegetable Production Guide - Beneficial Management Practices for Commercial Growers in British Columbia. http://productionguide.agrifoodbc.ca/guides/17
BC Ministry of Agriculture and Food and BC Ministry of Environment, 1983. Land Capability Classification for Agriculture in British Columbia. MoE Manual 1. ISSN 0821-0640.
BC Ministry of Agriculture. “Ag in Brief” reports (BC MAL, 2008) and more detailed “Agricultural Overview” reports (BC MAL, 2008).
BC Ministry of Environment. Conservation Data Centre: http://www.env.gov.bc.ca/cdc/
BC Ministry of Environment. Habitat Wizard: http://www.env.gov.bc.ca/habwiz/
BC Ministry of Environment. Inventory Methods for Small Mammals: Shrews, Voles, Mice & Rats – Standards for Components of British Columbia’s Biodiversity No. 31
Bertrand, R.A., Hughes-Games, G.A., and Nikkel, D.C., 1991. Soil Management Handbook for the Lower Fraser Valley. 2nd Edition. BC Ministry of Agriculture, Fisheries, and Food.
Boyle, C.A., L. Lavkulich, H. Schreier & E. Kiss. 1997. Changes in Land Cover and Subsequent Effects on Lower Fraser Basin Ecosystems from 1827 to 1990. Environmental Management, 21(2), 185-196
City of Richmond, 2003. Richmond’s Agricultural Viability Report.
http://www.richmond.ca/__shared/assets/viability_strategy6314.pdf
City of Richmond, 2002. Agricultural Profile of the City of Richmond: Section 3.0 Human modifications to the Agricultural Lands. http://www.richmond.ca/__shared/assets/section36306.pdf
City of Richmond. 2012. Official Community Plan.
City of Richmond 2008. Floodplain Designation and Protection. Bylaw No. 8204
Dan Schroeter Consulting Inc., 2008. Agricultural assessment of the CLC Lands, 5555 No. 4 Road, Richmond. Prepared for Pottinger Gaherty Environmental Consultants Ltd.
Davis, Neil and Rose Klinkenberg (editors). 2008. A Biophysical Inventory and Evaluation of the Lulu Island Bog, Richmond, British Columbia. Richmond Nature Park Society, Richmond, British Columbia.

CITY OF RICHMOND – GARDEN CITY LANDS BIOPHYSICAL INVENTORY AND ANALYSIS
72
Department of Regional Economic Expansion, 1969. Canada Land Inventory. Soil Capability Classification for Agriculture. Report No. 2. http://geogratis.cgdi.gc.ca/CLI/frames.html
Eastern Canada Soil and Water Conservation Centre (ECSWCC), 1997. Management and Conservation Practices for Vegetable Production on Peat Soils.
Environment Canada. Feb 4, 2013. Canadian Climate Normals – Richmond Nature Park. Retrieved March 7, 2013. http://climate.weatheroffice.gc.ca/climate_normals/results_e.html?stnID=837&lang=e&dCode=0&province=BC&provBut=Search&month1=0&month2=12 Environment Canada. Species at Risk (SARA) public registry: http://www.sararegistry.gc.ca/default_e.cfm
Environment Canada. 2013. Definition of wetlands. Retrieved July 12, 2013. http://www.ec.gc.ca/tho-wlo/default.asp?lang=En&n=B4669525-1#_definitions
Kenk, E. and M.W. Sondheim, 1987. The BC Ministry of Environment and Parks Thematic Mapping Geographic Information System. CAPAMP. Volume 1: Data entry and validation procedures for soil, agriculture capability, surficial geology and the all-purpose entity. MOEP Manual 10. Surveys and Resource Mapping Branch, Ministry of Environment and Parks.
Kerr Wood Leidal Associates (2011). Drainage Model and Capital Plan for the Proposed 2041 OCP. File #651.060.
Luttmerding, H.A., 1980. Soils of the Langley-Vancouver Map Area. RAB Bulletin 18. Volume 1: Soil Map Mosaics and Legend, Lower Fraser Valley (Scale 1:25,000). Report No. 15 British Columbia Soil Survey. Ministry of Environment, Province of British Columbia, Kelowna, BC. ISSN 0375-5886.
Luttmerding, H.A., 1981. Soils of the Langley-Vancouver Map Area. RAB Bulletin 18. Volume 3: Description of the Soils. Report No. 15 British Columbia Soil Survey. Ministry of Environment, Province of British Columbia, Kelowna, BC. ISSN 0375-5886.
Luttmerding, H.A., and P.N. Sprout, 1969. Soil Survey of Delta and Richmond Municipalities. Preliminary Report No. 10 of the Lower Fraser Valley Soil Survey. http://sis.agr.gc.ca/cansis/publications/surveys/bc/bc10_pre/bc10_pre_report.pdf
Metro Vancouver. 2011. Regional Land use Designations. Retrieved March 12, 2013. http://www.metrovancouver.org/planning/development/strategy/LandUseDesignationMapsJan11/Map2RegionalLandUseDesignationsLarge.pdf
Metro Vancouver. 2011. Ecological Health Action Plan. Retrieved May 10, 2013. http://www.metrovancouver.org/planning/development/ecologicalhealth/EcologicalHealthDocs/ECOHealthActionPlan_Nov2011.pdf
Minister of Supply and Services Canada. 1995. Canadian Biodiversity Strategy. http://www.biodivcanada.ca/560ED58E-0A7A-43D8-8754-C7DD12761EFA/CBS_e.pdf
Ontario Ministry of Agriculture, Food, and Rural Affairs. Factsheet: Management of Organic Soils. http://www.omafra.gov.on.ca/english/crops/facts/93-053.htm
Wilson, Sara J. 2010. Natural Capital in BC’s Lower Mainland: Valuing the Benefits from Nature. David Suzuki Foundation.

CITY OF RICHMOND – GARDEN CITY LANDS BIOPHYSICAL INVENTORY AND ANALYSIS
73
Appendix B –Peat Depth Measurements
Figure 12. Peat depth sample locations
Table 12. Peat depth
Peat Depth Plots
Transect 1 Peat Depth (cm) Transect 2 Peat Depth (cm) Transect 3 Peat Depth (cm) 1 60 28 70 29 60 2 60 27 65 30 50
3 60 26 55 31 55 4 55 25 60 32 60
5 60 24 65 33 55 6 50 23 70 34 55
7 55 22 70 35 55 8 60 21 80 36 50
9 65 20 80 37 70 10 65 19 95 38 70
11 55 18 105 39 65 12 90 17 110 40 75
13 95 16 90 41 65 14 0 (fill area) 15 0 (fill area) 42 0 (fill area)

CITY OF RICHMOND – GARDEN CITY LANDS BIOPHYSICAL INVENTORY AND ANALYSIS
74
Appendix C – Soil Sample Plot Locations
Figure 13. Soil Sample Plot Locations
Table 13. Soil sample plots
Soil Sample # Longitude Latitude Field Notes
1 49" 10' 30" N 123" 7' 14" W Dry to moist, adjacent to a wet area.
2 49" 10' 17" N 123" 7' 16" W Moist, peaty, good soil.
3 49" 10' 15" N 123" 6' 53" W Rich, dry, peaty. Ferns, salal, woody plants.
4 49" 10' 23" N 123" 7' 5" W Moist to wet, grassy.
5 49" 10' 31" N 123" 6' 58 " W Dry to moist, peaty.

CITY OF RICHMOND – GARDEN CITY LANDS BIOPHYSICAL INVENTORY AND ANALYSIS
75
Agricultural Site 1
Agricultural Site 2
Agricultural Site 3

CITY OF RICHMOND – GARDEN CITY LANDS BIOPHYSICAL INVENTORY AND ANALYSIS
76
Agricultural Site 4
Agricultural Site 5

CITY OF RICHMOND – GARDEN CITY LANDS BIOPHYSICAL INVENTORY AND ANALYSIS
77
Appendix D – Soil Analysis
Particle Analysis
Sample #
> 2.0 mm
< 2.0 mm
Sands Fines Ammonia-N Nitrate-N pH
Electrical Conductivity
% % % % ppm ppm mmhos/cm
1 - 100 0.1 8.7 72 12 3.7 0.34
2 - 100 0.5 15.2 64 6.3 4.1 0.39
3 - 100 0.5 13.2 56 5.8 3.5 0.41
4 - 100 0.4 9.4 72 1.9 3.6 0.39
5 - 100 0.7 6.1 48 0.2 3.6 0.36
Available nutrients
Sample # Organic Matter
Total Nitrogen
Phosphorus (P)
Potassium (K) Calcium (Ca)
Magnesium (Mg)
Copper (Cu) Zinc (Zn)
Iron (Fe)
Manganese (Mn) Boron (B)
% % ppm ppm ppm ppm ppm ppm ppm ppm ppm
1 91.2 0.99 24 149 1750 1325 1.5 8.4 88 8 0.7
2 84.3 1.67 38 275 2125 725 9.5 50 225 91 0.6
3 86.3 1.37 21 188 1125 438 3.9 22 138 15 <0.1
4 90.2 1.71 38 275 1000 513 2.8 13 200 14 0.2
5 93.2 1.21 10 195 1125 325 3.6 30 88 18 0.7

CITY OF RICHMOND – GARDEN CITY LANDS BIOPHYSICAL INVENTORY AND ANALYSIS
78
Appendix E – Hydrology Photos Photo 1. Drainage ditch and culverts
a) Drainage ditch looking east b) Drainage ditch looking west
c) Steel culvert
d) Concrete culvert
e) Headcut upstream of concrete culvert
f) Pooling water from ditch

CITY OF RICHMOND – GARDEN CITY LANDS BIOPHYSICAL INVENTORY AND ANALYSIS
79
g) View looking south of ditch entering City Stormwater system

CITY OF RICHMOND – GARDEN CITY LANDS BIOPHYSICAL INVENTORY AND ANALYSIS
80
Photo 2. Stormwater catch basins
a) Catch basin partially covered by grass and sediment b) Ponded water near catch basins south of access road
to Garden City Road
c) Ponded water near catch basins
d) Ponded water just south of access road to Garden
City Road

CITY OF RICHMOND – GARDEN CITY LANDS BIOPHYSICAL INVENTORY AND ANALYSIS
81
Photo 3. Ponded water in the northwestern region near the berm
a) Extent of the ponded water from the south edge
looking north towards the berm b) Looking east
c) Looking west
d) East of the berm looking west along Alderbridge Way

CITY OF RICHMOND – GARDEN CITY LANDS BIOPHYSICAL INVENTORY AND ANALYSIS
82
Appendix F - Design Storm Events from KWL (2011)

CITY OF RICHMOND – GARDEN CITY LANDS BIOPHYSICAL INVENTORY AND ANALYSIS
83
Appendix G - IDF curve from Environment Canada

CITY OF RICHMOND – GARDEN CITY LANDS BIOPHYSICAL INVENTORY AND ANALYSIS
84
Appendix H - Vegetation
Vascular Plants Zone Scientific Name Common Name V1 V2 V3 V4 V5 V6 V7
Achillea millefolium yarrow y Aegopodium podagraria* goutweed y Agrostis capillaris (A. tenuis)* colonial bentgrass y Aira praecox* early hairgrass y Alopecurus pratensis* meadow meadow-foxtail y Amelanchier lamarckii* juneberry y Andromeda polifolia bog-rosemary y Anthoxanthum odoratum* sweet vernalgrass y y Arctostaphylos uva-ursi kinnikinnick y Barbarea orthoceras American winter cress Y Barbarea vulgaris* bitter winter cress y Betula pendula* European birch y y y y Bidens sp.* beggarticks y Bromus hordeaceus (B. mollis)* soft bromegrass y Calluna vulgaris* Scotch heather VH y Cardamine hirsute* hairy bitter-cress y Carex laeviculmis smooth-stemmed sedge y Carex sitchensis Sitka sedge H y VH y H Carex sp. a sedge y Cerastium fontanum ssp. triviale.* mouse-ear chickweed y Cerastium glomeratum* sticky chickweed y Cirsium arvense var. horridum* Canada thistle y Cirsium vulgare* bull thistle y Crataegus douglasii var. suksdorfii black hawthorn y Crocus vernus* crocus y Cytisus scoparius* broom Dactylis glomerata* orchard grass y Digitalis purpurea* foxglove y y y Dipsacus fullonum ssp. sylvestris* Fuller’s teasel y Distichlis spicata seashore saltgrass y Draba verna* common draba y Elymus repens (Agropyron repens)* quackgrass y Epilobium angustifolium fireweed y y M L Epilobium ciliatum purple leaved willowherb y y Equisetum arvense field horsetail y y Equisetum hyemale scouring-rush y y Equisetum telmateia ssp. braunii giant horsetail y y Eriophorum chamissonis Chamisso’s cotton-grass y Euphrasia nemorosa (E. officinalis)* eyebright y Festuca pratensis* meadow fescue grass y Galanthus nivalis* snowdrop y Galium aparine cleavers y y Y Gaultheria shallon salal VL y Glecoma hederacea* ground-ivy y Geranium molle* dovefoot geranium y Hieracium lachenalii (H. vulgatum)* European hawkweed y y Y Hieracium umbellatum ssp. umbellatum
narrow-leaved hawkweed y y
Holcus lanatus* velvetgrass y Hyacinthoides hispanica (Endymion hispanicus)*
Spanish bluebells y

CITY OF RICHMOND – GARDEN CITY LANDS BIOPHYSICAL INVENTORY AND ANALYSIS
85
Hypericum perforatum* St. John’s wort y y Hypochaeris radicata* hairy cat’s ear y Iris pseudacorus* yellow flag iris y Juncus bufonius toad rush y Juncus effusus common rush H y VL Kalmia microphylla ssp. occidentalis western bog-laurel y Lactuca biennis* tall blue lettuce y y Lactuca serriola* compass plant y Lamium purpureum * purple dead-nettle y Lapsana communis* nipplewort Y Ledum groenlandicum (Rhododendron groenlandicum)
Labrador tea y
Leontodon autumnalis* autumn hawkbit y Lepidium heterophyllum* Smith’s pepper-grass y Leucanthemum vulgare* (Chrysanthemum leucanthemum)
ox-eye daisy y
Lolium arundinaceum (Festuca arundinacea)*
tall fescue y
Lolium perenne* perennial ryegrass y Lupinus polyphyllus large-leaved lupine y Luzula subsessilis
+ n/a
Lythrum salicaria* purple loosestrife y y Mahonia aquifolium (Berberis aquifolium)
tall Oregon-grape y
Maianthemum dilatatum+ false lily of the valley
Malus fusca Pacific crab apple y Malus pumila* domestic apple y y Malva moschata* musk mallow y Matricaria discoidea (M. matricarioides)*
pineapple weed y
Medicago lupulina* black medic y Medicago sativa ssp. sativa* alfalfa y Melilotus alba* white sweet-clover y Myosotis discolor* yellow forget-me-not y Y Narcissus poeticus* poet’s narcissus y Narcissus pseudonarcissus* daffodil y Oxycoccus macrocarpus* (Vaccinium macrocarpon)
cultivated cranberry y
Phalaris arundinacea* reed canarygrass y H y Phleum pretense* timothygrass y Plantago lanceolata* ribwort plantain y Plantago major* plantain y Poa annua* annual bluegrass y Poa bulbosa ssp. vivipara* bulbous bluegrass y Poa compressa Canada bluegrass y Poa pratensis* Kentucky bluegrass y Polygonum cuspidatum* Japanese knotweed y Populus balsamifera ssp. trichocarpa black cottonwood y Prunella vulgaris ssp. vulgaris* self-heal y Pteridium aquilinum ssp. lanuginosum bracken fern y y y H Quercus rubra* red oak y Ranunculus acris* meadow buttercup y Ranunculus repens* creeping buttercup y Rosa sp. rose y y Rubus allegheniensis* common blackberry Y Rubus chamaemorus cloudberry y y

CITY OF RICHMOND – GARDEN CITY LANDS BIOPHYSICAL INVENTORY AND ANALYSIS
86
Rubus discolor (R. armeniacus)* Himalayan blackberry y Rubus laciniatus* evergreen blackberry y y Rubus ursinus ssp. macropetalus trailing blackberry y Rumex acetosella* sheep sorrel y y y y Y Rumex obtusifolius bitter dock y Salix hookeriana Hooker’s willow y y Scirpus atrocinctus (S. cyperinus) wool-grass y Solanum dulcamara* European bittersweet y Solidago canadensis goldenrod y Sonchus oleraceus* common sow-thistle y Y Sorbus aucuparia* European mountain ash y Y Sparganium emersum emersed bur-reed y Spiraea douglasii hardhack y L y L VH H H Spiranthes romanzoffiana hooded ladies’ tresses y Stellaria media* chickweed y Symphytum x uplandicum* hybrid comfrey y Tanacetum vulgare* tansy y Taraxacum officinale* dandelion y y Teesdalia nudicaulis* shepherd’s cress y Trientalis europaea ssp. arctica* Arctic starflower y y Trifolium campestre (T. procumbens)* low hop-clover y Trifolium dubium* small hop-clover y Trifolium hybridum* alsike clover y Trifolium pratense* red clover y Trifolium repens* white clover y Ulmus sp.* elm y Vaccinium corymbosum* high bush blueberry y y Vaccinium myrtilloides velvet-leaved blueberry L y VL Vaccinium uliginosum bog blueberry y Veronica arvensis* wall speedwell y Vicia cracca ssp. cracca* tufted vetch y Vicia hirsuta* tiny vetch y Vicia sativa* common vetch y
Vulpia myuros (Festuca myuros rattail fescuegrass y
Mosses, liverworts, and lichens
Aulacomnium androgynum lover’s moss y y Aulacomnium palustre glow moss y y Brachythecium sp. short capsule moss y y y y y Bryum capillare a moss y Calliergonella cuspidata spear moss y Campylopus fragilis a moss y Ceratodon purpureus red roof moss y y Cladina portentosa (Cladonia portentosa)
coastal reindeer lichen y
Cladonia fimbriata trumpet lichen y Cladonia furcata fork lichen y Cladonia gracilis slender cup lichen y Cladonia macilenta pin lichen y Cladonia squamosa dragon lichen y Coccomyxa sp. a green alga y Dicranum scoparium broom moss y y Y Grimmia pulvinata a moss y Kindbergia praelonga slender beaked moss y Orthotrichum consimile a moss y Orthotrichum diaphanum* a moss y Orthotrichum lyellii Lyell’s bristle moss y

CITY OF RICHMOND – GARDEN CITY LANDS BIOPHYSICAL INVENTORY AND ANALYSIS
87
Physcia sp. rosette lichen y Pleurozium schreberi big redstem moss y Pohlia nutans y Polytrichum commune common hair cap moss y y Polytrichum strictum a haircap moss y y Porella cordaeana a liverwort y Pseudoscleropodium purum* y Rhytidiadelphus squarrosus bent leaf moss y Sphagnum capillifolium a peat moss y Sphagnum pacificum y y Tortula muralis a moss y Xanthoria candelaria shrubby orange lichen y Xanthoria polycarpa pincushion orange lichen y
* Introduced species; Cover percentage (y – present, VL - <5%, L - 5-10%, M - 10-25%, H - 25-50%, VH >50%) + Incidental observation
CITY OF RICHMOND – GARDEN CITY LANDS BIOPHYSICAL INVENTORY AND ANALYSIS
88
Appendix I - Agriculture Site Assessment Field Notes and Photos
Field notes – February 16, 2013
Weather conditions: sunny, cool, light to moderate winds.
Vegetation on western portion of GCL is green-yellow, on eastern it is red
“Boggy” soils to the East are peaty and spongy, moist to dry.
Wetter areas are in the western portion of the property, some standing water and ducks seen
there.
Flat topography throughout.
Old communication tower footings are not expected to be a big agricultural constraint.
Five soil samples taken at rooting depth (10-15 cm)
Samples will be analyzed at Pacific Soils Analysis for soil fertility and texture.
Auger holes from previous geotechnical work not easily visible but lots of orange flagging tape
seen – not sure if this is related or from another study.
Field Notes – May 10, 2013
Weather conditions: sunny, warm, calm.
Prior to this site visit the weather had been very dry and warm, with no precipitation for
approximately 2 weeks.
Vegetation throughout most of the site has turned from yellow and red/purple to green
Soils on the eastern portion of the GCL are quite dry.
Soils on the western portion continue to be wetter with some puddling and ponding remaining.
Vegetation on western (wetter) side of the property is distinct from the eastern (drier
sphagnum/bog) side of the property.
Wild blueberry was noted on the eastern side of the property.
Spring-based observations are in line with original winter-based observations and conclusions
regarding high water table throughout but especially on the western side of the property.
Next site visit is planned for late July/early August at the height of seasonal aridity.
Field Notes – July 10, 2013
Weather conditions: Sunny, warm/hot, no winds.
Prior to this site visit the weather had been very dry and hot (over 20oC), with no precipitation
for an extended period of time (approximately 3 weeks).
Soils throughout the property are dry to the touch, there is no puddling.
Soils on the western side of the property are more “spongy” indicating higher soil moisture
content.
Fireweed was abundant in the central and southern portions of the property. Fireweed grows
well in acidic soils – which are the case in the GCL.
This site visit was the first time that the water table was not seen above the soil surface.
This completes the 3 site visits to the GCL (February, May, and July).

CITY OF RICHMOND – GARDEN CITY LANDS BIOPHYSICAL INVENTORY AND ANALYSIS
89
Looking west from middle of GCL in February 2013 (left) and May 2013 (centre) and July 2013 (right). Note the change in colour of the vegetation indicating new growth under warm spring conditions.

CITY OF RICHMOND – GARDEN CITY LANDS BIOPHYSICAL INVENTORY AND ANALYSIS
90
Photos below are from the western side of the GCL where soils are wettest. Top photos February, middle photos May, bottom July 2013.

CITY OF RICHMOND – GARDEN CITY LANDS BIOPHYSICAL INVENTORY AND ANALYSIS
91
Eastern side of the property where soil conditions are drier. Top photos taken in February, bottom photos taken in May.

CITY OF RICHMOND – GARDEN CITY LANDS BIOPHYSICAL INVENTORY AND ANALYSIS
92
Appendix J – Projected Climate Change in the Metro Vancouver Region
Table 14. Projected climate change in the Metro Vancouver region29
Metro Vancouver Region 2020 change from 1961-1990 baseline 2050 change from 1961-1990 baseline 2080 change from 1961-1990 baseline
Characteristic Season Range Average Range Average Range Average
Average Temperature Annual +0.5oC to +1.4
oC +1.0
oC +1.0
oC to +2.5
oC +1.7
oC +1.5
oC to +4.1
oC +2.7
oC
Precipitation Annual -2% to +8% +4% -2% to +11% +7% +1% to +18% +8%
Summer -16% to +8% -7% -25% to +3% -15% -37% to -3% -14%
Winter -3% to +9% +3% -4% to +15% +6% +1% to +23% +9%
Snowfall Winter -42% to -5% -22% -56% to -19% -36% -74% to -26% -52%
Spring -62% to -4% -31% -73% to -17% -56% -88% to -21% -75%
Growing Degree Days Annual +104 to +314 degree days
+225 degree days +250 to +609 degree days
+415 degree days +373 to +1072 degree days
+680 degree days
Frost-free days Annual +6 to +20 days +13 days +14 to +33 days +22 days +19 to +47 days +33 days
29 Pacific Climate Impacts Consortium (PCIC). www.plan2adapt.ca Accessed September 2012.

CITY OF RICHMOND – GARDEN CITY LANDS BIOPHYSICAL INVENTORY AND ANALYSIS
93
Appendix K – Summary of Agricultural Activities in Richmond, BC
The information below is presented to provide context regarding both appropriate and successful examples of agricultural endeavours in the Richmond community. The information was compiled using Stats Canada 2011 agricultural census data and an agricultural profile developed by the City of Richmond in 2002. Total Number of Farms and Farmed Area There were 211 farms in Richmond in 2011, and over 50% (118) were under 10 acres in size. A total of 2,425 hectares (5,993 acres) were in use for crop production. Farm Types The top 3 farm types in Richmond in 2011 were:
Fruit (berries) (97 farms)
Greenhouses (39 farms)
Field vegetables (36 farms)
The most popular crops (by number and size of farms) are detailed in the table below:
Crop Number of
Farms Total Hectares (or m2
for greenhouses)
Average Ha per farm or Average m2
per greenhouse
Berries
Strawberries 5 57 11.4
Raspberries 4 2 0.5
Cranberries 24 858 35.8
Blueberries 70 556 7.9
Vegetables
Sweet Corn 10 52 5.2
Chinese Cabbage 21 51 2.4
Cabbage 10 64 6.4
Pumpkins 11 25 2.3
Squash and Zucchini 15 21 1.4
Nursery Products 20 49 2.5
Greenhouses
Flowers 22 88,415 4,019
Vegetables 10 35,755 3,576
Other (nursery, specialty) 6 7,516 1,253
In terms of location, most blueberry farms are located in the central and eastern portion of Richmond (in the vicinity of the Garden City Lands). Vegetable, forage, and greenhouse production is occurring mainly in the southern (Steveston) area of Richmond, while cranberry farms, and some forage crops, are centered along the Fraser River in the northeast section of Richmond.

CITY OF RICHMOND – GARDEN CITY LANDS BIOPHYSICAL INVENTORY AND ANALYSIS
94
Of the 211 farms in Richmond in 2011 only a few included livestock:
6 cattle farms (young calves under 1 year), average of 29 cows per farm.
3 dairy farms, average of 150 cows per farm.
4 sheep & lamb farms, average of 5 sheep per farm.
17 horse & pony farms, average of 10 horses per farm.
10 farms reported egg production and 3 farms have broiler (meat) poultry.
10 honeybee farms average 21 colonies per farm.
Land Tenure In terms of farms leasing land from government, only 5 of these tenure agreements, representing 76 hectares (189 acres) existed in Richmond in 2011. This represents about 2.4% of farms. By contrast, 7.1% of farms are leased from governments across BC.
Region Total Farms Farms being leased from government
As a % of total farms
Richmond 211 5 2.4%
Metro Vancouver 2,821 53 1.8%
British Columbia 19,759 1,397 7.1%
Farm Practices
Less than 40% of farms reported using herbicides, insecticides, or fungicides.
Liming, which increases pH of the soil to help neutralize acidic peat soils, was used on
13% of farms.
32% of farms, representing 1,098 hectares (including 895 ha of fruit/berries and 127 ha
of vegetables), used irrigation.
Only one Certified Organic farm was reported during the 2011 census, though many
more are operating using organic methods without certification.
Farm Finances
Total farm capital Number of farms
reporting
< $100,000 12
$100,000 - $199,999 15
$200,000 - $349,999 7
$350,000 - $499,999 5
$500,000 - $999,999 30
$1,000,000 - $1,499,999 20
$1,500,000 - $1,999,999 22
$2,000,000 - $3,499,999 59
$350,000,000 and over 41

CITY OF RICHMOND – GARDEN CITY LANDS BIOPHYSICAL INVENTORY AND ANALYSIS
95
Gross farm receipts Number of farms
reporting
< $10,000 71
$10,000 - $24,999 35
$25,000 - $49,999 20
$50,000 - $99,999 17
$100,000 - $249,999 25
$250,000 - $499,999 13
$500,000 - $999,999 11
$1,000,000 - $1,999,999 15
$2,000,000 and over 4
Farmer Demographics Age of farmers:
20 were under 35 years old;
100 were between 35 and 54 years old; and
175 were 55 years old and over.
This underscores the lack of new, young, and emerging farmers in Richmond.

CITY OF RICHMOND – GARDEN CITY LANDS BIOPHYSICAL INVENTORY AND ANALYSIS
96
Appendix L – Potential Farming Governance Models
Model Description Governance Benefits Constraints Examples
Cooperative community farm
Community farms incorporate a wide variety of activities on a shared land base. Some initiatives may include: - Food production, - Environmental education, - Agricultural mentorship and training, - Conservation of natural and cultural heritage, and - Outdoor recreation.
The land is held “in trust” for the community rather than privately owned. The land is leased (or licensed) cooperatively by the group of farmers or a larger group of shareholders. A society or co-operative group usually governs and administers the land use agreements.
Community farming is one of the most viable and affordable ways for new farmers to get into farming in BC. Benefits include sharing of costs and risks, sharing of labour, knowledge and experience.
Housing needs for all community farm members may not be able to be met on the farm, due to building restrictions on ALR land. Best suited to a small number of farmers will to make a long term commitment to staying on the land. Group cohesion and relationships, strong requirement of ability to work together. Clear strategies for business management need to be designed, practices, and regularly evaluated.
There are currently more than 20 farms in BC that have experience and knowledge in co-operative community farming. FarmFolk/CityFolk is actively engaged in developing a Community Farms Network for BC. They include:
Glen Valley Organic Farm Cooperative, Abbotsford;
Lohbrunner Farm, Langford;
Keating Community Farm, Duncan;
Nicomekl Community Organic Farm, Langley;
Fraser Common Farm, Aldergrove;
Providence Farm, Duncan;
Saanich Organics, Saanich, BC;
Yarrow Eco-Village (includes cohousing), Chilliwack, BC.
Active Learning Farm
Learning farms operate on the premise that practical learning and hands-on experience are necessary elements to creating sustainable communities. Examples of programs may include: Farmer Training School Programming Kids Farm Camp
Learning farms usually operate as a non-profit society. Registration charges may be necessary to cover operating costs.
Programs can be coordinated with local school districts to meet curriculum requirements.
Sustained funding is the biggest challenge. Recently, BC’s best known example of an active learning farm, Linnea Farm on Cortes Island, had to close its doors on its public school program due to a lack of funding.
UBC Farm, (Vancouver, BC);
Linnea Farm (Cortes Island, BC);
Everdale Farm (Hillsburgh, ON).

CITY OF RICHMOND – GARDEN CITY LANDS BIOPHYSICAL INVENTORY AND ANALYSIS
97
Gardening courses
Incubator Farm
An incubator farm hosts and trains farmers as they grow food, share equipment, establish their markets, and learn from their mistakes, successes and fellow producers. Then, once their businesses are viable, they find their own land.
Farmers can be brought into a tiered program. Initially farmers are given up to ½ acre of land to farm. If their businesses prove to be successful they will be invited to farm up to 5 acres for up to 2 years. A select few successful farmers then become eligible to be a Mentor Farmer, with longer term leases on the land and also more responsibilities for assisting new farmers.
Incubator Farm programs support new farm enterprises by offering access to land, equipment and infrastructure at reasonable rates, along with business planning support, technical training, mentorship and experience with ecological and emerging farming methods.
Some governments have been concerned that they would get complaints from other farmers about giving away land for free (or reduced rates) to new farmers and that it would be labeled as unfair competition. However this concern remains unproven. Crime, mostly theft of equipment, can be a problem because there may not be anyone living on the site. Transition off-site at the end of the incubator term is challenging for farmers and requires appropriate levels of support from the program.
The FarmStart program in Guelph, Ontario is the most established Canadian incubator farm program in Canada. Other examples include: Richmond Farm School (Richmond, BC); Intervale Farms Program (Burlington, VT); Agriculture and Land-Based Training Association (Salinas Valley, CA); UC Farm Incubator Project (Humboldt, CA); New American Sustainable Agriculture Project (Lewsiton, ME).

CITY OF RICHMOND – GARDEN CITY LANDS BIOPHYSICAL INVENTORY AND ANALYSIS
98
Urban Farming in Public Spaces
A farmed area, usually in publicly owned land (such as parks, vacant lots) is developed based on simple lease or licence agreements with local government.
A private enterprise (farm) enters into a land use agreement (lease or licence) with the local government.
Good use of land that would otherwise be sitting empty. Aesthetically pleasing use of public space.
Most land use agreements are short term (less than 5 years), which does not offer the farmer much security for investing in infrastructure. Much of the crops may have to be grown in portable pots or raised beds, depending on whether the site was previously contaminated (as is the case for some vacant lots).
The City of North Vancouver allows The North Shore Neighbourhood House Edible Garden Project, a local non-profit organization, to operate the Loutet Farm in Loutet Park. The Loutet Park Farm license is for five years with an offer to renew for two additional consecutive five year terms. SoleFoods Farm in Vancouver enters into a lease agreement with the City of Vancouver to produce farms in vacant lots, such as old gas station sites, which are in between land use developments. The City of Baltimore issued a Request for Qualifications to farm city-owned vacant land. Those applicants deemed qualified will be able to lease city property for up to five years with an option to renew. The city expects to lease 35 acres of land in parcels one acre and larger (Baltimore Office of Sustainability, 2011).