city of riverside notes to basic financial statements for ... · pdf filenotes to basic...
TRANSCRIPT
City of Riverside Notes to Basic Financial Statements For the year ended June 30, 2016 (amounts expressed in thousands)
1. Summary of Significant Accounting Policies
The City of Riverside (City) was incorporated on October 11, 1883 as a Charter City and operates under a Council-Manager form of Government. The more significant accounting policies reflected in the financial statements are summarized as follows:
A. Reporting Entity
The financial statements present the City and its component units, entities for which the City is financially accountable. Blended component units are legally separate entities, but in substance are part of the City's operations and their data is combined with that of the City's. The City has no component units that meet the criteria for discrete presentation. All of the City's component units have a June 30 year end.
Blended Component Units
Riverside Housing Authority (Housing Authority) was established in 2006 by the City. The Housing Authority’s primary purpose is to provide safe and sanitary housing accommodations for persons with low or moderate income. The Housing Authority’s activity has been combined with that of the primary government because City Council members serve as the Housing Authority’s commissioners and because the City is financially accountable and operationally responsible for all matters.
Riverside Public Financing Authority (Public Financing Authority) was organized in December 1987 by the City and the Redevelopment Agency. Pursuant to Assembly Bill 1X 26 (as modified by the California Supreme Court on December 29, 2011) all redevelopment agencies were dissolved effective February 1, 2012. Subsequently, the City became the Successor Agency to the Redevelopment Agency. The Parking Authority of the City of Riverside was added as an additional member of the Public Financing Authority on August 14, 2012. The Public Financing Authority’s activity has been combined with that of the primary government because City Council members serve as the Public Financing Authority’s board members and because the Public Financing Authority exclusively provides financing assistance to the primary government. The City is also financially accountable and operationally responsible for all matters.
Riverside Municipal Improvements Corporation (Municipal Improvements Corporation) was created in 1978 and operates under provisions of the Nonprofit Public Benefit Corporation Law of the State of California. The
Municipal Improvements Corporation's primary purpose is to provide financing assistance by obtaining land, property and equipment on behalf of the City. The activity of the Municipal Improvements Corporation has been combined with that of the primary government because three members of the City Council serve as the Municipal Improvements Corporation’s directors and because the Municipal Improvements Corporation exists to serve exclusively the primary government. The City is financially accountable and operationally responsible for all matters.
Fiduciary Component Unit
Successor Agency to the Redevelopment Agency of the City of Riverside (Successor Agency) is a separate legal entity, which was formed to hold the assets and liabilities of the former Redevelopment Agency pursuant to City Council actions taken on March 15, 2011 and January 10, 2012. The activity of the Successor Agency is overseen by an Oversight Board comprised of individuals appointed by various government agencies and the City of Riverside as Successor Agency of the former Redevelopment Agency. The nature and significance of the relationship between the City and the Successor Agency is such that it would be misleading to exclude the Successor Agency from the City’s financial statements. The Successor Agency is presented herein in the City’s fiduciary funds as a private-purpose trust fund.
Complete financial statements are prepared for the Riverside Public Financing Authority and the Successor Agency to the Redevelopment Agency of the City of Riverside, which can be obtained from the City's Finance Department, 3900 Main Street, Riverside, California, 92522 or online at www.riversideca.gov.
B. Government-wide and Fund Financial Statements
The government-wide financial statements report information on all of the non-fiduciary activities of the City and its component units. Interfund activity has been removed from these statements except for utility charges, as this would distort the presentation of function costs and program revenues. Governmental activities, which normally are supported by taxes and intergovernmental revenues, are reported separately from business type activities, which rely to a significant extent on fees and charges for support.
The statement of net position presents financial information on all of the City’s assets, liabilities, and deferred inflows/outflows of resources, with the difference reported as net position. Over time, increases or decreases in net position may serve as a useful indicator of whether the financial position of the City is improving or deteriorating.
City of Riverside Notes to Basic Financial Statements For the year ended June 30, 2016 (amounts expressed in thousands)
The statement of activities demonstrates the degree to which the direct expenses of a given function or segment are offset by program revenues. Direct expenses are those that are clearly identifiable with a specific function or segment. Program revenues include 1) charges to customers or applicants who purchase, use, or directly benefit from goods, services, or privileges provided by a given function or segment and 2) grants and contributions that are restricted to meeting the operational or capital requirements of a particular function or segment. Taxes and other items not properly included among program revenues are reported instead as general revenues. Indirect expenses are allocated to the various functions based on a proportionate utilization of the services rendered. Such allocations consist of charges for accounting, human resources, information technology and other similar support services.
Separate financial statements are provided for governmental funds, proprietary funds, and fiduciary funds, even though the latter are excluded from the government-wide financial statements. Major individual governmental funds and major individual enterprise funds are reported as separate columns in the fund financial statements.
C. Measurement Focus, Basis of Accounting and Financial Statement Presentation
The government-wide, proprietary and private-purpose trust fund financial statements are reported using the economic resources measurement focus and the accrual basis of accounting. Agency funds report only assets and liabilities and therefore have no measurement focus. Revenues are recorded when earned and expenses are recorded when a liability is incurred, regardless of the timing of related cash flows. Property taxes are recognized as revenues in the year for which they are levied on the property. Grants and similar items are recognized as revenue as soon as all eligibility requirements have been met. An allowance for doubtful accounts is maintained for the utility and other miscellaneous receivables.
Governmental fund financial statements are reported using the current financial resources measurement focus and the modified accrual basis of accounting. Revenues are recognized as soon as they are both measurable and available. Revenues are considered to be available when they are collectible within the current period or soon enough thereafter to pay liabilities of the current period. Revenues are considered to be available if they are generally collected within 60 days after year end, except for revenue associated with neglected property abatement which is eleven (11) months and except for grant revenue, including reimbursement received from
Transportation Uniform Mitigation Fees, which is six (6) months and sales tax revenue which is seven (7) months, as described below. Grant revenue is recognized if received within six (6) months of year end to enable the matching of revenue with applicable expenditures. Expenditures generally are recorded when a liability is incurred under accrual accounting. However, debt service expenditures, as well as expenditures related to compensated absences and claims and judgments, are recorded only when payment is due.
In 2004, the State temporarily began to exchange 25% of sales taxes for an equal amount of property taxes to securitize a short-term State bond issue. The State bond issue will remain outstanding for an uncertain number of years, but the bonds are currently estimated to retire in 2016. These in-lieu sales taxes will be paid to the City by the State on a different calendar than sales taxes, which are paid monthly, three months in arrears. The vast majority of the in-lieu amount will be paid during the applicable fiscal year; however, the final payment of the in-lieu sales taxes will not be paid until the January following the end of the applicable fiscal year. Since 2004, the final “true-up” payment has been reported in the fiscal year that the revenue was earned and thus provides consistency in the reporting of sales tax revenue.
Property taxes, special assessments, sales taxes, franchise taxes, licenses, charges for services, amounts due from other governments and interest associated with the current fiscal period are all considered to be susceptible to accrual. Other revenue items such as fines and permits are considered to be measurable and available only when the government receives cash, and are therefore not susceptible to accrual.
The government reports the following major governmental funds:
The General fund is the government’s primary operating fund. It accounts for all financial resources of the general government, except those required to be accounted for in another fund.
The Capital Outlay fund accounts for the construction and installation of street and highway capital improvements for the City, including improvements funded by the ½ % sales tax approved by Riverside County in 1988.
The government reports the following major proprietary funds:
The Electric fund accounts for the activities of the City’s electric distribution operations.

City of Riverside Notes to Basic Financial Statements For the year ended June 30, 2016 (amounts expressed in thousands)
The Water fund accounts for the activities of the City’s water distribution operations.
The Sewer fund accounts for the activities of the City’s sewer systems.
Additionally, the government reports the following fund types:
Internal service funds account for self-insurance, central stores and central garage on a cost reimbursement basis.
Fiduciary funds include private-purpose trust and agency funds. The private-purpose trust fund accounts for assets and activities of the dissolved Redevelopment Agency, which is accounted for in the Successor Agency Trust. The agency fund is used to account for special assessments that service no-commitment debt.
The permanent fund is a governmental fund that is used to report resources that are legally restricted to the extent that only earnings, and not principal, may be used for purposes that support the City’s Library programs. Non-expendable net position on the Statement of Net Position includes $1.6 million of permanent fund principal which are considered nonexpendable.
Amounts reported as program revenues include 1) charges to customers for goods, services, or privileges provided, 2) operating grants and contributions, and 3) capital grants and contributions, including special assessments. Internally dedicated resources are reported as general revenues rather than as program revenues. Likewise, general revenues include all taxes.
Proprietary funds distinguish operating revenues and expenses from non-operating items. Operating revenues and expenses generally result from providing services and producing and delivering goods in connection with a proprietary fund’s principal ongoing operations. The sewer fund also recognizes as operating revenue the portion of connection fees intended to recover the cost of connecting new customers to the system. Operating expenses for enterprise funds and internal service funds include the cost of sales and services, administrative expenses, and depreciation on capital assets. All revenues and expenses not meeting this definition are reported as non-operating revenues and expenses.
D. Cash and Investments
The City values its cash and investments in accordance with the provisions of Governmental Accounting Standards Board Statement No. 72 (GASB 72), Fair
Value Measurement and Application, which requires governmental entities to use valuation techniques that are appropriate under the circumstances and for which sufficient data are available to measure fair value. The techniques should be consistent with one or more of the following approaches: the market approach, the cost approach or the income approach.
Cash accounts of all funds are pooled for investment purposes to enhance safety and liquidity while maximizing interest earnings. Investments are stated at fair value except for investments in investment contracts which are recorded at contract value. All highly liquid investments (including restricted assets) with a maturity of 90 days or less when purchased are considered cash equivalents. Cash and investments held on behalf of proprietary funds by the City Treasurer are considered highly liquid and are classified as cash equivalents for the purpose of presentation in the Statement of Cash Flows.
E. Restricted Cash and Investments
Certain proceeds of long-term indebtedness, as well as certain resources set aside for their repayment, are classified as restricted assets on the statement of net position because their use is limited by applicable bond covenants. Restricted cash and investments also include cash set aside for nuclear decommissioning, public benefit programs, regulatory requirements and rate stabilization because their use is legally restricted to a specific purpose. Unspent proceeds received from the City’s landfill capping surcharge are also recorded as restricted assets.
F. Allowance for Doubtful Accounts
Management determines the allowance for doubtful accounts by analyzing customer accounts for all balances over 60 days old. The allowance for doubtful accounts is then adjusted at fiscal year-end based on the amount equal to the annual uncollectible accounts. Utility customer closed accounts are written off when deemed uncollectible. Recoveries to utility customer receivables previously written off are recorded when received. For non-utility accounts receivables, delinquent notices after 60 days are sent to customers with outstanding balances. After 120 days, accounts still outstanding are referred to the City’s collection agency. As of June 30, 2016, the City had an allowance for doubtful account balance of $6,402.

City of Riverside Notes to Basic Financial Statements For the year ended June 30, 2016 (amounts expressed in thousands)
G. Land and Improvements Held for Resale
Land and improvements held for resale were generally acquired for future development projects. The properties are carried at the lower of cost or net realizable value. H. Inventory
Supplies are valued at cost using the average-cost method. Costs are charged to user departments when consumed rather than when purchased.
I. Prepaid Items
Payments to vendors for services benefiting future periods are recorded as prepaid items and expenditures are recognized when items are consumed.
J. Capital Assets
Capital assets, which include property, plant, equipment, and infrastructure assets (e.g., roads, bridges, sidewalks, right of way, and similar items), are reported in the applicable governmental activities and business-type activities of the government-wide financial statements and in the proprietary funds and the fiduciary private-purpose trust fund statements of net position. The government defines capital assets as assets with an initial, individual cost of more than five thousand dollars and an estimated useful life in excess of one year. Such assets are recorded at historical cost or estimated historical cost if purchased or constructed. Costs include: labor; materials; interest during construction; allocated indirect charges such as engineering, construction and transportation equipment, retirement plan contributions and other fringe benefits. Donated capital assets are recorded at estimated fair market value at the date of donation. Intangible assets that cost more than one hundred thousand dollars with useful lives of at least three years are capitalized and are recorded at cost.
Interest incurred during the construction phase is reflected in the capitalized value of the asset constructed for proprietary funds. For the year ended June 30, 2016, business-type activities capitalized net interest costs of $21,232 in the government-wide and fund financial statements. Total interest expense incurred by the business-type activities (and the enterprise funds on the proprietary funds statements) before capitalization was $56,508.
The costs of normal maintenance and repairs that do not add to the value of the asset or materially extend asset lives are not capitalized. Capital assets
other than land are depreciated using the straight-line method. Estimated useful lives used to compute depreciation are as follows:
Buildings and Improvements 30-50 years Improvements other than Buildings 20-99 years Intangibles - Depreciable 3-15 years Machinery and Equipment 3-15 years Infrastructure 20-100 years
K. Compensated Absences
City employees receive 10 to 25 vacation days a year based upon length of service. A maximum of two years' vacation accrual may be accumulated and unused vacation is paid in cash upon separation.
City employees generally receive one day of sick leave for each month of employment with unlimited accumulation. Upon retirement or death, certain employees or their estates receive a percentage of unused sick leave paid in a lump sum based on longevity. The General, Electric and Water funds have been primarily used to liquidate such balances.
The liability associated with these benefits is reported in the government-wide statements. Vacation and sick leave of proprietary funds is recorded as an expense and as a liability of those funds as the benefits accrue to employees.
L. Derivative Instruments
The City’s derivative instruments are accounted for in accordance with Government Accounting Standards Board Statement No. 53 (GASB 53), Accounting and Financial Reporting for Derivative Instruments, which requires the City to report its derivative instruments at fair value. Changes in fair value for effective hedges that are achieved with derivative instruments are reported as deferrals in the statements of net position.
The City uses derivative instruments to hedge its exposure to changing interest rates through the use of interest rate swaps. The City had debt that was layered with “synthetic fixed rate” swaps, which was refunded in 2008 and 2011. The balance of the deferral account for each swap is included as part of the deferred charge on refunding associated with the new bonds. The swaps were also employed as a hedge against the new debt. Hedge accounting was applied to that portion of the hedging relationship, which was determined to be effective. The negative fair value of the interest rate swaps related to the new hedging relationship has been recorded and deferred on the statement of net
City of Riverside Notes to Basic Financial Statements For the year ended June 30, 2016 (amounts expressed in thousands)
position. See Note 10 for further discussion related to the City’s interest rate swaps.
Various transactions permitted in the Utility’s Power Resources Risk Management Policies may be considered derivatives, including energy and/or gas transactions for swaps, options, forward arrangements and congestion revenue rights. The City has determined that all of its contracts including congestion revenue rights fall under the scope of “normal purchases and normal sales” and are exempt from GASB 53.
M. Long-Term Obligations
Long-Term Debt
Long-term debt and other long-term obligations are reported as liabilities in the applicable governmental and business-type activities columns in the government-wide financial statements and in the proprietary funds and fiduciary private-purpose trust fund statements of net position. Bond premiums and discounts are deferred and amortized over the life of the bonds using the effective interest method. Bonds payable are reported net of the applicable bond premium or discount.
In the fund financial statements, government fund types recognize bond issuance costs as expenditures during the current period. The face amount of debt issued is reported as other financing sources. Premiums received on debt issuances are reported as other financing sources while discounts on debt issuance are reported as other financing uses.
Decommissioning
Federal regulations require the Electric Utility to provide for the future decommissioning of its ownership share of the nuclear units at San Onofre. The Electric Utility has established trust accounts to accumulate resources for the decommissioning of the nuclear power plant and restoration of the beachfront at San Onofre. Based on the most recent site specific cost estimate as of September 2014, submitted by Southern California Edison (SCE) and accepted by the Nuclear Regulatory Commission (NRC), the Electric Utility has fully funded the San Onofre Nuclear Generating Station (“SONGS”) decommissioning liability.
The Electric Utility has set aside $80,494 in cash investments with the trustee and $4,951 in an internally designated decommissioning reserve as the Electric Utility’s estimated share of the decommissioning cost of SONGS as of
June 30, 2016. With the recent retirement of SONGS units 2 and 3, there is much uncertainty as to future unknown costs to decommission SONGS. Although management believes the current cost estimate is the upper bound of decommissioning obligations, the Electric Utility has conservatively decided to continue to set aside $1,581 per year in an internally designated cash reserve for unexpected costs not contemplated in the current estimates. On February 23, 2016, the City Council adopted a resolution authorizing the commencement of SONGS decommissioning effective June 7, 2013. This resolution allows the Electric Utility to access the decommissioning trust funds to pay for its share of decommissioning costs. As of June 30, 2016, the Electric Utility has paid to date $14,936 in decommissioning obligations. The Electric Utility has submitted the necessary documents to the trustee and will begin drawing decommissioning trust funds to pay for the decommissioning costs as incurred. The Electric Utility anticipates receiving reimbursement from the trust starting in fiscal year ending June 30, 2017.
The plant site easement at San Onofre terminates May 2024. The plant must be decommissioned and the site restored by the time the easement terminates.
N. Claims and Judgments Payable
Claims and judgments payable are recognized when it is probable that a liability has been incurred and the amount of loss can be reasonably estimated. Such claims, including an estimate for claims incurred but not reported at year end, are recorded as liabilities in the self-insurance internal service fund. As of June 30, 2016, the City had an obligation related to claims and judgments which is reflected as a liability on the government-wide statements and is more fully described in Note 7.
O. Fund Equity
In the fund financial statements, governmental fund balance is made up of the following components:
Nonspendable fund balance is the portion of fund balance that cannot be spent due to form. Examples include inventories, prepaid amounts, long-term loans, and notes receivable, unless the proceeds are restricted, committed or assigned. Also, amounts that must be maintained intact legally or contractually, such as the principal of a permanent fund are reported within the nonspendable category.
City of Riverside Notes to Basic Financial Statements For the year ended June 30, 2016 (amounts expressed in thousands)
Restricted fund balance is the portion of fund balance that is subject to externally enforceable limitations by law, enabling legislation or limitations imposed by creditors or grantors.
Committed fund balance is the portion of fund balance that can only be used for specific purposes due to formal action of the City Council through adoption of a resolution prior to the end of the fiscal year. Once adopted, the limitation imposed by resolution remains in place until a similar action is taken (the adoption of another resolution) to remove or revise the limitation. No amounts have been reported within this category of fund balance.
Assigned fund balance reflects the City’s intended use of resources. Intent can be expressed by the City Council or by an official to which the City Council delegates the authority. On February 22, 2011, the City Council approved a policy whereby the authority to assign fund balance was delegated to the City’s chief financial officer, which authorized the assignment of fund balance for specific programs or purposes in accordance with City Council directives. The City also uses budget and finance policy to authorize the assignment of fund balance, which is done through the adoption of the budget and subsequent budget amendments throughout the year.
Unassigned fund balance is the residual classification that includes all spendable amounts in the General Fund not contained in other classifications.
When expenditures are incurred for purposes for which both restricted and unrestricted (committed, assigned or unassigned) fund balances are available, the City’s policy is to use restricted amounts before unrestricted amounts. Within unrestricted resources, committed resources are used first followed by assigned resources, and finally unassigned resources.
P. Net Position
Net position represents the difference between assets and deferred outflows less liabilities and deferred inflows. Net position invested in capital assets consists of capital assets, net of accumulated depreciation, reduced by the outstanding balances of any borrowings used for the related acquisition, construction or improvement of those assets excluding unspent debt proceeds. Restricted net position represents restricted assets less liabilities and deferred inflows related to those assets. Restricted assets are recorded when there are limitations imposed on their use either through legislation adopted by the City or through external restrictions imposed by creditors,
grantors or laws or regulations of other governments. Restricted resources are used first to fund appropriations.
Q. Interfund Transactions
Interfund transactions are accounted for as revenues and expenditures or expenses. Transactions, which constitute reimbursements, are eliminated in the reimbursed fund and accounted for as expenditures or expenses in the fund to which the transaction is applicable. During the year, transactions occur between individual funds for goods provided or services rendered. Related receivables and payables are classified as "due from/to other funds" on the accompanying fund level statements. The noncurrent portion of long-term interfund loans receivable are reported as advances and, for governmental fund types, are equally offset by nonspendable fund balance to indicate that the receivable is not in spendable form.
Any residual balances outstanding between the governmental activities and business-type activities are reported in the government-wide financial statements as “internal balances.”
R. Unearned Revenue
Unearned revenues arise when the government receives resources before it has a legal claim to them, as when grant monies are received prior to meeting all eligibility requirements. In subsequent periods, when both revenue recognition criteria are met, or when the government has a legal claim to the resources, revenue is recognized.
S. Unavailable Revenue
Unavailable revenue arises only under a modified accrual basis of accounting. Accordingly, unavailable revenue is reported only in the governmental funds balance sheet. These amounts are deferred and recognized as an inflow of resources (revenue) in the period that the amounts become available.
T. Deferred Outflows and Deferred Inflows of Resources
When applicable, the statement of net position and the balance sheet will report a separate section for deferred outflows of resources. Deferred outflows of resources represent outflows of resources (consumption of net position) that apply to future periods and that, therefore will not be recognized as an expense or expenditure until that time.
City of Riverside Notes to Basic Financial Statements For the year ended June 30, 2016 (amounts expressed in thousands)
Conversely, deferred inflows of resources represent inflows of resources (acquisition of net position) that apply to future periods and that, therefore, are not recognized as an inflow of resources (revenue) until that time.
U. Regulatory Assets and Deferred Regulatory Charges
In accordance with GASB Statement No. 62, enterprise funds that are used to account for rate-regulated activities are permitted to defer certain expenses and revenues that would otherwise be recognized when incurred, provided that the City is recovering or expects to recover or refund such amounts in rates charged to its customers. Accordingly, regulatory assets and/or deferred regulatory charges have been recorded in the Electric, Water, Sewer and Refuse funds.
V. Property Tax Calendar
Under California law, general property taxes are assessed for up to 1% of the property’s assessed value. General property taxes are collected by the counties along with other special district taxes and assessments and voter approved debt. General property tax revenues are collected and pooled by the county throughout the fiscal year and then allocated and paid to the county, cities and school districts based on complex formulas prescribed by State statutes.
Property taxes are calculated on assessed values as of January 1 for the ensuing fiscal year. On July 1 of the fiscal year the levy is placed and a lien is attached to the property. Property taxes are due in two installments. The first installment is due November 1 and is delinquent after December 10. The second installment is due February 1 and is delinquent after April 10. The City generally accrues only those taxes, which are received within sixty days after the year-end. Under the Teeter plan, the County of Riverside has responsibility for the collection of delinquent taxes and the City receives 100% of the levy.
W. Use of Estimates
The preparation of financial statements in conformity with accounting principles generally accepted in the United States of America requires management to make estimates and assumptions that affect the reported amounts of assets and liabilities, disclosure of contingent assets and liabilities at the date of the financial statements, and the reported amounts of revenue and expenditures. Specifically, the City has made certain estimates and assumptions relating to the revenues due and expenditures incurred through fiscal year end, collectability of its receivables, the valuation of property held
for resale, the useful lives of capital assets, and the ultimate outcome of claims and judgments. Actual results may differ from those estimates and assumptions.
X. Pensions For purposes of measuring the net pension liability and deferred outflows/inflows of resources related to pensions, and pension expense, information about the fiduciary net position of the City of Riverside California Public Employees’ Retirement System (CalPERS) plans (Plans) and additions to/deductions from the Plans’ fiduciary net position have been determined on the same basis as they are reported by CalPERS. For this purpose, benefit payments (including refunds of employee contributions) are recognized when due and payable in accordance with the benefit terms. Investments are reported at fair value.
Y. New Accounting Pronouncements
Effective July 1, 2015, the accompanying financial statements reflect the implementation of Governmental Accounting Standards Board Statement No. 72 (GASB 72), Fair Value Measurement and Application. The primary objective of GASB 72 is to address accounting and financial reporting issues related to fair value measurements. The definition of fair value is the price that would be received to sell an asset or paid to transfer a liability in an orderly transaction between market participants at the measurement date. GASB 72 provides guidance for determining a fair value measurement for financial reporting purposes. Also, GASB 72 provides guidance for applying fair value to certain investments and disclosures related to all fair value measurements.
2. Legal Compliance - Budgets
Budgets are adopted on a basis consistent with accounting principles generally accepted in the United States of America. Annual appropriated budgets are adopted for all departments within the general, special revenue and capital project funds. Formal budgets are not employed for debt service funds because debt indenture provisions specify payments. The permanent fund is not budgeted.
Biannually, during the period December through February, department heads prepare estimates of required appropriations for the following two-year budget cycle. These estimates are compiled into a proposed operating budget that includes a summary of proposed expenditures and financial resources and historical data for the preceding budget cycle. The operating budget is presented by the City Manager to the City Council for review. Public hearings
City of Riverside Notes to Basic Financial Statements For the year ended June 30, 2016 (amounts expressed in thousands)
are conducted to obtain citizen comments. The City Council generally adopts the budget during one of its June meetings. The City Manager is legally authorized to transfer budgeted amounts between divisions and accounts within the same department. Transfer of appropriations between departments or funds and increased appropriations must be authorized by the City Council. Expenditures may not legally exceed budgeted appropriations at the departmental level within a fund. All appropriations shall lapse at the end of the fiscal year to the extent they have not been expended or lawfully encumbered, except for appropriations for capital projects which shall continue to their completion.
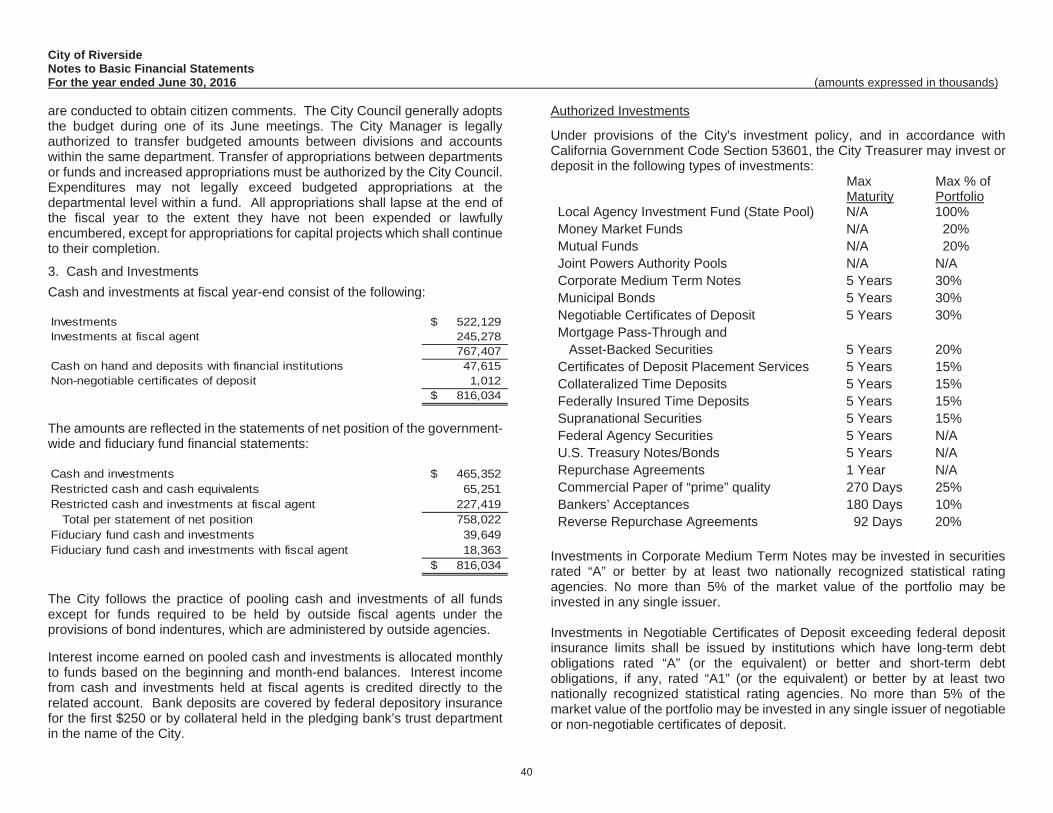
3. Cash and Investments Cash and investments at fiscal year-end consist of the following:
Investments 522,129$ Investments at fiscal agent 245,278
767,407 Cash on hand and deposits with financial institutions 47,615 Non-negotiable certificates of deposit 1,012
816,034$
The amounts are reflected in the statements of net position of the government-wide and fiduciary fund financial statements:
Cash and investments 465,352$ Restricted cash and cash equivalents 65,251 Restricted cash and investments at fiscal agent 227,419 Total per statement of net position 758,022 Fiduciary fund cash and investments 39,649 Fiduciary fund cash and investments with fiscal agent 18,363
816,034$
The City follows the practice of pooling cash and investments of all funds except for funds required to be held by outside fiscal agents under the provisions of bond indentures, which are administered by outside agencies.
Interest income earned on pooled cash and investments is allocated monthly to funds based on the beginning and month-end balances. Interest income from cash and investments held at fiscal agents is credited directly to the related account. Bank deposits are covered by federal depository insurance for the first $250 or by collateral held in the pledging bank’s trust department in the name of the City.
Authorized Investments
Under provisions of the City's investment policy, and in accordance with California Government Code Section 53601, the City Treasurer may invest or deposit in the following types of investments: Max
MaturityMax % of Portfolio
Local Agency Investment Fund (State Pool) N/A 100% Money Market Funds N/A 20% Mutual Funds N/A 20% Joint Powers Authority Pools N/A N/A Corporate Medium Term Notes 5 Years 30% Municipal Bonds 5 Years 30% Negotiable Certificates of Deposit 5 Years 30% Mortgage Pass-Through and Asset-Backed Securities 5 Years 20% Certificates of Deposit Placement Services 5 Years 15% Collateralized Time Deposits 5 Years 15% Federally Insured Time Deposits 5 Years 15% Supranational Securities 5 Years 15% Federal Agency Securities 5 Years N/A U.S. Treasury Notes/Bonds 5 Years N/A Repurchase Agreements 1 Year N/A Commercial Paper of “prime” quality 270 Days 25% Bankers’ Acceptances 180 Days 10% Reverse Repurchase Agreements 92 Days 20%
Investments in Corporate Medium Term Notes may be invested in securities rated “A” or better by at least two nationally recognized statistical rating agencies. No more than 5% of the market value of the portfolio may be invested in any single issuer.
Investments in Negotiable Certificates of Deposit exceeding federal deposit insurance limits shall be issued by institutions which have long-term debt obligations rated “A” (or the equivalent) or better and short-term debt obligations, if any, rated “A1” (or the equivalent) or better by at least two nationally recognized statistical rating agencies. No more than 5% of the market value of the portfolio may be invested in any single issuer of negotiable or non-negotiable certificates of deposit.

City of Riverside Notes to Basic Financial Statements For the year ended June 30, 2016 (amounts expressed in thousands)
Investments in Commercial Paper may be invested in securities rated “A1” (or the equivalent) or higher by at least one nationally recognized statistical rating agency. In addition, debt other than Commercial Paper, if any, issued by corporations in this category must be rated at least “A” (or the equivalent) or better by at least one nationally recognized statistical rating agency. No more than 5% of the market value of the portfolio may be invested in any single issuer. For purposes of this issuer limitation, holdings of Commercial Paper shall be combined with holdings of Corporate Medium-Term Notes. No more than 25% of the total market value of the portfolio may be invested in Commercial Paper. No more than 10% of the outstanding Commercial Paper of any single issuer may be purchased.
The City’s investment policy provides two exceptions to the above; one is for investments authorized by debt agreements (described below) and the other for funds reserved in the San Onofre Nuclear Generating Station Decommissioning Account for which the five-year maturity limitation may be extended to the term of the operating license.
Investments Authorized by Debt Agreements
Provisions of debt agreements, rather than the general provisions of the California Government CGASode or the City’s investment policy, govern investments of debt proceeds held by bond fiscal agents. Permitted investments are specified in related trust agreements and include the following:
Securities of the U.S. Government and its sponsored agencies Bankers’ Acceptances rated in the single highest classification Commercial Paper rated AA or higher at the time of purchase Investments in money market funds rated in the single highest
classification, except for certain debt proceeds which have no minimum rating requirement
Municipal obligations rated Aaa/AAA or general obligations of states with ratings of at least A2/A or higher by bothMoody’s and S&P
Investment Agreements
No maximum percentage of the related debt issue or maximum investment in one issuer is specified.
Disclosures Relating to Fair Value Measurement and Application
The City categorizes its fair value measurements within the fair value hierarchy established by generally accepted accounting principles. The hierarchy is based on the valuation inputs used to measure fair value of assets. Level 1 are quoted prices in an active market for identical assets; Level 2 inputs are significant other observable inputs; and Level 3 inputs are significant unobservable inputs. The City does not value any of its investments using Level 1 and Level 3 inputs.
The City has the following recurring fair value measurements as of June 30, 2016:
Total
Quoted Prices in Active
Markets for Identical Assets
(Level 1)
Significant Other
Observable Inputs
(Level 2)
Significant Unobservable Inputs (Level
3)Money Market Funds 44,450$ -$ 44,450$ -$ Federal Agency Securities 10,622 - 10,622 - U.S. Treasury Notes/Bonds 314,335 - 314,335 - Corp. Medium Term Notes 36,154 - 36,154 - Negotiable Certificates of Deposits 17,028 - 17,028 - Held by Fiscal Agent Money Market Funds 53,606 - 53,606 -
Commercial Paper 4,143 - 4,143 - U.S. Treasury Notes/Bonds 39,397 - 39,397 - Federal Agency Securities 46,461 - 46,461 - Corp. Medium Term Notes 17,905 - 17,905 - Total 584,101 -$ 584,101$ -$
Investments not subject to fair value hierarchy:
State Investment Pool 165,123 Investment Contracts 18,183
Total Investments 767,407$
Disclosures Relating to Interest Rate Risk
Interest rate risk is the risk that changes in market interest rates will adversely affect the fair value of an investment. Generally, the longer the maturity of an investment, the greater the sensitivity of its fair value to changes in market interest rates. The City’s investment policy requires that the interest rate risk exposure be managed by purchasing a combination of shorter term and longer term investments and by timing cash flows from maturities so that a portion of

City of Riverside Notes to Basic Financial Statements For the year ended June 30, 2016 (amounts expressed in thousands)
the portfolio is maturing or coming close to maturity evenly over time as necessary to provide the cash flow and liquidity needed for operations.
Information about the sensitivity of the fair values of the City’s investments (including investments held by fiscal agent) to market interest rate fluctuations is provided by the following table that shows the distribution of the City’s investments by maturity:
Total 12 Months
or Less 13 to 24 Months
25 to 60 Months
More than 60 Months
Money Market Funds 44,450$ 44,450$ -$ -$ -$ Federal Agency Securities 10,622 - 10,622 - - U.S. Treasury Notes/Bonds 314,335 46,711 128,316 139,308 - Corp. Medium Term Notes 36,154 18,697 8,807 8,650 - State Investment Pool 99,540 99,540 - - - Negotiable Certificates of Deposit 17,028 5,704 3,741 7,583 - Held by Fiscal Agent Money Market Funds 53,606 53,606 - - -
State Investment Pool 65,583 65,583 - - - Investment Contracts 18,183 - - 7,423 10,760 Commercial Paper 4,143 4,143 - - - U.S. Treasury Notes/Bonds 39,397 26,215 9,830 3,352 - Federal Agency Securities 46,461 32,242 13,845 374 - Corp. Medium Term Notes 17,905 13,891 4,014 - - Total 767,407$ 410,782$ 179,175$ 166,690$ 10,760$
Remaining Maturity (in Months)
The City assumes that callable investments will not be called.
Disclosures Relating to Credit Risk
Generally, credit risk is the risk that an issuer of an investment will not fulfill its obligation to the holder of the investment. This is measured by the assignment of a rating by a nationally recognized statistical rating organization.
Presented below is the actual rating as of year-end for each investment type:
Total AAA AA A Unrated Money Market Funds 44,450$ 19,065$ 20,303$ 5,082$ -$ Federal Agency Securities 10,622 10,622 - - - U.S. Treasury Notes/Bonds 314,335 314,335 - - - Corp. Medium Term Notes 36,154 - 34,343 1,811 - State Investment Pool 99,540 - - - 99,540 Negotiable Certificates of Deposits 17,028 - - - 17,028 Held by Fiscal Agent Money Market Funds 53,606 19,822 - 33,784 -
State Investment Pool 65,583 - - - 65,583 Investment Contracts 18,183 - - - 18,183 Commercial Paper 4,143 - - 4,143 - U.S. Treasury Notes/Bonds 39,397 39,397 - - - Federal Agency Securities 46,461 46,461 - - - Corp. Medium Term Notes 17,905 - - 17,905 - Total 767,407$ 449,702$ 54,646$ 62,725$ 200,334$
Ratings as of Year End
Concentration on Credit Risk
The investment policy of the City contains no limitations on the amount that can be invested in any one issuer beyond that stated above. For fiscal year ended June 30, 2016, the City did not have any investments in any one issuer (other than U.S. Treasury securities, money market funds, and external investment pools) that represent 5% or more of total City investments.
Custodial Credit Risk
Custodial credit risk for deposits is the risk that, in the event of the failure of a depository financial institution, a government will not be able to recover its deposits or will not be able to recover collateral securities that are in the possession of an outside party. The custodial credit risk for investments is the risk that, in the event of the failure of the counterparty (e.g., broker-dealer) to a transaction, a government will not be able to recover the value of its investment or collateral securities that are in the possession of another party. The City’s investment policy requires that a third party bank trust department hold all securities owned by the City. All trades are settled on a delivery vs. payment basis through the City’s safekeeping agent. The City has no deposits with financial institutions; bank balances are swept daily into a money market account.
The pledge to secure deposits is administered by the California Commissioner of Business Oversight. Collateral is required for demand deposits at 110% of all deposits not covered by federal depository insurance (FDIC) if obligations of the United States and its agencies, or obligations of the State or its

City of Riverside Notes to Basic Financial Statements For the year ended June 30, 2016 (amounts expressed in thousands)
municipalities, school districts, and district corporations are pledged. Collateral of 150% is required if a deposit is secured by first mortgages or first trust deeds upon improved residential real property located in California. All such collateral is considered to be held by the pledging financial institutions’ trust departments or agents in the name of the City. Obligations pledged to secure deposits must be delivered to an institution other than the institution in which the deposit is made; however the trust department of the same institution may hold them.
Written custodial agreements are required to provide, among other things, that the collateral securities are held separate from the assets of the custodial institution.
Investment in State Investment Pool
The City is a voluntary participant in the Local Agency Investment Fund (LAIF) that is regulated by California Government Code Section 16429 under the oversight of the Treasurer of the State of California. The fair value of the City’s investment in this pool is reported in the accompanying financial statements at amounts based upon the City’s pro-rata share of the fair value provided by LAIF for the entire LAIF portfolio (in relation to the amortized cost of that portfolio). The balance available for withdrawal is based on the accounting records maintained by LAIF, which are recorded on an amortized cost basis.
4. Direct Financing Lease Receivable
The former Redevelopment Agency had a direct financing lease arrangement with the State of California (the State) for a twelve-story office building, which was transferred to the Successor Agency. The lease term is for thirty years and the State takes ownership of the facility at the conclusion of that term. The lease calls for semi-annual payments not less than the debt service owed on the related lease revenue bonds issued by the former Redevelopment Agency for the purchase and renovation of the building. The future minimum lease payments to be received are as follows:
Fiscal Year2017 2,561$ 2018 2,598 2019 2,625 2020 2,659 2021 2,692 Thereafter 11,092 Total Due 24,227 Less: Amount applicable to interest (6,162) Total direct financing lease receivable 18,065$
5. Capital Assets
The following is a summary of changes in the capital assets during the fiscal year ended June 30, 2016.
Beginning Additons/ Deletions/ EndingBalance Transfers In Transfers Out Balance
339,755$ 3,113$ (76)$ 342,792$34,120 23,676 (16,261) 41,535
Total capital assets not depreciated 373,875 26,789 (16,337) 384,327
183,230 715 (349) 183,596 301,454 8,382 - 309,836 86,025 8,487 (2,445) 92,067
201 18 - 219 982,126 16,871 - 998,997
Total capital assets being depreciated 1,553,036 34,473 (2,794) 1,584,715
(59,432) (4,711) 333 (63,810) (91,584) (12,502) - (104,086) (63,595) (5,778) 2,381 (66,992)
(3) (41) - (44) (332,384) (24,117) - (356,501)
Total accumulated depreciation (546,998) (47,149) 2,714 (591,433) Total capital assets being
depreciated, net 1,006,038 (12,676) (80) 993,282 Governmental activities
capital assets, net 1,379,913$ 14,113$ (16,417)$ 1,377,609$
Improvements other than buildingsMachinery and equipmentIntangibles, depreciableInfrastructure
Governmental activities:
Less accumulated depreciation for:Buildings
Capital assets, not depreciated:LandConstruction in progress
Capital assets being depreciated:Buildings
Machinery and equipmentIntangibles, depreciableInfrastructure
Improvements other than buildings

City of Riverside Notes to Basic Financial Statements For the year ended June 30, 2016 (amounts expressed in thousands)
Beginning Additons/ Deletions/ EndingBalance Transfers In Transfers Out Balance
51,187$ 12,652$ -$ 63,839$ 21,492 - - 21,492
308,701 107,253 (65,977) 349,977 Total capital assets not depreciated 381,380 119,905 (65,977) 435,308
270,857 44,638 (116) 315,379 1,581,730 54,736 (2,556) 1,633,910
14,368 7,065 - 21,433 88,307 6,389 (5,423) 89,273
Total capital assets being depreciated 1,955,262 112,828 (8,095) 2,059,995
(121,421) (6,788) 115 (128,094) (493,491) (40,776) 2,345 (531,922)
(598) (1,617) - (2,215) (54,205) (5,744) 4,904 (55,045)
Total accumulated depreciation (669,715) (54,925) 7,364 (717,276) Total capital assets being
depreciated, net 1,285,547 57,903 (731) 1,342,719 Business-type activities
capital assets, net 1,666,927$ 177,808$ (66,708)$ 1,778,027$
Intangibles, depreciableMachinery and equipment
Intangibles, non-depreciable
Business-type activities:
Less accumulated depreciation for:Buildings
Capital assets, not depreciated:Land
Construction in progress
Capital assets being depreciated:BuildingsImprovements other than buildingsIntangibles, depreciableMachinery and equipment
Improvements other than buildings
Depreciation expense was charged to various functions as follows:
General government 5,022$Public safety 5,148Highway and streets, including general infrastructure 25,295Culture and recreation 11,684
Total depreciation expense - governmental activities 47,149$
Governmental activities:
Electric 30,953$Water 13,510Sewer 7,025Airport 707Refuse 1,211Transportation 526Public Parking 993
Total depreciation expense - business-type activities 54,925$
Business-type activities:
6. Long-Term Obligations
Changes in Long-Term Obligations: Below is a summary of changes in long-term obligations during the fiscal year:
Beginning Ending Due WithinBalance Additions Reductions Balance One Year
General obligations bond 13,546$ -$ (979)$ 12,567$ 1,040$ 108,725 31,145 (38,870) 101,000 40,025 187,212 - (5,783) 181,429 5,920
Lease revenue bonds 40,891 - (1,493) 39,398 1,420 Loan payable 45,574 - (2,092) 43,482 2,157
14,966 - (2,960) 12,006 2,769 Compensated absences 22,015 13,567 (13,138) 22,444 13,394 Claims liability 38,795 14,581 (10,107) 43,269 11,315 Judgment 3,334 - (3,334) - - OPEB obligation 16,361 2,057 (541) 17,877 -
491,419$ 61,350$ (79,297)$ 473,472$ 78,040$
Certif icates of participation
Governmental activities:
Pension obligation bonds
Capital leases
Beginning Ending Due WithinBalance Additions Reductions Balance One Year
Revenue bonds 1,239,634$ -$ (30,783)$ 1,208,851$ 26,555$37,225 3,081 (2,513) 37,793 2,5371,720 3,648 (674) 4,694 7895,922 - (236) 5,686 200
Arbitrage liability 15 - (15) - - Water stock acquisition rights 941 - (3) 938 150Compensated absences 8,444 6,954 (7,278) 8,120 6,994OPEB obligation 13,072 1,659 (436) 14,295 -
1,306,973$ 15,342$ (41,938)$ 1,280,377$ 37,225$
Capital leases
Business-type activities:
Notes payable
Landfill capping
Business-type activities:
The following debt has been issued for the purpose of generating capital resources for use in acquiring or constructing municipal facilities or infrastructure projects.

City of Riverside Notes to Basic Financial Statements For the year ended June 30, 2016 (amounts expressed in thousands)
Long-Term Obligations at June 30, 2016:
Revenue Bonds: Principal
Outstanding
Electric
$141,840 2008 Electric Refunding/Revenue Bonds; Series A & C. The bonds were issued at a variable rate; however, the City entered into an agreement to convert to a fixed rate of 3.1% and 3.2% for the Series A & C bonds, respectively. See Note 10 for information on the swap agreements. Bonds are due in annual installments from $700 to $7,835 through October 1, 2035. 112,515
$209,740 2008 Electric Revenue Bonds; Series D fixed rate bonds, 3.6% to 5.0%, due in annual installments from $3,460 to $25,345 through October 1, 2038.
209,740
$34,920 2009 Electric Refunding/Revenue Bonds; Series A fixed rate bonds, 4.0% to 5.0%, due in annual installments from $1,150 to $7,035 through October 1, 2018. The bonds refunded the 1998 series and partially refunded the 2001 series.
3,640
$140,380 2010 Electric Revenue Bonds; Series A and B fixed rate bonds, 3% to 5.0%, due in annual installments from $95 to $33,725 through October 1, 2040.
140,380
$56,450 2011 Electric Revenue Refunding Bonds; Series A. The bonds were issued at a variable rate; however, the City entered into an agreement to convert to a fixed rate of 3.2%. For information on the swap agreements see Note 10. Bonds are due in annual installments from $725 to $5,175 through October 1, 2035.
41,925
$79,080 2013 Electric Revenue Refunding Bonds; Series A fixed rate bonds, 3% to 5.25%, due in annual installments from $795 to $12,685 through October 1, 2043.
58,635
Subtotal 566,835 Add: Unamortized bond premium 8,213 $575,048
Water
$58,235 2008 Water Revenue Bonds; Series B fixed rate bonds, 4.0% to 5.0%, due in annual installments from $1,210 to $7,505 through October 1, 2038. $58,235
$31,895 2009 Water Refunding/Revenue Bonds; Series A fixed rate bonds, 3.0% to 5.0%, due in annual installments from $2,360 to $4,335 through October 1, 2020. The bonds refunded the 1998 series and partially refunded the 2001 series. 12,730
$67,790 2009 Water Revenue Bonds; Series B fixed rate bonds, 3.3% to 4.1%, due in annual installments from $2,475 to $4,985 through October 1, 2039. 67,790
$59,000 2011 Water Refunding/Revenue Bonds; Series A. The bonds were issued at a variable rate; however the City entered into an agreement to convert to a fixed rate of 3.2%. For information on the swap agreements see Note 10. Bonds are due in annual installments from $600 to $3,950 through October 1, 2035. 54,725
Subtotal 193,480 Add: Unamortized bond premium 2,442
$195,922
Sewer
$240,910 2009 Sewer Revenue Bonds; Series A & B fixed rate bonds, 3.65% to 5.0%, due in annual installments from $5,555 to $13,350 through August 1, 2039. $212,130
On June 15, 2015, the City issued Series 2015A Sewer Revenue Bonds in the amount of $200,030. A portion of the bond proceeds were used to refund the 2014 Sewer Revenue Bonds short term borrowing, as a result, no economic gain was achieved. Interest on the bonds is payable semi-annually on August 1 and February 1 of each year, commencing August 1, 2015. The rate of interest varies from 4% to 5% per annum depending on maturity date. Principal is payable in annual installments

City of Riverside Notes to Basic Financial Statements For the year ended June 30, 2016 (amounts expressed in thousands)
ranging from $4,790 to $14,175 commencing August 1, 2015 and ending August 1, 2040.
200,030
Subtotal 412,160 Add: Unamortized bond premium 25,721
$437,881
Total Revenue Bonds $1,208,851
Remaining revenue bond debt service payments will be made from revenues of the Electric, Water and Sewer Enterprise funds. Annual debt service requirements to maturity are as follows:
Fiscal Year Principal Interest Total Principal Interest Total2017 13,320$ 24,863$ 38,183$ 5,180$ 7,814$ 12,994$ 2018 13,795 24,279 38,074 5,415 7,577 12,992 2019 14,445 23,636 38,081 5,635 7,352 12,987 2020 14,995 23,066 38,061 5,865 7,120 12,985 2021 15,535 22,506 38,041 6,080 6,889 12,969
2022-2026 86,775 102,985 189,760 33,990 30,773 64,763 2027-2031 106,045 83,014 189,059 41,110 23,417 64,527 2032-2036 130,725 57,166 187,891 49,955 14,297 64,252 2037-2041 163,695 22,967 186,662 40,250 3,234 43,484 2042-2044 7,505 575 8,080 - - - Premium 8,213 - 8,213 2,442 - 2,442
Total 575,048$ 385,057$ 960,105$ 195,922$ 108,473$ 304,395$
Electric Utility Fund Water Utility Fund
Fiscal Year Principal Interest Total2017 8,055$ 19,255$ 27,310$ 2018 8,410 18,900 27,310 2019 13,515 18,488 32,003 2020 14,075 17,929 32,004 2021 10,820 17,372 28,192
2022-2026 62,565 78,394 140,959 2027-2031 79,435 61,525 140,960 2032-2036 101,090 39,873 140,963 2037-2041 114,195 13,104 127,299 Premium 25,721 - 25,721
Total 437,881$ 284,840$ 722,721$
Sewer Utility Fund
General Obligation Bonds: Principal Outstanding
$20,000 Fire Facility Projects, Election of 2003 General Obligation Bond; 3.0% to 5.5%, due in annual installments from $410 to $1,740 through August 1, 2024. $ 12,430 Add: Unamortized bond premium 137 Total General Obligation Bonds $12,567
Remaining general obligation bond debt service payments will be made from unrestricted revenues of the General fund. Annual debt service requirements to maturity are as follows:
Fiscal Year Principal Interest Total2017 1,040$ 592$ 1,632$ 2018 1,110 544 1,654 2019 1,195 493 1,688 2020 1,290 436 1,726 2021 1,380 373 1,753
2022-2025 6,415 724 7,139 Premium 137 - 137
Total 12,567$ 3,162$ 15,729$
Pension Obligation Bonds: Principal
Outstanding
$89,540 California Statewide Community Development Authority (Public Safety) 2004 Taxable Pension Obligation Bond; 2.65% to 5.896%, due in annual installments from $1,125 to $10,715 through June 1, 2023.
$ 56,600
$30,000 2005 Taxable Pension Obligation Bonds Series A; 3.85% to 4.78%, due in annual installments $630 to $3,860 through June 1, 2020. 13,255
$31,145 2016 Taxable Pension Obligation Refunding Bond Anticipation Notes; rate at June 30, 2016 was 0.75%, $31,145 due June 1, 2017. The refunding transaction did not result in an economic gain.

City of Riverside Notes to Basic Financial Statements For the year ended June 30, 2016 (amounts expressed in thousands)
31,145Total Pension Obligation Bonds $101,000
Remaining pension obligation bond debt service payments will be made from unrestricted revenues of the General fund. Annual debt service requirements to maturity are as follows:
Fiscal Year Principal Interest Total2017 40,025$ 4,280$ 44,305$ 2018 9,920 3,482 13,402 2019 11,035 2,936 13,971 2020 10,760 2,329 13,089 2021 8,815 1,725 10,540
2022-2023 20,445 1,837 22,282 Total 101,000$ 16,589$ 117,589$
Certificates of Participation: Principal Outstanding
$19,945 2006 Galleria at Tyler Public Improvements Certificates of Participation; 4.0% to 5.0%, due in annual installments from $435 to $1,270 through September 1, 2036. $17,575
$128,300 2008 Riverside Renaissance Certificates of Participation; issued at a variable rate; however, the City entered into an agreement to convert to a fixed rate of 3.4%. For information on the swap agreement see Note 10. Due in annual installments from $2,900 to $7,200 through March 1, 2037. 109,300$20,660 2010 Recovery Zone Facility Hotel Project Certificates of Participation; 4.0% to 5.5%, due in annual installments from $415 to $1,410 through March 1, 2040. $35,235 2013 Pavement Rehab Certificates of Participation; 4.0% to 5.0%, due in annual installments from $1,285 to $2,855 through June 1, 2034
19,815
33,950Subtotal 180,640Plus: Unamortized bond premium 789Total Certificates of Participation $181,429
Remaining certificates of participation debt service payments will be made from unrestricted revenues of the debt service fund. Annual debt service requirements to maturity are as follows:
Fiscal Year Principal Interest Total2017 5,920$ 7,137$ 13,057$ 2018 6,110 6,922 13,032 2019 6,310 6,700 13,010 2020 6,630 6,451 13,081 2021 6,955 6,188 13,143
2022-2026 38,780 26,602 65,382 2027-2031 47,430 18,160 65,590 2032-2036 48,815 8,066 56,881 2037-2040 13,690 950 14,640 Premium 789 - 789
Total 181,429$ 87,176$ 268,605$
Lease Revenue Bonds – Governmental Activities: Principal Outstanding
On August 15, 2012, the City issued the Series 2012A Lease Revenue Refunding Bonds in the amount of $41,240. The bonds were issued to refinance the 2003 Certificates of Participation. Interest on the bonds is payable semi-annually on May 1 and November 1 of each year, commencing May 1, 2013. The rate of interest varies from 2% to 5% per annum depending on maturity date. Principal is payable in annual installments ranging from $1,295 to $2,840 commencing November 1, 2013 and ending November 1, 2033.
Add: Unamortized bond premium Total Lease Revenue Bonds – Governmental Activities
$37,245
2,153 $39,398
Remaining lease revenue bond debt service payments will be made from unrestricted revenues of the debt service fund. Annual debt service requirements to maturity are as follows:
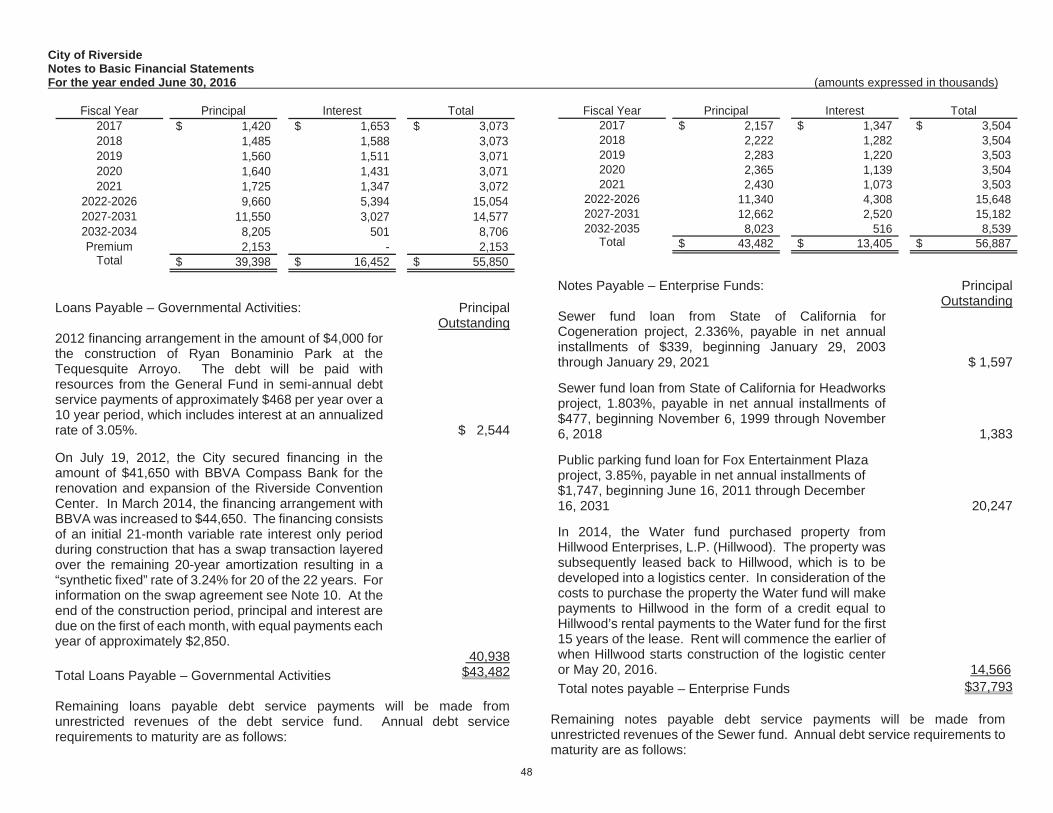
City of Riverside Notes to Basic Financial Statements For the year ended June 30, 2016 (amounts expressed in thousands)
Fiscal Year Principal Interest Total2017 1,420$ 1,653$ 3,073$ 2018 1,485 1,588 3,073 2019 1,560 1,511 3,071 2020 1,640 1,431 3,071 2021 1,725 1,347 3,072
2022-2026 9,660 5,394 15,054 2027-2031 11,550 3,027 14,577 2032-2034 8,205 501 8,706 Premium 2,153 - 2,153
Total 39,398$ 16,452$ 55,850$
Loans Payable – Governmental Activities: Principal Outstanding
2012 financing arrangement in the amount of $4,000 for the construction of Ryan Bonaminio Park at the Tequesquite Arroyo. The debt will be paid with resources from the General Fund in semi-annual debt service payments of approximately $468 per year over a 10 year period, which includes interest at an annualized rate of 3.05%. $ 2,544
On July 19, 2012, the City secured financing in the amount of $41,650 with BBVA Compass Bank for the renovation and expansion of the Riverside Convention Center. In March 2014, the financing arrangement with BBVA was increased to $44,650. The financing consists of an initial 21-month variable rate interest only period during construction that has a swap transaction layered over the remaining 20-year amortization resulting in a “synthetic fixed” rate of 3.24% for 20 of the 22 years. For information on the swap agreement see Note 10. At the end of the construction period, principal and interest are due on the first of each month, with equal payments each year of approximately $2,850.
40,938Total Loans Payable – Governmental Activities $43,482
Remaining loans payable debt service payments will be made from unrestricted revenues of the debt service fund. Annual debt service requirements to maturity are as follows:
Fiscal Year Principal Interest Total2017 2,157$ 1,347$ 3,504$ 2018 2,222 1,282 3,504 2019 2,283 1,220 3,503 2020 2,365 1,139 3,504 2021 2,430 1,073 3,503
2022-2026 11,340 4,308 15,648 2027-2031 12,662 2,520 15,182 2032-2035 8,023 516 8,539
Total 43,482$ 13,405$ 56,887$
Notes Payable – Enterprise Funds: Principal Outstanding
Sewer fund loan from State of California for Cogeneration project, 2.336%, payable in net annual installments of $339, beginning January 29, 2003 through January 29, 2021 $ 1,597
Sewer fund loan from State of California for Headworks project, 1.803%, payable in net annual installments of $477, beginning November 6, 1999 through November 6, 2018 1,383
Public parking fund loan for Fox Entertainment Plaza project, 3.85%, payable in net annual installments of $1,747, beginning June 16, 2011 through December 16, 2031
In 2014, the Water fund purchased property from Hillwood Enterprises, L.P. (Hillwood). The property was subsequently leased back to Hillwood, which is to be developed into a logistics center. In consideration of the costs to purchase the property the Water fund will make payments to Hillwood in the form of a credit equal to Hillwood’s rental payments to the Water fund for the first 15 years of the lease. Rent will commence the earlier of when Hillwood starts construction of the logistic center or May 20, 2016.
20,247
14,566 Total notes payable – Enterprise Funds $37,793
Remaining notes payable debt service payments will be made from unrestricted revenues of the Sewer fund. Annual debt service requirements to maturity are as follows:

City of Riverside Notes to Basic Financial Statements For the year ended June 30, 2016 (amounts expressed in thousands)
Fiscal Year Principal Interest Total2017 759$ 58$ 817$ 2018 774 43 817 2019 788 28 816 2020 326 14 340 2021 333 7 340 Total 2,980$ 150$ 3,130$
Sewer Fund
Fiscal Year Principal Interest Total2017 977$ 770$ 1,747$ 2018 1,014 732 1,746 2019 1,054 693 1,747 2020 1,095 652 1,747 2021 1,137 609 1,746
2022-2026 6,386 2,348 8,734 2027-2031 7,727 1,006 8,733
2032 857 17 874 Total 20,247$ 6,827$ 27,074$
Public Parking Fund
Fiscal Year Principal Interest Total2017 801$ 242$ 1,043$ 2018 837 228 1,065 2019 873 214 1,087 2020 910 198 1,108 2021 947 183 1,130
2022-2026 5,346 653 5,999 2027-2030 4,852 166 5,018
Total 14,566$ 1,884$ 16,450$
Water Fund
Contracts – Enterprise Funds: Principal Outstanding
Water stock acquisition rights payable on demand to various water companies $938
Letters of Credit:
The City’s 2008 Certificates of Participation and 2008 Electric Revenue Bonds (Series A and C) require an additional layer of security between the City and the purchaser of the bonds. The City has entered into the following letters of
credit (“LOC”) in order to provide liquidity should all or a portion of the debt be optionally tendered to the remarketer without being successfully remarketed:
Debt Issue LOC Provider
LOC Expiration
Date
AnnualCommitment
Fee 2008 Certificates of Participation Bank of America, N.A. 2018 0.400% 2008A Electric Revenue Bonds Barclays Bank, PLC 2017 0.275% 2008C Electric Revenue Bonds Bank of America, N.A. 2017 0.390%
To the extent that remarketing proceeds are insufficient or not available, tendered amounts will be paid from drawings made under an irrevocable direct-pay letter of credit.
Liquidity advances drawn against the LOC that are not repaid will be converted to an installment loan over a 5-year period. The City would be required to pay $63,420 a year for 5 years (assuming a 12 percent interest rate) if $109,300 of 2008 Certificates of Participation and $112,515 of 2008 Electric Revenue Bonds (Series A and C) were “put” and not resold. No amounts have ever been drawn against the three letters of credit due to a failed remarketing.
The various indentures allow the City to convert the mode of the debt in the case of a failed remarketing.
Capital Leases:
The City leases various equipment through capital leasing arrangements in the governmental and proprietary fund types. These activities are recorded for both governmental and business-type activities in the government-wide financial statements. The assets and related obligations under leases in governmental funds are not recorded in the fund statements. For proprietary funds, the assets and their related liabilities are reported directly in the fund. Amortization applicable to proprietary assets acquired through capital lease arrangements is included with depreciation for financial statement presentation.

City of Riverside Notes to Basic Financial Statements For the year ended June 30, 2016 (amounts expressed in thousands)
The assets acquired through capital leases are as follows:
Governmental Business-typeAsset Activities ActivitiesBuildings and improvements 1,103$ -$ Machinery and equipment 15,334 5,715 Subtotal 16,437 5,715 Less: Accumulated depreciation (6,286) (985) Total 10,151$ 4,730$
The future minimum lease obligations as of June 30, 2016 were as follows:
Governmental Business-typeFiscal Year Activities Activities2017 2,971$ 881$ 2018 2,971 881 2019 2,665 881 2020 1,485 868 2021 1,485 559 Thereafter 1,019 926 Total minimum lease payments 12,596 4,996 Less: Amount representing interest (rates ranging from 1.2% to 9%) (590) (302) Total capital lease payable 12,006$ 4,694$
The following are legally required debt service cash reserves. These amounts, at a minimum, are held by the City or fiscal agents at June 30, 2016:
Governmental long-term obligations:Certificates of participation 10,383$ Total 10,383$
Enterprise funds:Electric 10,801$ Sewer 20,204 Total 31,005$
The City has a number of debt issuances outstanding that are collateralized by the pledging of certain revenues. The amount and term of the remainder of these commitments are indicated in the debt service to maturity tables presented in the accompanying notes. The purposes for which the proceeds of the related debt issuances were utilized are disclosed in the debt descriptions in the accompanying notes. For the current year, debt service payments as a percentage of the pledged gross revenue (or net of certain
expenses where so required by the debt agreement) are indicated in the table below. The debt service coverage ratios also approximate the relationship of debt service to pledged revenue for the remainder of the term of the commitment.
Pledged Revenue Payments (all of RatioDescription of (net of expenses, debt secured by for FYPledged Revenue where required) this revenue) 06/30/16Electric revenues 126,458$ 42,240$ 2.99$ Water revenues 26,245 13,596 1.93 Sewer revenues 36,548* 29,191 1.25
* Includes cash set-aside in a rate stabilization account in accordance with applicable bond covenants.
There are also a number of limitations and restrictions contained in Assessment Bond indentures. The City believes they are in compliance with all significant limitations and restrictions.
Landfill Capping:
State and Federal laws and regulations require the City to place a final cover on all active landfills when closed and to perform certain maintenance and monitoring functions at the landfill site for 30 years after closure. To comply with these laws and regulations, the City is funding the costs of closure and "final capping" of the Tequesquite landfill located in the City. This area, comprised of approximately 120 acres, operated as a "Class II Sanitary Landfill" until its closure in 1985. During its operation, the landfill did not accept hazardous waste and no clean up and abatement or cease and desist orders have been issued to the City. The capacity used at June 30, 2016 was 100%. The remaining post closure period is currently 14 years.
The estimated costs as determined by an independent consultant and updated by the City’s Engineering Department are associated with flood control upgrades, remediation of possible ground water contamination and control of methane gas. All potential costs have been recognized in the financial statements. However, there is the potential for these estimates to change due to inflation, deflation, technology, or change in laws or regulations. The City is recovering such costs in rates charged to its customers. The portion of costs to be recovered through future rates is classified as a regulatory asset and will be amortized over future periods.
City of Riverside Notes to Basic Financial Statements For the year ended June 30, 2016 (amounts expressed in thousands)
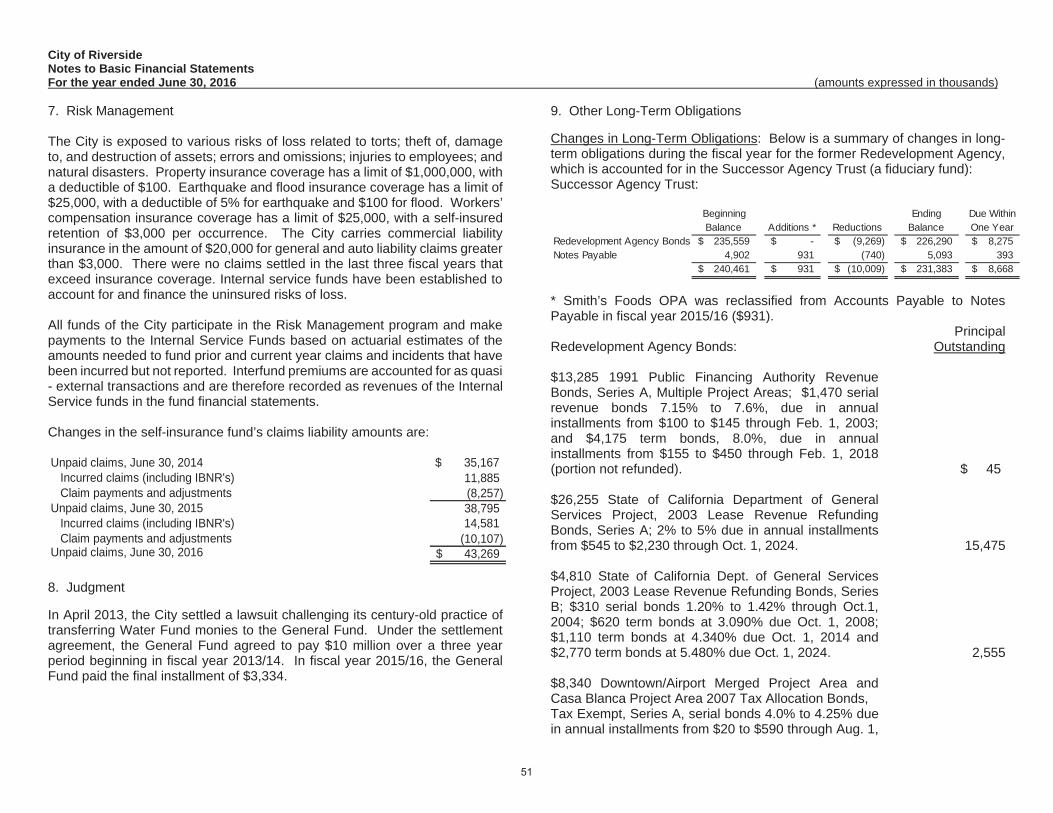
7. Risk Management
The City is exposed to various risks of loss related to torts; theft of, damage to, and destruction of assets; errors and omissions; injuries to employees; and natural disasters. Property insurance coverage has a limit of $1,000,000, with a deductible of $100. Earthquake and flood insurance coverage has a limit of $25,000, with a deductible of 5% for earthquake and $100 for flood. Workers’ compensation insurance coverage has a limit of $25,000, with a self-insured retention of $3,000 per occurrence. The City carries commercial liability insurance in the amount of $20,000 for general and auto liability claims greater than $3,000. There were no claims settled in the last three fiscal years that exceed insurance coverage. Internal service funds have been established to account for and finance the uninsured risks of loss.
All funds of the City participate in the Risk Management program and make payments to the Internal Service Funds based on actuarial estimates of the amounts needed to fund prior and current year claims and incidents that have been incurred but not reported. Interfund premiums are accounted for as quasi - external transactions and are therefore recorded as revenues of the Internal Service funds in the fund financial statements.
Changes in the self-insurance fund’s claims liability amounts are:
Unpaid claims, June 30, 2014 $ 35,167 Incurred claims (including IBNR's) 11,885 Claim payments and adjustments (8,257) Unpaid claims, June 30, 2015 38,795 Incurred claims (including IBNR's) 14,581 Claim payments and adjustments (10,107) Unpaid claims, June 30, 2016 43,269$
8. Judgment
In April 2013, the City settled a lawsuit challenging its century-old practice of transferring Water Fund monies to the General Fund. Under the settlement agreement, the General Fund agreed to pay $10 million over a three year period beginning in fiscal year 2013/14. In fiscal year 2015/16, the General Fund paid the final installment of $3,334.
9. Other Long-Term Obligations
Changes in Long-Term Obligations: Below is a summary of changes in long-term obligations during the fiscal year for the former Redevelopment Agency, which is accounted for in the Successor Agency Trust (a fiduciary fund): Successor Agency Trust:
Beginning Ending Due WithinBalance Additions * Reductions Balance One Year
Redevelopment Agency Bonds 235,559$ -$ (9,269)$ 226,290$ 8,275$ 4,902 931 (740) 5,093 393
240,461$ 931$ (10,009)$ 231,383$ 8,668$ Notes Payable
* Smith’s Foods OPA was reclassified from Accounts Payable to Notes Payable in fiscal year 2015/16 ($931).
Redevelopment Agency Bonds: Principal
Outstanding
$13,285 1991 Public Financing Authority Revenue Bonds, Series A, Multiple Project Areas; $1,470 serial revenue bonds 7.15% to 7.6%, due in annual installments from $100 to $145 through Feb. 1, 2003; and $4,175 term bonds, 8.0%, due in annual installments from $155 to $450 through Feb. 1, 2018 (portion not refunded). $ 45
$26,255 State of California Department of General Services Project, 2003 Lease Revenue Refunding Bonds, Series A; 2% to 5% due in annual installments from $545 to $2,230 through Oct. 1, 2024. 15,475
$4,810 State of California Dept. of General Services Project, 2003 Lease Revenue Refunding Bonds, Series B; $310 serial bonds 1.20% to 1.42% through Oct.1, 2004; $620 term bonds at 3.090% due Oct. 1, 2008; $1,110 term bonds at 4.340% due Oct. 1, 2014 and $2,770 term bonds at 5.480% due Oct. 1, 2024. 2,555
$8,340 Downtown/Airport Merged Project Area and Casa Blanca Project Area 2007 Tax Allocation Bonds, Tax Exempt, Series A, serial bonds 4.0% to 4.25% due in annual installments from $20 to $590 through Aug. 1,

City of Riverside Notes to Basic Financial Statements For the year ended June 30, 2016 (amounts expressed in thousands)
2025; $4,980 term bonds at 4.5% due Aug. 1, 2029; $410 term bonds at 4.375% due Aug. 1, 2037.
$14,850 Downtown/Airport Merged Project Area and Casa Blanca Project Area 2007 Tax Allocation Bonds, Taxable, Series B, $4,050 term bonds at 5.2% due Aug. 1, 2017; $10,800 term bonds at 5.8% due Aug. 1, 2028.
$89,205 University Corridor/Sycamore Canyon Merged Project Area, Arlington Project Area, Hunter Park/Northside Project Area, Magnolia Center Project Area, and La Sierra/Arlanza Project Area 2007 Tax Allocation Bonds, Tax-Exempt, Series C, serial bonds 4.0% to 5.0% due in annual installments from $50 to $3,210 through Aug. 1, 2025; $17,955 term bonds at 4.5% due Aug. 1, 2030; $47,775 term bonds at 5.0% due Aug. 1, 2037.
$43,875 University Corridor/Sycamore Canyon Merged Project Area, Arlington Project Area, Hunter Park/Northside Project Area, Magnolia Center Project Area, and La Sierra/Arlanza Project Area 2007 Tax Allocation Bonds, Taxable, Series D, $15,740 term bonds at 5.24% due Aug. 1, 2017; $28,135 term bonds at 5.89% due Aug. 1, 2032.
On October 16 2014, the Successor Agency to the Redevelopment Agency of the City of Riverside issued 2014 Subordinate Tax Allocation Refunding Bonds (Series A and B) in the amount of $62,980. The bonds were issued to refund certain obligations of the former Redevelopment Agency of the City of Riverside. The refunding transaction resulted in an economic gain of $10,312 and a net debt service savings of $17,345. Interest is due semi-annually on March 1 and September 1, commencing March 1, 2015. Principal is due in annual installments from $160 to $4,745 through September 1, 2034. The rate of interest varies from 0.6% to 5% per annum.
8,170
11,620
85,960
31,430
58,845Subtotal 214,100Add: Unamortized bond premium 12,190Total Redevelopment Agency Bonds $226,290
Remaining debt service will be paid by the Successor Agency Trust from future property tax revenues. Annual debt service requirements to maturity are as follows:
Fiscal Year Principal Interest Total2017 8,275$ 10,892$ 19,167$ 2018 8,920 10,589 19,509 2019 9,320 10,222 19,542 2020 9,830 9,778 19,608 2021 10,805 9,288 20,093
2022-2026 59,140 37,860 97,000 2027-2031 49,980 23,308 73,288 2032-2036 42,735 11,453 54,188 2037-2038 15,095 1,691 16,786 Premium 12,190 - 12,190
Total 226,290$ 125,081$ 351,371$
Notes Payable – Successor Agency: Principal Outstanding
These notes payable have been issued to promote development and expansion within the City’s redevelopment areas.
Pepsi Cola Bottling Company of Los Angeles, 10.5%, payable in net annual installments of $341, subject to recording of completion. 2,987
HUD Section 108 loan for Mission Village Project, 6.15% to 6.72%, payable in semi-annual installments beginning Aug. 1, 1999 of $110 to $420 through Aug. 1, 2018 1,175
Smith’s Food & Drug Centers Inc., 6% payable in variable installments, subject to payment of annual Community Facilities District assessment. 931
Total Notes Payable – Successor Agency $ 5,093
Remaining debt service will be paid by the Successor Agency Trust from future property tax revenues. Annual debt service requirements to maturity are as follows:

City of Riverside Notes to Basic Financial Statements For the year ended June 30, 2016 (amounts expressed in thousands)
Fiscal Year Principal Interest Total2017 393$ 360$ 753$ 2018 421 340 761 2019 454 326 780 2020 38 310 348 2021 42 300 342
2022-2026 1,217 1,423 2,640 2027-2031 471 1,238 1,709 2032-2036 777 933 1,710 2037-2038 1,280 430 1,710
Total 5,093$ 5,660$ 10,753$
As a result of action by the State of California to dissolve all redevelopment agencies in the state, the Successor Agency no longer receives the full amount of tax increment previously pledged by the dissolved redevelopment agency to its bondholders. In its place is a new revenue stream provided to the Successor Agency that represents only that portion of tax increment that is necessary to pay the enforceable obligations approved by the California Department of Finance.
For the current year, debt service payments as a percentage of the pledged gross revenue (or net of certain expenses where so required by the debt agreement) are indicated in the table below. The debt service coverage ratios for the Successor Agency also approximate the relationship of debt service to pledged revenue for the remainder of the term of the commitment.
Debt ServiceAnnual Amount of Annual Debt Service CoveragePledged Revenue Payments (all of Ratio
Description of (net of expenses, debt secured by for FYPledged Revenue where required) * this revenue) 06/30/16Property Taxes: Non-Housing 46,045$ 14,327$ 3.21 Housing 9,196 2,586 3.56
* The computations above are based on the total tax increment generated for the year ended June 30, 2016 for each project area that had been pledged as collateral for the Bonds. As discussed above, only a portion of tax increment has been actually remitted to the Successor Agency and reported as revenue in the accompanying financial statements.
Assessment Districts and Community Facilities Districts Bonds (Not obligations of the City):
As of June 30, 2016, the City has several series of Assessment District and Community Facility District Bonds outstanding in the amount of $45,805. Bonds were issued for improvements in certain districts and are long-term obligations of the property owners. The City Treasurer acts as an agent for the property owners in collecting the assessments, forwarding the collections to bondholders and initiating foreclosure proceedings, if applicable. Since the debt does not constitute an obligation of the City, it is not reflected as a long-term obligation of the City and is not reflected in the accompanying basic financial statements.
10. Derivative Instruments
Interest Rate Swaps
The City has six cash flow hedging derivative instruments, which are pay-fixed swaps. These swaps were employed as a hedge against debt that was refunded in 2008 and 2011 and against debt issued in 2012. The balance of the deferral account for each swap is included as part of the deferred charge on refunding associated with the new bonds. The swaps were also employed as a hedge against the new debt. Hedge accounting was applied to that portion of the hedging relationship, which was determined to be effective. Hedge accounting was also applied to the swap associated with the debt issued in 2012, which was also determined to be effective.
The following is a summary of the derivative activity for the year ended June 30, 2016:
Change inFair Value Fair Value
Notional as of for FiscalAmount 06/30/16 Year
Governmental activities2008 Renaissance Certificates of Participation 109,300$ (28,518)$ (7,504)$2012 Convention Center Financing 38,327 (2,946) (2,263)
Business-type activities2008 Electric Refunding/Revenue Bonds Series A 68,525 (11,984) (2,887)2008 Electric Refunding/Revenue Bonds Series C 41,975 (11,122) (3,508)2011 Electric Refunding/Revenue Bonds Series A 41,925 (11,095) (3,508)2011 Water Refunding/Revenue Bonds Series A 54,725 (12,398) (3,537)
Objective: In order to lower borrowing costs as compared to fixed-rate bonds, the City entered into interest rate swap agreements in connection with its $141,840 2008 Electric Revenue Bonds (Series A and C), $56,450 2011 Electric Revenue Bonds, $59,000 2011 Water Revenue Bonds and $128,300
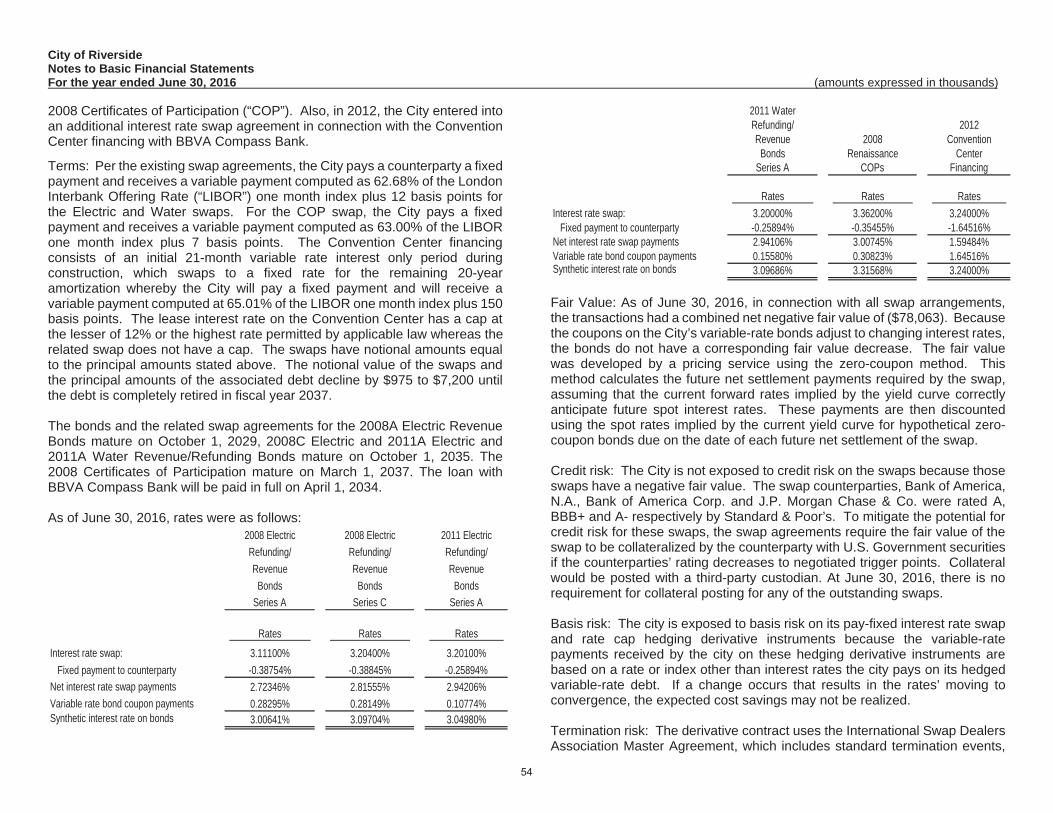
City of Riverside Notes to Basic Financial Statements For the year ended June 30, 2016 (amounts expressed in thousands)
2008 Certificates of Participation (“COP”). Also, in 2012, the City entered into an additional interest rate swap agreement in connection with the Convention Center financing with BBVA Compass Bank.
Terms: Per the existing swap agreements, the City pays a counterparty a fixed payment and receives a variable payment computed as 62.68% of the London Interbank Offering Rate (“LIBOR”) one month index plus 12 basis points for the Electric and Water swaps. For the COP swap, the City pays a fixed payment and receives a variable payment computed as 63.00% of the LIBOR one month index plus 7 basis points. The Convention Center financing consists of an initial 21-month variable rate interest only period during construction, which swaps to a fixed rate for the remaining 20-year amortization whereby the City will pay a fixed payment and will receive a variable payment computed at 65.01% of the LIBOR one month index plus 150 basis points. The lease interest rate on the Convention Center has a cap at the lesser of 12% or the highest rate permitted by applicable law whereas the related swap does not have a cap. The swaps have notional amounts equal to the principal amounts stated above. The notional value of the swaps and the principal amounts of the associated debt decline by $975 to $7,200 until the debt is completely retired in fiscal year 2037.
The bonds and the related swap agreements for the 2008A Electric Revenue Bonds mature on October 1, 2029, 2008C Electric and 2011A Electric and 2011A Water Revenue/Refunding Bonds mature on October 1, 2035. The 2008 Certificates of Participation mature on March 1, 2037. The loan with BBVA Compass Bank will be paid in full on April 1, 2034.
As of June 30, 2016, rates were as follows: 2008 Electric 2008 Electric 2011 ElectricRefunding/ Refunding/ Refunding/Revenue Revenue Revenue
Bonds Bonds BondsSeries A Series C Series A
Rates Rates Rates
Interest rate swap: 3.11100% 3.20400% 3.20100% Fixed payment to counterparty -0.38754% -0.38845% -0.25894%Net interest rate swap payments 2.72346% 2.81555% 2.94206%Variable rate bond coupon payments 0.28295% 0.28149% 0.10774%Synthetic interest rate on bonds 3.00641% 3.09704% 3.04980%
2011 WaterRefunding/ 2012Revenue 2008 Convention
Bonds Renaissance CenterSeries A COPs Financing
Rates Rates RatesInterest rate swap: 3.20000% 3.36200% 3.24000% Fixed payment to counterparty -0.25894% -0.35455% -1.64516%Net interest rate swap payments 2.94106% 3.00745% 1.59484%Variable rate bond coupon payments 0.15580% 0.30823% 1.64516%Synthetic interest rate on bonds 3.09686% 3.31568% 3.24000%
Fair Value: As of June 30, 2016, in connection with all swap arrangements, the transactions had a combined net negative fair value of ($78,063). Because the coupons on the City’s variable-rate bonds adjust to changing interest rates, the bonds do not have a corresponding fair value decrease. The fair value was developed by a pricing service using the zero-coupon method. This method calculates the future net settlement payments required by the swap, assuming that the current forward rates implied by the yield curve correctly anticipate future spot interest rates. These payments are then discounted using the spot rates implied by the current yield curve for hypothetical zero-coupon bonds due on the date of each future net settlement of the swap.
Credit risk: The City is not exposed to credit risk on the swaps because those swaps have a negative fair value. The swap counterparties, Bank of America, N.A., Bank of America Corp. and J.P. Morgan Chase & Co. were rated A, BBB+ and A- respectively by Standard & Poor’s. To mitigate the potential for credit risk for these swaps, the swap agreements require the fair value of the swap to be collateralized by the counterparty with U.S. Government securities if the counterparties’ rating decreases to negotiated trigger points. Collateral would be posted with a third-party custodian. At June 30, 2016, there is no requirement for collateral posting for any of the outstanding swaps.
Basis risk: The city is exposed to basis risk on its pay-fixed interest rate swap and rate cap hedging derivative instruments because the variable-rate payments received by the city on these hedging derivative instruments are based on a rate or index other than interest rates the city pays on its hedged variable-rate debt. If a change occurs that results in the rates’ moving to convergence, the expected cost savings may not be realized.
Termination risk: The derivative contract uses the International Swap Dealers Association Master Agreement, which includes standard termination events,

City of Riverside Notes to Basic Financial Statements For the year ended June 30, 2016 (amounts expressed in thousands)
such as failure to pay and bankruptcy. The Schedule to the Master Agreement includes an “additional termination event.” That is, a swap may be terminated by the City if either counterparty’s credit quality falls below “BBB-“ as issued by Standard and Poor’s. The City or the counterparty may terminate a swap if the other party fails to perform under the terms of the contract. If a swap is terminated, the variable-rate bond would no longer carry a synthetic interest rate. Also, if at the time of termination a swap has a negative fair value, the City would be liable to the counterparty for a payment equal to the swap’s fair value.
Swap payments and associated debt: As of June 30, 2016, the debt service requirements of the variable-rate debt and net swap payments assuming current interest rates remain the same, for their term are summarized in the following table. As rates vary, variable-rate bond interest payments and net swap payments will vary.
Interest RateFiscal Year Principal Interest Swaps, Net Total
2017 5,964$ 1,460$ 10,389$ 17,813$ 2018 7,217 1,419 10,210 18,846 2019 13,516 1,368 9,881 24,765 2020 16,610 1,298 9,428 27,336 2021 17,262 1,231 8,946 27,439
2022-2026 87,184 5,073 37,271 129,528 2027-2031 98,077 3,112 24,501 125,690 2032-2036 106,373 970 9,160 116,503 2037-2040 7,200 17 165 7,382
Total 359,403$ 15,948$ 119,951$ 495,302$
Variable-Rate Bonds
11. Economic Contingency
A portion of unassigned fund balance within the General Fund is set aside for future economic contingencies. The amount that has been set aside is equal to approximately 15% of General Fund expenditures.
12. Interfund Assets, Liabilities and Transfers
Due From/To Other Funds: These balances resulted from expenditures being incurred prior to receipt of the related revenue source.
The following table shows amounts receivable/payable between funds within the City at June 30, 2016:
Receivable Funds Payable Funds AmountGeneral Fund Nonmajor Governmental Funds 982$
Nonmajor Enterprise Funds 582 1,564
Electric Fund Central Stores Fund * 418 Water Fund Central Stores Fund * 179 Total 2,161$
* Internal service fund Advances To/From Other Funds: These balances consist of advances used to fund capital projects in advance of related financing/assessments and for other long-term borrowing purposes.
The following table shows amounts advanced from funds within the City to other funds within the City at June 30, 2016:
Receivable Funds Payable Funds AmounGeneral Fund Electric Fund 10,084$
Water Fund 4,338 Sewer Fund 2,775 Nonmajor Governmental Funds 462Nonmajor Enterprise Funds 1,865 Self-Insurance Trust Fund * 182 Central Stores Fund * 191 Central Garage Fund * 860
20,757 Sewer Fund Nonmajor Governmental Funds 5,984 Self-Insurance Trust Fund * Nonmajor Enterprise Funds 218
Central Garage Fund * 1,014 1,232
Central Garage Fund * Nonmajor Governmental Funds 3,460 31,433$

City of Riverside Notes to Basic Financial Statements For the year ended June 30, 2016 (amounts expressed in thousands)
In addition, the following advances to the former Redevelopment Agency are accounted for in the Private-Purpose Trust Fund of the Successor Agency: Receivable Funds AmountGeneral 582$ Nonmajor Governmental Funds 32,470 Electric 5,113 Self-Insurance Trust * 4,240 Total 42,405$
Transfers In/Out: Transfers are primarily used to (1) move revenues to the fund that statute or budget requires to expend them, and (2) move receipts restricted to debt service from the funds collecting the receipts to the debt service fund as debt service payments become due.
The following table shows amounts transferred to/from funds within the City for the year ended June 30, 2016:
Transfers In Funds Transfers Out Funds AmountGeneral Fund Electric Fund 38,360$
Water Fund 6,430 44,790
Capital Outlay Fund Nonmajor Governmental Funds 58
Nonmajor Governmental Funds General Fund 12,693 Capital Outlay Fund 3,105 Nonmajor Enterprise Funds 738
16,536 Water Fund General Fund 3,333
Sewer Fund General Fund 3 Capital Outlay Fund 51 Nonmajor Governmental Funds 207
261 Nonmajor Enterprise Funds General Fund 718
Total 65,696$
13. Deficit Net Position
Deficit net position exits in the Transportation Fund ($468). Staff is working with its transportation funding partner, the Riverside County Transportation Commission (RCTC), to resolve this funding shortfall. It is anticipated that the deficit will be reduced through the identification of additional funding sources over the next few years.
Deficit net position exists in the Self-Insurance Internal Service Fund ($31,763). In order to begin funding a portion of the deficit in the internal service fund, self-insurance rates were increased in the prior year with additional increases to occur over the next five years. However, the increases continue to be offset by unusually large losses incurred during the year combined with an adjustment for the increase in the amount estimated for claims and judgments. Management believes that there are sufficient funds on hand to cover current payment obligations and plans to continue to control costs and increase rates over the next few years as needed to match expected long-term payment requirements. Additionally, management is working on a reserve policy that will address current and future funding needs.
Deficit net position exists in the Successor Agency Private-Purpose Trust Fund ($178,009). The deficit in the Successor Agency Trust Fund will be reduced over the years as the related debt is paid-off with funds received from the Redevelopment Property Tax Trust Fund (RPTTF), which is administered by the County Auditor-Controller.
14. Litigation
The City is a defendant in various lawsuits arising in the normal course of business. Present lawsuits and other claims against the City are incidental to the ordinary course of operations and are largely covered by the City’s self-insurance program. In the opinion of management and the City Attorney, such claims and litigation will not have a materially adverse effect upon the financial position or results of operation of the City.
The Water Utility is a plaintiff in a lawsuit against several entities that either owned or leased a property site in the City of Colton and City of Rialto that is contaminated by perchlorate. The lawsuit was filed March 31, 2009, and no trial date has been set.
15. City Employees Retirement Plan
(A) Plan Description. The City of Riverside contributes to the California Public Employees Retirement System (CalPERS), an agent multiple employer public employee defined benefit pension plan. CalPERS provides retirement and

City of Riverside Notes to Basic Financial Statements For the year ended June 30, 2016 (amounts expressed in thousands)
disability benefits, annual cost-of-living adjustments, and death benefits to plan members and beneficiaries. CalPERS acts as a common investment and administrative agent for participating public entities within the State of California. Benefit provisions and all other requirements are established by state statute and City ordinance. A copy of CalPERS’ annual financial report may be obtained online at www.calpersca.gov.
(B) Funding Policy. The City has contributed at the actuarially determined rate provided by CalPERS’ actuaries. Participants are required to contribute 8% for miscellaneous employees and 9% for safety employees of their annual covered salary. The City has a multiple tier retirement plan with benefits varying by plan. The City pays the employees’ contributions to CalPERS for both miscellaneous and safety employees hired on or before specific dates as follows:
Safety (Police): 1st Tier (RPOA, RPOA Supervisory & RPAA) - The retirement formula
is 3% at age 50 for employees hired before February 16, 2012. The City pays the employee share (9%) of contributions on their behalf and for their account.
2nd Tier (RPOA only) - The retirement formula is 3% at age 50 and new employees hired on or after February 17, 2012 pay their share (9%) of contributions.
3rd Tier (RPOA, RPOA Supervisory & RPAA) – The retirement formula is 2.7% at age 57 for new members hired on or after January 1, 2013 and the employee must pay the employee share (9%). Classic members (CalPERS members prior to 12/31/12) hired on or after January 1, 2013 may be placed in a different tier.
Safety (Fire): 1st Tier - The retirement formula is 3% at age 50 for employees hired
before June 11, 2011. The City pays the employee share (9%) of contributions on their behalf and for their account.
2nd Tier - The retirement formula is 3% at age 55 and new employees hired on or after June 11, 2011 pay their share (9%) of contributions.
3rd Tier – The retirement formula is 2.7% at age 57 for new members hired on or after January 1, 2013 and the employee must pay the employee share (9%). Classic members (CalPERS members prior to 12/31/12) hired on or after January 1, 2013 may be placed in a different tier.
Miscellaneous:
1st Tier - The retirement formula is 2.7% at age 55. The City pays the employee share (8%) of contributions on their behalf and for their account except for general SEIU employees, which contributed 6% in fiscal year 2015/16, with the City paying the remaining 2% of the employee share.
2nd Tier - The retirement formula is 2.7% at age 55, and: o SEIU and SEIU Refuse employees hired on or after June 7,
2011 pay their share (8%) of contributions. o All other miscellaneous employees hired on or after October
19, 2011 pay their share (8%) of contributions. 3rd Tier – The retirement formula is 2% at age 62 for new members
hired on or after January 1, 2013 and the employee must pay the employee share ranging from 7-8% based on bargaining group classification. Classic members (CalPERS members prior to 12/31/12) hired on or after January 1, 2013 may be placed in a different tier.
The contribution requirements of plan members and the City are established and may be amended by CalPERS.
(C) Benefits Provided – CalPERS provides service retirement and disability benefits, annual cost of living adjustments and death benefits to plan members, who must be public employees and beneficiaries. Benefits are based on years of credited service, equal to one year of full time employment. Members with five years of total service are eligible to retire at age 50 with statutorily reduced benefits. All members are eligible for non-duty disability benefits after five years of service. The death benefit is one of the following: the Basic Death Benefit, the 1959 Survivor Benefit Level III, or the Optional Settlement 2W Death Benefit. The cost of living adjustments for each plan are applied as specified by the Public Employees’ Retirement Law.
(D) Employees Covered - At June 30, 2016, the following employees were covered by the benefit terms of each Plan: Inactive employees or beneficiaries currently receiving benefits are 1,889 and 700 for the Miscellaneous and Safety Plans, respectively. Inactive employees entitled to but not yet receiving benefits are 1,283 and 160 for Miscellaneous and Safety Plans, respectively. Active employees were 1,550 and 579 for Miscellaneous and Safety Plans, respectively.
(E) Contributions – Section 20814(c) of the California Public Employees’ Retirement Law requires that the employer contribution rates for all public employers be determined on an annual basis by the actuary and shall be effective on the July 1 following notice of a change in the rate. Funding

City of Riverside Notes to Basic Financial Statements For the year ended June 30, 2016 (amounts expressed in thousands)
contributions for both Plans are determined annually on an actuarial basis as of June 30 by CalPERS. The actuarially determined rate is the estimated amount necessary to finance the costs of benefits earned by employees during the year, with an additional amount to finance any unfunded accrued liability. The City is required to contribute the difference between the actuarially determined rate and the contribution rate of employees.
(F) Net Pension Liability - The City’s net pension liability for each Plan is measured as the total pension liability, less the pension plan’s fiduciary net position. The net pension liability of each of the Plans is measured as of June 30, 2015, using an annual actuarial valuation as of June 30, 2014 rolled forward to June 30, 2015 using standard update procedures.
A summary of principal assumptions and methods used to determine the net pension liability is shown below.
Actuarial Assumptions – The total pension liabilities in the June 30, 2014 actuarial valuations were determined using the following actuarial assumptions:
Miscellaneous SafetyValuation Date June 30, 2014 June 30, 2014Measurement Date June 30, 2015 June 30, 2015Actuarial Cost MethodActuarial Assumptions Discount Rate 7.65% 7.65%Inflation 2.75% 2.75%Payroll Growth 3.0% 3.0%Projected Salary Increase 3.3% - 14.2% (1) 3.3% - 14.2% (1)Investment Rate of Return 7.50% (2) 7.50% (2)Mortality The probabilities of mortality are based on the 2010 CalPERS
Experience Study for the period from 1997 to 2007. Pre-retirementmortality rates include 5 years of projected mortality improvement using Scale AA published by the Society of Actuaries.
Entry-Age Normal Cost Method
(1) Depending on age, service and type of employment (2) Net of pension plan investment expenses, including inflation
Discount Rate – The discount rate used to measure each plan’s total pension liability as of June 30, 2016 was 7.65%. To determine whether the municipal bond rate should be used in the calculation of a discount rate for each plan, CalPERS stress tested plans that would most likely result in a discount rate that would be different from the actuarially assumed discount rate. Based on
the testing, none of the tested plans run out of assets. Therefore, the discount rates used to measure total pension liability are adequate and the use of the municipal bond rate calculation is not necessary. The long term expected discount rates are applied to all plans in the Public Employees Retirement Fund. The stress test results are presented in a detailed report called “GASB Crossover Testing Report” that can be obtained from the CalPERS website.
The long-term expected rate of return on pension plan investments was determined using a building-block method in which best-estimate ranges of expected future real rates of return (expected returns, net of pension plan investment expense and inflation) are developed for each major asset class.
In determining the long-term expected rate of return, CalPERS took into account both short-term and long-term market return expectations as well as the expected pension fund cash flows. Using historical returns of all the funds’ asset classes, expected compound returns were calculated over the short-term (first 10 years) and the long-term (11-60 years) using a building-block approach. Using the expected nominal returns for both short-term and long-term, the present value of benefits was calculated for each fund. The expected rate of return was set by calculating the single equivalent expected return that arrived at the same present value of benefits for cash flows as the one calculated using both short-term and long-term returns. The expected rate of return was then set equivalent to the single equivalent rate calculated above and rounded down to the nearest one quarter of one percent.
The table below reflects long-term expected real rate of return by asset class. The rate of return was calculated using the capital market assumptions applied to determine the discount rate and asset allocation. These geometric rates of return are net of administrative expenses.
Current Target Real Return Real ReturnAsset Class Allocation Years 1 - 10 (1) Years 11+ (2)Global Equity 51.00% 5.25% 5.71%Global Fixed Income 19.00% 0.99% 2.43%Inflation Sensitive 6.00% 0.45% 3.36%Private Equity 10.00% 6.83% 6.95%Real Estate 10.00% 4.50% 5.13%Infrastructure and Forestland 2.00% 4.50% 5.09%Liquidity 2.00% -0.55% -1.05%
(1) An expected inflation of 2.5% used for this period (2) An expected inflation of 3.0% used for this period
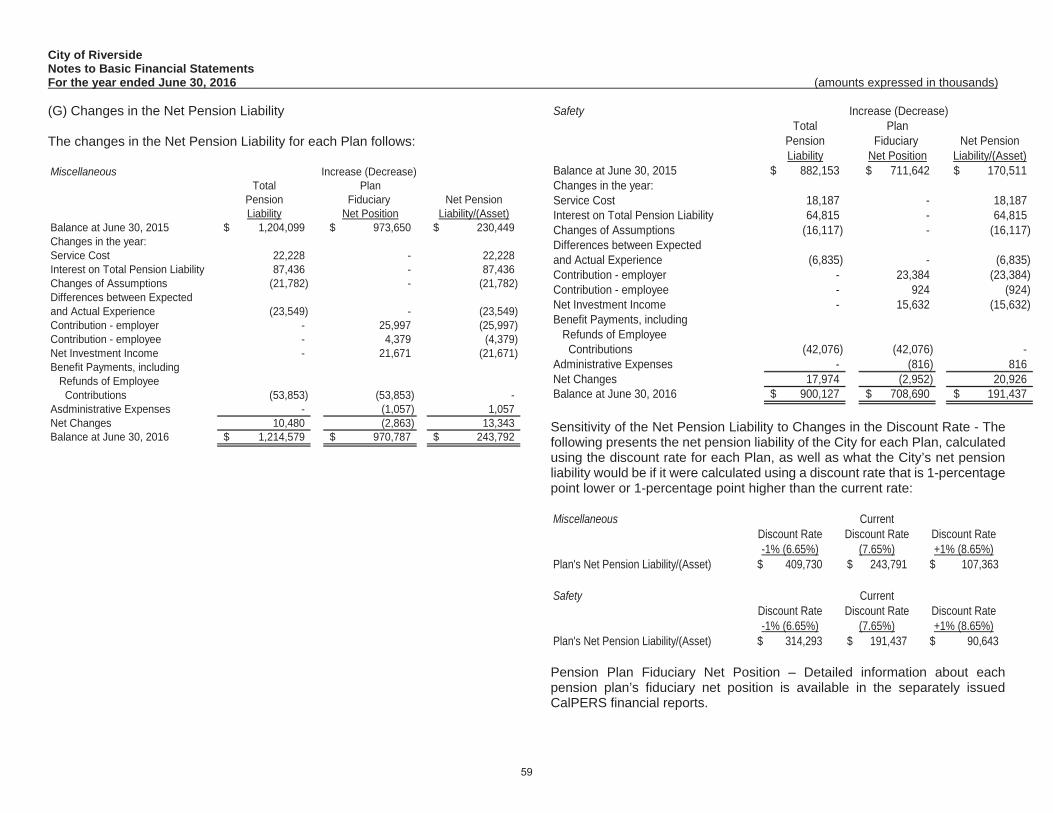
City of Riverside Notes to Basic Financial Statements For the year ended June 30, 2016 (amounts expressed in thousands)
(G) Changes in the Net Pension Liability
The changes in the Net Pension Liability for each Plan follows:
MiscellaneousTotal Plan
Pension Fiduciary Net PensionLiability Net Position Liability/(Asset)
Balance at June 30, 2015 1,204,099$ 973,650$ 230,449$ Changes in the year:Service Cost 22,228 - 22,228 Interest on Total Pension Liability 87,436 - 87,436 Changes of Assumptions (21,782) - (21,782) Differences between Expected and Actual Experience (23,549) - (23,549) Contribution - employer - 25,997 (25,997) Contribution - employee - 4,379 (4,379) Net Investment Income - 21,671 (21,671) Benefit Payments, including Refunds of Employee Contributions (53,853) (53,853) - Asdministrative Expenses - (1,057) 1,057 Net Changes 10,480 (2,863) 13,343 Balance at June 30, 2016 1,214,579$ 970,787$ 243,792$
Increase (Decrease)
SafetyTotal Plan
Pension Fiduciary Net PensionLiability Net Position Liability/(Asset)
Balance at June 30, 2015 882,153$ 711,642$ 170,511$ Changes in the year:Service Cost 18,187 - 18,187 Interest on Total Pension Liability 64,815 - 64,815 Changes of Assumptions (16,117) - (16,117) Differences between Expectedand Actual Experience (6,835) - (6,835) Contribution - employer - 23,384 (23,384) Contribution - employee - 924 (924) Net Investment Income - 15,632 (15,632) Benefit Payments, including Refunds of Employee Contributions (42,076) (42,076) - Administrative Expenses - (816) 816 Net Changes 17,974 (2,952) 20,926 Balance at June 30, 2016 900,127$ 708,690$ 191,437$
Increase (Decrease)
Sensitivity of the Net Pension Liability to Changes in the Discount Rate - The following presents the net pension liability of the City for each Plan, calculated using the discount rate for each Plan, as well as what the City’s net pension liability would be if it were calculated using a discount rate that is 1-percentage point lower or 1-percentage point higher than the current rate:
Miscellaneous CurrentDiscount Rate Discount Rate Discount Rate-1% (6.65%) (7.65%) +1% (8.65%)
Plan's Net Pension Liability/(Asset) 409,730$ 243,791$ 107,363$
Safety CurrentDiscount Rate Discount Rate Discount Rate-1% (6.65%) (7.65%) +1% (8.65%)
Plan's Net Pension Liability/(Asset) 314,293$ 191,437$ 90,643$
Pension Plan Fiduciary Net Position – Detailed information about each pension plan’s fiduciary net position is available in the separately issued CalPERS financial reports.
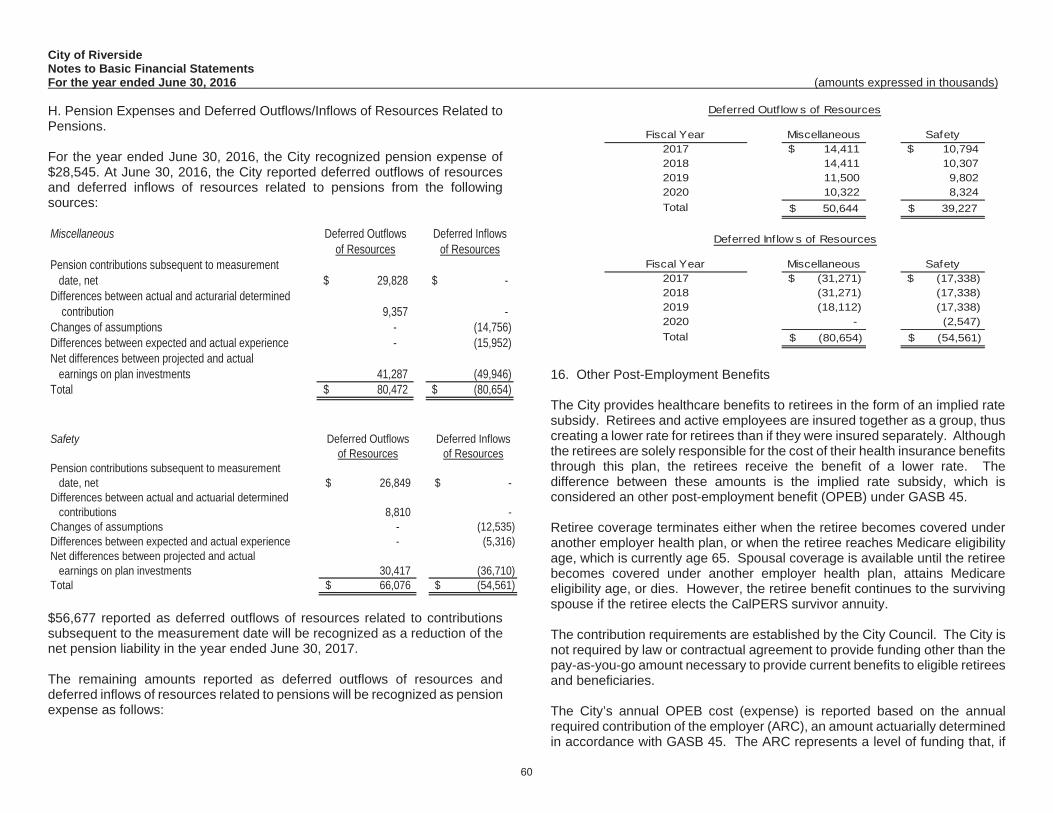
City of Riverside Notes to Basic Financial Statements For the year ended June 30, 2016 (amounts expressed in thousands)
H. Pension Expenses and Deferred Outflows/Inflows of Resources Related to Pensions.
For the year ended June 30, 2016, the City recognized pension expense of $28,545. At June 30, 2016, the City reported deferred outflows of resources and deferred inflows of resources related to pensions from the following sources:
Miscellaneous Deferred Outflows Deferred Inflowsof Resources of Resources
Pension contributions subsequent to measurement date, net 29,828$ -$ Differences between actual and acturarial determined contribution 9,357 - Changes of assumptions - (14,756) Differences between expected and actual experience - (15,952) Net differences between projected and actual earnings on plan investments 41,287 (49,946) Total 80,472$ (80,654)$
Safety Deferred Outflows Deferred Inflowsof Resources of Resources
Pension contributions subsequent to measurement date, net 26,849$ -$ Differences between actual and actuarial determined contributions 8,810 - Changes of assumptions - (12,535) Differences between expected and actual experience - (5,316) Net differences between projected and actual earnings on plan investments 30,417 (36,710) Total 66,076$ (54,561)$
$56,677 reported as deferred outflows of resources related to contributions subsequent to the measurement date will be recognized as a reduction of the net pension liability in the year ended June 30, 2017.
The remaining amounts reported as deferred outflows of resources and deferred inflows of resources related to pensions will be recognized as pension expense as follows:
Fiscal Year Miscellaneous Safety2017 $ 14,411 $ 10,794 2018 14,411 10,307 2019 11,500 9,802 2020 10,322 8,324 Total 50,644$ 39,227$
Fiscal Year Miscellaneous Safety2017 $ (31,271) $ (17,338)2018 (31,271) (17,338)2019 (18,112) (17,338)2020 - (2,547)Total (80,654)$ (54,561)$
Deferred Outflow s of Resources
Deferred Inflow s of Resources
16. Other Post-Employment Benefits
The City provides healthcare benefits to retirees in the form of an implied rate subsidy. Retirees and active employees are insured together as a group, thus creating a lower rate for retirees than if they were insured separately. Although the retirees are solely responsible for the cost of their health insurance benefits through this plan, the retirees receive the benefit of a lower rate. The difference between these amounts is the implied rate subsidy, which is considered an other post-employment benefit (OPEB) under GASB 45.
Retiree coverage terminates either when the retiree becomes covered under another employer health plan, or when the retiree reaches Medicare eligibility age, which is currently age 65. Spousal coverage is available until the retiree becomes covered under another employer health plan, attains Medicare eligibility age, or dies. However, the retiree benefit continues to the surviving spouse if the retiree elects the CalPERS survivor annuity.
The contribution requirements are established by the City Council. The City is not required by law or contractual agreement to provide funding other than the pay-as-you-go amount necessary to provide current benefits to eligible retirees and beneficiaries.
The City’s annual OPEB cost (expense) is reported based on the annual required contribution of the employer (ARC), an amount actuarially determined in accordance with GASB 45. The ARC represents a level of funding that, if

City of Riverside Notes to Basic Financial Statements For the year ended June 30, 2016 (amounts expressed in thousands)
paid on an ongoing basis, is projected to cover normal cost each year and amortize any unfunded actuarial liability (or funding excess) (UAAL) over a period not to exceed thirty years. The ARC for the year ended June 30, 2016 was $4,076, which consisted of normal cost of $1,975 and UAAL amortization of $2,101. The ARC as a percentage of payroll was 2.5% for the year ended June 30, 2016.
As of June 30, 2015, the most recent actuarial valuation date, the OPEB plan was 0.0% funded. The actuarial accrued liability for benefits was $40 million, and the actuarial value of assets was $0, resulting in an unfunded actuarial accrued liability (UAAL) of $40 million. Determination of the net OPEB obligation as of June 30, 2016:
Annual required contribution $ 4,076 Interest on net OPEB obligation 1,177 Amortization of net OPEB obligation (1,537) Annual OPEB cost 3,716 Less contributions made (977) Increase in net OPEB obligation 2,739 Net OPEB liability, beginning of year 29,433 Net OPEB liability, end of year 32,172$
Actuarial valuations involve estimates of the value of reported amounts and assumptions about the probability of events in the future. Amounts determined regarding the funded status of the plan and the annual required contributions of the employer are subject to continual revision as actual results are compared to past expectations and new estimates are made about the future. The method used by the actuary was the entry age normal cost method. The actuarial assumptions included (a) discount rate of 4.00%, (b) 2.75% inflation, (c) projected salary increases of 3.00% annually and (d) healthcare cost trend rates ranging from 5.0% to 7.0%.
Projections of benefits are based on the substantive plan (the plan as understood by the employer and plan members) and include the types of benefits in force at the valuation date and the pattern of sharing benefit costs between the city and the plan members to that point. Actuarial calculations reflect a long-term perspective and employ methods and assumptions that are designed to reduce short-term volatility in actuarial accrued liabilities and the actuarial value of assets.
Three-year trend information:
Actual % of ARCFiscal Year ARC Contributions Contributed
2014 $4,913 $1,232 25%2015 5,061 1,431 28%2016 4,076 977 24%
Annual % of OPEB Cost Net OPEBFiscal Year OPEB Cost Contributed Obligation
2014 $4,756 26% $25,8422015 5,022 28% 29,4332016 3,716 26% 32,172
The table below displays the funding progress of the plan and is based upon the most recent actuarial valuation data:
Unfunded UL as aActuarial Actuarial Actuarial Actuarial Annual % ofValuation Accrued Value of Liability Funded Covered Covered
Date Liability Assets (UL) Ratio Payroll Payroll06/30/15 40,235$ -$ 40,235$ 0% 165,775$ 24%
17. Commitments and Contingencies
A. Long-Term Electric Utility Commitments
Intermountain Power Agency
The Electric Utility Fund has entered into a power purchase contract with Intermountain Power Agency (IPA) for the delivery of electric power. The Electric Utility’s Fund share of IPA power is equal to 7.6 percent, or approximately 137.1 MW, of the net generation output of IPA’s 1,800 MW coal-fueled generating station located in central Utah. The contract expires in 2027 and the debt fully matures in 2024.
The contract constitutes an obligation of the Electric Utility to make payments solely from operating revenues. The power purchase contract requires the Electric Utility to pay certain minimum charges that are based on debt service requirements. Such payments are considered a cost of production.

City of Riverside Notes to Basic Financial Statements For the year ended June 30, 2016 (amounts expressed in thousands)
Southern California Public Power Authority
On November 1, 1980, the City of Riverside joined with the Imperial Irrigation District and the cities of Los Angeles, Anaheim, Vernon, Azusa, Banning, Colton, Burbank, Glendale and Pasadena to create the Southern California Public Power Authority (SCPPA) by a Joint Powers Agreement under the laws of the State of California. As of July 2001, the City of Cerritos was admitted as a member. The primary purpose of SCPPA is to plan, finance, develop, acquire, construct, operate and maintain projects for the generation and transmission of electric energy for sale to its participants. SCPPA is governed by a Board of Directors, which consists of one representative for each of the members. During fiscal years ended June 30, 2016 and 2015, the Electric Utility paid approximately $22,928 and $22,058, respectively, to SCPPA under various take-or-pay and renewable contracts. These payments are reflected as a component of maintenance and operation expense in the financial statements.
The projects and the Electric Utility Fund’s proportionate share of SCPPA’s obligations, including final maturities and contract expirations are as follows:
Project Percent Share EntitlementPalo Verde Nuclear Generating Station (PV) 5.4% 12.3MW Southern Transmission System (STS) 10.2% 244.0MW Hoover Dam Uprating (Hoover) 31.9% 30.0MW Mead – Phoenix Transmission (MPP) 4.0% 18.0MW Mead – Adelanto Transmission (MAT) 13.5% 118.0MW
Terms of Take or Pay Commitments
As part of the take-or-pay commitments with IPA and SCPPA, the Electric Utility has agreed to pay its share of current and long-term obligations. Management intends to pay these obligations from operating revenues received during the year that payment is due. A long–term obligation has not been recorded on the accompanying financial statements for these commitments. Take-or-pay commitments terminate upon the later of contract expiration or final maturity of outstanding bonds for each project.
Outstanding debts associated with the take-or-pay obligations have variable interest rates for the Palo Verde Nuclear Generating Station Project and the remaining projects have fixed interest rates which range from 0.47 percent to 6.13 percent. The schedule below details the amount of principal and interest that is due and payable by the Electric Utility as part of the take-or-pay contract for each project in the fiscal year indicated.
FiscalYear IPA PV STS Hoover MPP MAT Total2017 11,651$ 675$ 8,212$ $ 701 262$ 2,951$ 24,452$ 2018 17,007 679 8,049 699 258 2,909 29,601 2019 18,603 - 7,956 - 257 2,881 29,697 2020 18,095 - 6,976 - 254 2,859 28,184 2021 16,470 - 8,302 - 189 2,136 27,097
Thereafter 20,846 - 37,987 - - - 58,833 Total 102,672$ 1,354$ 77,482$ 1,400$ 1,220$ 13,736$ 197,864$
SCPPA
Final maturities of outstanding debt associated with take-or-pay obligations and related contract expirations are as follows:
Project Final Maturity Contract Expiration Palo Verde Nuclear Generating Station 2017 2030 Southern Transmission System 2027 2027 Hoover Dam Uprating 2017 2017 Mead – Phoenix Transmission 2020 2030 Mead – Adelanto Transmission 2020 2030
In addition to debt service, Riverside’s entitlements require the payment of fuel costs, operating and maintenance, administrative and general and other miscellaneous costs associated with the generation and transmission facilities discussed above. These costs do not have a similar structured payment schedule as debt service and vary each year.
The costs incurred for the year ended June 30, 2016 and 2015, are as follows (in thousands):
FiscalYear IPA PV STS Hoover MPP MAT Total2016 22,667$ 3,601$ 3,001$ $ 81 34$ 377$ 29,761$ 2015 23,426 2,628 2,731 113 145 285 29,328
These costs are reflected as a component of maintenance and operation expense on the statement of revenues, expenses and changes in net position.
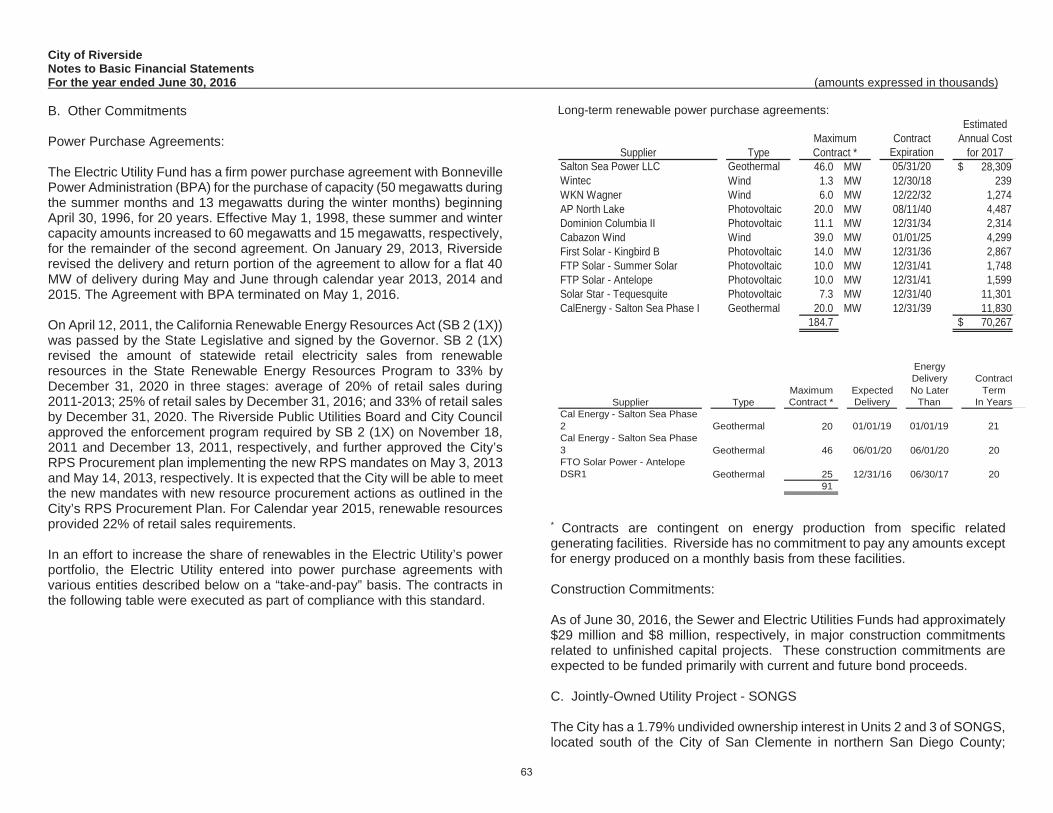
City of Riverside Notes to Basic Financial Statements For the year ended June 30, 2016 (amounts expressed in thousands)
B. Other Commitments
Power Purchase Agreements:
The Electric Utility Fund has a firm power purchase agreement with Bonneville Power Administration (BPA) for the purchase of capacity (50 megawatts during the summer months and 13 megawatts during the winter months) beginning April 30, 1996, for 20 years. Effective May 1, 1998, these summer and winter capacity amounts increased to 60 megawatts and 15 megawatts, respectively, for the remainder of the second agreement. On January 29, 2013, Riverside revised the delivery and return portion of the agreement to allow for a flat 40 MW of delivery during May and June through calendar year 2013, 2014 and 2015. The Agreement with BPA terminated on May 1, 2016.
On April 12, 2011, the California Renewable Energy Resources Act (SB 2 (1X)) was passed by the State Legislative and signed by the Governor. SB 2 (1X) revised the amount of statewide retail electricity sales from renewable resources in the State Renewable Energy Resources Program to 33% by December 31, 2020 in three stages: average of 20% of retail sales during 2011-2013; 25% of retail sales by December 31, 2016; and 33% of retail sales by December 31, 2020. The Riverside Public Utilities Board and City Council approved the enforcement program required by SB 2 (1X) on November 18, 2011 and December 13, 2011, respectively, and further approved the City’s RPS Procurement plan implementing the new RPS mandates on May 3, 2013 and May 14, 2013, respectively. It is expected that the City will be able to meet the new mandates with new resource procurement actions as outlined in the City’s RPS Procurement Plan. For Calendar year 2015, renewable resources provided 22% of retail sales requirements.
In an effort to increase the share of renewables in the Electric Utility’s power portfolio, the Electric Utility entered into power purchase agreements with various entities described below on a “take-and-pay” basis. The contracts in the following table were executed as part of compliance with this standard.
Long-term renewable power purchase agreements: Estimated
Contract Annual CostSupplier Type Expiration for 2017
Salton Sea Power LLC Geothermal 46.0 MW 05/31/20 28,309$ Wintec Wind 1.3 MW 12/30/18 239 WKN Wagner Wind 6.0 MW 12/22/32 1,274 AP North Lake Photovoltaic 20.0 MW 08/11/40 4,487 Dominion Columbia II Photovoltaic 11.1 MW 12/31/34 2,314 Cabazon Wind Wind 39.0 MW 01/01/25 4,299 First Solar - Kingbird B Photovoltaic 14.0 MW 12/31/36 2,867 FTP Solar - Summer Solar Photovoltaic 10.0 MW 12/31/41 1,748 FTP Solar - Antelope Photovoltaic 10.0 MW 12/31/41 1,599 Solar Star - Tequesquite Photovoltaic 7.3 MW 12/31/40 11,301 CalEnergy - Salton Sea Phase I Geothermal 20.0 MW 12/31/39 11,830
184.7 70,267$
MaximumContract *
EnergyDelivery Contract
Maximum Expected No Later TermSupplier Type Contract * Delivery Than In Years
Cal Energy - Salton Sea Phase 2 Geothermal 20 01/01/19 01/01/19 21Cal Energy - Salton Sea Phase 3 Geothermal 46 06/01/20 06/01/20 20FTO Solar Power - Antelope DSR1 Geothermal 25 12/31/16 06/30/17 20
91
* Contracts are contingent on energy production from specific related generating facilities. Riverside has no commitment to pay any amounts except for energy produced on a monthly basis from these facilities.
Construction Commitments:
As of June 30, 2016, the Sewer and Electric Utilities Funds had approximately $29 million and $8 million, respectively, in major construction commitments related to unfinished capital projects. These construction commitments are expected to be funded primarily with current and future bond proceeds.
C. Jointly-Owned Utility Project - SONGS
The City has a 1.79% undivided ownership interest in Units 2 and 3 of SONGS, located south of the City of San Clemente in northern San Diego County;

City of Riverside Notes to Basic Financial Statements For the year ended June 30, 2016 (amounts expressed in thousands)
however, on June 7, 2013, Southern California Edison (SCE) announced in a press release its plan to retire Units 2 and 3 of SONGS permanently. Consequently, the units are no longer a source of supply for the Electric Utility, but remain associated with certain of its costs, including those associated with the units’ shutdown and decommissioning.
SONGS was operated and maintained by SCE, under an agreement with the City and San Diego Gas & Electric Company (SDG&E), which expires upon termination of the easement for the plant in 2024. The three-member SONGS Board of Review approved the budget for capital expenditures and operating expenses. The City and the two other owners each had one representative on that board. The participation agreement provided that each owner was entitled to its proportionate share of benefits of, and paid its proportionate share of costs and liabilities incurred by SCE for, construction, operation and maintenance of the project; each owner’s obligation was several, and not joint or collective.
In 2005, the CPUC authorized a project to install four new steam generators in Units 2 and 3 at SONGS and remove and dispose of the predecessor generators. SCE completed the installation of these steam generators in 2010 and 2011 for Units 2 and 3, respectively. Replacement of the steam generators was expected to enable plant operations to continue through at least 2022, and perhaps beyond, subject to the approval of the Nuclear Regulatory Commission (NRC).
In January 2012, a water leak occurred in one of the heat transfer tubes of Unit 3’s steam generators, causing it to be shut down. At that time, Unit 2 was off-line for a planned outage when unexpected wear in areas of tube-to-support structure were found. Units 2 and 3 remained off-line for extensive inspections, testing and analysis of their steam generators. On June 7, 2013, SCE unilaterally announced its plan to retire Units 2 and 3 permanently.
The current plant site easement for SONGS terminates on May 12, 2024 and would need to be extended in order for the plant to be decommissioned and the site restored.
As a result of SCE’s decision to permanently retire SONGS Units 2 and 3, SCE has begun the decommissioning phase of the plant. The process of decommissioning a nuclear power plant is governed by NRC regulations. The regulations categorize the decommissioning activities into three phases: initial activities, major decommissioning and storage activities, and license termination. Initial activities include providing notice of permanent cessation of operations (accomplished on June 12, 2013) and notice of permanent
removal of fuel from the reactor vessels (provided by SCE to the NRC on June 28 and July 22, 2013 for Units 3 and 2, respectively). Within two years after the announcement of retirement, SCE, as the operating licensee must submit a post-shutdown decommissioning activities report, an irradiated fuel management plan and a site-specific decommissioning cost estimate. SCE submitted these documents to the NRC in the summer of 2014. As of August 2015, the NRC concluded their regulatory review process and accepted the regulatory filings without revision. SCE has now obtained the required regulatory approvals from the NRC to begin the decommissioning process. According to the document, total decommissioning costs for Units 2 and 3 are estimated at $4.4 million of which the Utility’s share is $79 million.
As of June 30, 2016, the Utility has set aside $80 million in cash investments with the trustee and $5 million in an internally restricted decommissioning reserve for the City’s share of the decommissioning costs.
There are no separate financial statements for the jointly-owned utility plant since each participant’s interests in the utility plant and operating expenses are included in their respective financial statements. The Electric Utility’s portion of current and long-term debt associated with the decommissioning of SONGS is included in the accompanying financial statements.
Replacement Power Costs
During the outage, the City has procured replacement power to serve its customers’ requirements. These costs are in addition to the operating and maintenance expenses paid annually during normal operations. Replacement power costs incurred by the City as a result of the outage (commencing on January 31, 2012 for Unit 3 and March 5, 2012 for Unit 2) were approximately $13.2 million and are reported as regulatory assets on the Statements of Net Position. During fiscal year June 30, 2016, the regulatory asset created was fully expensed as current rate revenues were adequate to absorb the previously incurred costs thus no longer requiring them to be deferred. The Electric Utility is in the process of calculating any additional costs associated with the unexpected shutdown of SONGS and will seek recovery of any such costs, as set forth herein.
Contractual Matters
The replacement steam generators for Units 2 and 3 were designed and manufactured by Mitsubishi Heavy Industries (MHI) and were warranted for an initial period of 20 years from acceptance. MHI was contractually obligated to repair or replace defective items and to pay specified damages for certain

City of Riverside Notes to Basic Financial Statements For the year ended June 30, 2016 (amounts expressed in thousands)
repairs. MHI’s liability under the purchase agreement is limited to $138 million and excludes consequential damages, defined to include “the cost of replacement power.” The limitations are subject to certain exceptions.
There are insurance policies for both property damage and accidental outage issued by Nuclear Electric Insurance Limited (NEIL), and SCE has notified NEIL of claims under the two policies. On October 12, 2015, the owners of SONGS reached a $400,000 settlement with NEIL for the outages caused by the failures of replacement steam generators. The Electric Utility’s allocation of the settlement was $7,160 and was used to offset the remaining portion of the regulatory asset expensed in fiscal year ended June 30, 2016. The owners of SONGS will continue to seek additional damages for the defective steam generators supplied by MHI and Mitsubishi Nuclear Energy Systems.
As a result of the decision by SCE to permanently retire Units 2 and 3 of SONGS prior to the expiration of the NRC licenses, the City expects to incur certain costs resulting from the early termination of long-term uranium fuel supply contracts. The Utility is in the process of calculating those damages in preparation for arbitration between SCE and MHI and will seek recovery of all such damages in that venue.
18. Subsequent Event
Measure Z
The City placed a general purpose tax measure on the November 8, 2016 ballot in hopes to raise the City of Riverside’s local sales tax one penny per dollar, to 9 percent, to pay for critical unfunded City programs and services, such as public safety, prevention of homelessness, road maintenance and tree trimming, recreation and parks, and more. The one-cent increase in sales tax is estimated to generate between $48 million and $50 million annually specifically for the City of Riverside’s General Fund, which pays for most services.