city research onlineopenaccess.city.ac.uk/13339/7/027012_1.pdf · estimation of splanchnic blood...
TRANSCRIPT

City, University of London Institutional Repository
Citation: Hickey, M., Samuels, N., Randive, N., Langford, R. M. & Kyriacou, P. A. (2010). Measurement of splanchnic photoplethysmographic signals using a new reflectance fiber optic sensor. Journal of Biomedical Optics, 15(2), e027012. doi: 10.1117/1.3374355
This is the published version of the paper.
This version of the publication may differ from the final published version.
Permanent repository link: http://openaccess.city.ac.uk/13339/
Link to published version: http://dx.doi.org/10.1117/1.3374355
Copyright and reuse: City Research Online aims to make research outputs of City, University of London available to a wider audience. Copyright and Moral Rights remain with the author(s) and/or copyright holders. URLs from City Research Online may be freely distributed and linked to.
City Research Online: http://openaccess.city.ac.uk/ [email protected]
City Research Online

Ms
MCSNL
NNRSBAL
PCSNL
1
MossbpTotDgfmt
mtomr
ASdE
Journal of Biomedical Optics 15�2�, 027012 �March/April 2010�
J
Downloaded Fro
easurement of splanchnic photoplethysmographicignals using a new reflectance fiber optic sensor
ichelle Hickeyity University Londonchool of Engineering and Mathematical Sciencesorthampton Square
ondon, EC1V 0HB United Kingdom
eal Samuelsilesh Randiveichard M. Langfordaint Bartholomew’s Hospitalarts and The London NHS Trustnaesthetic Laboratory and Departmentondon, EC1A 7BE United Kingdom
anayiotis A. Kyriacouity University Londonchool of Engineering and Mathematical Sciencesorthampton Square
ondon, EC1V 0HB United Kingdom
Abstract. Splanchnic organs are particularly vulnerable to hypoperfu-sion. Currently, there is no technique that allows for the continuousestimation of splanchnic blood oxygen saturation �SpO2�. As a pre-liminary to developing a suitable splanchnic SpO2 sensor, a new re-flectance fiber optic photoplethysmographic �PPG� sensor and pro-cessing system are developed. An experimental procedure to examinethe effect of fiber source detector separation distance on acquiredPPG signals is carried out before finalizing the sensor design. PPGsignals are acquired from four volunteers for separation distances of1 to 8 mm. The separation range of 3 to 6 mm provides the bestquality PPG signals with large amplitudes and the highest signal-to-noise ratios �SNRs�. Preliminary calculation of SpO2 shows that dis-tances of 3 and 4 mm provide the most realistic values. Therefore, it issuggested that the separation distance in the design of a fiber opticreflectance pulse oximeter be in the range of 3 to 4 mm. PreliminaryPPG signals from various splanchnic organs and the periphery areobtained from six anaesthetized patients. The normalized amplitudesof the splanchnic PPGs are, on average, approximately the same asthose obtained simultaneously from the periphery. These observationssuggest that fiber optic pulse oximetry may be a valid monitoringtechnique for splanchnic organs. © 2010 Society of Photo-Optical InstrumentationEngineers. �DOI: 10.1117/1.3374355�
Keywords: photoplethysmography; reflectance pulse oximetry; splanchnicperfusion; fiber optics.Paper 09134R received Apr. 9, 2009; revised manuscript received Nov. 2, 2009;accepted for publication Feb. 17, 2010; published online Apr. 5, 2010.
Introduction
onitoring of splanchnic blood oxygen saturation �SpO2� isf paramount importance in anaesthesia, intensive care, andurgery.1 It is essential that the organs and tissues of theplanchnic region are sufficiently perfused with oxygenatedlood to survive. When an organ or tissue suffers severe hy-operfusion or extreme hypoxia, organ dysfunction ensues.he failure of one organ can result in the failure of distantrgans through the release of toxins and other mediators intohe portal blood stream, resulting in multiple organ failure.espite advances in intensive care management, multiple or-an failure remains a common cause of death and morbidityollowing major surgery.2 Previous studies have indicated thatonitoring of the gastrointestinal tract may make early detec-
ion of malperfusion feasible.3
Currently, there is no widely accepted and readily availableonitoring technique for assessing splanchnic perfusion in
he clinical environment.1 Techniques such as polarographicxygen electrodes, positron emission tomography �PET�, andagnetic resonance imaging �MRI� are confined for use as
esearch tools.4 Doppler ultrasound and laser Doppler mea-
ddress all correspondence to: Michelle Hickey, City University London,chool of Engineering and Mathematical Sciences, Northampton Square, Lon-on, EC1V 0HB United Kingdom. Tel: 020-7040-3878; Fax: 020-7040-8568;-mail: [email protected]
ournal of Biomedical Optics 027012-
m: http://biomedicaloptics.spiedigitallibrary.org/ on 02/08/2016 Terms of Use
sure blood flow and not oxygenation, and are also heavilyoperator-dependent techniques,5,6 while fluorescein only al-lows for intermittent assessment.2 Gastric tonometry is one ofthe few organ-specific monitors approved for clinical use.7
However, due to its operator dependency, expense, and time-consuming nature, it has still not been widely accepted forroutine use.8,9 Reflectance spectrophotometry has been foundto be a powerful tool in the assessment of gastric mucosaloxygenation in both animals10 and patients.11 However, clini-cal experience with this device is limited. Problems related toits use include possible interference with other pigments �e.g.,bilirubin�, movement artifacts, and difficulties in handling thedevice.12 Furthermore, it has been noted that the cost of thespectrophotometry systems is too expensive.11
Pulse oximetry has also been used experimentally in thedetection of intestinal oxygenation in animals, where it wasfound to be a rapid, reproducible, as well as a highly sensitiveand specific technique for detecting small bowelischaemia.13,14 The feasibility of estimating splanchnic bloodoxygen saturation in humans has been demonstrated by Ou-riel, Fiore, and Geary in a study using a commercial transmis-sion pulse oximeter on the intestine after abdominal aneurysmsurgery in 30 patients.15 They found that a loss of pulsatilityand unmeasurable SpO2 suggests inadequate intestinal perfu-
1083-3668/2010/15�2�/027012/8/$25.00 © 2010 SPIE
March/April 2010 � Vol. 15�2�1
: http://spiedigitallibrary.org/ss/TermsOfUse.aspx

sg�cg
boabtisaptsaist
sotpsmot�dctdwai
dato
2Pmlt�otstaataat
Hickey et al.: Measurement of splanchnic photoplethysmographic signals…
J
Downloaded Fro
ion. During a second-look laparotomy on a 12-month-oldirl, Hei and Shun utilized a commercial pulse oximeter probeNellcor Oxisensor, Boulder, Colorado� to determine is-haemic intestinal segments.16 Segments with low blood oxy-en saturation values �SpO2� were excised.
Despite the attractiveness of this technique in estimatinglood oxygen saturation of abdominal organs, current pulseximetry sensors are not suitable for use in such anatomicalreas, as current commercial sensors in their majority areulky, cannot be sterilized, and may compress the splanchnicissue �assuming clip-on sensors�. More recently, the feasibil-ty for acquiring good quality photoplethysmographic �PPG�ignals in human abdominal organs, such as the bowel, liver,nd kidney during labarotomy, has been demonstrated by areliminary study using a custom-made reflectance optoelec-ronic pulse oximetry sensor.1 However, this sensor was notuitable for prolonged continuous monitoring in the abdomen,s it had to be held continuously by the user while investigat-ng a particular organ. Also, the custom-made optoelectronicensor was only applicable during open laparotomy, where allhe organs of interest were exposed.
Therefore, there remains a need for a new pulse oximetryensor that is suitable for use in the human abdomen bothperatively and postoperatively. In an attempt to achieve this,he design of a new fiber optic sensor is suggested. The pro-osal of the clinical experts is to use the small fiber opticensor �which is electrically isolated and sterilizable usingedically approved fibers� and secure it �stitch it� in the organ
f interest before the completion of the surgery. The body ofhe probe will be inserted in a commercial surgical drain tubei.e., such as French 16� that will be passed outside the ab-ominal wall where the probe will be connected to the pro-essing system. Once the surgeons are satisfied with the moni-oring, they will pull the probe out as they do with all otherrainage tubes after operations. Also, the fiber optic probeill also be used for the monitoring of perfusion in the stom-
ch wall and jejunum. For such application, the probe will benserted orally/nasally with the guidance of an endoscope.
As a preliminary to developing such a sensor, this studyescribes the design, technical development, and validation ofnew fiber optic reflectance PPG sensor and processing sys-
em. Preliminary PPG measurements from human abdominalrgans are also presented.
Backgroundulse oximetry is a noninvasive optical technique that esti-ates arterial blood oxygen saturation �SpO2� by shining
ight at two different wavelengths �red �R� and infrared �IR��hrough vascular tissue and measuring either the transmittedtransmission pulse oximetry� or reflected �reflectance pulseximetry� light signal. Both wavelengths are multiplexed, sohey are never on at the same time. A demultiplexer is used toeparate the mixed �red and infrared� PPG signals before fur-her processing. In this method, the ac pulsatile PPG signalssociated with cardiac contraction is assumed to be attribut-ble solely to the arterial blood component. The amplitudes ofhe red and infrared ac PPG signals are sensitive to changes inrterial oxygen saturation because of differences in the lightbsorption of oxygenated and deoxygenated hemoglobin athese two wavelengths.17 From the ratios of these amplitudes
ournal of Biomedical Optics 027012-
m: http://biomedicaloptics.spiedigitallibrary.org/ on 02/08/2016 Terms of Use
�Eq. �1�� and the corresponding dc PPG components, arterialblood oxygen saturation �SpO2� is estimated.
RR =Rac/Rdc
IRac/IRdc, �1�
where Rac and IRac are the red and infrared ac components,respectively, and Rdc and IRdc are the red and infrared dccomponents, respectively.
Commercial pulse oximeters are empirically calibratedfrom in-vivo data, resulting in look-up tables or equations thatare used to find the relationship between the pulse oximeterratio value R and the actual arterial oxygen saturation SaO2�using a CO-oximeter�. Equation �2� shows a typical linearequation.
SpO2 = 110 − 25 � RR. �2�
Hence, the technique of pulse oximetry relies on the presenceof adequate peripheral arterial pulsations, which are detectedas PPG signals.17
3 MethodsA new reflectance PPG sensor was developed, comprised ofoptical fibers coupled to infrared and red subminiature versionA �SMA�-mounted emitters and a photodiode. A PPG process-ing system was also developed for the detection and prepro-cessing of the red and infrared ac and dc PPG signals beforedigitization by a data acquisition card. The digitized PPG sig-nals were further processed, analysed, and displayed by a vir-tual instrument �VI� implemented in LabView �National In-struments, Austin, Texas�. The technical details of each stageare described next.
3.1 Fiber Optic Photoplethysmographic SensorFiber optic cables were chosen as a means of transmitting andreceiving the light, as they are electrically safe and their di-mension �cross sectional area� can be quite small to ultimatelyfacilitate insertion of the sensor into a small cavity. Glasssilica step index multimode fibers with a numerical aperture�NA� of 0.37 and a core diameter of 600 �m were deemedsufficient for the initial sensor. Each fiber cable was SMAterminated at one end. Bare fiber was exposed at the otherend, where it was cleaved and polished to attain a flat surfaceat 90 deg to the emitting light. These fibers are made frombiocompatible materials, are radiation resistant, and are ster-ilizable by ethylene oxide �EtO� and other methods.
To facilitate the multiplexing of the red and infrared sig-nals into a single fiber, a 400-nm bifurcated fiber �or Y-piece�from Ocean Optics �Ocean Optics, Duiven, The Netherlands�was used �Fig. 1�. The two ends of the Y-piece were coupledto the SMA-mounted emitters �with peak emission wave-lengths of 650 and 850 nm, respectively�, while the other endwas attached to a prepared single fiber optic cable �core di-ameter of 600 �m� to transmit both the red and infrared lightto the tissue. Another single fiber optic cable �core diameter of600 �m� was used to transmit the backscattered light fromthe tissue to the photodiode �1-mm2 active area�.
To compare the PPG signals acquired from abdominal or-gans when using the fiber optic sensor, an identical �with the
March/April 2010 � Vol. 15�2�2
: http://spiedigitallibrary.org/ss/TermsOfUse.aspx

stt
3
Atspiucig
Fs
Hickey et al.: Measurement of splanchnic photoplethysmographic signals…
J
Downloaded Fro
ame optical and electrical characteristics� peripheral fiber op-ic PPG sensor has also been developed. Figure 2 shows bothhe splanchnic and peripheral sensors.
.2 Photoplethysmographic Processing andAcquisition System
n electrically isolated PPG processing and acquisition sys-em was developed to drive the optical components of theplanchnic and peripheral fiber sensors, and to detect and pre-rocess the ac and dc red and infrared PPG signals. A virtualnstrument �VI� was also developed in LabView, which wassed to drive some of the hardware components of the pro-essing system, and enable the acquisition, displaying, stor-ng, and analyzing of all acquired PPG signals. A block dia-ram of the processing system is shown in Fig. 3.
Fig. 1 Reflectance configuration of the fiber optic re
ig. 2 �a� The Splanchnic PPG sensor and �b� the peripheral PPGensor.
ournal of Biomedical Optics 027012-
m: http://biomedicaloptics.spiedigitallibrary.org/ on 02/08/2016 Terms of Use
The emitter driver was controlled and driven by the R andIR multiplexing signals. These signals were used to time mul-tiplex the red and infrared emitters at 500 Hz �each emitter isswitched on every 2 ms for an interval of 0.5 ms�. The outputcurrent of the emitter driver was controlled by an analog volt-age �current control voltage�. All three signals were generatedby the virtual instrument via the output ports of the 16-bitDAQ card �DAQPad-6015, National Instruments, Austin,Texas�.
The photodetector detects the energy backscattered by thetissue and gives an output current proportional to the detectedlight intensity. The output of the current-to-voltage �I-V� dif-
e PPG sensor, including desired sensor dimensions.
Fig. 3 Block diagram illustrating the various stages of the PPG pro-cessing system �an identical processing system was also developed forthe peripheral fiber optic sensor�.
flectanc
March/April 2010 � Vol. 15�2�3
: http://spiedigitallibrary.org/ss/TermsOfUse.aspx

fscpw�tllidnc
4PdtbpPStoor
ttn
4Tpaahagst1wsits
sap
4Tuccdt
Hickey et al.: Measurement of splanchnic photoplethysmographic signals…
J
Downloaded Fro
erential amplifier contains multiplexed PPG signals corre-ponding to red and infrared wavelengths. The signal from theurrent-to-voltage differential amplifier passes to a demulti-lexer synchronized to the multiplexing signals from the VI,hich separates the red and infrared signals. The two signals
R and IR� after passing through an isolation barrier are fil-ered to extract the ac and dc PPG components for each wave-ength. The output PPG signals are digitized and further ana-yzed by the virtual instrument. PPG traces corresponding tonfrared and red wavelengths are obtained simultaneously andisplayed on the personal computer screen. All acquired sig-als are also saved in spreadsheet format for further postpro-essing and analysis.
Experimentsrior to the finalization of the sensor, it was necessary toetermine the optimum separation distance between the emit-ing and receiving fibers. It is well known that the distanceetween the emitters and the photodetector in a reflectanceulse oximeter sensor has a direct impact on the quality of thePG signals acquired,18 and hence the accurate estimation ofpO2. Therefore, an investigation was conducted to examine
he effect of the source detector separation between the fibersn the PPG �ac and dc� signals and to ultimately establish theptimum separation distance between the light emitting andeceiving fiber.
Also, in-vivo temperature tests were conducted to confirmhat temperature rises at the tip of the fiber optic sensor �con-act point with vascular tissue� would not be of clinical sig-ificance.
.1 Fiber-Spacing Experimento conduct this experiment, a precision-drilled perspex fingeriece was designed to allow the investigation of PPG signalst separation distances of 1 to 8 mm between the detectingnd transmitting fibers. The separation space between theoles was insulated by a black rubbery material to eliminateny light entering the photodiode from the surface of the fin-er �penumbra effect�. During the experiment, ac and dc PPGignals obtained from the index fingers of four healthy volun-eers with blood oxygen saturation values in the range of 98 to00% �measured with a commercial pulse oximeter�, at bothavelengths, were recorded simultaneously while varying the
eparation between the emitting and detecting fibers at 1-mmncrements. Any overhead fluorescent lights were switched offo eliminate any other light interference with the fiber opticensor.
To determine the quality of the signals obtained for eacheparation distance, a quantitative measure of SNR was desir-ble. The SNR was calculated using measurements of pulseower against background noise in the frequency domain.
.2 Fiber Optic Sensor Temperature Testhe operating current of the emitters is relatively low, and these of fiber optics ensures that the emitters are not in directontact with the tissue. However, it was still necessary toonfirm that the red and infrared sources would not cause anyirect thermal damage to the splanchnic tissue. An in-vivoemperature test was conducted to investigate the possibility
ournal of Biomedical Optics 027012-
m: http://biomedicaloptics.spiedigitallibrary.org/ on 02/08/2016 Terms of Use
of excessive temperature rises in the splanchnic area duringPPG measurements.
The in-vivo test was made on a normal healthy volunteer.The emitting fiber was placed in contact with the mucosa ofthe cheek inside the mouth. A type-K thermocouple was at-tached adjacent to the fiber tip, and was also in contact withthe mucosa of the mouth. The temperature was recorded untila constant baseline was attained. The infrared light emitterwas switched on and the temperature was monitored. Steady-state conditions were achieved after approximately 5 min, andmonitoring was continued for an additional 5 min. The mea-surement was repeated for a red emitter.
4.3 Preliminary Clinical MeasurementsPrior to engaging in a detailed clinical study, a preliminary�proof of concept� study was performed to evaluate the abilityof the sensor to obtain PPG signals from various abdominalorgans. Ethics committee approval was obtained to performPPG measurements on six adults �25 to 65 years� undergoingelective laparotomy.
Prior to any PPG measurements, the fiber optic sensor wasinserted into a sealed, sterile, transparent ultrasound probecover �latex-free material�. At an appropriate time during thesurgery, the sensor was passed to the surgeon and it was ap-plied gently to the surface of each available abdominal organso that the emitted light was reflected from its surfaces. Dur-ing the measurements, the overhead operating lights wereturned off to ensure no interference with the PPG sensor. Si-multaneous ac and dc fiber optic PPG traces from each ab-dominal organ and the finger were recorded for approximatelytwo minutes. Blood oxygen saturation from a commercialpulse oximeter �transmission mode finger probe, GE Health-care, Piscataway, New Jersey� was also simultaneously moni-tored and recorded.
5 Results5.1 Results from the Fiber-Spacing ExperimentPPG signals were recorded from all volunteers at both wave-lengths and at all separation distances between the transmit-
Fig. 4 Typical infrared ac PPG traces from the finger of a healthyvolunteer at various fiber separation distances between the emittingand receiving fiber.
March/April 2010 � Vol. 15�2�4
: http://spiedigitallibrary.org/ss/TermsOfUse.aspx

trd
dpoheqrv
wt
P
Fa
Fa
Hickey et al.: Measurement of splanchnic photoplethysmographic signals…
J
Downloaded Fro
ing and receiving fibers. Figure 4 depicts typical finger infra-ed ac PPG traces from a volunteer at various separationistances between the emitting and the receiving fiber.
Although PPG traces were detected at almost all separationistances, there were differences in signal amplitude and mor-hology at the various monitoring separations. PPG signalsbtained at a separation of 1 mm were of large amplitude;owever, PPG signals at this separation distance were oftenrratic and unstable. The range of 2 to 6 mm produced gooduality, stable PPGs with large amplitudes. Over 6-mm sepa-ation distance, the resulted ac PPGs were of poor quality andery low amplitude.
For each separation distance, mean ac and dc amplitudesere calculated for the red and infrared signals by averaging
he PPG amplitudes over one minute of data.Figures 5 and 6 show the means of the red and infrared ac
PG and dc PPG signals, respectively, from all four volun-
ig. 5 Mean �n=4� of the infrared �IR� and red �R� ac PPG amplitudesnd standard deviations for all separation distances.
ig. 6 Mean �n=4� of the infrared �IR� and red �R� dc PPG amplitudesnd standard deviations for all separation distances.
ournal of Biomedical Optics 027012-
m: http://biomedicaloptics.spiedigitallibrary.org/ on 02/08/2016 Terms of Use
teers. Again, it can be seen that the mean ac and dc PPGamplitudes decrease as the separation distance increases.
For each separation distance, the mean RR was calculated�Eq. �1��. This value was then used in Eq. �2� for the estima-tion of SpO2. Figure 7 shows both RR and the correspondingSpO2 value for all the separation distances.
The SNR of the red and infrared PPGs at all fiber separa-tion distances were also calculated as described in Sec. 4.1.Figure 8 shows the mean SNR values �n=4� for the red andinfrared PPG signals.
5.2 Results from the Fiber Optic Sensor TemperatureTest
The temperature of the mucosa was at 36.95 °C prior toswitching on the red or infrared emitter. After turning on theinfrared emitter and waiting 5 min for steady-state conditions,it was found that the temperature of the mucosa remained at36.95 °C, and was constant for the remainder of the monitor-ing period. The same results were observed for the red emit-ter.
Fig. 7 Mean ratio �n=4� and SpO2 values for various fiber separationdistances.
Fig. 8 Mean SNR values �n=4� for various fiber separation distances.
March/April 2010 � Vol. 15�2�5
: http://spiedigitallibrary.org/ss/TermsOfUse.aspx

5
Gpn=ag
ns
vtos
sa
6Acs
Fe
Fr
Hickey et al.: Measurement of splanchnic photoplethysmographic signals…
J
Downloaded Fro
.3 Results from the Preliminary ClinicalMeasurement
ood quality, easily recognizable PPG signals with large am-litudes were recorded on all attempts from various abdomi-al sites—small bowel �n=6�, large bowel �n=5�, liver �n1�, and stomach �n=1�. Figures 9–12 depict typical ac red
nd infrared PPG signals from all investigated abdominal or-ans.
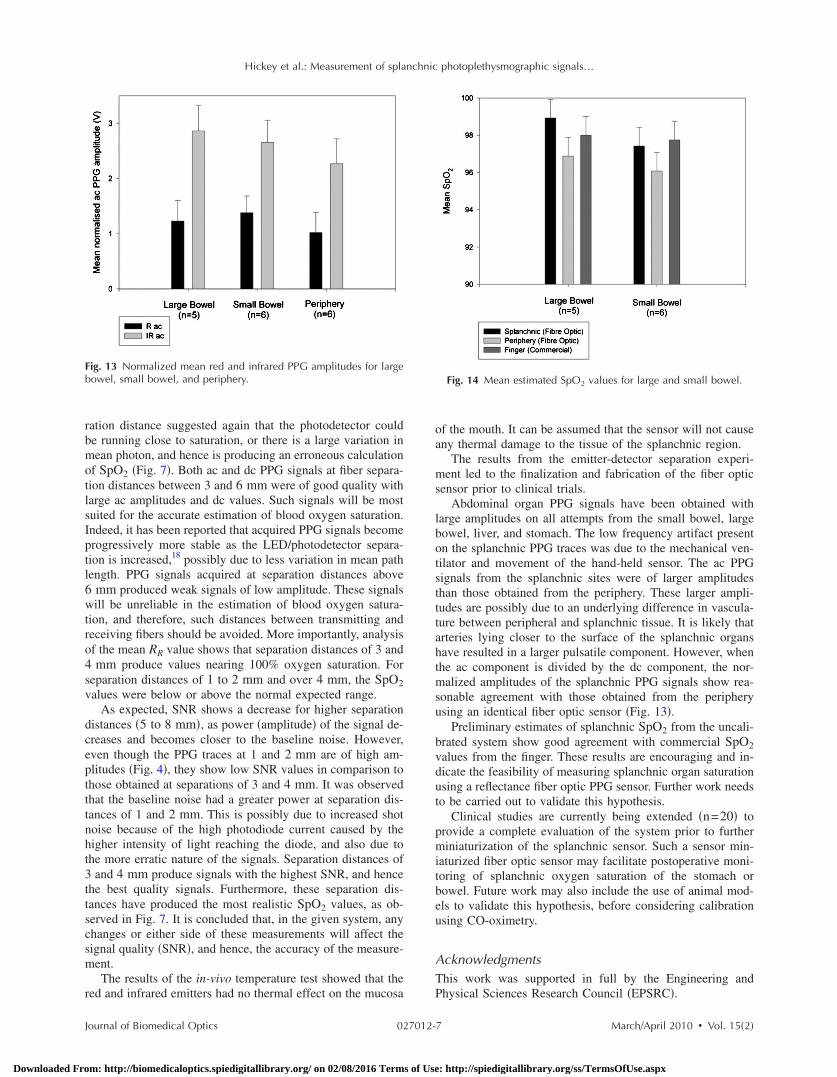
The amplitudes of the normalized ac splanchnic PPG sig-als were analyzed with those obtained from the peripheralite �Fig. 13�.
Although this is an uncalibrated system, preliminary SpO2alues were estimated using Eq. �2�. This was to evaluate ifhe fiber optic sensor and processing system may be capablef providing a reliable means of estimating blood oxygenaturation.
The ANOVA test �p�0.05� showed that there were notatistically significant differences between the SpO2 from thebdominal organs and those from the finger �Fig. 14�.
Conclusionfiber optic reflectance splanchnic PPG sensor and PPG pro-
essing and acquisition system are developed and evaluateduccessfully. The results of the emitter-detector separation ex-
ig. 9 ac PPG signals from the large bowel, with simultaneous periph-ral PPG and ECG.
ig. 10 ac PPG signals from the small bowel, with simultaneous pe-ipheral PPG and ECG.
ournal of Biomedical Optics 027012-
m: http://biomedicaloptics.spiedigitallibrary.org/ on 02/08/2016 Terms of Use
periment show a trend of decreasing ac and dc PPG ampli-tudes with increasing separation distance. Such a phenomenonis well explained, as the transfer of photons to the emitter viathe tissue bed decreases as the distance between the emittingsource and the receiving source increases. PPG signals ac-quired at 1-mm distance between the transmitting and receiv-ing fibers were found to be unsuitable, as the resulted PPGsignals were noisy, erratic, and of extremely large amplitudes.This was possibly due to the photodetector running close tosaturation. Also, the relative positions of the transmitting andreceiving fibers may affect the distribution of path lengths thatphotons travel before being captured by the detector.19 As thearterioles and capillaries in the finger do not extend up to theskin surface, at a separation of 1 mm, it is possible that thephotons reaching the detector have passed through a variousnumber of paths—some deeper through pulsatile tissue—while other photons merely probe the surface of the finger.This variable difference in photon path length and the largevariation in photon arrival time may explain the erratic signalsobtained at this separation distance. Furthermore, such sepa-ration distance will ultimately result in the erroneous estima-tion of blood oxygen saturation, as is shown in Fig. 7. At2-mm separation, the ac PPG signals were of better qualitythan the 1-mm separation. However, the dc PPGs at this sepa-
Fig. 11 ac PPG signals from the stomach, with simultaneous periph-eral PPG and ECG.
Fig. 12 ac PPG signals from the liver, with simultaneous peripheralPPG and ECG.
March/April 2010 � Vol. 15�2�6
: http://spiedigitallibrary.org/ss/TermsOfUse.aspx
rbmotlsIptl6wtro4sv
dceptttnht3ttscsm
r
Fb
Hickey et al.: Measurement of splanchnic photoplethysmographic signals…
J
Downloaded Fro
ation distance suggested again that the photodetector coulde running close to saturation, or there is a large variation inean photon, and hence is producing an erroneous calculation
f SpO2 �Fig. 7�. Both ac and dc PPG signals at fiber separa-ion distances between 3 and 6 mm were of good quality witharge ac amplitudes and dc values. Such signals will be mostuited for the accurate estimation of blood oxygen saturation.ndeed, it has been reported that acquired PPG signals becomerogressively more stable as the LED/photodetector separa-ion is increased,18 possibly due to less variation in mean pathength. PPG signals acquired at separation distances above
mm produced weak signals of low amplitude. These signalsill be unreliable in the estimation of blood oxygen satura-
ion, and therefore, such distances between transmitting andeceiving fibers should be avoided. More importantly, analysisf the mean RR value shows that separation distances of 3 andmm produce values nearing 100% oxygen saturation. For
eparation distances of 1 to 2 mm and over 4 mm, the SpO2alues were below or above the normal expected range.
As expected, SNR shows a decrease for higher separationistances �5 to 8 mm�, as power �amplitude� of the signal de-reases and becomes closer to the baseline noise. However,ven though the PPG traces at 1 and 2 mm are of high am-litudes �Fig. 4�, they show low SNR values in comparison tohose obtained at separations of 3 and 4 mm. It was observedhat the baseline noise had a greater power at separation dis-ances of 1 and 2 mm. This is possibly due to increased shotoise because of the high photodiode current caused by theigher intensity of light reaching the diode, and also due tohe more erratic nature of the signals. Separation distances ofand 4 mm produce signals with the highest SNR, and hence
he best quality signals. Furthermore, these separation dis-ances have produced the most realistic SpO2 values, as ob-erved in Fig. 7. It is concluded that, in the given system, anyhanges or either side of these measurements will affect theignal quality �SNR�, and hence, the accuracy of the measure-ent.The results of the in-vivo temperature test showed that the
ed and infrared emitters had no thermal effect on the mucosa
ig. 13 Normalized mean red and infrared PPG amplitudes for largeowel, small bowel, and periphery.
ournal of Biomedical Optics 027012-
m: http://biomedicaloptics.spiedigitallibrary.org/ on 02/08/2016 Terms of Use
of the mouth. It can be assumed that the sensor will not causeany thermal damage to the tissue of the splanchnic region.
The results from the emitter-detector separation experi-ment led to the finalization and fabrication of the fiber opticsensor prior to clinical trials.
Abdominal organ PPG signals have been obtained withlarge amplitudes on all attempts from the small bowel, largebowel, liver, and stomach. The low frequency artifact presenton the splanchnic PPG traces was due to the mechanical ven-tilator and movement of the hand-held sensor. The ac PPGsignals from the splanchnic sites were of larger amplitudesthan those obtained from the periphery. These larger ampli-tudes are possibly due to an underlying difference in vascula-ture between peripheral and splanchnic tissue. It is likely thatarteries lying closer to the surface of the splanchnic organshave resulted in a larger pulsatile component. However, whenthe ac component is divided by the dc component, the nor-malized amplitudes of the splanchnic PPG signals show rea-sonable agreement with those obtained from the peripheryusing an identical fiber optic sensor �Fig. 13�.
Preliminary estimates of splanchnic SpO2 from the uncali-brated system show good agreement with commercial SpO2values from the finger. These results are encouraging and in-dicate the feasibility of measuring splanchnic organ saturationusing a reflectance fiber optic PPG sensor. Further work needsto be carried out to validate this hypothesis.
Clinical studies are currently being extended �n=20� toprovide a complete evaluation of the system prior to furtherminiaturization of the splanchnic sensor. Such a sensor min-iaturized fiber optic sensor may facilitate postoperative moni-toring of splanchnic oxygen saturation of the stomach orbowel. Future work may also include the use of animal mod-els to validate this hypothesis, before considering calibrationusing CO-oximetry.
AcknowledgmentsThis work was supported in full by the Engineering andPhysical Sciences Research Council �EPSRC�.
Fig. 14 Mean estimated SpO2 values for large and small bowel.
March/April 2010 � Vol. 15�2�7
: http://spiedigitallibrary.org/ss/TermsOfUse.aspx

R
1
Hickey et al.: Measurement of splanchnic photoplethysmographic signals…
J
Downloaded Fro
eferences1. A. J. Crerar-Gilbert, P. A. Kyriacou, D. P. Jones, and R. M. Langford,
“Assessment of photoplethysmographic signals for the determinationof splanchnic oxygen saturation in humans,” Anaesthesia 57, 442–445 �2002�.
2. Jury of the Consensus, “Tissue hypoxia: how to detect, how to cor-rect, how to prevent?” Intensive Care Med. 22, 1250–1257 �1996�.
3. D. R. Dantzker, “The gastrointestinal tract. The canary of the body?”J. Am. Med. Assoc. 270�10�, 1247–1248 �1993�.
4. D. Rittoo, P. Gosling, C. Bonnici, S. Burnley, P. Millns, M. H.Simms, S. R. G. Smith, and R. K. Vohra, “Splanchnic oxygenation inpatients undergoing abdominal aortic aneurysm repair and volumeexpansion with eloHAES,” Cardiovasc. Surg. 10, 128–133 �2002�.
5. J. J. Ferrara, D. L. Dyess, M. Lasecki, S. Kinsey, C. Donnell, and G.Jurkovich, “Surface oximetry. A new method to evaluate intestinalperfusion,” Am. Surg. 54, 10–14 �1998�.
6. D. Lynn Dyess, B. W. Bruner, C. A. Donnell, J. J. Ferrara, and R. W.Powell, “Intraoperative evaluation of intestinal ischemia: a compari-son of methods,” South Med. J. 84�8�, 966–970 �1991�.
7. P. J. Kinnala, K. T. Kuttila, J. M. Gronroos, T. V. Havia, T. J. Nev-alainen, and J. H. A. Niinikoski, “Splanchnic and pancreatic tissueperfusion in experimental acute pancreatitis,” Scand. J. Gastroen-terol. 7, 845–849 �2002�.
8. J. J. Kolkman, J. A. Otte, and A. B. Groeneveld, “Gastrointestinalluminal PCO2 tonometry: an update on physiology, methodology andclinical applications,” Br. J. Anaesth. 84�1�, 74–86 �2000�.
9. M. Haterhill, S. M. Tibby, R. Evan, and I. A. Murdoch, “Gastrictonometry in septic shock,” Arch. Dis. Child 78, 155–158 �1998�.
0. U. Matern, J. Haberstroh, A. el Saman, E. Pauly, R. Salm, and E. H.
ournal of Biomedical Optics 027012-
m: http://biomedicaloptics.spiedigitallibrary.org/ on 02/08/2016 Terms of Use
Farthmann, “Emergency laparoscopy. technical support for the lap-aroscopic diagnosis of intestinal ischemia,” Surg. Endosc 10, 883–887 �1996�.
11. A. Fournell, L. A. Schwarte, T. W. L. Scheeren, D. Kindgen-Milles,P. Feindt, and S. A. Loer, “Clinical evaluation of reflectance spectro-photometry for the measurement of gastric microvascular oxygensaturation in patients undergoing cardiopulmonary bypass,” J. Car-diothorac Vasc. Anesth. 16, 576–581 �2002�.
12. S. M. Jakob and J. Takala, “Ards. monitoring tissue perfusion,” Crit.Care Clin. 18, 143–163 �2002�.
13. J. DeNobile, P. Guzzetta, and K. Patterson, “Pulse Oximetry as ameans of assessing bowel viability,” J. Surg. Res. 48, 21–23 �1990�.
14. P. H. MacDonald, P. K. Dinda, I. T. Beck, and C. D. Mercer, “The useof oximetry in determining intestinal blood flow,” Surg. Gynecol.Obstet. 176, 451–458 �1993�.
15. K. Ouriel, W. M. Fiore, and J. E. Geary, “Detection of occult colonicischemia during aortic procedures: use of an intraoperative photopl-ethysmographic technique,” J. Vasc. Surg. 7, 5–9 �1988�.
16. E. R. L. Hei and A. Shun, “Intra-operative pulse oximetry can helpdetermine intestinal viability,” Pediatr. Surg. Int. 17, 120–121 �2001�.
17. J. G. Webster, Design of Pulse Oximeters, Institute of Physics Pub-lishing, Bristol, UK �2003�.
18. Y. Mendelson and B. D. Ochs, “Noninvasive pulse oximetry utilisingskin reflectance photoplethysmography,” IEEE Trans. Biomed. Eng.35, 798–805 �1998�.
19. J. M. Schmitt, “Simple photon diffusion analysis of the effects ofmultiple scattering on pulse oximetry,” IEEE Trans. Biomed. Eng. 98,1194–1203 �1991�.
March/April 2010 � Vol. 15�2�8
: http://spiedigitallibrary.org/ss/TermsOfUse.aspx