city research onlineopenaccess.city.ac.uk/16059/1/zomorodian et al-engineering structures.pdf ·...
TRANSCRIPT
City, University of London Institutional Repository
Citation: Zomorodian, M., Yang, G., Belarbi, A. & Ayoub, A. (2016). Cracking behavior and crack width predictions of FRP strengthened RC members under tension. Engineering Structures, 125, pp. 313-324. doi: 10.1016/j.engstruct.2016.06.042
This is the accepted version of the paper.
This version of the publication may differ from the final published version.
Permanent repository link: http://openaccess.city.ac.uk/16059/
Link to published version: http://dx.doi.org/10.1016/j.engstruct.2016.06.042
Copyright and reuse: City Research Online aims to make research outputs of City, University of London available to a wider audience. Copyright and Moral Rights remain with the author(s) and/or copyright holders. URLs from City Research Online may be freely distributed and linked to.
City Research Online: http://openaccess.city.ac.uk/ [email protected]
City Research Online

CRACKING BEHAVIOR AND CRACK WIDTH PREDICTIONS OF
FRP STRENGTHENED RC MEMBERS UNDER TENSION
Abstract
This paper presents and discusses the experimental results of uniaxial tensile tests of fiber
reinforced polymer externally strengthened reinforced concrete (FRP strengthened RC) prisms in
terms of crack width and crack spacing. As a non-contact and material independent system for
in-time measurement of displacement and strain, the digital image correlation (DIC) technique
has been used in this study for investigating the evolution of strains and formation of cracks
during uniaxial tensile tests. As a result, the cracks were measured precisely at any load stage.
The experimental results of tests performed by authors and other researchers on FRP
strengthened RC members in tension are compared to prediction models from code provisions
and guidelines (Eurocode 2 and fib 14), and their suitability are analyzed and discussed. The
results show the dependence of the behavior and crack characteristics of FRP strengthened RC
members to parameters such as wrapping scheme and FRP reinforcement ratios which are not
included in design provisions for crack analysis. A new formulation for crack width and spacing
for FRP strengthened RC members, calibrated using the experimental results, has been proposed
which considers all the main affecting parameters.
1. Introduction
As a response to corrosion problems in reinforcing steel, to enhance the durability of RC
structures, and to increase the efficiency of strengthening systems, FRP composites became
popular in civil engineering during the last three decades. Although the use of externally bonded

FRP composites is by now a recognized technique, some aspects of the ultimate and
serviceability limit states needs further experimental and analytical investigations; especially for
serviceability conditions, which there is a lack of design provisions. The serviceability design of
FRP strengthened RC structures may be affected by the mechanical and bond properties of the
additional external FRP reinforcement. Therefore, accurate modeling of the cracking and
deformability behavior in such members is crucial. For FRP strengthened RC members the
cracking behavior is typically evaluated by using the same approach used for RC members [1].
For the design, both the ultimate limit state and the serviceability limit state of the structure must
be verified. An FRP strengthened RC member is designed for the required strength and
afterwards checked for serviceability and the ultimate state criteria. It should be noted that in
many cases, the serviceability criteria controls the design. According to clause 10.2.8 of ACI
440.2R-08 [2], to avoid inelastic deformations in FRP strengthened RC members at
serviceability limit states, the stress in steel reinforcement should be limited to 80% of the yield
strength.
Compared to the large numbers of experimental results on FRP strengthened RC elements which
aim at studying the behavior at the ultimate stage, fewer results are available for verification of
serviceability conditions under direct tension [1, 3-10]. Moreover, increase in the ultimate
capacity due to FRP strengthening will not necessarily result in a proportional increase in the
service load [1]; therefore, verification of serviceability limit state in FRP strengthened RC
elements is crucial. A number of experimental tests have been conducted to evaluate the
cracking of FRP strengthened RC flexural elements [11-13]. However, the behavior of FRP
strengthened RC members under direct tension was the focus of few research studies [3-9].

In the case of RC structures, reliable and effective models are available for evaluating deflections
and crack widths at the serviceability limit state, which also takes into account the tension
stiffening effect [1]. The modelling of tension stiffening in RC beams is typically based on
several experimental tests on specimens in uniaxial tension and bending. The code formulas are
advanced by now for RC members. Also, studies related to members strengthened with FRP rods
are progressing [14, 15]. However, for RC members strengthened by externally bonded FRP, the
serviceability in terms of crack characteristics has not been well established; in this case further
studies are needed regarding the transfer of stresses at the concrete-FRP interface, and also the
interaction of the external reinforcement with internal steel. Limited research studies have
investigated the crack characteristics and tension stiffening of externally bonded FRP
strengthened prisms and beams [1, 3-10]. Some design provisions provide equations for
calculating crack width and spacing for RC elements at serviceability conditions [16-21].
However, fewer provision are available for the serviceability conditions and crack width and
spacing predictions in design codes for FRP strengthened RC structures. An available code
formula for the prediction of mean crack spacing and width is presented in fib Bulletin 14 [21],
which is based on the work presented by Matthys [8].
Applying FRP reinforcement significantly changes the crack width and spacing of the RC
member, since tension stiffening phenomena develops both at the steel-concrete interface and the
FRP-concrete interface. Therefore, average crack widths are generally smaller than for un-
strengthened members at the same smeared strain level, due to the additional tension
stiffening of the external FRP reinforcement developing at the FRP-concrete interface
which reduces the crack spacing [3-10].

This paper presents and discusses the experimental results of FRP strengthened RC members
tested under uniaxial tension. The tensile RC members (prisms) were reinforced with externally
bonded FRP sheets. The prisms had different steel and FRP reinforcement ratios combined with
different wrapping schemes. Details of the tensile behavior and also the crack characteristic
analysis of the specimens are presented. The experimental results of tests performed by authors
and results available in the literature on RC elements externally strengthened with FRP [4, 8, and
9] in terms of crack spacing and crack width are compared with code provisions and the
suitability of the prediction models is analyzed. Finally, a new formulation for crack width and
spacing for FRP strengthened RC members, calibrated using the experimental results, has been
proposed which considers all the main affecting parameter.
The crack characteristics including crack width, number of cracks, and spacing are monitored by
using a digital image correlation (DIC) system at the conducted experiments. The evolution of
strains and deformations on FRP and concrete have been measured with a DIC system and its
tracking method. This method has been widely used for measurements in RC members [22-25].
2. Principles of the cracking phenomena
If a continuously increasing tension load is applied to a member, the first crack will form when
the tensile strength of the weakest section in the member is reached. This crack will result in a
local redistribution of stress in that member. At the crack, all the tensile force will be transferred
to the reinforcements, and the stress in the concrete adjacent to the crack will drop to zero [26].
With increasing distance from the crack, force is transferred from the reinforcements to the
concrete by bond stress until, at some distance, S0, from the crack; the stress distribution within
the section remains unchanged from what it was before the crack formed. This local
redistribution of forces in the region of the crack is accompanied by an extension of the member.

This extension, plus a minor shortening of the concrete which has been relieved of the tensile
stress it was supporting, is accommodated in the crack. The crack thus opens up to a finite width
immediately on its formation. The formation of the crack and the resulting extension of the
member also reduce the stiffness of the member. As further load is applied, a second crack will
form at the next weakest section, though it will not form within S0 of the first crack since the
stresses in this region will have been reduced by the formation of the first crack. However, if the
second crack is formed at a distance more than 2S0 away from the first crack, there is a certain
length between the two cracks where the concrete stress reaches the concrete tensile strength.
This means at least one crack will form between two existing cracks if they are at a distance
more than 2S0 apart. Further increase in load will lead to the formation of more cracks until there
is no remaining area of the member surface which is not within S0 of a previously formed crack.
Further loading will result in widening of existing cracks but no new cracks will form, therefore
a stable crack pattern with a crack spacing of S is achieved. The variation of
steel, concrete and FRP strains between two adjacent cracks are shown in Fig.1. Steel strain ( s )
and FRP strain ( f ) reduces from a peak at the crack location to a minimum halfway between
the cracks; the concrete strain ( c ) follows a converse pattern. It is assumed that the strain in
FRP and steel at the crack location are the same ( 0s ). Since the bond stress between steel and
concrete is not the same for FRP and concrete, with the increase of distance from the crack the
strain variation of FRP and steel differ from each other, In Fig. 1, sm and cm are the average
steel strain and average concrete strain. In RC members, the crack opening is computed as the
integral of the difference between the steel and concrete strains over two half crack spacing
(Fig.1.).
Fig.1. Schematic of strain distribution after cracks are formed
The distance S0 of an existing crack, defines the average spacing of the cracks and the maximum
spacing is 2S0. It is in the calculation of S0 that the most significant differences arise between the
equations in code provisions. The distance S0 depends on the rate at which the stress can be
transferred from the reinforcements, which are carrying all the force at a crack, to the concrete.
This transfer is affected by bond stresses on the reinforcements. It is assumed that the bond stress
is constant along the length S0, and the stress will reach the tensile strength of the concrete at a
distance S0 from a crack.
2.1. Code provisions for crack spacing and crack width
The integrity of a structure is affected by the crack characteristics and therefore careful
considerations should be made [27-28].In the past, tremendous amount of effort has gone into
developing methods to predict the crack width and spacing in RC members and many equations
have been proposed in different formats. A summary of the previous work on crack width and
spacing formulations in RC members are presented in Borosnyoi and Balazs [29]. In general,
these equations have the following format [30]:
bd
kw
(1)
Where w is the average crack width. From the equation it can be seen that the key elements
which affect the crack width are the bond characteristic parameter k, the bar diameter , the
reinforcement ratio , and the average strain
In Eurocode 2 [16], it is assumed that all the deformation of the member when a crack is formed
is accommodated in that crack. When all cracks have formed, the crack width is given by the
following relationship, which is based on compatibility:
smrmkk Sw
(2)
Where, wk is the average crack width, may be taken as 1.7 for load induced cracking, Srm is
the average crack spacing and εsm is the average strain. As shown in Eq. (3), in the crack width
formulation given in EC2-04 [17], the average strain is assumed to be equal to the average strain
in the reinforcements, εsm, taking account of tension stiffening, and taking out the average strain
in the concrete at the surface, εcm (Fig.1).
cmsmrmkk Sw
(3)
The following equation has been presented in EC2-92 [16] for average crack spacing:
eff
rm kkS
2125.050
(4)

Where, k1 is the bond coefficient equal to 0.8 for deformed bars and 1.6 for plain bars; k2 is the
coefficient to take into account the type of loading equal to 0.5 for bending and 1.0 for pure
tension; ∅ is the diameter of steel bar; and ρeff is the effective reinforcement ratio.
More recent studies have shown that the cover of concrete also has a significant influence [30-
32]. In EC2-04 [17] the following equation was proposed to evaluate the maximum crack
spacing for RC elements:
eff
r kkcS
21max, 425.04.3 (5)
Where c is the concrete cover and k1, k2, ∅, and ρeff are defined same as EC2-92 [16]. It was
found experimentally that a reasonable estimate of the characteristic crack width is
obtained if the maximum crack spacing is assumed to be 1.7 times the average crack
spacing [17]. Therefore, based on EC2-04, the average crack spacing, Srm, can be calculated
as follows:
eff
rm kkcS
2125.02 (6)
Ceroni [1] proposed the following expression for the effective reinforcement ratio to
consider the effect of externally bonded FRP in Eurocode 2 equations:
effc
sffs
effA
EEAA
,
/ (7)
Where As is the area of steel reinforcement, Af is the area of the FRP reinforcement, Ef and
Es are the Young’s modulus of FRP and steel respectively. Also, Ac,eff is the effective area
of concrete in tension, reasonably assumed as an area surrounding the steel rebar with a
radius of three times the diameter of the rebar.

In fib 14 [21], the average crack spacing in RC members strengthened with FRP sheets ,
taking into effect of both the internal and the external reinforcement, is calculated using the
following formulation:
ffbss
ffb
ffm
effcctm
ffbss
ss
ssm
effcctm
rmAEAE
AE
u
Af
AEAE
AE
u
AfS
,, 22 (8)
Where fctm is the mean tensile strength of concrete, us and uf are the perimeters of the steel
bar and FRP sheets bonded to concrete, τfm=1.8fctm [33] and τsm=1.25fctm [8] are the bond
stresses along the concrete-steel interface and concrete-FRP interfaces, which are assumed
constant and is a bond parameter given as:
sffsm
fssfm
buAE
uAE
(9)
The other parameter in the crack width equation is the average strain. In EC2-92 [16], εsm is
defined as:
2
212 1s
crsm
(10)
Where considers the bond characteristics of the internal steel rebars (1 for ribbed and 0.5 for
smooth bars), considers the loading type (1 for short and 0.5 for long term loading); is the
tensile stress in the steel bar at the first cracking load, and are the stress and strain in the
steel bar at the cracked section.
In EC2-04 [17] a different form of the equation is adopted and the difference in materials strains
between cracks is described as:

s
s
effs
effectmt
s
scmsm
EE
fk
E
6.0
1
(11)
Where , is the stress in the tension reinforcement, calculated by assuming a cracked section,
is the modular ratio (Es/Ec), kt is a factor depending on the duration of the load (0.6 for short-
term loads and 0.4 for long-term loads), and ρeff for FRP strengthened RC members is calculated
as shown in Eq. (7).
In fib14 [21], the same approach as EC2-92 [16] is used for calculation of the average strain and
average crack widths. By assuming that the initial strain at the extreme tensile fiber before
strengthening is zero, ε2 can be calculated as follows:
ffss
fs
AEAE
PP
2
(12)
Where, Ps and Pf are the total tensile force in steel and FRP respectively.
3. Experimental program
In order to evaluate the behavior of FRP strengthened RC elements under tension, and to
investigate the serviceability conditions, a series of full-scale tensile tests of FRP strengthened
RC prisms have been conducted. The experimental program consisting thirteen full-scale FRP
strengthened RC prisms tested under direct tensile loading was discussed in detail in [34-35].
Only a brief summary of the work and the main data are presented here. The test setup and
dimensions of the specimens are shown in Fig. 2. The specimens are 1400 mm long RC prisms
with a cross section of 257 mm × 178 mm. FRP sheets with a width of 200 mm were applied on
the two opposite wider sides of the specimen. Pin connection was used at the ends to eliminate

any potential bending effect and ensure pure uniaxial loading. Three different wrapping schemes
were used, including Side Bond (SB), Fully Wrapped (FW) and U-wrap with FRP Anchors (FA).
Testing initially started using load control up to the first cracking and then switched to
displacement control until failure of the specimen.
In Table 1, the material properties are reported; fy and Es being the yielding stress and Young’s
modulus of steel, respectively, t, Fu,FRP and Ef are the thickness, ultimate strength and Young’s
modulus of FRP, respectively. In table 2, the steel bar diameter, db (Ø), internal steel
reinforcement ratio, , external FRP reinforcement ratio, , the effective reinforcement ratio,
, defined previously, of the tested specimens are reported.
a) North view of the test specimen

b) Specimen layout
Fig. 2. Test setup and specimen layout (units in mm)
Table 1
Material properties.
Material
Steel #3 #4 #5
fy, (MPa) 458 462 469
Es, (GPa) 189 190 195
FRP SCH-11UP SCH-41S
1.0
876
72
t, (mm) 0.6
Fu,FRP, (MPa) 827
Ef, (GPa) 83
Table 2
Geometric and strengthening characteristics of the specimens [35].
Specimen Ø (mm) (%) (%) (%) Wrapping Scheme Anchorage method
REF_R3 0.375 0.31 - 0.058 - -
REF_R4 0.5 0.55 - 0.049 - -
REF_R5 0.625 0.87 - 0.045 - -
S3-025-FA 0.375 0.31 0.04 U-Wrap FRP anchor
S3-040-FA 0.375 0.31 0.035 U-Wrap FRP anchor
S4-025-FA 0.5 0.55 0.56 0.04 U-Wrap FRP anchor
S4-040-FA 0.5 0.55 0.90 0.04 U-Wrap FRP anchor
S4-025-FW 0.5 0.55 0.56 0.045 Fully Wrapped -
S4-040-FW 0.5 0.55 0.90 0.045 Fully Wrapped -
S4-025-SB 0.5 0.55 0.56 0.039 Side Bond -
S4-04-SB 0.5 0.55 0.90 0.058 Side Bond -
S5-025-FA 0.625 0.87 0.56 0.049 U-Wrap FRP anchor
S5-040-FA 0.625 0.87 0.90 0.045 U-Wrap FRP anchor

The specimens are identified by steel rebar sizes Nos. 3, 4, and 5), FRP sheet
thicknesses [0.6 and 1 mm (0.025 and 0.040 in.)], and wrapping schemes (Fully
Wrapped, Side Bond, and U-wrap with FRP Anchor). As an example: “S4-040-FW”
stands for the specimen with No. 4 rebar, 1 mm (0.040 in.) thick FRP sheets and
Fully Wrapped (FW) wrapping scheme method. REF-R3, REF-R4, and REF-R5
stand for RC reference specimens with Nos. 3, 4, and 5 rebars, respectively.
For the test procedure, load control was first used until the cracks occurs, after that
the displacement control mode was used unti l the failure of the specimen. In the
loading control mode, tensile load was applied at increments of 2.2 kN/jack/min.
For the displacement control steps in the post -cracking stage, the increment of the
strain was set to 0.0001 (mm/mm)/min.
4. Digital Image Correlation Measurement Technique
Digital image correlation is an optical, non-contact based measurement method, which 3D
displacements and deformations of a specimen are measured. DIC systems are well known
techniques for non-contact full field measurement of deformations and strains. The basic
principle consists of matching pixels between the initial and deformed images. The fundamental
correlation function, C, which is a function of the coordinates of the reference image, defines the
relationship of the reference image and the deformed image (Eq.13). The displacements in both
directions are defined as u and v, and I is the reference image and is a function of the pixel values
x+i and y+j. I*
represents the image after deformation and is a function of the pixel values with
the deformations applied. The correlation functions C, is the sum of the squared differences
between the reference image and the deformed image, where the function is summed over the
subset size n. The measured subset is defined as a small area which contains points being tracked
by the correlation function [36].
2/
2/,
2* ,,),,,(n
nji
jvyiuxIjyixIvuyxC
(13)
A random pattern is first applied on the surface of the measuring object by spray paint or
airbrush, similar to the example shown in Fig. 3. A suitable balance between the average black-
white spots must be achieved in order to enhance the accuracy of the measurements. To capture a
stereographic image of the test specimens in a 3D measurement, two cameras are used (Fig. 4).
The size and location of measuring volume with respect to the cameras, the angle of cameras,
and the position of the two cameras with respect to each other are first determined by system
calibration. Calibration is performed by taking pictures of a calibration object, which has targets
mounted on it with known sizes and distances to each other, through a set range of motions
within the volume where the measurement is being captured.
Full field displacements of a specimen are captured by collecting digital images at pre-
determined time intervals throughout the test and comparing the first image which represents the
reference configuration with other images. By post processing the digital images, the ARAMIS
DIC-3D software recognizes the structure of the stochastic pattern and allocates coordinates to
image pixels [37]. The displacement field is measured through overlapping image details (or
facets) which have a certain size, defined across the region of interest. A facet is used because it
has a wider variation in gray levels which can be uniquely identified from other facets in the
deformed image [23]. In Fig.3, a facet assigned to a digital image is shown. The deformation of
the facet after several steps in testing is shown with respect to the reference image. Typically

increasing the facet size enhances the accuracy of the measurements but will lower the spatial
resolution which is defined by the facet size [38].
Fig. 3. The pattern on the surface of a concrete specimen and facets
To obtain a common 3-D coordinate between images, the corner points from both cameras are
used and the 2-D coordinates of the same facet are determined.
In this study, the specimens were prepared by applying a speckle pattern as shown in Fig.3. A
thin layer of white flat paint was first applied on the surface, followed by a distribution of black
dots using spray paint. The ARAMIS DIC-3D software by GOM [37] was used in this work. In
the test set-up, the DIC system was positioned facing the surface of the specimen (Fig.4). The
measuring distance for all the tests was set about 80 inches. To focus the image on the
specimen’s surface, the aperture of the lens was first completely open and then during the test, to
improve the depth of field the lens aperture was closed. The shutter time was set to 60 ms.
Finally, to avoid over exposure and to have a uniform illumination of the measuring surface, the
light source was adjusted.

Fig.4. ARAMIS 3D sensor setup
In this study, a facet size of 19×19 pixels was chosen and the facet step was set to 15×15 pixels
to avoid statistically correlated measurements. The crack characteristics including crack width,
number of cracks, and spacing are monitored by using the ARAMIS system. In Fig. 5, the strain
field in the direction of applied load of a specimen at a specific load level is shown using
color gradient. The cracks are identified at locations with sudden increase in strain, . The crack
widths are measured by assigning two points near the cracks and continuously measuring their
distances.
Fig. 5. Full strain field in the direction of applied load of a specimen at a specific load level
5. Test results and data analysis

In this section the experimental results of the uniaxial tensile tests of FRP strengthened RC
specimens are presented. Details on the tensile behavior and cracking analysis of externally
bonded FRP strengthened RC members are given.
5.1. Tensile behavior
The load- average strain curves (P- ) of the tests are shown in Fig. 6. The average strain is
calculated based on the measurements of LVDTs over the test region as shown in Fig. 2 (i.e., 800
mm).
The uniaxial tensile behavior of the FRP strengthened RC members can be defined by three
different regions. The stress-average strain curve has an initial linear branch with steep slope,
which corresponds to the un-cracked condition of the member (pre-cracking stage). After the
first cracking, testing mode was switched to displacement control; therefore, the load dropped to
accommodate the increase in strain due to cracking. Afterwards, the cracking stage begins and
the slope of the stress-strain curve decreases due to progressive cracking in the FRP strengthened
RC member. Finally, at the post-yielding stage, the crack development has been stabilized and
the stress-strain curve increases monotonically until failure (Fig. 6).
Figs. 6a and 6b shows the results of the specimens with same steel and FRP reinforcement ratios
but different wrapping scheme. It can be observed form Figs. 6a and 6b that the application of
externally bonded FRP sheets significantly increases the capacity of the RC member. Also, the
observed failure modes are debonding for specimen with side bond wrapping scheme, and FRP
rupture for specimens with fully wrapped and U-wrap with FRP anchors. In both cases, the

average steel strain at failure is significantly smaller than that in RC members. Moreover, it can
be observed that the specimens with fully wrapped and FRP anchors have a greater gain in
capacity when compared to side bond wrapping scheme. This can be attributed to the fact that
the failure mode for the side bond wrapping scheme is FRP debonding while the failure mode for
fully wrapped and FRP anchors is FRP rupture. In the case of debonding, failure is experienced
at a strain level which is lower than the ultimate strain of FRP, when the FRP separates form the
concrete substrate. At these lower strain levels, the FRP is not able to utilize its full tensile
capacity, effectively lowering the efficiency of the strengthening system. In the case of FRP
rupture, the fibers reach their ultimate strain value and fracture at the point of maximum stress.
Therefore, the effective strain for FRP rupture is highly greater than that of FRP debonding,
which explains the greater gain in capacity.
a) Specimen (s = 0.55%, f = 0.56%) b) Specimen (s = 0.55%, f = 0.90%)
Fig. 6. Experimental load-average strain curves
5.2. Tension stiffening effect
The tensile contribution of concrete, known as tension stiffening, is usually neglected when
calculating the strength of RC members. However, tension stiffening affects the post-cracking
stiffness and consequently the overall behavior in terms of deflection and crack width of the
member under service load [39]. Tension-stiffening effect are useful in investigating the post-
0
100
200
300
0 0.005 0.01 0.015 0.02 0.025
Ten
sile
Lo
ad P
(kN
)
Average Tensile Strain Ɛm (mm/mm)
REF_R4S4_025_SBS4_025_FAS4_025_FW
0
100
200
300
0 0.005 0.01 0.015 0.02 0.025
Ten
sile
Lo
ad P
(kN
)
Average Tensile Strain Ɛm (mm/mm)
REF-R4S4_040_SBS4_040_FAS4_040_FW
cracking behavior of the FRP strengthened RC members and can provide additional information
to explain the bond characteristics between the FRP and concrete interface, which is crucial for
investigation of the crack width and crack spacing. If the tension stiffening effect is neglected,
the calculated strains and deformations may be overestimated.
Fig. 7 shows the curves of normalized tensile stress of concrete with respect to the average
tensile strain of tested specimens. The derivations of these curves are presented elsewhere [35].
Fig. 7a shows that the tension stiffening effect tends to be greater in the specimen with higher
steel reinforcement ratio. With the increase in steel reinforcement ratio the bond characteristics
between steel and the surrounding concrete increases and therefore influence cracking [34]. Fig.
7b indicates that compared with un-strengthened reference specimen (REF-R4), the specimen
with FRP exhibited a greater tension stiffening effect. Also, when compared the specimen
wrapping with different thickness of FRP sheets, it was found that the specimens strengthened
with thinner FRP sheets (smaller FRP reinforcement ratio), tend to have a greater tension
stiffening effect. It can be observed from Fig. 7c that that the tension stiffening is more evident
in specimens strengthened using the fully wrapped and FRP anchor method compared to those
using side bonding methods. The greater tension stiffening effect for the fully wrapped and FRP
anchor can also be attributed to the greater performance of the bond action due to these wrapping
methods.

a) Specimen (f = 0.56%, FRP Anchors) b) Specimen (s = 0.55%, FRP Anchors)
c) Specimen (s = 0.55%, f = 0.56%)
Fig. 7. Average stress-strain curves of concrete in tension
The contribution of the concrete in tension affects the stiffness of the FRP strengthened RC
members after cracking. Therefore, the crack spacing and crack width are affected at service load
level. Comparing the average stress-strain curves of concrete in tension for different specimens
show that wrapping scheme and FRP reinforcement ratio affect the bond behavior of steel-
concrete and also, FRP-concrete interface in FRP strengthened RC members. This will result in a
different crack pattern in such members compared to RC members.
5.3 Crack spacing
5.3.1 Experimental results
0
0.2
0.4
0.6
0.8
1
0 0.0025 0.005 0.0075 0.01
No
rmal
ized
Co
ncr
ete
Str
ess
Average Strain [mm/mm]
S3-025-FA
S4-025-FA
S5-025-FA
0
0.2
0.4
0.6
0.8
1
0 0.0025 0.005 0.0075 0.01
No
rmal
ized
Co
ncr
ete
Str
ess
Average Strain [mm/mm]
REF-R4
S4-025-FA
S4-040-FA
0
0.2
0.4
0.6
0.8
1
0 0.0025 0.005 0.0075 0.01
No
rmal
ized
Co
ncr
ete
Str
ess
Average Strain [mm/mm]
S4-025-SB
S4-025-FA
S4-025-FW
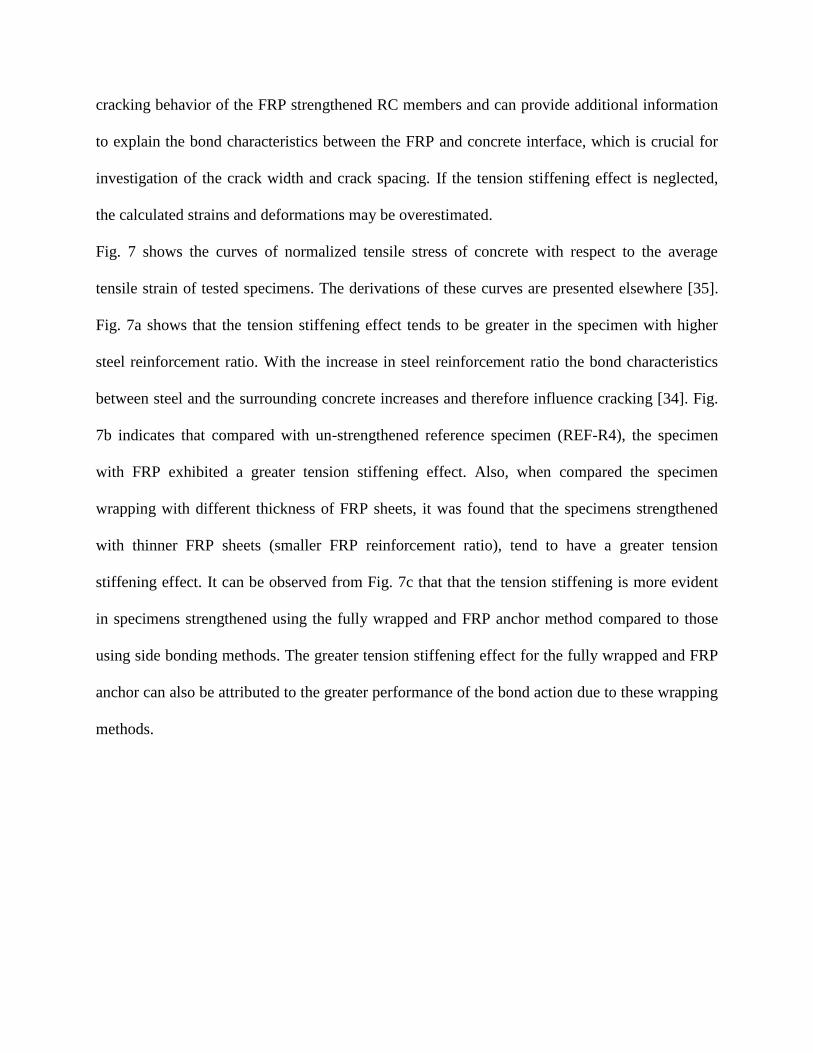
The stabilized cracking phase is reached when the crack spacing between two existing cracks are
too small for a new crack to develop in between. To determine the crack spacing, the cracks in
the last phase of the test are considered since it is closest to the stabilized cracking. In Table 3
experimental measurements of the average crack spacing, Srm, maximum crack spacing, Sr,max,
and minimum crack spacing, Sr,min, are presented. The experimental average crack spacing is
defined by the measurement of the spacing between the adjacent cracks along the length of the
prism at different heights and averaging for the entire specimen at the stabilized cracking stage.
The maximum and minimum crack spacing is defined based on the maximum and minimum
measured crack spacing at the stabilized cracking stage throughout the specimen, respectively.
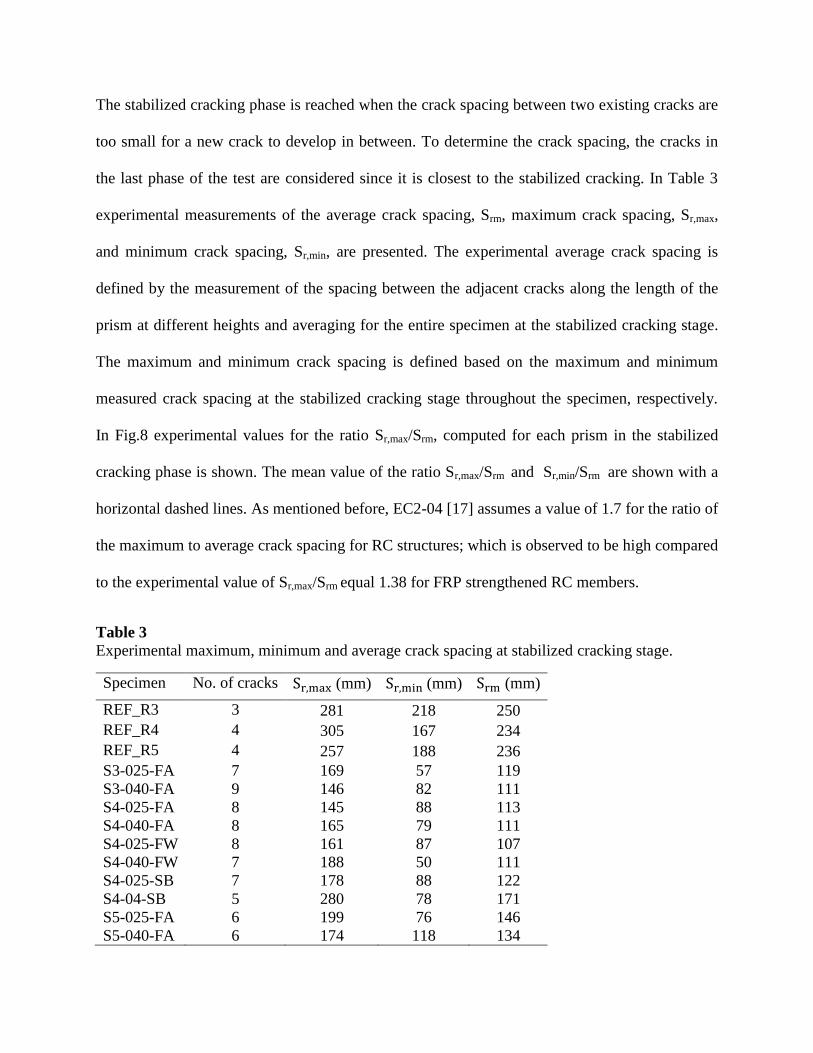
In Fig.8 experimental values for the ratio Sr,max/Srm, computed for each prism in the stabilized
cracking phase is shown. The mean value of the ratio Sr,max/Srm and Sr,min/Srm are shown with a
horizontal dashed lines. As mentioned before, EC2-04 [17] assumes a value of 1.7 for the ratio of
the maximum to average crack spacing for RC structures; which is observed to be high compared
to the experimental value of Sr,max/Srm equal 1.38 for FRP strengthened RC members.
Table 3
Experimental maximum, minimum and average crack spacing at stabilized cracking stage.
Specimen No. of cracks (mm) (mm) (mm)
REF_R3 3 281 218 250
REF_R4 4 305 167 234
REF_R5 4 257 188 236
S3-025-FA 7 169 57 119
S3-040-FA 9 146 82 111
S4-025-FA 8 145 88 113
S4-040-FA 8 165 79 111
S4-025-FW 8 161 87 107
S4-040-FW 7 188 50 111
S4-025-SB 7 178 88 122
S4-04-SB 5 280 78 171
S5-025-FA 6 199 76 146
S5-040-FA 6 174 118 134
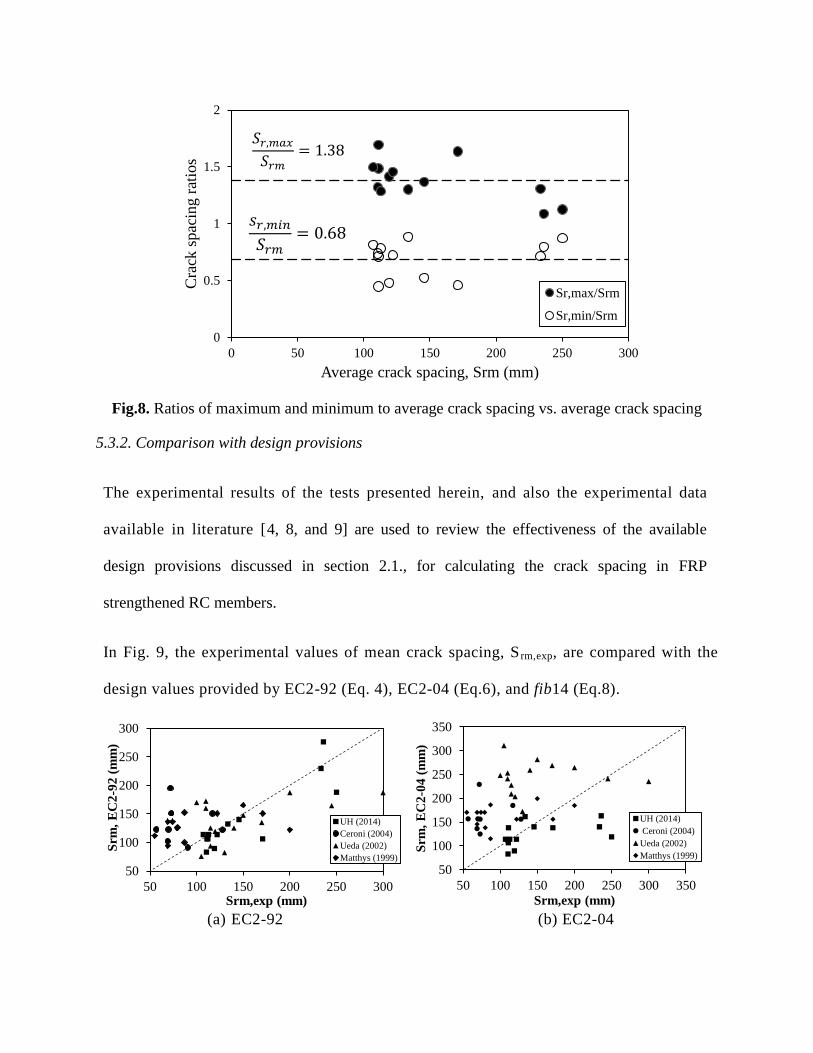
Fig.8. Ratios of maximum and minimum to average crack spacing vs. average crack spacing
5.3.2. Comparison with design provisions
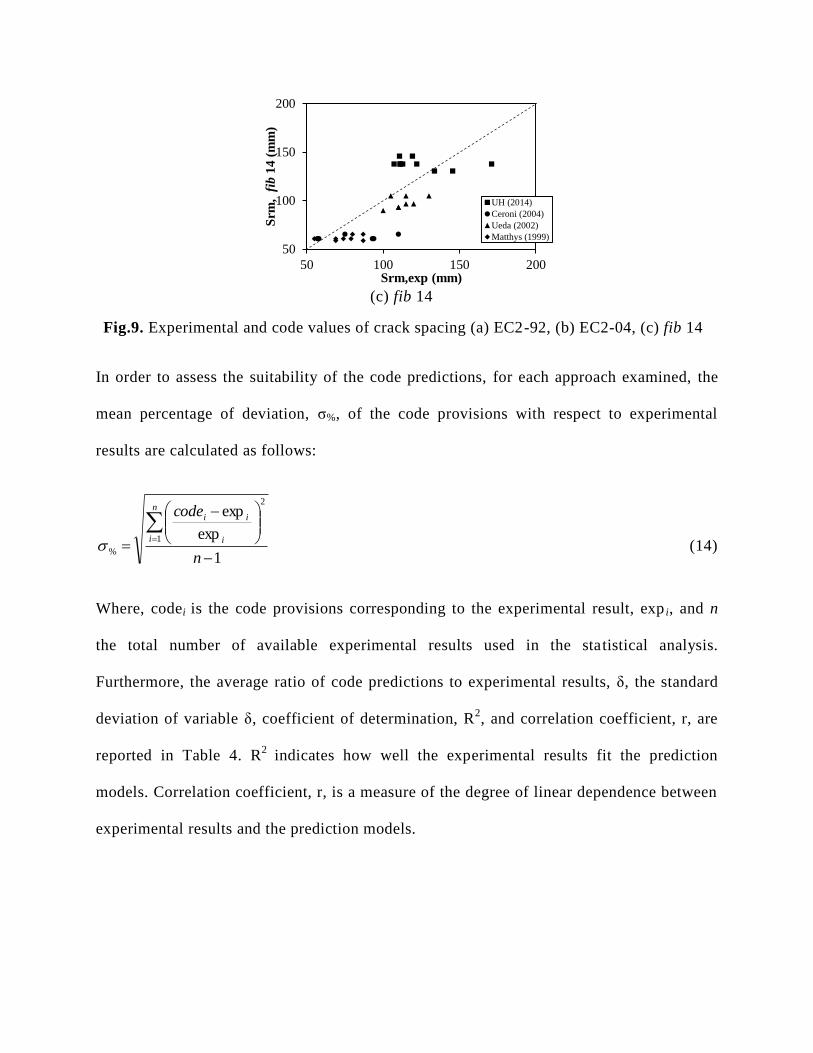
The experimental results of the tests presented herein, and also the experimental data
available in literature [4, 8, and 9] are used to review the effectiveness of the available
design provisions discussed in section 2.1., for calculating the crack spacing in FRP
strengthened RC members.
In Fig. 9, the experimental values of mean crack spacing, S rm,exp, are compared with the
design values provided by EC2-92 (Eq. 4), EC2-04 (Eq.6), and fib14 (Eq.8).
(a) EC2-92 (b) EC2-04
0
0.5
1
1.5
2
0 50 100 150 200 250 300
Cra
ck s
pac
ing r
atio
s
Average crack spacing, Srm (mm)
Sr,max/Srm
Sr,min/Srm
𝑠 𝑖𝑛
= 8
50
100
150
200
250
300
50 100 150 200 250 300
Srm
, E
C2
-92
(m
m)
Srm,exp (mm)
UH (2014)
Ceroni (2004)
Ueda (2002)
Matthys (1999)
50
100
150
200
250
300
350
50 100 150 200 250 300 350
Srm
, E
C2
-04
(m
m)
Srm,exp (mm)
UH (2014)
Ceroni (2004)
Ueda (2002)
Matthys (1999)
= 8
(c) fib 14
Fig.9. Experimental and code values of crack spacing (a) EC2-92, (b) EC2-04, (c) fib 14
In order to assess the suitability of the code predictions, for each approach examined, the
mean percentage of deviation, σ%, of the code provisions with respect to experimental
results are calculated as follows:
1
exp
exp2
1
%
n
coden
i i
ii
(14)
Where, codei is the code provisions corresponding to the experimental result, exp i, and n
the total number of available experimental results used in the statistical analysis.
Furthermore, the average ratio of code predictions to experimental results, δ, the standard
deviation of variable δ, coefficient of determination, R2, and correlation coefficient, r, are
reported in Table 4. R2
indicates how well the experimental results fit the prediction
models. Correlation coefficient, r, is a measure of the degree of linear dependence between
experimental results and the prediction models.
50
100
150
200
50 100 150 200S
rm,
fib
14
(m
m)
Srm,exp (mm)
UH (2014)
Ceroni (2004)
Ueda (2002)
Matthys (1999)

Table 4
Statistical parameters of the crack spacing for code guidelines and experimental results
The statistical parameters reported in Table. 4 shows that for crack spacing the code
guidelines of EC2-92 [16] and EC2-04 [17] presents a larger scatter compared to the fib 14
[21] prediction. The mean variable of parameter δ equal to 1.21 and 1.63 for EC2-92 and
EC2-04 respectively, shows the over-estimation of the experimental results. As in fib 14, δ
equals 0.97, which shows a good agreement between experimental results and the code
predictions. Also, evaluating the R2 and r values for fib 14 compared to EC2-92 and EC2-
04 show that fib 14 predictions show a better agreement with the experimental results. The
R2
value for EC2-04 equals -1.27, which shows that the prediction are very scatter
compared to EC2-92 and fib 14. In a previous research [35] the authors compared their
experimental results with the code predictions, and it was found that the EC2-92 shows a
better prediction of the results compared to the EC2-04 and fib 14 codes; This can be
attributed to the fact that increasing the number of experimental test used in the statistical
analysis will result in a more precise analysis of the crack spacing predictions. Also, the
experimental results presented by Ueda et al. [9] showed a good agreement with the fib 14
code formulas, compared to the other experimental tests in the database.
The comparison of code predictions and experimental results for crack spacing in
FRP strengthened RC members highlights the need for further investigations and

development of new formulations to accurately predict the crack spacing in FRP
strengthened RC members.
5.3.3 New proposed formula
The experimental database which consists of the tests performed by the authors and also the
available experimental results in literature [4, 8, and 9] was used to calibrate a new formula for
predicting the cracks spacing in externally bonded FRP strengthened RC members. The same
approach used in EC2-04 [17] for calculating crack width and spacing was adopted. Based on
previous research studies, the main parameters influencing the cracking phenomena such as
rebar diameter, effective area of concrete, concrete cover, FRP reinforcement ratios, and
parameters such as wrapping scheme was considered in the development of the new
formula. The following expression is proposed for the crack spacing prediction in FRP
strengthened RC members:
24
97.1
,
, 016.054.2
s
f
fs
beffck
Anrm
E
EAA
dAcS
(15)
Where, c is the concrete cover, 𝐴 is the effective area of concrete, db is the rebar diameter,
𝐴 and 𝐴 are the area of rebar and FRP, respectively, 𝐸 and 𝐸 are the Young’s modulus of
elasticity of steel and FRP, respectively. The variable k considers the effect of wrapping scheme
on the crack spacing. In the case of fully wrapped method and U-wrap with FRP anchor, k=1.0,
and side bonding, k=0.95. In order to use this formulation for crack spacing in RC members, the
k factor is to be 0.9 in such members.
The comparison considered between the experimental data base and the proposed model in Eq.

(15) is shown in Fig. 10. The statistical parameters reported in Table. 4 shows that the mean
percentages of deviation and the average ratio of code predictions to experimental results
for the proposed equation have reduced compared to EC2-92 [Eq. (4)], EC2-04 [Eq. (6)]
and also, fib 14 [Eq. (8)]. The variable δ and the standard deviation of variable δ are
computed as 1.01 and 0.20, respectively; which show a better prediction compared to the
code formulations.
Fig. 10. Experimental vs. theoretical values of crack spacing proposed by authors [Eq. (15)]
5.4. Crack width
5.4.1 Experimental results
Crack width measurements obtained using the DIC system is presented in this section. Using
the DIC system the crack widths were measured continuously during the test. It was observed
that in FRP strengthened RC members; average crack widths were generally smaller than
for un-strengthened members at the same smeared strain level [Fig. 11(a)], due to the
additional bond action developing at the FRP-concrete interface which reduces the crack
spacing [1, 32]. As shown in Fig. 11a, fully wrapped and U-wrap with FRP anchor
wrapping schemes provide better control of crack width as compared to side bonding.
50
100
150
200
250
300
350
400
450
500
50 150 250 350 450
Srm
, A
n (
mm
), E
q. (1
5)
Srm,exp (mm)
UH (2014)
Ceroni (2004)
Ueda (2002)
Matthys (1999)

Furthermore, the thinner FRP (0.6 mm) provides better crack control compared to the
thicker FRP (1.0 mm). It can be concluded that the fully wrapped method with thinner
FRP shows a better behavior in terms of crack control compared to the other wrapping
schemes and FRP thicknesses. This can be attributed to the greater tension stiffening
effect in members strengthened with thinner FRP, which results in an increase in the bond
between FRP and the concrete substrate and thereby decrease in crack width. The
additional bond stress between the FRP and the concrete substrate in strengthened RC
members result in the increase of the tension stiffening compared with that of the un-
strengthened RC members; when the amount of FRP reinforcement increased, it was
observed in the tests that the crack spacing decreased, which caused a greater
deterioration of the steel bond. This deterioration became dominant and caused a decrease
in the tension stiffening of the concrete and therefore, increase in crack width compared to
members strengthened with thinner FRP. Fig.11 (b), shows that with the application of
FRP sheets, the internal reinforcement ratio is not dominant in controlling the crack width in the
U-wrap with FRP anchor wrapping scheme.
a) Specimen (s = 0.55%, f = 0.56%) b) Specimen (f = 0.56%, FRP Anchors)
Fig. 11. Relationship between average crack width and average strain (a) effect of
0
0.2
0.4
0.6
0.8
1
0 0.001 0.002 0.003 0.004
Cra
ck W
idth
(m
m)
Strain (mm/mm)
Ref_R4S4_025_FWS4_025_FAS4_025_SBS4_04_FAS4_04_FWS4_04_SB
0
0.2
0.4
0.6
0.8
1
0 0.001 0.002 0.003 0.004
Cra
ck W
idth
(m
m)
Avrage Strain (mm/mm)
S3_025_FA
S4_025_FA
S5_025_FA
wrapping scheme, (b) effect of internal steel reinforcement
The first crack will form when the cracking load has been reached. Due to increment of
applied load progressive formation of new cracks was observed and a combination of
transverse and splitting cracks took place. Once the stabilized cracking stage was
reached, no more new crack was developed and only the opening of existing cracks was
observed. In Fig. 12, the final crack patterns at the stabilized cracking phase of three
specimens are shown; an un-strengthened specimen (REF-R3), and two strengthened
specimens with different FRP reinforcement ratios (S3-025-FA and S3-040-FA). It can
be observed that applying externally bonded FRP results in increase in number of
cracks, decrease in crack spacing and therefore decrease in crack width. As shown in
Fig. 12a, three main cracks formed at the stabilized cracking stage in specimen REF-R3.
With the addition of FRP in specimen S3-025-FA (Fig. 12b), the number of cracks
increased. As discussed earlier, this is due to the increase in the tension stiffening effect.
Similar behavior was observed for the specimen S3-040-FA (Fig. 12c). In specimens
strengthened with smaller amount of FRP, the bond stress between FRP and concrete
substrate increases while the bond stress between steel and concrete decreases. The increase
of the FRP bond is dominant, so the tension stiffening increases compared to un-strengthened
RC elements; when the amount of FRP reinforcements increases, the crack spacing decreases,
which causes a greater deterioration of steel bond. Therefore, the specimens strengthened with
thinner FRP had a better control of crack widths.

Fig. 12. Final crack pattern a) REF-R3, b) S3-025-FA, c) S3-040-FA (all dimensions in mm)
5.4.2. Comparison with design provisions
In order compare the experimental crack widths with the code predictions at serviceability
conditions, a load stage of steel tensile stress equal to 400 MPa is considered for the evaluation.
This assumption agrees with the commentary of Eurocode 2, where the database used to calibrate
the code formula for crack width is made of results with steel stress ranging from 150 to 350
MPa [1]. In Fig. 13, the comparison between the experimental results in the database and code
provisions is shown. Fig. 13a shows the comparison of experimental crack width results with
EC2-92 [Eq. (2), Eq. (4), and Eq. (10)]. Fig. 13b shows the comparison of experimental crack
width results with EC2-04 [Eq. (3), Eq. (6), and Eq. (11)]. Also, using Eq. (2), Eq. (8), Eq. (10)
and, Eq. (12), the crack width prediction of fib 14 are calculated and compared with the
experimental results (Fig.13c).
a) EC2-92 b) EC2-04
c) fib 14
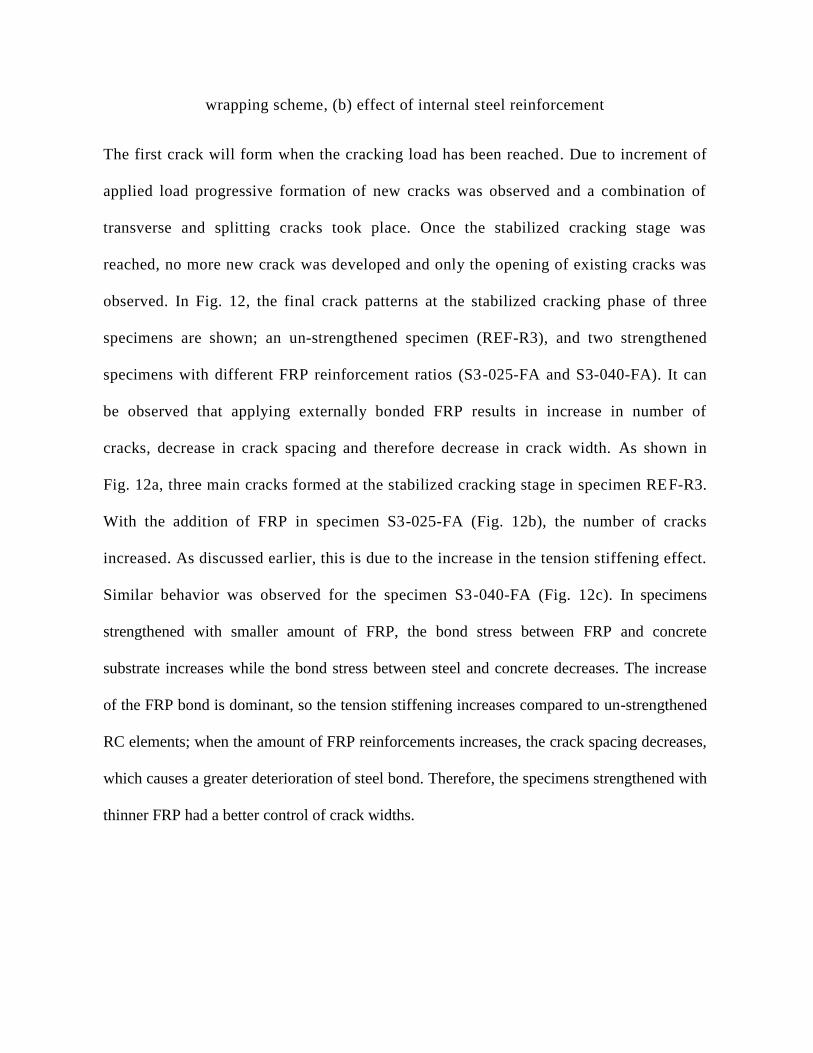
Fig.13. Experimental and code values of crack width (a) EC2-92, (b) EC2-04, (c) fib 14
In Table 5, the statistical summary of the experimental results and the code provision comparison
are reported.
Table 5 Statistical parameters of the crack width, wk, for code guidelines and experimental results
wk (EC2-92) wk (EC2-04) wk (fib 14) wk,An [Eq. (13)]
n
σ%
48
132.34
1.61
1.16
-0.19
0.61
48
214.76
2.57
1.41
-0.22
0.54
35
64.42
1.23
0.60
0.43
0.72
48
45.96
1.18
0.36
0.74
0.88
δ σδ
R2
r
The statistical parameters reported in Table. 5 shows that same as the crack spacing, for crack
width, wk, the code guidelines of EC2-92 [16] and EC2-04 [17] presents a larger scatter
0
0.2
0.4
0.6
0.8
0 0.2 0.4 0.6 0.8
wk
, E
C2
-92
(m
m)
w,exp (mm)
UH (2014)
Ceroni (2004)
Ueda (2002)
Mattthys (1999) 0
0.2
0.4
0.6
0.8
1
0 0.2 0.4 0.6 0.8 1
wk
, E
C2
-04
(m
m)
w,exp (mm)
UH (2014)
Ceroni (2004)
Ueda (2002)
Mattthys (1999)
0
0.2
0.4
0.6
0 0.2 0.4 0.6
wk
, fi
b 1
4(m
m)
w,exp (mm)
UH (2014)
Ceroni (2004)
Ueda (2002)
Mattthys (1999)

compared to the fib 14 [21] prediction. The mean variable of parameter δ equals to 1.61 and 2.57
for EC2-92 and EC2-04 respectively, shows the over-estimation of the predictions. As in fib 14,
δ equals to 1.23, which shows a better agreement between experimental results and the code
predictions. Also, evaluating the R2 and r values for fib 14 compared to EC2-92 and EC2-04
show that fib 14 predictions show a better agreement with the experimental results. It is evident
that the predictions of fib 14 which is specifically for FRP strengthened RC members, and uses
the expression of average strain proposed in EC2-92 [16], shows a better accuracy compared to
Eurocode 2 predictions. EC2-92 [16] Shows a better prediction compared to EC2-04 [17]
(132.34% and 1.61 Compared to 214.76% and 2.57).
To calculate the average crack width using the proposed crack spacing equation [Eq. (15)], the
approach suggested in EC2-04 [17] is used by introducing the proposed crack spacing, 𝑛, in
Eq. (3). The comparison between the experimental data base and the proposed crack width
formulation, wk,An, is shown in Fig. 14.
Fig. 14. Experimental vs. theoretical values of crack width proposed by authors [Eq. (3) and
Eq. (15)]
0
0.2
0.4
0.6
0.8
0 0.2 0.4 0.6 0.8
Wk
,An
(m
m)
Wk,exp (mm)
UH (2014)
Ceroni (2004)
Ueda (2002)
Matthys (1999)

The statistical parameters reported in Table. 5 show that the mean percentages of deviation
and the average ratio of code predictions to experimental results for the analytical crack
width equation have reduced compared to EC2-92 and EC2-04 crack width predictions. The
variable δ and the standard deviation of variable δ are computed as 1.18 and 0.36,
respectively; which show an improvement in crack width prediction compared to the Euro
Code and fib 14 formulations.
6. Conclusions
The direct tension tests of externally bonded FRP strengthened RC prisms have been
presented and discussed in this paper, focusing on crack spacing and widths. Crack control
in FRP strengthened RC members is an important factor which must be considered for
durability of the member. Same as RC members crack widths in FRP strengthened RC
members should be limited in order to protect the steel reinforcement from corrosion.
The crack characteristics including crack width, number of cracks, and spacing are
monitored by using the DIC system (ARAMIS) at the conducted experiments. With the use
of the DIC system crack openings are monitored precisely and the crack width
measurements are obtained continuously during the test. The DIC method has more accuracy
and precision compared to visual observation and simple measurements for crack analysis.
At serviceability conditions the presence of the FRP sheets significantly affects the crack
characteristics of RC members due to the additional contribution of the FRP by transferring
tensile stresses to the concrete. Also, wrapping scheme was found to have a great impact on
the crack characteristics of the FRP strengthened RC members in tension. The effectiveness
of the Eurocode 2 formulations and fib 14 for crack spacing and crack width predictions are
evaluated using statistical analysis of a database, including the direct tension tests
conducted by authors and several benchmark tests in literature. Application of Eurocode 2
provisions on crack spacing and crack width of FRP strengthened RC members clearly
overestimates the experimental values. Euro code 2 provisions of crack spacing and width
do not provide accurate results when applied to FRP strengthened RC tension members and
clearly overestimates the experimental values. Crack spacing and width formulations in
fib14 show better predictions compared to Eurocode 2 formulations.
The experimental database is used to propose a new formulation to evaluate crack spacing
and crack width, considering all the affecting parameters in the cracking phenomena. A
substantial improvement in the crack spacing and crack width prediction is obtained using
the crack spacing formulation presented in this paper; a good agreement with experimental
results and a clear statistical significance are attained.
ACKNOWLEDGEMENTS
This research was supported by the National Science Foundation, award number 1100930. Steel
reinforcement and FRP materials are donation from GERDAU AMERISTEEL Co. and FYFE.
Co., respectively. Their support is greatly acknowledged.
References
[1] Ceroni F, Pecce M. Design provisions for crack spacing and width in RC elements
externally bonded with FRP. Compos Part B: Eng, 40(1) (2009), pp. 17-28.
[2] ACI Committee 440. Guide for the design and construction of externally bonded FRP
systems for strengthening concrete structures. ACI 440.2R-08, Farmington Hills, MI:
American Concrete Institute; 2008.

[3] Farah K, Sato Y. Uniaxial tension behavior of reinforced concrete members
strengthened with carbon fiber sheets. J Compos Constr, 15(2) (2011), pp. 215-228.
[4] Ceroni F, Pecce M, Matthys S. Tension stiffening of reinforced concrete ties
strengthened with externally bonded fiber-reinforced polymer sheets. J Compos
Constr, 8(1) (2004), pp. 22-32.
[5] Sato Y, Shouji K, Ueda T, kahuta Y. Uniaxial tensile behavior of reinforced concrete
elements strengthened by carbon fiber sheet. In: Proc, 4th international symposium
on FRP reinforcement, (1999), p. 697-710.
[6] Yoshizawa H, Wu Z. Crack behavior of plain concrete and reinforced concrete members
strengthened with carbon fiber sheets. In: Proc, 4th international symposium on FRP for
reinforced concrete structures, (1999), p. 767-779.
[7] Tripi J, Bakis C, Boothby T, Nanni A. Deformation in concrete with external CFRP sheet
Reinforcement. J Compos Constr, 4(2) (2000), pp. 85-94.
[8] Matthys S. Structural behavior and design of concrete members strengthened with
externally bonded FRP reinforcement. Doctoral dissertation. Gent University, Belgium,
(1999).
[9] Ueda T, Yamaguchi R, Shoji K, Sato Y. Study on behavior in tension of reinforced
concrete members strengthened by carbon fiber sheet. J Compos Constr, 6(3) (2002),
pp. 168-174.
[10] Lee Y, Boothby T, Bakis C, Nanni A. Slip modulus of FRP sheets boned to concrete.
J Compos Constr, 3(4) (1999), pp. 161-167.
[11] Mias C, Torres L, Guadagnini B, Turon A. Short and long-term cracking behavior of
GFRP reinforced concrete beams. Compos Part B: Eng, 77 (2015), pp. 223-231.

[12] Noel M, Soudki K. Estimation of the crack width and deformation of FRP-reinforced
concrete flexural members with and without transverse shear reinforcement. Eng Struct,
59(2014), pp. 393–398.
[13] Elsanadedy H, Abbas H, Al-Salloum Y, and Almusallam T. Prediction of
intermediate crack debonding strain of externally bonded FRP laminates in RC
beams and one-way slabs. J Compos Constr,18(5) (2014), pp. 04014008-1-16.
[14] Pecce M, Manfredi G, Cosenza E. Experimental response and code models of GFRP
RC beams in ultimate and serviceability conditions. J Compos Constr, 4(4) (2000),
pp. 182-190.
[15] Baena M, Turon A, Torres Ll, Mias C. Experimental study and code predictions of
fiber reinforced polymer reinforced concrete (FRP RC) tensile members. Compos
Struct, 93(10) (2011), pp. 2511-2520.
[16] Eurocode 2. Eurocode: Design of concrete structures-part 1: general rules and rules for
buildings, European Committee for Standardization, EN 1992-1-1, Brussels, (1992).
[17] Eurocode 2. Eurocode: Design of concrete structures-part 1: general rules and rules for
buildings, European Committee for Standardization, EN 1992-1-1, Brussels, (2004).
[18] ACI Committee 318. Building code requirements for structural concrete and commentary.
ACI 318R-05. Detroit, MI: American Concrete Institute, (2005).
[19] CSA. Design and construction of building components with fiber rereinforced polymers.
CAN /CSA-806-12.Rexdale BD, ON: Canadian Standards Association, (2012).
[20] JSCE. Standard specification for concrete structures. Japan society of civil engineers.
Tokyo, (2007).

[21] Fib (International Federation for Structural Concrete). Externally bonded FRP
reinforcement for RC structures: Basis of design and safety concept. FIB Bulletin 14,
Laussanne, (2001).
[22] Alam S, Lenormand T, Loukili A, Regoin P. Measuring crack width and spacing in
reinforced concrete members. In: Proc, 7th International conference on Fracture
Mechanics of Concrete and Concrete Structures. Korea, Seoul, (2010), p. 377-382.
[23] Gencturk B, Hossain K, Kapadia A, Labib E., Mo Y.-L. Use of digital image correlation
technique in full-scale testing of prestressed concrete structures. Measurement, 47 (2014),
pp. 505–515.
[24] Choi S, Shah S.P. Measurement of deformation on concrete subject to compression using
image correlation. Exp Mech, 37(3) (1997), pp. 307–313.
[25] Hosseini F, Gencturk B, Lahpour S, Ibague Gil D. An experimental investigation of
innovative bridge columns with engineered cementitious composites and Cu-Al-Mn
super-elastic alloys. Smart Mater Struct, 24(8) (2015), 085029.
[26] ACI 224.2R-92. Cracking of concrete members in direct tension. ACI committee
224. Detroit (USA): American Concrete Institute, (1992).
[27] Champiri M D, Mousavizadegan S H, Moodi F. A decision support system for diagnosis
of distress cause and repair in marine concrete structures. Comput Concr, 9(2) (2012), pp.
99–118.
[28] Champiri M D, Mousavizadegan S H, Moodi F. A fuzzy classification system for
evaluating the health condition of marine concrete structures. J Adv Concr Technol, 10(3)
(2012), pp. 95–109.
[29] Borosnyoi A, Balazs G. Models for flexural cracking in concrete: the state of the art.
Structural concrete journal of the FIB, 6(2) (2005), pp. 53-62.
[30] Beeby A.W. The influence of parameter φ/ρeff on crack widths. Structural Concrete,
5(2) (2004), pp. 71–83.
[31] Farra B, Jaccoud J. Bond behavior, tension stiffening and crack prediction of high
strength concrete. International conference: Bond in Concrete from research to
practice, proceedings. Riga Technical University, (1992), p. 9.1-9.10.
[32] Ferr-Borges J. Cracking and deformability of reinforced concrete beams. IABSE
Publications, Zurich, (1966), p. 75-95.
[33] CEB-FIP. Model code for concrete structures. Comite Euro-Internaional du Beton.
Paris (France), (1990).
[34] Yang G, Zomorodian M, Belarbi A, Acun B. Tension stiffening of reinforced
concrete shear elements strengthened with externally bonded FRP sheets. 37th
IABSE Symposium Madrid. Madrid (Spain), (2014), p. 145-152.
[35] Yang G, Zomorodian M, Belarbi A, Ayoub A. Uniaxial Tensile Stress-Strain
Relationships of RC Elements Strengthened with FRP Sheets. J Compos Constr,
(2015), 10.1061/(ASCE)CC.1943-5614.0000639, 04015075.
[36] Jin T, Goo N, Woo S, Park H. Use of a digital image correlation technique for measuring
the material properties of Beetle wing. J of Bionic Engineering, 6 (2009), pp. 224–231.
[37] GOM mbh. ARAMIS user manual-software. GOM optical measuring techniques.
Braunschweig (Germany), (2011).
[38] Ghiassi B, Xavier J, Oliveira D, Lourenço P. Application of digital image correlation
in investigating the bond between FRP and masonry. Compos Struct, 106 (2013), pp.
340-349.
[39] Bischoff P. Tension stiffening and cracking of steel fiber-reinforced concrete. J
Mater Civ Eng, 15(2) (2003), pp. 174–182.