city research onlineopenaccess.city.ac.uk/12131/1/ipo paper tran and jeon may 2 2009.pdf ·...
TRANSCRIPT

City, University of London Institutional Repository
Citation: Tran, A. & Jeon, B. (2011). The dynamic impact of macroeconomic factors on initial public offerings: evidence from time-series analysis. Applied Economics, 43(23), pp. 3187-3201. doi: 10.1080/00036840903493267
This is the accepted version of the paper.
This version of the publication may differ from the final published version.
Permanent repository link: http://openaccess.city.ac.uk/12131/
Link to published version: http://dx.doi.org/10.1080/00036840903493267
Copyright and reuse: City Research Online aims to make research outputs of City, University of London available to a wider audience. Copyright and Moral Rights remain with the author(s) and/or copyright holders. URLs from City Research Online may be freely distributed and linked to.
City Research Online: http://openaccess.city.ac.uk/ [email protected]
City Research Online

1
The Dynamic Impact of Macroeconomic Factors on Initial Public Offerings:
Evidence from Time-Series Analysis
ANH L. TRAN Department of Finance
Drexel University
BANG NAM JEON
Department of Economics and International Business Drexel University
Abstract
This paper examines the explanatory power and the dynamic impact of macroeconomic conditions on IPO activities in the U.S. during the period from 1970 to 2005. Applying time-series econometric techniques, we find the existence of long-run equilibrium relationships between IPO activities and selected macroeconomic variables. Stock market performance and volatility are shown to play the most important role in the timing of IPOs. The Fed funds rate and the 10-year U.S. Treasury bond yield play a comparable role in determining the amount of proceeds raised in the IPOs. There also exist different short-run dynamic adjustment mechanisms between IPOs and macroeconomic factors toward the long-run equilibrium path and they are mostly completed within the period of six months to one year. The results have some useful implications for forecasting IPO activities.
Keywords: Initial public offerings (IPO), cointegration, VAR, VEC JEL classification: G32, G10, E44
Corresponding author, Address: Department of Economics and International Business, Bennett S. LeBow College of Business, Drexel University, 3141 Chestnut Street, Philadelphia, PA 19104, U.S.A., Phone: (215) 895-2125, Email: [email protected]. An earlier version of this paper was presented at the 2008 Eastern Finance Association annual meetings. The authors appreciate Sean Flynn, Jacqueline Garner, and seminar participants for their useful comments. The authors are responsible for any errors and omission.

2
I. Introduction
Going public activities have varied greatly over time during the past three decades. During
the period from 1973 to 1979, only 283 firms in the U.S. went public and raised less than $3 billion
in total. In comparison, the period from 1983 to 1989 witnessed 3,227 initial public offerings
(IPOs) with a total amount of $109 billion. Most active is the period between 1993 and 1999 when
4,500 IPOs raised a total proceed of $312 billion (see Figure 1). Such variations in IPO activities
have been observed to move together with changing economic conditions over time.
Macroeconomic conditions, to a certain extent, affect the industry-level and firm-level business
performance, the optimal operation within each firm, and therefore the firm’s decision to go public.
Although fluctuation in the IPO volume is well known1, the cause and mechanism of such
fluctuation from the macroeconomic perspective have not been studied extensively. The issues of
how macroeconomic conditions influence IPO activities, how long the effects last, and to what
extent each condition affects new equity issuance are of interest to investors, investment banks, and
IPO-planning firms alike.
The objectives of this paper are, first, to examine the dynamic impact of various
macroeconomic determinants on IPO activities, including economic growth, stock market
conditions, the Fed’s changes in monetary policy, and long-term bond yields, and second, to
investigate the causality and impulse-response mechanisms between the macroeconomic shocks
and IPO activities. The paper also derives some implications of the selected macroeconomic
determinants on forecasting IPO activities.
Most previous literature on IPOs has focused on certain corporate-level factors that explain
why companies go public. Zingales (1995), for example, shows in his model that owners try to
maximize the proceeds when selling their companies through IPOs by balancing their control and
ownership. Chemmanur and Fulghieri (1999) propose a theory of going public in which the
1 For example, see Ibbotson and Jaffe (1975), Ritter (1984), Lowry (2003), and Pastor and Veronesi (2005).

3
equilibrium timing of the going-public decision is determined by the firm's trade-off between
lowering the information duplication produced by outsiders and avoiding the risk-premium
demanded by venture capitalists. Lerner (1994) studies 350 privately held venture-backed
biotechnology firms and concludes that these companies go public when equity valuations are high,
while they employ private financing when values are lower. Seasoned venture capitalists appear to
be particularly proficient at taking companies public near market peaks. Pagano, Panetta, and
Zingales (1998) show that the most important determinants of IPOs are the company size and the
industry market-to-book ratio. They conclude that going public lowers the borrowing cost and that
entrepreneurs attempt to time their IPOs to take advantage of good market conditions.
Given the importance of market conditions for conducting IPOs, very few authors have
examined in depth the macroeconomic determinants of IPOs. Loughran, Ritter, and Rydqvist
(1994) review the timing of IPOs of 15 countries using stock price indexes and GNP growth rates.
They show that the number of IPOs and the stock price level are positively correlated. Ljungqvist
(1995) finds the same result for 11 European countries using data for the period from 1980 to 1989.
Ritter and Welch (2002) review IPO activity, pricing, and allocations and suggest that market
conditions are the most important factor in the decision to go public. In addition, Lowry (2003)
shows that firms’ capital demand and investor sentiment are the important determinants of the IPO
volume. Recently, Gleason, Johnston, and Madura (2008) find that IPO aftermarket risk is higher
for firms that go public during periods of high market volatility. Although it is a stylized fact that
firms raise funds when market conditions are favorable, the question of which market indicators of
macroeconomic conditions do matter in the short-run and long-run is still unanswered by most
empiricists. This paper examines the effects of market liquidity, inflation, interest rates and the
Fed’s action on monetary policy, besides the common stock market indicators, on IPO activities to
uncover the relative importance of different macroeconomic determinants of IPOs and the
interaction between the macroeconomic environment and IPO activities.

4
This paper employs three different measures of IPO activities. Previous research mostly
focuses on the number (or volume) of IPOs as a sole measure of IPO activities. The proceeds raised
by IPOs are expected to appropriately reflect the extent to which the capital markets affect IPO
activities. In addition, the average proceeds raised by all IPOs may also be a useful indicator of a
relative performance of IPO activities as shown in Figure 1.
Applying time-series econometrics techniques to monthly IPO activities in the U.S. during
the period from January 1970 to December 2005, we find the existence of long-run equilibrium
relationships between IPO activities and selected macroeconomic variables. Our results show that
stock market performance and volatility play the most important role in the timing of IPOs. The
Fed funds rate and the 10-year U.S. Treasury bond (TB) yield play a significant role in determining
the amount of proceeds raised in these IPOs. The effect of market liquidity, however, is only
marginal for the timing of IPO. We also find that there exist different patterns of short-run dynamic
adjustment mechanisms among the IPO activity and macroeconomic variables toward the long-run
equilibrium path. The dynamic adjustment processes are shown to finish mostly within the period
of six months to one year. The results are also shown to provide useful implications for forecasting
IPO activities.
The rest of the paper is structured as follows. Section II describes the dataset and specifies
the econometric methodology. Section III discusses the empirical results and implications for
forecasting IPO activities. Section IV concludes.
II. Data and methodology
We collect firm-level IPO data from the Securities Data Company (SDC) during the period
from January 1970 to December 2005. SDC’s IPO database includes daily IPO data from 1970. We
aggregate the number of IPOs and total proceeds raised in these IPOs from daily into monthly
observations. Average proceeds are total proceeds raised per IPO in a month.

5
We use three measures of IPO activities in this analysis, which are (1) the number of IPOs
as a measure of IPO activities, (2) total proceeds as a measure of the aggregate IPO value, and (3)
average proceeds per IPO as a measure of the average size of IPO activities. Following Ritter’s
methods (1984), we exclude small-sized Regulation A offerings (raising less than $1.5 million
during the 1980s), real estate investment trusts (REITs), closed-end funds, and American
Depository Receipts (ADRs).2 We match our aggregate number of IPOs with the updated monthly
IPO data in Ibbotson, Sindelar, and Ritter (1994). Table 1 shows the summary statistics of the
variables used in this paper. The maximum number of IPO per month is 108 in October 1996 but
the maximum total proceed raised in a month is about $14 billion in April 2000. However, the
maximum average proceed per month is $973 million in October 1998. These statistics show that
the levels of the three IPO measures are somewhat different in time from each other and it is worth
exploring individually.
To fit the scope of this paper, we select macroeconomic variables, some of which have
been identified as the most relevant in the literature, including (1) industrial production index (IP)
as a proxy for real economic activity, (2) S&P500 index (SP) as a measure for stock market
performance, (3) market volatility (VOL) as a proxy for investment risk, (4) market liquidity (LIQ)
as a measure of investors’ willingness to commit resources in the market, (5) inflation (CPI), (6)
the effective Federal funds rate (FF) as an indicator of the Fed’s monetary policy stance, and (7)
the 10-year U.S. Treasury bond yield (TB) as a proxy for long-term financing costs in the debt
market and information captured in the yield curve.3
The industrial production index is used in place of GDP since GDP data are not available
on a monthly basis. We obtain the S&P500 index from the Center for Research in Security Prices
2 According to Ritter (1984), these small offerings are excluded in his study due to limited data availability. Similar to many IPO studies, we focus only on initial public offerings of common stocks and exclude REITs, closed-end funds, and ADRs due to structural differences of these offerings. 3 See, for example, Fama (1990), Bernanke and Blinder (1992), Lee (1992), Loughran, Ritter, and Rydqvist (1994), Bernanke and Gertler (1999), Bernanke and Kuttner (2003), Pástor and Stambaugh (2003), Pástor and Veronesi (2005), and Gleason, Johnston, and Madura (2008) that use these macroeconomic measures in their studies of financial economics including IPO activities.

6
(CRSP). Market volatility is obtained as standard deviation of daily market returns during each
month, as used, for example, in Pástor and Veronesi (2005). For the measurement of market
liquidity (LIQ), we calculate the aggregate measure of market liquidity using the methodology
proposed by Pástor and Stambaugh (2003).4 The daily stock return and volume data which are
needed to compute market liquidity are obtained from CRSP. We use the consumer price index
(CPI) as a proxy for inflation. We obtain data on industrial production index, CPI, the Fed funds
rates, and bond yield rates from the FRED macroeconomic database provided by the Federal
Reserve Bank in St. Louis.
To analyze the dynamic impact of macroeconomic factors on IPO activities, we first
perform unit-root tests for each of the variables to ensure that our regressions are not spurious.
When the variables follow unit-root processes and they are cointegrated, we estimate the vector
error correction (VEC) model. Otherwise, we run contemporaneous ordinary least squares
regressions on the log-differenced data. Second, if they pass unit-root tests, we check for a long-run
cointegration relationship among the variables. Third, we apply relevant time-series econometrics
tools, including the multivariate vector autoregressive model (VAR), the error correction model
(VEC), and impulse response function analysis, to examine the effects of changes in
macroeconomic environments on IPO activities and identify their adjustment mechanisms to
various macroeconomic shocks. Finally, we check the VEC model’s relative performance of
forecasting IPO activities, compared to those from a naïve forecasting method.
III. Empirical results
Times-series properties and bench-mark regressions
4 Aggregate market liquidity in each month is constructed by averaging individual stock measures of liquidity for the month and then multiplying them by the ratio of the total dollar value of the stocks at the end of the previous month and the dollar value of the stocks in January 1970. The individual stock measure of liquidity for a given month is obtained as a regression slope coefficient, which is estimated using daily returns and volume data within that month. For more details, see Pástor and Stambaugh (2003).

7
To test for the presence of unit roots, we conduct the Augmented Dickey-Fuller (ADF)
tests with trend and intercept as the most general unit roots test approach. The null hypothesis for
ADF tests is that the variable has unit roots. We transform all variables into their natural logarithms
and perform ADF tests for both the levels and also for their first differences when the variable has
unit roots at the level. We use the Schwarz Information Criterion to select the number of lags in the
regression for the ADF tests. The results reported in Table 2 show that the null hypothesis of unit
roots for the level cannot be rejected at the 1%, 5%, and 10% significance levels for all variables
except market volatility and market liquidity. On the other hand, for the variables that have unit
roots at the level, the null hypothesis of unit roots at the first difference can be rejected at the 1%
significance level. Therefore, these variables have unit roots at the level but do not have unit roots
at the first difference. In other words, they are integrated of order 1. As a result, we use the log-
differenced data for these variables in our estimation.
The preliminary correlation results reported in Table 3 show that IPO variables are
positively correlated with stock market performance and market liquidity, but negatively correlated
with market volatility, the Fed funds rate, and the 10-year Treasury bond yield rate. To examine the
relationship between each of the three IPO performance variables and seven macroeconomic
variables, we conduct OLS regressions, as bench-mark regressions, on the level data for market
volatility and market liquidity and on the log-differenced data for all other variables as follows:
ikikjijii CMX ,
where Xi is a vector of IPO measures (i=1, ..., 3), Mj is a vector of macroeconomic variables
(j=1,…, 7), and Ck is a vector of control variables. Log-difference transformation of the variables
represents growth rates and is found to be stationary based on the results of the above unit roots
tests. Cross correlations across macroeconomic variables reported in Table 3 show that
multicollinearity is not an issue among these variables. To simplify the variable names, we use the
original name of each variable for the log-differenced one. Table 4 reports the estimation results.

8
The estimation results for the number of IPOs reported in Panel A of Table 4 shows that
the number of IPOs is positively correlated with S&P500 stock price index and negatively
correlated with market volatility. Stock market performance dominates other macroeconomic
factors in explaining the timing to go public. Entrepreneurs try to take advantage of a better stock
market performance to bring their company to public, attracting stock investors who pursue higher
stock returns. When the market is risky, entrepreneurs prefer to remain private to avoid the chance
of their newly listed stocks moving downward. Market liquidity plays a marginal role when we
exclude S&P500 index and market volatility. Our R2, albeit low, is similar to the preliminary result
reported in the literature, for example, by Pástor and Veronesi (2005).
Regressions of total proceeds and average proceeds reported in Panel B and Panel C of
Table 4 show somewhat different significance levels on their coefficients from Panel A. While
market volatility still affects the dollar amount raised through IPOs, stock market performance and
liquidity no longer play a role as in the case of the number of IPOs, as shown in Panel A. The 10-
year Treasury bond yield rate is negatively correlated with total proceeds and average proceeds of
IPOs. When interest rates increase, investors find debt markets more attractive than equity markets,
assuming that investing in loans is an alternative to investing in equity from public offerings. The
dollar amount of proceeds raised in IPOs, therefore, becomes less in periods of high interest rates.
The Fed funds rate, as an indicator for monetary policy stance taken by the Fed, plays a marginal
role in the case of total proceeds when we exclude stock market performance and volatility as
reported in regression (2) of Panel B. CPI is statistically significant as a control factor for inflation
in both panels.
Overall, the results of the OLS estimation reported in Table 4 show that stock market
volatility and market liquidity are important factors in determining the number of IPOs, while long-
term interest rates and inflation are shown to explain better the amount of proceeds raised in these
IPOs. A tight monetary policy, indicated by a high Fed funds rate, seems to affect IPO activity
adversely, but the coefficients are not quite statistically significant.

9
As robustness tests, we include two dummy variables, NBER and SOX, to control for
different phases of the business cycle and a possible structural break due to regulatory changes
brought by the Sarbanes-Oxley Act of 2002.5 The dummy variable, NBER, has the value of 1 for
the non-recession period and the value of zero for the recession period, which are declared by the
National Bureau of Economic Research (NBER). We also include the first lag of the dependent
variable to capture partial adjustment mechanisms of IPO activities. As reported in the regression
(3) of Table 4, adding these dummies for business cycle (NBER) and Sarbanes-Oxley (SOX) does
not significantly change our main results discussed above.
Long-run equilibrium relations between IPO activities and macroeconomic conditions
After finding correlations between IPO activities and selected macroeconomic factors, we
explore a possibility of long-run equilibrium relationships, or common stochastic trend, between
IPO activities and the macroeconomic factors, by applying multivariate cointegration analyses. It is
necessary to determine the appropriate number of lags for the cointegration tests. We perform lag
length tests using five different criteria, including (1) the sequential modified likelihood ratio test
statistic, (2) the final prediction error, (3) the Akaike information criterion, (4) the Schwarz
information criterion, and (5) the Hannan-Quinn information criterion.6 The test results reported in
Table 5 show that the appropriate number of lags should be three according to the likelihood ratio,
final prediction error, and Akaike information criteria in all cases and other criteria in some cases.
This number of lags is consistent through all different lag tests and applies for all three measures of
IPO activity.
Using the method of Johansen and Juselius (1991), we check for cointegrations among IPO
variables and macroeconomic variables using the multivariate cointegration on each of the IPO
5 Sarbanes-Oxley, effective on August 29, 2002 in response to several major corporate scandals, requires U.S. public companies to comply with specific rules about financial reporting and corporate governance. These requirements may make private firms reluctant to go public due to substantial costs of compliance. 6 See Akaike (1974, 1976), Hannan-Quinn (1979), and Schwarz (1978) for more information on model selection using these criteria.

10
variables and the seven macroeconomic variables. The unrestricted cointegration rank tests assume
a linear deterministic trend.7 The Johansen trace test statistic of the null hypothesis that there are at
most r cointegrating vectors and n – r common stochastic trends is calculated as
n
riitrace Tr
1
)1ln()(
and the maximum eigen value test the null hypothesis of r cointegrating vectors using
)1ln()1,( 1max rTrr
where λi is the n – r least squared canonical correlations and T is the sample size.
The results from both trace and maximum eigen value tests reported in Table 6 show that
there are four cointegration equations in the system, which indicates that common stochastic trends
exist between IPO activities and macroeconomic factors. This finding implies that there exist long-
run equilibrium relationships between each of the three measures of IPO activity and a group of the
selected seven macroeconomic variables.
Fluctuation of IPO activities and the adjustment mechanism
We proceed to examine the dynamic relationships among IPO variables and
macroeconomic factors using the cointegration results. To evaluate these dynamics, we use the
vector error correction (VEC) model. When the variables are cointegrated, the VEC model
provides more efficient parameter estimates in the short and long run than the vector autoregressive
(VAR) model. Besides, the VAR model in differences is not well specified since it ignores
important information on the long-run equilibrium relationship contained in the levels of the
cointegrated series.
Following Johansen’s methodology and Engle and Granger (1987), we estimate the
multivariate VEC model to explore if there is any error correction mechanism when IPO activities
7 Using different deterministic trend assumptions yields four or five cointegration equations. The case of four cointegration equations dominates in linear and quadratic assumptions.

11
drift away from the long-run equilibrium path. Let Yt,i ≡ (Xi, Mj) where Xi is one of the three IPO
measures (i=1, 2, 3), Mj is the vector of the seven macroeconomic variables (j=1, …, 7). If Yt,i is
cointegrated, a VEC model can be specified as, according to the Granger Representation Theorem:
itijt
k
j ijitiiiit YYY ,,1 ,,1,
where α is a constant vector representing a linear trend, β represents the cointegration vector, and γ,
which is called the error correction coefficient, provides information on the speed of adjustments to
the long-run equilibrium path. The γ coefficient is expected to have a negative sign in a range of
-1 < γ < 0. Table 7 reports the estimated error correction coefficient, γ, from the estimation results
of the VEC model and the VEC model’s fitness of data, which is shown to be reasonably good. All
the error correction coefficients show a correct sign. The size of the coefficients is between 0.13
and 0.47 for the frequency of IPOs and between 0.23 and 0.52 for the total proceeds of IPOs. This
finding implies that it would take approximately one to 6 months and one to less than 3 months to
complete the half-way adjustments toward the long-run equilibrium path of the IPO frequency and
IPO total proceeds, respectively.8
As the VAR/VEC models require the proper order of the variables in the system to perform
the impulse-response analysis using orthogonal innovations, we conduct the Granger causality tests
of the macroeconomic variables on the frequency, total proceeds and average proceeds of IPOs.
The results of Granger causality tests, as reported in Table 8, indicate that the stock market,
industrial production and inflation play a significant role in Granger-causing all three IPO
variables. Market volatility and liquidity Granger-cause the number of IPOs but not the IPO
proceeds, whereas the Fed funds rate Granger-causes the IPO proceeds. The number of IPOs and
industrial production are found to Granger-cause in a bi-directional way. Stock market and the IPO
proceeds are also shown to have a bi-directional Granger-cause relationship. These bi-directional
8 The time required for a half-way adjustment is obtained using ln(1-0.5)/ln(1-α), where α is the error correction coefficient in the VEC model estimation.

12
causal relationships between the selected macroeconomic variables and IPO measures justify our
VAR/VEC models which treat all the variables in the system endogenous.
In addition, as reported in Panel B of Table 8, the causal relationships among the
macroeconomic variables are multidirectional. Market liquidity seems to be the most exogenous
variable, while industrial production seems to be the most endogenous variable among the
macroeconomic variables. S&P500 stock price index significantly Granger-causes market volatility
and industrial production, which has been widely accepted in the literature.9 The10-year Treasury
bond rate Granger-causes the Fed funds rate, which seems to be counter-intuitive and needs further
examination for the direction of causality. To decide the final order of macroeconomic variables for
the following variance decomposition and impulse-response function analysis, we also incorporate
a conventional wisdom that the Fed’s monetary policy actions will affect interest rates, bond yields
and stock market variables. We perform a sensitivity analysis using different orders of the variables
as a robustness check.
Table 9 reports the results of variance decomposition based on our multivariate VEC
model estimates for each of the three IPO measures on the seven macroeconomic variables. These
estimation specifications include a linear deterministic trend and up to three lag intervals (in first
differences) as evidenced from the previous lag tests reported in Table 5. From panel A of Table 9,
S&P500 stock price index and the Fed funds rate are shown to play the most powerful role in
explaining the variance in the forecast error of the number of IPOs. Volatility is persistent from the
beginning and its effect remains similar over time. The effect of market liquidity is marginal within
the first few months but they become large and stable after six months.
While the S&P500 index plays an important role in explaining the forecast error variance
of the number of IPOs, it does not do so for the case of total and average proceeds (in Panel B and
C). Stock market performance affects the entrepreneur’s desire to go public, but the dollar amount
of proceeds raised depends more likely on capital structure and financing cost consideration by
9 See, for example, Lee (1992)

13
both entrepreneurs and investment banks underwriting the IPO. The Fed funds rate and the 10-year
Treasury bond rate are shown to play a significant role in determining the total and average
proceeds. We also perform diagnostic tests for the disturbance term using the Ljung-Box
portmanteau and Lagrange Multiplier tests. Untabulated results indicate the absence of serial
correlation and heteroskedasticity. We confirm that our findings are robust to the different ordering
of the variables for the variance decomposition analysis.
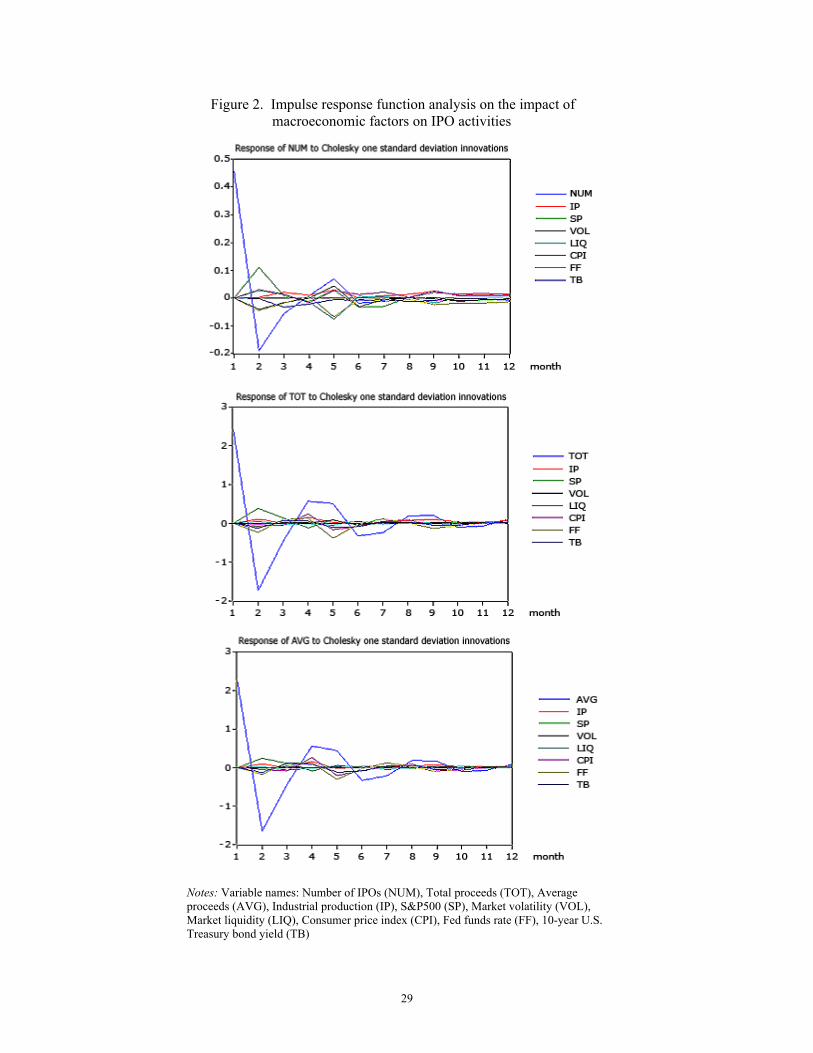
We then proceed to conduct the impulse-response function (IRF) analysis to examine how
each variable in the system responds to various shocks and what the patterns of the dynamic
adjustments to the long run equilibrium are. We perform the IRF analysis for each of the three IPO
variables to investigate how they respond to one standard deviation innovations of each of the
seven macroeconomic variables. The results are reported in Figure 2. The response mechanism in
the case of the number of IPOs seems to be faster toward the equilibrium than that of the proceeds.
The variables do not show any explosive behavior and all effects are wiped out within a year or
sooner. The response of the number of IPOs to macroeconomic shocks takes place mostly during
the first three months after the shocks arrives, while the response of total and average proceeds to
macroeconomic shocks takes place mostly during the first six months. The graphs also show that
the S&P500 index plays an important role in all three cases of the number of IPOs, total proceeds,
and average proceeds, while the Fed funds rate does so only in the cases of total and average
proceeds. Changing the order of the variables does not change the main findings reported in this
section significantly.
Implications for forecasting IPO activities
To determine whether the model has a proper power of predictability or not, we use the
historical data from 1970 to 2002 to re-estimate the coefficients of the VEC model and generate
forecast for three years from 2003 to 2005. The statistics of the model forecast are then used to
compare to those of a naïve forecast which is based on the VAR model without the error correction

14
term. Table 10 shows that the VEC model which incorporates information on based on the long-run
equilibrium cointegration relations improves the forecasting performance significantly, evidenced
by smaller root mean square error, mean absolute error, and bias proportion. Besides, our adjusted
R2 from the VEC model significantly increases to more than 0.70. This is close to the R2 of the
rational IPO wave model proposed by Pástor and Veronesi (2005). Figure 3 shows that the VEC
model captures the dynamic changes in IPO activities with lower forecast errors, while the naïve
approach produces larger forecast errors. Our findings indicate that the VEC model on changes in
the macroeconomic environment performs reasonably well in predicting IPO activities.
Our results provide useful policy implications for not only investors, investment banks, and
IPO-planning firms, but also for macroeconomic policy planners. By anticipating future surge or
drop in IPO activities based on the expected changes in the macroeconomic environment, policy
makers can adopt adjustment mechanisms that complement or counteract with future IPO-induced
consequences in the economy.
IV. Conclusion
This paper examines the explanatory power and the dynamic impact that selected
macroeconomic factors have on IPO activities in the US during the period from 1970 to 2005.
Using time-series econometrics techniques, we provide consistent evidence that selected
macroeconomic factors, such as stock market performance, monetary policy stance and Treasury
bond yield rates play an important role in providing with a favorable environment for a firm to go
public. Our paper provides a closer look at these market conditions by examining their relative
importance in determining IPO activities and interactive adjustment mechanisms.10
We find evidence that there exists a long-run equilibrium relationship between IPO
activities and selected macroeconomic conditions. Specifically, stock market performance and
10 This is consistent with the viewpoint presented in Ritter and Welch (2002). They mention in their review of IPO activity, pricing, and allocations that market conditions are the most important factor in the decision to go public.

15
volatility play the most important role in the timing of IPOs. The effect of market liquidity and real
economic activity proxied by industrial production are overshadowed by that of the stock market.
While stock market performance plays an important role in explaining the number of IPOs, the Fed
funds rate and the 10-year U.S. Treasury bond yield play a significant role in determining the
amount of proceeds raised in these IPOs.
There also exist different short-run dynamic adjustment mechanisms between the
macroeconomic factors and IPOs toward the long-run equilibrium path. We find that the short-run
adjustment processes are completed for the most part within a period of six months to one year.
Our findings also indicate that the VEC model, which incorporates an error correction mechanism
between IPOs and selected macroeconomic variables, predicts IPO activities reasonably well. The
exploration of the relative importance of other factors, such as firm-specific and industry-level
determinants, in determining and predicting IPO activities is left to our future research agenda.
16
References
Akaike, H., 1974, A new look at the statistical model identification, I.E.E.E. Transactions on Automatic Control, AC, 19, 716-723. Akaike, H., 1976, Canonical correlation analysis of time series and the use of an information criterion, in R. K. Mehra and D. G. Lainotis (eds.), System Identification: Advances and Case Studies, Academic Press, New York, 52-107. Bernanke, B., and Blinder, A., 1992, The federal funds rate and the channels of monetary transmission, American Economic Review 82, 901–921. Bernanke, B., and Gertler, M., 1999, Monetary policy and asset price volatility, New Challenges for Monetary Policy, Federal Reserve Bank of Kansas City. Bernanke, B, and Kuttner, K., 2003, What explains the stock market’s reaction to Federal Reserve Policy? Mimeo, Board of Governors and Federal Reserve Bank of New York. Chemmanur, T., and Fulghieri, P., 1999, A theory of the going-public decision, Review of Financial Studies, 12, 249-279. Cheung, Y., and Lai, K. S., 1993, Finite-sample sizes of johansen's likelihood ration tests for conintegration, Oxford Bulletin of Economics and Statistics, 55, 313-328. Cowan, L., 2006, Stock market quarterly review: companies hit brakes on IPOs; economy, oil-price worries soften new-issue demand; Europe bucks weak trend, Wall Street Journal, Eastern Edition, Oct 2, 2006, page C.12. Dickey, D. A., and Fuller, W. A., 1981, Likelihood ratio statistics for autoregressive: time series with a unit root, Econometrica, 49, 1057-1072. Engle, R. F., and Granger, C. W. J., 1987, Co-integration and error correction: representation, estimation, and testing, Econometrica, 55, 254-276. Engle, R. F., and Yoo, B. S., 1987, Forecasting and testing in co-integrated systems, Journal of Econometrics, 35, 143-59. Fama, E., 1990, Stock returns, expected returns and real activity, Journal of Finance, 45, 1089-1108. Gleason, K., Johnston, J., Madura, J., 2008, What factors drive IPO aftermarket risk, Applied Financial Economics, 18, 1099-1110. Gompers, P., and Lerner, J., 2000, Money chasing deals? The impact of fund inflows on private equity valuations, Journal of Financial Economics, 55, 281-325. Hannan, E. J., 1980, The estimation of the order of an ARMA process, Annals of Statistics, 8, 1071-1081. Hannan, E. J., and Quinn, B. G., 1979, The determination of the order of an autoregression, Journal of the Royal Statistical Society, B, 41, 190-195. Ibbotson, R. G., and Jaffe, J. F., 1975, Hot issue markets, Journal of Finance, 30, 1027-1042.

17
Ibbotson, R. G., Sindelar, J., and Ritter, J., 1994, The market’s problem with the pricing of initial public offerings, Journal of Applied Corporate Finance, 7, 66-74. Johansen, S., 1988, Statistical analysis of cointegration vectors, Journal of Economic Dynamics and Control, 12, 231-254. Johansen, S., and Juselius, K., 1990, Maximum likelihood estimation and inference on cointegration with applications to the demand for money, Oxford Bulletin of Economics and Statistics, 52, 169-210. Lee, B, 1992, Causal relationships among stock returns, interest rates, real activity, and inflation, Journal of Finance 47, 1591-1603. Lerner, J., 1994, Venture capitalists and the decision to go public, Journal of Financial Economics, 45, 293-316. Ljungqvist, A., 1995, When do firms go public? Poisson evidence from Germany, Working paper, University of Oxford Loughran, T., Ritter, J., and Rydqvist, K., 1994, Initial public offerings: international insights, Pacific Basin Finance Journal, 2, 165-200. Lowry, M., 2003, Why does IPO volume fluctuate so much? Journal of Financial Economics, 67, 3-40. Lowry, M., and Schwert, G., 2002, IPO market cycles: bubbles or sequential learning? Journal of Finance, 57, 1771-1200. Nelson, C. R., and Plosser, C. L., 1982, Trends and random walks in macroeconomic time series: some evidence and implications, Journal of Monetary Economics, 10, 139-162. Pagano, M., Panetta, F., and Zingales, L., 1998, Why do companies go public? An empirical analysis, Journal of Finance, 53, 27-64. Pástor, L., and Stambaugh, R. F., 2003, Liquidity risk and expected stock returns, Journal of Political Economy, 111, 642-685. Pástor, L., and Veronesi, P., 2005, Rational IPO waves, Journal of Finance, 60, 1713-1757. Ritter, J., 1984, The "hot issue" market of 1980, Journal of Business, 57, 215-240. Ritter, J., and Welch, I., 2002, A review of IPO activity, pricing, and allocations, Journal of Finance, 57, 1795-1828. Schwarz, G., 1978, Estimating the dimension of a model, Annals of Statistics, 6, 461-464. Zingales, L., 1995, Inside ownership and the decision to go public, Review of Economic Studies, 62, 425-448.

18
Table 1. Summary statistics of IPO and selected macroeconomic variables
Level Mean Median Max Min Std dev Skewness Kurtosis
The number of IPOs 28.39 23 108 0 23.87 0.89 3.13
Total proceeds ($ mil) 1,924.62 1,189.65 13,989.30 0 2,271.36 1.65 6.72
Average proceeds ($ mil) 73.54 36.73 973.32 0 126.53 3.71 20.49
Industrial production 70.07 67.16 110.45 40.70 20.01 0.52 1.98
S&P500 456.33 273.60 1517.68 63.54 425.53 0.98 2.51
Market volatility 0.82 0.70 4.93 0.28 0.42 3.20 24.29
Market liquidity -0.02 -0.01 0.52 -0.89 0.13 -1.05 11.31
CPI 115.74 115.55 199.20 37.80 48.48 -0.10 1.74
Federal funds rate 6.66 5.91 19.10 0.98 3.49 1.00 4.49
10-year Treasury bond yield 7.66 7.34 15.32 3.33 2.48 0.88 3.47
Notes: Data include monthly observations during the period from January 1970 to December 2005 on three IPO variables and seven macroeconomic variables. The number of IPO is the number of firms going public in a month as in Ritter’s specification. Total proceed is the total dollar raised in these IPOs in each month from the Securities Data Company (SDC). Average proceed is total proceed raised per one IPO in a month. Industrial production index is used in place of GDP since GDP data are not available on a monthly basis. S&P500 and data used to calculate the aggregate market liquidity from the Center for Research in Security Prices (CRSP). Market volatility is computed each month as standard deviation of daily market return within the month as in Pástor and Veronesi (2005). Market liquidity in each month is constructed by averaging individual stock measures for the month and then multiplying with the ratio of the dollar value at the end of the previous month of the stocks included in the average in current month and the dollar value in January 1970; and an individual stock’s measure for a given month is a regression slope coefficient estimated using daily returns and volume data within that month as in Pástor and Stambaugh (2003). Data on industrial production index, CPI, the Fed funds rate, and Treasury bond yield are obtained from the Federal Reserve in St. Louis.

19
Table 2. Unit roots tests Log levels Log differences DF ADF DF ADF
Number of IPOs -2.03 [3] -3.07 [3] -3.68*** [6] -17.09*** [2]
Total proceeds -2.23 [3] -2.26 [3] -23.65*** [2] -23.66*** [2] Average proceeds -2.21 [3] -2.56 [3] -8.44*** [6] -9.14*** [6] Industrial production -2.51 [3] -2.13 [1] -7.55*** [2] -9.71*** [1] S&P500 -1.53 [0] -2.23 [0] -6.13*** [4] -20.35*** [0] Market volatility -4.47*** [5] -4.49*** [5] Market liquidity -19.93*** [0] -20.10*** [0] CPI -1.03 [11] -0.25 [1] -5.03*** [4] -11.94*** [0] Federal funds rate -2.49 [6] -2.47 [1] -11.86*** [0] -11.86*** [0]
10-year Treasury bond yield -1.49 [2] -1.89 [2] -3.69*** [6] -15.61*** [1]
Notes: All variables are transformed into natural logarithms except market volatility and market liquidity. Both Dickey-Fuller (DF) and Augmented Dickey-Fuller (ADF) tests are conducted with trend and intercept. The reported numbers are the t-statistics. The number of lags selected by the Schwarz Info Criterion is in brackets. The null hypothesis is that the variable has unit roots. ***, **, and * denote statistical significance at the 1%, 5% and 10% level, respectively. Critical values for DF with trend and intercept are -2.57, -2.89, and -3.48 at the 10%, 5%, and 1% level, respectively. Critical values for ADF with trend and intercept are -3.13, -3.42, and -3.98 at the 10%, 5%, and 1% level, respectively.

20
Table 3. Correlations among IPO and macroeconomic variables
IP SP VOL LIQ CPI FF TB
NUM -0.03 0.20 -0.17 0.08 -0.02 -0.07 -0.08
TOT 0.01 0.10 -0.07 0.02 0.09 -0.07 -0.10
AVG 0.02 0.07 -0.05 0.00 0.11 -0.07 -0.09
IP 1.00 -0.06 -0.12 -0.02 -0.12 0.31 0.16
SP 1.00 -0.29 0.19 -0.17 -0.20 -0.17
VOL 1.00 -0.29 0.01 -0.11 -0.04
LIQ 1.00 0.01 0.01 -0.03
CPI 1.00 0.11 0.18
FF 1.00 0.25
TB 1.00
Notes: The number of IPOs (NUM), total proceeds (TOT), average proceeds (AVG), industrial production (IP), S&P500 (SP), consumer price index (CPI), the Federal funds rate (FF), and 10-year Treasury bond yield (TB) are in the log-difference. Market volatility (VOL) and market liquidity (LIQ) are in the level.

21
Table 4. OLS bench-mark regressions
Panel A: NUM Panel B: TOT Panel C: AVG
(1) (2) (3) (1) (2) (3) (1) (2) (3)
C 0.12 0.00 0.13 -0.25 -0.52 -0.56 -0.38 -0.54 -0.73 (1.69) (0.07) (1.29) (-0.61) (-2.14) (-0.93) (-0.99) (-2.37) (-1.28)
IP -0.84 0.06 -2.61 28.35 30.25 12.43 29.77 30.78 15.77 (-0.23) (0.02) (-0.68) (1.27) (1.36) (0.54) (1.43) (1.48) (0.74)
SP 1.73*** 1.72*** 5.54 4.95 3.59 3.00 (2.82) (2.91) (1.50) (1.40) (1.04) (0.91)
VOL -0.17*** -0.20*** -0.41 -0.45 -0.24 -0.24 (-2.73) (-3.19) (-1.10) (-1.19) (-0.68) (-0.67)
LIQ 0.33* 0.00 0.33 -0.38 -0.03 -0.37 (1.71) (-0.01) (0.29) (-0.34) (-0.03) (-0.35)
CPI 3.56 0.01 0.77 127.79*** 117.03*** 120.49*** 127.41*** 120.62*** 123.25*** (0.48) (0.00) (0.10) (2.84) (2.61) (2.76) (3.02) (2.88) (3.02)
FF -0.31 -0.40 -0.33 -3.40 -3.74 -3.29 -3.12 -3.34 -2.95 (-0.76) (-0.99) (-0.84) (-1.41) (-1.57) (-1.39) (-1.38) (-1.50) (-1.33)
TB -0.70 -0.86 -0.56 -8.13** -8.73** -8.46** -7.47** -7.89** -8.03** (-1.07) (-1.30) (-0.89) (-2.08) (-2.23) (-2.28) (-2.04) (-2.16) (-2.31)
D(-1) -0.30*** -0.33*** -0.34*** (-6.56) (-7.43) (-7.62)
NBER
0.03 0.46 0.45
(0.35) (0.99) (1.02)
SOX 0.07 0.70 0.63 (0.68) (1.08) (1.06)
R2 adj 0.04 0.01 0.13 0.03 0.02 0.14 0.02 0.02 0.14
Notes: The number of IPOs (NUM), total proceeds (TOT) and average proceeds (AVG) are regressed on macroeconomic variables. D(-1) is the first lag of the dependent variable. The NBER dummy variable equals one for the economic expansion period and zero for the recession period. The SOX dummy variable equals one for the period after Sarbanes-Oxley, which became effective on August 29, 2002. All other variables are defined as in Table 1 and Table 3. t-statistics are reported in parentheses. ***, **, and * denote the statistical significance at the 1%, 5% and 10% level, respectively.

22
Table 5. Lag length tests
Panel A:
Lag test on number of IPOs and macroeconomic variables
Panel B:
Lag test on total proceeds and macroeconomic variables
Panel C:
Lag test on average proceeds and macroeconomic variables
Lag LR FPE AIC SC HQ LR FPE AIC SC HQ LR FPE AIC SC HQ
0 NA 0.00 -15.09 -15.05 -15.07 NA 0.00 -12.10 -12.05 -12.08 NA 0.00 -12.27 -12.23 -12.25
1 307.47 0.00 -15.71 -15.42* -15.60 310.02 0.00 -12.72 -12.44 -12.61 310.83 0.00 -12.90 -12.61 -12.78
2 96.31 0.00 -15.82 -15.30 -15.61* 159.94 0.00 -12.99 -12.47* -12.78 162.63 0.00 -13.17 -12.65* -12.97
3 54.45* 0.00 -15.84* -15.08 -15.54 110.67* 0.00 -13.14* -12.38 -12.84* 110.76* 0.00 -13.33* -12.56 -13.02*
4 31.98 0.00 -15.80 -14.80 -15.41 33.57 0.00 -13.11 -12.11 -12.71 34.24 0.00 -13.29 -12.29 -12.90
5 26.97 0.00 -15.75 -14.51 -15.26 33.34 0.00 -13.07 -11.84 -12.59 32.70 0.00 -13.26 -12.02 -12.77
6 21.57 0.00 -15.69 -14.21 -15.10 26.14 0.00 -13.02 -11.55 -12.44 26.59 0.00 -13.21 -11.73 -12.62
Notes: The tests of the lag length of IPO variables on macroeconomic variables use five different criteria: LR (sequential modified likelihood ratio test statistic), FPE (Final prediction error), AIC (Akaike information criterion), SC (Schwarz information criterion), and HQ (Hannan-Quinn information criterion). * indicates the lag order selected by each criterion (at the 5% significance level).

23
Table 6. Multivariate cointegration tests on IPO activity and macroeconomic variables
Trace criterion Maximum Eigen value criterion Hypothesized No. of CE(s)
Eigen value
Stat 5% CV p-value
Hypothesized No. of CE(s)
Eigen value
Stat 5% CV p-value
Panel A: Number of IPOs and macroeconomic variables
None *** 0.237 366.518 187.470 0.000 None *** 0.237 115.843 56.705 0.000
At most 1 *** 0.178 250.675 150.559 0.000 r = 1 *** 0.178 83.972 50.600 0.000
At most 2 *** 0.131 166.703 117.708 0.000 r = 2 *** 0.131 60.073 44.497 0.001
At most 3 *** 0.102 106.630 88.804 0.002 r = 3 *** 0.102 46.268 38.331 0.005
At most 4 0.054 60.362 63.876 0.095 r = 4 0.054 23.546 32.118 0.380
At most 5 0.038 36.816 42.915 0.178 r = 5 0.038 16.544 25.823 0.497
At most 6 0.031 20.272 25.872 0.212 r = 6 0.031 13.437 19.387 0.294
At most 7 0.016 6.836 12.518 0.362 r = 7 0.016 6.836 12.518 0.362
Panel B: Total proceeds and macroeconomic variables
None *** 0.235 360.195 187.470 0.000 None *** 0.235 114.781 56.705 0.000
At most 1 *** 0.178 245.414 150.559 0.000 r = 1 *** 0.178 83.824 50.600 0.000
At most 2 *** 0.137 161.591 117.708 0.000 r = 2 *** 0.137 62.963 44.497 0.000
At most 3 *** 0.092 98.628 88.804 0.008 r = 3 ** 0.092 41.151 38.331 0.023
At most 4 0.047 57.477 63.876 0.154 r = 4 0.047 20.783 32.118 0.590
At most 5 0.041 36.694 42.915 0.182 r = 5 0.041 17.822 25.823 0.391
At most 6 0.027 18.872 25.872 0.288 r = 6 0.027 11.854 19.387 0.429
At most 7 0.016 7.019 12.518 0.343 r = 7 0.016 7.019 12.518 0.343
Panel C: Average proceeds and macroeconomic variables
None *** 0.233 354.097 187.470 0.000 None *** 0.233 113.721 56.705 0.000
At most 1 *** 0.177 240.376 150.559 0.000 r = 1 *** 0.177 83.563 50.600 0.000
At most 2 *** 0.137 156.814 117.708 0.000 r = 2 *** 0.137 62.816 44.497 0.000
At most 3 ** 0.082 93.997 88.804 0.020 r = 3 * 0.082 36.844 38.331 0.073
At most 4 0.050 57.153 63.876 0.162 r = 4 0.050 22.129 32.118 0.483
At most 5 0.040 35.024 42.915 0.244 r = 5 0.040 17.378 25.823 0.426
At most 6 0.025 17.647 25.872 0.368 r = 6 0.025 10.848 19.387 0.529
At most 7 0.016 6.798 12.518 0.366 r = 7 0.016 6.798 12.518 0.366
Notes: The Unrestricted Cointegration Rank Tests assume a linear deterministic trend. These tests are performed on the level of each of the three IPO performance variables and the seven macroeconomic variables, all of which follow unit-root processes. The number of lags (in first differences) in the VAR specifications is one to three. CE(s) indicates Cointegration equation(s). CVs are the sample-size adjusted critical values provided in Cheung and Lai (1993). ‘None’ means one cointegrating relationship binding all variables. r denotes the number of cointegrating vectors. ***, **, and * denote rejection of the hypothesis at the 1%, 5% and 10% significance level, respectively.

24
Table 7. The estimation results of the error-correction model for IPO activities Error corrections Regression Adjusted (1) (2) (3) (4) F-statistics R2
Number of IPOs
-0.13***
-0.47***
-0.23**
-0.01
6.16***
0.25 (3.90) (3.65) (1.85) (0.12) Total proceeds -0.23*** -0.28*** -0.52*** -0.17 13.15*** 0.44 (5.55) (4.40) (3.90) (0.37) Average proceeds -0.18*** -0.22*** -0.23*** -0.20 13.29*** 0.43
(5.18) (3.80) (3.70) (0.49)
Notes: t-statistics are in parentheses. ***, **, and * denote the statistical significance at the 1%, 5% and 10% level, respectively.

25
Table 8. Granger causality tests Panel A: Granger causality tests of macroeconomic variables on the number of IPOs, total proceeds, and average proceeds.
Macro NUM TOT AVG The macro factor does not Granger cause
factor does not Granger cause the macro factor NUM TOT AVG
IP 2.599*** 3.236*** 2.594*** 2.481*** 3.535*** 3.027***
SP 1.184 1.834** 1.986** 4.270*** 3.787*** 2.181**
VOL 0.885 0.578 0.514 2.003** 0.949 0.478
LIQ 0.812 0.145 0.135 2.220** 0.258 0.152
CPI 1.349 1.795** 1.934** 1.588* 1.944** 1.957**
FF 1.024 0.875 0.798 1.462 2.221** 1.868**
TB 1.473 0.663 0.531 1.199 0.510 0.421
Notes: F-statistics are from the F-test for the null hypothesis that IPO variables do not Granger-cause the macroeconomic variables in the left panel and vice versa for the right panel. All variables are defined as in Table 1 and Table 3. ***, **, * denotes rejection of the null hypothesis at the 1%, 5% and 10% significance level, respectively. Panel B: Granger causality tests among macroeconomic variables.
Macro IP SP VOL LIQ CPI FF TB
IP 1.082 0.897 0.245 0.614 6.677*** 3.009**
SP 6.365*** 8.237*** 1.598 0.536 6.309*** 2.945**
VOL 5.376*** 2.015 1.579 1.683 6.022*** 1.669
LIQ 2.994** 0.992 0.968 0.193 0.237 3.154**
CPI 4.175*** 2.182 1.404 0.389 0.554 3.730**
FF 2.093 1.771 2.854** 0.609 3.833*** 0.516
TB 2.397* 3.352** 0.308 1.702 2.152* 8.146***
Notes: F-statistics are from the F-test for the null hypothesis that the variable in the vertical column on the left does not Granger-cause the variable in the horizontal bar at the top. All variables are defined as in Table 1 and Table 3. ***, **, * denote rejection of the hypothesis at the 1%, 5% and 10% significance level, respectively.

26
Table 9. Multivariate VAR/VEC: Variance decomposition
Panel A: Number of IPOs (NUM)
Month NUMt IPt SPt VOLt LIQt CPIt FFt TBt
1 92.00 0.12 3.46 2.41 0.01 0.31 1.15 0.55
3 89.86 0.24 4.74 1.91 0.30 1.03 1.12 0.80
6 84.03 0.61 5.39 2.45 2.29 1.32 2.97 0.94
9 82.88 0.92 5.62 2.41 2.35 1.59 3.20 1.02
12 82.21 1.09 5.62 2.46 2.33 1.78 3.46 1.05
18 80.79 1.53 5.54 2.47 2.33 2.15 4.08 1.12
24 79.48 1.93 5.46 2.49 2.31 2.50 4.63 1.20
Panel B: Total proceeds (TOT)
Month TOTt IPt SPt VOLt LIQt CPIt FFt TBt
1 93.37 0.51 0.35 0.71 0.04 1.41 1.35 2.25
3 93.24 0.32 1.19 0.51 0.12 1.68 1.10 1.83
6 89.75 0.68 1.32 0.49 0.19 2.65 2.93 1.98
9 89.05 0.87 1.31 0.50 0.20 2.73 3.30 2.05
12 88.89 0.93 1.31 0.50 0.22 2.78 3.32 2.05
18 88.52 1.15 1.32 0.51 0.24 2.78 3.43 2.06
24 88.24 1.34 1.34 0.51 0.26 2.77 3.49 2.06
Panel C: Average proceeds (AVG)
Month AVGt IPt SPt VOLt LIQt CPIt FFt TBt
1 93.54 0.40 0.06 0.33 0.09 2.69 1.10 1.80
3 92.90 0.26 0.65 0.31 0.15 3.19 1.01 1.52
6 89.57 0.62 0.70 0.32 0.17 4.46 2.25 1.91
9 88.91 0.72 0.69 0.33 0.21 4.53 2.59 2.02
12 88.75 0.75 0.70 0.35 0.22 4.59 2.61 2.03
18 88.50 0.87 0.72 0.36 0.24 4.61 2.65 2.04
24 88.32 0.98 0.74 0.38 0.25 4.62 2.66 2.05
Notes: Multivariate VEC estimates of three IPO measures and seven macroeconomic variables. For the definition of the variables, refer to Table 1 and Table 3. These estimations assume a linear deterministic trend. The number of lags (in first differences) in the VAR specifications are 1 to 3. Variance decomposition is the percentage of forecast error, in the number of IPOs, total proceeds and average proceeds, that can be explained by macroeconomics variables (Cholesky one standard deviation).

27
Table 10. Forecast statistics
Root mean
squared error Mean
absolute error Bias
proportion Adjusted R2
The number of IPOs
- Naïve forecast 0.556 0.429 0.003 0.044
- Model forecast 0.082 0.066 0.001 0.705
Total proceeds
- Naïve forecast 0.811 0.655 0.202 0.027
- Model forecast 0.660 0.527 0.078 0.779
Average proceeds
- Naïve forecast 0.841 0.662 0.161 0.023
- Model forecast 0.650 0.525 0.128 0.782
Notes: Forecast statistics of the change in number of IPOs, total proceeds, and average proceeds for the period from 2003 to 2005 using historical data from 1970 to 2002. The naïve forecast provides estimates using the VAR model which does not include the error correction term. The model forecast provides estimates using the VEC model.

28
Figure 1. Monthly IPO activities from 1970 to 2005
29
Figure 2. Impulse response function analysis on the impact of macroeconomic factors on IPO activities
Notes: Variable names: Number of IPOs (NUM), Total proceeds (TOT), Average proceeds (AVG), Industrial production (IP), S&P500 (SP), Market volatility (VOL), Market liquidity (LIQ), Consumer price index (CPI), Fed funds rate (FF), 10-year U.S. Treasury bond yield (TB)

30
Figure 3. IPO activities forecasting