city response to state auditor fy 2019-20 local government
TRANSCRIPT

City Response to State Auditor FY 2019-20 Local Government High Risk Evaluation
CITY OF ANAHEIM SEPTEMBER 23, 2021 FINANCE DEPARTMENT

i
Table of Contents
CITY OF ANAHEIM RESPONSE TO STATE AUDITOR’S FY 2019-20 LOCAL GOVERNMENT HIGH RISK EVALUATION .......................................................................................................... 1
EXECUTIVE SUMMARY ................................................................................................................................ 1
INTRODUCTION ........................................................................................................................................... 1
REVIEW OF THE EVALUATION .................................................................................................................. 2
Financial Indicator #1: General Fund Reserves ........................................................................ 2
Financial Indicator #2: Debt Burden ........................................................................................... 3
Financial Indicator #3: Liquidity .................................................................................................. 3
CITY ADJUSTED EVALUATION ................................................................................................................... 4
CONCLUSION .............................................................................................................................................. 5
CITY COMPARISONS ................................................................................................................. 7
TOTAL OVERALL POINTS .............................................................................................................. 8
POINTS BY FINANCIAL INDICATORS ....................................................................................... 10

CITY OF ANAHEIM RESPONSE TO STATE AUDITOR REPORT
PAGE 1
CITY OF ANAHEIM RESPONSE TO STATE
AUDITOR’S FY 2019-20 LOCAL GOVERNMENT HIGH RISK EVALUATION
EXECUTIVE SUMMARY In October 2019, the California State Auditor (State Auditor) launched a new tool—an online dashboard—that ranks more than 470 California cities based on detailed information about their fiscal health. The ranking is part of a process for determining whether a city is at risk of fiscal distress. The dashboard was updated in August 2021 and indicated that the City of Anaheim (City) moved from moderate risk to high risk based on the audited financial statements for fiscal year 2019/20. The Government Finance Officers Association (GFOA) best practices caution against using financial data in isolation to avoid coming to an inappropriate conclusion. While financial indicators are a useful tool to identify trends or anomalies, they do not necessarily reflect nuances or qualitative factors. For example, the Auditor’s analysis does not reflect that prior to the Anaheim Resort Improvement Bonds and the expansion, the Anaheim Resort provided the General Fund with approximately 11% of its budget after paying for all of its costs compared to more than 25% in a normal year today. Several quantitative nuanced items were also identified by the City, and when adjusted for, place the City back into the moderate risk category with nearly 200 other California cities. Further, even during the pandemic with the Anaheim Resort closed, the City’s credit ratings are ‘A’ rated, indicating that the City is at low risk for default. At this time, the Anaheim Resort has reopened and revenues have surpassed expectations. We anticipate that the City will have a strong recovery and financial indicators and ratings will improve significantly over time. Anaheim has a legacy of sound financial management and takes pride in its fiscal health. The City is a complex organization with a diverse economy, and has successfully balanced serving its community while fulfilling its financial obligations. The current circumstances are the result of temporary conditions brought on by the global pandemic and not indicative of an imminent decline in the City’s fiscal health.
INTRODUCTION The California State Auditor (Auditor) released a report in late August indicating that the City of Anaheim (Anaheim) was at high risk, defined as having a significant potential for waste, fraud, abuse or mismanagement or has major challenges associated with its economy, efficiency, or effectiveness. While there was no formal report issued by the Auditor, Finance reviewed the dashboard, supporting data, and methodology that the Auditor used. Finance reviewed the data to ensure accuracy and thoroughly understand the Auditor’s methodology. The data used in the dashboard for all cities in the State is from audited financial statements. While we understand

CITY OF ANAHEIM RESPONSE TO STATE AUDITOR REPORT
PAGE 2
using audited data for consistency, it does not provide any significant qualitative interpretation. Further, while Generally Accepted Accounting Principles (GAAP) require most things to be accounted for the same, not all 470 plus California cities have the same things (such as utilities, a convention center and the Anaheim Resort) to account for, and incorrect or misleading conclusions from quantitative data alone may be made. The Auditor used 10 financial indicators and assigned points for each area. While the information can be useful in analysis, we believe the isolated snapshot of the data does not tell the whole story of a city’s fiscal health. According to the Government Finance Officers Association (GFOA), “considering financial data in isolation can lead to inappropriate conclusions--appropriate context is essential for sound interpretation. For state and local governments, trend data of the government itself and comparative data from other governments frequently have provided this context for evaluating current-year financial data.” In this regard, Anaheim has a proven track record of sound fiscal health, serving our community and meeting our obligations. GFOA further states, “GFOA believes that a government’s own past performance normally is the most relevant (but not exclusive) context for analyzing current-year financial data.” And, “Appropriate comparisons of a government’s own data with the data of other similar governments also may be useful for purposes of financial analysis. However, care must be taken to ensure that such comparisons are valid.” Examples of potential differences include, significant ranges in the scope or quality of services provided, significant variances in the number of those served; varying categorization and differences in regions where costs and environmental factors may not be comparable.
REVIEW OF THE EVALUATION Financial Indicator #1: General Fund Reserves An item of specific note that affected the FY 2019/20 changes (those most recently published by the Auditor), was the internal borrowing of $33 million from our Insurance Internal Service Fund in response to the drop of revenues due to the COVID pandemic. The City has had a long-standing policy to set-aside funds for its long-term compensated absences and self-insurance liabilities, unlike most other agencies that deal with each year as it comes due. Because of this, the City was able to prudently borrow $33 million from those funds set-aside to be paid out over a long-term horizon. When a city borrows from an outside party, it does not have any impact on reserves and, in fact, increases liquidity for governmental funds as borrowed money comes in. But external borrowing also comes at a cost to cities. Governmental funds are supposed to look more like a typical household budget where the concern is in what’s coming in and going out in the near term. It focuses on whether bills can be paid on time and what is available in savings for an emergency. However, there is an inconsistency in GAAP that if you borrow from yourself, no matter what the repayment terms, it is considered an immediate obligation and negatively affects your reserves and liquidity, as compared to borrowing externally. It should be noted that there is no measure of these additional “reserves” the City has on hand and it is only reflected in the metrics as a negative. We consider this to be responsible management of internal reserves during an unprecedented time. The Insurance Internal Service Fund is well-funded with the ability to meet near-term

CITY OF ANAHEIM RESPONSE TO STATE AUDITOR REPORT
PAGE 3
demands. As such, Anaheim’s internal borrowing should be seen a prudent use of internal funds that is not always apparent under accounting rules. Additionally, the dashboard looks at ratios of reserves and includes both expenditures and transfers out. Our standard measurement does not include transfers out because the vast majority is for the Lease Payment Measurement Revenues (LPMR) for the Anaheim Resort Improvement Bonds. In 1997, the Anaheim Public Financing Authority issued lease revenue bonds to finance the construction of improvements in the Anaheim Resort. The amount of each lease payment is measured by portions of the three largest revenue sources (TOT, sales tax, and property tax). Lease payments made by the City under the lease agreement are equal to LPMR, which in general means the sum of an amount equal to the following are be transferred out into a restricted debt service fund: • 3% of the 15% TOT rate (i.e. 20% of the City’s total TOT revenue) for all hotel properties in
the City, excluding certain Disney properties constructed prior to 2009; • 100% of the TOT revenues from certain Disney properties constructed prior to 2009 over the
1995 base (adjusted annually by the change in CPI) with a minimum 2% increase; • 100% of the sales tax revenues from certain Disney properties over the 1995 base (adjusted
annually by the change in CPI) with a minimum 2% increase; • 100% of the City’s property tax revenues from certain Disney properties in excess of the
1995 base property tax amount, adjusted annually by 2%.
The way that LPMR works is that it creates its own reserves with a trustee, as in a typical year the LPMR paid to the trustee is greatly above the debt service requirements. Just adjusting for the LPMR alone results in an increase in the percentage of reserves by 2% or roughly $7M. Financial Indicator #2: Debt Burden The Auditor dashboard looks at all debt citywide, with no distinction between types of debt or the source of repayment. One of the largest components of the City’s debt profile is for the Electric Utility, which represents over 40% of the City’s debt and is not common to other cities and can skew many results in a simple dashboard rating. While the City has other self-supporting debt such as the Water Utility (approximately 10%), Sanitation Utility (approximately 3%), and the Anaheim Resort Improvement Bonds (approximately 20% for which the City does not make LPMR payments unless the City receives the revenue), Finance made adjustments only to the Electric Utility as it is uncommon to other cities and in no way connected to the General Fund. Financial Indicator #3: Liquidity As described in the General Fund Reserves Financial Indicator section, the treatment of the $33 million internal borrowing is inconsistent with the treatment of external debt and therefore affected the Liquidity financial indicator as well. This indicator compared the cash on-hand against the liabilities of the General Fund, which included the $33 million we borrowed from the Insurance Internal Service Fund. This indicator is meant to measure a city’s ability to pay its bills in the coming fiscal year but the $33 million is not due this year.

CITY OF ANAHEIM RESPONSE TO STATE AUDITOR REPORT
PAGE 4
CITY ADJUSTED EVALUATION The following reflects Anaheim’s numbers calculated on a point system by the Auditor compared to that which Finance recalculated to reflect the above adjustments, and puts the City in the moderate risk category with nearly 200 other California cities:
FINANCIAL INDICATOR 1. General Fund Reserves 30 1.58 5.08 2. Debt Burden 15 3.17 3.89 3. Liquidity 10 4.00 7.54 4. Revenue Trends 5 2.38 2.38 5. Pension Obligations 10 6.96 6.96 6. Pension Funding 5 3.55 3.55 7. Pension Costs 5 3.06 3.06 8. Future Pension Costs 5 1.94 1.94 9. OPEB Obligations 10 10.00 10.00 10. OPEB Funding 5 1.85 1.85 Maximum Score Possible 100 38.49 46.25
While no formal report was published by the Auditor, for ease of use, Finance has compiled various schedules that illustrate Anaheim’s original and adjusted points compared to the Top Ten cities and the high risk cities. The methodology is available for viewing on the Auditor’s website at: https://www.auditor.ca.gov/local_high_risk/process_methodology.
POINTS POSSIBLE
ANAHEIM (State
Auditor)
ANAHEIM (City
Adjusted)

CITY OF ANAHEIM RESPONSE TO STATE AUDITOR REPORT
PAGE 5
CONCLUSION Despite the unprecedented global pandemic and temporary drastic drop in tax revenues, the City maintains strong credit ratings, which allowed us to borrow at favorable rates during this difficult time. The following are the credit ratings of the City’s General Fund:
RATING AGENCY
Fitch Ratings March 5, 2021 A+ Negative An ‘A’ rating denotes expectations of low default risk. The capacity for payment of financial commitments is considered strong. This capacity may, nevertheless, be more vulnerable to adverse business or economic conditions than is the case for higher ratings.
Moody’s Investors Service
May 20, 2021 A1 Stable Obligations rated ‘A’ are judged to be upper-medium grade and are subject to low credit risk. The modifier 1 indicates that the obligation ranks in the higher end of its generic rating category.
S&P Global Ratings
May 24, 2021 A- Negative An obligation rated 'A' is somewhat more susceptible to the adverse effects of changes in circumstances and economic conditions than obligations in higher-rated categories. However, the obligor's capacity to meet its financial commitments on the obligation is still strong. Ratings from 'AA' to 'CCC' may be modified by the addition of a plus (+) or minus (-) sign to show relative standing within the rating categories.
These ratings were issued in the midst of a global pandemic and before the Anaheim Resort had reopened. At this time, the Anaheim Resort has reopened and revenues have surpassed expectations, lending credence to economic forecasts that indicate recovery will be swift and steady. We anticipate that the City will have a strong recovery and financial indicators and ratings will improve significantly over time. Again, while financial indicators are a useful tool to identify trends or anomalies, they do not necessarily reflect nuances or qualitative factors. For example, the Auditor’s analysis does not reflect that prior to the Resort expansion, the Resort provided the General Fund with approximately 11% of its budget after paying for all of its costs compared to more than 25% in a normal year currently, or that the City is protected from making LPMR payments when revenues
DATE RATING OUTLOOK DEFINITION

CITY OF ANAHEIM RESPONSE TO STATE AUDITOR REPORT
PAGE 6
are depressed. The Anaheim Resort bonds are a prime example of its sound financial management and legacy of fiscal health. The City is a complex, full service organization with its own public utility. It is home to a diverse economy, and has successfully balanced service to the community while fulfilling its financial obligations. Despite the challenging fiscal conditions brought on by the global pandemic, when the Auditor’s findings are properly adjusted to more accurately reflect our operations and unique standing as a world-class destination, the results place our community in the same financial standing as nearly half of all other cities in the State. Moreover, we believe that unlike most other California cities, Anaheim is uniquely positioned to improve its financial standing over the next several years as key developments come online and the Anaheim Resort Improvement bonds are retired, providing a significant influx of funds over the long-term.

CITY OF ANAHEIM RESPONSE TO STATE AUDITOR REPORT
PAGE 7
CITY COMPARISONS
CITY OF ANAHEIM RESPONSE TO STATE AUDITOR REPORT
PAGE 8
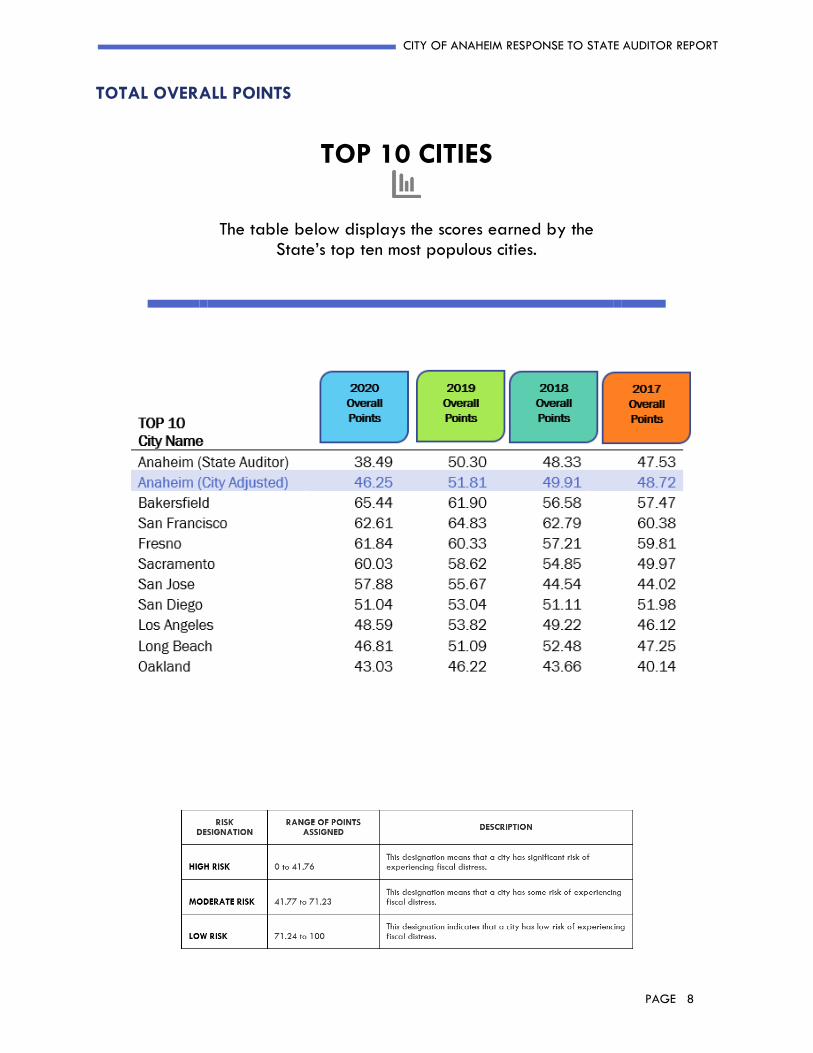
TOTAL OVERALL POINTS TOP 10 CITIES
The table below displays the scores earned by the State’s top ten most populous cities.

CITY OF ANAHEIM RESPONSE TO STATE AUDITOR REPORT
PAGE 9
HIGH RISK CITIES
The table below displays the scores earned by cities designated
as High Risk Cities by the State Auditor Report.
Cities identified in this category are those earning overall points between 0 to 41.76.

CITY OF ANAHEIM RESPONSE TO STATE AUDITOR REPORT
PAGE 10
POINTS BY FINANCIAL INDICATORS
TOP 10 CITIES Scores earned by the State’s top ten most populous cities, by Financial Indicators.

CITY OF ANAHEIM RESPONSE TO STATE AUDITOR REPORT
PAGE 11
HIGH RISK CITIES The table below displays the scores earned by cities designated as High Risk Cities by the State Auditor Report. Cities identified in this category are those earning overall points between 0 to 41.76