city tourism outlook and ranking: coronavirus impacts and
TRANSCRIPT

April 2020
City Tourism Outlook and Ranking: Coronavirus Impacts and Recovery
David Goodger
Managing Director, EMEA
Tourism Economics
Kieran Ferran
Senior Economist
Tourism Economics
Questions: Use the question panel on the right Questions: Use the question panel on the right
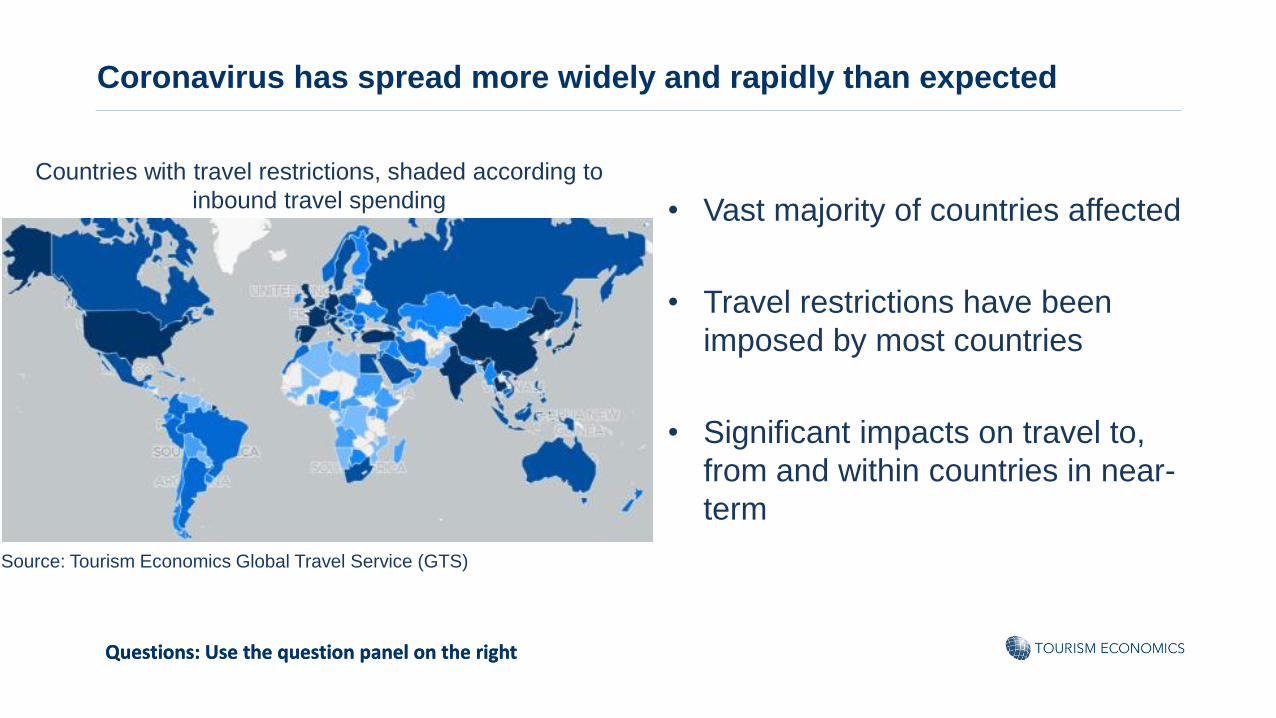
Coronavirus has spread more widely and rapidly than expected
• Vast majority of countries affected
• Travel restrictions have been
imposed by most countries
• Significant impacts on travel to,
from and within countries in near-
term
Source: Tourism Economics Global Travel Service (GTS)
Countries with travel restrictions, shaded according to
inbound travel spending

Questions: Use the question panel on the right Questions: Use the question panel on the right
Global lockdowns are having a very large impact on economy and travel
0 20 40 60 80 100
Present
Past
ChinaItalySpainFranceGermanyUS (specific states)UKIndiaAustraliaJapanOther
Global lockdowns
Source : Oxford Economics/Haver Analytics % of global GDP
16%
63%

Questions: Use the question panel on the right Questions: Use the question panel on the right
Immediate economic impact will be greater than during GFC
-8
-6
-4
-2
0
2
4
2007 2009 2011 2013 2015 2017 2019 2021
Non-China EM q/q contributionChina q/q contributionAdvanced economies q/q contributionGlobal % quarter
World: GDP
Source : Oxford Economics/Haver Analytics
% quarter Forecast

Questions: Use the question panel on the right Questions: Use the question panel on the right
Policy stimulus is providing vital support
-2.0
-1.5
-1.0
-0.5
0.0
0.5
1.0
1.5
2.0
2.5
2000 2005 2010 2015 2020
Advanced Economies Emerging Markets World
Global: Fiscal impulse
Source : Oxford Economics/Haver Analytics
Ppts of potential GDP
Forecast
Questions: Use the question panel on the right Questions: Use the question panel on the right
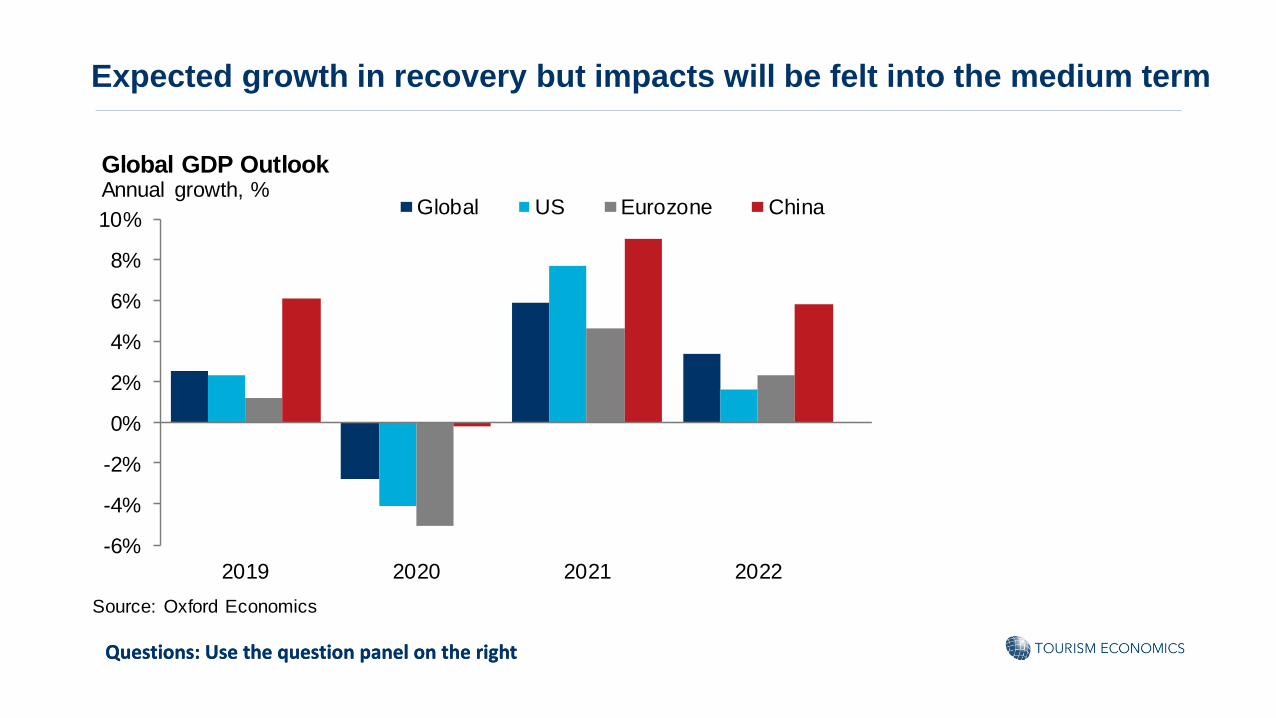
Expected growth in recovery but impacts will be felt into the medium term
2019 2020 2021 2022
-6%
-4%
-2%
0%
2%
4%
6%
8%
10%Global US Eurozone China
Source: Oxford Economics
2022 GDP relative topre-recession trend
Global GDP OutlookAnnual growth, %

Questions: Use the question panel on the right
Huge hit to labour market will impact consumer and travel demand
0
2
4
6
8
10
12
14
16
France US Spain UK
Labour shocks
Source : Oxford Economics/Haver Analytics
% of Total employmentFrance - workers temporarily laid-off under government support schemeUS - rise in jobless claims in the four weeks to Mar 28Spain - fall in employment end-Feb to end-MarchUK - applications for universal credit Mar 16 to 31

Questions: Use the question panel on the right
International travel will fall more sharply than GDP for the year
2001 2004 2007 2010 2013 2016 2019 2022
-50%
-40%
-30%
-20%
-10%
0%
10%
20%
30%
40%
GDP (real price)
Prior upside
Prior downside
New baseline
Source: Tourism Economics
Global GDP & Tourist ArrivalsAnnual growth, %

Questions: Use the question panel on the right
Impacts felt across all regions
-50%
-40%
-30%
-20%
-10%
0%
10%
20%
Asia Pacific Europe North America Latin America Middle East &Africa
2020 2021 2022 2023
Global city international visitor arrivals by destination region, relative to 2019% difference from 2019 levels
Source: Tourism Economics

Questions: Use the question panel on the right Questions: Use the question panel on the right
Jan Feb Mar Apr May Jun Jul Aug Sep Oct Nov Dec
0%
2%
4%
6%
8%
10%
12%
14%
16%
Europe
MEA
APAC
N America
LatinAmerica
Source: UNWTO, Tourism Economics
Global arrivals: average monthly seasonality
% share annual arrivals, 2013-18
Expected impacts in 2020 will be affected by duration and seasonality
• Expected 8-month impact period covers
over 3/4 usual annual European travel
activity – but a smaller amount of usual
travel for Middle East and Africa (2/3).
• Within this, current restrictions are
expected for around 4 months.
• Duration of current restrictions will have
a big impact on flows – some tapering
may begin peak summer months.
• “Typical airline had 2 months of cash at
the start of the year” according to IATA -
airline failures may follow.

Questions: Use the question panel on the right Questions: Use the question panel on the right
Occupancy falls below 50% in most major markets
0
10
20
30
40
50
60
70
80
Jan
5th
12th 19th 26th Feb
2nd
9th 16th 23rd Mar
1st
8th 15th 22nd 29th Apr
5th
Average Hotel Occupancy Rate by Country & RegionChina
Asia Pacific excl. China
Europe
USA
Source: STR, Tourism Economics
Occupancy rate,%, rolling 7 day average for week ending
Datafor week ending

Questions: Use the question panel on the right Questions: Use the question panel on the right
Occupancy falls below 50% in most major markets
0
10
20
30
40
50
60
70
80
90
100
Co
logn
e
Melb
ourn
e
Syd
ney
Dub
ai
Leed
s
Mu
mb
ai
Berl
in
Gla
sgo
w
Mad
rid
Lo
nd
on
Edin
bu
rgh
Ham
bu
rg
Milan
Bru
sse
ls
Duss
eld
orf
Am
sterd
am
Birm
ing
ham
Dub
lin
Bud
apest
Mo
scow
Mu
nic
h
Average Hotel Occupancy Rate by Market
Feb23rd
Mar 22nd
Source: STR, Tourism Economics
Occupancy rate, %, rolling 7 day average for week endingData for week ending

Questions: Use the question panel on the right
Largest city destinations hit hardest…
-3.3
-3.5
-3.8
-3.8
-4.2
-4.3
-4.6
-4.6
-4.8
-4.9
-5.7
-6.7
-8.2
-9.7
-10.3
-42%-37%-36%-42%-37%-37%-42%-34%-36%-43%-40%-41%-41%-42%-51%
-12 -10 -8 -6 -4 -2 0
GuangzhouBarcelona
Kuala LumpurOsakaTokyo
SingaporeRome
New YorkParis
ShenzhenLondon
DubaiMacao
BangkokHong Kong
Source: Tourism Economics
City international visitor arrivals decline, 2019-2020(mn) % change
Questions: Use the question panel on the right
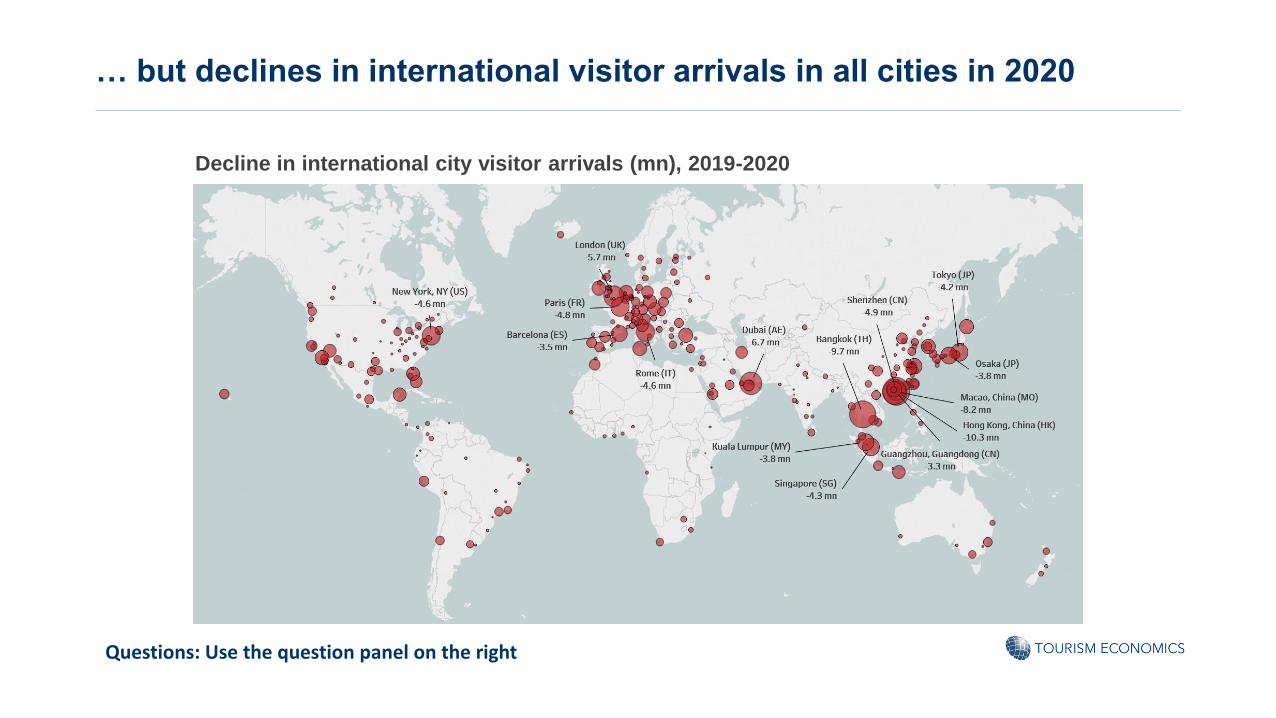
… but declines in international visitor arrivals in all cities in 2020
Decline in international city visitor arrivals (mn), 2019-2020

Questions: Use the question panel on the right
Some changes to the city rankings
2019
Rank
2019
(mn)
2020
Rank
2020
(mn)
2025
Rank
2025
(mn)
Bangkok 1 22.9 1 13.2 1 25.7
Hong Kong 2 20.1 3 9.8 3 22.5
Macao 3 19.8 2 11.6 2 23.9
Dubai 4 16.3 4 9.5 4 19.5
London 5 14.2 7 8.5 5 15.5
New York 6 13.5 5 8.9 8 14.4
Paris 7 13.4 6 8.6 7 14.6
Singapore 8 11.8 8 7.5 6 15.1
Shenzhen 9 11.6 12 6.6 11 13.5
Tokyo 10 11.3 9 7.2 10 13.9
Rome 11 10.9 13 6.3 14 10.9
Kuala Lumpur 12 10.6 11 6.8 9 14.0
Shanghai 13 10.3 10 7.0 12 10.9
Barcelona 14 9.3 14 5.9 18 9.8
Osaka 15 9.1 17 5.2 17 9.9
Source: Tourism Economics Key:
Global city international visitor arrivals
Moved up rankings
relative to 2019
Moved down rankings
relative to 2019
Questions: Use the question panel on the right
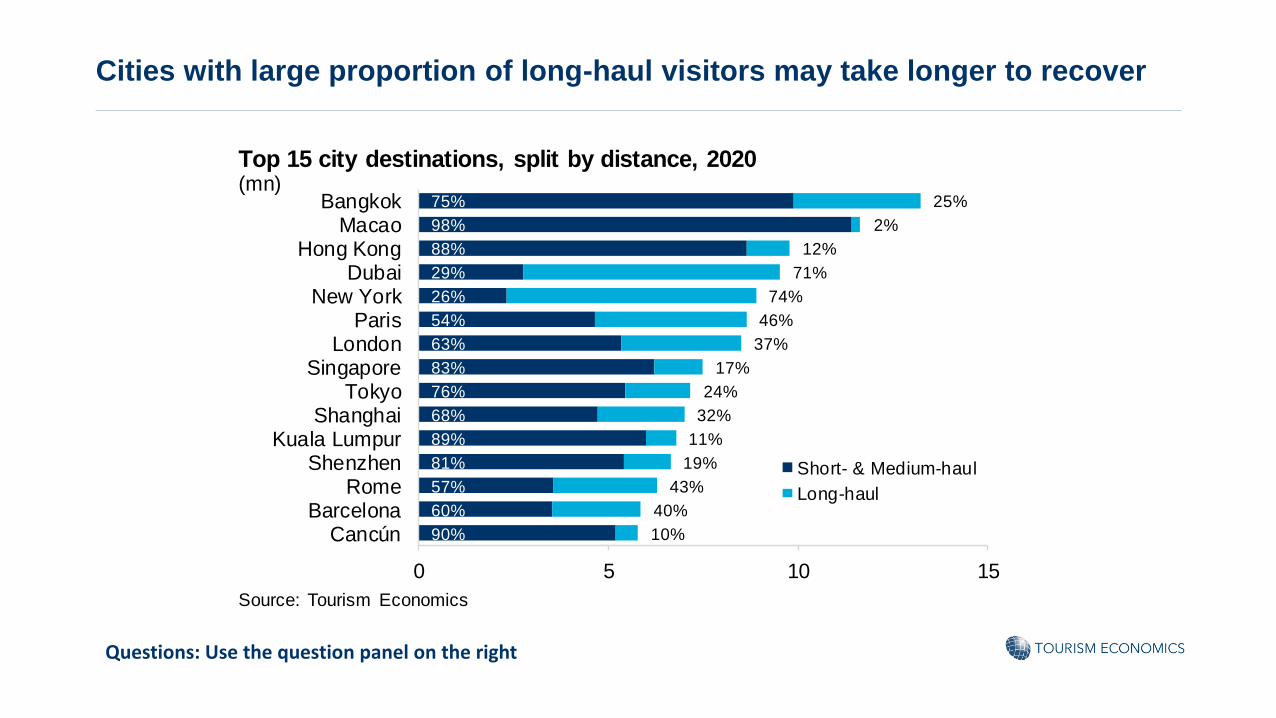
Cities with large proportion of long-haul visitors may take longer to recover
90%
60%
57%
81%
89%
68%
76%
83%
63%
54%
26%
29%
88%
98%
75%
10%
40%
43%
19%
11%
32%
24%
17%
37%
46%
74%
71%
12%
2%
25%
0 5 10 15
CancúnBarcelona
RomeShenzhen
Kuala LumpurShanghai
TokyoSingapore
LondonParis
New YorkDubai
Hong KongMacao
Bangkok
Short- & Medium-haul
Long-haul
Source: Tourism Economics
Top 15 city destinations, split by distance, 2020(mn)
Questions: Use the question panel on the right
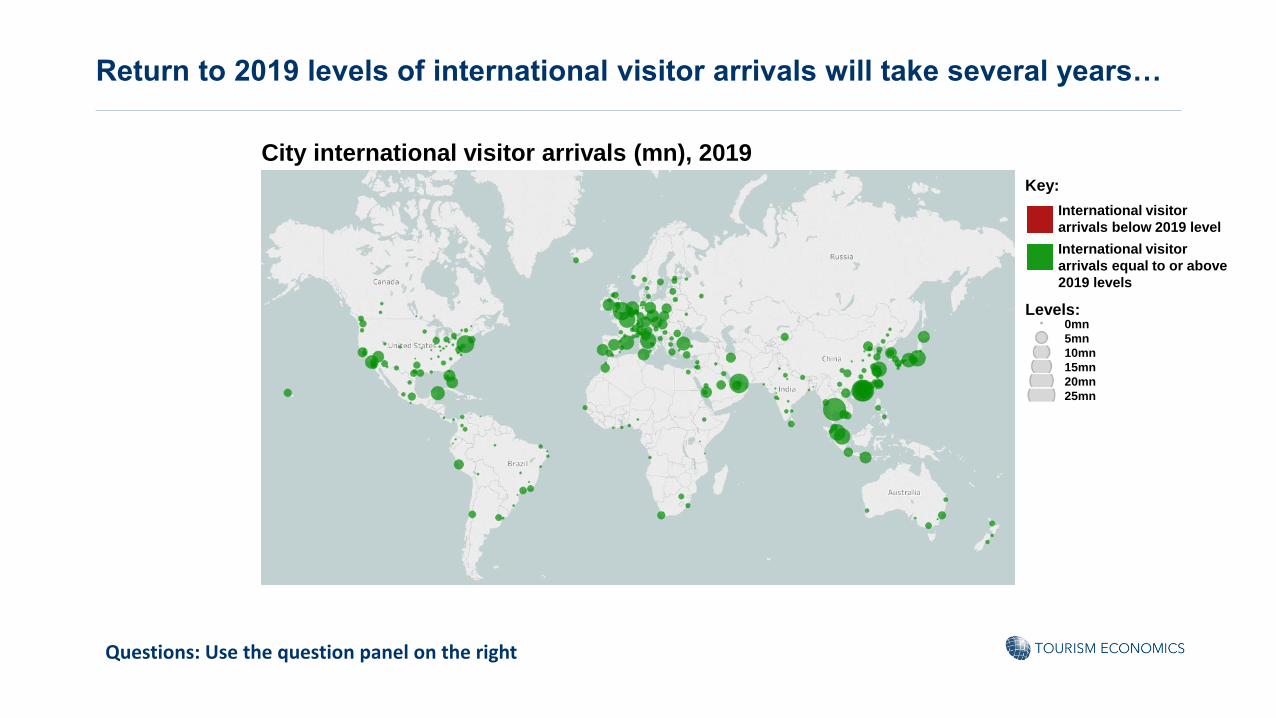
Return to 2019 levels of international visitor arrivals will take several years…
City international visitor arrivals (mn), 2019
Key:
International visitor
arrivals below 2019 level
International visitor
arrivals equal to or above
2019 levels
Levels:0mn
5mn
10mn
15mn
20mn
25mn

Questions: Use the question panel on the right
… declines in international arrivals are forecast for all cities in 2020…
City international visitor arrivals (mn), 2020
Key:
International visitor
arrivals below 2019 level
International visitor
arrivals equal to or above
2019 levels
Levels:0mn
5mn
10mn
15mn
20mn
25mn

Questions: Use the question panel on the right
…some recovery in 2021 but all cities will still remain below 2019 levels…
City international visitor arrivals (mn), 2021
Key:
International visitor
arrivals below 2019 level
International visitor
arrivals equal to or above
2019 levels
Levels:0mn
5mn
10mn
15mn
20mn
25mn

Questions: Use the question panel on the right
…it will take until 2022 before the first cities return to 2019 levels…
City international visitor arrivals (mn), 2022
Key:
International visitor
arrivals below 2019 level
International visitor
arrivals equal to or above
2019 levels
Levels:0mn
5mn
10mn
15mn
20mn
25mn

Questions: Use the question panel on the right
… and by 2023 most cities are expected to exceed 2019 levels…
City international visitor arrivals (mn), 2023
Key:
International visitor
arrivals below 2019 level
International visitor
arrivals equal to or above
2019 levels
Levels:0mn
5mn
10mn
15mn
20mn
25mn
Questions: Use the question panel on the right
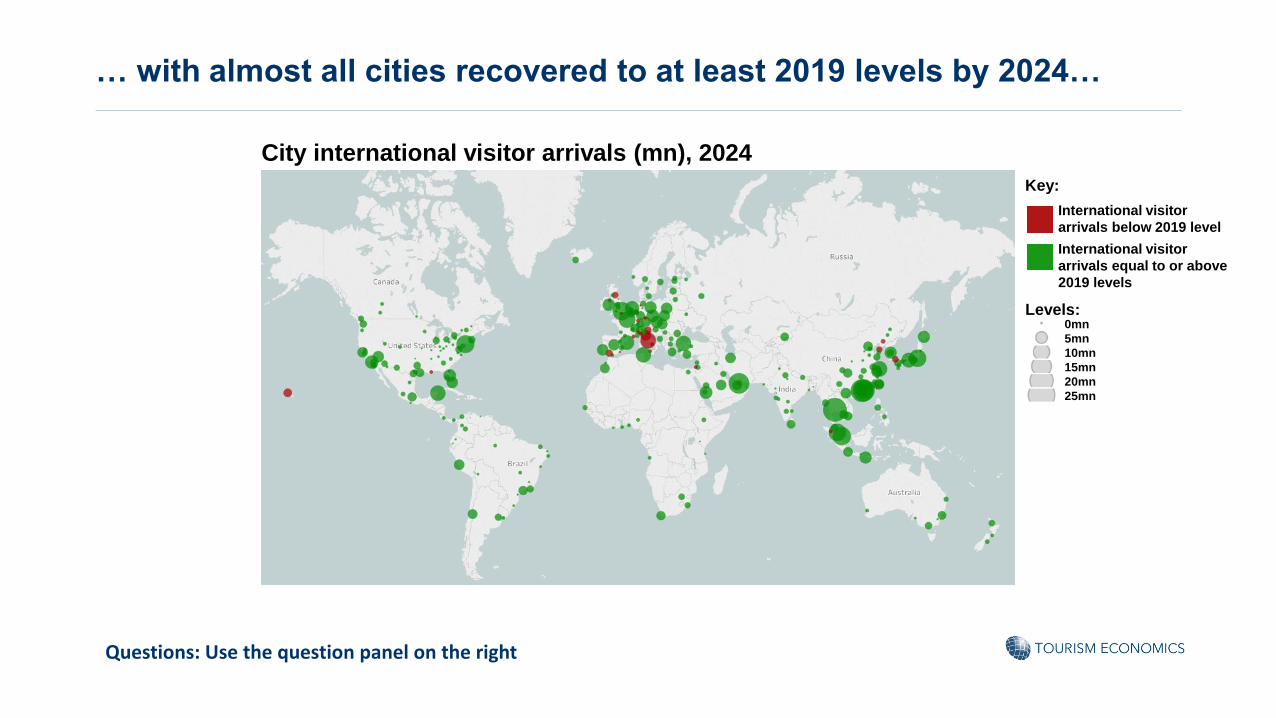
… with almost all cities recovered to at least 2019 levels by 2024…
City international visitor arrivals (mn), 2024
Key:
International visitor
arrivals below 2019 level
International visitor
arrivals equal to or above
2019 levels
Levels:0mn
5mn
10mn
15mn
20mn
25mn

Questions: Use the question panel on the right
… but by 2025, some Italian cities still remain below 2019 levels.
City international visitor arrivals (mn), 2025
Key:
International visitor
arrivals below 2019 level
International visitor
arrivals equal to or above
2019 levels
Levels:0mn
5mn
10mn
15mn
20mn
25mn

Questions: Use the question panel on the right
Domestic visitor arrivals will decline sharply in 2020
60%
49%
35%
73%
53%
90%
-400 -300 -200 -100 0
Latin America
Middle East & Africa
Europe
North America
Asia Pacific (exc. China)
China
International
Domestic
Source: Tourism Economics
Decline in city domestic visitor arrivals by region, 2019-2020(mn)
Domestic share of totalcity arrivals 2020
Questions: Use the question panel on the right
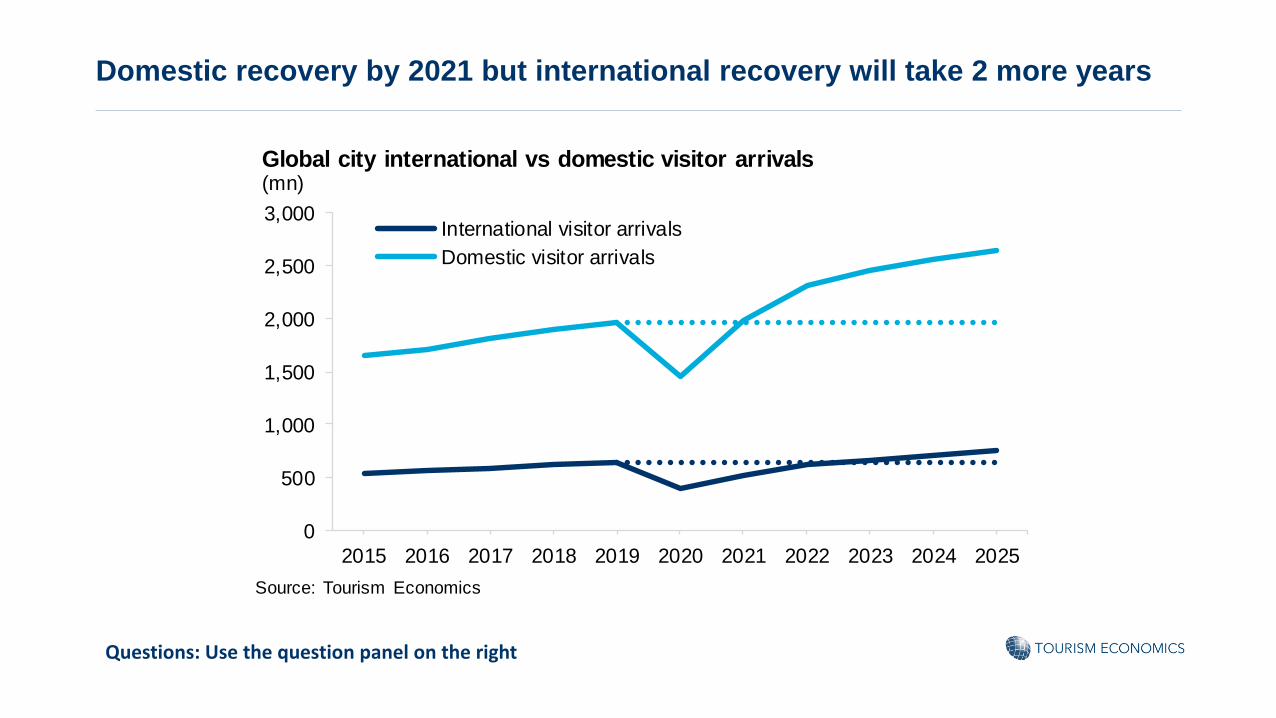
Domestic recovery by 2021 but international recovery will take 2 more years
0
500
1,000
1,500
2,000
2,500
3,000
2015 2016 2017 2018 2019 2020 2021 2022 2023 2024 2025
International visitor arrivals
Domestic visitor arrivals
Global city international vs domestic visitor arrivals(mn)
Source: Tourism Economics
Questions: Use the question panel on the right
Dubai
New York
London
Paris
Tokyo
Shanghai
Rome
Barcelona
Istanbul
Los AngelesOrlando
Miami
Cracow
San Francisco
Hangzhou
Jakarta
RiyadhCape Town
Abu Dhabi
0%
20%
40%
60%
80%
100%
0% 20% 40% 60% 80% 100%
Source: Tourism Economics
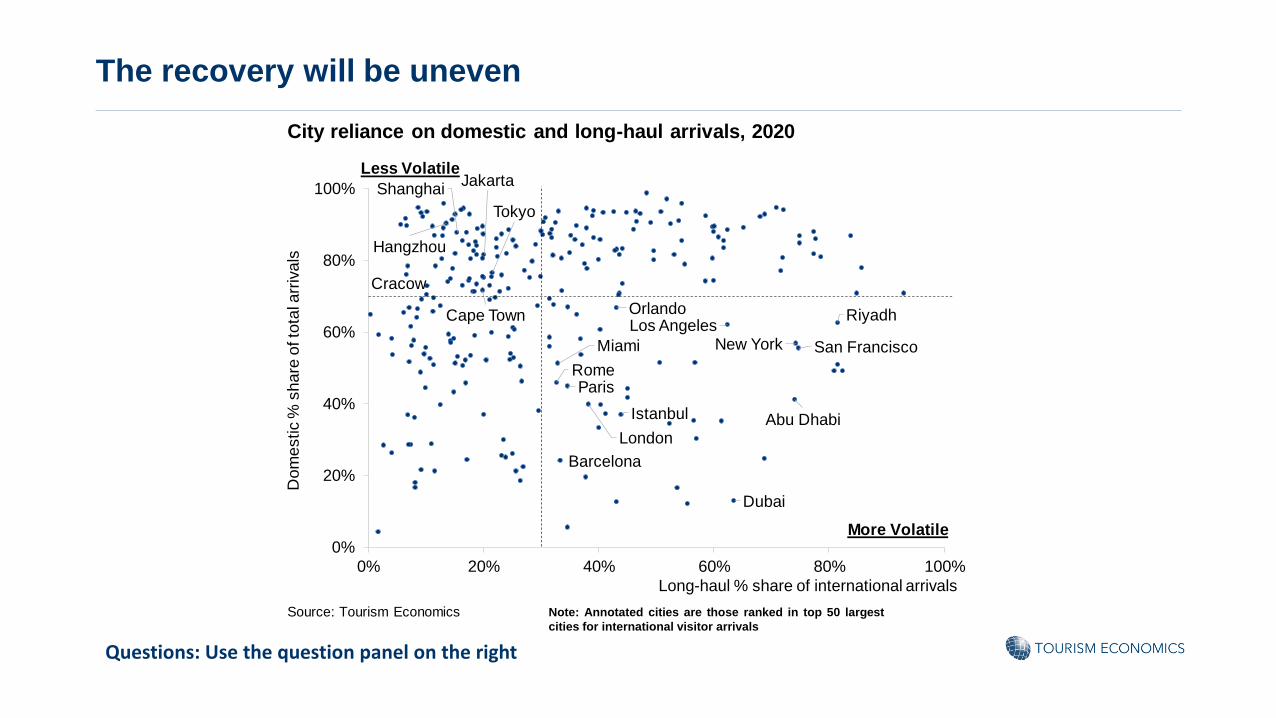
City reliance on domestic and long-haul arrivals, 2020
Long-haul % share of international arrivals
Do
me
stic %
sh
are
of to
tal a
rriv
als
More Volatile
Less Volatile
The recovery will be uneven
Note: Annotated cities are those ranked in top 50 largest
cities for international visitor arrivals

Questions: Use the question panel on the right Questions: Use the question panel on the right
We are looking to support you during these uncertain times with 3-month subscription access* to:
• Tourism Forecast Services
Including access to Global Travel Service (GTS) flows for 185 countries and Global City
Travel (GCT) data and forecasts for over 300 cities
• All of our Research Briefings
Receive all the latest research updates from Oxford Economics to monitor the global and
regional impact of the coronavirus, the implications for financial markets as well as all of our
current thematic research on global economic developments.
• Our Global Scenario Service
This service allows you to quantify the effects of the coronavirus spread on our baseline
forecasts for the 80 most important countries and compare this with our latest coronavirus
pandemic scenario as well as to other current global risk scenarios, such as US or world
recession.
If you would like to receive further information, please contact:
*a discounted fee structure applies

Global headquarters
Oxford Economics Ltd
Abbey House
121 St Aldates
Oxford, OX1 1HB
UK
Tel: +44 (0)1865 268900
London
Broadwall House
21 Broadwall
London, SE1 9PL
UK
Tel: +44 (0)203 910 8000
New York
5 Hanover Square, 8th Floor
New York, NY 10004
USA
Tel: +1 (646) 786 1879
Singapore
6 Battery Road
#38-05
Singapore 049909
Tel: +65 6850 0110
Offices in
Europe, Middle East
and Africa
Oxford
London
Belfast
Frankfurt
Paris
Milan
Cape Town
Dubai
Offices in
Americas
New York
Philadelphia
Mexico City
Boston
Chicago
Los Angeles
Toronto
San Francisco
Houston
Offices
Asia Pacific
Singapore
Sydney
Hong Kong
Tokyo
Email:
Website:www.oxfordeconomics.com