city union bank · company background city union bank (cubk) was established in 1904 as kumbakonam...
TRANSCRIPT

CITY UNION BANK
Initiating CoverageInitiating Coverage
CITY UNION BANK
:
High Potential “CUB”
BFSI
Price performance
Key drivers
Target Price:
CMPPotential Upside
MARKET DATA
No. of Shares
Market Cap
Free Float
Avg. daily vol (6mth)
52-w High / Low
Bloomberg
Promoter holding
FII / DII
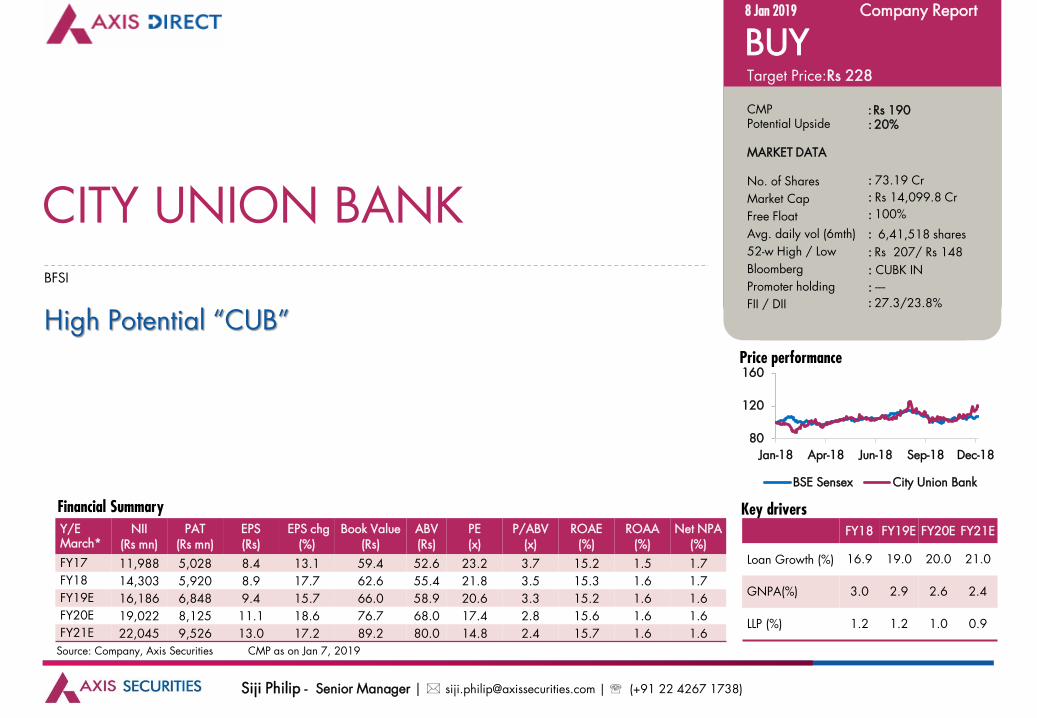
8 Jan 2019 Company Report
BUYRs 228
Rs 19020%
73.19 Cr
Rs 14,099.8 Cr
100%
6,41,518 shares
Rs 207/ Rs 148
----
27.3/23.8%
:
:
:
:
:
:
: CUBK IN
: :
CITY UNION BANK
FY18 FY19E FY20E FY21E
Loan Growth (%) 16.9 19.0 20.0 21.0
GNPA(%) 3.0 2.9 2.6 2.4
LLP (%) 1.2 1.2 1.0 0.9
Financial Summary
Source: Company, Axis Securities CMP as on Jan 7, 2019
Y/E March*
NII (Rs mn)
PAT (Rs mn)
EPS (Rs)
EPS chg(%)
Book Value(Rs)
ABV (Rs)
PE(x)
P/ABV(x)
ROAE (%)
ROAA (%)
Net NPA(%)
FY17 11,988 5,028 8.4 13.1 59.4 52.6 23.2 3.7 15.2 1.5 1.7
FY18 14,303 5,920 8.9 17.7 62.6 55.4 21.8 3.5 15.3 1.6 1.7
FY19E 16,186 6,848 9.4 15.7 66.0 58.9 20.6 3.3 15.2 1.6 1.6
FY20E 19,022 8,125 11.1 18.6 76.7 68.0 17.4 2.8 15.6 1.6 1.6
FY21E 22,045 9,526 13.0 17.2 89.2 80.0 14.8 2.4 15.7 1.6 1.6
Siji Philip - Senior Manager | [email protected] | (+91 22 4267 1738)
80
120
160
Jan-18 Apr-18 Jun-18 Sep-18 Dec-18
BSE Sensex City Union Bank

3
08 Jan 2019 Company Report
City Union Bank
Sector: BFSICity Union Bank : High Potential “CUB”
CUBK (City Union Bank) is a mid-sized private sector bank focused largely on working capital finance to smallmanufacturers and traders. Unchanged strategies and organisation focus, adequate capitalisation, and managementcontinuity are CUBK’s key strengths. It has delivered steady performance on account of its conservative management,unparalleled lending franchise, tight control on asset quality, superior return ratios across cycles, healthy NIMs and a wellcapitalised balance sheet. Improving loan growth, diversified revenue profile, controlled C-I and lower credit costs shouldaid RoAA of +1.55% over FY18-21E. Considering multiple levers, we assign 2.9x on FY21E ABV to arrive at target priceof Rs 228.
.MSME/Trader/Retail to drive loan
book growth
We expect high double digitgrowth in loan book overFY18-21E, largely driven byMSME/Trader/Retail
Focus on small-ticket solebanker business model,expertise in southern India’sniche business segments, vizMSME, traders and agriloans, and struggling healthof regional PSBs will drivehigher loan growth
Control over C-I to be maintained
Share of non-branch channelsin transactions is ~90%, whichis comparable with the bestnew generation private sectorbanks vis-à-vis ~60% a fewyears ago. This has been akey factor in sizing employeesper branch from ~9-9.5 a fewyears ago to ~8.5, currently.Further gains can be beneficialfor cost to income ratio (C-I)
With marginal moderation inNIM and controlled opex weexpect C-I to be in the rangeof ~40-42% over FY18-FY21E
Conservative approach to growth a key strength
CUBK has maintained its USPon product (working capitallending) and the customerbase (SME, traders,agriculture, etc) despite thelure to do something different,unlike other lenders
While increasing granularityto reduce concentration risk,the bank has ensured highercollateralisation to lower creditrisk too
Credit cost to decline with focus on lower slippages and recovery
The bank’s focus on small-ticket secured lending,working capital loans backedby adequate collateral restrictthe slippages of NPA and alsoimprove the NPA recoveries
With slippages normalizingand recoveries gainingtraction, we expect GNPA andLLP (Loan Loss Provisions) todecline by 60bps and 28bpsto 2.4% and 0.9% respectivelyover FY18-21E
ROAA profile to bemaintained at +1.55% levels

4
Company background
City Union Bank (CUBK) was established in 1904
as Kumbakonam Bank Ltd in Tamil Nadu and is amongst
India’s oldest private sector banks. It has evolved into a
strong regional player with major presence in South India,
with 544 branches out of which 418 are in Tamil Nadu.
CUBK has bancassurance tie-ups with LIC of India and
National Insurance Company Ltd for selling their insurance
products. It also has a tie-up with Exports Credit &
Guarantee Corporation Ltd for marketing export credit
insurance products through its branches. It is also in talks
for mutual fund tie up offerings.
The bank is primarily a working capital lender to MSME,
retail/wholesale trade and agricultural sectors. This
higher-yielding trade and MSME loans segment accounts
for ~51% of advances and has registered compounded
growth of 18.5% over FY11-FY18.
CUBK’s decades of experience in a single geographical
region has helped it gain immense knowledge and
understanding on the way local businesses are run. It has
withstood a number of business cycles during the course
of its existence.
Ownership Profile – Total Institution holding at ~51%
Loan Mix (%) - (Q2FY19)
17.4
14.9
33.8
9.0
6.5
18.5
Traders Agri MSME Gold Large corp Others
20.1
27.3
3.7
48.9
MFs FPIs FI/Banks Public & Others
Source: Company, Axis Securities
08 Jan 2019 Company Report
City Union Bank
Sector: BFSI

5
The bank has shown consistency in management withonly seven CEOs being appointed in its entire 114-yearhistory.
It was listed on the stock exchanges in 1998 under theleadership of its Chairman V Narayanan, who had tenureof 24 years at CUBK.
Experienced Management Team
Company Overview
Retired as CFO & ED of TCS in 2013 after 43 years of service
Well known in the Indian IT industry
S. MAHALINGAMChairman
Joined the bank as DGM in 2003 and has hands on experience of the overall operations of the bank
Serving as MD & CEO of the Bank from May 2011
Dr. N. KAMAKODIManaging Director & CEO
V. RAMESHCFO & GM
Joined CUBK in 1986, worked his way up to July 2015
CFO since July 2015
Name Year
S. Mahalinga Iyer 1926-1963
R. A. Venkataramani 1963-1969
O. R. Srinivasan 1969-1977
K. Srinivasan 1977-1980
V. Narayanan 1980-2004
S. Balasubramanian 2005-2011
Dr. N. Kamakodi 2011-Present
Source: Company, Axis Securities
08 Jan 2019 Company Report
City Union Bank
Sector: BFSI

6
Conservative and Consistent approach towards lending
Granular Loan Book
High collateralization -increases solvency
Niche focus maintained

7
Over FY03-13, CUBK delivered 29% CAGR in loansmaintaining ~60% average lending through workingcapital and the rest comprised term loans. Post a growthmoderation over the next couple of years due toslowdown in non core segments, loan growth gainedmomentum over FY15-FY18 registering 15% CAGR.
CUBK has focused on remaining the sole banker or part ofsmall group of banks (maybe 2-3 banks); maintaining low-ticket sizes; and increasing collateralisation in these loans.
Most lenders have changed their focus from either theproduct or the customer or both over the long periods oftheir history, due to challenges e.g. corporate. CUBK, onthe other hand, has maintained a disciplined and stableapproach to lending entailing focus on MSMEs and morespecifically on their working capital requirement.
Working capital loans yielding higher interest constitute66% of advances. Re-pricing is possible at short intervalsthus reducing interest rate risk. 95% of the loan book is onfloating rate basis which also reduces interest rate risk.
Niche focus maintained Loan Book – Product Composition
Specialist in working capital finance
64% 65% 65% 65% 66%
34% 33% 34% 34% 33%
2% 2% 1% 1% 1%
0%
20%
40%
60%
80%
100%
120%
FY14 FY15 FY16 FY17 FY18
Cash Credit & Demand Loans Term Loans Bills Purchased & Bills Discounted
66%
33%1%
Cash Credit & Demand Loans Term Loans Bills Purchased & Bills Discounted
Source: Company, Axis Securities
08 Jan 2019 Company Report
City Union Bank
Sector: BFSIConservative and Consistent approach towards lending

88
High collateralization - increases solvency Secured and Working Capital Loans (%)
Advances to major industries (FY18)
Industry Name Amt
(in mn) % of Total Advances
Advances to Major Industries 68,278 24%
All other advances 213,873 76%
Total Gross Advances 282,151 100%
58 62 63 64 66 66 66 66
97 97 97 97 98 98 98 98
FY1
1
FY1
2
FY1
3
FY1
4
FY1
5
FY1
6
FY1
7
FY1
8
W/C (%) Secured book (%)
Source: Company, Axis Securities
08 Jan 2019 Company Report
City Union Bank
Sector: BFSI
Secured loans comprised 98% of total loans as of FY18.This has provided it niche positioning, strong SMErelationships, and better customer acquisition throughreferrals, and has lowered credit risks.
CUBK has ensured higher collateralisation of loans evenas its growth has been to smaller MSME customerslowering concentration risks and granular loan book.
From FY10 to FY15, the mix of unrated exposure in totalexposure increased from 89% to 96%. However, theproportion of exposures attracting ‘less than 100% riskweight’ increased from 61% to 67% over the sameperiod, indicating that these exposures have highercollateral, therefore lowering overall credit risk. OverFY15-FY18, the mix of unrated exposure in total exposurehas remained at 96% while the ‘less than 100% riskweight’ has come down moderately from 67% to 63%,keeping credit risks at comfortable levels.
Advances to major industries constitute only 24% of itsloan book and 76% comprises of largely Trade, Services,Agri, Gold etc. CUBK uses its long standing relationships,its understanding of these clients and catering to specificcustomer needs to attract new clients.
Conservative and Consistent approach towards lending
9
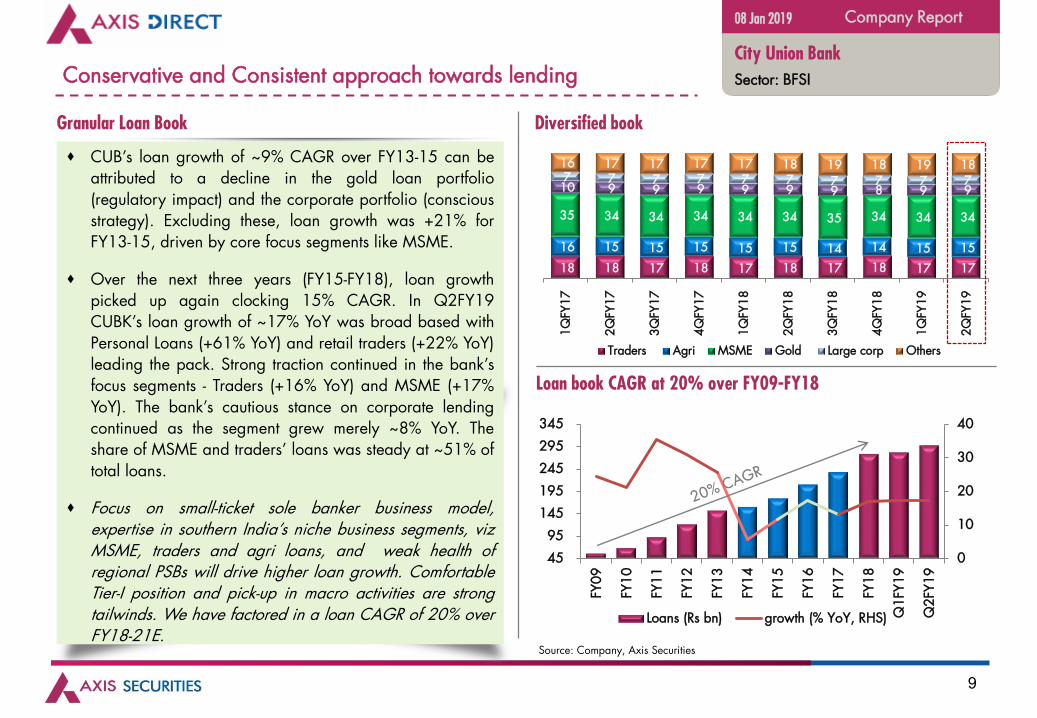
CUB’s loan growth of ~9% CAGR over FY13-15 can beattributed to a decline in the gold loan portfolio(regulatory impact) and the corporate portfolio (consciousstrategy). Excluding these, loan growth was +21% forFY13-15, driven by core focus segments like MSME.
Over the next three years (FY15-FY18), loan growthpicked up again clocking 15% CAGR. In Q2FY19CUBK’s loan growth of ~17% YoY was broad based withPersonal Loans (+61% YoY) and retail traders (+22% YoY)leading the pack. Strong traction continued in the bank’sfocus segments - Traders (+16% YoY) and MSME (+17%YoY). The bank’s cautious stance on corporate lendingcontinued as the segment grew merely ~8% YoY. Theshare of MSME and traders’ loans was steady at ~51% oftotal loans.
Focus on small-ticket sole banker business model,expertise in southern India’s niche business segments, vizMSME, traders and agri loans, and weak health ofregional PSBs will drive higher loan growth. ComfortableTier-I position and pick-up in macro activities are strongtailwinds. We have factored in a loan CAGR of 20% overFY18-21E.
Granular Loan Book Diversified book
Loan book CAGR at 20% over FY09-FY18
18 18 17 18 17 18 17 18 17 17
16 15 15 15 15 15 14 14 15 15
35 34 34 34 34 34 35 34 34 34
10 9 9 9 9 9 9 8 9 9 7 7 7 7 7 7 7 7 7 7
16 17 17 17 17 18 19 18 19 18
1Q
FY1
7
2Q
FY1
7
3Q
FY1
7
4Q
FY1
7
1Q
FY1
8
2Q
FY1
8
3Q
FY1
8
4Q
FY1
8
1Q
FY1
9
2Q
FY1
9
Traders Agri MSME Gold Large corp Others
Source: Company, Axis Securities
08 Jan 2019 Company Report
City Union Bank
Sector: BFSI
0
10
20
30
40
45
95
145
195
245
295
345
FY0
9
FY1
0
FY1
1
FY1
2
FY1
3
FY1
4
FY1
5
FY1
6
FY1
7
FY1
8
Q1
FY1
9
Q2
FY1
9
Loans (Rs bn) growth (% YoY, RHS)
Conservative and Consistent approach towards lending

10
Regional focus in MSME segment – Improved market share
Regional banks –preferred choice for
MSME
Credit growth in TN revives

11
Credit growth in Tamil Nadu for FY18 revived to 13% YoY; highest in past four yearsSource: Company, Axis Securities
08 Jan 2019 Company Report
City Union Bank
Sector: BFSIRegional focus in MSME segment – Improved market share
Credit growth in Tamil Nadu revives
(Rs bn) FY13 FY14 FY15 FY16 FY17 FY18
Branches 8,041 8,841 9,496 9,971 10,501 10,612
Growth (% YoY) 8.6 9.9 7.4 5 5.3 1.1
Deposits 4,446 5,082 5,441 5,968 6,651 7,177
Growth (% YoY) 3.6 14.3 7.1 9.7 11.4 7.9
Advances 5,335 6,056 6,499 6,828 6,955 7,847
Growth (% YoY) 18.8 13.5 7.3 5.1 1.9 12.8
Priority sector Advances 2,111 2,430 2,664 3,002 3,161 3,565
Growth (% YoY) 19.6 15.1 9.6 12.7 5.3 12.8
Agri 982 1,077 1,207 1,246 1,353 1,568
Growth (% YoY) 25.6 9.7 12.1 3.2 8.6 15.9
MSME 686 869 962 1,178 1,244 1,403
Growth (% YoY) 10.6 26.7 10.7 22.5 5.6 12.8
Housing 262 293 304 320 320 306
Growth (% YoY) 9.7 11.8 3.8 5.3-
-4.4
Others 181 191 191 258 244 288
Growth (% YoY) 45.7 5.5 - 35.1 -5.4 18
Non Priority Sector 3,225 3,626 3,835 3,826 3,794 4,282
Growth (% YoY) 18.2 12.4 5.8 -0.2 -0.8 12.9

12
CUBK’s advances portfolios based in home state stands at ~69% as at Sep’18. CUBK is amongst top-5 private banks in TamilNadu with market shares of ~3.4% (Q1FY19) vs. aggregate other private banks share at ~24%.Given the bank’s strategy todeepen presence in the state, CUB will gain market share from the weaker PSBs which have ~26% branch network share. Weexpect the bank’s understanding of local businesses, relationships and knowledge of the niche business segments in southern Indiato support this expansion.
MSME players suggest that regional banks are better placed than other financial intermediaries i.e. new private sector banks,public sector banks , NBFCs, MFIs and upcoming small banks, in their respective geographies. According to them, due topersonal attention to their needs, access to top management and quick turnaround time as compared to other large banks, firstchoice for banking will be regional banks in the respective home states.
Regional banks – preferred choice for MSME
CUBK State-wise branch network
Branch State Wise (%) FY15 FY16 FY17 FY18 Q2FY19
Tamil Nadu 68.2 68.4 68.9 69.2 68.9
Telengana 4.2 4.8 4.7 4.5 4.9
Seemandhra 7.6 7.2 6.9 6.5 6.4
Karnataka 5.5 5.3 5.5 6.0 5.9
Maharashtra 3.6 3.2 3.1 3.2 3.3
Kerala 3.2 2.9 2.9 2.7 2.6
Gujarat 1.9 2.1 2.0 1.8 1.8
Others 5.9 6.1 6.0 6.2 6.1
Source: Company, Axis Securities, RBI
08 Jan 2019 Company Report
City Union Bank
Sector: BFSIRegional focus in MSME segment – Improved market share

13
MSME Lending - Opportunities in India
MSME - the new lending sweet spot?
Private Banks improve market
share

14
As per the International Finance Corporation, the totalfinancing demand of Indian MSME sector is Rs 32.5trillion (Source: KPMG). As on March 18, the total on-balance sheet commercial lending stood at Rs 54.2trillion with MSME segments constituting 23% - Rs 12.6trillion.
Private Banks and NBFCs have increased their marketshare in Micro and SME lending from 27.5% and 9.1%in March 2017 to 30.3% and 10.9% in March 2018.Share of PSBs has fallen from 57% to 50.4% in the sameperiod.
Large Banks hesitate to grant loans due to high-riskperception from lack of financial transparency, highadministrative costs of small-scale lending, and lack ofcollateral. Another reason is high mortality rates ofMSMEs—financial institutions are doubtful about theirsurvival and growth and, therefore, under-financinghappens. With this regard, specialist players like CUBKwith their understanding of local businesses are on strongfooting. Also, the advent of GST will help MSME toimprove systemic data.
14
NPA (%) in MSME higher in PSBs
Credit to MSME improving yet gap to overall demand remains
Source: Company, Axis Securities
08 Jan 2019 Company Report
City Union Bank
Sector: BFSI
Source: MSME Pulse Report
0
5
10
15
Mar-1
5
May-
15
Jul-1
5
Sep
-15
Nov-
15
Jan-
16
Mar-1
6
May-
16
Jul-1
6
Sep
-16
Nov-
16
Jan-
17
Mar-1
7
May-
17
Jul-1
7
Sep
-17
Nov-
17
Jan-
18
Mar-1
8
MSME Private sector NPA MSME PSBs NPA
13.1
2.7
18.019.020.021.022.023.024.0
0
20
40
60
Mar-1
6
May-
16
Jul-1
6
Sep
-16
Nov-
16
Jan-
17
Mar-1
7
May-
17
Jul-1
7
Sep
-17
Nov-
17
Jan-
18
Mar-1
8
MSME (in trn) Total Commercial Credit (in trn) MSME % Share
Private Banks improve market share
MSME Lending - Opportunities in India

1515
Employment - MSME sector
MSME GDP contribution in India low
Source: Company, Axis Securities
08 Jan 2019 Company Report
City Union Bank
Sector: BFSI
62
21
80
23
70 74 78
52 53
0
30
60
90
Ger
many
India
Italy
Russ
ia
Sin
gapore
Sout
h A
fric
a
Taiw
an
UK
US
MSME - Employment (%)
Bank credit to MSMEs as a percentage of GDP in India isaround 8%— far less compared to developed economieswhere it stands at +50% of GDP.
MSME’s contribute significantly to employment,entrepreneurship and growth in the economy. Theyremain, by their predominantly informal nature, vulnerableto structural and cyclical shocks, at times with persistenteffects. So local lending knowledge helps.
Banks need to look at new segments that can drive growththe same way retail did in the past. The MSME sector,which is the second largest employer after agriculture, isemerging as a lending sweet spot.
CUBK’s management stated that they are gradually seeingtheir MSME customers trying to add capacity or increasetheir scale of business. Also, some customers aremigrating from PCA banks or larger banks where theirrequirements are not fulfilled.
MSME – new lending sweet spot?
MSME Lending - Opportunities in India
54
8
68
3550 57
85
50 48
020406080
100
Ger
many
India
Italy
Russ
ia
Sin
gapore
Sout
h A
fric
a
Taiw
an
UK
US
MSME - GDP Contibution (%)

16
CASA aligns to business model
CASA to remain in moderate range
17
CASA aligns to business model
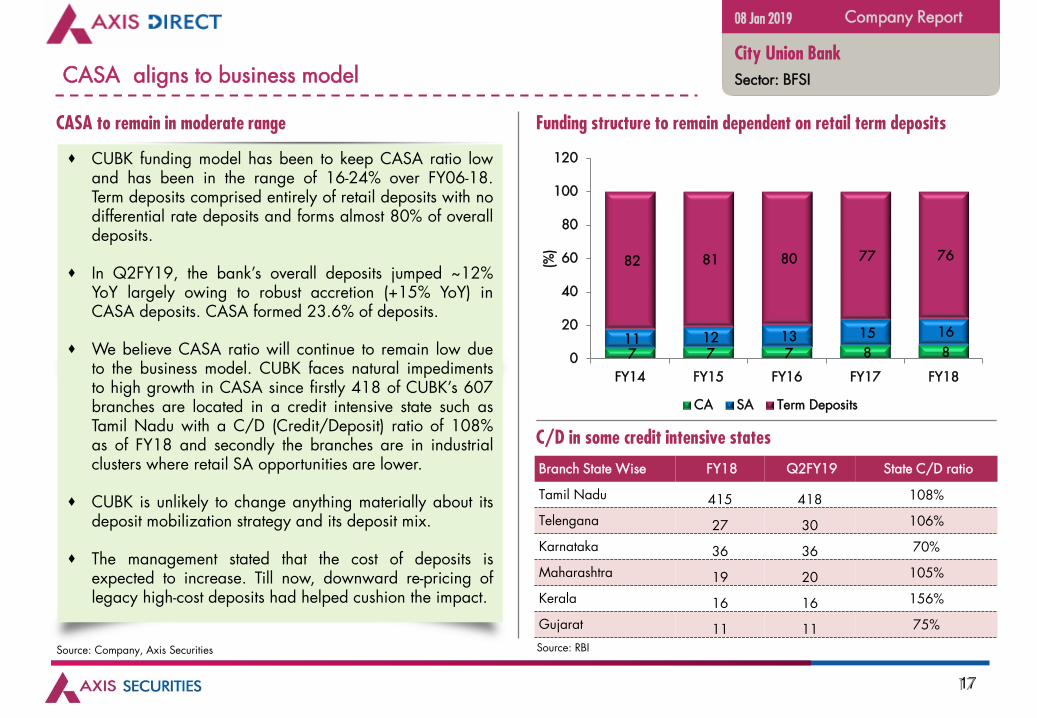
CUBK funding model has been to keep CASA ratio lowand has been in the range of 16-24% over FY06-18.Term deposits comprised entirely of retail deposits with nodifferential rate deposits and forms almost 80% of overalldeposits.
In Q2FY19, the bank’s overall deposits jumped ~12%YoY largely owing to robust accretion (+15% YoY) inCASA deposits. CASA formed 23.6% of deposits.
We believe CASA ratio will continue to remain low dueto the business model. CUBK faces natural impedimentsto high growth in CASA since firstly 418 of CUBK’s 607branches are located in a credit intensive state such asTamil Nadu with a C/D (Credit/Deposit) ratio of 108%as of FY18 and secondly the branches are in industrialclusters where retail SA opportunities are lower.
CUBK is unlikely to change anything materially about itsdeposit mobilization strategy and its deposit mix.
The management stated that the cost of deposits isexpected to increase. Till now, downward re-pricing oflegacy high-cost deposits had helped cushion the impact.
17
C/D in some credit intensive states
Funding structure to remain dependent on retail term deposits
7 7 7 8 8 11 12 13 15 16
82 81 80 77 76
0
20
40
60
80
100
120
FY14 FY15 FY16 FY17 FY18
(%)
CA SA Term Deposits
Branch State Wise FY18 Q2FY19 State C/D ratio
Tamil Nadu 415 418 108%
Telengana 27 30 106%
Karnataka 36 36 70%
Maharashtra 19 20 105%
Kerala 16 16 156%
Gujarat 11 11 75%
Source: Company, Axis Securities
08 Jan 2019 Company Report
City Union Bank
Sector: BFSI
Source: RBI
CASA to remain in moderate range

18
Steady NIM
Non-interest income sustains
NIM maintained across cycles

19
Steady NIMs
CUBK has maintained its NIMs at +3%. Over FY15-FY18, NIM has gradually increased from 3.34% to 4.16% led bylower slippage rates and decline in cost of funds. In the first half of FY19, after a 12bps compression in Q1, CUBK’sNIM bounced back to 4.32%, led by drop in CoF, as the term deposits were repriced at lower rates coupled withsteady yields and rise in the C-D ratio.
CUBK’s focus on the MSME and trader segments results in customer loyalty and will continue to yield pricing power.However, we expect marginal pressure on yields which coupled with bottoming out of cost of funds will moderateNIMs. Additionally, with 66% of the book consisting of high yielding working capital loans, and 95% linked tofloating rates the drop in NIMs will be gradual. Despite conservative management guidance, we have maintained ourNIM assumptions at ~3.8-4% over FY19-21E.
NIMs maintained across cycles
NIMs at +3% maintained
Source: Company, Axis Securities
08 Jan 2019 Company Report
City Union Bank
Sector: BFSI
0.0
10.0
20.0
30.0
40.0
50.0
60.0
0.0
1.0
2.0
3.0
4.0
5.0
FY07 FY08 FY09 FY10 FY11 FY12 FY13 FY14 FY15 FY16 FY17 FY18
NIM (LHS) NII growth (RHS)

20
Steady NIMs
Contribution from non-interest income to overall income has largely sustained at ~27-33%. The bank has alsoexpanded its fee-based offerings to include slightly more sophisticated cash management and transaction bankingofferings, which may improve fee income.
We expect growth in non interest income to follow the bank’s credit growth trends.
08-01-2019
Non interest income sustains
Non interest income ~1/3rd of Total Income
140 175
333259
303345
414 401 430 446 439495
34124
381 394
66 78171
228
603
453
1,078
938
24.4
31.1 33.8 34.0
27.3 29.3 30.5
26.9
33.4
29.5 28.8 27.1
0
5
10
15
20
25
30
35
40
0
200
400
600
800
1,000
1,200
FY07 FY08 FY09 FY10 FY11 FY12 FY13 FY14 FY15 FY16 FY17 FY18
Fee income Treasury income Other income (% to Total income)
08 Jan 2019 Company Report
City Union Bank
Sector: BFSI

21
C-I : Operating leverage to sustain
Opex additions streamlined
Digital push lowers TAT

22
C- I : Operating leverage to sustain
During FY12-15, the bank doubled its network to 475 branches and the employee base 1.5x to ~4,300. This resultedin higher opex CAGR (+23%, driven by 20% CAGR rise in staff cost).With ~70% of the branches in rural and semi-urban regions, the bank had relatively higher break-even period.
CUBK undertook focused effort to increase penetration of its internet and mobile banking applications. It was alsodiligent in making use of the RBI incentive to install cash recyclers across branches. This freed up branch staff, enablingmigration of ~80% of cash receipts to machines. As a result, CUBK was incrementally able to opt for smaller brancheswith lower rent, fewer employees per branch and faster branch breakeven.
The decline in C-I or cost/income ratio over FY15-18 has been 468bps, with the exit C-I ratio in FY18 being 40.4%.This sharp decline was the outcome of slowdown in branch and employee addition, improving productivity anddevelopment of alternate delivery channels.
Slowdown in Branch/Employee additions coupled with digital push improved C-I
26
5
30
0
28
1
17
6
20
8
51
1
43
8
43
0
14
6
15
6
17
2
63
0
19
19
27
15
24
54
75
50
50
50
25
50
35.0
40.0
45.0
50.0
0
100
200
300
400
500
600
700
FY07 FY08 FY09 FY10 FY11 FY12 FY13 FY14 FY15 FY16 FY17 FY18
Employee additions Branch additions C/I (%, RHS)
Source: Company, Axis Securities
08 Jan 2019 Company Report
City Union Bank
Sector: BFSI
Opex additions streamlined

23
C- I : Operating leverage to sustain
In terms of the number of transactions, the bank’s non-branch channels have a share close to 90%, i.e., at similar levelsto new generation banks. It is this digital strategy traction that has aided in the employees per branch metric to declinefrom ~9-9.5 to ~8.5 in the last few years.
The bank wants to add value through the digital route and are following a combination approach in which datacollection and analysis is automated, while the final decision is manual. Their credit disbursal technology is able tocarry out automatic credit appraisal for ticket sizes up to Rs1.5-2mn. The advent of GST will help in creating data onwhich better analytics and sourcing can be based. Turn around time (TAT) has reduced and in some cases the reductionhas been from 60mins to 15mins.
Management expects trendline medium term C-I ratio to remain in the range of 40-42% barring impact from fluctuationin other income. After the cyber fraud which took place through SWIFT (in CUBK), the management stated that theywere able to restrict the damage and have subsequently added multiple levels of security.
Branch and employee efficiency on the up Productivity have improved significantly
08 Jan 2019 Company Report
City Union Bank
Sector: BFSI
0.0
0.2
0.4
0.6
0.8
1.0
1.2
1.4
0
20
40
60
80
100
120
140
Mar-15 Mar-16 Mar-17 Mar-18 Sep-18
Business per Employee (in mn) Profit per Employee (in mn)
Digital push lowers TAT
0
50
100
150
200
0
500
1,000
1,500
FY0
7
FY0
8
FY0
9
FY1
0
FY1
1
FY1
2
FY1
3
FY1
4
FY1
5
FY1
6
FY1
7
FY1
8
FY1
9E
FY2
0E
FY2
1E
Business per branch (mn) Business per employee (mn)

24
On the mend - Asset Quality
Asset quality to improveRestructured
pool consistently coming down
Concerns on asset quality addressed

25
On the mend – Asset quality
CUBK has had an adverse asset quality experience given an increase in GNPAs from 1.86% in FY15 to 3% in FY18. Theincrease was accompanied by higher write-offs, but for which headline GNPAs would have been higher. Delinquency ratioincreased to 2.9% in FY14 and declined thereafter to 2.2% as of FY18. CUBK benefited from not having a large number ofconsortium-based exposures or large term lending versus mid-sized and larger peers. Despite this, stress did emerge in iron andsteel, power, textiles, and sugar, etc.
The bank’s underwriting practices, strong relationships and expected tailwinds of improving macros give us confidence that theworst of stressed asset additions is behind. We expect asset quality to stabilise given the unlikely occurrence of high slippagesfrom the iron and steel industry, as ~60%+ of the exposure is impaired, a low Restructured pool of 1.3% and no majorexposure to large leveraged corporates.
Stressed asset additions come down Loan loss provisions (LLP) as % to average loans
0.0
0.5
1.0
1.5
2.0
2.5
3.0
3.5
0.0
0.5
1.0
1.5
2.0
2.5
3.0
3.5
FY0
7
FY0
8
FY0
9
FY1
0
FY1
1
FY1
2
FY1
3
FY1
4
FY1
5
FY1
6
FY1
7
FY1
8
GNPA % NNPA % Slippages % (RHS)
0.7 0.7 0.7 0.8 0.8
0.5 0.7
0.9 1.0 1.1 1.1 1.2
0.0
0.2
0.4
0.6
0.8
1.0
1.2
1.4
FY0
7
FY0
8
FY0
9
FY1
0
FY1
1
FY1
2
FY1
3
FY1
4
FY1
5
FY1
6
FY1
7
FY1
8
LLP % loans
Source: Company, Axis Securities
08 Jan 2019 Company Report
City Union Bank
Sector: BFSI
Asset quality to improve

26
On the mend – Asset quality
In Q2FY19, CUBK’s net stressed book (restructured + NNPAs) was stable QoQ at 1.71% and down 10bps YoY.GNPAs were flat QoQ at Rs 8.5bn (2.85%) with lower slippages at Rs 1.36bn (1.88% ann. vs. 1.78% QoQ and2.4% YoY). Only 2 accounts above Rs 100mn (Steel trading and oil trading co) slipped in Q2. The aggregaterecoveries/upgrades jumped 48% YoY to Rs 685mn (+7% QoQ) as collateral realization improved. The write offswere higher at Rs 736mn vs. Rs 690mn QoQ. The management has cautioned on a single exposure in the Papersector (Rs 800-850mn). However, they maintained their slippage guidance of 1.75-2% for FY19. For FY19 ourslippage assumptions are ~1.9% and is expected to taper off over FY20-21E.
Restructured book at an all-time low
0.0
0.2
0.4
0.6
0.8
1.0
1.2
1.4
1.6
1.8
0.0
0.5
1.0
1.5
2.0
2.5
3.0
3.5
1Q
FY15
2Q
FY15
3Q
FY15
4Q
FY15
1Q
FY16
2Q
FY16
3Q
FY16
4Q
FY16
1Q
FY17
2Q
FY17
3Q
FY17
4Q
FY17
1Q
FY18
2Q
FY18
3Q
FY18
4Q
FY18
1Q
FY19
2Q
FY19
Restructured loans (Rs bn) % of Loans RHS
Source: Company, Axis Securities
08 Jan 2019 Company Report
City Union Bank
Sector: BFSI
Restructured pool consistently coming down

27
On the mend – Asset quality
There have been 2 relatively large accounts (of exposure greater than Rs 500mn) that have been under stress. One is
from the paper sector (underlying asset is paper mill) and another is an education institution.
On the educational institution account with an exposure of Rs650-700mn, some properties were sold leading to that
account coming out of stress.
On the paper asset exposure of Rs800-850mn, the management stated that the working capital gap on the paper asset
amounts to Rs400-450mn. Overall, the management is still hopeful on the account.
Even if the large paper account slips, the banks re-iterates its full year FY19 slippage ratio of 1.75-2%.
CUBK does not have any direct exposure to IL&FS group or other NBFCs.
We estimate overall stress levels to come off as improvement in credit growth, lack of consortium level challenges, and
adequate control over own smaller-ticket accounts allow CUBK to stem the flow of NPAs or recover outstanding debt. In
terms of concentration risk, as highlighted earlier, CUBK is well placed with respect to peers. The proportion of top four
NPA accounts or top twenty loan accounts is low at 0.41% and 6.87% respectively.
08 Jan 2019 Company Report
City Union Bank
Sector: BFSI
Concerns on asset quality addressed

28
Return ratios comfortable
ROAE at +15% over last 3 years
ROAA at +1.5%, best amongst peers

29
Return ratios comfortable
Capital raising history
Date Capital raised
(Rs Mn)Issue px Reason
29/3/2007 202 16.9 Preferential issue
08/10/2007 304 16.9 Preferential issue
08/10/2007 950 19.0 Preferential issue
29/12/2009 480 6.0 Rights Issue (1:4)
11/01/2013 2,580 20.0 Right Issue (1:4)
22/07/2014 3,500 75.1 QIP
Source: Company, Axis Securities
08 Jan 2019 Company Report
City Union Bank
Sector: BFSI
1.3
1.4
1.5
1.6
1.7
1.8
0.0
5.0
10.0
15.0
20.0
25.0
30.0
FY0
7
FY0
8
FY0
9
FY1
0
FY1
1
FY1
2
FY1
3
FY1
4
FY1
5
FY1
6
FY1
7
FY1
8
ROAE Tier 1 ROAA
CUBK’s ROAE averaged +20% over FY03-13.
However, after FY14, ROAE declined and is
currently at 15.3%. The decline was attributable to
drop in ROAA; slowdown in loan growth and
decline in leverage due to capital raising. At
15.6% Tier 1 ratio, CUBK has adequate capital
cushion, which needs to be deployed to improve
return ratios. Any adverse risks notwithstanding, we
believe capital is sufficient for next couple of years.
ROAA has been largely consistent at +1.5%
(except FY14 – 1.4%) over FY07-FY18 and is the
best among peers.
While management is fairly risk averse currently, a
change in the operating environment would give it
confidence to grow its loan portfolio faster which
will be positive for the stock.
Adequate capital cushion ROAE at 15% over last 3 years

30
CUBK’s Operational Performance
Lower LLP to aid earnings …
Stable loan growth… Improved Asset
quality …ROAA sustained

31
We expect loan CAGR of 20% over FY18-FY21E led bygrowth in MSME, Traders following favourable domesticfactors and increase in market share.
Spread could moderate over the next couple of years withbottoming of cost of funds. NIMs could be in the range of3.8-4%. LLP is expected to taper down to >1% overFY18-FY21E on lower stressed additions. This will translateinto 16/12/17% CAGR in NII/PPOP/PAT over FY18-21E.
NIM to be at +3.5% Lower LLP to aid earnings
Stable loan growth, lower LLP to aid earnings … Overall loan growth to be led by MSME
8.1 7.6
6.8
6.0 6.1 6.3
6.5
12.7 12.1
11.5
11.0 10.9 11.0 11.1 3.3 3.6 3.9
4.2 4.0 4.0 3.8
2.0
2.5
3.0
3.5
4.0
4.5
5.0
7.0
9.0
11.0
13.0
15.0
FY15 FY16 FY17 FY18 FY19E FY20E FY21E
(%)
(%)
Cost of funds Yield of funds NIM (RHS)
0.0
0.2
0.4
0.6
0.8
1.0
1.2
1.4
0
5
10
15
20
25
FY15 FY16 FY17 FY18 FY19E FY20E FY21E
NII (Rs bn) PAT (Rs bn) LLP (%)
Source: Company, Axis Securities
08 Jan 2019 Company Report
City Union Bank
Sector: BFSICUBK’s Operational Performance
0
10
20
30
40
0
100
200
300
400
500
600
FY1
1
FY1
2
FY1
3
FY1
4
FY1
5
FY1
6
FY1
7
FY1
8
FY1
9E
FY2
0E
FY2
1E
Loans (Rs bn, LHS) growth (%)

32
Worst in terms of asset quality could be over byQ3/Q4FY19 and we expect GNPA/NNPA to come downgradually over FY19-21E. Lower exposures to stressedsegments will reduce the probability of future unexpectedsurprises.
Improvement in business growth, cost efficiencies andlower provisioning requirements are expected to sustainRoAA at +1.55% over FY18-21E.
Asset quality to improve ROAA at +1.5%
Improved Asset quality, ROAA sustained… C-I to be in control
45
41
44
40
42
41 40
2.0
1.9
2.1 2.0
2.0
1.9
1.8
1.5
1.6
1.7
1.8
1.9
2.0
2.1
36
38
40
42
44
46
FY15 FY16 FY17 FY18 FY19E FY20E FY21E
(%)
(%)
C-I (LHS) C-AA
Source: Company, Axis Securities
08 Jan 2019 Company Report
City Union Bank
Sector: BFSICUBK’s Operational Performance
16.7
15.5
15.2 15.3
15.2
15.6 15.7
1.49 1.50
1.51
1.57 1.58 1.59
1.55
1.5
1.5
1.6
1.6
14.5
15.0
15.5
16.0
16.5
17.0
FY15 FY16 FY17 FY18 FY19E FY20E FY21E
ROAE (%) ROAA (%)
1.9
2.4
2.8 3.0
2.9 2.6
2.4
1.3 1.5
1.7 1.7 1.6 1.6 1.6
0.0
0.5
1.0
1.5
2.0
2.5
3.0
3.5
FY1
5
FY1
6
FY1
7
FY1
8
FY1
9E
FY2
0E
FY2
1E
GNPA % NNPA %

33
Outlook &Valuation
Asset quality and growth issues are being addressed gradually. CUBK will benefit from its increasing loan book led by
better traction in MSME/Trader/Retail segments. Its focus on small-ticket secured lending has helped to maintain sound
asset quality in the past few years despite the industry being under severe asset quality stress. Its focus on lower
slippages through better NPA management (99% of its loan book is secured) and higher recovery will lead to declining
credit cost over next couple of years. We believe that with gradual improvement in the macros, a well-capitalised
balance sheet and weak position of regional PSBs, CUBK is well placed to step on the growth pedal.
We forecast 17% earnings CAGR over FY18-21E. The bank will continue with its higher return profile, with RoAA &
RoAE at ~1.6% and +15% over FY18-FY21E.
CUBK, over last few years, has witnessed relatively better and stable valuations owing to consistent return profile vis-à-
vis midsized private bank peers. We believe, CUB with superior NIM, best return profile, grip on asset quality with
greater bottom-line visibility over the medium term should continue to fetch higher multiple. Initiate BUY with a
Target Price of Rs 228/sh (2.9x FY21E ABV ).
Source: Company, Axis Securities
08 Jan 2019 Company Report
City Union Bank
Sector: BFSI
1.4
1.5
1.6
1.7
1.8
(6.0) (4.0) (2.0)
- 2.0 4.0 6.0
FY0
7
FY0
8
FY0
9
FY1
0
FY1
1
FY1
2
FY1
3
FY1
4
FY1
5
FY1
6
FY1
7
FY1
8
FY1
9E
FY2
0E
FY2
1E
NII Other income Operating Cost Provisions Tax ROAA (RHS)

34
Peer Comparison & Key Risks
Regional concentration: While asset quality risks havebeen low, a sudden shock in any of the southern states,especially TN could result in an increase in GNPAs.Further, dominant southern focus limits growthopportunities as well.
Asset quality deterioration: CUBK has managed itsasset quality quite well given the stress faced by theother such banks. However, any deterioration in theasset quality may affect profitability of the companygoing forward.
Source: Company, Axis Securities
Key Risks & ConcernsP/ABV SD Chart
Peer Comparison (In mn)
Company Mcap PATGNPA
(%)ROA (%)
ROE(%)
BVPS P/BV
City Union Bank 142,425 5,920 3.0 1.6 15.3 62.6 3.0
South Indian Bank 28,141 3,345 3.6 0.4 7.0 27.7 0.6
Federal Bank 184,772 8,791 3.0 0.8 8.3 63.2 1.5
DCB Bank 52,164 2,456 1.8 0.9 10.9 86.6 2.0
Karur Vysya Bank 71,138 3,454 6.6 0.5 6.1 79.3 1.1
08 Jan 2019 Company Report
City Union Bank
Sector: BFSI
0
50
100
150
200
250
Mar-1
4
Jul-1
4
Nov-
14
Mar-1
5
Jul-1
5
Nov-
15
Mar-1
6
Jul-1
6
Nov-
16
Mar-1
7
Jul-1
7
Nov-
17
Mar-1
8
Jul-1
8
Nov-
18
Price 1x 1.5x 2x 2.5x 3x

35
Financials
Income Statement (Rs mn) Balance Sheet (Rs mn)
Source: Company, Axis Securities
Particulars FY17 FY18 FY19E FY20E FY21E
Interest Earned 31,738 34,024 39,084 47,019 56,970
Interest Expended 19,750 19,721 22,898 27,997 34,925
Net Interest Income 11,988 14,303 16,186 19,022 22,045
Other Income 4,839 5,321 5,197 5,430 5,778
Fee Income (CEB) 439 495 567 656 791
Treasury Income 1,078 938 1,200 975 825
Total Income 16,827 19,624 21,383 24,452 27,823
Total Operating Exp 6,890 7,546 8,453 9,530 10,812
Employee Expense 2,981 3,159 3,617 3,973 4,469
PPOP 9,937 12,078 12,930 14,922 17,011
Provisions & Contingencies 3,010 4,178 3,754 3,813 4,083
Prov. for NPAs (incl. stand. prov)
2,595 3,180 3,754 3,813 4,083
PBT 6,928 7,900 9,176 11,109 12,928
Provision for Tax 1,900 1,980 2,327 2,984 3,402
PAT 5,028 5,920 6,848 8,125 9,526
Particulars FY17 FY18 FY19E FY20E FY21E
Sources of Funds
Share Capital 601 665 732 732 732
Reserves 35,101 40,968 47,570 55,404 64,588
Shareholder's Funds 35,702 41,632 48,302 56,135 65,320
Savings 46,297 51,705 61,615 72,990 86,024
Current 24,092 27,862 25,602 28,536 31,644
Term Deposit 230,768 248,959 307,364 370,286 452,548
Total Deposits 301,157 328,526 394,581 471,812 570,216
Borrowings 5,310 17,359 9,704 13,817 17,193
Other Liabilities & Provisions
10,538 11,855 13,814 15,844 18,259
Total Liabilities 352,708 399,372 466,401 557,608 670,989
Application of Funds
Cash & Bank Balance 28,790 26,364 29,343 35,343 41,448
Investments 70,315 78,791 87,527 104,401 125,854
G-Secs 66,906 76,344 84,835 101,440 122,597
Advances 238,327 278,528 331,448 397,738 481,263
Fixed Assets 2,151 2,231 2,343 2,460 2,583
Other Assets 13,126 13,458 15,740 17,666 19,841
Total Assets 352,708 399,372 466,401 557,608 670,989
08 Jan 2019 Company Report
City Union Bank
Sector: BFSI

36
Financials
Key Metrics (%) Key Metrics (%)
Source: Company, Axis Securities
Particulars FY17 FY18 FY19E FY20E FY21E
Valuation Ratios
EPS 8.4 8.9 9.4 11.1 13.0
Earnings Growth (%) 13.1 17.7 15.7 18.6 17.2
BVPS 59.4 62.6 66 76.7 89.2
Adj. BVPS 52.6 55.4 58.9 68.0 80.0
ROAA (%) 1.5 1.6 1.6 1.6 1.6
ROAE (%) 15.2 15.3 15.2 15.6 15.6
P/E (x) 23.2 21.8 20.6 17.4 14.8
P/ABV (x) 3.7 3.5 3.3 2.8 2.4
P/PPOP (x) 11.7 10.7 10.9 9.5 8.3
Dividend Yield (%) 0.2 0.2 0.2 0.2 0.2
Profitability
Yield on Advances (%) 11.5 11.0 10.9 11.0 11.1
Yield on Investment (%) 8.1 7.0 7.0 7.0 6.8
Cost of Funds (%) 6.8 6.0 6.1 6.3 6.51
Cost of Deposits (%) 6.8 6.1 6.2 6.3 7.0
Core Spread (%) 4.7 4.9 4.8 4.7 4.6
NIM (%) 3.9 4.2 4.0 4.0 3.8
Operating Efficiency
Cost/Avg. Asset Ratio (%) 2.1 2 2 1.9 1.8
Cost-Income Ratio (%) 43.7 40.4 41.9 40.6 40.0
Particulars FY17 FY18 FY19E FY20E FY21EBalance Sheet Structure Ratios
Loan Growth (%) 13.2 16.9 19.0 20.0 21.0Deposit Growth (%) 10.9 9.1 20.1 19.6 20.9C/D Ratio (%) 79.1 84.8 84 84.3 84.4Equity/Assets (%) 10.1 10.4 10.4 10.1 9.7
Equity/Loans (%) 15 14.9 14.6 14.1 13.6CASA (%) 23.4 24.2 22.1 21.5 20.6Total Capital Adequacy Ratio (CAR) 15.8 16.0 15.6 14.9 14.2Tier I CAR 15.4 15.6 15.3 14.7 14.0
Asset Quality
Gross NPLs (Rsm) 6,820 8,565 9,579 10,491 11,809
Net NPLs (Rsm) 4,083 4,793 5,196 6,390 7,496
Gross NPLs (%) 2.83 3.03 2.85 2.61 2.43
Net NPLs (%) 1.71 1.72 1.57 1.61 1.56
Coverage Ratio (%) 61.0 64.0 71.7 69.6 68.6
LLP (%) 1.12 1.17 1.19 1.00 0.89
ROAA Tree
Net Interest Income 3.60% 3.80% 3.74% 3.72% 3.59%Non Interest Income 1.45% 1.42% 1.20% 1.06% 0.94%Treasury Income 0.32% 0.25% 0.28% 0.19% 0.13%Operating Cost 2.07% 2.01% 1.95% 1.86% 1.76%Provisions 0.90% 1.11% 0.87% 0.74% 0.66%Provisions for NPAs 0.76% 0.81% 0.84% 0.72% 0.64%Tax 0.57% 0.53% 0.54% 0.58% 0.55%ROAA 1.51% 1.57% 1.58% 1.59% 1.55%Leverage (x) 10.0 9.7 9.6 9.8 10.1ROAE 15.2% 15.3% 15.2% 15.6% 15.7%
08 Jan 2019 Company Report
City Union Bank
Sector: BFSI

37
Key Milestones
Incorporationof the Bank
Took overCommonWealthBankLimited
Initial PublicOffering (IPO);Listing bank’sshares on theBSE, NSE & MSE
Obtained licensesto act as a agentfor procuring lifeinsurance &general insurancebusiness
Rights issue @1 : 4 - to rewardthe existingshareholders
Celebrated110th yearFoundation Day inDec 2014
Raised INRRs.3,500 mn inEquity capitalThrough QIProute
Scheduledbank since22.03.1945
Amalgamation of‘The City ForwardBank Limited’ &‘The Union BankLimited’ with ourBank
Entered intoagreement withTCS for corebanking solution“Quartz”
Preferentialallotment forequity sharesstrengtheningbank’s capitalfunds
Rights Issue @1 : 4 - to rewardthe existingshareholders &employees under“EmployeeReservationScheme”
Bonus Issue @1 : 10 -rewardedto the existingShareholders
1904 1945 1957 1965 1998 2002 2003 2007 2009 2012 2014 2017& 2018
Source: Company, Axis Securities
08 Jan 2019 Company Report
City Union Bank
Sector: BFSI

38
Disclaimer
Disclosures:
The following Disclosures are being made in compliance with the SEBI Research Analyst Regulations 2014 (herein after referred to as the Regulations).
1. Axis Securities Ltd. (ASL) is a SEBI Registered Research Analyst having registration no. INH000000297. ASL, the Research Entity (RE) as defined in the Regulations, is engaged in the business ofproviding Stock broking services, Depository participant services & distribution of various financial products. ASL is a subsidiary company of Axis Bank Ltd. Axis Bank Ltd. is a listed publiccompany and one of India’s largest private sector bank and has its various subsidiaries engaged in businesses of Asset management, NBFC, Merchant Banking, Trusteeship, Venture Capital,Stock Broking, the details in respect of which are available on www.axisbank.com.
2. ASL is registered with the Securities & Exchange Board of India (SEBI) for its stock broking & Depository participant business activities and with the Association of Mutual Funds of India (AMFI) fordistribution of financial products and also registered with IRDA as a corporate agent for insurance business activity.
3. ASL has no material adverse disciplinary history as on the date of publication of this report.
4. I/We, Siji Philip – Senior Manager, Research, MBA, author/s and the name/s subscribed to this report, hereby certify that all of the views expressed in this research report accurately reflectmy/our views about the subject issuer(s) or securities. I/We (Research Analyst) also certify that no part of my/our compensation was, is, or will be directly or indirectly related to the specificrecommendation(s) or view(s) in this report. I/we or my/our relative or ASL does not have any financial interest in the subject company. Also I/we or my/our relative or ASL or its Associates mayhave beneficial ownership of 1% or more in the subject company at the end of the month immediately preceding the date of publication of the Research Report. Since associates of ASL areengaged in various financial service businesses, they might have financial interests or beneficial ownership in various companies including the subject company/companies mentioned in thisreport. I/we or my/our relative or ASL or its associate does not have any material conflict of interest. I/we have not served as director / officer, etc. in the subject company in the last 12-monthperiod.
Any holding in stock – No
5. ASL has not received any compensation from the subject company in the past twelve months. ASL has not been engaged in market making activity for the subject company.
6. In the last 12-month period ending on the last day of the month immediately preceding the date of publication of this research report, ASL or any of its associates may have:
i. Received compensation for investment banking, merchant banking or stock broking services or for any other services from the subject company of this research report and / or;ii. Managed or co-managed public offering of the securities from the subject company of this research report and / or;iii. Received compensation for products or services other than investment banking, merchant banking or stock broking services from the subject company of this research report;
ASL or any of its associates have not received compensation or other benefits from the subject company of this research report or any other third-party in connection with this report.
Term& Conditions:
This report has been prepared by ASL and is meant for sole use by the recipient and not for circulation. The report and information contained herein is strictly confidential and may not be altered inany way, transmitted to, copied or distributed, in part or in whole, to any other person or to the media or reproduced in any form, without prior written consent of ASL. The report is based on thefacts, figures and information that are considered true, correct, reliable and accurate. The intent of this report is not recommendatory in nature. The information is obtained from publicly availablemedia or other sources believed to be reliable. Such information has not been independently verified and no guaranty, representation of warranty, express or implied, is made as to its accuracy,completeness or correctness. All such information and opinions are subject to change without notice. The report is prepared solely for informational purpose and does not constitute an offer documentor solicitation of offer to buy or sell or subscribe for securities or other financial instruments for the clients. Though disseminated to all the customers simultaneously, not all customers may receive thisreport at the same time. ASL will not treat recipients as customers by virtue of their receiving this report.
08 Jan 2019 Company Report
City Union Bank
Sector: BFSI

39
Disclaimer
08 Jan 2019 Company Report
City Union Bank
Sector: BFSI
Disclaimer:
Nothing in this report constitutes investment, legal, accounting and tax advice or a representation that any investment or strategy is suitable or appropriate to the recipient’s specific circumstances. The securities and strategies
discussed and opinions expressed, if any, in this report may not be suitable for all investors, who must make their own investment decisions, based on their own investment objectives, financial positions and needs of specific
recipient.
This report may not be taken in substitution for the exercise of independent judgment by any recipient. Each recipient of this report should make such investigations as it deems necessary to arrive at an independent evaluation of
an investment in the securities of companies referred to in this report (including the merits and risks involved), and should consult its own advisors to determine the merits and risks of such an investment. Certain transactions,
including those involving futures, options and other derivatives as well as non-investment grade securities involve substantial risk and are not suitable for all investors. ASL, its directors, analysts or employees do not take any
responsibility, financial or otherwise, of the losses or the damages sustained due to the investments made or any action taken on basis of this report, including but not restricted to, fluctuation in the prices of shares and bonds,
changes in the currency rates, diminution in the NAVs, reduction in the dividend or income, etc. Past performance is not necessarily a guide to future performance. Investors are advice necessarily a guide to future performance.
Investors are advised to see Risk Disclosure Document to understand the risks associated before investing in the securities markets. Actual results may differ materially from those set forth in projections. Forward-looking statements
are not predictions and may be subject to change without notice.
ASL and its affiliated companies, their directors and employees may; (a) from time to time, have long or short position(s) in, and buy or sell the securities of the company(ies) mentioned herein or (b) be engaged in any other
transaction involving such securities or earn brokerage or other compensation or act as a market maker in the financial instruments of the company(ies) discussed herein or act as an advisor or investment banker,
lender/borrower to such company(ies) or may have any other potential conflict of interests with respect to any recommendation and other related information and opinions. Each of these entities functions as a separate, distinct
and independent of each other. The recipient should take this into account before interpreting this document.
ASL and / or its affiliates do and seek to do business including investment banking with companies covered in its research reports. As a result, the recipients of this report should be aware that ASL may have a potential conflict of
interest that may affect the objectivity of this report. Compensation of Research Analysts is not based on any specific merchant banking, investment banking or brokerage service transactions. ASL may have issued other reports
that are inconsistent with and reach different conclusion from the information presented in this report.
Neither this report nor any copy of it may be taken or transmitted into the United State (to U.S. Persons), Canada, or Japan or distributed, directly or indirectly, in the United States or Canada or distributed or redistributed in
Japan or to any resident thereof. If this report is inadvertently sent or has reached any individual in such country, especially, USA, the same may be ignored and brought to the attention of the sender. This report is not directed or
intended for distribution to, or use by, any person or entity who is a citizen or resident of or located in any locality, state, country or other jurisdiction, where such distribution, publication, availability or use would be contrary to
law, regulation or which would subject ASL to any registration or licensing requirement within such jurisdiction. The securities described herein may or may not be eligible for sale in all jurisdictions or to certain category of
investors.
The Disclosures of Interest Statement incorporated in this document is provided solely to enhance the transparency and should not be treated as endorsement of the views expressed in the report. The Company reserves the right
to make modifications and alternations to this document as may be required from time to time without any prior notice. The views expressed are those of the analyst(s) and the Company may or may not subscribe to all the views
expressed therein.
Copyright in this document vests with Axis Securities Limited.
Axis Securities Limited, Corporate office: Unit No. 2, Phoenix Market City, 15, LBS Road, Near Kamani Junction, Kurla (west), Mumbai-400070, Tel No. – 18002100808/022-61480808, Regd. off.- Axis House, 8th Floor,
Wadia International Centre, Pandurang Budhkar Marg, Worli, Mumbai – 400 025. Compliance Officer: Anand Shaha, Email: [email protected], Tel No: 022-42671582.
DEFINITION OF RATINGS
Ratings Expected absolute returns over 12-18 months
BUY More than 10%
HOLD Between 10% and -10%
SELL Less than -10%
NOT RATED We have forward looking estimates for the stock but we refrain from assigning valuation and recommendation
UNDER REVIEW We will revisit our recommendation, valuation and estimates on the stock following recent events
NO STANCE We do not have any forward looking estimates, valuation or recommendation for the stock