civilian personnel sickness absence april 2020
TRANSCRIPT
This report presents figures on Sickness Absence for civilian personnel employed by the Ministry of Defence, excluding Royal Fleet Auxiliary personnel and Locally engaged civilians. Using data from the Ministry of Defence Human Resource and Management System (HRMS), the tables present information about changes in the Average Number of Working Days Lost (AWDL), actual number of days lost, the number of instances of Sickness Absence and the distribution by ICD code.
Main points
Responsible statistician: Civilian Personnel Head of Branch 020 7218 1359
Further information/mailing list: [email protected]
Would you like to be added to our contact list, so that we can inform you about updates to these statistics and consult you if we are
thinking of making changes? You can subscribe to updates by emailing [email protected]
Civilian Personnel Sickness Absence
Annual Report
1 April 2020
MOD average working days absent per civilian personnel 12 months to 31 March 2020 an increase of 0.16 days compared with the previous 12 month period
MOD civilian number of incidents of sickness absence 12 months to 31 March 2020 an increase of 6 per cent compared with the previous 12 month period
MOD civilian personnel working days lost due to sickness 12 months to 31 March 2020 an increase of 6 per cent compared with the previous 12 month period
MOD civilian personnel main causes of sickness absence 12 months to 31 March 2020
Non-industrial personnel - Mental and behavioural disorders (25%) - Diseases of the musculoskeletal system (17%) - Diseases of the respiratory system (12%)
Industrial personnel - Diseases of the musculoskeletal system (25%) - Mental and behavioural disorders (18%) - Injury, poisoning and other external causes (12%)
6.84 days
64,530 incidents
358,030 days
Defini
2
Please note: data for ‘12 months ending 31 March 2020’ are provisional (marked with a ‘p’) due to not having final confirmation of all the data returns.
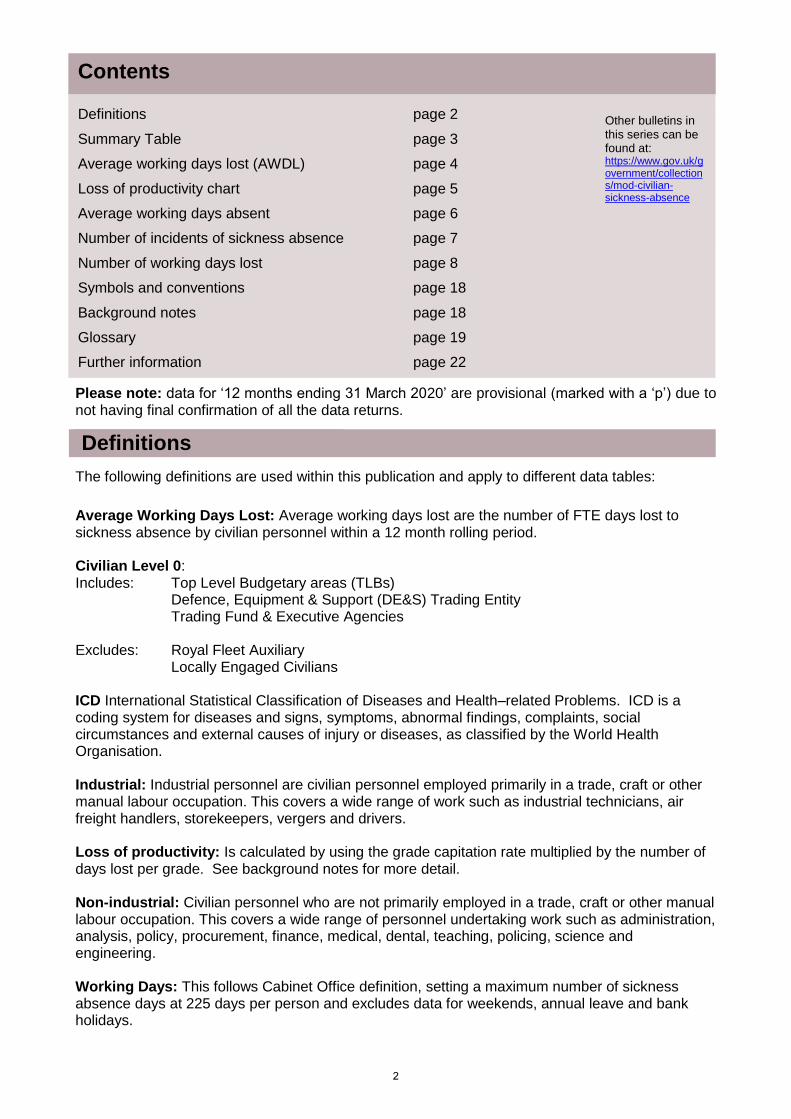
The following definitions are used within this publication and apply to different data tables:
Average Working Days Lost: Average working days lost are the number of FTE days lost to sickness absence by civilian personnel within a 12 month rolling period.
Civilian Level 0: Includes: Top Level Budgetary areas (TLBs)
Defence, Equipment & Support (DE&S) Trading Entity Trading Fund & Executive Agencies
Excludes: Royal Fleet Auxiliary Locally Engaged Civilians
ICD International Statistical Classification of Diseases and Health–related Problems. ICD is a coding system for diseases and signs, symptoms, abnormal findings, complaints, social circumstances and external causes of injury or diseases, as classified by the World Health Organisation.
Industrial: Industrial personnel are civilian personnel employed primarily in a trade, craft or other manual labour occupation. This covers a wide range of work such as industrial technicians, air freight handlers, storekeepers, vergers and drivers.
Loss of productivity: Is calculated by using the grade capitation rate multiplied by the number of days lost per grade. See background notes for more detail.
Non-industrial: Civilian personnel who are not primarily employed in a trade, craft or other manual labour occupation. This covers a wide range of personnel undertaking work such as administration, analysis, policy, procurement, finance, medical, dental, teaching, policing, science and engineering.
Working Days: This follows Cabinet Office definition, setting a maximum number of sickness absence days at 225 days per person and excludes data for weekends, annual leave and bank holidays.
Definitions
Definitions page 2
Summary Table page 3
Average working days lost (AWDL) page 4
Loss of productivity chart page 5
Average working days absent page 6
Number of incidents of sickness absence page 7
Number of working days lost page 8
Symbols and conventions page 18
Background notes page 18
Glossary page 19
Further information page 22
Contents
Other bulletins in this series can be found at: https://www.gov.uk/government/collections/mod-civilian-sickness-absence
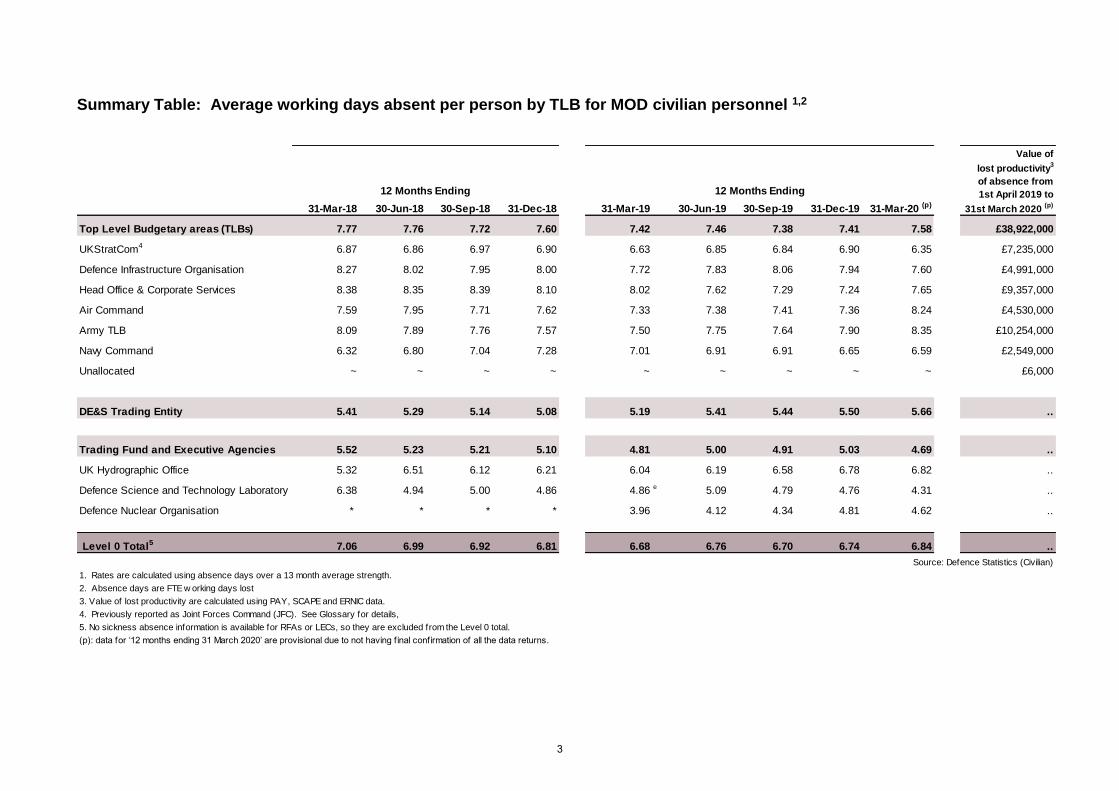
Summary Table: Average working days absent per person by TLB for MOD civilian personnel 1,2
31-Mar-18 30-Jun-18 30-Sep-18 31-Dec-18 31-Mar-19 30-Jun-19 30-Sep-19 31-Dec-19 31-Mar-20 (p)
Top Level Budgetary areas (TLBs) 7.77 7.76 7.72 7.60 7.42 7.46 7.38 7.41 7.58 £38,922,000
UKStratCom4 6.87 6.86 6.97 6.90 6.63 6.85 6.84 6.90 6.35 £7,235,000
Defence Infrastructure Organisation 8.27 8.02 7.95 8.00 7.72 7.83 8.06 7.94 7.60 £4,991,000
Head Office & Corporate Services 8.38 8.35 8.39 8.10 8.02 7.62 7.29 7.24 7.65 £9,357,000
Air Command 7.59 7.95 7.71 7.62 7.33 7.38 7.41 7.36 8.24 £4,530,000
Army TLB 8.09 7.89 7.76 7.57 7.50 7.75 7.64 7.90 8.35 £10,254,000
Navy Command 6.32 6.80 7.04 7.28 7.01 6.91 6.91 6.65 6.59 £2,549,000
Unallocated ~ ~ ~ ~ ~ ~ ~ ~ ~ £6,000
DE&S Trading Entity 5.41 5.29 5.14 5.08 5.19 5.41 5.44 5.50 5.66 ..
Trading Fund and Executive Agencies 5.52 5.23 5.21 5.10 4.81 5.00 4.91 5.03 4.69 ..
UK Hydrographic Office 5.32 6.51 6.12 6.21 6.04 6.19 6.58 6.78 6.82 ..
Defence Science and Technology Laboratory 6.38 4.94 5.00 4.86 4.86 e 5.09 4.79 4.76 4.31 ..
Defence Nuclear Organisation * * * * 3.96 4.12 4.34 4.81 4.62 ..
Level 0 Total5 7.06 6.99 6.92 6.81 6.68 6.76 6.70 6.74 6.84 ..
Source: Defence Statistics (Civilian)
1. Rates are calculated using absence days over a 13 month average strength.
3. Value of lost productivity are calculated using PAY, SCAPE and ERNIC data.
4. Previously reported as Joint Forces Command (JFC). See Glossary for details,
5. No sickness absence information is available for RFAs or LECs, so they are excluded from the Level 0 total.
(p): data for ‘12 months ending 31 March 2020’ are provisional due to not having f inal confirmation of all the data returns.
2. Absence days are FTE w orking days lost
Value of
lost productivity3
of absence from
1st April 2019 to
31st March 2020 (p)
12 Months Ending12 Months Ending
3
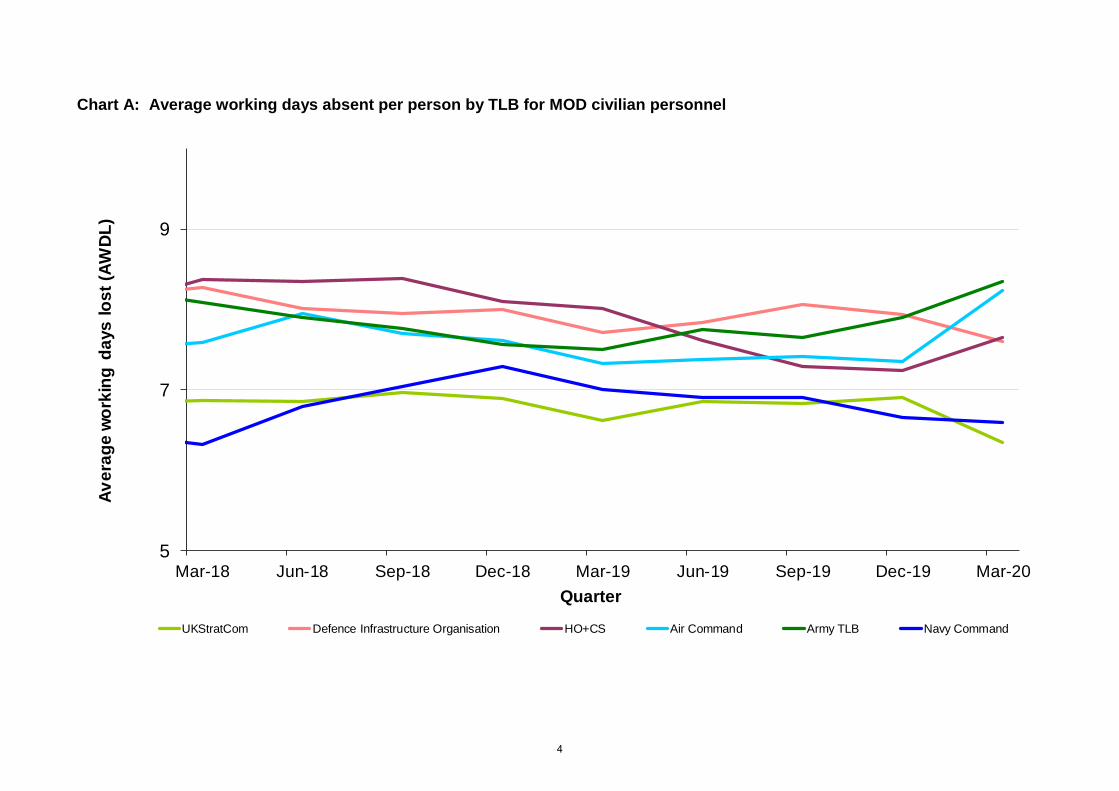
Chart A: Average working days absent per person by TLB for MOD civilian personnel
5
7
9
Mar-18 Jun-18 Sep-18 Dec-18 Mar-19 Jun-19 Sep-19 Dec-19 Mar-20
Av
era
ge
wo
rkin
g d
ays
lo
st
(AW
DL
)
Quarter
UKStratCom Defence Infrastructure Organisation HO+CS Air Command Army TLB Navy Command
4
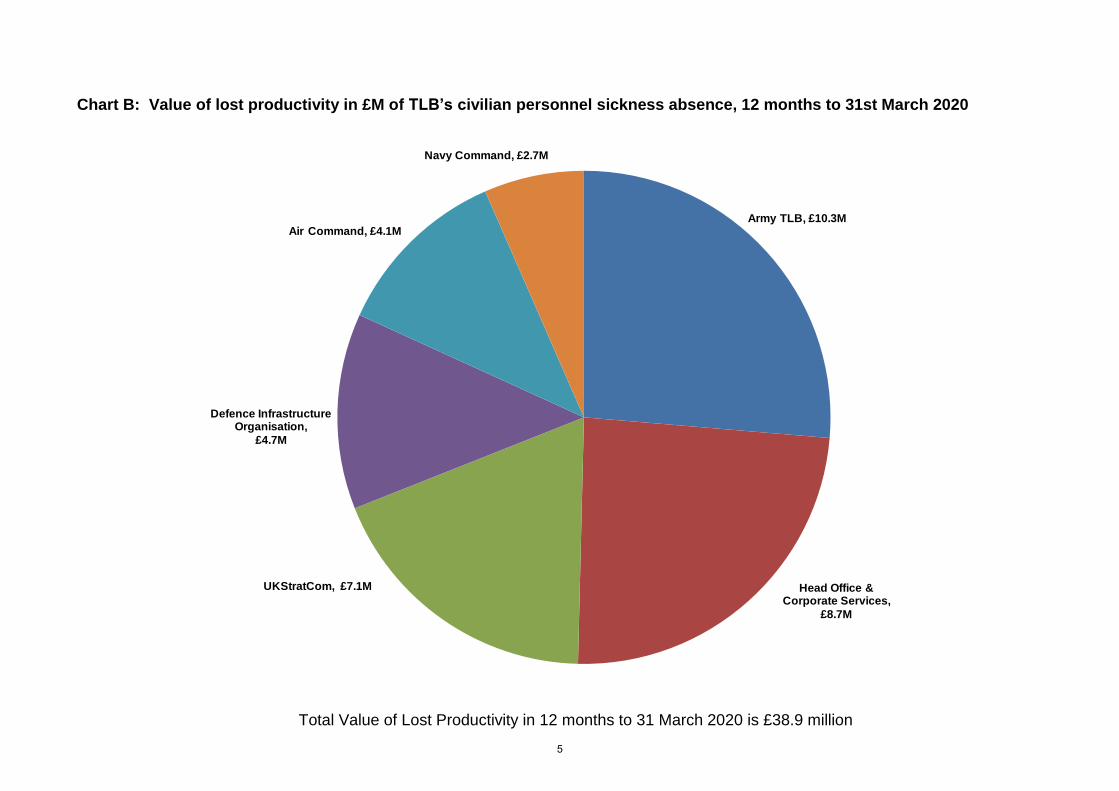
Chart B: Value of lost productivity in £M of TLB’s civilian personnel sickness absence, 12 months to 31st March 2020
Army TLB, £10.3M
Head Office & Corporate Services,
£8.7M
UKStratCom, £7.1M
Defence Infrastructure Organisation,
£4.7M
Air Command, £4.1M
Navy Command, £2.7M
5
Total Value of Lost Productivity in 12 months to 31 March 2020 is £38.9 million
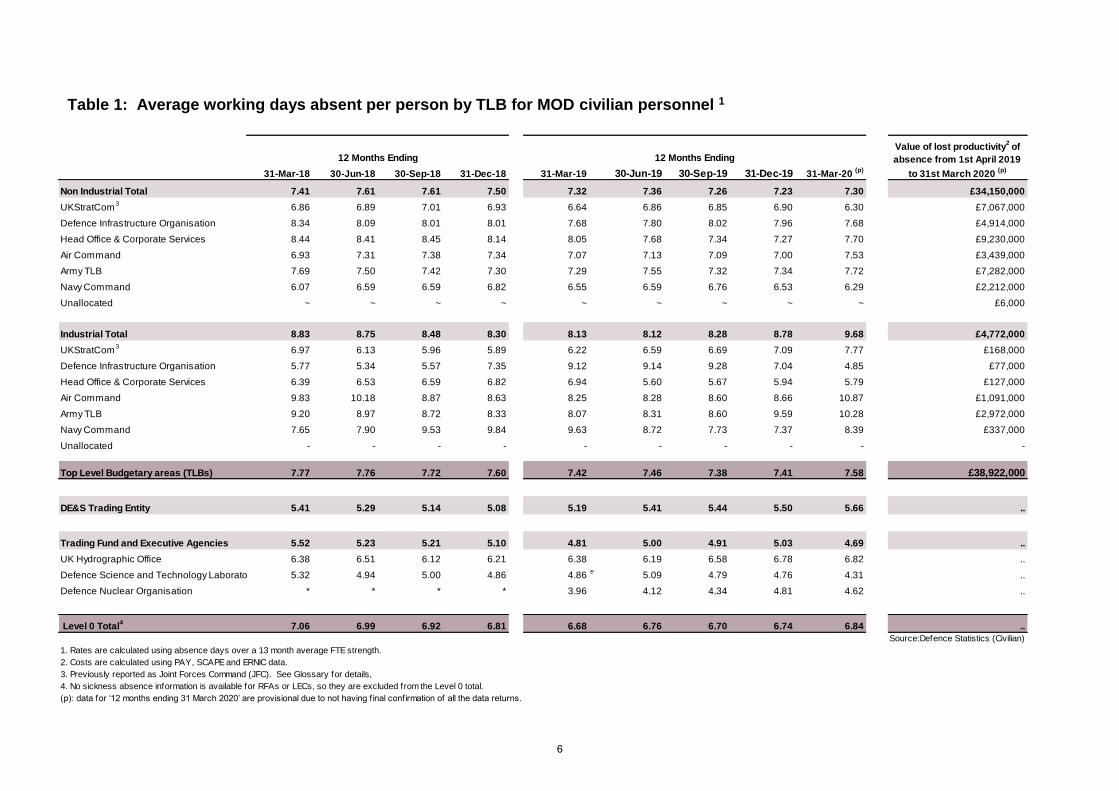
Table 1: Average working days absent per person by TLB for MOD civilian personnel 1
31-Mar-18
ry
30-Jun-18 30-Sep-18 31-Dec-18 31-Mar-19 30-Jun-19 30-Sep-19 31-Dec-19 31-Mar-20 (p)
Non Industrial Total 7.41 7.61 7.61 7.50 7.32 7.36 7.26 7.23 7.30 £34,150,000
UKStratCom3
6.86 6.89 7.01 6.93 6.64 6.86 6.85 6.90 6.30 £7,067,000
Defence Infrastructure Organisation 8.34 8.09 8.01 8.01 7.68 7.80 8.02 7.96 7.68 £4,914,000
Head Office & Corporate Services 8.44 8.41 8.45 8.14 8.05 7.68 7.34 7.27 7.70 £9,230,000
Air Command 6.93 7.31 7.38 7.34 7.07 7.13 7.09 7.00 7.53 £3,439,000
Army TLB 7.69 7.50 7.42 7.30 7.29 7.55 7.32 7.34 7.72 £7,282,000
Navy Command 6.07 6.59 6.59 6.82 6.55 6.59 6.76 6.53 6.29 £2,212,000
Unallocated ~ ~ ~ ~ ~ ~ ~ ~ ~ £6,000
Industrial Total 8.83 8.75 8.48 8.30 8.13 8.12 8.28 8.78 9.68 £4,772,000
UKStratCom3
6.97 6.13 5.96 5.89 6.22 6.59 6.69 7.09 7.77 £168,000
Defence Infrastructure Organisation 5.77 5.34 5.57 7.35 9.12 9.14 9.28 7.04 4.85 £77,000
Head Office & Corporate Services 6.39 6.53 6.59 6.82 6.94 5.60 5.67 5.94 5.79 £127,000
Air Command 9.83 10.18 8.87 8.63 8.25 8.28 8.60 8.66 10.87 £1,091,000
Army TLB 9.20 8.97 8.72 8.33 8.07 8.31 8.60 9.59 10.28 £2,972,000
Navy Command 7.65 7.90 9.53 9.84 9.63 8.72 7.73 7.37 8.39 £337,000
Unallocated - - - - - - - - - -
Top Level Budgetary areas (TLBs) 7.77 7.76 7.72 7.60 7.42 7.46 7.38 7.41 7.58 £38,922,000
DE&S Trading Entity 5.41 5.29 5.14 5.08 5.19 5.41 5.44 5.50 5.66 ..
Trading Fund and Executive Agencies 5.52 5.23 5.21 5.10 4.81 5.00 4.91 5.03 4.69 ..
UK Hydrographic Office 6.38 6.51 6.12 6.21 6.38 6.19 6.58 6.78 6.82 ..
Defence Science and Technology Laborato 5.32 4.94 5.00 4.86 4.86e
5.09 4.79 4.76 4.31 ..
Defence Nuclear Organisation * * * * 3.96 4.12 4.34 4.81 4.62 ..
Level 0 Total4
7.06 6.99 6.92 6.81 6.68 6.76 6.70 6.74 6.84 ..
Source:Defence Statistics (Civilian)
1. Rates are calculated using absence days over a 13 month average FTE strength.
2. Costs are calculated using PAY, SCAPE and ERNIC data.
3. Previously reported as Joint Forces Command (JFC). See Glossary for details,
4. No sickness absence information is available for RFAs or LECs, so they are excluded from the Level 0 total.
(p): data for ‘12 months ending 31 March 2020’ are provisional due to not having f inal confirmation of all the data returns.
12 Months Ending 12 Months EndingValue of lost productivity
2 of
absence from 1st April 2019
to 31st March 2020 (p)
6
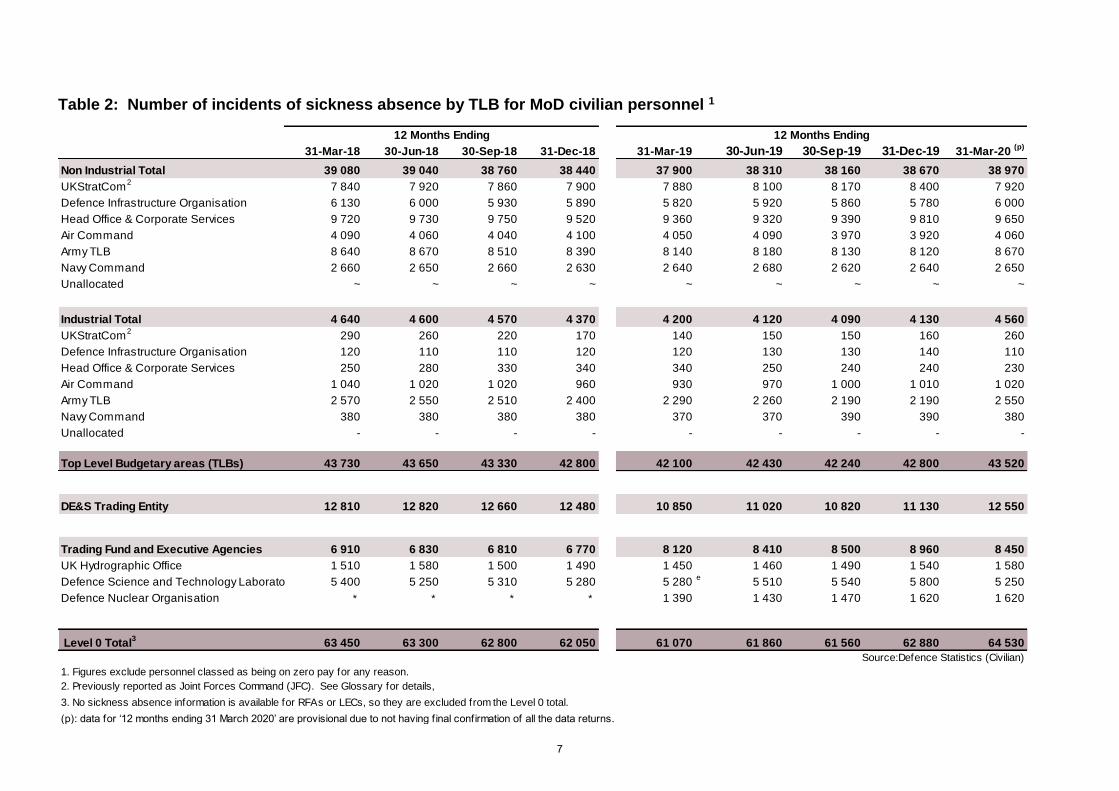
Table 2: Number of incidents of sickness absence by TLB for MoD civilian personnel 1
31-Mar-18
ry
30-Jun-18 30-Sep-18 31-Dec-18 31-Mar-19 30-Jun-19 30-Sep-19 31-Dec-19 31-Mar-20 (p)
Non Industrial Total 39 080 39 040 38 760 38 440 37 900 38 310 38 160 38 670 38 970
UKStratCom2
7 840 7 920 7 860 7 900 7 880 8 100 8 170 8 400 7 920
Defence Infrastructure Organisation 6 130 6 000 5 930 5 890 5 820 5 920 5 860 5 780 6 000
Head Office & Corporate Services 9 720 9 730 9 750 9 520 9 360 9 320 9 390 9 810 9 650
Air Command 4 090 4 060 4 040 4 100 4 050 4 090 3 970 3 920 4 060
Army TLB 8 640 8 670 8 510 8 390 8 140 8 180 8 130 8 120 8 670
Navy Command 2 660 2 650 2 660 2 630 2 640 2 680 2 620 2 640 2 650
Unallocated ~ ~ ~ ~ ~ ~ ~ ~ ~
Industrial Total 4 640 4 600 4 570 4 370 4 200 4 120 4 090 4 130 4 560
UKStratCom2
290 260 220 170 140 150 150 160 260
Defence Infrastructure Organisation 120 110 110 120 120 130 130 140 110
Head Office & Corporate Services 250 280 330 340 340 250 240 240 230
Air Command 1 040 1 020 1 020 960 930 970 1 000 1 010 1 020
Army TLB 2 570 2 550 2 510 2 400 2 290 2 260 2 190 2 190 2 550
Navy Command 380 380 380 380 370 370 390 390 380
Unallocated - - - - - - - - -
Top Level Budgetary areas (TLBs) 43 730 43 650 43 330 42 800 42 100 42 430 42 240 42 800 43 520
DE&S Trading Entity 12 810 12 820 12 660 12 480 10 850 11 020 10 820 11 130 12 550
Trading Fund and Executive Agencies 6 910 6 830 6 810 6 770 8 120 8 410 8 500 8 960 8 450
UK Hydrographic Office 1 510 1 580 1 500 1 490 1 450 1 460 1 490 1 540 1 580
Defence Science and Technology Laborato 5 400 5 250 5 310 5 280 5 280e
5 510 5 540 5 800 5 250
Defence Nuclear Organisation * * * * 1 390 1 430 1 470 1 620 1 620
Level 0 Total3
63 450 63 300 62 800 62 050 61 070 61 860 61 560 62 880 64 530
Source:Defence Statistics (Civilian)
1. Figures exclude personnel classed as being on zero pay for any reason.
2. Previously reported as Joint Forces Command (JFC). See Glossary for details,
3. No sickness absence information is available for RFAs or LECs, so they are excluded from the Level 0 total.
(p): data for ‘12 months ending 31 March 2020’ are provisional due to not having f inal confirmation of all the data returns.
12 Months Ending 12 Months Ending
7
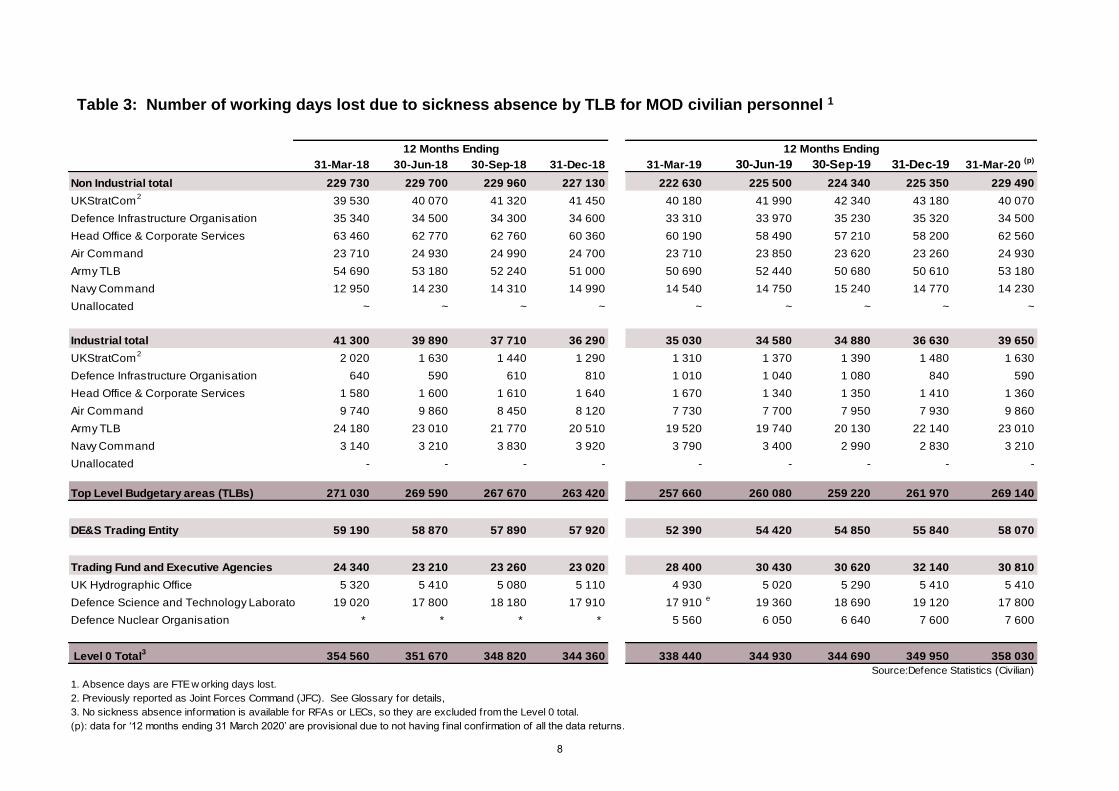
Table 3: Number of working days lost due to sickness absence by TLB for MOD civilian personnel 1
31-Mar-18
ry
30-Jun-18 30-Sep-18 31-Dec-18 31-Mar-19 30-Jun-19 30-Sep-19 31-Dec-19 31-Mar-20 (p)
Non Industrial total 229 730 229 700 229 960 227 130 222 630 225 500 224 340 225 350 229 490
UKStratCom2
39 530 40 070 41 320 41 450 40 180 41 990 42 340 43 180 40 070
Defence Infrastructure Organisation 35 340 34 500 34 300 34 600 33 310 33 970 35 230 35 320 34 500
Head Office & Corporate Services 63 460 62 770 62 760 60 360 60 190 58 490 57 210 58 200 62 560
Air Command 23 710 24 930 24 990 24 700 23 710 23 850 23 620 23 260 24 930
Army TLB 54 690 53 180 52 240 51 000 50 690 52 440 50 680 50 610 53 180
Navy Command 12 950 14 230 14 310 14 990 14 540 14 750 15 240 14 770 14 230
Unallocated ~ ~ ~ ~ ~ ~ ~ ~ ~
Industrial total 41 300 39 890 37 710 36 290 35 030 34 580 34 880 36 630 39 650
UKStratCom2
2 020 1 630 1 440 1 290 1 310 1 370 1 390 1 480 1 630
Defence Infrastructure Organisation 640 590 610 810 1 010 1 040 1 080 840 590
Head Office & Corporate Services 1 580 1 600 1 610 1 640 1 670 1 340 1 350 1 410 1 360
Air Command 9 740 9 860 8 450 8 120 7 730 7 700 7 950 7 930 9 860
Army TLB 24 180 23 010 21 770 20 510 19 520 19 740 20 130 22 140 23 010
Navy Command 3 140 3 210 3 830 3 920 3 790 3 400 2 990 2 830 3 210
Unallocated - - - - - - - - -
Top Level Budgetary areas (TLBs) 271 030 269 590 267 670 263 420 257 660 260 080 259 220 261 970 269 140
DE&S Trading Entity 59 190 58 870 57 890 57 920 52 390 54 420 54 850 55 840 58 070
Trading Fund and Executive Agencies 24 340 23 210 23 260 23 020 28 400 30 430 30 620 32 140 30 810
UK Hydrographic Office 5 320 5 410 5 080 5 110 4 930 5 020 5 290 5 410 5 410
Defence Science and Technology Laborato 19 020 17 800 18 180 17 910 17 910e
19 360 18 690 19 120 17 800
Defence Nuclear Organisation * * * * 5 560 6 050 6 640 7 600 7 600
Level 0 Total3
354 560 351 670 348 820 344 360 338 440 344 930 344 690 349 950 358 030
Source:Defence Statistics (Civilian)
1. Absence days are FTE w orking days lost.
2. Previously reported as Joint Forces Command (JFC). See Glossary for details,
3. No sickness absence information is available for RFAs or LECs, so they are excluded from the Level 0 total.
(p): data for ‘12 months ending 31 March 2020’ are provisional due to not having f inal confirmation of all the data returns.
12 Months Ending 12 Months Ending
8
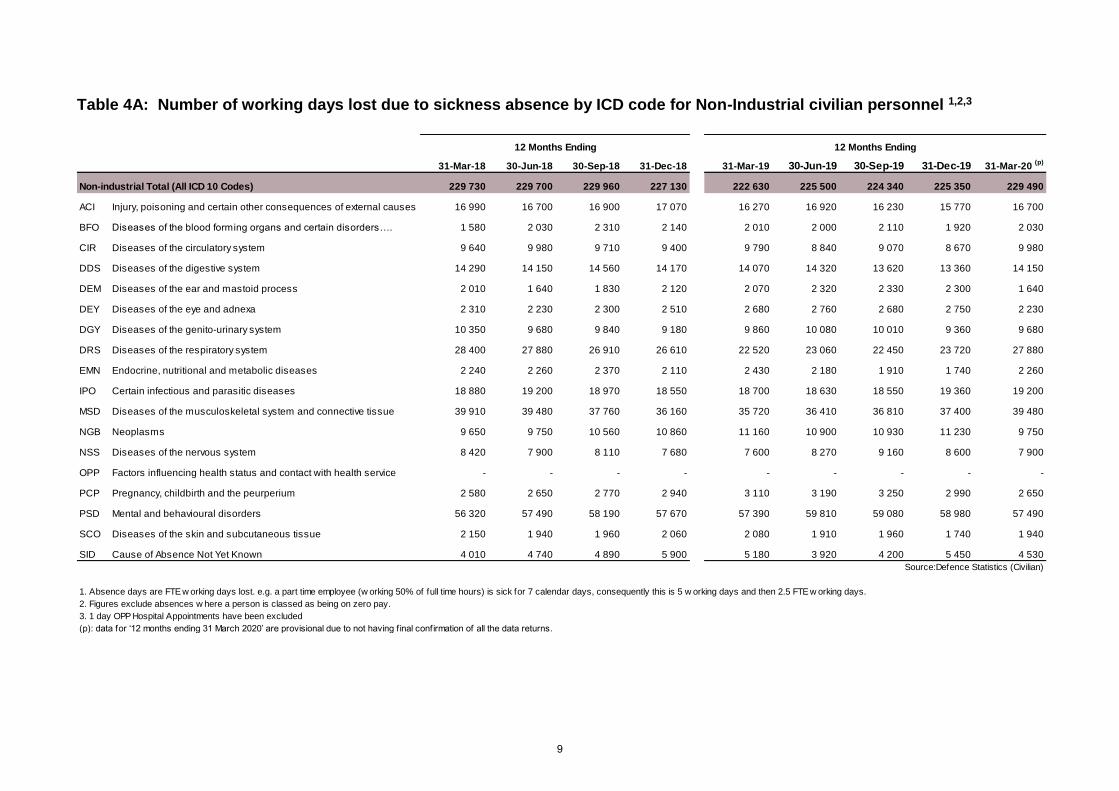
Table 4A: Number of working days lost due to sickness absence by ICD code for Non-Industrial civilian personnel 1,2,3
31-Mar-18 30-Jun-18 30-Sep-18 31-Dec-18 31-Mar-19 30-Jun-19 30-Sep-19 31-Dec-19 31-Mar-20 (p)
Non-industrial Total (All ICD 10 Codes) 229 730 229 700 229 960 227 130 222 630 225 500 224 340 225 350 229 490
ACI Injury, poisoning and certain other consequences of external causes 16 990 16 700 16 900 17 070 16 270 16 920 16 230 15 770 16 700
BFO Diseases of the blood forming organs and certain disorders…. 1 580 2 030 2 310 2 140 2 010 2 000 2 110 1 920 2 030
CIR Diseases of the circulatory system 9 640 9 980 9 710 9 400 9 790 8 840 9 070 8 670 9 980
DDS Diseases of the digestive system 14 290 14 150 14 560 14 170 14 070 14 320 13 620 13 360 14 150
DEM Diseases of the ear and mastoid process 2 010 1 640 1 830 2 120 2 070 2 320 2 330 2 300 1 640
DEY Diseases of the eye and adnexa 2 310 2 230 2 300 2 510 2 680 2 760 2 680 2 750 2 230
DGY Diseases of the genito-urinary system 10 350 9 680 9 840 9 180 9 860 10 080 10 010 9 360 9 680
DRS Diseases of the respiratory system 28 400 27 880 26 910 26 610 22 520 23 060 22 450 23 720 27 880
EMN Endocrine, nutritional and metabolic diseases 2 240 2 260 2 370 2 110 2 430 2 180 1 910 1 740 2 260
IPO Certain infectious and parasitic diseases 18 880 19 200 18 970 18 550 18 700 18 630 18 550 19 360 19 200
MSD Diseases of the musculoskeletal system and connective tissue 39 910 39 480 37 760 36 160 35 720 36 410 36 810 37 400 39 480
NGB Neoplasms 9 650 9 750 10 560 10 860 11 160 10 900 10 930 11 230 9 750
NSS Diseases of the nervous system 8 420 7 900 8 110 7 680 7 600 8 270 9 160 8 600 7 900
OPP Factors influencing health status and contact with health service - - - - - - - - -
PCP Pregnancy, childbirth and the peurperium 2 580 2 650 2 770 2 940 3 110 3 190 3 250 2 990 2 650
PSD Mental and behavioural disorders 56 320 57 490 58 190 57 670 57 390 59 810 59 080 58 980 57 490
SCO Diseases of the skin and subcutaneous tissue 2 150 1 940 1 960 2 060 2 080 1 910 1 960 1 740 1 940
SID Cause of Absence Not Yet Known 4 010 4 740 4 890 5 900 5 180 3 920 4 200 5 450 4 530
Source:Defence Statistics (Civilian)
2. Figures exclude absences w here a person is classed as being on zero pay.
3. 1 day OPP Hospital Appointments have been excluded
(p): data for ‘12 months ending 31 March 2020’ are provisional due to not having f inal confirmation of all the data returns.
12 Months Ending 12 Months Ending
1. Absence days are FTE w orking days lost. e.g. a part time employee (w orking 50% of full time hours) is sick for 7 calendar days, consequently this is 5 w orking days and then 2.5 FTE w orking days.
9
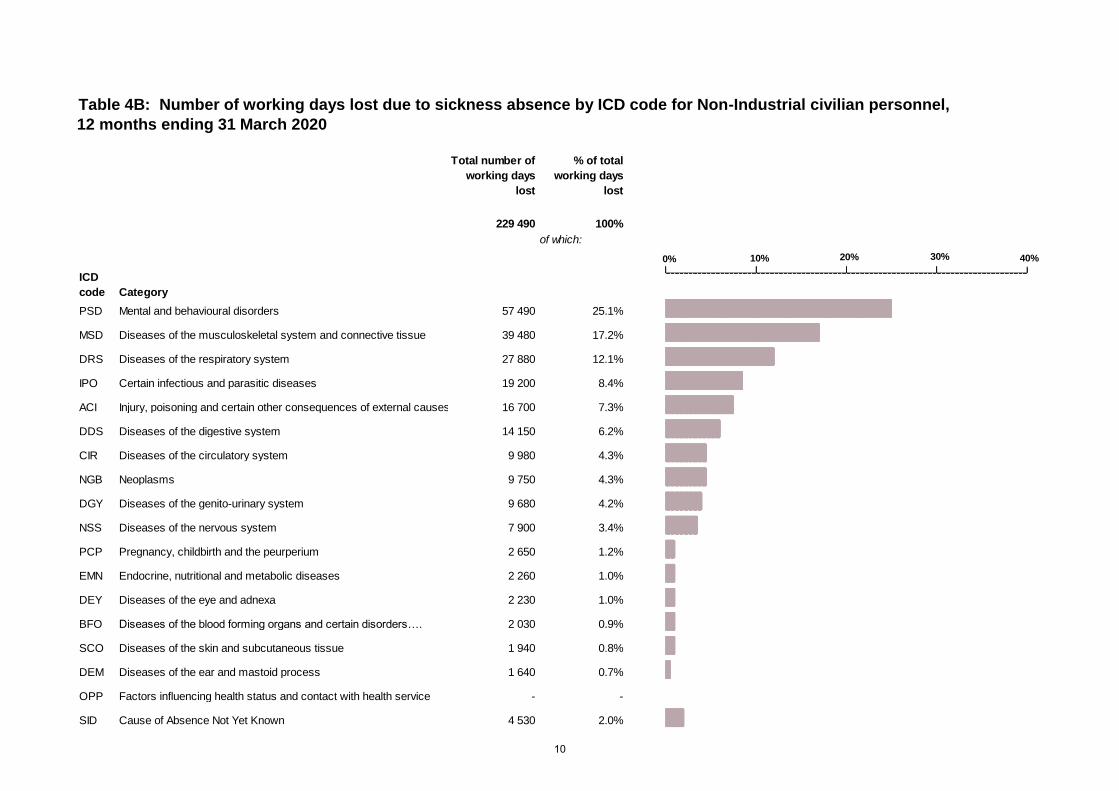
Table 4B: Number of working days lost due to sickness absence by ICD code for Non-Industrial civilian personnel,
12 months ending 31 March 2020
229 490 100%
PSD Mental and behavioural disorders 57 490 25.1%
MSD Diseases of the musculoskeletal system and connective tissue 39 480 17.2%
DRS Diseases of the respiratory system 27 880 12.1%
IPO Certain infectious and parasitic diseases 19 200 8.4%
ACI Injury, poisoning and certain other consequences of external causes 16 700 7.3%
DDS Diseases of the digestive system 14 150 6.2%
CIR Diseases of the circulatory system 9 980 4.3%
NGB Neoplasms 9 750 4.3%
DGY Diseases of the genito-urinary system 9 680 4.2%
NSS Diseases of the nervous system 7 900 3.4%
PCP Pregnancy, childbirth and the peurperium 2 650 1.2%
EMN Endocrine, nutritional and metabolic diseases 2 260 1.0%
DEY Diseases of the eye and adnexa 2 230 1.0%
BFO Diseases of the blood forming organs and certain disorders…. 2 030 0.9%
SCO Diseases of the skin and subcutaneous tissue 1 940 0.8%
DEM Diseases of the ear and mastoid process 1 640 0.7%
OPP Factors influencing health status and contact with health service - -
SID Cause of Absence Not Yet Known 4 530 2.0%
ICD
code Category
of which:
Total number of
working days
lost
% of total
working days
lost
0% 10% 30% 40%20%
10
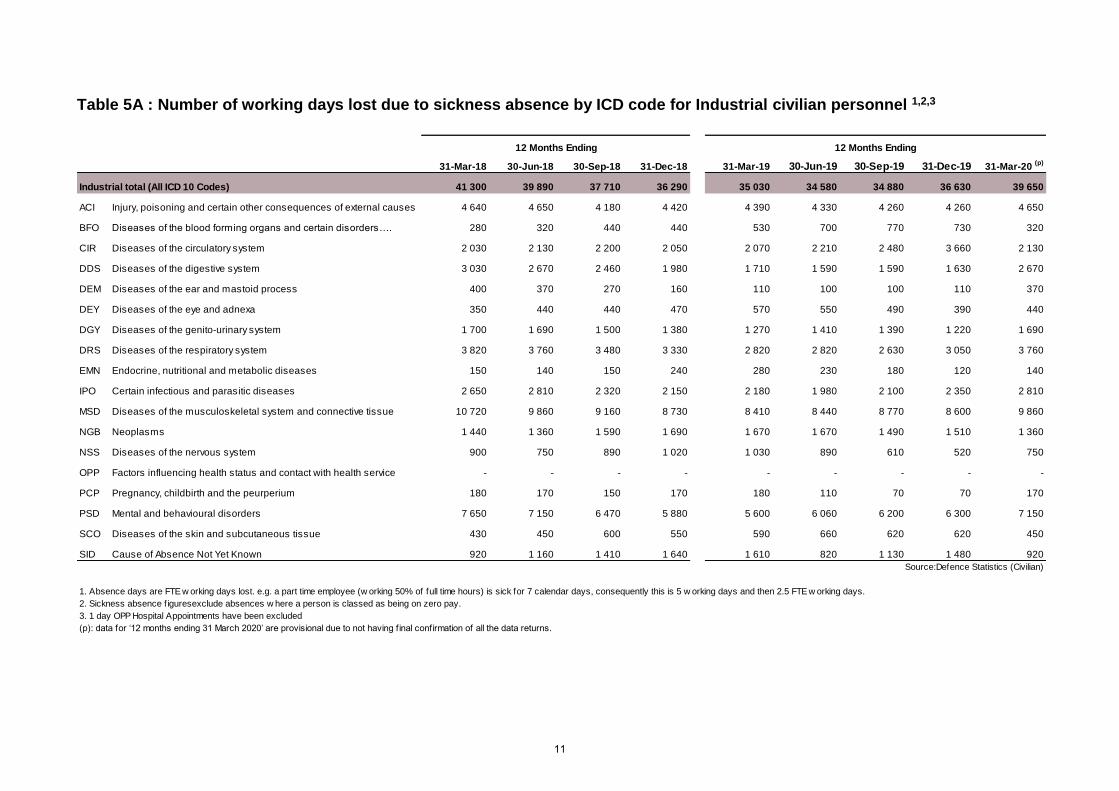
Table 5A : Number of working days lost due to sickness absence by ICD code for Industrial civilian personnel 1,2,3
31-Mar-18 30-Jun-18 30-Sep-18 31-Dec-18 31-Mar-19 30-Jun-19 30-Sep-19 31-Dec-19 31-Mar-20 (p)
Industrial total (All ICD 10 Codes) 41 300 39 890 37 710 36 290 35 030 34 580 34 880 36 630 39 650
ACI Injury, poisoning and certain other consequences of external causes 4 640 4 650 4 180 4 420 4 390 4 330 4 260 4 260 4 650
BFO Diseases of the blood forming organs and certain disorders…. 280 320 440 440 530 700 770 730 320
CIR Diseases of the circulatory system 2 030 2 130 2 200 2 050 2 070 2 210 2 480 3 660 2 130
DDS Diseases of the digestive system 3 030 2 670 2 460 1 980 1 710 1 590 1 590 1 630 2 670
DEM Diseases of the ear and mastoid process 400 370 270 160 110 100 100 110 370
DEY Diseases of the eye and adnexa 350 440 440 470 570 550 490 390 440
DGY Diseases of the genito-urinary system 1 700 1 690 1 500 1 380 1 270 1 410 1 390 1 220 1 690
DRS Diseases of the respiratory system 3 820 3 760 3 480 3 330 2 820 2 820 2 630 3 050 3 760
EMN Endocrine, nutritional and metabolic diseases 150 140 150 240 280 230 180 120 140
IPO Certain infectious and parasitic diseases 2 650 2 810 2 320 2 150 2 180 1 980 2 100 2 350 2 810
MSD Diseases of the musculoskeletal system and connective tissue 10 720 9 860 9 160 8 730 8 410 8 440 8 770 8 600 9 860
NGB Neoplasms 1 440 1 360 1 590 1 690 1 670 1 670 1 490 1 510 1 360
NSS Diseases of the nervous system 900 750 890 1 020 1 030 890 610 520 750
OPP Factors influencing health status and contact with health service - - - - - - - - -
PCP Pregnancy, childbirth and the peurperium 180 170 150 170 180 110 70 70 170
PSD Mental and behavioural disorders 7 650 7 150 6 470 5 880 5 600 6 060 6 200 6 300 7 150
SCO Diseases of the skin and subcutaneous tissue 430 450 600 550 590 660 620 620 450
SID Cause of Absence Not Yet Known 920 1 160 1 410 1 640 1 610 820 1 130 1 480 920
Source:Defence Statistics (Civilian)
2. Sickness absence figuresexclude absences w here a person is classed as being on zero pay.
3. 1 day OPP Hospital Appointments have been excluded
(p): data for ‘12 months ending 31 March 2020’ are provisional due to not having f inal confirmation of all the data returns.
12 Months Ending 12 Months Ending
1. Absence days are FTE w orking days lost. e.g. a part time employee (w orking 50% of full time hours) is sick for 7 calendar days, consequently this is 5 w orking days and then 2.5 FTE w orking days.
11
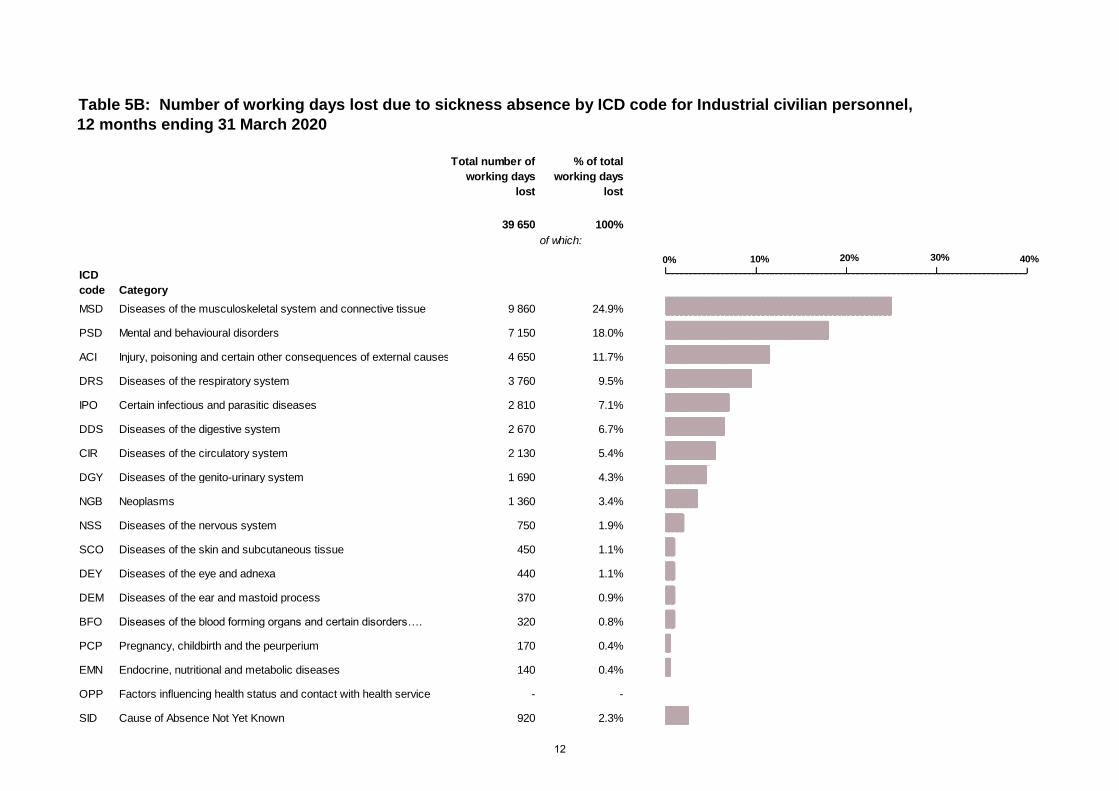
Table 5B: Number of working days lost due to sickness absence by ICD code for Industrial civilian personnel,
12 months ending 31 March 2020
Total number of
working days
lost
% of total
working days
lost
39 650 100%
Category
MSD Diseases of the musculoskeletal system and connective tissue 9 860 24.9%
PSD Mental and behavioural disorders 7 150 18.0%
ACI Injury, poisoning and certain other consequences of external causes 4 650 11.7%
DRS Diseases of the respiratory system 3 760 9.5%
IPO Certain infectious and parasitic diseases 2 810 7.1%
DDS Diseases of the digestive system 2 670 6.7%
CIR Diseases of the circulatory system 2 130 5.4%
DGY Diseases of the genito-urinary system 1 690 4.3%
NGB Neoplasms 1 360 3.4%
NSS Diseases of the nervous system 750 1.9%
SCO Diseases of the skin and subcutaneous tissue 450 1.1%
DEY Diseases of the eye and adnexa 440 1.1%
DEM Diseases of the ear and mastoid process 370 0.9%
BFO Diseases of the blood forming organs and certain disorders…. 320 0.8%
PCP Pregnancy, childbirth and the peurperium 170 0.4%
EMN Endocrine, nutritional and metabolic diseases 140 0.4%
OPP Factors influencing health status and contact with health service - -
SID Cause of Absence Not Yet Known 920 2.3%
ICD
code
of which:
0% 10% 30% 40%20%
12
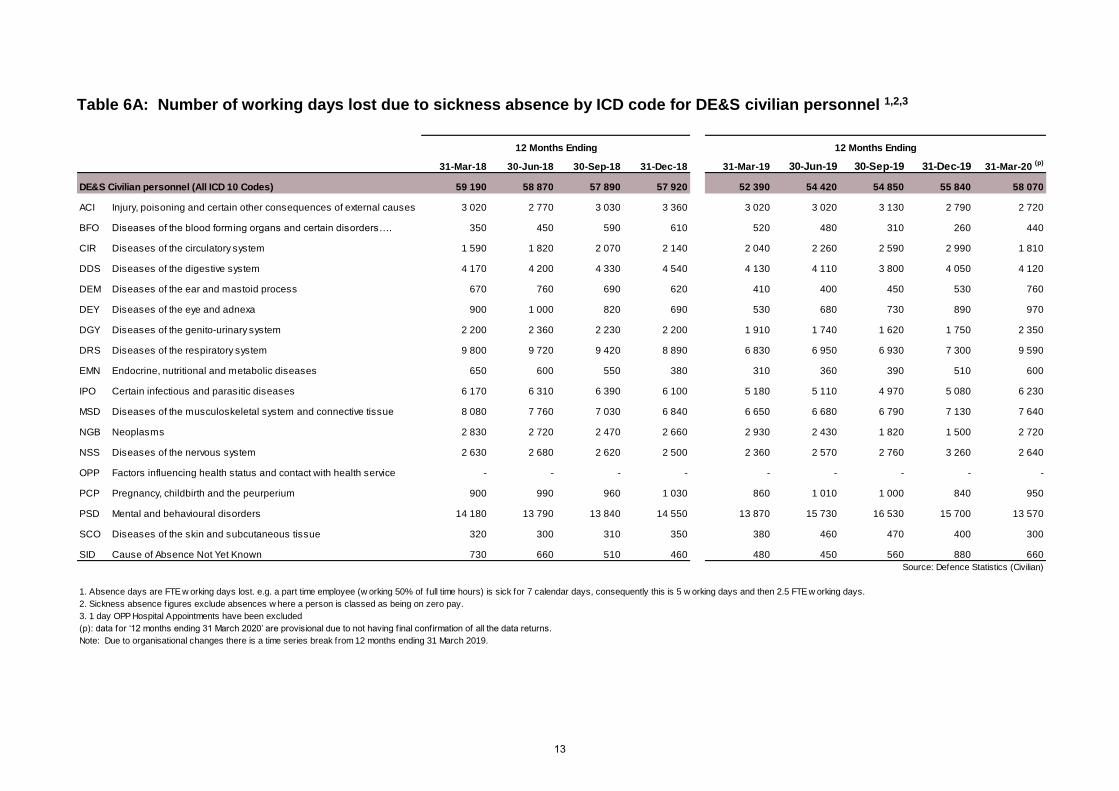
Table 6A: Number of working days lost due to sickness absence by ICD code for DE&S civilian personnel 1,2,3
31-Mar-18 30-Jun-18 30-Sep-18 31-Dec-18 31-Mar-19 30-Jun-19 30-Sep-19 31-Dec-19 31-Mar-20 (p)
DE&S Civilian personnel (All ICD 10 Codes) 59 190 58 870 57 890 57 920 52 390 54 420 54 850 55 840 58 070
ACI Injury, poisoning and certain other consequences of external causes 3 020 2 770 3 030 3 360 3 020 3 020 3 130 2 790 2 720
BFO Diseases of the blood forming organs and certain disorders…. 350 450 590 610 520 480 310 260 440
CIR Diseases of the circulatory system 1 590 1 820 2 070 2 140 2 040 2 260 2 590 2 990 1 810
DDS Diseases of the digestive system 4 170 4 200 4 330 4 540 4 130 4 110 3 800 4 050 4 120
DEM Diseases of the ear and mastoid process 670 760 690 620 410 400 450 530 760
DEY Diseases of the eye and adnexa 900 1 000 820 690 530 680 730 890 970
DGY Diseases of the genito-urinary system 2 200 2 360 2 230 2 200 1 910 1 740 1 620 1 750 2 350
DRS Diseases of the respiratory system 9 800 9 720 9 420 8 890 6 830 6 950 6 930 7 300 9 590
EMN Endocrine, nutritional and metabolic diseases 650 600 550 380 310 360 390 510 600
IPO Certain infectious and parasitic diseases 6 170 6 310 6 390 6 100 5 180 5 110 4 970 5 080 6 230
MSD Diseases of the musculoskeletal system and connective tissue 8 080 7 760 7 030 6 840 6 650 6 680 6 790 7 130 7 640
NGB Neoplasms 2 830 2 720 2 470 2 660 2 930 2 430 1 820 1 500 2 720
NSS Diseases of the nervous system 2 630 2 680 2 620 2 500 2 360 2 570 2 760 3 260 2 640
OPP Factors influencing health status and contact with health service - - - - - - - - -
PCP Pregnancy, childbirth and the peurperium 900 990 960 1 030 860 1 010 1 000 840 950
PSD Mental and behavioural disorders 14 180 13 790 13 840 14 550 13 870 15 730 16 530 15 700 13 570
SCO Diseases of the skin and subcutaneous tissue 320 300 310 350 380 460 470 400 300
SID Cause of Absence Not Yet Known 730 660 510 460 480 450 560 880 660
Source: Defence Statistics (Civilian)
2. Sickness absence figures exclude absences w here a person is classed as being on zero pay.
3. 1 day OPP Hospital Appointments have been excluded
(p): data for ‘12 months ending 31 March 2020’ are provisional due to not having f inal confirmation of all the data returns.
Note: Due to organisational changes there is a time series break from 12 months ending 31 March 2019.
12 Months Ending 12 Months Ending
1. Absence days are FTE w orking days lost. e.g. a part time employee (w orking 50% of full time hours) is sick for 7 calendar days, consequently this is 5 w orking days and then 2.5 FTE w orking days.
13
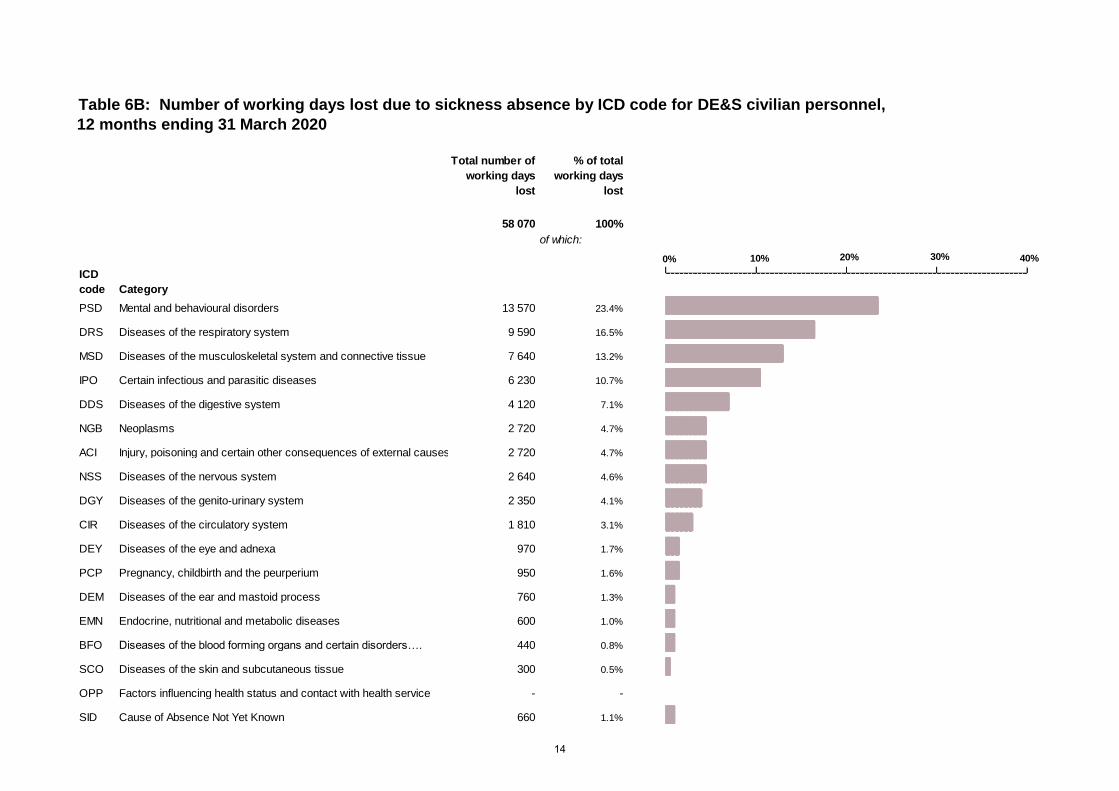
Table 6B: Number of working days lost due to sickness absence by ICD code for DE&S civilian personnel,
12 months ending 31 March 2020
58 070 100%
PSD Mental and behavioural disorders 13 570 23.4%
DRS Diseases of the respiratory system 9 590 16.5%
MSD Diseases of the musculoskeletal system and connective tissue 7 640 13.2%
IPO Certain infectious and parasitic diseases 6 230 10.7%
DDS Diseases of the digestive system 4 120 7.1%
NGB Neoplasms 2 720 4.7%
ACI Injury, poisoning and certain other consequences of external causes 2 720 4.7%
NSS Diseases of the nervous system 2 640 4.6%
DGY Diseases of the genito-urinary system 2 350 4.1%
CIR Diseases of the circulatory system 1 810 3.1%
DEY Diseases of the eye and adnexa 970 1.7%
PCP Pregnancy, childbirth and the peurperium 950 1.6%
DEM Diseases of the ear and mastoid process 760 1.3%
EMN Endocrine, nutritional and metabolic diseases 600 1.0%
BFO Diseases of the blood forming organs and certain disorders…. 440 0.8%
SCO Diseases of the skin and subcutaneous tissue 300 0.5%
OPP Factors influencing health status and contact with health service - -
SID Cause of Absence Not Yet Known 660 1.1%
of which:
ICD
code Category
Total number of
working days
lost
% of total
working days
lost
0% 10% 30% 40%20%
14
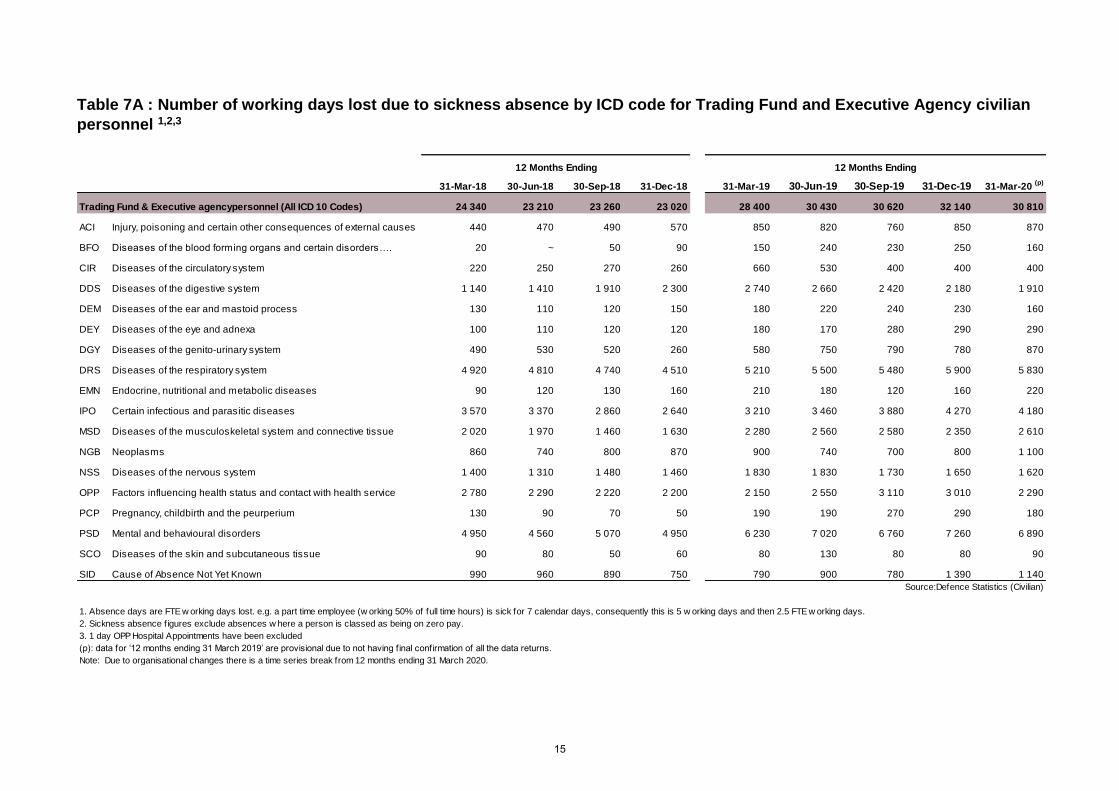
Table 7A : Number of working days lost due to sickness absence by ICD code for Trading Fund and Executive Agency civilian
personnel 1,2,3
31-Mar-18 30-Jun-18 30-Sep-18 31-Dec-18 31-Mar-19 30-Jun-19 30-Sep-19 31-Dec-19 31-Mar-20 (p)
Trading Fund & Executive agencypersonnel (All ICD 10 Codes) 24 340 23 210 23 260 23 020 28 400 30 430 30 620 32 140 30 810
ACI Injury, poisoning and certain other consequences of external causes 440 470 490 570 850 820 760 850 870
BFO Diseases of the blood forming organs and certain disorders…. 20 ~ 50 90 150 240 230 250 160
CIR Diseases of the circulatory system 220 250 270 260 660 530 400 400 400
DDS Diseases of the digestive system 1 140 1 410 1 910 2 300 2 740 2 660 2 420 2 180 1 910
DEM Diseases of the ear and mastoid process 130 110 120 150 180 220 240 230 160
DEY Diseases of the eye and adnexa 100 110 120 120 180 170 280 290 290
DGY Diseases of the genito-urinary system 490 530 520 260 580 750 790 780 870
DRS Diseases of the respiratory system 4 920 4 810 4 740 4 510 5 210 5 500 5 480 5 900 5 830
EMN Endocrine, nutritional and metabolic diseases 90 120 130 160 210 180 120 160 220
IPO Certain infectious and parasitic diseases 3 570 3 370 2 860 2 640 3 210 3 460 3 880 4 270 4 180
MSD Diseases of the musculoskeletal system and connective tissue 2 020 1 970 1 460 1 630 2 280 2 560 2 580 2 350 2 610
NGB Neoplasms 860 740 800 870 900 740 700 800 1 100
NSS Diseases of the nervous system 1 400 1 310 1 480 1 460 1 830 1 830 1 730 1 650 1 620
OPP Factors influencing health status and contact with health service 2 780 2 290 2 220 2 200 2 150 2 550 3 110 3 010 2 290
PCP Pregnancy, childbirth and the peurperium 130 90 70 50 190 190 270 290 180
PSD Mental and behavioural disorders 4 950 4 560 5 070 4 950 6 230 7 020 6 760 7 260 6 890
SCO Diseases of the skin and subcutaneous tissue 90 80 50 60 80 130 80 80 90
SID Cause of Absence Not Yet Known 990 960 890 750 790 900 780 1 390 1 140
Source:Defence Statistics (Civilian)
2. Sickness absence figures exclude absences w here a person is classed as being on zero pay.
3. 1 day OPP Hospital Appointments have been excluded
(p): data for ‘12 months ending 31 March 2019’ are provisional due to not having f inal confirmation of all the data returns.
Note: Due to organisational changes there is a time series break from 12 months ending 31 March 2020.
12 Months Ending 12 Months Ending
1. Absence days are FTE w orking days lost. e.g. a part time employee (w orking 50% of full time hours) is sick for 7 calendar days, consequently this is 5 w orking days and then 2.5 FTE w orking days.
15
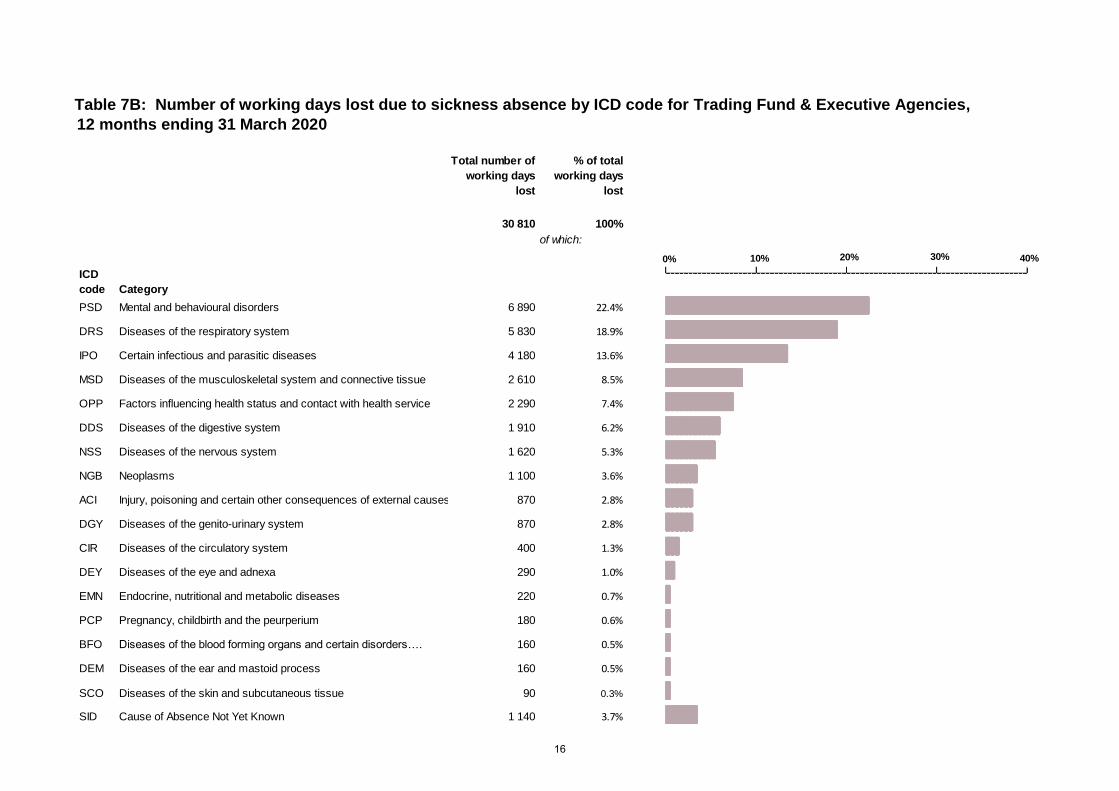
Table 7B: Number of working days lost due to sickness absence by ICD code for Trading Fund & Executive Agencies,
12 months ending 31 March 2020
30 810 100%
PSD Mental and behavioural disorders 6 890 22.4%
DRS Diseases of the respiratory system 5 830 18.9%
IPO Certain infectious and parasitic diseases 4 180 13.6%
MSD Diseases of the musculoskeletal system and connective tissue 2 610 8.5%
OPP Factors influencing health status and contact with health service 2 290 7.4%
DDS Diseases of the digestive system 1 910 6.2%
NSS Diseases of the nervous system 1 620 5.3%
NGB Neoplasms 1 100 3.6%
ACI Injury, poisoning and certain other consequences of external causes 870 2.8%
DGY Diseases of the genito-urinary system 870 2.8%
CIR Diseases of the circulatory system 400 1.3%
DEY Diseases of the eye and adnexa 290 1.0%
EMN Endocrine, nutritional and metabolic diseases 220 0.7%
PCP Pregnancy, childbirth and the peurperium 180 0.6%
BFO Diseases of the blood forming organs and certain disorders…. 160 0.5%
DEM Diseases of the ear and mastoid process 160 0.5%
SCO Diseases of the skin and subcutaneous tissue 90 0.3%
SID Cause of Absence Not Yet Known 1 140 3.7%
of which:
ICD
code Category
Total number of
working days
lost
% of total
working days
lost
0% 10% 30% 40%20%
16
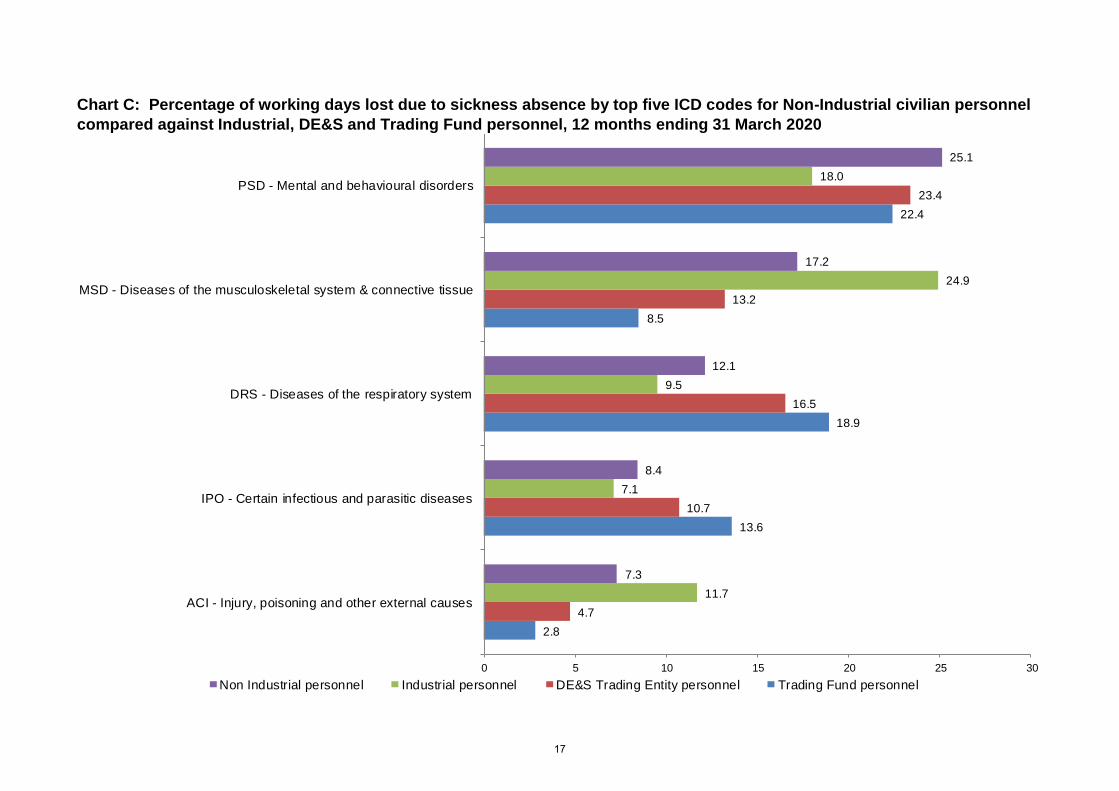
Chart C: rcentage of working days lost due to sickness absence by top fiv ICD codes for Non-Industrial civilian personnel
compared against Industrial, DE&S and Trading Fund personnel, 12 months ending 31 March 2020
Pe e
2.8
n l
13.6
18.9
8.5
22.4
4.7
10.7
16.5
13.2
23.4
11.7
7.1
9.5
24.9
18.0
7.3
8.4
12.1
17.2
25.1
0 5 10 15 20 25 30
Industrial-Chart C: Percentage of working days lost due to sickness absence by top five ICD codes for Non
ACI - Injury, poisoning and other external causes
IPO - Certain infectious and parasitic diseases
DRS - Diseases of the respiratory system
MSD - Diseases of the musculoskeletal system & connective tissue
PSD - Mental and behavioural disorders
Civilia Personnel compared against Industrial, DE&S and Trading Fund personne , 12 months ending 31 March 2020
Non Industrial personnel Industrial personnel DE&S Trading Entity personnel Trading Fund personnel
17
~ fewer than five
(continued) Information
* not applicable
.. not available
- zero or rounded to zero
(e) estimate
(p) provisional
Rounding
Where rounding has been used, totals and sub-totals have been rounded separately and so may not equal the sums of their rounded parts. This also applies to Civilian personnel data expressed in terms of Full-Time Equivalents (FTE).
When rounding to the nearest 10, numbers ending in “5” have been rounded to the nearest multiple of 20 to prevent systematic bias.
Excel tables accompanying this publication
rmation
An updated MOD Disclosure Control and Rounding policy has been published on GOV.UK and we have applied this policy to the statistics on Civilian personnel in the accompanying Excel tables. The policy is available on https://www.gov.uk/government/publications/defence-statistics-policies
oConventionsBackground
18
Disclosure control will still be applied to statistical or numeric information to safeguard the confidentiality of individuals. ‘Disclosure control’ refers to the efforts made to reduce the risk of disclosure, such as applying statistical methods to protect ‘personally identifiable information’ (PII) in aggregate data tables. These safeguards can take many forms (e.g. data suppression, rounding, recoding etc.).
1. Defence Equipment and Support (DE&S) changed status as at 1 April 2015 and was reclassified as a Bespoke Trading Entity. It is reported outside Top Level Budgetary areas, but within level 0. Prior to this it was categorised as a Top Level Budgetary Area, which was part of the Civilian Level 1 total.
2. Changes in the DE&S Trading Entity grade structure meant that they were no longer aligned with those used by the Top Level Budgetary Areas. Therefore, the ‘loss of productivity’ figure that was previously published for this group is no longer possible.
3. As at 1 April 2018 approximately 1,160 posts transferred out of DE&S Trading Entity to form Defence Nuclear Organisation (DNO) as an Executive Agency, additionally approximately 80 personnel within DG Nuclear also transferred to DNO, moving from TLBs. DNO sickness absence figures have been reported from 12 months to 31 March 2019 (whole 12 months). Therefore, there is a time series break for both DE&S trading entity and Trading Fund & Executive agencies from 12 months ending 31 March 2019 onwards.
4. The value of lost productivity is calculated by applying the latest available capitation rates for Pay, ERNIC and SCAPE for civil service grades and multiplying them by the number of working days lost for each civil service grade.
Background notes
Symbols and Conventions
n tes (cont) Info
ERNIC (Earnings related National Insurance contributions) is the National Insurance contribution to the department.
19
SCAPE (Superannuation Contributions Adjusted for Past Experience) is the pension element to the department.
The capitation rates are based on MOD averages for the respective year. The pay element of the capitation rate is basic pay only; no allowances are included. The capitation rates do not include overhead costs and these are not held centrally. Capitation rates are calculated for all grades.
Working Days Lost: Average working days lost are the number of FTE days lost to sickness absence by civilian personnel within a 12 month rolling period.
Civilian Level 0: Includes: Top Level Budgetary areas (TLBs)
Defence, Equipment & Support (DE&S) Trading Entity Trading Fund & Executive Agencies
Excludes: Royal Fleet Auxiliary Locally Engaged Civilians
Army TLB: (previously reported as Land Forces) Performs a similar role to Navy Command within the context of trained Army formations and equipment.
Defence Equipment & Support: Defence Equipment & Support (DE&S) equips and supports the UK’s Armed Forces for current and future operations. It acquires and supports through-life, including disposal, equipment and services ranging from ships, aircraft, vehicles and weapons, to electronic systems and information services. DE&S satisfies on-going requirements including food, clothing, medical supplies, maintenance and temporary accommodation, as well as operating HM Naval Bases and the joint supply chain for land, sea and air.
Defence Infrastructure Organisation (DIO): established on 01 April 2011 replaced Defence Estates and includes TLB property and facilities management functions previously situated within other TLBs.
Defence Science and Technology Laboratory: is an Executive Agency. It supplies impartial scientific and technical research and advice to the MOD and other government departments.
Defence Statistics: On 1 April 2013 the Directorate formerly known as DASA split into two one-star analytical business areas within the Head Office Strategy Directorate - Defence Economics and Defence Statistics. These two business areas continue to provide National Statistics on Defence and other corporate information, forecasting, planning, consultancy, analytical research and advice to the MOD.
Defence Nuclear Organisation: is the sponsor for the SDA as an Executive Agency. It became an Executive Agency on a phased approach after splitting out from DE&S. It was reported as a full Executive agency on April 2018.
Full Time Equivalence (FTE): is a measure of the size of the workforce that takes account of the fact that some people work part-time. Prior to 1 April 1995 part-time employees were assumed to work 50 per cent of normal hours, but since then actual hours worked has been the preferred
Glossary
20
methodology. The average hours worked by part-time personnel is about 68 per cent of full-time hours.
Head Office & Corporate Services (HO&CS): was established in April 2012. Lead areas of activity include Senior Finance Office (SFO) responsibility for ensuring that decisions are taken with due regard to affordability and value for money, acting as Head of Establishment for London HO Buildings and associated support requirements, Production of the Department’s Resource Accounts and Governance support for MOD Trading Funds.
HQ Air Command: Air Command incorporates the RAF's Personnel and Training Command and Strike Command with a single fully integrated Headquarters, which equips the RAF to provide a coherent and coordinated single Air focus to the other Services, MOD Head Office, the Permanent Joint Headquarters and the rest of MOD.
Hydrographic Office: The UK Hydrographic Office is responsible for surveying the seas around the UK and other areas to aid navigation.
ICD International Statistical Classification of Diseases and Health–related Problems. ICD is a coding system for diseases and signs, symptoms, abnormal findings, complaints, social circumstances and external causes of injury or diseases, as classified by the World Health Organisation
Industrial: Industrial personnel are civilian personnel employed primarily in a trade, craft or other manual labour occupation. This covers a wide range of work such as industrial technicians, air freight handlers, storekeepers, vergers and drivers.
Joint Forces Command (JFC): See UKStratCom
Locally engaged civilians: MOD employs a number of civilian personnel overseas, known as Locally engaged civilians (LECs). The definition of a Locally engaged civilian is an employee who has been recruited locally as a ‘servant of the Crown’. In other words, they have not been recruited through fair and open competition in the UK under the Civil Service Order in Council and they are not therefore members of the Home Civil Service or the Diplomatic Service. LECs are also employed on terms and conditions analogous with local employment law and market forces, and not those of the UK.
Ministry of Defence (MOD): This United Kingdom Government department is responsible for implementation of government defence policy and is the headquarters of the British Armed Forces. The principal objective of the MOD is to protect the United Kingdom and its values and interests abroad. The MOD manages day to day running of the Armed Forces, contingency planning and defence procurement.
Navy Command: is the TLB for the Naval Service. As at 1 April 2010 Fleet TLB was renamed to Navy Command. Fleet TLB was formed on 1 April 2006 by the merger of the Commander-in-Chief Fleet and the Chief of Naval Personnel/ Commander-in-Chief Naval Home Command.
Non-industrial: Civilian personnel who are not primarily employed in a trade, craft or other manual labour occupation. This covers a wide range of personnel undertaking work such as administration, analysis, policy, procurement, finance, medical, dental, teaching, policing, science & engineering.
Royal Fleet Auxiliary: The Royal Fleet Auxiliary is a civilian-manned fleet, owned by the MOD, which supports Royal Navy ships around the world, supplying warships with fuel, ammunition and supplies. The RFA fleet is fully integrated into the RN’s command and control system and forms a vital part of maritime operations.
Strength: The total number of personnel employed by the Department at or within a specific time period.
Top Level Budgetary Area (TLB): The major organisational groupings of the MOD directly responsible for the planning, management and delivery of departmental capability.
Trading Funds: Trading Funds were introduced by the Government under the Trading Funds Act 1973 as a ‘means of financing trading operations of a government department which, hitherto, have been carried out on Vote’. They are self-accounting units that have greater freedom than other government departments in managing their own financial and management activities. They are also free to negotiate their own terms and conditions with their personnel and for this reason their grading structures do not always match that of the rest of the Ministry.
UKStratCom (formerly Joint Forces Command (JFC)): was established at 1 April 2012 to ensure that a range of military support functions covering medical services, training and education, intelligence and cyber are organised in an efficient and effective manner to support success on operations, supporting investment in joint capabilities, strengthening the links between operational theatres and top level decision making. Joint Forces Command achieved Full Operational Capacity as at 1 April 2013, absorbing additional support roles from lead service TLBs. As of October 2019 JFC changed their official title to UKStratcom.
21
Working Days: This follows Cabinet Office definition, setting a maximum number of sickness absence days at 225 days per person and excludes data for weekends, annual leave and bank holidays.
The background quality report provides more detailed information about the quality of data used to produce this publication and any statistics derived from that data.
https://www.gov.uk/government/statistics/mod-civilian-personnel-sickness-absence-quarterly-report-background-quality-reports
Defence Statistics (Civilian) conducted a public consultation on reducing publication of Civilian Personnel Sickness Absence from quarterly to once a year for the following reasons:
a. The information can still be provided to internal customers, but published less frequently, reducing the time spent on ministerial submissions and report commentary.
b. To ensure best use of resource in a context of tightening resources and high levels of internal demand for analysis.
c. To free up resource to spend on reactive ad hoc analysis to meet our policy customers’ requirements.
Revisions
Occasionally errors can occur in statistical processes; procedures are constantly reviewed to minimise this risk. Should a significant error be found the publication on the website will be updated and an errata slip published documenting the revision.
This report contains provisional figures for the ’12 months ending 31 March 2020’ due to not having final confirmation of all the data returns. A revised iteration of this report will look to be published once the returns have been finalised.
Background Quality Report
Frequency of publication
Contact Us
Defence Statistics welcome feedback on our statistical products. If you have any comments or questions about this publication or about our statistics in general, you can contact us as follows:
Defence Statistics (Civilian Personnel)
Email: [email protected]
If you require information which is not available within this or other available publications, you may wish to submit a Request for Information under the Freedom of Information Act 2000 to the Ministry of Defence. For more information, see:
https://www.gov.uk/make-a-freedom-of-information-request/the-freedom-of-information-act
Other contact points within Defence Statistics are:
Defence Expenditure Analysis 030 6793 4531 [email protected]
Naval Service Workforce 023 9254 7426 [email protected]
Army Workforce 01264 886175 [email protected]
RAF Workforce 01494 496822 [email protected]
22
Tri-Service Workforce 020 7807 8896 [email protected]
Civilian Workforce 020 7218 1359 [email protected]
Health Information 030 6798 4423 [email protected]
If you wish to correspond by mail, our postal address is:
Defence Statistics (Civilian Personnel) Ministry of Defence, Main Building Floor 3 Zone M Whitehall London SW1A 2HB
Further Information