ckx: pathways to education: charting a path to impact
TRANSCRIPT
Charting a Path to ImpactMapping poverty and high dropout rates in Canada
CKX Summit | Toronto | November 21, 2014 Maureen Thompson, Director, Program Expansion Konrad Glogowski, Director, Research and Knowledge Mobilization

The Plan
1. Introduction to Pathways to Education 2. The Mapping Tool: Insights, Strengths, and Limitations 3. Expansion, Partner Engagement, Community Knowledge 4. Demo 5. Q and A

What is Pathways to Education?
• Community-based high school dropout prevention program • Comprehensive, providing four areas of support:
Academic | Social Development Financial | Advocacy & Relationships
• Strong emphasis on evaluation and measuring results • Adaptable to the local context • Reliant on partnerships and relationships • In 15 communities across Canada • Support wraparound programs in two more communities

Change: Break the cycle of poverty in low income communities
Obstacles: Graduation from high school and postsecondary access
Intervention best practices:
To be effective, “programs must be comprehensive and directed towards all facets of a student’s life. As youth leave school prematurely for a multitude of of reasons, services and supports must be flexible and customized to meet individual student needs” (Ferguson, Tilleczek, Boydell, & Rummens, 2005).
Pathways Design Factors

Pathways Design Factors
Community Role: Program delivery, program adaptation, identification of community need, readiness and capacity
Pathways Canada Role: Knowledge sharing, research and knowledge mobilization, resource development, program development and implementation support, data management and result measurement

Why a Mapping Tool?

What Already Exists: An Opportunity
Many tools and resources exist, but they are generally inadequate for our needs:
Maps: Similar national or provincial maps exist now but they generally show only the Census Division level. There are some valuable municipal maps that provide greater detail.
Reports and Statistics: A wide variety of reports is accessible, but the data we need is scattered, incomplete, or not focused on smaller geographic units; Generalizations mask the pockets we want to identify and understand.
Data Access Fees: Specific data sets for smaller geographies have to be purchased from Statistics Canada.

The Pathways to Education Mapping Tool was designed to:
• Identify existing and potential educationally at-risk communities in Canada; understand poverty trends;
• Refine the process for identifying high-need communities for potential expansion/ partnerships;
• Support a scan of existing community organizations and services;
• Inform program expansion, planning, and fund development work;
• Help position Pathways as issue leader with strong, data-based insights into poverty trends and educational attainment of low-income youth;
• Document and analyze unique socio-demographic and economic contexts of existing and potential Pathways sites.
Purpose
8

Geographic LevelsCensus Division (CD): Group of neighbouring municipalities (such as county, municipalité régionale de comté, and regional district) or their equivalents. Census divisions are intermediate geographic areas between the province/territory level and the municipality.
Census Subdivision (CSD): General term for municipalities.
Census Metropolitan Area (CMA): Grouping of census subdivisions comprising a large urban area. To become a CMA, an area must register an urban core population of at least 100,000 at the previous census.
Census Tract (CT): Area that is small and relatively stable. Census tracts usually have a population between 2,500 and 8,000 persons.

• School-aged children 8-11
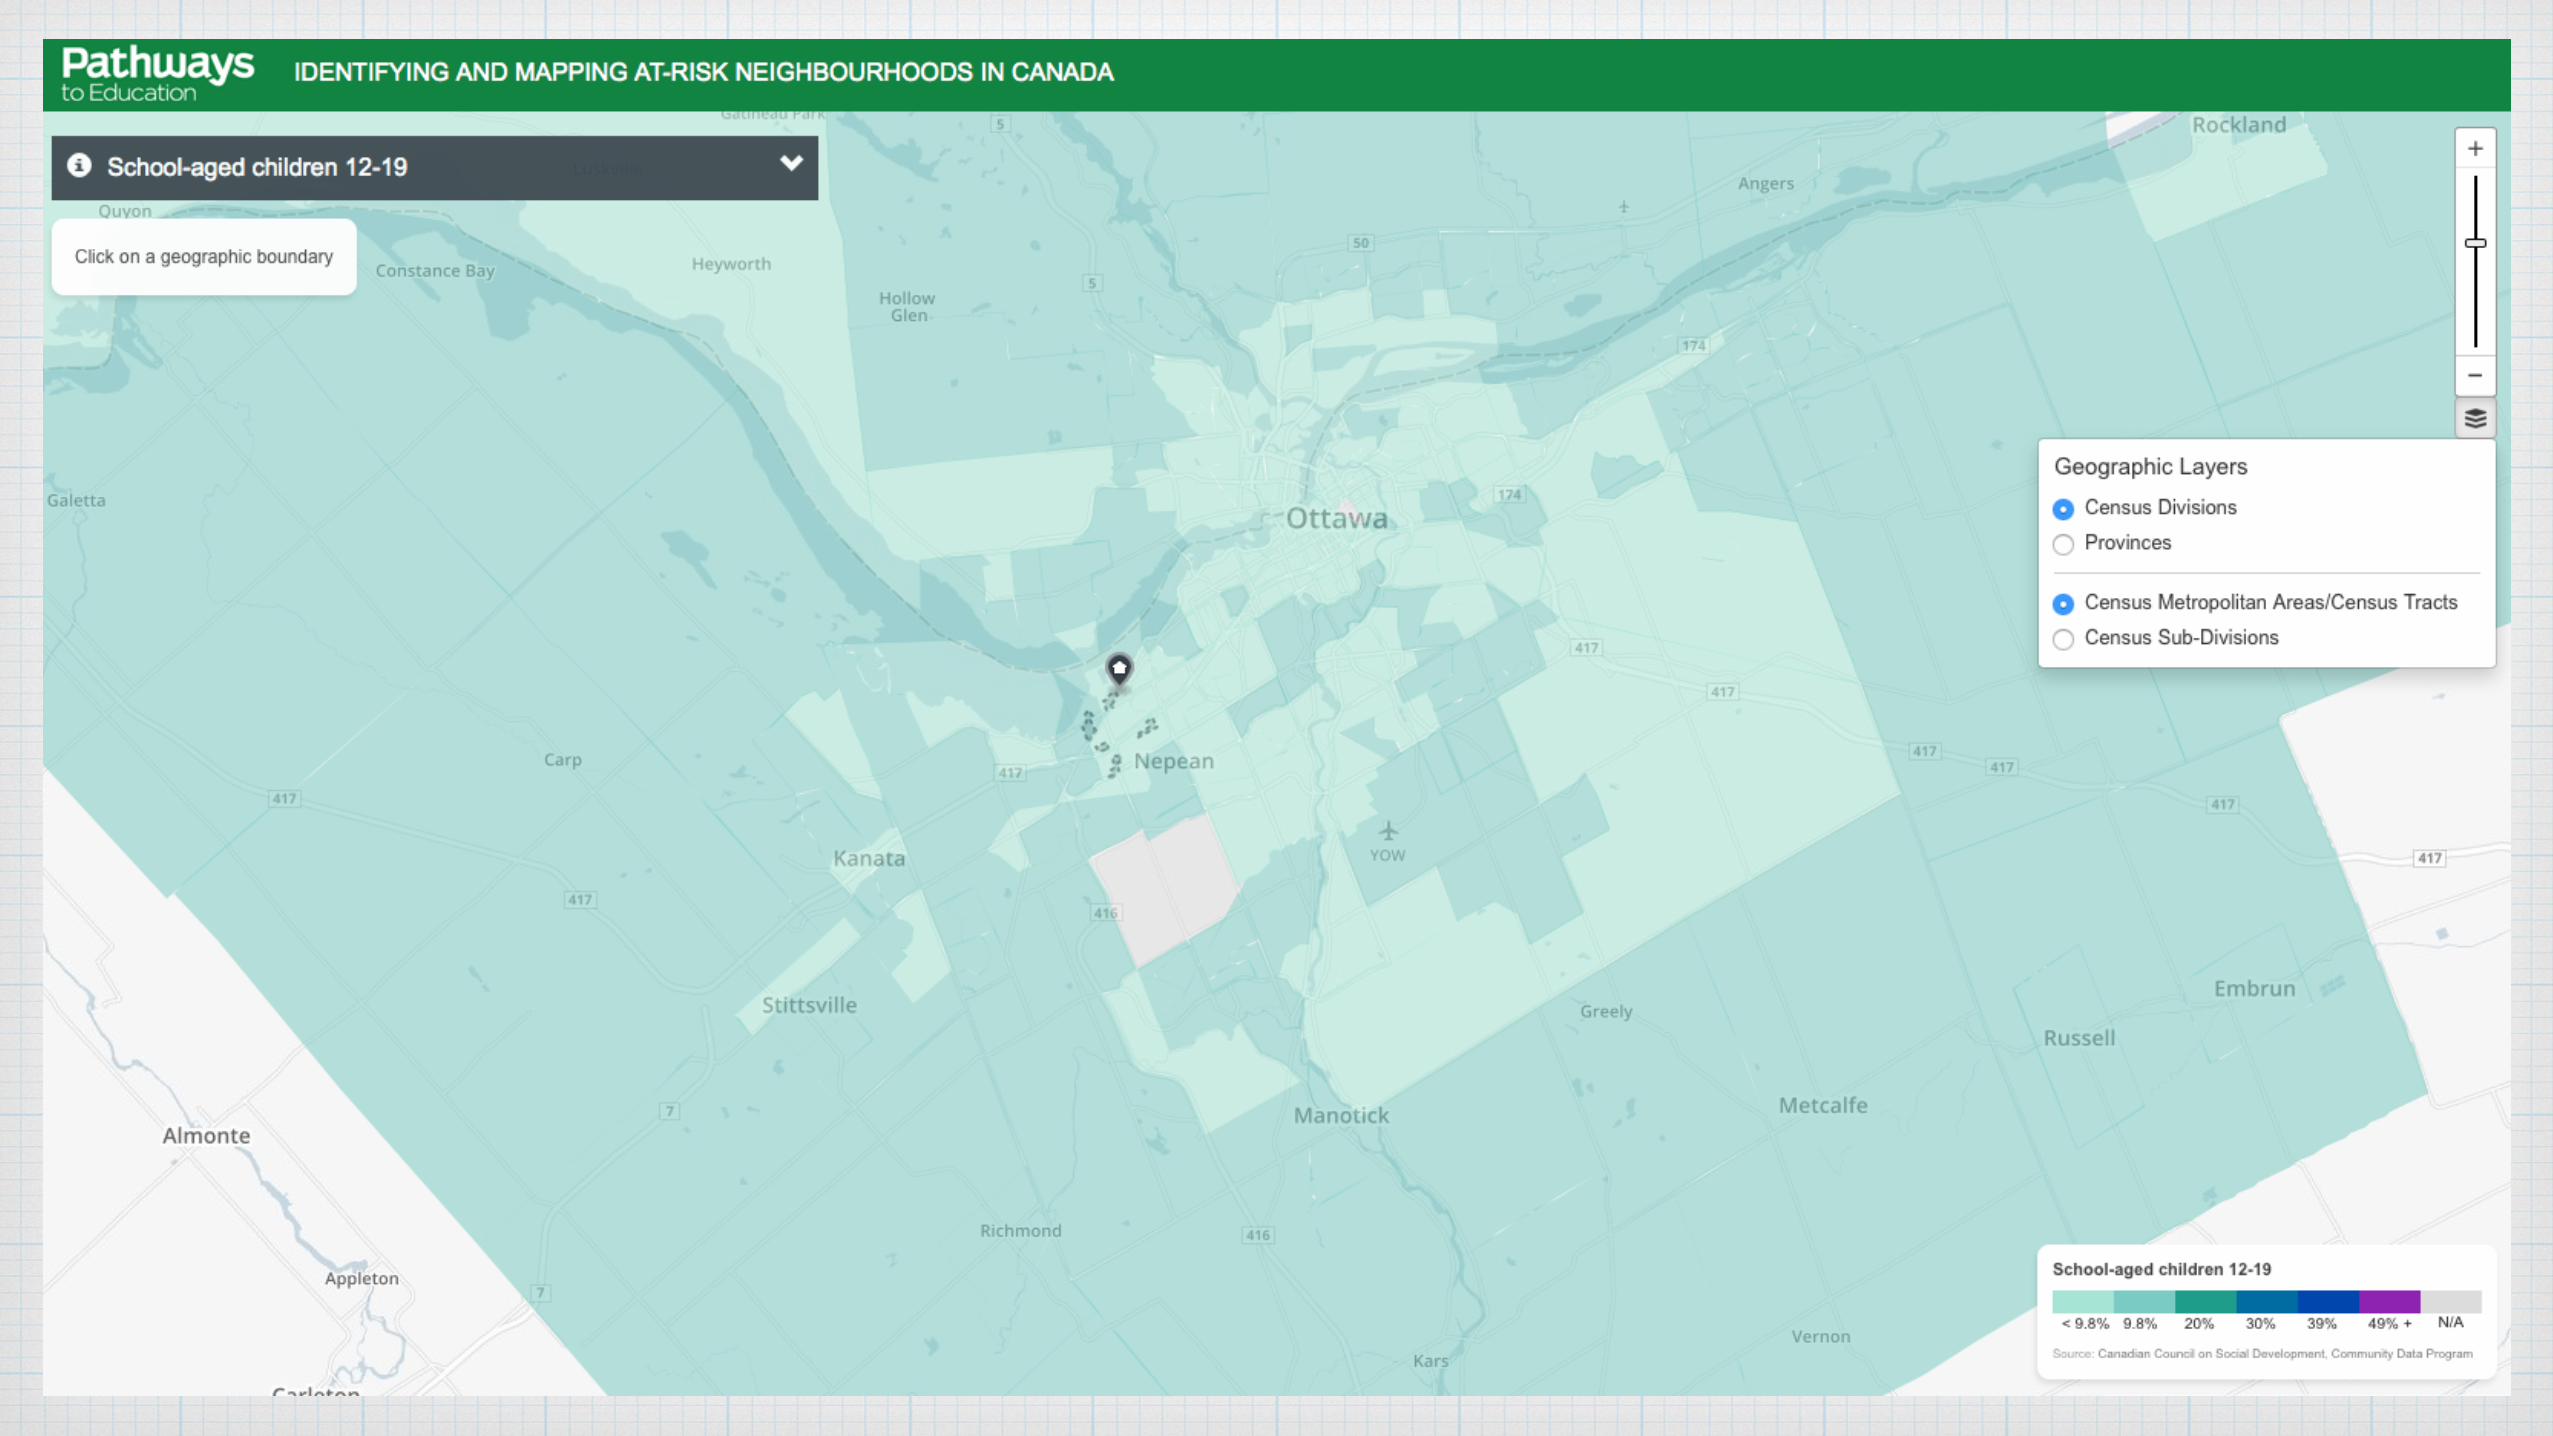
• School-aged children 12-19
• Households in subsidized housing
• Recent immigrants
• Population with no knowledge of English or French
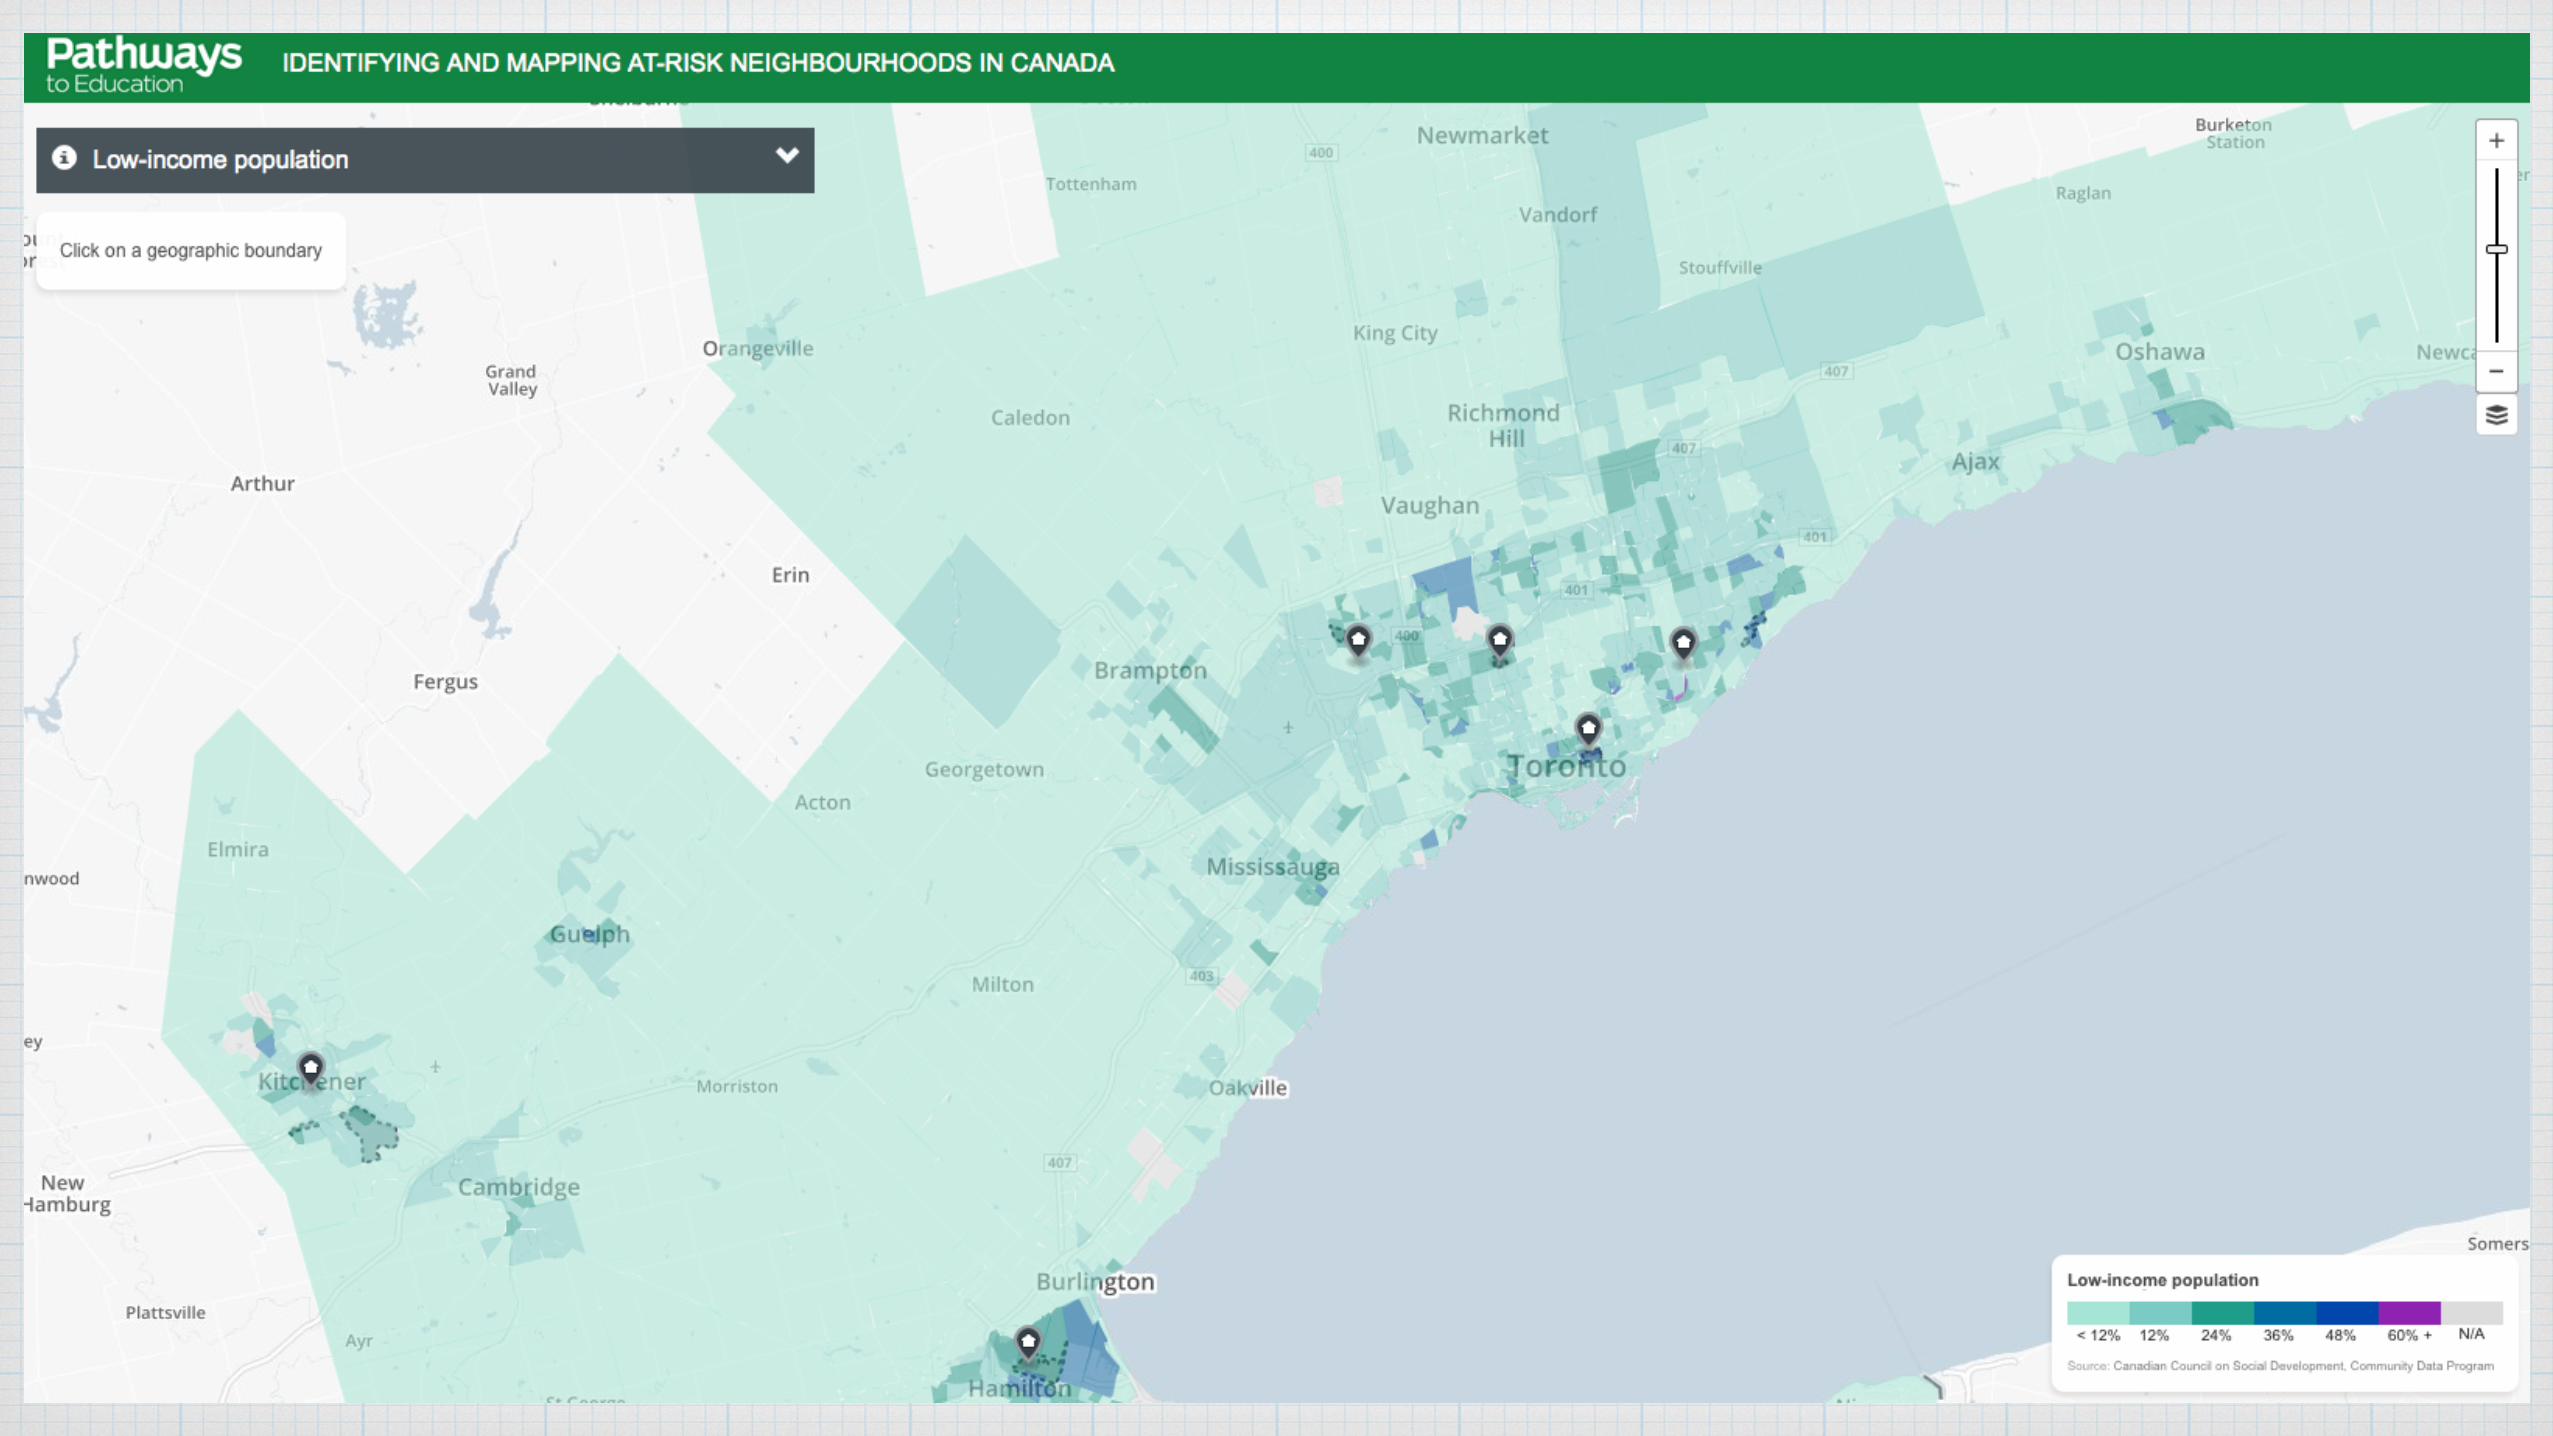
• Low-income population
• Aboriginal population
14 IndicatorsThe tool includes a set of core indicators to identify educationally-at-risk communities:
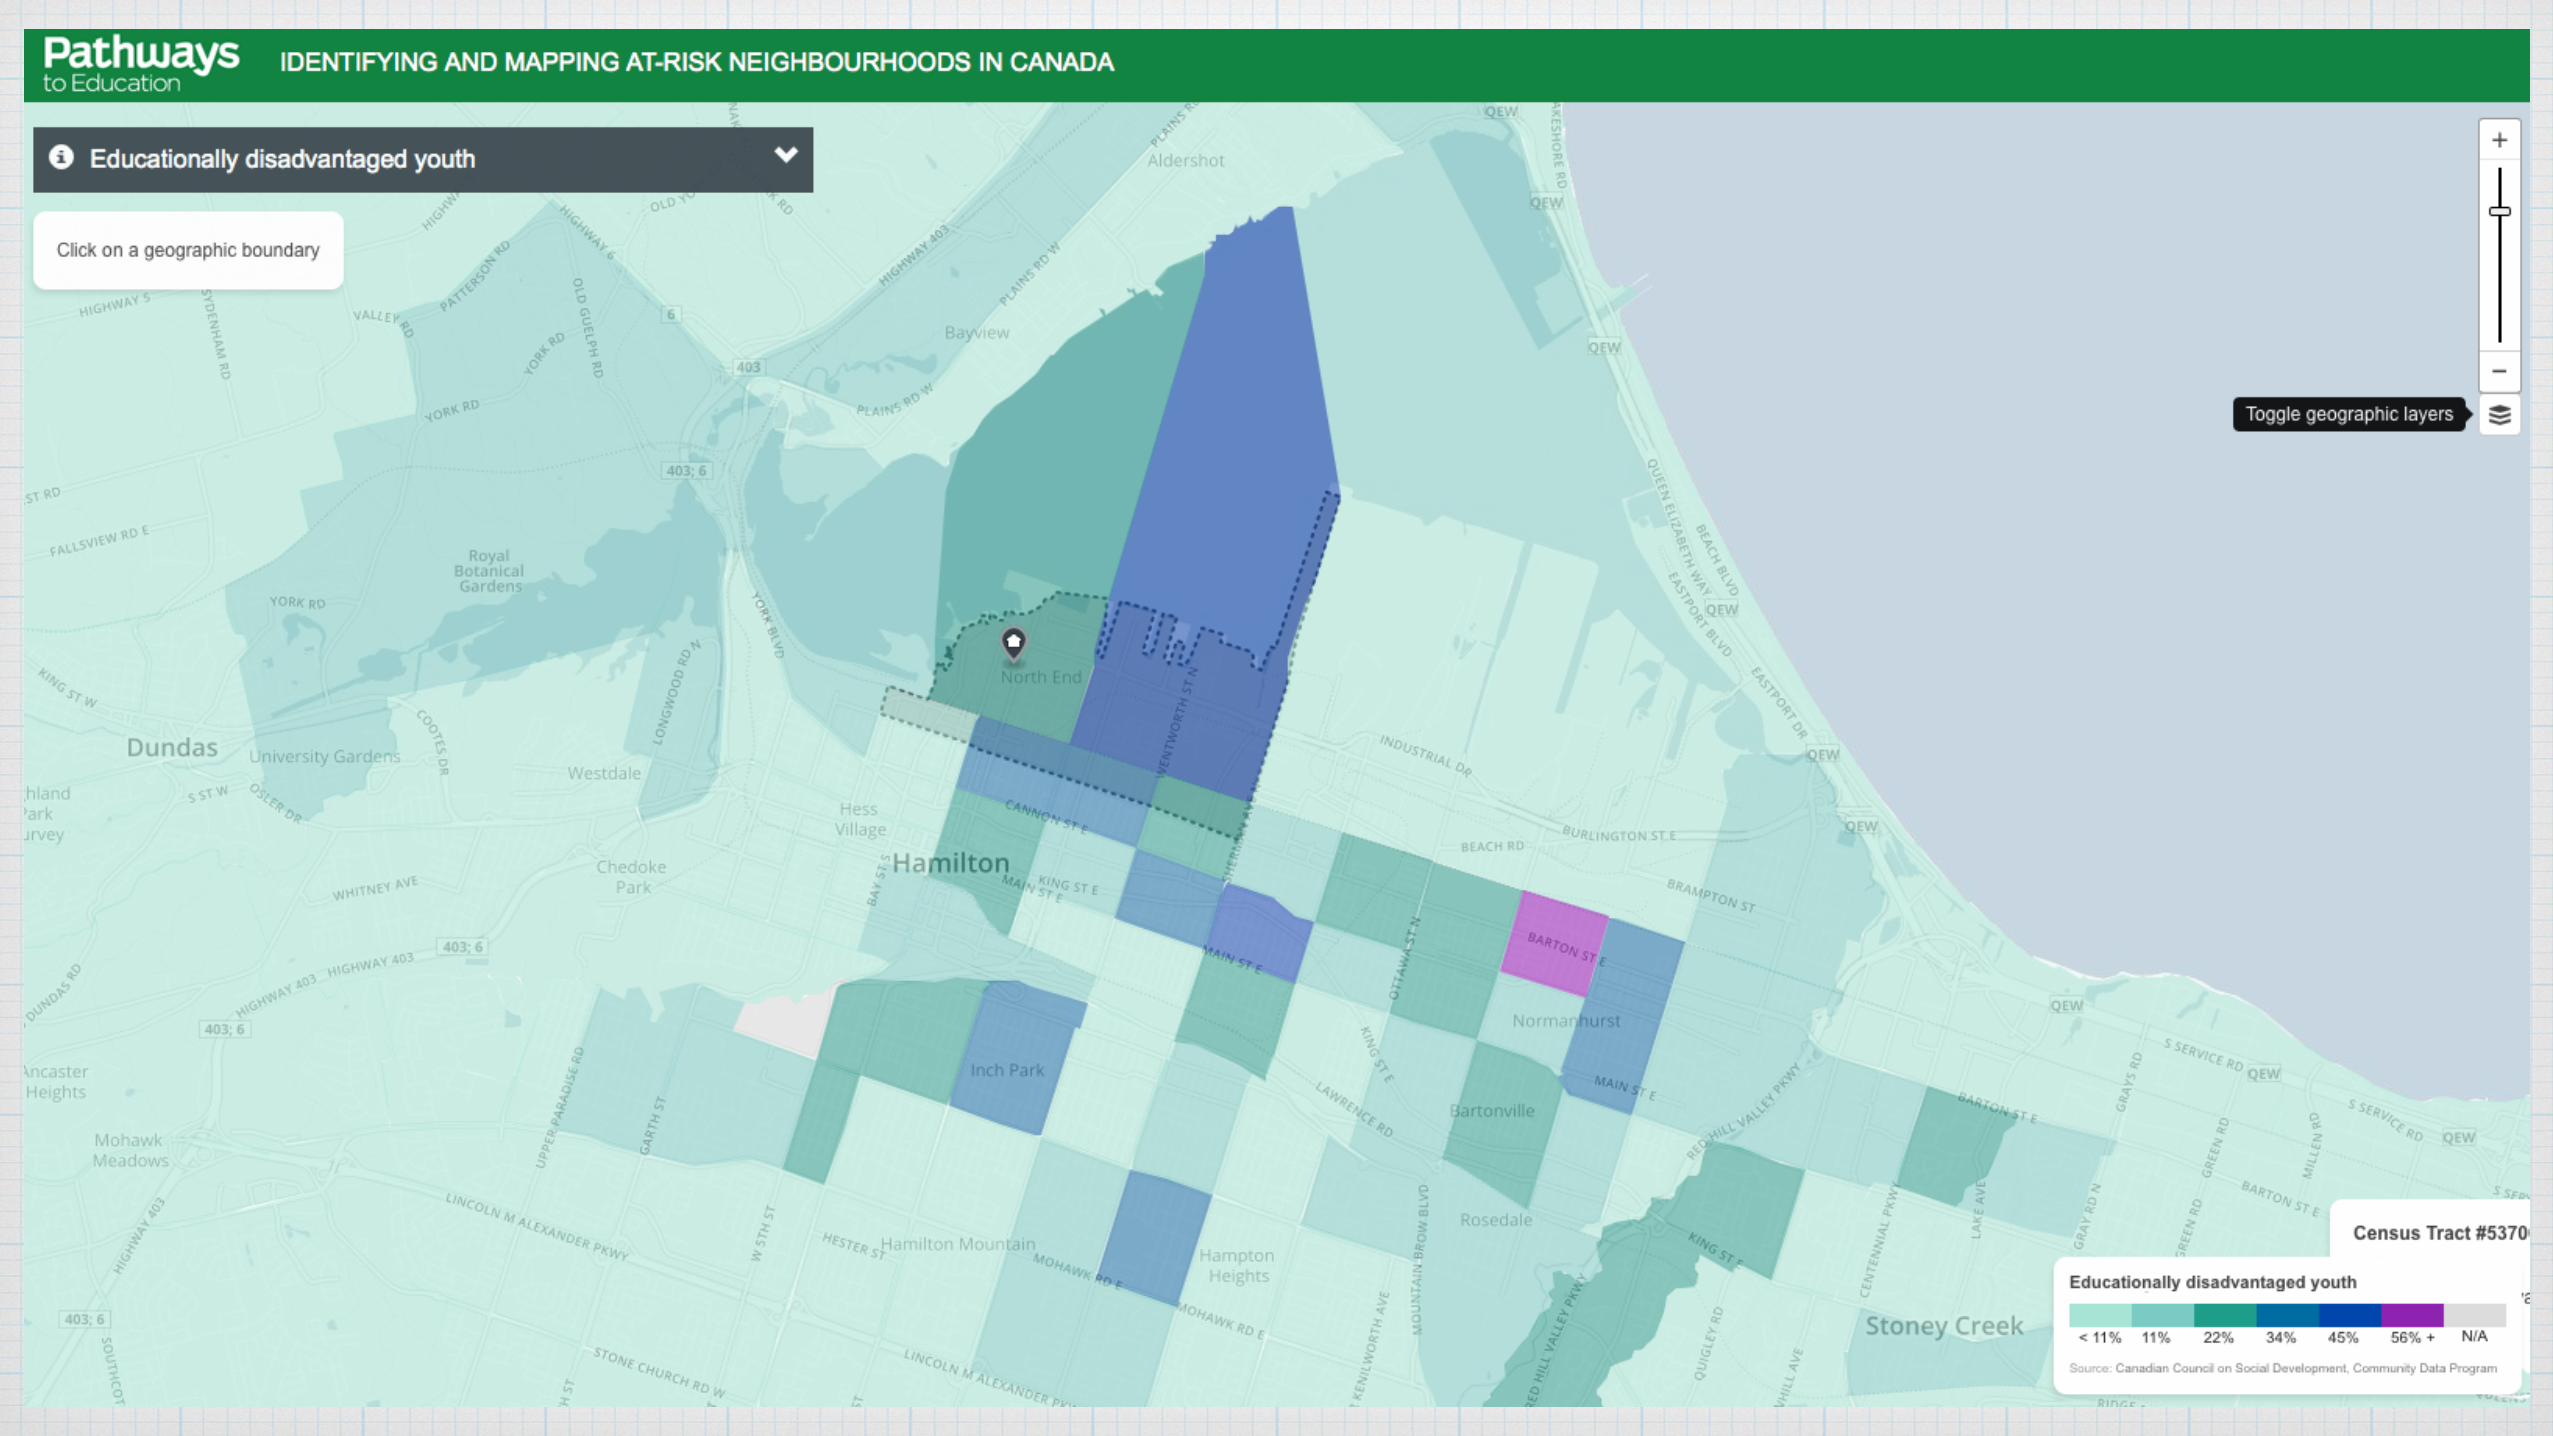
• Educationally disadvantaged youth
• Educational Assets: Youth (20-34) with certificate, diploma or degree
• Educational Assets: Adults (35-64) with certificate, diploma or degree
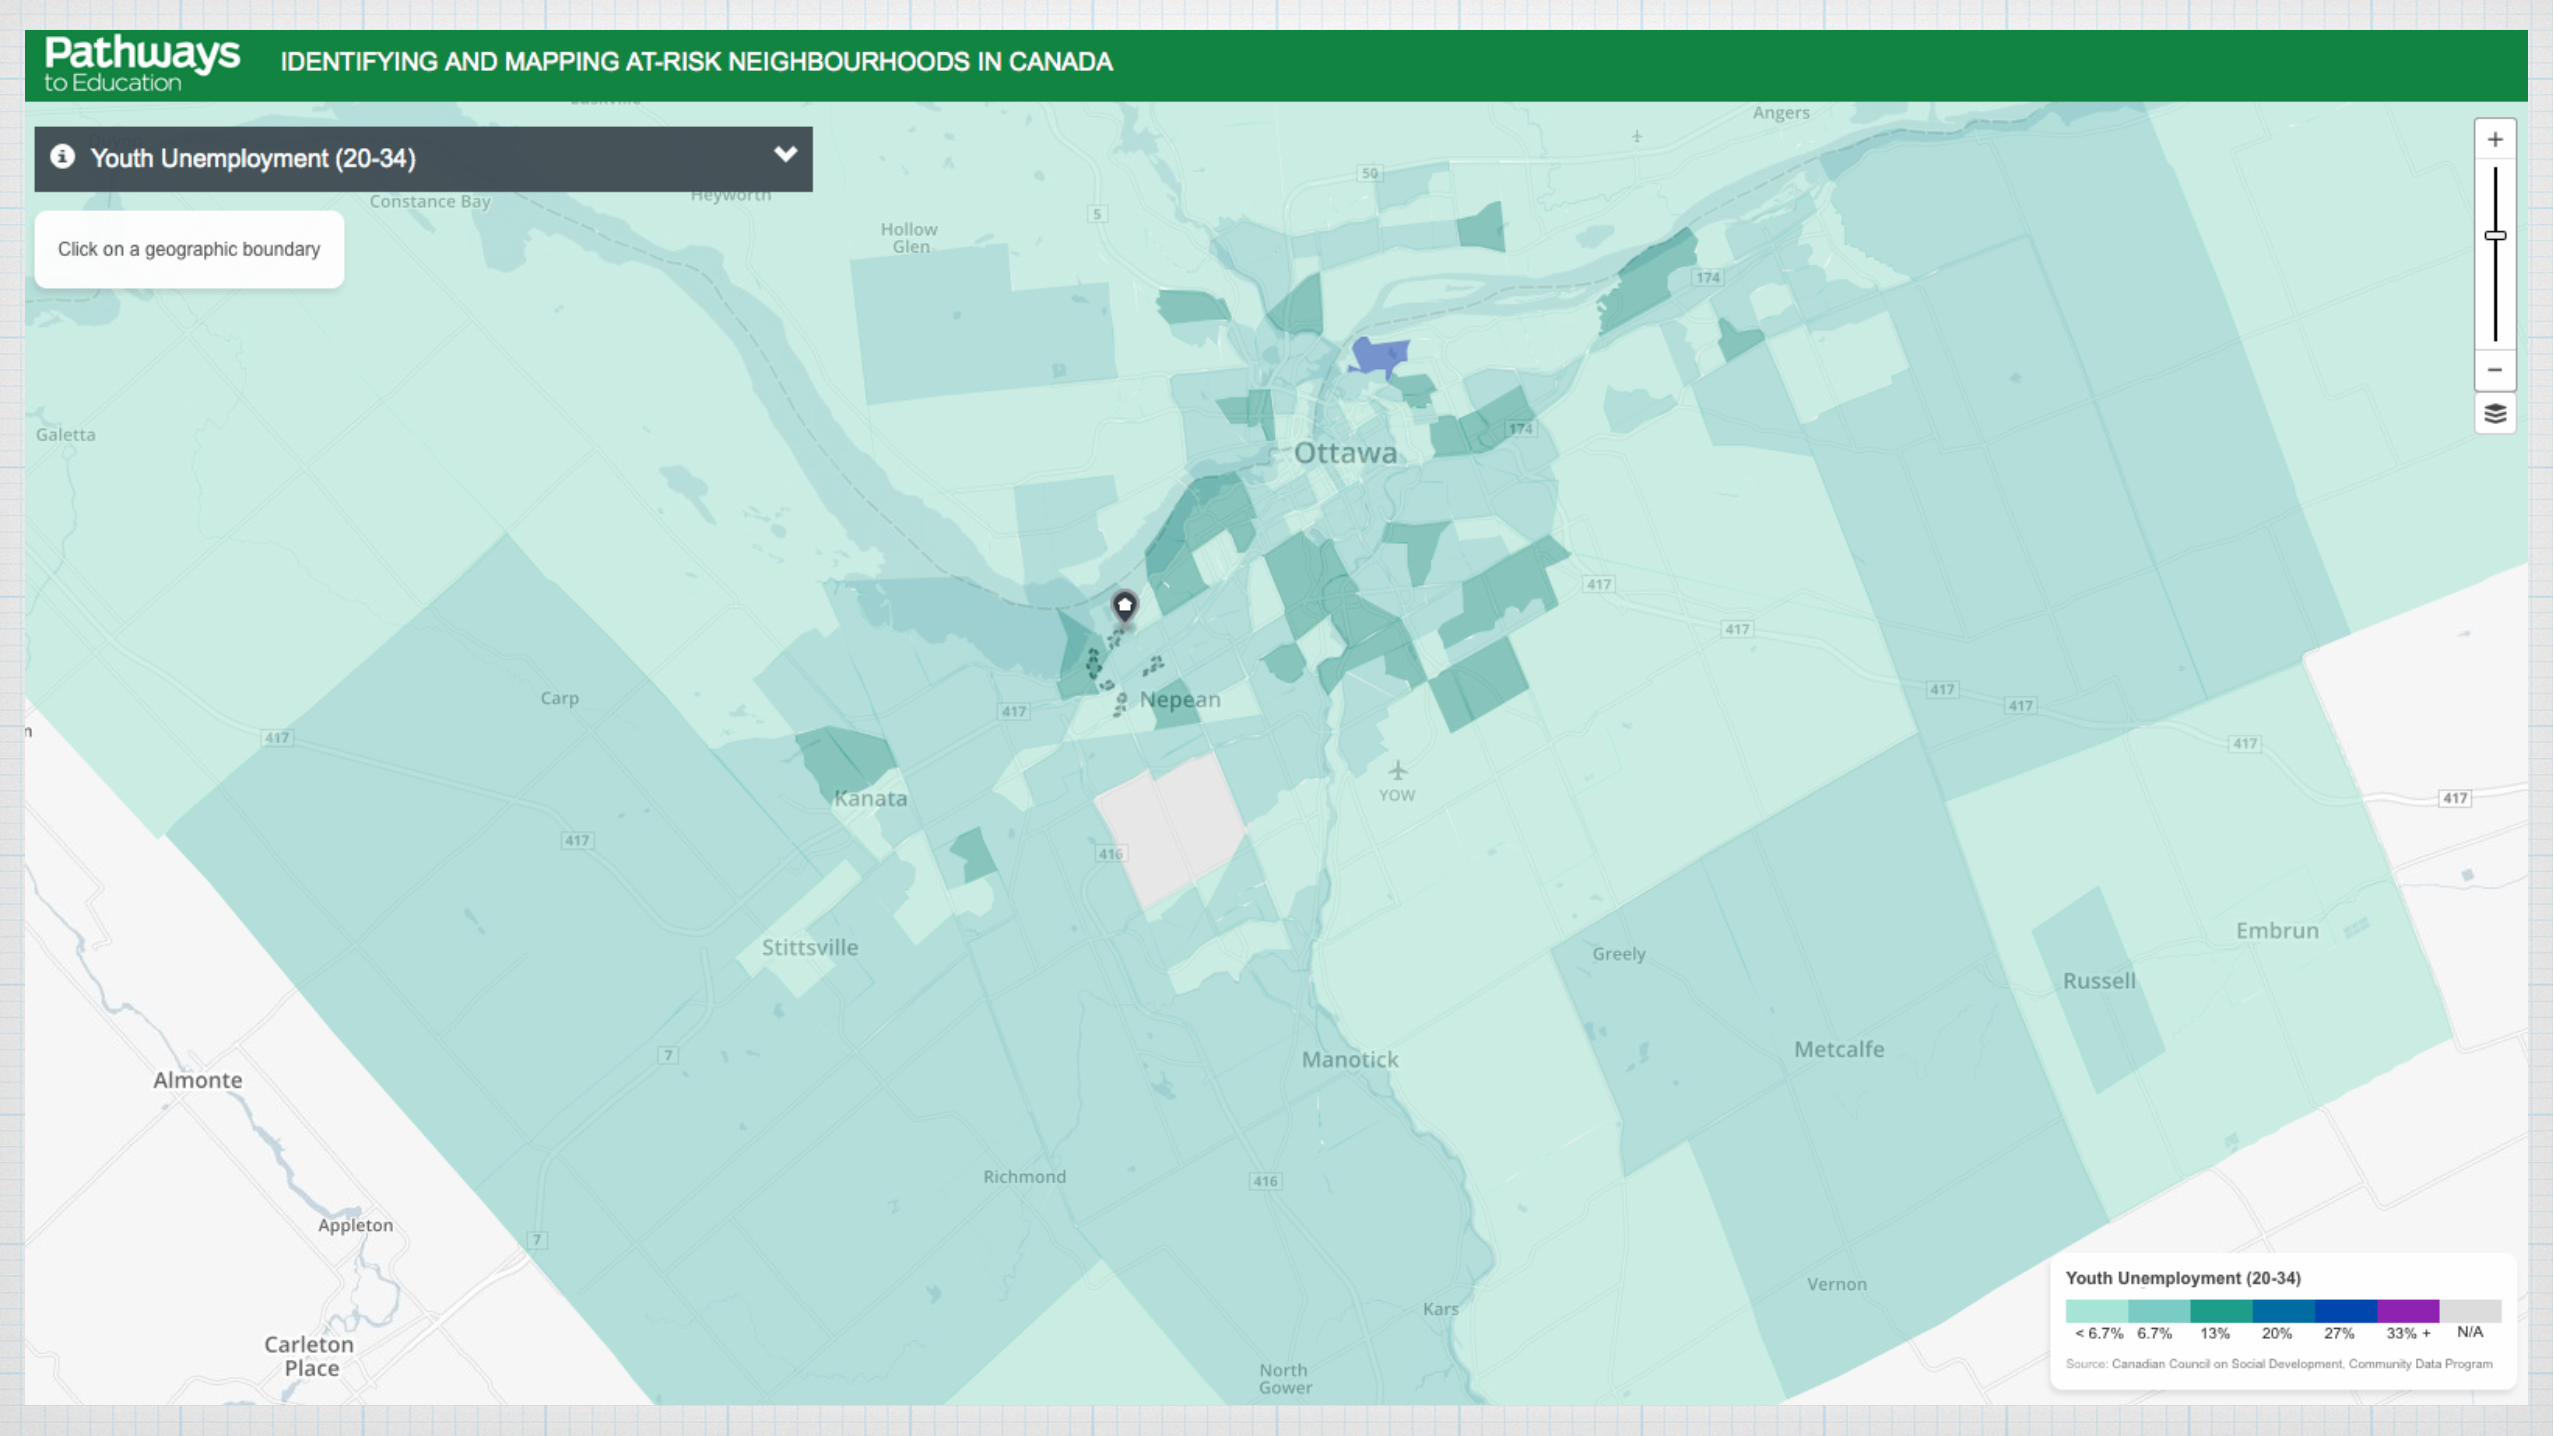
• Youth unemployment (20-34)
• Adult unemployment (35-64)
• Aboriginal youth (15-24)
• Immigrant youth (15-24)

Census Divisions in Canada
11

Indicators (Pull-Down)
Layers toggle
Selection Pop-Up
Zoom slider

All indicators forselected region


Calgary


Insights
The Mapping Tool:
• Builds on existing Statistics Canada data;
• Confirms that existing Pathways programs are in high-need communities;
• Provides a quick at-a-glance understanding of relevant statistics and trends across the country;
• Can be used to identify and further analyze educationally at-risk communities; Assists Pathways Canada in identifying potential communities for future partnership.

Community Engagement

Using the MapsConfirm we are in the right communities: •2 sites are not on the map due to their size •13 of current 15 are on the map •13 of 15 programs in one or more of their city’s highest need CTs
Identify census tracts in cities without a Pathways program that have the highest CNF. •The map has identified 19
Reach out to key stakeholders in the identified neighbourhoods •Have these neighbourhoods been prioritized for municipal anti-poverty initiatives? •Have these neighbourhoods identified youth poverty/high school education as priorities? •Which of these neighbourhoods are ready/done some initial work? •Do they have capacity for collaboration and intervention? •Are there local interventions for earlier ages? • Is there sustainable funding and fund-raising capacity locally or regionally?

Community Engagement Checklist
• Is there a need? • Are community members likely to participate? • Is the community ready to do this? • Are there community organizations that can deliver the program? • Does the community and region have the resources to support the
program over the long term?

• Is there a need for the program? • Is this a community with a high level of poverty? • Is this a community with low levels of educational attainment and post-secondary participation?
• Was our information up to date? • Is the need measurable? • Can the data provide us with a baseline? • Is there a gap in services related to these issues?
Community Engagement Checklist

Community Engagement Checklist
• Will the community participate in the program? • Is youth educational attainment a priority issues for youth, parents, former residents, schools, community services?
• What is the history of successful interventions? • How do community members feel about the services in their community?
• What is the make-up of the community?

• Is the community ready to do this? • Is there cohesion in the community on this issue? • Is there a history of partnership around community issues? • Has there been community capacity building? • Are there successful interventions for younger age groups? • Has the region identified this as a priority?
- Government, municipal, provincial - Potential funders - Other key stakeholders
Community Engagement Checklist

• Are there community organizations that can deliver the program?
• Are there one or more organizations capable of delivering all or parts of the program?
• Are they capable of doing this over the long term? • Do they have the right connections with the community? • Do they have the right connections with potential partners and
funders?
Community Engagement Checklist

Does the community and region have the resources to support the program over the long term?
• Program funding • Capable staff and volunteers • Appropriate space • Internships • Post-secondary institutions • Relevant in-kind donations
Community Engagement Checklist

Winnipeg’s North End: North Point Douglas, Lord Selkirk Park and William Whyte
• Top 2 census tracts in Winnipeg • Surrounding areas may have fewer children and more mixed income • Boundaries determined by some local context/program size considerations • Community Engagement Checklist:
- Community Need - Community Readiness - Community Capacity - Right Organization - Availability of Local Funding
Case Study 1

Regent Park: Regent Park (North & South), Moss Park
• Top Census Tract in Toronto: North Regent Park • Surrounding census tracts include less population density, a large park,
commercial space, Cabbagetown and Corktown • Boundaries determined by local context • Community Engagement Checklist:
- Community Need - Community Engagement - Community Capacity - Right Organization - Availability of Local Fundraising
Case Study 2

Case Study 3Montreal Community
• Highest CNF census tract in Canada • Two Community Engagement processes: 2007 & 2013. Both unsuccessful • Community Engagement Checklist:
- Community Need - Community Engagement - Community Capacity - Right Organization - Availability of Funding

New Brunswick City
• 7 high need neighbourhoods on the map, 1 in the top 5 nationally • Community Engagement Process underway • Community Engagement Checklist:
- Community Need - Community Engagement - Community Capacity - Right Organization - Availability of Funding
Case Study 4

Charting a Path to Impact
Maureen Thompson: [email protected] Konrad Glogowski: [email protected]
Thank you!