clark public school district · 2019-12-18 · clark public school district table of contents...
TRANSCRIPT

CLARK PUBLIC
SCHOOL DISTRICT
Clark Public School District Clark, New Jersey
Comprehensive Annual Financial Report For The Fiscal Year Ended June 30, 2019

COMPREHENSIVE ANNUAL
FINANCIAL REPORT
of the
Clark Public School District
Clark, New Jersey
For The Fiscal Year Ended June 30, 2019
Prepared by
Clark Public School District Finance Department

CLARK PUBLIC SCHOOL DISTRICT TABLE OF CONTENTS
Letter of Transmittal Organizational Chart Roster of Officials Consultants and Advisors
Independent Auditor's Report
INTRODUCTORY SECTION
FINANCIAL SECTION
REQUIRED SUPPLEMENTARY INFORMATION-PART I
Management's Discussion and Analysis
Basic Financial Statements
A. District-wide Financial Statements:
A-1 A-2
Statement of Net Position Statement of Activities
B. Fund Financial Statements:
Governmental Funds: B-1 Balance Sheet B-2 Statement of Revenues, Expenditures, and Changes in Fund Balances B-3 Reconciliation of the Governmental Funds Statement of Revenues, Expenditures,
and Changes in Fund Balances with the District-Wide Statement of Activities
Proprietary Funds: B-4 Statement of Net Position B-5 Statement of Revenues, Expenses, and Changes in Net Position B-6 Statement of Cash Flows
Fiduciary Funds: B-7 Statement of Net Position B-8 Statement of Changes in Net Position
Notes to the Financial Statements
11
ll1
iv
1-3
4-18
19 20-21
22-23 24
25
26 27 28
29 30
31-70

CLARK PUBLIC SCHOOL DISTRICT TABLE OF CONTENTS
REQUIRED SUPPLEMENTARY INFORMATION- PART II
C. Budgetary Comparison Schedules
C-1 C-2
Budgetary Comparison Schedule - General Fund Budgetary Comparison Schedule - Special Revenue Fund
NOTES TO THE REQUIRED SUPPLEMENTARY INFORMATION-PART II
C-3 Budgetary Comparison Schedule- Notes to the Required Supplementary Information
REQUIRED SUPPLEMENTARY INFORMATION- PART III
L. Schedules Related to Accounting and Reporting for Pensions (GASB 68)
L-1
L-2
L-3
L-4 L-5
L-6
Required Supplementary Information- Schedule of the District's Proportionate Share of the Net Pension Liability- Public Employees Retirement System
Required Supplementary Information- Schedule of District Contributions -Public Employees Retirement System
Required Supplementary Information- Schedule of the District's Proportionate Share of the Net Pension Liability- Teachers Pension and Annuity Fund
Notes to Required Supplementary Information Required Supplementary Information- Schedule of Changes in the District's
Proportionate Share of Total OPEB Liability Notes to Required Supplementary Information
OTHER SUPPLEMENTARY INFORMATION
D. School Level Schedules- Not Applicable
E. Special Revenue Fund:
E-1
E-2
Combining Schedule of Program Revenues and Expenditures Special Revenue Fund -Budgetary Basis
Preschool Education Aid- Schedule of Expenditures- Budgetary Basis- Not Applicable
F. Capital Projects Fund:
F-1 Summary Schedule of Project Expenditures- Budgetary Basis F-2 Summary Schedule of Revenues, Expenditures and Changes in
Fund Balance- Budgetary Basis F-2a- Schedule of Project Revenues, Expenditures, Project Balance and Project Status F-2e
71-77 78
79
80
81
82 83
84 85
86-87 88
89
90
91-95

CLARK PUBLIC SCHOOL DISTRICT TABLE OF CONTENTS
G. Proprietary Funds:
Enterprise Fund: G-1 Statement ofNet Position- Not Applicable G-2 Statement of Revenues, Expenses and Changes in Fund
Net Position- Not Applicable G-3 Statement of Cash Flows -Not Applicable
H. Fiduciary Funds:
H-1 H-2 H-3 H-4
Combining Statement of Agency Net Position- Agency Funds Combing Statement of Changes in Fiduciary Net Position- Not Applicable Student Activity Agency Fund Schedule of Receipts and Disbursements Payroll Agency Fund Schedule of Receipts and Disbursements
I. Long-Term Debt:
J.
Schedule of Serial Bonds I-1 I-2 I-3
Schedule of Capital Leases and Inter local Agreements Debt Service Fund Budgetary Comparison Schedule
STATISTICAL SECTION (Unaudited)
J-1 Net Position by Component J-2 Changes in Net Position J-3 Fund Balances- Governmental Funds J-4 Changes in Fund Balances- Governmental Funds J-5 General Fund Other Local Revenue by Source J-6 Assessed Value and Actual Value ofTaxable Property J-7 Direct and Overlapping Property Tax Rates J-8 Principal Property Taxpayers J-9 Property Tax Levies and Collections J-10 Ratios of Outstanding Debt by Type J-11 Ratios ofNet General Bonded Debt Outstanding J-12 Direct and Overlapping Governmental Activities Debt J-13 Legal Debt Margin Information J-14 Demographic and Economic Statistics J-15 Principal Employers J-16 Full-Time Equivalent District Employees by Function/Program J-17 Operating Statistics J-18 School Building Information J-19 Schedule of Required Maintenance for School Facilities J-20 Insurance Schedule
96
96 96
97 98 99 99
100 101 102
103 104-105
106 107 108 109 110 111 112 113 114 115 116 117 118 119 120 121 122 123

K.
K-1
K-2
K-3
K-4
K-5
K-6
K-7
K-7
K-8
CLARK PUBLIC SCHOOL DISTRICT TABLE OF CONTENTS
SINGLE AUDIT SECTION
Report on Internal Control Over Financial Reporting and on Compliance and Other Matters Based on an Audit of Financial Statements Performed in Accordance With Government Auditing Standards- Independent Auditor's Rep01t
Report on Compliance for Each Major Federal and State Program; Report on Internal Control Over Compliance; and Report on the Schedule of Expenditures of Federal Awards Required by the U.S. Uniform Guidance and Schedule of Expenditures of State Financial Assistance as Required by New Jersey OMB Circular 15-08 - Independent Auditor's Report
Schedule of Expenditures ofFederal Awards
Schedule of Expenditures of State Financial Assistance
Notes to the Schedules of Expenditures ofFederal Awards and State Financial Assistance
Schedule of Findings and Questioned Costs- Part 1- Summary of Auditor's Results
Schedule of Findings and Questioned Costs -Part 2 - Schedule of Financial Statement Findings
Schedule of Findings and Questioned Costs- Part 3- Schedule of Federal and State Award Findings and Questioned Costs
Summary Schedule of Prior Year Findings
124-125
126-128
129
130-131
132-133
134-135
136
137-138
139

INTRODUCTORY SECTION

Edward Grande Superintendent of Schools
December 2, 2019
Honorable President and Members of the Board of Education Clark Board of Education County of Union, New Jersey
Dear Board Members:
( ."/ark Public Schools 365 We,\({ic!d Are • ClarA. NJ 07066
(732)574-9000 • F(n ( 732)514·1456
R. Paul Vizzuso Business Admin./Board Secretary
The comprehensive annual financial report of the Clark School District ("District") for the fiscal year ended June 30, 2019 is hereby submitted. Responsibility for both the accuracy of the data and completeness and fairness of the presentation, including all disclosures, rests with the management of the Clark Board of Education ("Board"). To the best of our knowledge and belief, the data presented in this report is accurate in all material respects and is reported in a manner designed to present fairly the financial position and results of operation of the various funds and account groups of the District. All disclosures necessary to enable the reader to gain an understanding of the District's financial activities have been included.
The comprehensive annual financial report is presented in four sections: introductory, financial, statistical and single audit. The introductory section includes this transmittal letter, the District's organizational chart, a roster of principal officials and a list of consultants and advisors. The financial section includes the district-wide and fund financial statements and schedules, as well as the auditor's report and the Management's Discussion and Analysis. The statistical section includes selected financial statements and schedules as well as information generally presented on a multi-year basis.
The District is required to undergo an annual single audit in conformity with the provisions of Title 2 U.S. Code of Federal Regulations (CFR) Part 200, Uniform Administrative Requirements, Cost Principles and Audit Requirements for Federal Awards (Uniform Guidance) and the State Treasury OMB Circular 15-08, Single Audit Policy for Recipients of Federal Grants, State Grants, and State Aid Payments. Information related to this single audit, including the auditor's report on the internal control structure and compliance with applicable laws and regulations and findings and recommendations, are included in the single audit section of this report.
Respectfully submitted,
Edward Grande Superintendent of Schools
-"''~ ·~('~ -·-, In. lSI). ~ ( 't'lfi.l .
GREATNESS i

CLARK PUBLIC SCHOOLS Clark, New Jerse
Confidential Secretaries to
Superintendent
Director of Security
Supervisor of Pupil Personnel Services/Guidance
lr
Student School Assistance
Counselors Coordinator ,
Guidance Office Support Staff
..... ....
,..-- Content Area Supervisors
Educational Initiatives ·Humanities (6-12) ·STEAM (6-12) ·Preschool, Wellness, School Nursmg, and 504 Plans
ORGANIZATIONAL CHART
Board of Education --------------------------- I I I
• • ~
Business I Board Secretary I SUPERINTENDENT Administrator
H Confidential I Secretary to BA ~lr ,,
Middle H Accountant I High School School
Elementary Technology
Principal Principal
Principals H Accounts Payable I ~ H Transportation/ I Elementary I Benefits
HS Assistant MS Assistant Assistant Principal Principal Principal H Maintenance I
1lr Custodial Services I ... Special Services
Athletic Director Supervisor
~I Athletic Dept. . Child Study Team Support Staff -..
H Phys. Ed Teachers . Classroom Aides ..
Coaches ~
Special Education Teaching and Support Staff

CLARK PUBLIC SCHOOL DISTRICT CLARK, NEW JERSEY
ROSTER OF OFFICIALS JUNE 30, 2019
Members of the Board of Education
Steven Donkersloot, President
Thomas Lewis, Vice President
Lorraine j. Aklonis
Dino Bencivenga
ScottBohm
Robert Brede
Laura Caliguire
Tina Simitz, Garwood Representative
Robert Smorol
Henry R. V arriano
Other Officials
Edward Grande, Superintendent of Schools
R. Paul Vizzuso, Business Administrator/Board Secretary
James Testa, Treasurer of School Monies
iii
Term Expires
2020
2019
2019
2021
2021
2020
2020
2019
2021
2019

CLARK PUBLIC SCHOOL DISTRICT CONSULTANTS AND ADVISORS
Audit Firm
Lerch, Vinci & Higgins, LLP 17-17 Route 208
FairLawn, NJ 07410
Attorney
Weiner Law Group, LLP Attorneys at Law
629 Parsippany Road PO Box0438
Parsippany, NJ 07054
Official Depositories
Columbia Bank 1100 Raritan Road Clark, NJ 07066
Health Insurance Broker
Brown & Brown Benefit Advisors 1129 Broad Street, Suite 101
Shrewsbury, NJ 07702
Architect
Parette Somjen Architects 439 Route 46 East
Rockaway, NJ 07866
iv

FINANCIAL SECTION

LERCH, VINCI & HIGGINS,LLP CERTIFIED PUBLIC ACCOUNTANTS REGISTERED MUNICIPAL ACCOUNTANTS
DI ET ER 1'. LERCH. CPA, RMA. PSA
GARY J. VINCI, CPA , RMA, PSA
GARY W. HIGGINS. CPA. RMA. PSA
JEFFREY C. BLISS. CPA. RMA. PSA
PAUL J. LERCH, CP.'\, RMA, PSA
DONNA L. JA PHET, CPA, PSA
JULI US 13 . CONSONI. CPA. PSA
ANDREW D. PARENTE, CPA, RMA, PSA
Honorable President and Members of the Board ofEducation
Clark Public School District Clark, New Jersey
Report on the Financial Statements
INDEPENDENT AUDITOR'S REPORT
ELIZABETH A. SHICK. CPA, RMA, PSA
ROBERT W. HAAG. CPA. PSA
DEBORAH K. LERCH. CPA, PSA
RALPH M. PICONE. CPA. RMA . PSA
DEBRA GOLLE, CPA
MARK SACO. CPA
SHERY L M. LEIDIG, CPA. PSA
ROBERT LERCH. CPA
CHRIS SOliN, CPA
We have audited the accompanying fmancial statements of the governmental activities, the business-type activities, each major fund, and the aggregate remaining fund information of the Clark Public School District as of and for the fiscal year ended June 30, 2019 and the related notes to the financial statements, which collectively comprise the Clark Public School District's basic financial statements as listed in the table of contents.
Management's Responsibility for the Financial Statements
Management is responsible for the preparation and fair presentation of these financial statements in accordance with accounting principles generally accepted in the United States of America; this includes the design, implementation, and maintenance of internal control relevant to the preparation and fair presentation of financial statements that are free from material misstatement, whether due to fraud or error.
Auditor's Responsibility
Our responsibility is to express opinions on these financial statements based on our audit. We conducted our audit in accordance with auditing standards generally accepted in the United States of America, the standards applicable to financial audits contained in the Government Auditing Standards, issued by the Comptroller General of the United States and audit requirements as prescribed by the Office of School Finance, Department of Education, State of New Jersey. Those standards require that we plan and perform the audit to obtain reasonable assurance about whether the financial statements are free from material misstatement.
An audit involves performing procedures to obtain audit evidence about the amounts and disclosures in the financial statements. The procedures selected depend on the auditor's judgment, including the assessment of the risks of material misstatement of the financial statements, whether due to fraud or error. In making those risk assessments, the auditor considers internal control relevant to the entity's preparation and fair presentation of the financial statements in order to design audit procedures that are appropriate in the circumstances, but not for the purpose of expressing an opinion on the effectiveness of the entity's internal control. Accordingly, we express no such opinion. An audit also includes evaluating the appropriateness of accounting policies used and the reasonableness of significant accounting estimates made by management, as well as evaluating the overall presentation of the financial statements.
17-17 RO UTE 208• FA IR LAWN, NJ 07410 • TELEP1i.ONE (201) 79 .1 -71 00 • FACSIMILE (201 ) 791-3035
WWW.LV HCPA.COM

We believe that the audit evidence we have obtained is sufficient and appropriate to provide a basis for our audit opinions.
Opinions
In our opinion, the financial statements referred to above present fairly, in all material respects, the respective financial position of the governmental activities, the business-type activities, each major fund, and the aggregate remaining fund information of the Clark Public School District as of June 30, 2019, and the respective changes in financial position and, where applicable, cash flows thereof for the fiscal year then ended in accordance with accounting principles generally accepted in the United States of America.
Other Matters
Required Supplementary Information
Accounting principles generally accepted in the United States of America require that the management's discussion and analysis, budgetary comparison information, pension information and other postemployment benefits information be presented to supplement the basic financial statements. Such information, although not a part of the basic financial statements, is required by the Governmental Accounting Standards Board who considers it to be an essential part of financial reporting for placing the basic financial statements in an appropriate operational, economic, or historical context. We have applied certain limited procedures to the required supplementary information in accordance with auditing standards generally accepted in the United States of America, which consisted of inquiries of management about the methods of preparing the information and comparing the information for consistency with management's responses to our inquiries, the basic financial statements, and other knowledge we obtained during our audit of the basic financial statements. We do not express an opinion or provide any assurance on the information because the limited procedures do not provide us with sufficient evidence to express an opinion or provide any assurance.
Other Information
Our audit was conducted for the purpose of forming opinions on the financial statements that collectively comprise the Clark Public School District's basic financial statements. The introductory section, combining fund financial statements, financial schedules, statistical section, schedule of expenditures of federal awards as required by Title 2 U.S. Code of Federal Regulations Part 200, Uniform Administrative Requirements, Cost Principles, and Audit Requirements for Federal Awards (Uniform Guidance) and schedule of expenditures of state financial assistance as required by New Jersey OMB Circular 15-08, Single Audit Policy for Recipients of Federal Grants, State Grants and State Aid, are presented for purposes of additional analysis and are not a required part of the basic financial statements of the Clark Public School District.
The combining fund financial statements, schedule of expenditures of federal awards and schedule of expenditures of state financial assistance are the responsibility of management and were derived from and relate directly to the underlying accounting and other records used to prepare the basic financial statements. Such information has been subjected to the auditing procedures applied in the audit of the basic financial statements and certain additional procedures, including comparing and reconciling such information directly to the underlying accounting and other records used to prepare the basic financial statements or to the basic financial statements themselves, and other additional procedures in accordance with auditing standards generally accepted in the United States of America. In our opinion, the combining fund financial statements, schedules of expenditures of federal awards and state financial assistance are fairly stated in all material respects in relation to the basic financial statements as a whole.
The introductory section, fmancial schedules and statistical section have not been subjected to the auditing procedures applied in the audit of the basic financial statements and, accordingly, we do not express an opinion or provide any assurance on them.
2

Other Reporting Required by Government Auditing Standards
In accordance with Government Auditing Standards, we have also issued our report dated December 2, 2019 on our consideration of the Clark Public School District's internal control over financial reporting and on our tests of its compliance with certain provisions of laws, regulations, contracts, and grant agreements and other matters. The purpose of that report is to describe the scope of our testing of internal control over financial reporting and compliance and the results of that testing, and not to provide an opinion on the effectiveness of the Clark Public School District's internal control over financial reporting or on compliance. That report is an integral part of an audit performed in accordance with Government Auditing Standards in considering the Clark Public School District's internal control over financial reporting and compliance.
Fair Lawn, New Jersey December 2, 2019
3
~0~t-L~~ LERCH, VINCI & HIGGINS, LLP Certified Public Accountants Public School Accountants
Andrew D. Parente Public School Accountant PSA Number CS00224600

REQUIRED SUPPLEMENTARY INFORMATION-PART I
MANAGEMENT'S DISCUSSION AND ANALYSIS

CLARK PUBLIC SCHOOL DISTRICT
Management Discussion and Analysis
Fiscal Year Ended June 30, 2019
As management of the Clark Public School District (the Board or District), we offer readers of the District's financial statements this narrative overview and analysis of the financial activities of the Clark Public School District for the fiscal year ended June 30, 2019. We encourage readers to consider the information presented here in conjunction with additional information that we have furnished in our letter of transmittal, which can be found in the introductory section of this report.
FINANCIAL HIGHLIGHTS
Key financial highlights for the 2018-2019 fiscal year include the following:
• The assets and deferred outflows of resources of the Clark Public School District exceeded its liabilities and deferred inflows of resources at the close of the fiscal year by $12,705,893 (Net Position).
• Overall District revenues were $47,940,816 and were $1,112,348 more than overall District expenses of $46,828,468. General revenues accounted for $33,253,902 or 69% of all revenues. Program specific revenues in the form of charges for services, grants and contributions account for $14,686,914 or 31% of total revenues.
• The School District had $45,586,373 in expenses for governmental activities; only $13,258,794 of these expenses were offset by program specific charges, grants or contributions. General revenues (predominantly property taxes) of $33,237,864 were adequate to provide for these programs.
• As of the close of the current fiscal year, the District's governmental funds reported combined ending fund balances of $7,085,058. Of that amount, $523,608 (7%) is available for spending at the District's discretion (unassigned fund balance).
• The General Fund unassigned fund balance was $523,608 at June 30, 2019, is an increase of $7,663 when compared with the beginning unassigned fund balance at July 1, 2018 of$515,945.
• The General Fund unassigned budgetary basis fund balance at June 30, 2019 was $854,686, which represents an increase of $152,918 compared to the ending unassigned budgetary basis fund balance at June 30, 2018 of $701,768.
• The District's total outstanding long-term liabilities decreased by $1,872,795 during the current fiscal year.
4

CLARK PUBLIC SCHOOL DISTRICT
Management Discussion and Analysis
Fiscal Year Ended June 30, 2019
OVERVIEW OF THE FINANCIAL STATEMENTS
The financial section of the annual report consists of four parts - Independent Auditor's Report, required supplementary information which includes the management's discussion and analysis (this section), the basic financial statements, and supplemental information. The basic financial statements include two kinds of statements that present different views of the District:
• The first two statements are district wide financial statements that provide both short-term and long-term information about the District's overall financial status.
• The remaining statements are fund financial statements that focus on individual parts of the District, reporting the District's operations in more detail than the district-wide statements.
• The governmental funds statements tell how basic services were financed in the short term as well as what remains for future spending
• Proprietary funds statements offer short-term and long-term financial information about the activities the district operated like businesses.
• Fiduciary funds statements provide information about the financial relationships in which the District acts solely as a trustee or agent for the benefit of others to whom the resources belong.
The basic financial statements also include notes that explain some of the information in the statements and provide more detailed data. The Figure below shows how the various parts of this annual report are arranged and related to one another.
Management Discussion Basic and Analysis ~ Financial
Statements
I I I I
District-Wide Fund Notes to the Financial Financial Financial
Statements Statements Statements
Summary 10111 •I Detail
5

CLARK PUBLIC SCHOOL DISTRICT
Management Discussion and Analysis
Fiscal Year Ended June 30, 2019 The following table summarizes the major features of the District's financial statements, including the portion of the District's activities they cover and the types of information they contain. The remainder of this overview section of management's discussion and analysis highlights the structure and contents of each of the statements.
Major Features of the District-Wide and Fund Financial Statements District-Wide Statements Fund Financial Statements
Governmental Funds Proprietary Funds Fiduciary Funds
Scope Entire district The activities of the Activities the district Instances in which (except fiduciary district that are not operates similar to the district funds) proprietary or fiduciary, private businesses; food administers
such as instruction; service, before and after resources on behalf building maintenance, care program. of someone else, transportation, and such as administration. scholarship,
donations, student activities, and payroll deductions.
Required Financial Statements ofNet Balance Sheet Statement ofNet Statements of Statements Position Statement of Revenue Position Fiduciary Net
Statement of Expenditures and Statement of Revenues, Position Activities Changes in Fund Expenses and Changes Statement of
Balances in Fund Net Position Changes in Statement of Cash Fiduciary Net Flows Position
Accounting Basis Accrual Modified accrual Accrual accounting and Accrual accounting and Measurement accounting and accounting and current economic resources and economic Focus economic financial focus focus resources focus
resources focus Type of Asset, All assets, Generally assets expected All assets, liabilities All assets and Liabilities and liabilities and to be used up and and deferred liabilities both Deferred deferred liabilities that come due outflows/inflows of short and long-Inflows/outflows outflows/inflows during the year or soon resources, both term; funds do not Information of resources, both there after; no capital financial and capital, currently contain
financial and assets or long-term short-term and long- capital assets capital, short-term liabilities included term although they can and long-term
Type of All revenues and Revenues for which cash All revenues and All additions and Inflow /Outflow expenses during is received during or soon expenses during the dedications during Information the year, regardless after the end of the year; year, regardless of the year, regardless
of when cash is expenditures when goods when cash is received of when cash is received and the or services have been or paid. received or paid. related liability is received and the related due and payable liability is due and
payable.
6

CLARK PUBLIC SCHOOL DISTRICT
Management Discussion and Analysis
Fiscal Year Ended June 30, 2019
District-Wide Statements
The district-wide statements report information about the District as a whole using accounting methods similar to those used by private-sector companies. The statement of net position includes all of the district's assets, liabilities and deferred outflows/inflows of resources. All of the current year's revenues and expenses are accounted for in the statement of activities regardless of when cash is received or paid.
The two district-wide statements report the Districts net position and how they have changed. Net position- the difference between the District's assets/deferred outflows and liabilities/deferred inflows - is one way to measure the District's financial health or position.
• Over time, increases or decreases in the District's net position is an indicator of whether its financial condition is improving or deteriorating, respectively.
• To assess the overall health of the District you need to consider additional nonfinancial factors such as changes in the District's property tax base and the condition of school buildings and other facilities.
In the District-wide financial statement's the District's activities are shown in two categories:
• Governmental activities - Most of the District's basic services are included here, such as regular and special education, transportation, administration, and community education. Property taxes and State and Federal aids finance most of these activities.
• Business-type activities - The District charges fees to customers to help it cover the costs of certain services it provides. The District's Food Service and Before and After School child care programs are included here.
Fund Financial Statements
The fund financial statements provide more detailed information about the District's funds- focusing on its most significant or "major" funds -not the district as a whole. Funds are accounting devices the District uses to keep track of specific sources of funding and spending on particular programs:
• Some funds are required by State law and by bond covenants.
• The District uses other funds, established in accordance with the State of New Jersey Uniform Chart of Accounts, to control and manage money for particular purposes (e.g. repaying its long-term debts) or to show that it is properly using certain revenues (e.g. Federal funds).
7

CLARK PUBLIC SCHOOL DISTRICT
Management Discussion and Analysis
Fiscal Year Ended June 30, 2019
The District has three kinds of funds:
• Governmental funds - Most of the District's basic services are included in governmental funds, which generally focus on (1) how cash and other financial resources that can readily be converted to cash, flow in and out and (2) the balances left at year-end that are available for spending. Consequently, the governmental funds statements provide a detailed short-term view that helps to determine whether there are more or fewer financial resources that can be spent in the near future to finance the District's programs. Because this information does not encompass the additional long-term focus of the District-wide statements, we provide additional information at the bottom of the governmental funds statements that explain the relationship (or differences) between them.
• Proprietary funds - Services for which the District charges a fee are generally reported in proprietary funds. Proprietary funds are reported in the same way as the District-wide statements.
o Enterprise Funds - These funds are established to account for operations that are financed and operated in a manner similar to private business enterprises. The stated intent is that costs of providing goods or services to the students on a continuing basis are financed or recovered primarily through user charges. The District currently has two enterprise funds for its food service operations and its before and after school child care programs.
• Fiduciary funds - The District is the trustee, or fiduciary, for assets that belong to others such as donations for a science observatory, contributions for various organizations, payroll agency funds, and student activity funds. The District is responsible for ensuring that the assets reported in these funds are used for their intended purposes. All of the District's fiduciary activities are reported in a separate statement of fiduciary net position and a statement of changes in fiduciary net position. We exclude these activities from the District's government-wide financial statements because the District cannot use these assets to finance its operations.
Notes to the Financial Statements
The notes provide additional information that is essential to a full understanding of the data provided in the district-wide and fund financial statements. The notes to the financial statements can be found following the financial statements.
8

CLARK PUBLIC SCHOOL DISTRICT
Management Discussion and Analysis
Fiscal Year Ended June 30, 2019
Other Information
In addition to the financial statements and accompanying notes, which together comprise the basic financial statements, this report also presents certain required supplementary information concerning the District's budget process. The District adopts an annual revenue and expenditure budget for the general, special revenue and debt service funds. Budgetary comparison schedules have been provided for the general and special revenue funds as required supplementary information. Information regarding the District's employee retirement systems and pension plans as well as the post-retirement health benefits plan has also been provided as required supplementary information. The required supplementary information can be found following the notes to the financial statements.
Combining statements and schedules are presented immediately following the major budgetary comparisons and pension information.
FINANCIAL ANALYSIS OF THE DISTRICT AS A WHOLE
The district's financial position is the product of several financial transactions including the net results of activities, the acquisition and payment of debt, the acquisition and disposal of capital assets, and the depreciation of capital assets.
The following provides a summary of the school district's net position for 2019 and 2018.
Net Position. The District's combined net position was $12,705,893 on June 30, 2019 and $11,593,545 on June 30, 2018.
9

CLARK PUBLIC SCHOOL DISTRICT
Management Discussion and Analysis
Fiscal Year Ended June 30, 2019
Net Position as of June 30, 2019 and 2018
Governmental Types
Business-Type Activities Total
2019 2018 2019 2018 2019 2018
Assets Current and other assets Capital assets, net
Total Assets
Deferred Outflows of Resources
Total Assets and Deferred Outflows
of Resources
Liabilities Non-Current liabilities Other liabilities
Total Liabilities
Deferred Inflows of Resources
Total Liabilities and Deferred Inflows
of Resources
Net Position Net Investment in capital assets Restricted Unrestricted
$ 8,255,030 $ 22,420,004
30,675,034
1,579,536
32,254,570
17,795,950 1,201,318
18,997,268
2,368,874
21,366,142
11,934,121 1,294,684
(2,340,377)
6,209,659 $ 1,756,400 $ 1,478,988 $ 10,011,430 $ 23,866,901 197,397 188,389 22,617,401
30,076,560
2,219,146
32,295,706
19,668,745 697,937
20,366,682
1,950,881
22,317,563
12,640,594 1,292,183
(3,954,634)
1,953,797
1,953,797
133,793
133,793
2,539
136,332
197,397
1,620,068
1,667,377
1,667,377
48,001
48,001
3,974
51,975
188,389
1,427,013
32,628,831
1,579,536
34,208,367
17,795,950 1,335,111
19,131,061
2,371,413
21,502,474
12,131,518 1,294,684 (720,309)
7,688,647 24,055,290
31,743,937
2,219,146
33,963,083
19,668,745 745,938
20,414,683
1,954,855
22,369,538
12,828,983 1,292,183
(2,527,621)
Total Net Position $ 10,888,428 $ 9,978,143 $ 1,817,465 $ 1,615,402 $ 12,705,893 $ 11,593,545
By far the largest portion of the District's net position reflects its investment in capital assets (e.g., land and improvements, buildings and improvements, vehicles, furniture and equipment); less any related debt used to acquire those assets that is still outstanding. The District uses these capital assets to provide services to its students; consequently, these assets are not available for future spending. Although the District's investment in its capital assets is reported net of related debt, it should be noted that the resources needed to repay this debt must be provided from other sources, since the capital assets
. themselves cannot be used to liquidate these liabilities. Restricted net position represents amounts reserved for specific purposes by outside parties or state laws and regulations. Unrestricted net position represents amounts available to the government that are neither restricted nor invested in capital assets.
10

CLARK PUBLIC SCHOOL DISTRICT
Management Discussion and Analysis
Fiscal Year Ended June 30, 2019
The District's total net position of $12,705,893 at June 30, 2019 represents a $1,112,398 or 10%, increase from the prior year. The following shows changes in net position for fiscal years 2019 and 2018.
Change in Net Position
For the Fiscal Years Ended June 30, 2019 and 2018
Governmental Business-Type
Types Activities Total
2019 2018 2019 2018 2019 2018
Revenues
Program Revenues
Charges for Services $ 1,541,710 $ 1,867,529 $ l ,312,382 $ 1,277,628 $ 2,854,092 $ 3,145,157
Operating Grants and Contributions 11,473,904 14,411,728 115,738 133,154 II ,589,642 14,544,882
Capital Grants and Contributions 243,180 243,180 General Revenues
Property Taxes 33,049,404 32,167,229 33,049,404 32,167,229
State and Federal Aid 2,159 24,143 2,159 24,143 Other 186,301 178,382 16,038 3,142 202,339 181,524
Total Revenues 46,496,658 48,649,011 1,444,158 1,413,924 47,940,816 50,062,935
Program Expenses
Instruction
Regular 22,759,140 24,437,501 22,759,140 24,437,501
Special Education 6,547,210 6,884,916 6,547,210 6,884,916
Other Instruction 804,764 785,113 804,764 785,113
School Sponsored Activities and Athletics 881,274 943,095 881,274 943,095
Support Services
Student and Instruction Related 5,259,948 5,504,080 5,259,948 5,504,080
General Administration 857,466 946,276 857,466 946,276
School Administration 2,883,591 2,850,334 2,883,591 2,850,334
Central and Other Support Services 494,018 557,236 494,018 557,236
Plant Operations and Maintenance 3,438,736 3,185,847 3,438,736 3,185,847
Pupil Transportation 1,241,640 1,149,796 1,241,640 1,149,796
Interest on Debt 418,586 438,449 418,586 438,449
Food Service 679,286 698,774 679,286 698,774 Before and After School Program 562,809 471,833 562,809 471,833
Total Expenses 45,586,373 47,682,643 1,242,095 1,170,607 46,828,468 48,853,250
Change in Net Position 910,285 966,368 202,063 243,317 1,112,348 1,209,685
Net Position, Beginning of Year 9,978,143 9,011,775 1,615,402 1,372,085 II ,593,545 10,383,860
Net Position, End of Year $ 10,888,428 $ 9,978,143 $ 1,817,465 $ 1,615,402 $ 12,705,893 $ 11,593,545
11

CLARK PUBLIC SCHOOL DISTRICT
Management Discussion and Analysis
Fiscal Year Ended June 30, 2019
Governmental Activities. The District' s total governmental activities' revenues, which includes State and Federal grants, were $46,496,658 for the year ended June 30, 2019, property taxes of $33 ,049,404 represented 71% of revenues. Another significant portion of revenues came from State aid; total State, Federal and Local Aid and Grants were $11,719,243 and represented 25% of revenues. In addition, revenue in the amount of $1,728,011 (4%) was earned from tuition fees and miscellaneous income which includes items such as interest, prior year refunds and other miscellaneous items.
The total cost of all governmental activities programs and services was $45,586,373. The district's expenses are predominantly related to educating and caring for students. Instruction totaled $30,992,388 (68%) of total expenses. Support services total $14,175,399 (31%) oftotal expenses. The remaining expenses were for interest costs on long-term debt outstanding in the amount of$418,586 (1 %).
Total governmental activities revenues exceeded expenses, increasing net position by $910,285 from the previous year.
Revenues by Type- Governmental Activities For Fiscal Year 2019
Federal, State,
Local Aid and Grants
Other4%
Property Tax Levy
71%
Expenses by Type- Governmental Activities For Fiscal Year 2019
Plant Operation & Ma,mt,enam;,e
Other
School, General & Central
Administmtion 9%
Student and Instruction
Services 12%
12
68%

CLARK PUBLIC SCHOOL DISTRICT
Management Discussion and Analysis
Fiscal Year Ended June 30, 2019
Total and Net Cost of Governmental Activities. The District's total cost of services was $45,586,373. After applying program revenues, derived from operating and capital grants and contributions of $11,717,084 and charges for services of $1,541,710 the net cost of services of the District is $32,327,579.
Instruction Regular
Special Education
Other Instruction
School Sponsored Activities and Athletics
Support services Student and Instruction Related
General Administration
School Administration
Central and Other Support Services
Plant Operations and Maintenance
Pupil Transpm1ation
Interest on debt
Total Expenses
Business-Type Activities
$
Total Cost of Services
Net Cost of Services
22,759,140 $
6,547,210 804,764 881,274
5,259,948 857,466
2,883,591 494,018
3,438,736 1,241,640
418,586
24,437,501 $ 15,564,026 6,884,916 3,533,522
785,113 509,381 943,095 853,738
5,504,080 946,276
2,850,334 557,236
3,185,847 1,149,796
438,449
3,935,954 843,336
2,131,548 474,513
3,087,806 975,169 418 586
$ 14,996,907 3,436,255
486,519 876,051
3,776,319 909,231
1,908,038 505,164
3,015,259 1,055,194
438 449
$ 45,586,373 $ 47,682,643 $ 32,327,579 $ 31,403,386
The cost of Business-Type Activities for the fiscal year ended June 30, 2019 was $1,242,095. Food service costs were 679,286 (55%) and before and after school child care costs were $562,809 (45%). These costs were funded by revenue from charges for services of $1,312,382 (91 %) and operating grants of $115,738 (8%), as detailed in the change in net position schedule. Revenues from food service charges for services were $617,258 (47%) and before and after school child care charges for services were $695,124 (53%).
Total business-type activities revenues surpassed expenses, increasing net position by $202,063 over the previous year. At June 30, 2019 the net position balance of the Food Service Program was $370,394 and of the Before and After School Child Care Program Fund was $1,447,071.
13

CLARK PUBLIC SCHOOL DISTRICT
Management Discussion and Analysis
Fiscal Year Ended June 30, 2019 FINANCIAL ANALYSIS OF THE DISTRICT'S FUNDS
The financial performance of the District as a whole is reflected in its governmental funds as well. As the District completed the year, its governmental funds reported a combined fund balance of $7,085,058 at June 30, 2019 compared to a combined fund balance of $5,543,391 at June 30, 2018.
Revenues and other financing sources for the District's governmental funds were $43,012,065 while total expenditures were $41,470,398.
GENERAL FUND
The General fund includes the primary operations of the District in providing educational services to students from Pre-Kindergarten through Grade 12 including pupil transportation, extra-curricular activities and capital outlay projects.
The following schedule presents a summary of General Fund Revenues for the fiscal years ended June 30, 2019 and 2018.
Revenue
Local Sources
Property Tax Levy
Miscellaneous
State Sources Federal Sources
Total
$
$
Amount
2019 2018
31,694,372 $ 30,792,697
1,728,011 2,041,271
6,750,236 5,919,208 15,510 15,701
40,188,129 $ 38,768,877
$
$
Amount of
Increase (Decrease)
901,675
(313,260)
831,028 (191)
1,419,252
Percent Change
3%
-15%
14% -1%
4%
The majority of revenues come from property taxes which accounted for 79% of total revenue while state sources represented 17% of total revenue for the 2019 fiscal year. Miscellaneous revenues primarily tuition fees received from Garwood represented 4% of the total revenue for the 2019 fiscal year.
14

CLARK PUBLIC SCHOOL DISTRICT
Management Discussion and Analysis
Fiscal Year Ended June 30, 2019
State
General Fund Revenues by Source For Fiscal Year 2019
Other 4%
The following schedule presents a summary of General Fund expenditures for the fiscal years ended June 30, 2019 and 2018.
Amount of Amount Increase
Expenditures 2019 2018 Wecrease)
Current: Instruction $ 25,396,151 $ 24,544,411 $ 851,740 Support Services 12,931,662 11,886,983 1,044,679
Debt Service 179,302 171,460 7,842 Capital Outlay 514,348 492,256 22,092
Total $ 39,021,463 $ 37,095,110 $ 1,926,353
Total General Fund expenditures increased $1,926,353 or 5% from the previous year. Instruction represented 65% of total expenditures while support services accounted for 33% and debt service and capital outlay accounted for 2% of total expenditures for the 2019 fiscal year.
For the 2018-2019 school year General Fund revenues, and other financing sources exceeded expenditures by $1,541,666. After adjusting for restricted and assigned fund balances, the unassigned fund balance increased from $515,945 at June 30, 2018 to $523,608 at June 30, 2019. The District ended the year with $5,139,521 of excess surplus. In addition, the District had restricted fund balances of $587,163 in capital reserve and $635,784 in maintenance reserve at June 30,2019.
15
Percent Change
3% 9% 5%
100%
5%

CLARK PUBLIC SCHOOL DISTRICT
Management Discussion and Analysis
Fiscal Year Ended June 30, 2019
APITAL ASSETS AND DEBT ADMINISTRATION
Capital Assets. At the end of fiscal years 2019 and 2018, the District had invested in land, buildings, furniture, machinery and equipment for both governmental and businesstype activities. Depreciation charges for fiscal year 2018-2019 amounted to $2,196,885 for governmental activities and $18,146 for business-type activities. The following is a comparison ofthe June 30, 2019 and 2018 balances.
Land
Construction In Progress
Land Improvements
Buildings and Improvements Machinery and Equipment
Less Depreciation
Total Capital Assets, Net of Depreciation
Capital Assets As of June 30, 2019 and 2018
$
Governmental
Activities
1,808,965 $ 1,808,965
8,500
2,695,664 2,077,484
47,788,695 47,761,779 4,230,632 4,149,902
56,532,456 55,798,130 (34,112,452) (31,931,229)
$ 22,420,004 $ 23,866,901 \
$
$
Business-Type
Activities
442,324 $ 423,226
442,324 423,226 (244,927) (234,837)
197,397 $ 188,389
$ 1,808,965 $ 1,808,965
8,500
2,695,664 2,077,484
47,788,695 47,761,779 4,672,956 4,573,128
56,974,780 56,221,356 (34,357,379) (32,166,066)
$ 22,617,401 $ 24,055,290
Additional information on the District's capital assets is presented in Note 3 of this report.
16

CLARK PUBLIC SCHOOL DISTRICT
Management Discussion and Analysis
Fiscal Year Ended June 30, 2019 Debt Administration. As of June 30, 2019 the District had long-term debt and outstanding long-term liabilities in the amount of $17,795,950. For fiscal year 2018-2019 total outstanding long-term liabilities decreased by $1 ,872, 795. The following is a comparison of the June 30, 2019 and 2018 balances.
Outstanding Long-Term Liabilities As of June 30, 2019 and 2018
Serial Bonds (including unamortized premium) Capital Leases and lnterlocal Agreements Net Pension Liability Compensated Absences
$
Total $
10,494,439 $ 11,542,035 463,243 258,484
5,990,324 7,077,525 847,944 790,701
17,795,950 $ 19,668,745
Additional information on the District's long-term liabilities is presented in Note 3 of this report.
GENERAL FUND BUDGETARY HIGHLIGHTS
Over the course of the year, the District revised the annual operating budget several times. These budget amendments fall into two categories:
• Reinstating prior year purchase orders being carried over. • Appropriation of additional State and Federal Aid.
General Fund budgetary basis revenues exceeded budgetary basis expenditures increasing budgetary basis fund balance by $1,686,921 from the previous year. After deducting restricted and assigned fund balances, the unassigned budgetary fund balance increased $152,918 from $701,768 at June 30, 2018 to $854,686 at June 30, 2019. The District has retained a Capital Reserve balance in the amount of $587,163 at June 30, 2019. In addition, the District has a Maintenance Reserve balance of$635,784 at June 30, 2019.
17

CLARK PUBLIC SCHOOL DISTRICT
Management Discussion and Analysis
Fiscal Year Ended June 30, 2019
ECONOMIC FACTORS AND NEXT YEAR'S BUDGET
While many factors influence the District's future, the availability of State funding, special education needs, capital improvements, student enrollment and the economy will have the most impact on educational and fiscal decisions in the future.
Many factors were considered by the District's administration during the process of developing the fiscal year 2019-2020 budget. The primary factors were the District's projected student population, anticipated state and federal aid, contractual salary and related benefit cost increases, as well as, increased special education tuition costs.
These indicators were considered when adopting the budget for fiscal year 2019-2020. Budgeted expenditures in the General Fund increased approximately 5% to $37,860,693 for fiscal year 2019-2020.
CONTACTING THE DISTRICT'S FINANCIAL MANAGEMENT
This financial report is designed to provide our citizens, taxpayers, customers, and investors and creditors with a general overview of the District's finances and to demonstrate the District's accountability for the money it receives. If you have questions about this report or need additional financial information contact the Business Office, Clark Public School District, Administrative Offices (ALJ High School), 365 Westfield Avenue, Clark New Jersey 07066.
18

DISTRICT-WIDE FINANCIAL STATEMENTS

EXHffiiT A-1
CLARK PUBLIC SCHOOL DISTRICT STATEMENT OF NET POSITION
AS OF JUNE 30, 2019
Governmental Business-Type Activities Activities Total
ASSETS Cash $ 7,510,647 $ 1,732,801 $ 9,243,448
Receivables, Net: Receivables from Other Governments 493,231 4,803 498,034
Other 257,350 428 257,778
Internal Balances (6, 198) 6,198
Inventories 12,170 12,170
Capital Assets Not Being Depreciated 1,817,465 1,817,465
Capital Assets, Being Depreciation 20,602,539 197,397 20,799,936
Total Assets 30,675,034 1,953,797 32,628,831
DEFERRED OUTFLOWS OF RESOURCES
Deferred Amounts on Refunding of Debt 471,799 471,799
Deferred Amounts on Net Pension Liability 1,107,737 1,107,737
Total Deferred Outflows of Resources 1,579,536 1,579,536
Total Assets and Deferred Outflows of Resources 32,254,570 1,953,797 34,208,367
LIABILITIES
Accounts Payable and Other Current Liabilities 1,096,169 114,674 1,210,843
Accrued Interest Payable 31,346 31,346 Unearned Revenue 73,803 19,119 92,922 Noncurrent Liabilities:
Due Within One Year 1,180,240 1,180,240 Due Beyond One Year 16,615,710 16,615,710
Total Liabilities 18,997,268 133,793 19,131,061
DEFERRED INFLOWS OF RESOURCES
Deferred Amounts on Net Pension Liability 2,368,874 2,368,874 Deferred Commodities Revenue 2,539 2,539
Total Deferred Inflows of Resources 2,368,874 2,539 2,371,413
Total Liabilities and Deferred Inflows of Resources 21,366,142 136,332 21,502,474
NET POSITION
Net Investment in Capital Assets 11,934,121 197,397 12,131,518 Restricted for: Capital Projects 658,899 658,899 Other Purposes 635,785 635,785
Unrestricted (2,340,377) 1,620,068 (720,309)
Total Net Position $ 10,888,428 $ 1,817,465 $ 12,705,893
The accompanying Notes to the Financial Statements are an integral part of this statement. 19

EXHIBIT A-2
CLARK PUBLIC SCHOOL DISTRICT STATEMENT OF ACTIVITIES
FOR THE FISCAL YEAR ENDED JUNE 30, 2019 Net (Expense) Revenue and
Program Revenues Changes in Net Position Operating Capital
Charges for Grants and Grants and Governmental Business-Type Functions/Programs Exuenses Services Contributions Contributions Activities Activities Total
Governmental Activities Instruction:
Regular $ 22,759,140 $ 1,206,865 $ 5,988,249 $ ( 15 ,564,026) $ (15,564,026) Special Education 6,547,210 334,845 2,678,843 (3,533,522) (3,533,522) Other Instruction 804,764 295,383 (509,381) (509,381) School Sponsored Activities and Athletics 881,274 27,536 (853,738) (853,738)
Support Services Student and Instruction Related Services 5,259,948 1,323,994 (3,935,954) (3,935,954) General Administrative Services 857,466 14,130 (843,336) (843,336) School Administrative Services 2,883,591 752,043 (2, 131 ,548) (2, 131 ,548) Central and Other Support Services 494,018 19,505 (474,513) (474,513) Plant Operations and Maintenance 3,438,736 107,750 $ 243,180 (3,087,806) (3,087,806) Pupil Transportation 1,241,640 266,471 (975,169) (975,169)
Interest on Debt 418,586 (418,586) (418,586)
Total Governmental Activities 45,586,373 1,541,710 11,473,904 243,180 (32,327,579) (32,327,579)
Business-Type Activities Food Service 679,286 617,258 115,738 $ 53,710 53,710 Before and After School Program 562,809 695,124 132,315 132,315
Total Business-Type Activities 1,242,095 1,312,382 115,738 186,025 186,025
Total Primary Government $ 46,828,468 $ 2,854,092 $ 11,589,642 $ 243,180 {32,327,579) 186,025 (32,141,554)
The accompanying Notes to the Financial Statements are an integral part ofthis statement. 20 (Continued)

CLARK PUBLIC SCHOOL DISTRICT STATEMENT OF ACTIVITIES
FOR THE FISCAL YEAR ENDED JUNE 30, 2019
General Revenues: Property Ta'<.es:
Levied for General Purposes Levied for Debt Service
State Aid, Unrestricted Miscellaneous Income
Total General Revenues
Change in Net Position
Net Position, Beginning of Year
Net Position, End of Year
The accompanying Notes to the Financial Statements are an integral part of this statement. 21
EXHIBIT A-2
Net (Expense) Revenue and Changes in Net Position
Governmental Activities
$ 31,694,372 1,355,032
2,159 186,301
33,237,864
910,285
9,978,143
$ 10,888,428
Business-Type Activities
$ 16,038
16,038
202,063
1,615,402
$ 1,817,465
$
$
31,694,372 1,355,032
2,159 202,339
33,253,902
1,112,348
11,593,545
12,705,893

FUND FINANCIAL STATEMENTS

EXHIBITB-1
CLARK PUBLIC SCHOOL DISTRICT
BALANCE SHEET GOVERNMENTAL FUNDS
AS OF JUNE 30, 2019
Special Capital Debt Total
General Revenue Projects Service Governmental
Fund Fund Fund Fund Funds
ASSETS Cash $ 7,265,765 $ 173,145 $ 71,736 $ $ 7,510,647
Receivables, Net Receivables from Other Governments 402,930 90,301 493,231
Due from Other Funds 279,760 279,760
Total Assets $ 7,948,455 $ 263,446 $ 71,736 $ $ 8,283,638
LIABILITIES Liabilities Accounts Payable $ 906,526 $ 94,310 $ 1,000,836
Payable to Federal Government 2,410 2,410
Payable State Government 87,787 87,787
Due to Other Funds 28,608 28,608
Other Liabilities 5,136 5,136
Unearned Revenue 73,803 73,803
Total Liabilities 935,134 263,446 1,198,580
FUND BALANCES Restricted Fund Balance Excess Surplus- Designated for Subsequent
Year's Expenditures 2,165,576 2,165,576
Excess Surplus 2,973,945 2,973,945
Capital Reserve 587,163 587,163
Maintenance Reserve 635,784 635,784
Capital Projects $ 71,736 71,736
Debt Service $ 1
Assigned Fund Balance
Year End Encumbrances. 127,245 127,245
Unassigned Fund Balance 523,608 523,608
Total Fund Balances 7,013,321 71,736 7,085,058
Total Liabilities and Fund Balances $ 7,948,455 $ 263,446 $ 71,736 $ $ 8,283,638
22

CLARK PUBLIC SCHOOL DISTRICT GOVERNMENTAL FUNDS
BALANCE SHEET AS OF JUNE 30, 2019
Total Fund Balances- Governmental Funds (Exhibit B-1)
Amounts reported for governmental activities in the statement of net position (A-1) are different because:
Capital assets used in governmental activities are not financial resources and therefore are not reported in the funds. The cost of the assets is $56,532,456 and the accumulated depreciation is $34,112,452
Amounts resulting from the refunding of debt are reported as deferred outflows of resources on the statement of net position and amortized over the life of the debt.
Certain amounts resulting from the measurement of the net pension liability are reported as either deferred outflows of resources or deferred inflows of resources on the statement of net position and amortized over future years.
Deferred Outflows of Resources Deferred Inflows of Resources
The District has financed capital assets through the issuance of serial bonds and long-term lease obligations. The interest accrual at year end is:
Long-term liabilities, including bonds payable, are not due and payable in the current period and therefore are not reported as liabilities in the funds
Serial Bonds Payable (including unamortized premium) Capital Leases and Interlocal Agreements Payable Compensated Absences Net Pension Liability
Total Net Position of Governmental Activities (Exhibit A-1)
$ 1,107,737 (2,368,874)
$ 10,494,439 463,243 847,944
5,990,324
The accompanying Notes to the Financial Statements are an Integral Part of this Statement 23
EXHIBIT B-1
$ 7,085,058
22,420,004
471,799
(1,261,137)
(31,346)
(17,795,950)
$ 10,888,428

EXHIBITB-2
CLARK PUBLIC SCHOOL DISTRICT
STATEMENT OF REVENUES, EXPENDITURES, AND CHANGES IN FUND BALANCES
GOVERNMENTAL FUNDS
FOR THE FISCAL YEAR ENDED JUNE 30, 2019
Special Capital Debt Total
General Revenue Projects Service Governmental
Fund Fund Fund Fund Funds
REVENUES
Local Sources
Property Tax Levy $ 31,694,372 $ 1,355,032 $ 33,049,404
Tuition 1,541,710 1,541,710
Interest 77,327 77,327
Miscellaneous Revenues 108,974 108,974
Total - Local Sources 33,422,383 1,355,032 34,777,415
State Sources 6,750,236 $ 467,177 7,217,413
Federal Sources 15,510 626,727 642,237
Total Revenues 40,188,129 1,093,904 1,355,032 42,637,065
EXPENDITURES
Instruction
Regular 18,288,129 92,626 18,380,755
Special Education 5,600,892 514,778 6,115,670
Other Instruction 648,363 67,649 716,012
School-Sponsored Activities and Athletics 858,767 858,767
Support Services
Student and Instruction Related Services 4,448,837 418,851 4,867,688
General Administrative Services 849,109 849,109
School Administrative Services 2,586,848 2,586,848
Central and Other Support Services 477,494 477,494
Plant Operations and Maintenance 3,349,244 3,349,244
Pupil Transportation 1,220,130 1,220,130
Debt Service
Principal 170,241 975,000 1,145,241
Interest and Other Charges 9,061 380,031 389,092 Capital Outlay 514,348 514,348
Total Expenditures 39,021,463 1,093,904 1,355,031 41,470,398
Excess of Revenues Over Expenditures 1,166,666 1,166,667
OTHER FINANCING SOURCES lnterlocal Agreement 375,000 375,000
Total Other Financing Sources 375,000 375,000
Net Change in Fund Balances 1,541,666 1,541,667
Fund Balance, Beginning of Year 5,471,655 $ 71,736 5,543,391
Fund Balance, End ofYear $ 7,013,321 $ $ 71,736 $ 1 $ 7,085,058
The accompanying Notes to the Financial Statements are an integral part of this statement
24

CLARK PUBLIC SCHOOL DISTRICT RECONCILIATION OF THE GOVERNMENTAL FUNDS STATEMENT OF
REVENUES, EXPENDITURES AND CHANGES IN FUND BALANCES WITH THE DISTRICT-WIDE STATEMENT OF ACTIVITIES
FOR THE FISCAL YEAR ENDED JUNE 30, 2019
Total net change in fund balances - governmental funds (Exhibit B-2)
Amounts reported for governm~ental activities in the statement of activities are different because:
Capital outlays to purchase or build capital assets are reported in governmental funds as expenditures. However, for governmental activities those costs are shown in the statement and allocated over their estimated useful lives as annual depreciation expense. This is the amount by which depreciation exceeds capital outlay and donated assets in the current period.
Capital Outlay Depreciation Expense Donated Assets
In the statement of activities, certain operating expenses - compensated absences and pension expense are measured by the amounts earned or accrued during the year. In the governmental funds, however, expenditures for these items are measured by the amount of financial resources used {paid):
Increase in Compensated Absences Decrease in Pension Expense
The issuance oflong-term debt provides current financial resources to the governmental funds, while the repayment of long-term debt uses those current financial resources of governmental funds. Neither transactions, however, has any effect on net position. Also, governmental funds report the effect of premiums and other such items related to the refunding bonds when they are issued, whereas these amounts are expensed and or defe1Ted and amortized in the statement
of activities. Debt Issued
Interlocal Agreement
Principal Repayments
Serial Bonds Capital Lease and Interlocal Agreement Payable
Amortization of Deferred Amounts on Refunding
Amortization of Bond Premium
Interest on long-term debt in the statement of activities differs from the amount
reported in the governmental funds because interest is recorded as an expenditure in the funds when it is due, and thus requires the use of current financial resources. In the statement of activities, however, interest expense is recognized as the interest accrues, regardless of when it is due.
Decrease in Accrued Interest
The statement of activities report losses arising from the disposal of existing
capital assets. Conversely, governmental funds do not report any loss on disposal of
capital assets.
Change in net position of governmental activities (Exhibit A-2)
The accompanying Notes to the Financial Statements are an Integral Part of this Statement. 25
$ 514,348 (2, 196,885)
243,180
(57,243) 132,011
(375,000)
975,000 170,241
(102,413)
72 596
$
$
EXHIBITB-3
1,541,667
(1,439,357)
74,768
740,424
323
(7,540)
910,285

CLARK PUBLIC SCHOOL DISTRICT
PROPRIETARY FUNDS
STATEMENT OF NET POSITION
AS OF JUNE 30, 2019
EXHIBIT B-4
Business-TxQe Activities- EnterQrise Fund
Food
Service
ASSETS
Current Assets
Cash $ 267,153
Intergovernmental Receivable
State 370
Federal 4,433
Other Accounts Receivable 428
Inventories 12,170 Due from Other Funds 28,608
Total Current Assets 313,162
Capital Assets
Equipment 423,899
Less: Accumulated Depreciation (239, 720)
Total Capital Assets, Net 184,179
Total Assets 497,341
LIABILITIES
Current Liabilities
Accounts Payable 105,289 Due to Other Funds Unearned Revenue 19,119
Total Current Liabilities 124,408
DEFERRED INFLOW OF RESOURCES
Deferred Commodities Revenue 2,539
Total Liabilities and Deferred Inflow of Resources 126,947
NET POSITION
Investment in Capital Assets 184,179 Unrestricted 186,215
Total Net Position $ 370,394
The accompanying Notes to the Financial Statements are an integral part of this statement 26
Before and
After School
Program Totals
$ 1,465,648 $ 1,732,801
370
4,433
428
12,170 28,608
1,465,648 1,778,810
18,425 442,324
(5,207) (244,927)
13,218 197,397
1,478,866 1,976,207
9,385 114,674
22,410 22,410 19,119
31,795 156,203
2,539
31,795 158,742
13,218 197,397 1,433,853 1,620,068
$ 1,447,071 $ 1,817,465

The accompanying Notes to the Financial Statements are an integral part of this statement 27

EXHIBITB-6 CLARK PUBLIC SCHOOL DISTRICT
PROPRIETARY FUNDS STATEMENT OF CASH FLOWS
FOR THE FISCAL YEAR ENDED JUNE 30, 2019
Business-Tyl!e Activities - Enter!! rise Fund
Food Service
Cash Flows from Operating Activities Cash Received from Customers $ 618,699 Cash Payments for Employees' Salaries and Benefits (255,311) Cash Payments to Suppliers for Goods and Services (287,643)
Net Cash Provided by Operating Activities 75,745
Cash Flows from Noncapital Financing Activities Cash Received from State and Federal Subsidy Reimbursement 74,608
Net Cash Provided by Noncapital Financing Activities 74,608
Cash Flows from Investing Activities Interest Earnings 2,958
Net Cash Provided by Investing Activities 2,958
Cash Flows from Capital and Related Financing Activities Purchases of Capital Assets (27,578)
Net Cash (Used for) Capital and Related Financing Activities (27,578)
Net Increase in Cash and Cash Equivalents 125,733
Cash, Beginning of Year 141,420
Cash, End of Year $ 267,153
Reconciliation of Operating Income (Loss) to Net Cash Provided by Operating Activities
Operating Income (Loss) $ (61,604)
Adjustments to Reconcile Operating Income (Loss) to Net Cash Provided by Operating Activities
Non-Cash Federal Assistance-Food Distribution Program 42,491 Depreciation Expense 16,529 Change in Assets, Liabilities and Deferred Inflows
(Increase )/Decrease in Accounts Receivable 62 (Increase)/Decrease in Inventory 1,893 Increase/(Decrease) in Accounts Payable 76,430 Increase/(Decrease) in Unearned Revenue 1,379 Increase/(Decrease) in Deferred Commodities Revenue (1 ,435)
Total Adjustments 137,349
Net Cash Provided by (Used) for Operating Activities $ 75,745
Non-Cash Investing, Capital and Financing Activities Value Received- Food Distribution Program $ 41,056
The accompanying Notes to the Financial Statements are an integral part of this statement 28
Before and After School
Program Totals
$ 695,124 $ 1,313,823 ( 413,852) (669, 163) (139,357) (427,000)
141,915 217,660
74,608
74,608
13,080 16,038
13,080 16,038
(27,578)
(27,578)
154,995 280,728
1,310,653 1,452,073
$ 1,465,648 $ 1,732,801
$ 132,315 $ 70,711
42,491 1,617 18,146
62 1,893
7,983 84,413 1,379
(1,435)
9,600 146,949
$ 141,915 $ 217,660
$ 41,056

CLARK PUBLIC SCHOOL DISTRICT FIDUCIARY FUNDS
STATEMENT OF NET POSITION AS OF JUNE 30, 2019
Private Puruose Trust Funds Kelemen Science
Observatory Donations Fund
ASSETS Cash $ 12,082 $
Total Assets 12,082
LIABILITIES Due to Other Funds Due to Student Groups Employee Deposits Payable - Summer Payroll Accrued Salaries and Wages Payroll Deductions and Withholding Payable Flexible Spending Deposits
Total Liabilities
NET POSITION
Net Position Held in Trust for Scholarships and Other Purposes $ 12,082 $
The accompanying Notes to the Financial Statements are an integral part of this statement 29
Fund
15,903
15,903
15,903
EXHIBIT B-7
Agency Fund
$ 808,830
$ 808,830
$ 257,350 146,834 243,857
1,898 153,493
5,398
$ 808,830

EXHIBIT B-8
CLARK PUBLIC SCHOOL DISTRICT FIDUCIARY FUNDS
STATEMENT OF CHANGES IN NET POSITION FOR THE FISCAL YEAR ENDED JUNE 30, 2019
Private Purpose Trust Funds Kelemen Science
ADDITIONS Investment Earnings
Interest
Total Additions
DEDUCTIONS Miscellaneous Expenses
Total Deductions
Change in Net Position
$
Observatory Fund
97
97
97
$
Donations Fund
128
128
128
Net Position, Beginning ofYear 11,985 15,775
Net Position, End of Year $ 12,082 $ 15,903
The accompanying Notes to the Basic Financial Statements are an integral part of this statement 30

NOTES TO THE FINANCIAL STATEMENTS

CLARK PUBLIC SCHOOL DISTRICT NOTES TO THE FINANCIAL STATEMENTS FOR THE FISCAL YEAR ENDED JUNE 30, 2019
NOTE 1 SUMMARY OF SIGNIFICANT ACCOUNTING POLICIES
A. Reporting Entity
The Clark Public School District (the "Board" or the "District") is an instrumentality of the State of New Jersey, established to function as an education institution. The Board consists of nine elected officials and one representative from Garwood Borough (sending district) and is responsible for the fiscal control of the District. A superintendent is appointed by the Board and is responsible for the administrative control of the District. Under existing statutes, the Board's duties and powers include, but are not limited to, the development and adoption of a school program; the establishment, organization and operation of schools; and the acquisition, maintenance and disposition of school property.
The Board also has broad fmancial responsibilities, including the approval of the annual budget and the establishment of a system of accounting and budgetary controls.
The reporting entity is composed of the primary government, component units, and other organizations that are included to ensure that the financial statements of the District are not misleading. The primary government consists of all funds, departments, boards and agencies that are not legally separate from the District. For the Clark Public School District this includes general operations, food service, before and after school child care and student related activities of the District.
Component units are legally separate organizations for which the District is fmancially accountable. The District is fmancially accountable for an organization ifthe District appoints a voting majority of the organization's governing board and (1) the District is able to significantly influence the programs or services performed or provided by the organization; or (2) the District is legally entitled to or can otherwise access the organization's resources; the District is legally obligated or has otherwise assumed the responsibility to fmance the deficits of, or provide fmancial support to, the organization; or the District is obligated for the debt of the organization. Component units may also include organizations that are fiscally dependent on the District in that the District approves the budget, the issuance of debt or the levying of taxes. Based on the foregoing criteria, the District has no component units. Furthermore, the District is not includable in any other reporting entity as a component unit.
B. New Accounting Standards
During fiscal year 2019, the District adopted the following GASB statement as required:
• GASB No. 88, Certain Disclosures Related to Debt, Including Direct Borrowings and Direct Placements. The primary objective of this Statement is to improve the information that is disclosed in notes to government fmancial statements related to debt, including direct borrowings and direct placements. It also clarifies which liabilities governments should include when disclosing information related to debt. This Statement will improve fmancial reporting by providing users of fmancial statements with essential information that currently is not consistently provided. In addition, information about resources to liquidate debt and the risks associated with changes in terms association with debt will be disclosed.
Other accounting standards that the District is currently reviewing for applicability and potential impact on the financial statements include:
• GASB No. 84, Fiduciary Activities, will be effective with the fiscal year ending June 30, 2020. The objective of this Statement is to improve guidance regarding the identification of fiduciary activities for accounting and financial reporting purposes and how those activities should be reported. This Statement established criteria for identifying fiduciary activities of all state and local governments.
31

CLARK PUBLIC SCHOOL DISTRICT NOTES TO THE FINANCIAL STATEMENTS FOR THE FISCAL YEAR ENDED JUNE 30, 2019
NOTE 1 SUMMARY OF SIGNIFICANT ACCOUNTING POLICIES (Continued)
B. New Accounting Standards (Continued)
• GASB No. 87, Leases, will be effective with the fiscal year ending June 30,2021. The objective of this Statement is to better meet the information needs of financial statement users by improving accounting and fmancial reporting for leases by governments. This Statement increases the usefulness of governments' financial statements by requiring recognition of certain lease assets and liabilities for leases that previously were classified as operating leases and recognized as inflows of resources or outflows of resources based on the payment provisions of the contract.
• GASB No. 89, Accounting for Interest Costs Incurred Before the End of a Construction Period, will be effective beginning with the fiscal year ending June 30, 2020. The objectives of this Statement are (1) to enhance the relevance and comparability of information about capital assets and the cost of borrowing for a reporting period and (2) to simplifY accounting for interest cost incurred before the end of a construction period. This Statement requires that interest cost incurred before the end of a construction period be recognized as an expense in the period in which the cost is incurred for fmancial statements prepared using the economic resources measurement focus. As a result, interest cost incurred before the end of a construction period will not be included in the historical cost of a capital asset reported in a business-type activity or enterprise fund.
C. Basis of Presentation - Financial Statements
The fmancial statements include both district-wide fmancial statements (based on the District as a whole) and fund fmancial statements (based on specific District activities or objectives). Both the district-wide and fund financial statements categorize activities as either governmental activities or business-type activities. While separate district-wide and fund fmancial statements are presented, they are interrelated. In the district-wide financial statements, the governmental activities colunm incorporates data from governmental funds while business-type activities incorporate data from the District's enterprise funds. Fiduciary funds are excluded from the district-wide financial statements.
District-Wide Financial Statements
The district-wide fmancial statements (i.e., the statement of net position and the statement of activities) report information on all of the nonfiduciary activities of the Board of Education. All fiduciary activities are reported only in the fund fmancial statements. For the most part, the effect of interfund activity has been removed from these statements. Governmental activities, which norm-ally are supported by property taxes and intergovernmental revenues, are reported separately from business-type activities, which rely to a significant extent on fees and charges for support. In the statement of net position, both the governmental and business-type activities columns (a) are presented on a consolidated basis by colunm, and (b) reflect on a full accrual economic resource basis, which incorporates long-term assets and receivables as well as long-term debt and obligations.
The statement of activities demonstrates the degree to which the direct expenses of a given function or segment are offset by program revenues. Direct expenses are those that are clearly identifiable with a specific function or segment. Program revenues include 1) charges to customers or other governmental entities, including other school districts, who purchase, use, or directly benefit from goods or services provided by a given function or segment and 2) grants and contributions that are restricted to meeting the operational or capital requirements of a particular function or segment. Property taxes, unrestricted state aid and other items not properly included among program revenues are reported instead as general revenues.
As a general rule the effect of interfund activity has been eliminated from the district-wide fmancial statements. Exceptions to this general rule are charges between the Board's proprietary and fiduciary funds since elimination of these charges would distort the direct costs and program revenues reported for the various functions concerned.
32

CLARK PUBLIC SCHOOL DISTRICT NOTES TO THE FINANCIAL STATEMENTS FOR THE FISCAL YEAR ENDED JUNE 30, 2019
NOTE 1 SUMMARY OF SIGNIFICANT ACCOUNTING POLICIES (Continued)
C. Basis of Presentation- Financial Statements (Continued)
Fund Financial Statements
Separate fund financial statements are provided for governmental, proprietary, and fiduciary activities, even though the latter are excluded from the district-wide financial statements. The emphasis of fund financial statements is on major individual governmental and enterprise funds, each reported as separate columns in the fund fmancial statements. All remaining governmental and enterprise funds are aggregated and reported as nonmajor funds. The District considers all of its governmental and enterprise funds to be major funds.
The District reports the following major governmental funds:
The general fund is the School District's primary operating fund. It accounts for all financial resources of the District, except those to be accounted for in another fund.
The special revenue fund accounts for the proceeds of specific revenue sources legally restricted to expenditures for specified purposes. This fund accounts for federal, state and local financial programs, with the exception of grants for major capital projects and the child nutrition programs.
The capital projects fund accounts for the proceeds from the sale of bonds, lease purchases and other revenues used for the acquisition or construction of capital facilities and other capital assets, other than those financed by the proprietary funds.
The debt service fund accounts for the accumulation of resources that are restricted, committed or assigned for the payment of principal and interest on long-term general obligation debt of governmental funds.
The District reports the following major proprietary funds which are organized to be self-supporting through user charges:
The food service fund accounts for the activities of the school cafeteria, which provides food service to students as well as ala carte and catering services for teachers and special events.
The before and after school program fund accounts for the activities of the District's extended before and after school programs which provides childcare for elementary school students of the district.
Additionally, the government reports the following fund types:
The fiduciary trust funds are used to account for resources legally held in trust for private donations for scholarship awards and for private donations for the science observatory. All resources of the funds, including any earnings on invested resources, may be used to support the intended purpose. There is no requirement that any portion of these resources be preserved as capital.
The fiduciary agency funds account for assets held by the District as an agent for student activities and for payroll deductions and withholdings. The funds for the student activities fund are solely for noninstructional student activities that are supported and controlled by student organizations and clubs for which school administration does not have management involvement. The payroll funds are held to remit employee withholdings to respective state, federal and other agencies.
33

CLARK PUBLIC SCHOOL DISTRICT NOTES TO THE FINANCIAL STATEMENTS FOR THE FISCAL YEAR ENDED JUNE 30, 2019
NOTE 1 SUMMARY OF SIGNIFICANT ACCOUNTING POLICIES (Continued)
C. Basis of Presentation - Financial Statements (Continued)
Fund Financial Statements (Continued)
Activity between funds that are representative of lending/bon-owing arr-angements outstanding at the end of the fiscal year are referr-ed to as either "due to/from other funds" (i.e., the curr-ent portion of interfund loans) or "advances to/from other funds" (i.e., the non-cmTent pmiion of interfund loans). All other outstanding balances between funds are reported as "due to/fi·om other funds". Any residual balances outstanding between the governmental activities and business-type activities are reported in the district-wide financial statements as "internal balances".
Reclassifications
Certain amounts presented in the prior year data may have been reclassified in order to be consistent with the cunent year's presentation.
D. Measurement Focus and Basis of Accounting
The accounting and financial repmiing treatment is detennined by the applicable measurement focus and basis of accounting. Measurement focus indicates the type of resources being measured such as cunent financial resources or econormc resources. The basis of accounting indicates the timing of transactions or events for recognition in the financial statements.
The district-wide financial statements are repmied using the economic resources measurement focus and the accrual basis of accounting, as are the proprietary fund and fiduciary fund financial statements with the exception of the agency fund which does not have a measurement focus. All assets, all liabilities and all defened outflows/inflows of resources associated with these operations (with the exception of the fiduciary funds) are included on the Statement of Net Position. Revenues are recorded when earned and expenses are recorded at the time liabilities are incurred, regardless of the timing of related cash flows. Property taxes are recognized as revenues in the year for which they are levied. Grants and similar items are recognized as revenue as soon as all eligibility requirements imposed by the provider have been met.
Governmental fund financial statements are reported using the curr-ent financial resources measurement focus and the modified accrual basis of accounting. Revenues are recognized when susceptible to accrual (i.e. when they are both measurable and available). Revenues are considered to be available when they are collectible within the curr-ent period or soon enough thereafter to pay liabilities of the curr-ent period. For this purpose, the Board considers revenues to be available if they are collected within 60 days after year-end. Expenditures are recorded when a liability is incurr-ed, as under accrual basis of accounting, with the exception of debt service expenditures as well as expenditures related to compensated absences and claims and judgments which are recorded only when payment is due. General capital asset acquisitions are reported as expenditures in governmental funds. Issuance of long-term debt and acquisitions under capital leases are reported as other financing sources.
Property taxes, tuition, unrestricted state aid, and interest associated with the cunent fiscal period are all considered to be susceptible to accrual and so have been recognized as revenues of the curr-ent fiscal period. Entitlements (formula-type grants and aid) are recorded as revenues when all eligibility requirements are met, including any time requirements, and the amount is received during the period or within the availability period for this revenue source. Expenditure-driven grants and similar awards (reimbursement-type grants and awards) are recognized as revenue when the qualifying expenditures have been incurr-ed and all other eligibility requirements imposed by the grantor or provider have been met, and the amount is received during the period or within the availability period for this revenue source. All other revenue items are considered to be measurable and available only when cash is received by the District.
When both restricted and unrestricted resources are available for use, it is the Board's policy to use restricted resources first, then unrestricted resources as they are needed.
34

CLARK PUBLIC SCHOOL DISTRICT NOTES TO THE FINANCIAL STATEMENTS FOR THE FISCAL YEAR ENDED JUNE 30, 2019
NOTE 1 SUMMARY OF SIGNIFICANT ACCOUNTING POLICIES (Continued)
E. Assets, Liabilities, Deferred Outflows/Inflows of Resources, and Net Position/Fund Balance
1. Cash, Cash Equivalents and Investments
Cash and cash equivalents are considered to be cash on hand, demand deposits, and short-term investments with original maturities of three months or less from the date of acquisition.
Investments are reported at fair value and are limited by N.J.S.A. 18A:20-37.
2. Receivables
All receivables are reported at their gross value, and where appropriate, are reduced by the estimated portion that is expected to be uncollectible.
3. Inventories
The cost of inventories of the governmental fund types are recorded as expenditures at the time individual inventory items are purchased.
Food Service Fund inventories, exclusive of the federal commodities, are valued at cost, using the first-in first-out (FIFO) method and consist of food and expendable supplies. The cost of such inventories is recorded as expenses when consumed rather than when purchased. The United States Department of Agriculture (USDA) commodity portion of the Food Service Fund inventory consists of food donated by the USDA. It is valued at estimated market prices by the USDA. The amount of unused commodities inventory at year-end is reported as deferred inflows of resources.
4. Capital Assets
Capital assets, which include property, plant and equipment, are reported in the applicable governmental or business-type activities columns in the district-wide fmancial statements. Capital assets are defined by the Board as assets with an initial, individual cost of $2,000 and an estimated useful life in excess of two years. The District was able to estimate the historical cost for the initial reporting of these capital assets through back trending. As the District constructs or acquires additional capital assets each period, they are capitalized and reported at historical cost. Donated capital assets are recorded at acquisition value at the date of donation. The costs of normal maintenance and repairs that do not add to the value of the asset or materially extend its useful life are not capitalized.
Major outlays for capital assets and improvements are capitalized as projects are constructed. Interest incurred during the construction phase of capital assets of business-type activities is included as part of the capitalized value of the assets constructed.
Land and construction in progress are not depreciated. The other property, plant, and equipment of the District is depreciated using the straight line method over the following estimated useful lives:
Land Improvements Buildings Building Improvements Heavy Equipment Office Equipment and Furniture Computer Equipment
35
20 40 20
5-15 5-15 5-6

CLARK PUBLIC SCHOOL DISTRICT NOTES TO THE FINANCIAL STATEMENTS FOR THE FISCAL YEAR ENDED JUNE 30, 2019
NOTE 1 SUMMARY OF SIGNIFICANT ACCOUNTING POLICIES (Continued)
E. Assets, Liabilities, Deferred Outflows/Inflows of Resources, and Net Position/Fund Balance (Continued)
5. Deferred Outflows/Inflows of Resources
In addition to assets, the statement of financial position will sometimes report a separate section for deferred outflows of resources. This separate fmancial statement element, deferred outflows of resources, represents a consumption of net position that applies to future periods and so will not be recognized as an outflow of resources (expense/expenditure) until then. The Board has two items which arise only under the accrual basis of accounting that qualify for reporting in this category. One item is the deferred amount on refunding of debt which results from the loss on a debt refunding reported in the district-wide statement of net position. Deferred amounts on debt refunding result from the loss on the transaction when the debt's reacquisition price is greater than the carrying value of the refunded debt. These amounts are deferred and amortized over the shorter of the life of the refunded or refunding debt. The other item that qualifies for reporting in this category is the deferred amounts on net pension liability. Deferred amounts on net pension liability are reported in the district-wide statement of net position and result from: (1) differences between expected and actual experience; (2) changes in assumptions; (3) net difference between projected and actual investment earnings on pension plan investments; (4) changes in proportion and differences between employer contributions and proportionate share of contributions; and (5) contributions made subsequent to the measurement date. These amounts are deferred and amortized over future years.
In addition to liabilities, the statement of fmancial position will sometimes report a separate section for deferred inflows of resources. This separate fmancial statement element, deferred inflows of resources, represents an acquisition of net position that applies to future periods and so will not be recognized as an inflow of resources (revenue) until that time. The Board has two types of items that qualify for reporting in this category. Accordingly, one item that qualifies for reporting in this category are the deferred amounts on net pension liability. Deferred amounts on net pension liability are reported in the district-wide statement of net position and result from: (1) differences between expected and actual experience; (2) changes in assumptions; (3) net difference between projected and actual investment earnings on pension plan investments; and (4) changes in proportion and differences between employer contributions and proportionate share of contributions. These amounts are deferred and amortized over future years. The other item is the deferred commodities revenue, reported in both the district-wide and the proprietary funds statements of net position. The deferred commodities revenue represents the estimated market value of the donated and unused Federal commodities inventory at year end. This amount is deferred and recognized as an inflow of resources in the period the commodities are consumed.
6. Compensated Absences
It is the District's policy to permit employees to accumulate (with certain restrictions) earned but unused vacation and sick leave benefits. A long-term liability of accumulated vacation and sick leave and salary related payments has been recorded in the governmental activities in the district-wide fmancial statements, representing the Board's commitment to fund such costs from future operations. A liability is reported in the governmental funds only to the amount actually due at year end as a result of employee resignations and retirements.
36

CLARK PUBLIC SCHOOL DISTRICT NOTES TO THE FINANCIAL STATEMENTS FOR THE FISCAL YEAR ENDED JUNE 30, 2019
NOTE 1 SUMMARY OF SIGNIFICANT ACCOUNTING POLICIES (Continued)
E. Assets, Liabilities, Deferred Outflows/Inflows of Resources, and Net Position/Fund Balance (Continued)
7. Pensions
In the district-wide financial statements and proprietary fund types in the fund fmancial statements, for purposes of measuring the net pension liability, deferred outflows of resources and deferred inflows of resources related to pensions, and pension expense, information about the fiduciary net position of the retirement systems sponsored and administered by the State of New Jersey and additions to/deductions from these retirement systems' fiduciary net position have been determined on the same basis as they are reported by the retirement systems. For this purpose, benefit payments (including refunds of employee contributions) are recognized when due and payable in accordance with the benefit terms. Investments are reported at fair value.
In the governmental fund fmancial statements, net pension liabilities represent amounts normally expected to be liquidated with expendable available fmancial resources for required pension contributions that are due and payable at year end. Pension expenditures are recognized based on contractual pension contributions that are required to be made to the pension plan during the fiscal year.
8. Long-Term Obligations
In the district-wide fmancial statements, and proprietary fund types in the fund financial statements, long-term debt and other long-term obligations are reported as liabilities in the applicable governmental activities, business-type activities, or proprietary fund type statement of net position. Losses resulting from debt refundings are classified as deferred outflows of resources. Bond premiums are deferred and amortized over the life of the bonds using the effective interest method. Losses resulting from debt refundings are also deferred and amortized over the life of the refunded bonds or new bonds whichever is less using the effective interest method. Bonds payable are reported with the unamortized bond premium or discount. Bond issuance costs (other than for prepaid insurance) are treated as an expense.
In the fund financial statements, governmental fund types recognize bond premiums, as well as bond issuance costs, during the current period. The face amount of debt issued is reported as other financing sources. Premiums received on debt issuances are reported as other fmancing sources. Issuance costs, whether or not withheld from the actual debt proceeds received, are reported as debt service expenditures.
9. Net Position/Fund Balance
District-Wide Statements
In the district-wide statements, there are three classes of net position:
• Net Investment in Capital Assets- consists of net capital assets (cost less accumulated depreciation) reduced by outstanding balances of related debt obligations from the acquisition, construction or improvement of those assets. Deferred outflows of resources and deferred inflows of resources attributable to the acquisition, construction or improvement of those assets or related debt also should be included.
• Restricted Net Position - reports net position when constraints placed on the residual amount of non capital assets are either externally imposed by creditors (such as through debt covenants), grantors, contributors, or laws or regulations of other governments, or imposed by law through constitutional provisions or enabling legislation.
• Unrestricted Net Position - any portion of net position not already classified as either net investment in capital assets or net position -restricted is classified as net position - unrestricted.
37

CLARK PUBLIC SCHOOL DISTRICT NOTES TO THE FINANCIAL STATEMENTS FOR THE FISCAL YEAR ENDED JUNE 30, 2019
NOTE 1 SUMMARY OF SIGNIFICANT ACCOUNTING POLICIES (Continued)
E. Assets, Liabilities, Deferred Outflows/Inflows of Resources, and Net Position/Fund Balance (Continued)
9. Net Position/Fund Balance (Continued)
Governmental Fund Statements
Fund balance categories are designed to make the nature and extent of the constraints placed on the District's fund balance more transparent. These categories are comprised of a hierarchy based primarily on the extent to which the District is bound to observe constraints imposed upon the use of the resources reported in governmental funds.
Restricted Fund Balance- Amounts constrained to specific purposes by their providers (such as grantors, bondholders, and higher levels of government), through constitutional provisions, or by enabling legislation.
Excess Surplus- Designated for Subsequent Year's Expenditures- This restriction was created in accordance with NJSA 18A:7F-7 to represent the June 30, 2018 audited excess surplus that was appropriated in the 2019/2020 original budget certified for taxes.
Excess Surplus- This restriction was created in accordance with NJSA 18A:7F-7 to represent the June 30, 2019 audited excess surplus that is required to be appropriated in the 2020/2021 original budget certified for taxes.
Capital Reserve- This restriction was created by the District in accordance with NJAC 6A:23A-14.1 to fund future capital expenditures (See Note 2B).
Maintenance Reserve - This restriction was created by the Board in accordance with NJAC 6A:23A-14.2 to accumulate funds for the required maintenance of school facilities in accordance with the EFCA (NJSA 18A:7G-9) for a thorough and efficient education. (See Note 2C).
Capital Projects - Represents fund balance restricted specifically for capital acquisitions and improvements in the Capital Projects Fund.
Debt Service - Represents fund balance restricted specifically for the repayment of long-term debt principal and interest in the Debt Service Fund.
Assigned Fund Balance - Amounts a government intends to use for a specific purpose; intent can be expressed by the governing body or by an official or body to which the governing body delegates the authority.
Year-End Encumbrances - Represent outstanding purchase orders for goods or services approved by management for specific purposes from available resources of the current year for which the goods and materials have not yet been received or the services have not yet been rendered at June 30.
Unassigned Fund Balance - Represents fund balance that has not been restricted, committed or assigned to specific purposes within the governmental funds.
In the general operating fund and other governmental funds (capital projects and debt service fund types), it is the District's policy to consider restricted resources to have been spent first when an expenditure is incurred for purposes for which both restricted and unrestricted (i.e., committed, assigned or unassigned) fund balances are available, followed by committed and then assigned fund balances. Unassigned amounts are used only after the other resources have been used.
38

CLARK PUBLIC SCHOOL DISTRICT NOTES TO THE FINANCIAL STATEMENTS FOR THE FISCAL YEAR ENDED JUNE 30, 2019
NOTE 1 SUMMARY OF SIGNIFICANT ACCOUNTING POLICIES (Continued)
E. Assets, Liabilities, Deferred Outflows/Inflows of Resources, and Net Position/Fund Balance (Continued)
10. Fund Balance Policies
Fund balance of governmental funds is reported in various categories based on the nature of any limitations requiring the use of resources for specific purposes. The government itself can establish limitations on the use of resources through either a commitment (committed fund balance) or an assignment (assigned fund balance).
The committed fund balance classification includes amounts that can be used only for the specific purposes determined by a formal action of the government's highest level of decision-making authority. The Board of Trustees is the highest level of decision-making authority for the government that can, by adoption of a resolution or formal Board action prior to the end of the fiscal year, commit fund balance. Once adopted, the limitation imposed by the resolution remains in place until a similar action is taken (the adoption of another resolution) to remove or revise the limitation. The District has no committed fund balances at year end.
Amounts in the assigned fund balance classification are intended to be used by the government for specific purposes but do not meet the criteria to be classified as committed. The Board has authorized the School Business Administrator/Board Secretary to assign fund balance. The Board may also assign fund balance as it does when appropriating fund balance to cover a gap between estimated revenue and appropriations in the subsequent year's appropriated budget. Unlike commitments, assignments generally only exist temporarily. In other words, an additional action does not normally have to be taken for the removal of an assignment. Conversely, as discussed above, an additional action is essential to either remove or revise a commitment.
F. Revenues and Expenditures/Expenses
1. Program Revenues
Amounts reported as program revenues in the district-wide statement of activities include 1) charges to customers or applicants for goods or services, provided, 2) operating grants and contributions, and 3) capital grants and contributions. Internally dedicated resources are reported as general revenues rather than as program revenues. Likewise, general revenues include all property taxes, unrestricted state aid, investment earnings and miscellaneous revenues.
2. Property Taxes
Property taxes are levied pursuant to law and are collected by the municipality and are transferred to the District as requested. Property tax revenues are recognized in the year they are levied and become available. Property taxes collected in advance of the year-end for which they are levied and transferred to the District are reported as deferred inflows of resources. The tax bills are mailed annually in June by the municipal tax collector and are levied and due in four quarterly installments on August 1, November 1, February 1 and May 1 of the fiscal year. When unpaid, taxes or any other municipal lien, or part thereof, on real property, remains in arrears on April 1st in the year following the calendar year levy when the same became in arrears, the tax collector of the municipality shall, subject to the provisions of New Jersey Statute, enforce the lien by placing the property on a tax sale. The municipality may institute annual "in rem" tax foreclosure proceedings to enforce the tax collection or acquisition of title to the property.
39

CLARK PUBLIC SCHOOL DISTRICT NOTES TO THE FINANCIAL STATEMENTS FOR THE FISCAL YEAR ENDED JUNE 30, 2019
NOTE 1 SUMMARY OF SIGNIFICANT ACCOUNTING POLICIES (Continued)
F. Revenues and Expenditures/Expenses (Continued)
3. Tuition Revenues and Expenditures
Tuition Revenues - Tuition charges were established by the Board of Education based on estimated costs. The charges are subject to adjustment when the final costs are determined and certified by the State Department of Education.
Tuition Expenditures- Tuition charges for the fiscal years 2017-2018 and 2018-2019 were based on rates established by the receiving district. These rates are subject to change when the actual costs have been certified by the State Department of Education.
4. Proprietary Funds, Operating and Nonoperating Revenues and Expenses
Proprietary funds distinguish operating revenues and expenses from nonoperating items. Operating revenues and expenses generally result from providing services and producing and delivering goods in connection with a proprietary fund's principal ongoing operations. The principal operating revenues of the food service enterprise fund and of the before and after school program enterprise fund are charges to customers for sales and services. Operating expenses for enterprise funds include the cost of sales and services, administrative expenses, and depreciation on capital assets. All revenues and expenses not meeting this definition are reported as nonoperating revenues and expenses. Federal and State subsidies for the food service operation are considered nonoperating revenues.
NOTE 2 STEWARDSHIP, COMPLIANCE AND ACCOUNTABILITY
A. Budgetary Information
In accordance with the requirements of the New Jersey Department of Education ("the Department"), the District annually prepares its operating budget for the forthcoming year. The budget, except for the general fund and special revenue fund, which is more fully explained below and in the notes to the required supplementary information, is prepared in accordance with accounting principles generally accepted in the United States of America and serves as a formal plan for expenditures and the proposed means for financing them. Capital lease transactions are accounted for on the GAAP basis.
The annual budget is adopted in the spring of the preceding year for the general, special revenue and debt service funds. The District is not required to adopt an annual budget for the capital projects fund. The budget is submitted to the county superintendent for review and approval prior to adoption. Prior to the 2012/2013 budget year, the annual budget was required to be voted upon at the annual school election held on the third Tuesday in April. On January 17, 2012, Chapter 202 of the Laws of P.L. 2011 was approved which established procedures for moving the date of a school district's annual school election from April to the general election in November. Under the new law, districts that have their school board members elected in November no longer have to submit their budgets that meet levy cap requirements for voter approval beginning with the 2012/2013 budget year. Only a school board decision to exceed the tax levy cap would require voter approval for the additional amount on the November ballot. The Board adopted a resolution to move its annual election to the date of the general elections in accordance with the law; therefore voter approval of the annual budget is not required.
40

CLARK PUBLIC SCHOOL DISTRICT NOTES TO THE FINANCIAL STATEMENTS FOR THE FISCAL YEAR ENDED JUNE 30, 2019
NOTE 2 STEWARDSHIP, COMPLIANCE AND ACCOUNTABILITY (Continued)
A. Budgetary Information (Continued)
Budget adoptions and amendments are recorded in the District's board minutes. The budget is amended by the Board of Trustees as needed throughout the year. The budget for revenues, other resources, other uses, and fund balances is prepared by fund source and amount. The budget for expenditures is prepared by fund, program, function, object and amount. The legal level of budgetary control is established at the line item account within each fund. Line item accounts are defined as the lowest (most specific) level of detail as established pursuant to the minimum chart of accounts referenced in N.J.A.C. 6:20-2A.2(m)l. The Board approved several budget transfers during 2018/2019. Also, during 2018/2019 the Board increased the original budget by $373,732. The increase was funded by grant awards and the reappropriation of prior year general fund encumbrances.
Formal budgetary integration into the accounting system is employed as a management control device during the year. For governmental funds there are no substantial differences between the budgetary basis of accounting and accounting principles generally accepted in the United States of America, with the exception of the legally mandated revenue recognition of certain state aid payments for budgetary purposes only and the treatment of encumbrances in the special revenue fund as described in the Notes to Required Supplementary Information (RSI). Encumbrance accounting is also employed as an extension of formal budgetary integration in the governmental fund types. Unencumbered appropriations lapse at fiscal year end.
Encumbrance accounting is employed in the governmental funds. Under encumbrance accounting, purchase orders, contracts and other commitments for the expenditure of resources are recorded to reserve a portion of the applicable appropriation. Open encumbrances in governmental funds other than the special revenue fund are reported as committed and/or assigned fund balances at fiscal year end as they do not constitute expenditures or liabilities but rather commitments related to unperformed contracts for goods and services which are reappropriated and honored during the subsequent fiscal
' year.
B. Capital Reserve
A capital reserve account was established by the District. The accumulation of funds will be used for capital outlay expenditures in subsequent fiscal years. The capital reserve is maintained in the general fund and its activity is included in the general fund annual budget.
Funds placed in the capital reserve are restricted to capital projects in the district's approved Long Range Facilities Plan (LRFP). Upon submission of the LRFP to the Department, a district may increase the balance in the capital reserve by appropriating funds in the annual general fund budget certified for taxes or by transfer by board resolution at year end of any unanticipated revenue or unexpended line-item appropriation amounts or both. A district may also appropriate additional amounts when the express approval of the voters has been obtained either by a separate proposal at budget time or by a special question at one of the four special elections authorized pursuant to N.J.S.A. 19:60-2. Pursuant to N.J.A.C. 6:23A-14.1(g), the balance in the reserve cannot at any time exceed the local support costs of uncompleted capital projects in its approved LRFP.
41

CLARK PUBLIC SCHOOL DISTRICT NOTES TO THE FINANCIAL STATEMENTS FOR THE FISCAL YEAR ENDED JUNE 30, 2019
NOTE 2 STEWARDSHIP, COMPLIANCE AND ACCOUNTABILITY (Continued)
B. Capital Reserve (Continued)
The activity of the capital reserve for the fiscal year ended June 30, 2019 is as follows:
Balance, July 1, 2018 $ 586,163
Increased by Interest Earnings 1,000
Balance, June 30, 2019 $ 587,163
C. Maintenance Reserve
A maintenance reserve account was established by the District. The accumulation of funds will be used for required maintenance of school facilities expenditures in subsequent fiscal years. The maintenance reserve is maintained in the General Fund and its activity is included in the General Fund annual budget.
Funds placed in the maintenance reserve are restricted to required maintenance activities for a school facility as reported in the comprehensive maintenance plan. A District may appropriate funds into the maintenance reserve in the annual General Fund budget certified for taxes or by transfer by board resolution at year end of any unanticipated revenue or unexpended line item appropriation amounts or both. Pursuant to N.J.A.C. 6A:23A-14.2(g), the balance in the reserve cannot at any time exceed four percent of the replacement cost of the school district's school facilities for the current year.
The activity of the maintenance reserve for the fiscal year ended June 30, 2019 is as follows:
Balance, July 1, 2018
Increased by Interest Earnings
Balance, June 30, 2019
$ 634,284
1,500
$ 635,784
The June 30,2019 comprehensive maintenance plan indicated a maximum maintenance reserve amount of$2,023,427.
D. Transfers to Capital Outlay
During the 2018/2019 school year, the district transferred $181,959 to the non-equipment capital outlay accounts. The transfer was approved by the County Superintendent.
E. Calculation of Excess Surplus
In accordance with N.J.S.A. 18A:7F-7, as amended, the restricted fund balance for Excess Surplus is a required calculation pursuant to the New Jersey Comprehensive Educational Improvement and Financing Act of 1996 (CEIFA). New Jersey school districts are required to restrict General Fund fund balance in excess of2% of budget expenditures at the fiscal year end of June 30 if they did not appropriate a required minimum amount as budgeted fund balance in their subsequent year's budget. The excess fund balance at June 30, 2019 is $5,139,521. Of this amount, $2,165,576 was designated and appropriated in the 2019/2020 original budget certified for taxes and the remaining amount of$2,973,945 will be appropriated in the 2020/2021 original budget certified for taxes.
42

CLARK PUBLIC SCHOOL DISTRICT NOTES TO THE FINANCIAL STATEMENTS FOR THE FISCAL YEAR ENDED JUNE 30, 2019
NOTE 3 DETAILED NOTES ON ALL FUNDS
A. Cash Deposits and Investments
Cash Deposits
The Board's deposits are insured through either the Federal Deposit Insurance Corporation (FDIC), National Credit Union Share Insurance Fund (NCUSIF), Securities Investor Protection Corporation (SIPC) or New Jersey's Governmental Unit Deposit Protection Act (GUDPA). The Board is required to deposit their funds in a depository which is protecting such funds pursuant to GUDPA. The New Jersey Governmental Unit Deposit Protection Act requires all banks doing business in the State ofNew Jersey to pledge collateral equal to at least 5% of the average amount of its public deposits and 100% of the average amount of its public funds in excess of the lesser of 75% of its capital funds or $200 million for all deposits not covered by the FDIC and NCUSIF.
Bank balances are insured up to $250,000 in the aggregate by the FDIC for each bank. NCUSIF insures credit union accounts up to $250,000 in the aggregate for each fmancial institution. SIPC replaces cash claims up to a maximum of $250,000 for each failed brokerage firm. At June 30, 2019, the book value of the Board's deposits were $10,080,263 and bank and brokerage firm balances of the Board's deposits amounted to $10,383,484. The Board's deposits which are displayed on the various fund balance sheets as "cash" are categorized as:
Depository Account
Insured $
Bank Balance
10,383,484
Custodial Credit Risk - Deposits - Custodial credit risk is the risk that in the event of a bank failure, the government's deposits may not be returned to it. The Board does not have a policy for custodial credit risk. As of June 30, 2019 none of the Board's bank balances were exposed'to custodial credit risk.
Investments
The Board is permitted to invest public funds in accordance with the types of securities authorized by N.J.S.A. 18A:20-37. Examples of the allowable investments are bonds or other obligations of the United States or obligations guaranteed by the United States of America; Government Money Market Mutual Funds; any obligation that a federal agency or a federal instrumentality has issued in accordance with an act of Congress, which security has a maturity date not greater than 397 days from the date of purchase, provided that such obligations bear a fixed rate of interest not dependent on any index or other external factor; bonds or other obligations of the school district or bonds or other obligations of the local unit or units within which the school district is located; Bonds or other obligations, having a maturity date of not more than 397 days from the date of purchase, issued by New Jersey school districts, municipalities, counties, and entities subject to the "Local Authorities Fiscal Control Law," (C.40A:5A-1 et seq.); Other bonds or obligations having a maturity date not more than 397 days from the date of purchase may be approved by the Division of Investment in the Department of the Treasury for investment by school districts; Local Government investment pools; deposits with the State of New Jersey Cash Management Fund established pursuant to section 1 ofP.L. 1977, c.281 (C.52:18A-90.4); and agreements for the repurchase of fully collateralized securities, if transacted in accordance with the above statute.
As of June 30, 2019, the Board had no outstanding investments.
43

CLARK PUBLIC SCHOOL DISTRICT NOTES TO THE FINANCIAL STATEMENTS FOR THE FISCAL YEAR ENDED JUNE 30, 2019
NOTE 3 DETAILED NOTES ON ALL FUNDS (Continued)
B. Receivables
Receivables as of June 30, 2019 for the district's individual major funds in the aggregate, including the applicable allowances for uncollectible accounts, are as follows:
Special Food General Revenue Service
Fund Fund Fund Total Receivables:
Intergovernmental: Local $ 321,528 $ 321,528 State 81,402 $ 2,813 $ 370 84,585 Federal 87,488 4,433 91,921
Other 428 428
Gross Receivables 402,930 90,301 5,231 498,462 Less: Allowance for
Uncollectibles
Net Total Receivables $ 402,930 $ 90,301 $ 5,231 $ 498,462
c. Unearned Revenue
Governmental funds report unearned revenue in connection with resources that have been received, but not yet earned. At the end of the current fiscal year, the various components of unearned revenue reported in the governmental funds were as follows:
Special Revenue Fund Unencumbered Grant Draw Downs Grant Draw Downs Reserved for Encumbrances
Total Deferred Revenue for Governmental Funds
44
$
$
5,228 68,575
73,803

CLARK PUBLIC SCHOOL DISTRICT NOTES TO THE FINANCIAL STATEMENTS FOR THE FISCAL YEAR ENDED JUNE 30, 2019
NOTE 3 DETAILED NOTES ON ALL FUNDS (Continued)
D. Capital Assets
Capital asset activity for the fiscal year ended June 30, 2019 was as follows:
Balance Balance
July 1, 2018 Increases Decreases June 30,2019
Governmental Activities:
Capital Assets, Not Being Depreciated:
Land $ 1,808,965 $ 1,808,965 Construction in Progress $ 8,500 8,500
Total Capital Assets, Not Being Depreciated 1,808,965 8,500 1,817,465
Capital Assets, Being Depreciated:
Site Improvements 2,077,484 618,180 2,695,664 Buildings and Improvements 47,761,779 26,916 47,788,695
Machinery and Equipment 4,149,902 103,932 $ (23,202) 4,230,632
Total Capital Assets Being Depreciated 53,989,165 749,028 (23,202) 54,714,991
Less Accumulated Depreciation for:
Site Improvements (1,51 0,430) (103,540) (1,613,970)
Buildings and Improvements (27,467,039) (1,876,553) (29,343,592) Machinery and Equipment (2,953,760) (216,792) 15,662 (3, 154,890)
Total Accumulated Depreciation (31,931,229) (2, 196,885) 15,662 (34, 112,452)
Total Capital Assets, Being Depreciated, Net 22,057,936 (1,447,857) (7,540) 20,602,539
Government Activities Capital Assets, Net $ 23,866,901 $ (1,439,357) $ (7,540) $ 22,420,004
Business-Type Activities: Capital Assets, Being Depreciated:
Machinery and Equipment $ 423,226 $ 27,578 $ (8,480) $ 442,324
Total Capital Assets Being Depreciated 423,226 27,578 (8,480) 442,324
Less Accumulated Depreciation for: Machinery and Equipment (234,837) (18,146) 8,056 (244,927)
Total Accumulated Depreciation (234,837) (18,146) 8,056 (244,927)
Total Capital Assets, Being Depreciated, Net 188,389 9,432 (424) 197,397
Business-Type Activities Capital Assets, Net $ 188,389 $ 9,432 $ (424) $ 197,397
45

CLARK PUBLIC SCHOOL DISTRICT NOTES TO THE FINANCIAL STATEMENTS FOR THE FISCAL YEAR ENDED JUNE 30, 2019
NOTE 3 DETAILED NOTES ON ALL FUNDS (Continued)
D. Capital Assets (Continued)
Depreciation expense was charged to functions/programs of the District as follows:
Governmental Activities: Instruction Regular
Total Instruction
Support Services Student and Instruction Related Services General Administration School Administration Central Services Plant Operations and Maintenance Pupil Transportation
Total Support Services
Total Depreciation Expense- Governmental Activities
Business-Type Activities: Food Service Fund Before and After School Program Fund
Total Depreciation Expense-Business-Type Activities
E. Interfund Receivables, Payables, and Transfers
The composition ofinterfund balances as ofJune 30,2019, is as follows:
Due To/From Other Funds
Receivable Fund
General Fund General Fund Food Service Fund
Total
Payable Fund
Before and After Care Fund Payroll Agency Fund General Fund
$ 2,079,804
$
$
$
$
$
2,079,804
29,800 676 485
5,922 60,182 20,016
117,081
2,196,885
16,529 1,617
18,146
Amount
22,410 257,350
28,608
308,368
The above balances are the result of revenues earned in one fund which are due to another fund and/or expenditures paid by one fund on behalf of another fund.
The District expects all interfund balances to be liquidated within one year.
46

CLARK PUBLIC SCHOOL DISTRICT NOTES TO THE FINANCIAL STATEMENTS FOR THE FISCAL YEAR ENDED JUNE 30, 2019
NOTE 3 DETAILED NOTES ON ALL FUNDS (Continued)
F. Leases
Capital Leases and Interlocal Agreement
The District is leasing copiers and a school bus totaling $303,500 under capital leases. In addition, the district entered into an interlocal agreement with the Township of Clark totaling $375,000 for the renovation of the turf athletic field. The leases and inter local agreement are for terms of 2 to 5 years.
The capital assets acquired through capital leases and interlocal agreement are as follows:
Site Improvements Machinery and Equipment
Total
Governmental Activities
$
$
375,000 303,500
678,500
The future minimum lease and other interlocal agreement obligations and the net present value of these minimum lease and other interlocal agreements payments as of June 30, 2019 were as follows:
Govenunental Activities
Fiscal Capital Inter local Year Ending June 30 Leases Agreement
2020 $ 103,698 $ 75,000 2021 54,397 75,000 2022 13,599 75,000 2023 75,000
Total minimum lease payments 171,694 300,000 Less: amount representing interest {8,451) Present value of minimum lease payments $ 163,243 $ 300,000
47

CLARK PUBLIC SCHOOL DISTRICT NOTES TO THE FINANCIAL STATEMENTS FOR THE FISCAL YEAR ENDED JUNE 30, 2019
NOTE 3 DETAILED NOTES ON ALL FUNDS (Continued)
G. Long-Term Debt
General Obligation Bonds
The Board issued general obligation refunding bonds in order to advance refund certain principal and interest maturities of the 2005 school bonds which provided funds for the acquisition and construction of major capital facilities, other capital assets and other purposes permitted by statute. The full faith and credit of the Board are irrevocably pledged for the payment of the principal of the bonds and the interest thereon.
Bonds payable at June 30,2019 are comprised ofthe following issues:
$14,145,000, 2012 Refunding Bonds, due in annual installments of$1,010,000 to $1,755,000 through June 1, 2026, interest at 2.63% to 4.00% $10.160.000
The Board's schedule of principal and interest for long-term debt issued and outstanding is as follows:
Governmental Activities:
Year Ending Serial Bonds June 30, Principal Interest Total
2020 $ 1,010,000 $ 341,031 $ 1,351,031 2021 1,095,000 300,631 1,395,631 2022 1,295,000 259,831 1,554,831 2023 1,590,000 208,031 1,798,031 2024 1,705,000 144,431 1,849,431
2025-2027 3,465,000 152,326 3,617,326
$ 10,160,000 $ 1,406,281 $ 11,566,281
Statutorv Borrowing Power
The Board's remaining borrowing power under N.J.S. 18A:24-19, as amended, at June 30, 2019 was as follows:
4% of Equalized Valuation Basis (Municipal) Less: Net Debt
Remaining Borrowing Power
48
$
$
106,958,996 10,160,000
96,798,996

CLARK PUBLIC SCHOOL DISTRICT NOTES TO THE FINANCIAL STATEMENTS FOR THE FISCAL YEAR ENDED JUNE 30, 2019
NOTE 3 DETAILED NOTES ON ALL FUNDS (Continued)
H. Other Long-Term Liabilities
Changes in Long-Term Liabilities
Long-term liability activity for the fiscal year ended June 30, 2019, was as follows:
Beginning
Balance Additions Reductions
Governmental Activities: Bonds Payable $ 11,135,000 $ 975,000
Add: Original Issue Premium 407,035 72,596
Total Bonds Payable 11,542,035 1,047,596
Capital Leases Payable 258,484 95,241
Interlocal Agreement Payable $ 375,000 75,000
Compensated Absences 790,701 57,243 Net Pension Liability 7,077,525 1,087,201
Governmental Activity Long-Term Liabilities $ 19,668,745 $ 432,243 $ 2,305,038
Due Ending Within Balance One Year
$ 10,160,000 $ 1,010,000 334,439
10,494,439 1,010,000
163,243 95,240
300,000 75,000
847,944 5,990,324
$ 17,795,950 $ 1,180,240
For the governmental activities, the liabilities for capital leases, interlocal agreements, compensated absences, and net pension liability are generally liquidated by the general fund.
NOTE 4 OTHER INFORMATION
A. Risk Management
The District is exposed to various risks of loss related to property, general liability, automobile coverage, theft of, damage to and destruction of assets; errors and omissions; injuries to employees; student accident; termination of employees and natural disasters. The Board has obtained commercial insurance coverage to guard against these events to minimize the exposure to the District should they occur. A complete schedule of insurance coverage can be found in the statistical section of this Comprehensive Annual Financial Report.
There has been no significant reduction in insurance coverage from the previous year nor have there been any settlements in excess of insurance coverage's in any of the prior three years.
B. Contingent Liabilities
The District is a party defendant in some lawsuits, none of a kind unusual for a school district of its size and scope of operation. In the opinion of the Board's Attorney the potential claims against the District not covered by insurance policies would not materially affect the financial condition of the District.
49

CLARK PUBLIC SCHOOL DISTRICT NOTES TO THE FINANCIAL STATEMENTS FOR THE FISCAL YEAR ENDED JUNE 30, 2019
NOTE 4 OTHER INFORMATION (Continued)
B. Contingent Liabilities (Continued)
Federal and State Awards - The Board participates in a number of federal and state programs that are fully or partially funded by grants received from other governmental units. Expenditures financed by grants are subject to audit by the appropriate grantor government. If expenditures are disallowed due to noncompliance with grant program regulations, the Board may be required to reimburse the grantor government. As of June 30, 2019, significant amounts of grant expenditures have not been audited by the various grantor agencies but the Board believes that disallowed expenditures, if any, based on subsequent audits will not have a material effect on any of the individual governmental funds or the overall financial position of the District.
C. Federal Arbitrage Regulations
The District is subject to Section 148 of the Internal Revenue Code as it pertains to the arbitrage rebate on all tax-exempt obligations, both long and short-term debt. Under the 1986 Tax Reform Act, the Internal Revenue Service (IRS) required that all excess earnings from investment proceeds be rebated to the IRS. Arbitrage, for purposes of these regulations, is defmed as the difference between the yield on the investment and the yield on the obligations issued. If there are excess earnings, this amount may be required to be rebated to the IRS. At June 30,2019, the District has not estimated its arbitrage earnings due to the IRS, if any.
D. Employee Retirement Systems and Pension Plans
Plan Descriptions and Benefits Provided
The State of New Jersey sponsors and administers the following contributory defmed benefit public employee retirement systems (retirement systems) covering substantially all Board employees who are eligible for pension coverage:
Public Employees' Retirement System (PERS)- Established in January 1955, under the provisions ofN.J.S.A. 43:15A to provide coverage to substantially all full time employees of the State or any county, municipality, school district, or public agency provided the employee is not a member of another State-administered retirement system. Membership is mandatory for such employees. PERS is a cost sharing multiple employer defined benefit pension plan. For additional information about PERS, please refer to the State Division of Pension and Benefits (Division's) Comprehensive Annual Financial Report (CAFR) which can be found at www.state.nj.us/treasury/pensions.
The vesting and benefit provisions are set by N.J.S.A. 43:15A. PERS provides retirement, death, and disability benefits. All benefits vest after ten years of service, except for medical benefits, which vest after 25 years of service or under the disability provisions ofPERS.
The following represents the membership tiers for PERS:
Tier Definition
1 Members who were enrolled prior to July 1, 2007 2 Members who were eligible to enroll on or after July 1, 2007 and prior to November 2, 2008 3 Members who were eligible to enroll on or after November 2, 2008 and prior to May 22, 2010 4 Members who were eligible to enroll on or after May 22, 2010 and prior to June 28, 2011 5 Members who were eligible to enroll on or after June 28, 2011
50

CLARK PUBLIC SCHOOL DISTRICT NOTES TO THE FINANCIAL STATEMENTS FOR THE FISCAL YEAR ENDED .JUNE 30, 2019
NOTE 4 OTHER INFORMATION (Continued)
D. Employee Retirement Systems and Pension Plans (Continued)
Public Employees' Retirement System (PERS) (Continued)
Service retirement benefits of 1/55th offmal average salary for each year of service credit is available to tier 1 and 2 members upon reaching age 60 and to tier 3 members upon reaching age 62. Service retirement benefits of 1/60th of fmal average salary for each year of service credit is available to tier 4 members upon reached age 62 and tier 5 members upon reaching age 65. Early retirement benefits are available to tier 1 and 2 members before reaching age 60, tier 3 and 4 members with 25 or more years of service credit before age 62, and tier 5 members with 30 or more years of service credit before age 65. Benefits are reduced by a fraction of a percent for each month that a member retires prior to the age at which a member can receive full early retirement benefits in accordance with their respective tier. Tier 1 members can receive an unreduced benefit from age 55 to age 60 if they have at least 25 years of service. Deferred retirement is available to members who have at least ten years of service credit and have not reached the service retirement age for the respective tier.
Teachers' Pension and Annuity Fund (TP AF) -Established in January 1955, under the provisions ofN.J.S.A. 18A:66 to provide coverage to substantially all full time certified teachers or professional staff of the public school systems in the State. Membership is mandatory for such employees. TP AF is a cost sharing multiple- employer defined benefit pension plan with a special funding situation, which the State is responsible to fund 100% of local employer contributions, excluding any local employer early retirement incentive (ERI) contributions. For additional information about TPAF, please refer to the State Division of Pension and Benefits (Division's) Comprehensive Annual Financial Report (CAFR) which can be found at www.state.nj .us/treasury/pensions.
The vesting and benefit provisions are set by N.J.S.A. 18A:66. TP AF provides retirement, death, and disability benefits. All benefits vest after ten years of service, except for medical benefits, which vest after 25 years of service or under the disability provisions of TPAF. Members are always fully vested for their own contributions and, after three years of service credit, become vested for 2% of related interest earned on the contributions. In the case of death before retirement, members' beneficiaries are entitled to full interest credited to the members' accounts.
The following represent the membership tiers for TP AF:
Tier
1 2 3 4 5
Definition
Members who were enrolled prior to July 1, 2007 Members who were eligible to enroll on or after July 1, 2007 and prior to November 2, 2008 Members who were eligible to enroll on or after November 2, 2008 and prior to May 22, 2010 Members who were eligible to enroll on or after May 22, 2010 and prior to June 28, 2011 Members who were eligible to enroll on or after June 28, 2011
Service retirement benefits of 1/55th offmal average salary for each year of service credit is available to tier 1 and 2 members upon reaching age 60 and to tier 3 members upon reaching age 62. Service retirement benefits of 1/60th of fmal average salary for each year of service credit is available to tier 4 members upon reached age 62 and tier 5 members upon reaching age 65. Early retirement benefits are available to tier 1 and 2 members before reaching age 60, tier 3 and 4 members with 25 or more years of service credit before age 62, and tier 5 members with 30 or more years of service credit before age 65. Benefits are reduced by a fraction of a percent for each month that a member retires prior to the retirement for his/her respective tier. Deferred retirement is available to members who have at least ten years of service credit and have not reached the service retirement age for the respective tier.
51

CLARK PUBLIC SCHOOL DISTRICT NOTES TO THE FINANCIAL STATEMENTS FOR THE FISCAL YEAR ENDED JUNE 30, 2019
NOTE 4 OTHER INFORMATION (Continued)
D. Employee Retirement Systems and Pension Plans (Continued)
Teachers' Pension and Annuity Fund (TP AF) (Continued)
The State of New Jersey sponsors and administers the following defined contribution public employee retirement program covering certain state and local government employees which include those Board employees who are eligible for pension coverage.
Defined Contribution Retirement Program (DCRP)- established under the provisions of Chapter 92, P.L. 2007 and Chapter 103, P.L. 2008 to provide coverage to elected and certain appointed officials, effective July 1, 2007 and employees enrolled in PERS on or after July 1, 2007 who earn in excess of established annual maximum compensation limits (equivalent to annual maximum wage for social security deductions). This provision was extended by Chapter 1, P.L. 2010, effective May 21, 2010, to new employees (Tier 2) of the PFRS and new employees who would otherwise be eligible to participate in PERS and do not earn the minimum salary required or do not work the minimum required hours but earn a base salary of at least $5,000 are eligible for participation in the DCRP. Membership is mandatory for such individuals with vesting occurring after one (1) year of membership. DCRP is a defined contribution pension plan.
Other Pension Funds
The State established and administers a Supplemental Annuity Collective Trust Fund (SACT) which is available to active members of the State-administered retirement systems to purchase annuities to supplement the guaranteed benefits provided by their retirement system. The state or local government employers do not appropriate funds to SACT.
The cost of living increase for PERS and TP AF, are funded directly by each of the respective systems but are currently suspended as a result of reform legislation.
According to state law, all obligations of each retirement system will be assumed by the State of New Jersey should any retirement system be terminated.
The State of New Jersey, Department of the Treasury, Division of Pensions and Benefits ("Division"), issues publicly available financial reports that include the financial statements and required supplementary information of each of the above systems. The financial reports may be accessed via the New Jersey, Division of Pensions and Benefits, website at www. state.nj. us/treasury/pensions.
Plan Amendments
The authority to amend the provisions of the above plans rests with new legislation passed by the State of New Jersey. Pension reforms enacted pursuant to Chapter 78, P.L. 2011 included provisions creating special Pension Plan Design Committees for TP AF and PERS, once a Target Funded Ratio (TFR) is met. The Pension Plan Design Committees will have the discretionary authority to modify certain plan design features, including member contribution rate; formula for calculation of fmal compensation of fmal salary; fraction used to calculate a retirement allowance; age at which a member may be eligible and the benefits for service or early retirement; and benefits provided for disability retirement. The committees will also have the authority to reactivate the cost of living adjustment (COLA) on pensions. However, modifications can only be made to the extent that the resulting impact does not cause the funded ratio to drop below the TFR in any one year of a 30-year projection period.
52

CLARK PUBLIC SCHOOL DISTRICT NOTES TO THE FINANCIAL STATEMENTS FOR THE FISCAL YEAR ENDED JUNE 30, 2019
NOTE 4 OTHER INFORMATION (Continued)
D. Employee Retirement Systems and Pension Plans (Continued)
Measurement Focus and Basis of Accounting
The fmancial statements of the retirement systems are prepared in accordance with U.S. generally accepted accounting principles as applicable to governmental organizations. In doing so, the Division adheres to reporting requirements established by the Governmental Accounting Standards Board (GASB).
The accrual basis of accounting is used for measuring fmancial position and changes in net position of the pension trust funds. Under this method, contributions are recorded in the accounting period in which they are legally due from the employer or plan member, and deductions are recorded at the time the liabilities are due and payable in accordance with the terms of each plan. The accounts of the Division are organized and operated on the basis of funds. All funds are accounted
' for using an economic resources measurement focus.
Investment Valuation
The Division ofinvestment, Department ofthe Treasury, State ofNew Jersey (Division of Investment) manages and invests certain assets of the retirement systems. Prudential retirement is the third-party administrator for the DCRP and provides record keeping, administrative services and investment options. Investment transactions are accounted for on a trade or investment date basis. Interest and dividend income is recorded on the accrual basis, with dividends accruing on the exdividend date. The net increase or decrease in the fair value of investments includes the net realized and unrealized gains or losses on investments.
The State ofNew Jersey, Department ofthe Treasury,!]Division of Investment issues publicly available fmancial reports that include the financial statements of the State ofNew Jersey Cash Management Fund. The fmancial reports may be obtained in writing to the State of New Jersey, Department of the Treasury, Division of Investment, P.O. Box 290, Trenton, New Jersey 08625-0290 or at www.state.nj.us/treasury/doinvest.
Collective Net Pension Liability
The collective net pension liability of the participating employers for local PERS at June 30, 2018 is $19.7 billion and the plan fiduciary net position as a percentage of the total pension liability is 53.60%. The collective net pension liability of the State funded TPAF at June 30, 2018 is $63.81 billion and the plan fiduciary net position as a percentage of total pension liability is 26.49%.
The total pension liabilities were determined based on actuarial valuations as of July 1, 2017 which were rolled forward to June 30, 2018.
Actuarial Methods and Assumptions
In the July 1, 2017 PERS and TPAF actuarial valuation, the actuarial assumptions and methods used in these valuations were described in the Actuarial Assumptions and Methods section of the Actuary's report and are included here in this note to the financial statements. The pension systems selected economic and demographic assumptions and prescribed them for use for purposes of compliance with GASB Statement No. 68. The Actuary provided guidance with respect to these assumptions, and it is their belief that the assumptions represent reasonable expectations of anticipated plan experience
53

CLARK PUBLIC SCHOOL DISTRICT NOTES TO THE FINANCIAL STATEMENTS FOR THE FISCAL YEAR ENDED JUNE 30, 2019
NOTE 4 OTHER INFORMATION (Continued)
D. Employee Retirement Systems and Pension Plans (Continued)
Employer and Employee Pension Contributions
The contribution policy is set by laws of the State of New Jersey and contributions are required by active members and participating employers. Plan members and employer contributions may be amended by State of New Jersey legislation with the amount of contributions by the State of New Jersey contingent upon the Annual Appropriations Act. As defined, the retirement systems require employee contributions based on 7.50% for PERS, 7.50% for TPAF and 5.50% for DCRP of the employee's annual compensation for fiscal year 2019.
PERS employers' and TPAF State's nonemployer contributions are based on actuarially determined amounts, which include the normal cost and unfunded accrued liability. For the fiscal year ended June 30, 2019 for TPAF, which is a cost sharing multiple employer defined benefit pension plan with a special funding situation, the State's annual pension contribution was less than this actuarial determined amount. For PERS, which is a cost sharing multiple employer defined benefit pension plan, the annual pension contributions were equal to the actuarial determined amounts. TP AF nonemployer contributions are made annually by the State ofNew Jersey to the pension system on behalf of the Board. PERS employer contributions are made annually by the Board to the pension system in accordance with Chapter 114, P.L. 1997. In the DCRP, which is a defined contribution plan, member contributions are matched by a 3% employer contribution. All PERS and DCRP contributions made by the Board for fiscal years 2019, 2018 and 2017 were equal to the required contributions.
During the fiscal years ended June 30, 2019, 2018 and 2017 the Board was required to contribute for PERS and DCRP and the State of New Jersey, as a nonemployer contributing entity, contributed for TPAF, respectively for normal cost pension and accrued liability contributions (including non-contributory group life insurance (NCGI)) the following amounts:
Fiscal Year Ended On-behalf
June 30, PERS TPAF DCRP
2019 $ 302,620 $ 2,909,712 $ 27,232 2018 281,659 2,162,354 21,020 2017 276,566 1,608,255 20,416
In addition for fiscal years 2019, 2018 and 2017 the District contributed $1,147, $3,295 and $1,691, respectively for PERS and the State contributed $2,574, $2,892 and $3,795, respectively for TPAF for Long Term Disability Insurance Premium (LTDI).
The PERS contributions are recognized in the governmental fund fmancial statements (modified accrual basis) as an expenditure. The on-behalf TP AF contributions are recognized in the governmental fund fmancial statements (modified accrual basis) as both a revenue and expenditure in accordance with GASB Statement No. 85, Omnibus 2017 (GASB No. 85). The DCRP contributions are recognized in the governmental fund financial statements (modified accrual basis) as an expenditure, as well as, the district-wide fmancial statements (accrual basis) as an expense.
Also, in accordance with N.J.S.A. 18A:66-66 the State of New Jersey reimbursed the Board $1,135,769 during the fiscal year ended June 30, 2019 for the employer's share of social security contributions for TPAF members as calculated on their base salaries. This amount has been recognized in the district-wide financial statements (accrual basis) and the governmental fund fmancial statements (modified accrual basis) as a revenue and expense/expenditure in accordance with GASB No. 85.
54

CLARK PUBLIC SCHOOL DISTRICT NOTES TO THE FINANCIAL STATEMENTS FOR THE FISCAL YEAR ENDED JUNE 30, 2019
NOTE 4 OTHER INFORMATION (Continued)
D. Employee Retirement Systems and Pension Plans (Continued)
Pension Liabilities, Pension Expense, and Deferred Outflows of Resources and Deferred Inflows of Resources Related to Pensions
Public Employees Retirement System (PERS)
GASB Statement No. 68, Accounting and Financial Reporting for Pensions, (GASB No. 68) requires participating employers in PERS to recognize their proportionate share of the collective net pension liability, collective deferred outflows of resources, collective deferred inflows of resources and collective pension expense. The employer allocation percentages presented are based on the ratio of the contributions as an individual employer to total contributions to the PERS during the measurement period July 1, 2017 through June 30, 2018. Employer allocation percentages have been rounded for presentation purposes.
Although the NJ Division of Pensions and Benefits ("Division") administers one cost-sharing multiple employer defmed benefit pension plan, separate (sub) actuarial valuations are prepared to determine the actuarial determined contribution rate by group. Following this method, the measurement of the collective net pension liability, deferred outflows of resources, deferred inflows of resources and pension expense are determined separately for each individual employer of the State and local groups of the plan.
To facilitate the separate (sub) actuarial valuations, the Division maintains separate accounts to identify additions, deductions, and fiduciary net position applicable to each group. The allocation percentages are presented for each group. The allocation percentages for each group as of June 30, 2018 are based on the ratio of each employer's contribution to total employer contributions of the group for the fiscal year ended June 30, 2018.
At June 30, 2019, the District reported in the statement of net position (accrual basis) a liability of $5,990,324 for its proportionate share of the PERS net pension liability. The net pension liability was measured as of June 30, 2018 and the total pension liability used to calculate the net pension liability was determined by an actuarial valuation as of that date. The District's proportionate share of the net pension liability was based on the District's share of contributions to the pension plan relative to the contributions of all participating governmental entities, actuarially determined. At June 30, 2018, the District's proportionate share was .03042 percent, which was an increase of .00002 percent from its proportionate share measured as of June 30, 2017 of .03040 percent.
55

CLARK PUBLIC SCHOOL DISTRICT NOTES TO THE FINANCIAL STATEMENTS FOR THE FISCAL YEAR ENDED JUNE 30, 2019
NOTE 4 OTHER INFORMATION (Continued)
D. Employee Retirement Systems and Pension Plans (Continued)
Pension Liabilities, Pension Expense, and Deferred Outflows of Resources and Deferred Inflows of Resources Related to Pensions (Continued)
Public Employees Retirement System (PERS) (Continued)
For the fiscal year ended June 30, 2019, the District recognized in the district-wide statement of activities (accrual basis) pension expense of $170,609 for PERS. The pension contribution made by the District during the current 2018/2019 fiscal year is the contribution that is applied to the net pension liability reported at the end of the current fiscal year of June 30, 2019 with a measurement date of the prior fiscal year end of June 30, 2018. Since the State of New Jersey applies the current year pension contribution towards the calculation of the net pension liability reported at the end of the current fiscal year, which has a measurement date of the preceding fiscal year end, there is no deferred outflows of resources reported as of June 30, 2019 for contributions made subsequent to the measurement date. At June 30, 2019, the District reported deferred outflows of resources and deferred inflows of resources related to PERS pension from the following sources:
Deferred Deferred Outflows Inflows
of Resources of Resources
Difference Between Expected and Actual Experience $ 114,236 $ 30,888
Changes of Assumptions 987,106 1,915,387 Net Difference Between Projected and Actual
Earnings on Pension Plan Investments 56,189 Changes in Proportion and Differences Between District Contributions and Proportionate Share of Contributions 6,395 366,410
Total $ 1,107,737 $ 2,368,874
At June 30, 2019, the amounts reported as deferred outflows of resources and deferred inflows of resources related toPERS pension will be recognized in pension expense as follows:
Year Ending June 30, Total
2020 $ (109,547) 2021 (176,985) 2022 (487,408) 2023 (373,946) 2024 (113,251)
$ (1,261,137)
56

CLARK PUBLIC SCHOOL DISTRICT NOTES TO THE FINANCIAL STATEMENTS FOR THE FISCAL YEAR ENDED JUNE 30, 2019
NOTE 4 OTHER INFORMATION (Continued)
D. Employee Retirement Systems and Pension Plans (Continued)
Pension Liabilities, Pension Expense, and Deferred Outflows of Resources and Deferred Inflows of Resources Related to Pensions (Continued)
Public Employees Retirement System (PERS) (Continued)
Actuarial Assumptions
The District's total pension liability for the June 30, 2018 measurement date was determined by an actuarial valuation as of July 1, 2017, which was rolled forward to June 30, 2018. This actuarial valuation used the following actuarial assumptions, applied to all periods in the measurement:
Inflation Rate
Salary Increases:
Through 2026
Thereafter
Investment Rate of Return
Mortality Rate Table
2.25%
1.65-4.15% Based on Age
2.65-5.15% Based on Age
7.00%
RP-2000
Assumptions for mortality improvements are based on Society of Actuaries Scale AA.
The actuarial assumptions used in the July 1, 2017 valuation were based on the results of an actuarial experience study for the period July 1, 2011 to June 30,2014.
57

CLARK PUBLIC SCHOOL DISTRICT NOTES TO THE FINANCIAL STATEMENTS FOR THE FISCAL YEAR ENDED JUNE 30, 2019
NOTE 4 OTHER INFORMATION (Continued)
D. Employee Retirement Systems and Pension Plans (Continued)
Pension Liabilities, Pension Expense, and Deferred Outflows of Resources and Deferred Inflows of Resources Related to Pensions (Continued)
Public Employees Retirement System (PERS) (Continued)
Long-Term Expected Rate of Return
In accordance with State statute, the long-term expected rate of return on plan investments (7% at June 30, 2018) is determined by the State Treasurer, after consultation with the Directors of the Division of Investment and Division of Pensions and Benefits, the board of trustees and actuaries. The long-term expected rate of return on pension plan investments was determined using a building-block method in which best-estimate ranges of expected future real rate of return (expected returns, net of pension plans investment expense and inflation) are developed for each major asset class. These ranges are combined to produce the long-term expected rate of return by weighting the expected future real rates of return by the target asset allocation percentage and by adding expected inflation. Best estimates of arithmetic real rates of return for each major asset class included in the pension plans' target asset allocation as of June 30, 2018 are summarized in the following table:
Asset Class
Risk Mitigation Strategies Cash Equivalents U.S. Treasuries Investment Grade Credit US Equities Non-US Developed Markets Equity
Emerging Market Equities High Yield Global Diversified Credit Credit Oriented Hedge Funds Debt Related Private Equity Debt Related Real Estate Private Real Estate Equity Related Real Estate BuyoutsN enture Capital
Discount Rate
Target Allocation
5.00% 5.50% 3.00% 10.00% 30.00% 11.50%
6.50% 2.50% 5.00% 1.00% 2.00% 1.00% 2.50% 6.25% 8.25%
Long-Term Expected Real Rate of Return
5.51% 1.00% 1.87% 3.78% 8.19% 9.00%
11.64% 6.82% 7.10% 6.60% 10.63% 6.61% 11.83% 9.23% 13.08%
The discount rate used to measure the total pension liabilities of the PERS plan was as follows: Fiscal Year Measurement Date Discount Rate
2019 June 30, 2018 5.66% 2018 June30,2017 5.00%
58

CLARK PUBLIC SCHOOL DISTRICT NOTES TO THE FINANCIAL STATEMENTS FOR THE FISCAL YEAR ENDED JUNE 30, 2019
NOTE 4 OTHER INFORMATION (Continued)
D. Employee Retirement Systems and Pension Plans (Continued)
Pension Liabilities, Pension Expense, and Deferred Outflows of Resources and Deferred Inflows of Resources Related to Pensions (Continued)
Public Employees Retirement System (PERS) (Continued)
Discount Rate (Continued)
The following table represents the crossover period, if applicable, for the PERS defined benefit plan:
Period of Projected Benefit Payments for which the Following Rates were Applied:
Long-Term Expected Rate of Return
Municipal Bond Rate *
Through June 30, 2046
From July 1, 2046 and Thereafter
*The municipal bond return rate used is 3.87% as of the measurement date of June 30, 2018. The source is the Bond Buyer Go 20-Bond Municipal Bond fudex, which includes tax-exempt general obligation municipal bonds with an average rating of AA/Aa or higher.
Sensitivity of Net Pension Liability
The following presents the District's proportionate share of the PERS net pension liability calculated using the discount rate of 5.66%, as well as what the District's proportionate share of the PERS net pension liability would be if it were calculated using a discount rate that is !-percentage-point lower (4.66 percent) or !-percentage-point higher (6.66 percent) than the current rate:
District's Proportionate Share of the PERS Net Pension Liability
1% Decrease
4.66%
$ 7,532,142
Current Discount Rate
5.66%
$ 5,990,324
1% Increase 6.66%
$ 4,696,837
The sensitivity analysis was based on the proportionate share of the District's net pension liability at June 30, 2018. A sensitivity analysis specific to the District's net pension liability at June 30, 2018 was not provided by the pension system.
Pension Plan Fiduciary Net Position
Detailed information about the PERS pension plan's fiduciary net position is available in the separately issued financial report from the State of New Jersey, Department of the Treasury, Division of Pension and Benefits. The financial report may be accessed via the New Jersey, Division of Pensions and Benefits, website at www.state.nj.us/treasury/pensions.
59

CLARK PUBLIC SCHOOL DISTRICT NOTES TO THE FINANCIAL STATEMENTS FOR THE FISCAL YEAR ENDED JUNE 30, 2019
NOTE 4 OTHER INFORMATION (Continued)
D. Employee Retirement Systems and Pension Plans (Continued)
Pension Liabilities, Pension Expense, and Deferred Outflows of Resources and Deferred Inflows of Resources Related to Pensions (Continued)
Teachers Pension and Annuity Fund (TP AF)
GASB No. 68, requires participating employers in TPAF to recognize their proportionate share of the collective net pension liability, collective deferred outflows of resources, collective deferred inflows of resources and collective pension expense. The non-employer allocation percentages presented are based on the ratio of the State's contributions made as an employee and non-employer adjusted for unpaid early retirement incentives to total contributions to TP AF during the fiscal year ended June 30, 2018. Non-employer allocation percentages have been rounded for presentation purposes.
The contribution policy for TP AF is set by N.J.S.A. 18A:66 and requires contributions by active members and non-employer contributions by the State. State legislation has modified the amount that is contributed by the State. The State's pension contribution is based on an actuarially determined amount which includes the employer portion of the normal cost and an amortization of the unfunded accrued liability. For the fiscal year ended June 30, 2018, the State's pension contribution was less than the actuarial determined amount.
In accordance with GASB No. 68, the District is not required to recognize a net pension liability for TPAF. The State of New Jersey, as a nonemployer contributing entity, is the only entity that has a legal obligation to make employer contributions to TP AF on behalf of the District. Accordingly, the District's proportionate share percentage determined under Statement No. 68 is zero percent and the State's proportionate share is 100% of the net pension liability attributable to the District for TPAF. Therefore, in addition, the District does not recognize any portion of the TPAF collective deferred outflows of resources and deferred inflows of resources.
For the fiscal year ended June 30, 2019, the District recognized in the district-wide statement of activities (accrual basis) pension expense of $5,316,628 for TP AF. This amount has been included in the district-wide statement of activities (accrual basis) as both a revenue and expense in accordance with GASB No. 85.
At June 30, 2019 the State's proportionate share of the net pension liability attributable to the District is $91,199,776. The nonemployer allocation percentages are based on the ratio of the State's contributions made as an employer and nonemployer adjusted for unpaid early retirement incentives to total contributions to TPAF during the year ended June 30, 2018. At June 30, 2018, the State's share of the net pension liability attributable to the District was .14336 percent, which was an increase of .00038 percent from its proportionate share measured as of June 30, 2017 of .14298 percent.
60
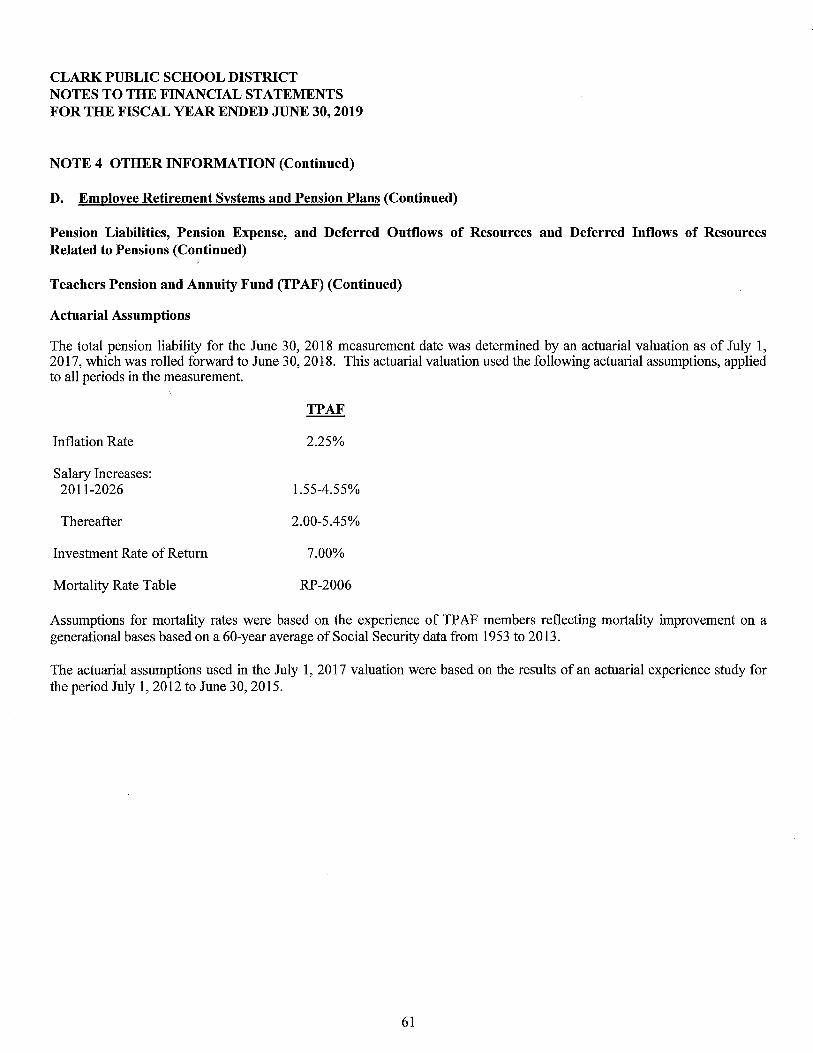
CLARK PUBLIC SCHOOL DISTRICT NOTES TO THE FINANCIAL STATEMENTS FOR THE FISCAL YEAR ENDED JUNE 30, 2019
NOTE 4 OTHER INFORMATION (Continued)
D. Employee Retirement Systems and Pension Plans (Continued)
Pension Liabilities, Pension Expense, and Deferred Outflows of Resources and Deferred Inflows of Resources Related to Pensions (Continued)
Teachers Pension and Annuity Fund (TP AF) (Continued)
Actuarial Assumptions
The total pension liability for the June 30, 2018 measurement date was determined by an actuarial valuation as of July 1, 2017, which was rolled forward to June 30, 2018. This actuarial valuation used the following actuarial assumptions, applied to all periods in the measurement.
Inflation Rate
Salary Increases: 2011-2026
Thereafter
Investment Rate of Return
Mortality Rate Table
2.25%
1.55-4.55%
2.00-5.45%
7.00%
RP-2006
Assumptions for mortality rates were based on the experience of TP AF members reflecting mortality improvement on a generational bases based on a 60-year average of Social Security data from 1953 to 2013.
The actuarial assumptions used in the July 1, 2017 valuation were based on the results of an actuarial experience study for the period July 1, 2012 to June 30, 2015.
61

CLARK PUBLIC SCHOOL DISTRICT NOTES TO THE FINANCIAL STATEMENTS FOR THE FISCAL YEAR ENDED JUNE 30, 2019
NOTE 4 OTHER INFORMATION (Continued)
D. Employee Retirement Systems and Pension Plans (Continued)
Pension Liabilities, Pension Expense, and Deferred Outflows of Resources and Deferred Inflows of Resources Related to Pensions (Continued)
Teachers Pension and Annuity Fund (TP AF) (Continued)
Long-Term Expected Rate of Return
In accordance with State statute, the long-term expected rate of return on plan investments (7% at June 30, 2018) is determined by the State Treasurer, after consultation with the Directors of the Division of Investment and Division of Pensions and Benefits, the board of trustees and actuaries. The long-term expected rate of return on pension plan investments was determined using a building-block method in which best-estimate ranges of expected future real rate of return (expected returns, net of pension plans investment expense and inflation) are developed for each major asset class. These ranges are combined to produce the long-term expected rate of return by weighting the expected future real rates of return by the target asset allocation percentage and by adding expected inflation. Best estimates of arithmetic real rates of return for each major asset class included in the pension plans' target asset allocation as of June 30, 2018 are summarized in the following table:
Long-Term
Target Expected Real
Asset Class Allocation Rate of Return
Risk Mitigation Strategies 5.00% 5.51% Cash Equivalents 5.50% 1.00% U.S. Treasuries 3.00% 1.87% Investment Grade Credit 10.00% 3.78% High Yield 2.50% 6.82% Global Diversified Credit 5.00% 7.10% Credit Oriented Hedge Funds 1.00% 6.60% Debt Related Private Equity 2.00% 10.63% Debt Related Real Estate 1.00% 6.61% Private Real Estate 2.50% 11.83% Equity Related Real Estate 6.25% 9.23% U.S.Equity 30.00% 8.19% Non-U.S. Developed Markets Equity 11.50% 9.00% Emerging Markets Equity 6.50% 11.64% BuyoutsN enture Capital 8.25% 13.08%
62

CLARK PUBLIC SCHOOL DISTRICT NOTES TO THE FINANCIAL STATEMENTS FOR THE FISCAL YEAR ENDED JUNE 30, 2019
NOTE 4 OTHER INFORMATION (Continued)
D. Employee Retirement Systems and Pension Plans (Continued)
Pension Liabilities, Pension Expense, and Deferred Outflows of Resources and Deferred Inflows of Resources Related to Pensions (Continued)
Teachers Pension and Annuity Fund (TPAF) (Continued)
Discount Rate
The discount rate used to measure the total pension liabilities of the TP AF plan was as follows:
Fiscal Year Measurement Date Discount Rate
2019 June 30,2018 4.86% 2018 June 30, 2017 4.25%
The following table represents the crossover period, if applicable, for the TP AF defmed benefit plan:
Period of Projected Benefit Payments for which the Following Rates were Applied:
Long-Term Expected Rate of Return
Municipal Bond Rate *
Through June 30, 2040
From July 1, 2040 and Thereafter
*The municipal bond return rate used is 3.87% as of the measurement date of June 30, 2018. The source is the Bond Buyer Go 20-Bond Municipal Bond Index, which includes tax-exempt general obligation municipal bonds with an average rating of AA/Aa or higher.
Sensitivity of Net Pension Liability
The following presents the State's proportionate share of the TPAF net pension liability attributable to the District calculated using the discount rate of 4.86%, as well as what the State's proportionate share of the TPAF net pension liability attributable to the District that would be if it were calculated using a discount rate that is !-percentage-point lower (3.86 percent) or !-percentage-point higher (5.86 percent) than the current rate:
1% Current 1% Decrease Discount Rate Increase (3.86%) (4.86%} (5.86%}
State's Proportionate Share of the TP AF Net Pension Liability Attributable to the District $ 107,796,403 $ 91,199,776 $ 77,441,576
The sensitivity analysis was based on the State's proportionate share of the net pension liability attributable to the District at June 30, 2018. A sensitivity analysis specific to the State's proportionate share of the net pension liability attributable to the District at June 3 0, 2018 was not provided by the pension system.
63

CLARK PUBLIC SCHOOL DISTRICT NOTES TO THE FINANCIAL STATEMENTS FOR THE FISCAL YEAR ENDED JUNE 30, 2019
NOTE 4 OTHER INFORMATION (Continued)
D. Employee Retirement Systems and Pension Plans (Continued)
Pension Liabilities, Pension Expense, and Deferred Outflows of Resources and Deferred Inflows of Resources Related to Pensions (Continued)
Teachers Pension and Annuity Fund (TP AF) (Continued)
Pension Plan Fiduciary Net Position
Detailed information about the TPAF pension plan's fiduciary net position is available in the separately issued fmancial report from the State of New Jersey, Department of the Treasury, Division of Pension and Benefits. The fmancial report may be accessed via the New Jersey, Division of Pensions and Benefits, website at www.state.nj.us/treasury/pensions.
E. Post-Retirement Medical Benefits
The State ofNew Jersey sponsors and administers the post-retirement health benefit program plan for school districts.
As a result of implementing GASB Statement No. 74, Financial Reporting for Postemployment Benefit Plans Other than Pension Plans, the post-retirement health benefit program plan is reported in an Agency Fund in the New Jersey Comprehensive Annual Financial Report for the fiscal year ended June 30, 2018. Therefore, the plan has no assets accumulated in a trust. In accordance with GASB Statement No. 75, Accounting and Financial Reporting for Postemployment Benefits Other than Pension (GASB No. 75), the plan is classified as a single employer defined benefit OPEB plan with a special funding situation that is not administered through a trust that meets the criteria in paragraph 4 of GASBNo. 75.
Plan Description and Benefits Provided
The State of New Jersey sponsors and administers the following post-retirement health benefit program plan covering certain local school district employees, including those Board employees and retirees eligible for coverage.
State Health Benefit Program Fund - Local Education Retired Employees Plan (including Prescription Drug Program Fund)- N.J.S.A. 52:14-17.32fprovides medical coverage, prescription drug benefits and Medicare Part B reimbursement to qualified retired education employees and their covered dependents. The State of New Jersey provides employer-paid coverage to members of the TP AF who retire from a board of education or county college with 25 years of service or on a disability retirement. Under the provisions of Chapter 126, P.L. 1992, the State also provides employer-paid coverage to members of the PERS and Alternate Benefits Program (ABP) who retire from a board of education or county college with 25 years of service or on a disability retirement if the member's employer does not provide this coverage. Certain local participating employers also provide post-retirement medical coverage to their employees. Retirees who are not eligible for employer paid health coverage at retirement can continue in the program if their employer participates in this program or if they are participating in the health benefits plan of their former employer and are enrolled in Medicare Parts A and B by paying the cost of the insurance for themselves and their covered dependents.
Pursuant to Chapter 78, P .L. 2011, future retirees eligible for postretirement medical coverage who have less than 20 years of creditable service on June 28, 2011 will be required to pay a percentage of the cost of their health care coverage in retirement provided they retire with 25 or more years of pension service credit. The percentage of the premium for which the retiree will be responsible will be determined based on the retiree's annual retirement benefit and level of coverage.
64
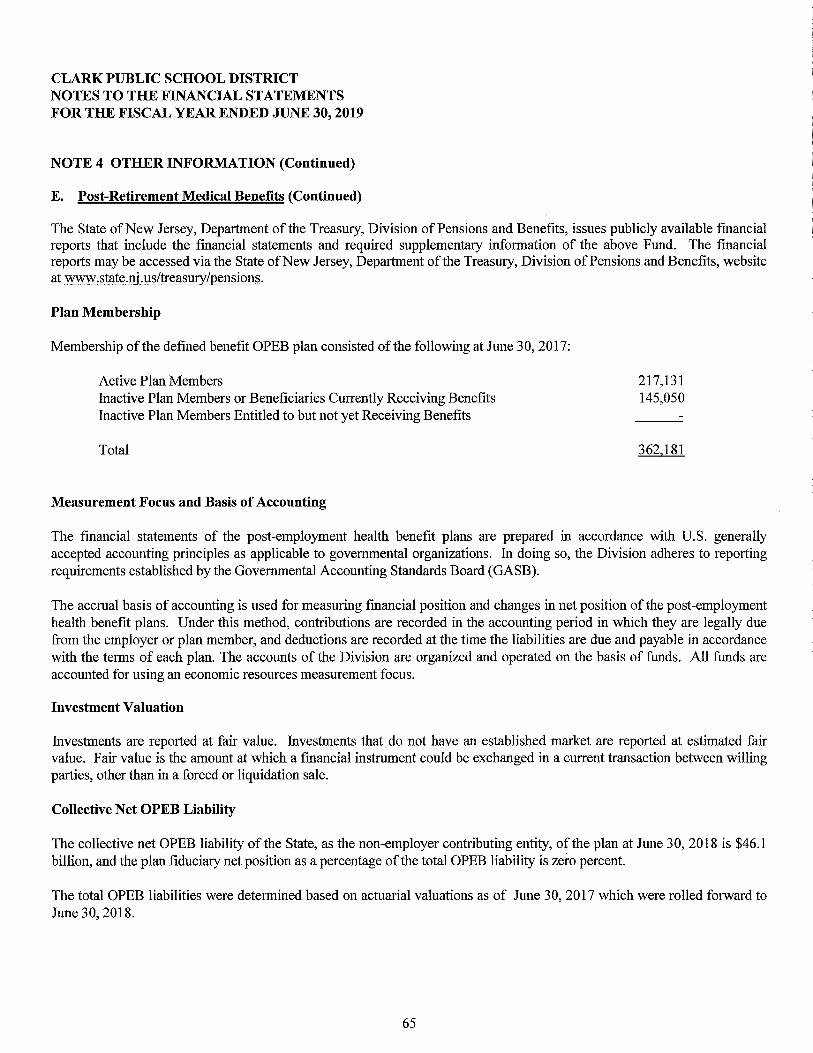
CLARK PUBLIC SCHOOL DISTRICT NOTES TO THE FINANCIAL STATEMENTS FOR THE FISCAL YEAR ENDED JUNE 30, 2019
NOTE 4 OTHER INFORMATION (Continued)
E. Post-Retirement Medical Benefits (Continued)
The State ofNew Jersey, Department of the Treasury, Division ofPensions and Benefits, issues publicly available fmancial reports that include the fmancial statements and required supplementary information of the above Fund. The fmancial reports may be accessed via the State ofNew Jersey, Department of the Treasury, Division of Pensions and Benefits, website at www.state.nj. us/treasury/pensions.
Plan Membership
Membership of the defined benefit OPEB plan consisted of the following at June 30, 2017:
Active Plan Members Inactive Plan Members or Beneficiaries Currently Receiving Benefits Inactive Plan Members Entitled to but not yet Receiving Benefits
Total
Measurement Focus and Basis of Accounting
217,131 145,050
362.181
The financial statements of the post-employment health benefit plans are prepared in accordance with U.S. generally accepted accounting principles as applicable to governmental organizations. In doing so, the Division adheres to reporting requirements established by the Governmental Accounting Standards Board (GASB).
The accrual basis of accounting is used for measuring fmancial position and changes in net position of the post-employment health benefit plans. Under this method, contributions are recorded in the accounting period in which they are legally due from the employer or plan member, and deductions are recorded at the time the liabilities are due and payable in accordance with the terms of each plan. The accounts of the Division are organized and operated on the basis of funds. All funds are accounted for using an economic resources measurement focus.
Investment Valuation
Investments are reported at fair value. Investments that do not have an established market are reported at estimated fair value. Fair value is the amount at which a financial instrument could be exchanged in a current transaction between willing parties, other than in a forced or liquidation sale.
Collective Net OPEB Liability
The collective net OPEB liability of the State, as the non-employer contributing entity, of the plan at June 30, 2018 is $46.1 billion, and the plan fiduciary net position as a percentage of the total OPEB liability is zero percent.
The total OPEB liabilities were determined based on actuarial valuations as of June 30, 2017 which were rolled forward to June 30,2018.
65

CLARK PUBLIC SCHOOL DISTRICT NOTES TO THE FINANCIAL STATEMENTS FOR THE FISCAL YEAR ENDED JUNE 30, 2019
NOTE 4 OTHER INFORMATION (Continued)
E. Post.:..Retirement Medical Benefits (Continued)
Actuarial Methods and Assumptions
In the June 30, 2017 OPEB actuarial valuation, the actuarial assumptions and methods used in these valuations were described in the Actuarial Assumptions and Methods section of the Actuary's report and are included here in this note to the financial statements. The Plan selected economic and demographic assumptions and prescribed them for use for purposes of compliance with GASB Statement No. 75. The Actuary provided guidance with respect to these assumptions, and it is their belief that the assumptions represent reasonable expectations of anticipated plan experience.
Post-Retirement Medical Benefits Contributions
The funding policy of the OPEB plan is pay as you go basis; therefore, there is no prefunding of the liability. Contributions to pay for the health benefit premiums of participating employees in the OPEB plan are made by the State, as a nonemployer contributing entity, under a special funding situation in accordance with State statutes as previously disclosed. The State as a non-employer contributing entity made contributions of $1.23 billion to the OPEB plan in fiscal year 2018.
The State sets the contribution rate based on a pay as you go basis rather than the actuarial determined contribution, an amount actuarially determined in accordance with the parameters of GASB Statement 75. The actuarial determined contribution represents a level of funding that, if paid on an ongoing basis, is projected to cover normal cost each year and any unfunded actuarial liabilities (or funding excess) of the plan using a systematic and rational method over a closed period equal to the average of the expected remaining service lives of all employees that are provided with OPEB through the Plan. The State's contributions, as a nonemployer contributing entity, to the State Health Benefits Program Fund - Local
Education Retired Employees Plan for retirees' post-retirement benefits on behalf of the School District for the fiscal years ended June 30, 2019, 2018 and 2017 were $1,319,841, $1,396,618 and $1,340,043, respectively, which equaled the required contributions for each year. The State's contributions to the State Health Benefits Program Fund- Local Education Retired Employees Plan for PERS retirees' post-retirement benefits on behalf of the School District was not determined or made available by the State of New Jersey. The on-behalf OPEB contributions are recognized in the governmental fund financial statements (modified accrual basis) as both a revenue and expenditure in accordance with GASB No. 85.
OPEB Liabilities, OPEB Expenses and Deferred Outflows of Resources and Deferred Inflows of Resources Related toOPEB
GASB Statement No. 75 requires participating employers in the State Health Benefit Program Fund- Local Education Retired Employees Plan to recognize their proportionate share of the collective OPEB liability, collective deferred outflows of resources, collective deferred inflows of resources and collective OPEB expense. The nonemployer allocation percentages presented are based on the ratio of the State's contributions made as a nonemployer toward the actuarially determined contribution amount to total contributions to the plan during the measurement period July 1, 2017 through June 30, 2018. Nonemployer allocation percentages have been rounded for presentation purposes.
In accordance with GASB No. 75, the District is not required to recognize an OPEB liability for the post-employment health benefit plan. The State of New Jersey, as a nonemployer contributing entity, is the only entity that has a legal obligation to make employer contributions to the plan on behalf of the District. Accordingly, the District's proportionate share percentage determined under Statement No. 75 is zero percent and the State's proportionate share is 100% of the OPEB liability attributable to the District. Therefore, in addition, the District does not recognize any portion of the collective deferred outflows of resources and deferred inflows of resources related to the plan.
66

CLARK PUBLIC SCHOOL DISTRICT NOTES TO THE FINANCIAL STATEMENTS FOR THE FISCAL YEAR ENDED JUNE 30, 2019
NOTE 4 OTHER INFORMATION (Continued)
E. Post-Retirement Medical Benefits (Continued)
OPEB Liabilities, OPEB Expenses and Deferred Outflows of Resources and Deferred Inflows of Resources Related to OPEB (Continued)
For the fiscal year ended June 30, 2019, the District recognized in the district-wide statement of activities (accrual basis) OPEB expense of $2,529,338. This amount has been included in the district-wide statement of activities (accrual basis) as a revenue and expense in accordance with GASB No. 85.
At June 30, 2019 the State's proportionate share of the OPEB liability attributable to the District is $62,919,054. The nonemployer allocation percentages are based on the ratio of the State's proportionate share of the OPEB liability attributable to the District at June 30, 2018 to the total OPEB liability of the State Health Benefit Program Fund- Local Education Retired Employees Plan at June 30, 2018. At June 30, 2018, the state's share of the OPEB liability attributable to the District was .13645 percent, which was a decrease of .00200 percent from its proportionate share measured as of June 30, 2017 of.13845 percent.
Actuarial Assumptions
The OPEB liability for the June 30, 2018 measurement date was determined by an actuarial valuation as of June 30, 2017, which was rolled forward to June 30, 2018. This actuarial valuation used the following actuarial assumptions, applied to all periods in the measurement.
Inflation Rate 2.50%
Salary Increases * Initial Fiscal Year Applied Through Rate
2026 1.55% to 4.55% 2.00% to 5.45% Rate Thereafter
Mortality Preretirement mortality rates were based on the RP-2006 Headcount-Weighted Healthy Employee Male/Female mortality table with fully generational mortality improvement projections from the central year using the MP-2017 scale. Postretirement mortality rates were based on the RP-2006 Headcount-Weighted Healthy Annuitant Male/Female mortality table with fully generational improvement projections from the central year using the MP-20 17 scale. Disability mortality was based on the RP-2006 Headcount-Weighted Disable Male/Female mortality table with fully generational improvement projections from the central year using the MP-2017 scale.
Long-Term Rate of Return 1.00%
*Salary increases are based on the defmed benefit plan that the individual is enrolled in and his or her year of service for TP AF or his or her age for PERS.
The actuarial assumptions used in the June 30, 2017 valuation were based on the results ofthe TPAF and PERS actuarial experience studies for the period July 1, 2012 to June 30, 2015 and July 1, 2011 to June 30, 2014, respectively.
Healthcare cost trend rates for pre-Medicare Preferred Provider Organization (PPO) medical benefits, this amount initially is 5.8 percent and decreases to a 5.0 percent long-term trend rate after eight years. For self-insured post-65 PPO medical benefits, the trend rate is 4.5 percent. For health maintenance organization (HMO) medical benefits, the trend rate is initially 5.8 percent and decreases to a 5.0 percent long-term trend rate after eight years. For prescription drug benefits, the initial trend rate is 8.0 percent and decreases to a 5.0 percent long-term trend rate after seven years. For the Medicare Part B reimbursement, the trend rate is 5.0 percent. This reflects the known underlying cost of the Part B premium. The Medicare Advantage trend rate is 4.5 percent and will continue in all future years.
67

CLARK PUBLIC SCHOOL DISTRICT NOTES TO THE FINANCIAL STATEMENTS FOR THE FISCAL YEAR ENDED JUNE 30, 2019
NOTE 4 OTHER INFORMATION (Continued)
E. Post-Retirement Medical Benefits (Continued)
OPEB Liabilities, OPEB Expenses and Deferred Outflows of Resources and Deferred Inflows of Resources Related to OPEB (Continued)
Long-Term Expected Rate of Return
As the OPEB plan only invests in the State ofNew Jersey Cash Management Fund, the long-term expected rate of return on OPEB investments was based off the best-estimate ranges of future real rates of return (expected returns, net of OPEB plan investment expense and inflation) for cash equivalents, which is 1.00% as of June 30, 2018.
Discount Rate
The discount rate used to measure the total OPEB liabilities of the plan was as follows:
Fiscal Year
2019 2018
Measurement Date
June 30,2018 June 30,2017
Discount Rate
3.87% 3.58%
The discount rate represents the municipal bond return rate as chosen by the Division. The source is the Bond Buyer Go 20-Bond Municipal Bond Index, which includes tax-exempt general obligation municipal bonds with an average rating of AA/Aa or higher. As the long-term rate of return is less than the municipal bond rate, it is not considered in the calculation of the discount rate, rather the discount rate is set at the municipal bond rate.
Changes in the Total OPEB Liability
The change in the State's proportionate share of the OPEB liability attributable to the District for the fiscal year ended June 30, 2019 (measurement date June 30, 2018) is as follows:
Balance, June 30,2017 Measurement Date
Changes Recognized for the Fiscal Year: Service Cost Interest on the Total OPEB Liability Differences Between Expected and Actual Experience Changes of Assumptions Gross Benefit Payments Contributions from the Member
Net Changes
Balance, June 30,2018 Measurement Date
68
Total OPEB Liability
(State Share 100%)
$ 74,266,642
$
$
2,485,362 2,718,903
(7,707,292) (7,220,276) (1,682,433)
58,148 (11,347,588)
62,919,054

CLARK PUBLIC SCHOOL DISTRICT NOTES TO THE FINANCIAL STATEMENTS FOR THE FISCAL YEAR ENDED JUNE 30, 2019
NOTE 4 OTHER INFORMATION (Continued)
E. Post-Retirement Medical Benefits (Continued)
OPEB Liabilities, OPEB Expenses and Deferred Outflows of Resources and Deferred Inflows of Resources Related to OPEB (Continued)
Changes in the Total OPEB Liability (Continued)
Changes of assumptions and other inputs reflect a change in the discount rate from 3.58 percent in 2017 to 3.87 percent in 2018.
The change in the total OPEB liability was based on the State's proportionate share of the OPEB liability attributable to the District at June 30, 2018. A change in the total OPEB liability specific to the State's proportionate share of the OPEB liability attributable to the District for the fiscal year ended June 30, 2018 was not provided by the pension system.
Sensitivity of OPEB Liability
Sensitivity of the total OPEB liability to changes in the discount rate. The following presents the State's proportionate share of the OPEB liability attributable to the District calculated using the discount rate of 3.87%, as well as what the State's proportionate share of the OPEB liability attributable to the District that would be if it were calculated using a discount rate that is !-percentage-point lower (2.87 percent) or !-percentage-point higher ( 4.87 percent) than the current rate:
1% Current 1% Decrease Discount Rate Increase (2.87%) (3.87%} (4.87%}
State's Proportionate Share of the OPEB Liability Attributable to the District $ 74,383,130 $ 62,919,054 $ 53,806,297
Sensitivity of the total OPEB liability to changes in the healthcare cost trend rates. The following presents the State's proportionate share of the OPEB liability attributable to the District calculated using health care cost trend rates that are !percentage-point lower or !-percentage-point higher than the current healthcare cost trend rates:
Total OPEB Liability (School Retirees) $
1% Decrease
52,006,263 $
Health care Cost Trend
Rates
62,919,054 $
1% Increase
77,351,638
The sensitivity analyses were based on the State's proportionate share of the OPEB liability attributable to the District at June 30, 2018. Sensitivity analyses specific to the State's proportionate share of the OPEB liability attributable to the District at June 30, 2018 were not provided by the pension system.
69

CLARK PUBLIC SCHOOL DISTRICT NOTES TO THE FINANCIAL STATEMENTS FOR THE FISCAL YEAR ENDED JUNE 30, 2019
NOTE 4 OTHER INFORMATION (Continued)
F. Tax Abatements
As defined by the Governmental Accounting Standards Board (GASB), a tax abatement is an agreement between a government and an individual or entity in which the government promises to forgo tax revenues and the individual or entity promises to subsequently take a specific action that contributes to economic development or otherwise benefits the government or its citizens. School districts are not authorized by New Jersey statute to enter into tax abatement agreements. However, the county or municipality in which the school district is situated may have entered into tax abatement agreements, and that potential school tax revenue must be disclosed in these financial statements. If the county or municipality entered into tax abatement agreements, those agreements will not directly affect the school district's local tax revenue because N.J.S.A. 54:4-75 and N.J.S.A. 54:4-76 require that amounts so forgiven must effectively be recouped from other taxpayers and remitted to the school district.
For Clark Public School District, the District's share of abated taxes resulting from the municipality having entered into a tax abatement agreement is indeterminate.
70

REQUIRED SUPPLEMENTARY INFORMATION- PART II
BUDGET COMPARISON SCHEDULES

CLARK PUBLIC SCHOOL DISTRICT EXHffiiT C-1
GENERAL FUND
BUDGETARY COMPARISON SCHEDULE FOR THE FISCAL YEAR ENDED JUNE 30, 2019
Variance
Original Final Final To Budget Adjustments Budget Actual Actual
REVENUES
Local Sources
Property Tax Levy $ 31,694,372 $ 31,694,372 $ 31,694,372
Tuition- Other LEA's Within State 1,441,780 1,441,780 1,541,710 $ 99,930
Interest 2,500 2,500 77,327 74,827
Rents 31,345 31,345 35,792 4,447 Miscellaneous Revenues 25,000 25,000 73,182 48,182
Total Local Sources 33,194,997 33, 194,997_ 33,422,383 227,386
State Sources
Special Education Aid 976,707 976,707 976,707
Security Aid 55,181 55,181 55,181
Transportation Aid 256,592 256,592 256,592
Extraordinary Aid 50,000 50,000 214,175 164,175
Additional Nonpublic Transportation Aid 24,940 24,940
TP AF Pension Benefit Contribution -(Non-Budget) 2,850,053 2,850,053
TP AF Pension- NCGI Premium (Non-Budget) 59,659 59,659
TP AF Long-Term Disability Insurance 2,574 2,574
TP AF Post Retirement Medical Contribution (Non-Budget) 1,319,841 1,319,841
TP AF Social Security Contributions (Non-Budget) 1,135,769 1,135,769
Total State Sources 1,338,480 1,338,480 6,895,491 5,557,011
Federal Sources
Medicaid Reimbursement 20,129 20,129 15,510 (4,619)
Total Federal Sources 20,129 20,129 15,510 (4,619)
Total Revenues 34,553,606 34,553,606 40,333,384 5,779,778
EXPENDITURES
CURRENT
Instruction- Regular Programs
Salaries of Teachers
Preschool 192,426 $ (40,711) 151,715 148,890 2,825 Kindergarten 371,831 (34,774) 337,057 337,057 Grades 1-5 3,606,592 48,733 3,655,325 3,655,325 Grades 6-8 2,286,619 (10,761) 2,275,858 2,273,633 2,225 Grades 9-12 4,407,805 (160,398) 4,247,407 4,244,734 2,673
Regular Programs - Home Instruction
Salaries of Teachers 30,000 (25,327) 4,673 4,673 Purchased Professional/Educational Services 12,905 12,905 12,905
Regular Programs - Undistributed Instruction
Other Salaries for Instruction 225,291 (38,045) 187,246 187,246 Purchased Professional/Educational Services 345,540 l 345,541 344,968 573 Other Purchased Services 17,500 430 17,930 17,930 General Supplies 293,800 (1,502) 292,298 243,208 49,090 Textbooks 31,540 9,975 41,515 31,745 9,770 Other Objects 59,940 59,940 49,539 10,401
Total Regular Programs 11,868,884 (239,474) 11,629,410 11,551,853 77,557
71 (Continued)

CLARK PUBLIC SCHOOL DISTRICT EXHlliiT C-1
GENERAL FUND
BUDGETARY COMPARISON SCHEDULE FOR THE FISCAL YEAR ENDED JUNE 30, 2019
Variance
Original Final Final To Budget Adjustments Budget Actual Actual
EXPENDITURES CURRENT (Continued)
Learning and/or Language Disabilities
Salaries of Teachers $ 162,215 $ 59,215 $ 221,430 $ 221,236 $ 194
Other Salaries for Instruction 111,254 (28,960) 82,294 82,294
Purchased Professional/Educational Services 700 700 700
General Supplies 2,805 1,385 4,190 4,190
Other Objects 16,830 11,496 28,326 11,779 16,547
Total Learning and/or Language Disabilities 293,804 43,136 336,940 320,199 16,741
Multiple Disabilities
Salaries of Teachers 166,970 (112,067) 54,903 53,989 914
Other Salaries for Instruction 6,173 6,173 6,173
General Supplies 23,315 (3,642) 19,673 5,478 14,195
Total Multiple Disabilities 190,285 (109,536) 80,749 65,640 15,109
Behavioral Disabilities
Salaries of Teachers 56,490 56,490 48,271 8,219
Other Salaries for Instruction 15,752 15,752 14,470 1,282
General Supplies 23,000 23,000 13,351 9,649
Total Behavioral Disabilities 95,242 95,242 76,092 19,150
Resource Room/Resource Center
Salaries of Teachers 1,852,212 (363,873) 1,488,339 1,411,793 76,546
Other Salaries for Instruction 350,872 314,009 664,881 636,247 28,634
Purchased Professional/Educational Services 2,200 2,200 2,200
General Supplies 3,570 3,570 3,144 426
Textbooks 5,100 5 100 4,631 469
Total Resource Room/Resource Center 2,213,954 (49,864) 2,164,090 2,058,015 106,075
Preschool Disabilities- Part-Time
Salaries of Teachers 113,663 44,955 158,618 146,391 12,227
Other Salaries for Instruction 1,500 1,500 1,500 General Supplies 1,100 1,100 1,100
Total Preschool Disabilities- Part-Time 114,763 46,455 161,218 148,991 12,227
Total Special Education 2,908,048 (69,809) 2,838,239 2,668,937 169,302
Basic Skills/Remedial Salaries of Teachers 364,597 (809) 363,788 352,822 10,966
Total Basic Skills/Remedial 364,597 (809) 363,788 352,822 10,966
Bilingual Education Salaries of Teachers 57,040 3,661 60,701 60,701
Total Bilingual Education 57,040 3,661 60,701 60,701
School Sponsored Co-Curricular Activities
Salaries 176,296 (16,042) 160,254 159,806 448
Supplies & Materials 73,593 1,674 75,267 49,545 25,722 Other Objects 45,419 (15,001) 30,418 12,269 18,149
Total School Sponsored Co-Curricular Activities 295,308 {29,369) 265,939 221,620 44,319
72 (Continued)

CLARK PUBLIC SCHOOL DISTRICT EXHIDIT C-1
GENERAL FUND
BUDGETARY COMPARISON SCHEDULE FOR THE FISCAL YEAR ENDED JUNE 30, 2019
Variance
Original Final Final To Budget Adjustments Budget Actual Actual
EXPENDITURES CURRENT (Continued)
School Sponsored Athletics
Salaries $ 217,830 $ 82,670 $ 300,500 $ 300,500
Purchased Services 100,827 (71,402) 29,425 29,425
Supplies and Materials 48,195 7,153 55,348 55,348 Other Objects 52,377 (3,447) 48,930 46,057 $ 2,873
Total School Sponsored Athletics 419,229 14,974 434,203 431,330 2,873
Total Instruction 15,913,106 (320,826) 15,592,280 15,287,263 305,017
Undistributed Expenditures
Instruction
Tuition to Other LEAs w/i State- Special 807,465 7,483 814,948 626,262 188,686
Tuition to County Voc. School Dist.-Regular 556,000 38,000 594,000 590,250 3,750
Tuition to County Voc. School Dist.- Special 28,000 4,000 32,000 32,000
Tuition to Priv. Sch. For the Disabled-
Within State 1,402,600 (194,831) 1,207,769 820,179 387,590 Tuition Other 47,830 47,830 47,830
Total Undistributed Expenditures- Instruction 2,794,065 (97,518) 2,696,547 2,116,521 580,026
Attendance and Social Work Salaries 54,558 54,558 37,888 16,670
Total Attendance and Social Work 54,558 54,558 37,888 16,670
Health Services
Salaries 417,883 4,447 422,330 352,458 69,872
Purchased Professional and Technical Services 31,110 {8,769) 22,341 22,341
Supplies and Materials 6,426 2,694 9,120 8,978 142 Other Objects 510 1,063 1,573 1,573
Total Health Services 455,929 (565) 455,364 385,350 70,014
Other Support Serv. Students- Speech, OT, PT &Related Serv.
Salaries 296,417 (275) 296,142 295,302 840 Purchased Professional/Educational Services 137,700 {3,669) 134,031 108,248 25,783 Supplies and Materials 5,799 5,799 2,013 3,786
Total Other Supp.Serv. Student- Speech, OT, PT, & Related Serv. Speech, OT, PT, & Related Serv. 439,916 {3,944) 435,972 405,563 30,409
Other Support Services- Students- Extra Serv. Salaries 244,001 {105,439) 138,562 107,631 30,931
Total Other Supp.Serv. Student- Extra Serv. 244,001 {105,439) 138,562 107,631 30,931
Other Support Services- Students- Guidance
Salaries of Other Professional Staff 641,032 641,032 590,670 50,362 Salaries of Secretarial & Clerical Assistants 118,256 118,256 101,105 17,151 Other Purchased Services 69,539 25,387 94,926 94,926 Supplies and Materials 5,100 5,100 3,913 1,187
Total Other Support Services- Students- Guidance 833,927 25,387 859,314 790,614 68,700
73 (Continued)

CLARK PUBLIC SCHOOL DISTRICT EXHffilT C-1
GENERAL FUND
BUDGETARY COMPARISON SCHEDULE
FOR THE FISCAL YEAR ENDED JUNE 30, 2019 Variance
Original Final Final To Budget Adjustments Budget Actual Actual
EXPENDITURES CURRENT (Continued)
Other Support Services- Students- Child Study Team
Salaries of Other Professional Staff $ 859,592 $ 859,592 $ 813,064 $ 46,528
Salaries of Secretarial & Clerical Assistants 126,140 126,140 123,512 2,628
Other Salaries 60,000 $ 1,443 61,443 61,443
Purchased Professional-Educational Services 45,158 (1,023) 44,135 44,135
Other Purchased Services 1,374 1,374 1,224 150
Supplies and Materials 7,140 7,140 7,140
Total Other Support Services- Students-
Child Study Team 1,099,404 420 1,099,824 1,050,518 49,306
Improvement oflnstructional Services
Salaries of Supervisors oflnstruction 134,675 134,675 88,777 45,898
Salaries of Other Professional Staff 30,000 (4,822) 25,178 23,950 1,228
Other Purchased Services 72,000 72,000 47,866 24,134
Supplies and Materials 1,020 1,020 395 625 Other Objects 10,200 10,200 7,428 2,772
Total Improvement oflnstructional Services 247,895 (4,822) 243,073 168,416 74,657
Educational Media/School Library
Salaries 57,040 1,275 58,315 58,315
Other Purchased Services Supplies and Materials 36,516 (333) 36,183 34,968 1,215
Total Educational Media/School Library 93,556 942 94,498 93,283 1,215
Instructional Staff Training Services
Purchased Professional-Educational Services 14,794 7,536 22,330 22,330 Other Objects 16,830 535 17,365 17,365
Total Instructional Staff Training Services 31,624 8,071 39,695 39,695
Support Services General Administration
Salaries 253,772 (12,394) 241,378 236,200 5,178 Legal Services 50,000 44,439 94,439 87,065 7,374 Audit Fees 39,900 39,900 38,115 1,785 Architectural/Engineering Services 5,000 (4,740) 260 260
Miscellaneous Purchased Services 76,812 76,812 67,301 9,511 Communications/Telephone 179,100 (2,305) 176,795 141,516 35,279 General Supplies 10,000 10,000 6,525 3,475 Miscellaneous Expenditures 18,400 18,400 7,784 10,616 BOE Membership Dues and Fees 40,415 40,415 39,549 866
Total Support Services General Administration 673,399 25,000 698,399 624,055 74,344
Support Services School Administration
Salaries of Principals/ Asst. Principals/Prog Director 841,199 (90) 841,109 837,942 3,167 Salaries of Other Professional Staff 115,933 449,583 565,516 490,165 75,351 Salaries of Secretarial and Clerical Assistants 319,166 26,885 346,051 344,899 1,152 Purchased Profesional and Technical Services 500 (90) 410 410 Supplies and Materials 4,080 180 4,260 3,428 832 Other Objects 8,451 8,451 1,966 6,485
Total Support Services School Administration 1,289,329 476,468 1,765,797 1,678,400 87,397
74 (Continued)

CLARK PUBLIC SCHOOL DISTRICT EXHffiiT C-1
GENERAL FUND
BUDGETARY COMPARISON SCHEDULE FOR THE FISCAL YEAR ENDED JUNE 30, 2019
Variance
Original Final Final To Budget Adjustments Budget Actual Actual
EXPENDITURES CURRENT (Continued)
Undistributed Expenditures - Central Services
Salaries $ 345,344 $ $ 345,344 $ 326,056 $ 19,288
Misc. Purchased Services 500 500 500
Supplies and Materials 7,500 539 8,039 2,864 5,175
Miscellaneous Expenditures 3,315 3,315 2,784 531
Total Undistributed Expenditures- Central Services 356,659 539 357,198 331,704 25,494
Required Maintenance for School Facilities
Salaries 289,220 9,833 299,053 282,012 17,041
Cleaning, Repair and Maintenance Services 153,000 153,000 122,562 30,438 General Supplies 70,000 70,000 59,453 10,547
Total Required Maintenance for School Facilities 512,220 9,833 522,053 464,027 58,026
Custodial Services
Salaries 330,886 (13,548) 317,338 312,930 4,408
Salaries of Non-Instructional Aides 90,291 42,601 132,892 130,669 2,223
Purchased Professional-Technical Services 26,010 (2,707) 23,303 18,669 4,634
Cleaning, Repair and Maintenance Services 916,818 (40,752) 876,066 849,022 27,044
Rentals 112,000 112,000 109,935 2,065
Other Purchased Property Services 358,000 (55,676) 302,324 187,340 114,984
Insurance 267,672 267,672 216,304 51,368
General Supplies 39,000 5,756 44,756 44,756
Energy (Natural Gas) 165,000 165,000 163,400 1,600
Energy (Electricity) 375,000 (968) 374,032 344,860 29,172 Miscelleaneous 1,082 1,082 1,082
Total Custodial Services 2,680,677 (64,212) 2,616,465 2,378,967 237,498
Care and Upkeep of Grounds
Cleaning, Repair and Maintenance Services 42,000 (11,853) 30,147 25,169 4,978 General Supplies 9,000 4,232 13,232 13,232
Total Care and Upkeep of Grounds 51,000 (7,621) 43,379 38,401 4,978
Security
Salaries 198,376 (6,240) 192,136 175,786 16,350 Purchased Professional and Technical Services 480,751 (81,496) 399,255 9,727 389,528 General Supplies 8,750 2,785 11,535 11,535 Equipment 1,406 1,406 780 626
Total Security 687,877 (83,545) 604,332 197,828 406,504
Student Transportation Services
Salaries ofNon-lnstructional Aides 42,939 42,939 1,746 41,193 Salaries for Pupil Trans. (Bet Home & School)- SpeEd 52,226 52,226 44,229 7,997 Lease Purchase- School Buses 90,000 (40,000) 50,000 46,281 3,719 Contracted Services- Aid in Lieu ofPayments-Nonpublic Schools 81,000 81,000 67,000 14,000 Contracted Services (Between Home and School)- Vendors 325,500 40,000 365,500 345,256 20,244 Contracted Services (Other Than Btwn Home and School)- Vendors 227,031 (32,503) 194,528 98,956 95,572 Contracted Services (Special Ed Students)- Vendors 561,132 31,003 592,135 592,135 Contracted Services- (Regular Students)- ESCs & CTSAs 25,000 25,000 17,000 8,000 Misc. Purchased Services-Transportation 25,000 25,000 19,652 5,348 General Supplies 17,000 17,000 13,599 3,401 Other Objects
Total Student Transportation Services 1,446,828 (1,500) 1,445,328 1,245,854 199,474
75 (Continued)

CLARK PUBLIC SCHOOL DISTRICT EXHffiiT C-1
GENERAL FUND BUDGETARY COMPARISON SCHEDULE
FOR THE FISCAL YEAR ENDED JUNE 30, 2019 Variance
Original Final Final To Budget Adjustments Budget Actual Actual
EXPENDITURES
CURRENT (Continued) Unallocated Benefits- Employee Benefits
Social Security Contributions $ 390,000 $ (15,032) $ 374,968 $ 374,776 $ 192
Other Retirement Contributions - PERS 325,000 7,800 332,800 332,800
Unemployment Compensation 75,000 3,934 78,934 78,934
Workmen's Compensation 172,808 372 173,180 168,627 4,553
Health Benefits 4,625,394 (4,566) 4,620,828 4,374,636 246,192
Other Employee Benefits 305,000 7,492 312,492 248,026 64,466
Total Unallocated Benefits 5,893,202 5,893,202 5,577,799 315,403
Interest Earned on Maintenance Reserve 1,500 1,500 1,500
On-Behalf (Non-Budget)
TP AF Pension Benefit Contribution -(Non-Budget) 2,850,053 (2,850,053)
TP AF Pension- NCGI Premium (Non-Budget) 59,659 (59,659)
TP AF Long-Term Disability Insurance 2,574 (2,574)
TP AF Post Retirement Medical Contribution (Non-Budget) 1,319,841 (1,319,841)
TP AF Social Security Contributions (Non-Budget) 1,135,769 (1,135,769)
Total On-Behalf 5,367,896 (5,367,896)
Total Undistributed Expenditures 19,887,566 177,494 20,065,060 23,100,410 (3,035,350)
Total Current Expenditures 35,800,672 (143,332) 35,657,340 38,387,673 (2,730,333)
CAPITAL OliTLA Y
Equipment
Grades I -5 20,400 20,400 6,070 14,330
Grades 6-8 2,509 2,509 2,509
Admin. Info Tech 165,766 (45,194) 120,572 64,222 56,350 Security 10,000 10,071 20,071 13,831 6,240
Total Equipment 196,166 (32,614) 163,552 86,632 76,920
Facilities Acquisition and Construction Services
Architectural and Engineering Services 8,500 8,500 8,500
Other Purchased Professional and Technical Services 173,459 173,459 44,216 129,243 Assessment for Debt Service on SDA Funding 119,442 119,442 119,442
Total Facilities Acquisition and Construction Services 119 442 181,959 301,401 172,158 129,243
Interest Deposit to Capital Reserve 1,000 1,000 1,000
Assets Acquired Through Interlocal Agreement (Non-Budgeted)
Construction Services 375,000 (375,000)
Total Assets Acquired Through Interlocal Agrmnt (Non-Budgeted) 375,000 (375,000)
Total Capital Outlay 316,608 149,345 465,953 633,790 (167,837)
Total General Fund 36,117,280 6,013 36,123,293 39,021,463 (2,898, 170)
Excess (Deficiency) of Revenues Over/(Under) Expenditures (1,563,674) {6,013) {1,569,687) 1,311,921 2,881,608
76 (Continued)

EXPENDITURES
CURRENT (Continued) Other Financing Sources
Interlocal Agreement
Total Other Financing Sources
Excess (Deficiency) of Revenues and Other Financing Sources Over/(Under) Expenditures
Fund Balance, Beginning of Year
CLARK PUBLIC SCHOOL DISTRICT GENERAL FUND
BUDGETARY COMPARISON SCHEDULE
FOR THE FISCAL YEAR ENDED JUNE 30, 2019
Original Budget Adjustments
Final Budget
$ (1,563,674) $ (6,013) $ (1,569,687)
5,657,478 5,657,478
$
Actual
EXHffiiT C-1
Variance
Final To Actual
375,000 $ 375,000
375,000 375,000
1,686,921 3,256,608
5,657,478
Fund Balance, End of Year $ 4,093,804 :::.$=~(6~,0~1:.;,3) $ 4,087,791 $ 7,344,399 $ 3,256,608
Recapitulation:
Restricted Fund Balance Excess Surplus- Designated for Subsequent Year's Expenditures Excess Surplus Capital Reserve Maintenance Reserve
Assigned Fund Balance Year End Encumbrances
Unassigned Fund Balance
Fund Balance- Budgetary Basis
Less: State Aid Revenue not recognized on GAAP basis
Fund Balance per Governmental Funds Statements (GAAP)
77
$ 2,165,576
2,973,945
587,163
635,784
127,245 854,686
7,344,399
(331,078)
$ 7,013,321

EXHIBIT C-2
CLARK PUBLIC SCHOOL DISTRICT
SPECIAL REVENUE FUND BUDGETARY COMPARISON SCHEDULE
FOR THE FISCAL YEAR ENDED JUNE 30, 2019
Original Final Variance
Budget Adjustments Budget Actual Final to Actual
REVENUES Intergovernmental
State $ 419,136 $ 113,975 $ 533,111 $ 448,137 $ (84,974)
Federal 549,656 253,744 803,400 695,302 (108,098)
Local
Total Revenues 968,792 367,719 1,336,511 1,143,439 (193,072)
EXPENDITURES
Instruction
Salaries of Teachers 28,462 6,515 34,977 33,947 1,030
Purchased Professional/Educational Services 54,720 167,039 221,759 68,310 153,449
Tuition 441,411 3,519 444,930 444,930
General Supplies 59,334 85,035 144,369 134,771 9,598
Textbooks 28,837 4,645 33,482 32,107 1,375
Total Instruction 612,764 266,753 879,517 714,065 165,452
Support Services
Personal Services Employee-Benefits 5,320 5,523 10,843 10,523 320
Purchased Professional/Educational Services 350,708 59,220 409,928 395,580 14,348 Other Purchased Services 36,223 36,223 23,271 12,952
Total Support Services 356,028 100,966 456,994 429,374 27,620
Unaiiocated Benefits
Employee Benefits
Capital Outlay
Instructional Equipment
N oninstructional Equipment
Total Capital Outlay
Total Expenditures 968,792 367,719 1,336,511 1,143,439 193,072
Excess (Deficiency) of Revenues
Over/(Under) Expenditures
Fund Balances, Beginning of Year
Fund Balances, End of Year $ $ $ $ $
78

NOTES TO THE REQUIRED SUPPLEMENTARY INFORMATION- PART II

EXHIBIT C-3
CLARK PUBLIC SCHOOL DISTRICT REQUIRED SUPPLEMENTARY INFORMATION
BUDGETARY COMPARISON SCHEDULES NOTES TO THE REQUIRED SUPPLEMENTARY INFORMATION
FOR THE FISCAL YEAR ENDED JUNE 30, 2019
Formal budgetary integration into the accounting system is employed as a management control device during the year. For governmental funds there are no substantial differences between the budgetary basis of accounting and accounting principles generally accepted in the United States of America, with the exception of the legally mandated revenue recognition of certain state aid payments for budgetary purposes only and the treatment of encumbrances in the special revenue fund as described below. Encumbrance accounting is also employed as an extension of formal budgetary integration of the governmental fund types. Unencumbered appropriations lapse at fiscal year end.
The accounting records of the Special Revenue Fund are maintained on the grant accounting budgetary basis. The grant accounting budgetary basis differs from GAAP in that the grant accounting budgetary basis recognizes encumbrances as. expenditures and also recognizes the related revenues, whereas the GAAP basis does not. Sufficient supplemental records are maintained to allow for the presentation of GAAP basis financial reports.
The following presents a reconciliation of the General and Special Revenue Funds from the budgetary basis of accounting as presented in the Budgetary Comparison Schedule - General Fund and Special Revenue Fund to the GAAP basis of accounting as presented in the Statement of Revenues, Expenditures and Changes in Fund Balance- Governmental Funds.
General Fund
Special Revenue
Fund Sources/inflows of resources Actual amounts (budgetary basis) "revenues"
from the budgetary comparison schedule
Difference - Budget to GAAP:
Grant accounting budgetary basis differs from GAAP in that encumbrances are recognized as expenditures, and the related revenue is recognized.
Encumbrances June 30, 2018
Encumbrances June 30, 2019
State Aid payment not recognized for budgetary purposes, recognized for GAAP statements. 2017/2018 State Aid
State Aid payment recognized for budgetary purposes, not recognized for GAAP statements. 2018/2019 State Aid
Total revenues as reported on the Statement of Revenues, Expenditures and Changes in Fund Balances - Governmental Funds.
Uses/outflows of resources Actual amounts (budgetary basis) "total expenditures" from the
budgetary comparison schedule
Differences - Budget to GAAP
Encumbrances for supplies and equipment ordered but not received are reported in the year the order is placed for budgetary purposes,
but in the year the supplies are received for fmancial reporting
purposes.
Encumbrances June 30, 2018
Encumbrances June 30, 2019
Total expenditures as reported on the Statement of Revenues, Expenditures, and Changes in Fund Balances - Governmental Funds
79
$ 40,333,384 $ 1,143,439
19,040
(68,575)
185,823
(331,078)
$ 40,188,129 $ 1,093,904
$ 39,021,463 $ 1,143,439
19,040
(68,575)
$ 39,021,463 $ 1,093,904

REQUIRED SUPPLEMENTARY INFORMATION- PART III
PENSION AND OTHER POST EMPLOYMENT BENEFIT INFORMATION

District's Proportion of the Net Position Liability (Asset)
District's Proportionate Share of the Net Pension Liability (Asset) $
District's Covered Payroll $
District's Proportionate Share of the Net Pension Liability (Asset) as a Percentage of its Covered Payroll
Plan Fiduciary Net Position as a Percentage of the Total Pension Liability
CLARK PUBLIC SCHOOL DISTRICT REQUIRED SUPPLEMENTARY INFORMATION
SCHEDULE OF THE DISTRICT'S PROPORTIONATE SHARE OF THE NET PENSION LIABILITY Public Employees Retirement System
Last Six Fiscal Years*
2019 2018 2017 2016
0.03042% 0.03040% 0.03113% 0.03291%
5,990,324 $ 7,077,525 $ 9,220,197 $ 7,386,520
2,039,825 $ 2,129,762 $ 2,062,445 $ 2,050,030
293.67% 332.32% 447.05% 360.31%
53.60% 48.10% 40.14% 47.93%
The amounts presented for each fiscal year were determined as of the previous fiscal year-end.
This schedule is presented to illustrate the requirements to show information for 10 years in accordance with GASB Statement No. 68. However, until a full 10-year trend is compiled, the District will only present information for those years for which information is available.
80
EXHIBIT L-1
2015 2014
0.03286% 0.03257%
$ 6,152,107 $ 6,741,273
$ 2,201,638 $ 2,186,439
279.43% 308.32%
52.08% 48.72%

Contractually Required Contribution $
Contributions in Relation to the Contractually Required Contribution
Contribution Deficiency (Excess) $
District's Covered Payroll $
Contributions as a Percentage of Covered Payroll
CLARK PUBLIC SCHOOL DISTRICT REQUIRED SUPPLEMENTARY INFORMATION
SCHEDULE OF DISTRICT CONTRIBUTIONS
Public Employees Retirement System
Last Six Fiscal Years
2019 2018 2017 2016
302,620 $ 281,659 $ 276,566 $ 282,895
302,620 281,659 276,566 282,895
$ $ $
2,039,825 $ 2,129,762 $ 2,062,445 $ 2,050,030
14.84% 13.22% 13.41% 13.80%
This schedule is presented to illustrate the requirement to show information for I 0 years in accordance with GASB Statement No. 68. However, until the full I 0-year trend is compiled,
the District will only preset information for those years which information is available.
81
EXHIBITL-2
2015 2014
$ 270,885 $ 265,771
270,885 265,771
$ $
$ 2,201,638 $ 2,186,439
12.30% 12.16%

CLARK PUBLIC SCHOOL DISTRICT REQUIRED SUPPLEMENTARY INFORMATION
SCHEDULE OF THE DISTRICT'S PROPORTIONATE SHARE OF THE NET PENSION LIABILITY
Teachers Pension and Annuity Fund
Last Six Fiscal Years*
2019 2018 2017
District's Proportion of the Net Position Liability (Asset) 0.00% 0.00% 0.00%
District's Proportionate Share of the Net Pension Liability (Asset) $0 $0 $0
State's Proportionate Share of the Net Pension Liability (Asset) Associated with the District $ 91,199,776 $ 96,402,979 $ 118,927,288
Total $ 91,199,776 $ 96,402,979 $ 118,927,288
District's Covered Payroll $ 15,606,996 $ 14,999,187 $ 14,930,047
District's Proportionate Share of the Net Pension Liability (Asset) as a Percentage of its Covered Payroll 0% 0% 0%
Plan Fiduciary Net Position as a Percentage of the Total Pension Liability 26.49% 25.41% 22.33%
The amounts presented for each fiscal year were determined as of the previous fiscal year-end.
This schedule is presented to illustrate the requirement to show information for 10 years in accordance with GASB Statement No. 68. However, until the fulllO-year trend is compiled, the District will only present information for those years which information is available.
82
2016
0.00%
$0
$ 96,800,736
$ 96,800,736
$ 14,472,063
0%
28.71%
EXHIBIT L-3
2015 2014
0.00% 0.00%
$0 $0
$ 80,987,570 $ 76,907,380
$ 80,987,570 $ 76,907,380
$ 14,879,359 $ 15,053,374
0% 0%
33.64% 33.76%

CLARK PUBLIC SCHOOL DISTRICT REQUIRED SUPPLEMENTARY INFORMATION
EXIDBITL-4
SCHEDULE OF DISTRICT'S PROPORTIONATE SHARE OF NET PENSION LIABILITY AND SCHEDULE OF DISTRICT CONTRIBUTIONS
NOTES TO REQUIRED SUPPLEMENTARY INFORMATION
Change of Benefit Terms:
Change of Assumptions:
FOR THE FISCAL YEAR ENDED JUNE 30, 2019
None.
Assumptions used in calculating the net pension liability and statutorily required employer contribution are presented in Note 4D.
83

CLARK PUBLIC SCHOOL DISTRICT REQUIRED SUPPLEMENTARY INFORMATION
SCHEDULE OF CHANGES IN THE DISTRICT'S PROPORTIONATE SHARE OF TOTAL OPEB LIABILITY
Postemployment Health Benefit Plan
Last Two Fiscal Years*
2019 2018
Total OPEB Liability
Service Cost $ 2,485,362 $ 2,972,767
Interest on Total OPEB Liability 2,718,903 2,361,715
Changes of Benefit Tenus Differences Between Expected and Actual Experience (7,707,292)
Changes of Assumptions (7,220,276) (9,811 ,698)
Gross Benefit Payments (1,682,433) (1,687,114)
Contribution from the Member 58,148 62,124
Net Change in Total OPEB Liability (11,347,588) (6,102,206)
Total OPEB Liability- Beginning 74,266,642 80,368,848
Total OPEB Liability- Ending $ 62,919,054 $ 74,266,642
District's Proportionate Share ofOPEB Liability $ $
State's Proportionate Share ofOPEB Liability 74,266,642 74,266,642
Total OPEB Liability- Ending $ 74,266,642 $ 74,266,642
District's Covered Payroll $ 17,646,821 $ 17,128,949
District's Proportionate Share of the Total OPEB Liability as a Percentage of its Covered Payroll 0% 0%
Note: No assets are accumulated in a trust that meets the criteria in paragraph 4 ofGASB 75.
*The amounts presented for each fiscal year were detennined as of the previous fiscal year end.
EXHffiiTL-5
This schedule is presented to illustrate the requirement to show infonnation for 10 years in accordance with GASB Statement No. 75. However, until a full 1 0-year trend is compiled, the District will only present infonnation for those years for which infonnation is available.
84

CLARK PUBLIC SCHOOL DISTRICT REQUIRED SUPPLEMENTARY INFORMATION
EXHIBITL-6
SCHEDULE OF CHANGES IN THE DISTRICT'S PROPORTIONATE SHARE OF THE OPEB LIABILITY AND SCHEDULE OF DISTRICT PROPORTIONATE SHARE OF THE OPEB LIABILITY
NOTES TO REQUIRED SUPPLEMENTARY INFORMATION
Changes in Benefit Terms:
Changes of Assumptions
FOR THE FISCAL YEAR ENDED JUNE 30, 2019
None.
Assumptions used in calculating the OPEB liability are presented in Note 4E.
85

SCHOOL LEVEL SCHEDULES
NOT APPLICABLE


EXHIBIT E-1
CLARK PUBLIC SCHOOL DISTRICT
SPECIAL REVENUE FUND
COMBINING SCHEDULE OF PROGRAM REVENUES AND EXPENDITURES- BUDGETARY BASIS
FOR THE FISCAL YEAR ENDED JUNE 30, 2019
Cb. 192 Svcs. Ch. 193 Svcs.
Non public Nonpublic Non public Non public Grand
Nonpublic Non public Nonpublic Nonpublic Compensatory Nonpublic Home Supplemental Exam./ Corrective Total Total
REVENUES Nursing ~ Technoloa Securitv Education Transn:ort. Instruction Instruction Classification. Speech Page2 2019
Intergovernmental
State $ 54,126 $ 32,107 $ 21,312 $ 20,450 $ 189,595 $ 16,621 $ 2,813 $ 48,770 $ 38,238 $ 24,105 $ 448,137 Federal $ 695,302 695,302
Total Revenues $ 54,126 $ 32,107 $ 21,312 $ 20,450 $ 189,595 $ 16,621 $ 2,813 $ 48,770 $ 38,238 $ 24,105 $ 695,302 $ 1,143,439
EXPENDITURES
Instruction
Salaries of Teachers $ 33,947 $ 33,947
Purchased Professional/ Educational Services $ 20,450 47,860 68,310
Tuition 444,930 444,930
General Supplies 134,771 134,771
Textbooks $ 32,107 32,107
Total Instruction 32,107 20,450 661,508 714,065
Support Services Personal Services Employee-Benefits 10,523 10,523
Purchased Professional/ Educational Services $ 54,126 $ 21,312 $ 189,595 $ 16,621 $ 2,813 $ 48,770 $ 38,238 $ 24,105 395,580 Other Purchased Services 23,271 23,271
Total Support Services ~ 21,312 189,595 16,621 2,813 48,770 38,238 24,105 33,794 429,374
Facilities Acquisition and Construction
Instructional Equipment
Noninstructional Equipment
Total Facilities Acquisition and Construction
Total Expenditures $ 54,126 $ 32,107 $ 21,312 $ 20,450 $ 189,595 $ 16,621 $ 2,813 $ 48,770 $ 38,238 $ 24,105 $ 695,302 $ 1,143,439
86

EXHffiiTE-1a
CLARK PUBLIC SCHOOL DISTRICT SPECIAL REVENUE FUND
COMBINING SCHEDULE OF PROGRAM REVENUES AND EXPENDITURES- BUDGETARY BASIS FOR THE FISCAL YEAR ENDED JUNE 30, 2019
Tittem Title I Title IlA Immigrant Title IV IDEA IDEA Total
REVENUES 2018/19 2018/19 2018/19 2018/19 PartB Preschool Page2
Intergovernmental
State Federal $ 125,809 $ 40,064 $ 1,880 $ 12,771 $ 492,790 $ 21,988 $ 695,302
Total Revenues $ 125,809 $ 40,064 $ 1,880 $ 12,771 $ 492,790 $ 21,988 $ 695,302
EXPENDITURES Instruction
Salaries ofTeachers $ 15,727 $ 1,435 $ 16,785 $ 33,947
Purchased Professional/ Educational Services $ 47,860 47,860
Tuition 444,930 444,930
General Supplies $ 125,809 $ 8,962 134,771 Textbooks
Total Instruction 125,809 15,727 1,435 8,962 492,790 16,785 661,508
Support Services
Personal Services Employee-Benefits 4,875 445 5,203 10,523
Purchased Professional! Educational Services Other Purchased Services 19,462 3,809 23,271
Total Support Services 24,337 445 3,809 5,203 33,794
Facilities Acquisition and Construction
Instructional Equipment
Noninstructional Equipment
Total Facilities Acquisition and Construction
Total Expenditures $ 125,809 $ 40,064 $ 1,880 $ 12,771 $ 492,790 $ 21,988 $ 695,302
87

CLARK PUBLIC SCHOOL DISTRICT SPECIAL REVENUE FUND
PRESCHOOL EDUCATION AID SCHEDULE OF EXPENDITURES
BUDGETARY BASIS FOR THE FISCAL YEAR ENDED JUNE 30, 2019
NOT APPLICABLE
88
EXHIBITE-2

CAPITAL PROJECTS FUND

CLARK PUBLIC SCHOOL DISTRICT CAPITAL PROJECTS FUND
SUMMARY SCHEDULE OF PROJECT EXPENDITURES- BUDGETARY BASIS FROM INCEPTION AND FOR THE FISCAL YEAR ENDED JUNE 30, 2019
Modified Expenditures to Date Issue/Project Title Appropriation Prior Years Current Year
ALJ High School- Restroom ADA Upgrades $ 174,333 $ 171,132
Valley Road Elementary School- Restroom ADA Upgrades 193,400 176,700
Karl H. Kumpf Middle School- Restroom ADA Upgrades 188,706 175,602
Frank K. Henly Elementary School- Restroom ADA Upgrades 113,238 99,538
Valley Road Elementary School- Window Replacements 595,615 570,584
$ 1,265,292 $1,193,556
Reconciliation to GAAP
Project Balances, June 30, 2019
Fund Balance, June 30, 2019- GAAP
Recapitulation of Fund Balance
Restricted for Capital Projects Available for Capital Projects
$
Total Fund Balance- Restricted for Capital Projects
89
EXHffilTF-1
Balance June 30,2019
$ 3,201
16,700
13,104
13,700
25,031
$ 71,736
$ 71,736
$ 71,736
$ 71,736
$ 71,736

CLARK PUBLIC SCHOOL DISTRICT CAPITAL PROJECTS FUND
EXHIBITF-2
SUMMARY SCHEDULE OF REVENUES, EXPENDITURES AND CHANGES IN FUND BALANCE BUDGETARY BASIS
FOR THE FISCAL YEAR ENDED JUNE 30, 2019
Revenues and Other Financing Sources State Sources- SDA Grant Transfer from General Fund- Capital Reserve
Total Revenues
Expenditures and Other Financing Uses Expenditures: Architect/Engineering Services Construction Services
Other Financing Uses Cancelled SDA Grant Receivable
Total Expenditures and Other Financing Uses
Excess (Deficiency) of Revenues and Other Financing Sources Over (Under) Expenditures and Other Financing Uses
Fund Balance- Beginning ofY ear
Fund Balance- Ending ofY ear
Reconciliation to GAAP Basis
Fund Balance, June 30, 2019 - Budgetary Basis
Fund Balance, June 30, 2019-GAAP Basis
90
$ 71,736
$ 71,736
$ 71,736
$ 71,736

CLARK PUBLIC SCHOOL DISTRICT
CAPITAL PROJECTS FUND
EXHIBIT F-2a
SCHEDULE OF PROJECT REVENUES, EXPENDITURES, PROJECT BALANCE AND PROJECT STATUS
ALJ HIGH SCHOOL- RESTROOM ADA UPGRADES
FROM INCEPTION AND FOR THE FISCAL YEAR ENDED JUNE 30, 2019
Revenues and Other Financing Sources
State Sources- SDA Grant Local Contribution -Transfer From Capital Reserve
Total Revenues and Other Financing Sources
Expenditures and Other Financing Uses
Architect/Engineering Services Construction Services
Total Expenditures and Other Financing Uses
Excess (Deficiency) of Revenues and Other Financing Sources over (under) Expenditures and Other Financing Uses
Additional Project Information:
DOE Project Number SDA Project Number Grant Number Grant Date
Bond Authorization Date Bonds Authorized Bonds Issued Original Authorization Cost Additional Authorization Cost/( Cancellation) Revised Authorization Cost
Percentage Increase over Original
Authorized Cost Percentage Completion Original Target Completion Date Revised Target Completion Date
Prior Periods
$ 69,733 104,600
I 74,333
8,300 162,832
171,132
$ 3,201
0850-005-14-1001 0850-005. 14-G2RB G5-5865 May 29,2014
N/A N/A N/A $ 174,898
(565) 174,333
-0.32% 98.16%
December 31,2014 July 31, 2016
91
Current Year
$
Revised Authorized
Totals Cost
$ 69,733 $ 69,733 104,600 104,600
174,333 174,333
8,300 8,300 162,832 166,033
171,132 174,333
$ 3,201 $

CLARK PUBLIC SCHOOL DISTRICT
CAPITAL PROJECTS FUND
EXIDBITF-2b
SCHEDULE OF PROJECT REVENUES, EXPENDITURES, PROJECT BALANCE AND PROJECT STATUS
VALLEY ROAD ELEMENTARY SCHOOL- RESTROOM ADA UPGRADES
FROM INCEPTION AND FOR THE FISCAL YEAR ENDED JUNE 30, 2019
Revenues and Other Financing Sources
State Sources- SDA Grant Local Contribution -Transfer From Capital Reserve
Total Revenues and Other Financing Sources
Expenditures and Other Financing Uses Construction Services
Total Expenditures and Other Financing Uses
Excess (Deficiency) of Revenues and Other Financing Sources over (under) Expenditures and Other Financing Uses
Additional Project Information: DOE Project Number SDA Project Number Grant Number Grant Date
Bond Authorization Date Bonds Authorized Bonds Issued Original Authorization Cost Additional Authorization Cost/( Cancellation) Revised Authorization Cost
Percentage Increase over Original
Authorized Cost Percentage Completion Original Target Completion Date Revised Target Completion Date
Prior Periods
$ 77,360 116,040
193,400
176,700
176,700
$ 16,700
0850-040-14-1004 0850-040-14-G2RE 05-5868 3/18/16
N/A N/A N/A $
92
212,871 (19,471) 193,400
-9.15% 91.37%
June 30, 2017 June 30, 2017
Current Year
$
Preliminary
Authorized
Totals Cost
$77,360 $ 77,360 116,040 116,040
193,400 193,400
176,700 193,400
176,700 193,400
$16,700 $

CLARK PUBLIC SCHOOL DISTRICT
CAPITAL PROJECTS FUND
EXHIBIT F-2c
SCHEDULE OF PROJECT REVENUES, EXPENDITURES, PROJECT BALANCE AND PROJECT STATUS
KARL H. KUMPF MIDDLE SCHOOL- RESTROOM ADA UPGRADES
FROM INCEPTION AND FOR THE FISCAL YEAR ENDED JUNE 30, 2019
Revenues and Other Financing Sources
State Sources- SDA Grant
Local Contribution - Transfer From Capital Reserve
Total Revenues and Other Financing Sources
Expenditures and Other Financing Uses
Architect/Engineering Services Construction Services
Total Expenditures and Other Financing Uses
Excess (Deficiency) of Revenues and Other Financing Sources over (under) Expenditures and Other Financing Uses
Additional Project Information: DOE Project Number
SDA Project Number
Grant Number
Grant Date
Bond Authorization Date Bonds Authorized Bonds Issued Original Authorization Cost Additional Authorization Cost/( Cancellation) Revised Authorization Cost
Percentage Increase over Original
Authorized Cost Percentage Completion Original Target Completion Date Revised Target Completion Date
Prior Periods
$ 67,420
121,286
188,706
1,796 173,806
175,602
$ 13,104
0850-035-14-1003
0850-035-14-G2RD
G5-5867
3/18/16
N/A N/A N/A $
93
168,550 20,156
188,706
11.96% 93.06%
June 30, 2017 June 30,2017
Current Year
$
$ $
Preliminary
Authorized
Totals Cost
67,420 $ 67,420
121,286 121,286
188,706 188,706
1,796 1,796 173,806 186,910
175,602 188,706
13,104 $

CLARK PUBLIC SCHOOL DISTRICT
CAPITAL PROJECTS FUND
EXHIBIT F-2d
SCHEDULE OF PROJECT REVENUES, EXPENDITURES, PROJECT BALANCE AND PROJECT STATUS
FRANK K. HEHNLY ELEMENTARY SCHOOL- RESTROOM ADA UPGRADES FROM INCEPTION AND FOR THE FISCAL YEAR ENDED JUNE 30, 2019
Revenues and Other Financing Sources
State Sources- SDA Grant Local Contribution - Transfer From Capital Reserve
Total Revenues and Other Financing Sources
Expenditures and Other Financing Uses Construction Services
Total Expenditures and Other Financing Uses
Excess (Deficiency) ofRevenues and Other Financing Sources over (under) Expenditures and Other Financing Uses
Additional Project Information:
DOE Project Number
SDA Project Number
Grant Number Grant Date
Bond Authorization Date Bonds Authorized Bonds Issued Original Authorization Cost Additional Authorization Cost/( Cancellation) Revised Authorization Cost
Percentage Increase over Original
Authorized Cost Percentage Completion Original Target Completion Date Revised Target Completion Date
Prior Periods
$ 44,920 68,318
113,238
99,538
99,538
$ 13,700
0850-030-14-1002
0850-030-14-G2RC
G5-5866
3/18/2016
N/A N/A N/A $
94
143,610 (30,372) 113,238
-21.15% 87.90%
June 30, 2017 June 30, 2017
Current Year
$
Preliminary Authorized
Totals Cost
$44,920 $ 44,920
68,318 68,318
113,238 113,238
99,538 113,238
99,538 113,238
$13,700 $

CLARK PUBLIC SCHOOL DISTRICT
CAPITAL PROJECTS FUND
EXHIBIT F -2e
SCHEDULE OF PROJECT REVENUES, EXPENDITURES, PROJECT BALANCE AND PROJECT STATUS
VALLEY ELEMENTARY SCHOOL- WINDOW REPLACEMENT PROJECT
FROM INCEPTION AND FOR THE FISCAL YEAR ENDED JUNE 30, 2019
Revenues and Other Financing Sources
State Sources- SDA Grant
Local Contribution - Transfer From Capital Reserve
Total Revenues and Other Financing Sources
Expenditures and Other Financing Uses
Architect/Engineering Services Construction Services
Total Expenditures and Other Financing Uses
Excess (Deficiency) ofRevenues and Other Financing Sources over (under) Expenditures and Other Financing Uses
Additional Project Information:
DOE Project Number
SDA Project Number
Grant Number
Grant Date
Bond Authorization Date Bonds Authorized Bonds Issued Original Authorization Cost Additional Authorization Cost/( Cancellation) Revised Authorization Cost
Percentage Increase over Original
Authorized Cost Percentage Completion Original Target Completion Date Revised Target Completion Date
$
Prior Periods
229,513
366,102
595,615
29,275 541,309
570,584
Current Year
$ 25,031 ;;;,$=====
0850-040-14-1005
0850-040-14-G2RF
G5-5869
6/2/2016
N/A N/A N/A
95
593,980 1,635
595,615
0.28% 95.80%
June 30, 2017 June 30, 2017
$
$
Totals
229,513
366,102
595,615
29,275 541,309
570,584
$
Preliminary Authorized
Cost
229,513
366,102
595,615
29,275 566,340
595,615
25,031 ;;;,$====


CLARK PUBLIC SCHOOL DISTRICT PROPRIETARY FUNDS
STATEMENT OF NET POSITION AS OF JUNE 30, 2019
FINANCIAL STATEMENTS ARE PRESENTED ON EXHIBIT B-4
STATEMENT OF REVENUES, EXPENSES AND CHANGES IN FUND NET POSITION
FOR THE FISCAL YEAR ENDED JUNE 30, 2019
FINANCIAL STATEMENTS ARE PRESENTED ON EXHIBIT B-5
STATEMENT OF CASH FLOWS FOR THE FISCAL YEAR ENDED JUNE 30, 2019
FINANCIAL STATEMENTS ARE PRESENTED ON EXHIBIT B-6
96
EXHIBIT G-1
EXHffiiTG-2
EXHIBIT G-3

FIDUCIARY FUNDS
AGENCY FUNDS

ASSETS
Cash
Intergovernmental Receivable
Total Assets
LIABILITIES
Due to Other Funds
Due to Student Groups
CLARK PUBLIC SCHOOL DISTRICT AGENCY FUNDS
COMBINING STATEMENT OF AGENCY NET POSITION AS OF JUNE 30, 2019
Student Activity
$ 146,834
$ 146,834
$ 146,834
Employee Deposits Payable-Summer Payroll
Accrued Salaries and Wages
Payroll Deductions and Withholding Payables Flexible Spending Deposits
Total Liabilities $ 146,834
97
EXHIBIT H-1
Total Payroll Agency Funds
$ 661,996 $ 808,830
$ 661,996 $ 808,830
$ 257,350 $ 257,350
146,834
243,857 243,857
1,898 1,898
153,493 153,493 5,398 5,398
$ 661,996 $ 808,830

CLARK PUBLIC SCHOOL DISTRICT FIDUCIARY FUNDS
EXHIBITH-2
COMBINING STATEMENT OF CHANGES IN FIDUCIARY NET POSITION FOR THE FISCAL YEAR ENDED JUNE 30, 2019
FINANCIAL STATEMENTS ARE PRESENTED ON EXHIBIT B-8
98

ELEMENTARY SCHOOLS Valley Road Frank K. Hehnly Clark School Account
MIDDLE SCHOOL Carl H. Kumpf
HIGHSCHOOL Athletic Account Arthur L. Johnson Internal School Account
Total All Schools
ASSETS
Cash Intergovernmental Receivable
Total Assets
LIABILITIES
Due to Other Funds
CLARK PUBLIC SCHOOL DISTRICT AGENCY FUNDS
STUDENT ACTIVITY AGENCY FUND SCHEDULE OF RECEIPTS AND DISBURSEMENTS
FOR THE FISCAL YEAR ENDED JUNE 30, 2019
Balance, July 1, Cash 2018 Receipts
$ 22,420 $ 26,304 10,268 11,133
135 1
48,626 88,734
14,308 29,963 88,725 133,428
1,967 16
$ 186,449 $ 289,579
PAYROLL AGENCY FUND SCHEDULE OF RECEIPTS AND DISBURSEMENTS
FOR THE FISCAL YEAR ENDED JUNE 30, 2019
Balance, July 1, 2018 Additions
$ 585,579 $23,285,759 28,288
$ 613,867 $23,285,759
$ 268,369 $ 5,049 Employee Deposits Payable - Summer Payroll 187,782 244,457 Accrued Salaries and Wages 1,427 12,751,412 Payroll Deductions and
Withholdings Payable 151,685 10,279,041
Flexible Spending Deposits 4,604 5,800
Total Liabilities $ 613,867 $23,285,759
99
EXHIBITH-3
Balance, Cash June 30,
Disbursements 2019
$ 22,632 $ 26,092 12,849 8,552
136
100,740 36,620
42,833 1,438 150,140 72,013
1,983
$ 329,194 $ 146,834
EXHIBITH-4
Balance, June 30,
Deletions 2019
$ 23,209,342 $ 661,996 28,288
$ 23,237,630 $ 661,996
$ 16,068 $ 257,350 188,382 243,857
12,750,941 1,898
10,277,233 153,493
5,006 5,398
$ 23,237,630 $ 661,996

LONG-TERM DEBT

Date of Issue Issue
Refunding School Bonds 12/4/12 $
CLARK PUBLIC SCHOOL DISTRICT LONG-TERM DEBT
SCHEDULE OF SERIAL BONDS FOR THE FISCAL YEAR ENDED JUNE 30, 2019
Amount of Annual Maturities Interest Balance, Issue Date Amount Rate July 1, 2018
14,145,000 6/01/20 1,010,000 4.00%
6/01/21 1,095,000 3.73%
6/01/22 1,295,000 4.00%
6/01/23 1,590,000 4.00%
6/01/24 1,705,000 2.63%
6/01/25 1,710,000 2.75%
6/01/26 1,755,000 3.00% $ 11,135,000
$ 11,135,000
100
EXHIBIT 1-1
Balance, Issued Retired June 30, 2019
$ 975,000 $ 10,160,000
$ $ 975,000 $ 10,160,000

EXHIBIT 1-2 CLARK PUBLIC SCHOOL DISTRICT
LONG-TERM DEBT SCHEDULE OF OBLIGATIONS UNDER CAPITAL LEASES AND INTERLOCAL AGREEMENTS
FOR THE FISCAL YEAR ENDED JUNE 30, 2019
Original Interest Balance, Balance, Pumose Issue Rate June 30,2018 Issued Matured June 30,2019
Capital Leases 18 Xerox Copiers $ 201,380 0.32% $ 165,939 $ 48,871 $ 117,068 School Bus 86,226 7.06% 86,226 42,999 43,227 Digital Copier 15,894 3.00% 6,319 3 371 2 948
Total Capital Leases 258,484 95,241 163,243
Interlocal Agreement- Township of Clark Athletic Turf Field Improvements 375,000 $ 375,000 75,000 300,000
Total Interlocal Agreements 375,000 75,000 300,000
Total Capital Leases and Interlocal Agreements $ 258,484 $ 375,000 $ 170,241 $ 463,243
101

REVENUES Local Sources
Local Tax Levy
Total Revenues
EXPENDITURES
Regular Debt Service
Principal Interest on Bonds
Total Expenditures
Net Change in Fund Balances
Fund Balance, Beginning ofYear
Fund Balance, End of Year
CLARK PUBLIC SCHOOL DISTRICT
DEBT SERVICE FUND
BUDGETARY COMPARISON SCHEDULE
FOR THE FISCAL YEAR ENDED JUNE 30, 2019
Original
Budget Adjustments
Final
Budget
EXHIBIT 1-3
Variance
Final to Actual
$ 1,355,032 $ 1,355,032 $ 1,355,032
$
1,355,032
975,000 380,032
1,355,032
$ $
102
1,355,032
975,000 380,032
1,355,032
1,355,032
975,000 380,031
1,355,031
~$======~' ~$========

STATISTICAL SECTION
This part of the Clark Public School District's comprehensive annual financial report presents detailed information as a context for understanding what the information in the fmancial statements, note disclosures, and required supplementary information says about the government's
overall fmancial health.
Contents
Financial Trends
These schedules contain trend information to help the reader understand how the government's fmancial performance and well-being have changed
over time.
Revenue Capacity
These schedules contain information to help the reader assess the government's most significant local revenue source, the property tax.
Debt Capacity
These schedules present information to help the reader assess the affordability of the government's current levels of outstanding debt and the government's ability to issue additional debt in the future.
Demographic and Economic Information
These schedules offer demographic and economic indicators to help the reader understand the environment within which the government's fmancial activities take place.
Operating Information
These schedules contain service and infrastructure data to help the reader understand how the information in the government's fmancial report
Exhibits
J-1 to J-5
J-6 to J-9
J-10 to J-13
J-14 and J-15
relates to the services the government provides and the activities it performs. J-16 to J-20
Sources: Unless otherwise noted, the information in these schedules is derived from the comprehensive annual fmancial reports fov the relevant year.

CLARK PUBLIC SCHOOL DISTRICT NET POSITION BY COMPONENT
LAST TEN FISCAL YEARS (Unaudited)
(accrual basis of accounting)
Fiscal Year Ended June 30, 2010 2011 (I) 2012 2013 2014 2015
Governmental Activities Net Investment In Capital Assets $ 21,130,888 $ 20,693,647 $ 19,589,306 $ 18,535,021 $ 17,548,040 $ 16,572,663 Restricted 889,081 162,011 362,011 382,501 1,357,029 2,009,330 Unrestricted (97,354) 354,620 674,667 1,624,260 (4,692,995} (5,095,914)
Total Governmental Activities Net Position $ 21,922,615 $ 21,210,278 $ 20,625,984 $ 20,541,782 $ 14,212,074 $ 13,486,079
Business-Type Activities Net Investment In Capital Assets $ 141,417 $ 11,361 $ 10,365 $ 9,368 $ 8,372 $ 15,732 Unrestricted (73,310) (47,475) 39,058 161,654 256,768 549,426
Total Business-Type Activities Net Position $ 68,107 $ (36,114) $ 49,423 $ 171,022 $ 265,140 $ 565,158
District-Wide Net Investment In Capital Assets $ 21,272,305 $ 20,705,008 $ 19,599,671 $ 18,544,389 $ 17,556,412 $ 16,588,395 Restricted 889,081 162,011 362,011 382,501 1,357,029 2,009,330 Unrestricted (170,665) 307,145 713,725 1,785,914 (4,436,227) (4,546,488)
Total District Net Position $ 21,990,721 $ 21,174,164 $ 20,675,407 $ 20,712,804 $ 14,477,214 $ 14,051,237
Note 1- Net Position at June 30,2011 is restated to reflect the implementation ofGASB Statement No. 63, "Financial Reporting of Deferred Outflows of Resources, Deferred Inflows of Resources and Net Position"
and GASB Statement No. 65, "Items Previously Reported in Assets and Liabilities".
Note 2 ~Net Position at June 30, 2014 is restated to reflect the implementation ofGASB Statement No. 68, "Accounting and Financial Reporting for Pensions."
103
EXHIBIT J-1
2016 2017 2018 2019
$ 14,261,400 $ 13,705,490 $ 12,640,594 $ 11,934,121 1,697,976 1,407,399 1,292,183 1,294,684
(6,367,405) (6,101,114) (3,954,634) (2,340,377) $ 9,591,971 $ 9,011,775 $ 9,978,143 $ 10,888,428
$ 173,146 $ 187,318 $ 188,389 $ 197,397
831,023 1,184,767 1,427,013 1,620,068 $ 1,004,169 $ 1,372,085 $ 1,615,402 $ 1,817,465
$ 14,434,546 $ 13,892,808 $ 12,828,983 $ 12,131,518
1,697,976 1,407,399 1,292,183 1,294,684
(5,536,382) (4,916,347) (2,527,621) (720,309) $ 10,596,140 $ 10,383,860 $ 11,593,545 $ 12,705,893

EXHffiiTJ-2 CLARK PUBLIC SCHOOL DISTRICT
CHANGES IN NET POSITION LAST TEN FISCAL YEARS
(Unaudited) (accrual basis of accounting)
Fiscal Year Ended June 30, 2010 2011 2012 2013 2014 2015 2016 2017 2018 2019
Expenses Governmental Activities
Instruction $ 20,965,188 Regular Instruction $ 16,401,047 $ 17,411,882 $ 17,902,025 $ 17,581,785 $ 20,404,457 $ 21,756,514 $ 23,893,780 $ 24,437,501 $ 22,759,140 Special Education Instruction 4,254,388 4,204,766 4,647,130 4,504,738 6,003,305 6,842,631 7,230,657 6,884,916 6,547,210 Other Instruction 786,089 655,131 752,665 641,301 709,751 832,791 926,423 785,113 804,764 School Sponsored Activities and Athletics 853,285 965,481 865,920 902,524 953,377 932,447 1,069,420 943,095 881,274
Support Services: Tuition 1,659,492 Student and Instruction Related Services 5,953,039 5,678,385 5,394,922 5,218,949 5,350,090 5,440,909 5,603,858 6,279,967 5,504,080 5,259,948 General Administration Services 845,029 993,837 1,155,219 947,143 816,658 781,746 643,497 979,981 946,276 857,466 School Administrative Services 1,232,782 1,568,620 1,653,477 1,969,532 1,987,484 2,233,308 2,211,194 2,222,532 2,850,334 2,883,591 Central and Other Support Services 432,399 691,176 573,788 629,245 628,734 720,876 844,452 662,608 557,236 494,018 Plant Operations and Maintenance 3,148,845 3,198,335 3,160,128 2,918,305 3,022,501 3,100,548 3,405,988 3,286,336 3,185,847 3,438,736 Pupil Transportation Services 775,049 789,990 859,168 942,558 866,858 1,037,189 1,468,123 1,446,708 1,149,796 1,241,640
Interest On Long-Tenn Debt 773,494 730,798 697,192 642,044 592,530 552,422 511,849 473,902 438,449 418,586 Unallocated Depreciation and Amortization
Total Governmental Activities Expenses 35,785,317 35,945,950 36,731,154 37,435,516 36,895,203 41,937,888 45,053,344 48,472,314 47,682,643 45,586,373
Business-Type Activities: Food Service 650,372 572,364 658,295 649,233 631,893 628,176 664,892 656,503 698,774 679,286 Before and After School Program 274,635 320,664 411,722 272,655 319,264 326,787 471,833 562,809
Total Business-Type Activities Expense 650,372 572,364 932,930 969,897 1,043,615 900,831 984,156 983,290 1,170,607 1,242,095 Total District Expenses 36,435,689 $ 36,518,314 $ 37,664,084 $ 38,405,413 $ 37,938,818 $42,838,719 $ 46,037,500 $ 49,455,604 $ 48,853,250 $ 46,828,468
Program Revenues Governmental Activities:
Charges For Services: Instruction $ 1,943,873 2,097,387 $ 2,365,732 $ 2,511, 730 $ 2,738,802 $ 2,196,195 $ 1,748,491 $ 1,922,961 $ 1,867,529 $ 1,541,710 Pupil Transportation 107,892 !39,320 201,733 136,081 213,134 119,066 125,198
Operating Grants And Contributions 348,927 3,622,331 4,690,598 5,455,611 4,981,443 8,925,719 10,685,784 13,688,326 14,411,728 11,473,904 Capital Grants And Contributions 268,431 157,877 31,545 3,320 65,133 204,065 216,428 243,180
Total Governmental Activities Program Revenues 2,561,231 5,985,487 7,227,195 8,169,074 7,859,646 11,400,181 12,757,406 15,952,913 16,279,257 13,258,794
Business-Type Activities. Charges For Services
Food Service 464,543 $ 483,801 $ 530,527 $ 498,124 $ 526,372 $ 532,264 $ 563,073 $ 582,632 $ 620,305 $ 617,258 Before and After School Program 324,759 441,487 496,257 547,455 595,433 632,477 657,323 695,124
Operating Grants And Contributions 82,976 113,018 !37,181 111,885 115,104 121,130 125,639 135,109 133,154 115,738 Capital Grants And Contributions 160,000
Total Business Type Activities Program Revenues 707,519 596,819 992,467 1,051,496 1,137,733 1,200,849 1,284,145 1,350,218 1,410,782 1,428,120 Total District Program Revenues $ 3,268,750 $ 6,582,306 $ 8,219,662 $ 9,220,570 $ 8,997,379 $ 12,601,030 $ 14,041,551 $ 17,303,131 $ 17,690,039 $ 14,686,914
Net (Expense)/Revenue Governmental Activities $ (33,224,086) $(29,960,463) $(29,503,959) $(29,266,442) $(29,035,557) $(30,537,707) $(32,295,938) $(32,519,401) $(31,403,386) $ (32,327,579) Business-Type Activities 57,147 24,455 59,537 81,599 94,118 300,018 299,989 366,928 240,175 186,025 Total District-Wide Net Expense $ (33,166,939) $(29,936,008) $(29,444,422) $(29,184,843) $ (28,941,439) $(30,237,689) $ (31,995,949) $(32,152,473) $(31,163,211) $ (32, 141,554)
104

EXHffiiTJ-2 CLARK PUBLIC SCHOOL DISTRICT
CHANGES IN NET POSITION LAST TEN FISCAL YEARS
(Unaudited) (accrual basis of accounting)
Fiscal Year Ended June 30, 2010 2011 2012 2013 2014 2015 2016 20!7 2018 2019
General Revenues And Other Changes In Net Position Governmental Activities:
Property Taxes Levied For General Purposes $ 26,790,200 $ 27,058,102 $ 27,283,102 $ 27,490,840 $ 27,816,331 $ 28,206,800 $ 28,770,935 $ 30,188,919 $ 30,792,697 $ 31,694,372 Property Taxes Levied For Debt Service 863,709 1,463,709 1,525,942 1,537,009 1,405,790 1,426,782 1,410,881 1,387,532 1,374,532 1,355,032 State Aid, Unrestricted 5,387,583 30,400 28,630 27,796 2,196 2,268 2,257 2,265 24,143 2,159 Investment Earnings 39,387 19,712 11,161 10,436 5,859 7,121 6,362 6,145 15,861 Miscellaneous Income 584,635 643,374 96,830 156,159 216,947 168,741 104,701 120,701 162,521 186,301 Transfers (26,000) (40,000)
Total Governrnental Activities 33 665,514 29,215,297 28,919,665 29,182,240 29,447,123 29,811,712 30,295,136 31,705,562 32,369,754 33,237,864
Business-Type Activities: Investment Earnings $ 295 $ 362 $ 988 $ 3,142 $ 16,038 Transfers 26,000 40,000
Total Business-Type Activities 295 26,000 40,000 362 988 3,142 16,038 Total District-Wide $ 33,665,809 $ 29,215,297 $ 28,945,665 $ 29,222,240 $ 29,447,123 $ 29,811,712 $ 30,295,498 $ 31,706,550 $ 32,372,896 $ 33,253,902
Change In Net Position Governrnental Activities $ 441,428 $ (745,166) $ (584,294) $ (84,202) $ 411,566 $ (725,995) $ (2,000,802) $ (813,839) $ 966,368 $ 910,285 Business-Type Activities 57,442 24,455 85,537 121,599 94,118 300,018 300,351 367,916 243,317 202,063 Total District $ 498,870 $ (720,711) (498,757) $ 37,397 $ 505,684 $ (425,977) $ (I, 700,451) $ (445,923) $ 1,209,685 $ 1,112,348
105

CLARK PUBLIC SCHOOL DISTRICT FUNDBALANCES-GOVERNMENTALFUNDS
LAST TEN FISCAL YEARS (Unaudited)
(modified accrual basis of accounting)
Fiscal Year Ended June 30, 2010 2011 2012 2013 2014 2015
General Fund Reserved $ 982,473 Unreserved 475,786 Restricted $ 418,855 $ 712,592 $ 1,457,002 $ 1,171,226 $ 3,794,969 Cornrnitted 231,590 55,313 65,388 Assigned 120,163 359,919 289,893 261,068 256,514 Unassigned 479,516 475,325 441,671 2,405,555 552,381
Total General Fund $ 1,458,259 $ 1,018,534 $ 1,547,836 $ 2,420,156 $ 3,893,162 $ 4,669,252
All Other Governrnental Funds Unreserved, Reported In
Capital Projects Fund $ 582,121 Debt Service Fund (607,942)
Restricted $ 162,011 $ 162,011 $ 182,501 $ 99,959 $ 2,260
Total All Other Governrnental Funds $ (25,821) $ 162,011 $ 162,011 $ 182,501 $ 99,959 $ 2,260
Beginning with Fiscal Year 2011, the District implemented GASB Statement No. 54, "Fund Balance Reporting and Governmental Fund Type Definitions". The Statement provides more
clearly defmed fund balance categories to make the nature and extent of the constraints placed on a government's fund balance more transparent. This Statement established fund
balance classifications that comprise a hierarchy based primarily on the extent to which a government is bound to observe constraints imposed upon the use of the resources reported
in governmental funds. Reclassification of prior year fund balance amounts to comply with Statement No. 54 is not required
106
EXHIBIT J-3
2016 2017 2018 2019
$ 2,219,713 $ 2,890,007 $ 4,940,367 $ 6,362,468
188,840 91,987 15,343 127,245 381,794 528,288 515,945 523,608
$ 2,790,347 $ 3,510,282 $ 5,471,655 $ 7,013,321
$ 362,313 $ 71,736 $ 71,736 $ 71,737
$ 362,313 $ 71,736 $ 71,736 $ 71,737

EXHIBIT J-4
CLARK PUBLIC SCHOOL DISTRICT CHANGES IN FUND BALANCES- GOVERNMENTAL FUNDS
LAST TEN FISCAL YEARS (Unaudited)
(modified accrual basis of accounting)
Fiscal Year Ended June 30, 2010 2011 2012 2013 2014 2015 2016 2017 2018 2019
Revenues Property Tax Levy 27,279,408 28,521,811 28,809,044 29,027,849 29,222,121 29,633,582 30,181,816 31,576,451 $ 32,167,229 33,049,404
Tuition Charges 1,622,475 2,097,387 2,232,020 2,514,730 2,738,802 2,326,907 1,748,491 1,922,961 1,867,529 1,541,710
Transportation Fees 107,892 139,320 201,733 136,081 213,134 119,066 125,198
Interest Earnings 72,175 19,712 11,161 10,436 5,859 7,121 6,362 6,145 15,861 77,327
Miscellaneous 174,339 662,652 113,945 173,655 226,878 186,177 109,628 120,701 157,881 108,974
Intermediate Sources State Sources 8,120,637 3,025,295 3,895,265 4,751,893 4,345,993 4,807,241 5,477,457 5,888,692 6,403,101 7,217,413
Federal Sources 649458 766,035 810,721 714,018 631,035 638,565 709,566 690,851 556 198 642,237
Total Revenue 37,918,492 35,200,784 36,011,476 37,394,314 37,306,769 37,812,727 38,352,386 40,330,999 41,167,799 42,637,065
Expenditures Instruction 14,846,264
Regular Instruction 14,309,636 15,198,171 15,892,981 15,463,533 15,937,309 16,582,976 16,910,254 17,675,355 18,380,755
Special Education Instruction 4,251,339 4,188,235 4,656,410 4,505,192 5,509,495 5,915,696 5,961,945 5,923,023 6,115,670
Other Instruction 785,569 651,649 754,629 641,390 614,062 703,821 709,702 609,599 716,012
School Sponsored Activities and Athletics 852,518 960,996 867,820 902,620 956,124 917,527 1,014,810 869,592 858,767
Support Services Tuition 1,809,790
Student and Instruction Related Services 4,452,102 5,668,952 5,366,085 5,228,790 5,348,851 5,083,662 5,062,071 5,299,734 4,595,993 4,867,688
General Administration Services 963,949 993,380 1,152,338 815,196 816,702 782,594 638,992 951,709 896,437 849,109
School Administrative Services 859,405 1,552,544 1,633,925 1,885,112 1,891,765 1,925,942 1,909,819 1,742,520 2,270,268 2,586,848
Central and Other Support Services 432,733 690,573 570,854 630,646 628,807 723,102 832,222 620,155 497,186 477,494
Plant Operations And Maintenance 3,294,828 3,174,865 3,127,457 2,889,938 2,990,753 3,072,391 3,346,062 3,148,646 2,982,499 3,349,244
Student Transportation Services 1,002,165 789,795 858,139 943,053 866,879 1,037,589 1,435,137 1,388,859 1,128,489 1,220,130
Employee Benefits 4,427,129
On-BehalfTPAF and Pension Contributions 2,109,055
Cost of Issuance Capital Outlay 5,331,065 727,930 170,923 886,103 281,079 257,432 854,570 511,392 499,599 514,348
Debt Service: Principal 690,000 820,000 875,000 1,074,496 1,021,858 1,062,016 1,195,367 1,198,832 1,140,560 1,145,241
Interest And Other Charges 794,222 735,577 702,402 626,133 556,875 517,822 476,978 443,083 405,432 389,092
Cost of Issuance 133,038
Advanced Refunding Escrow 1,298,208 Total Expenditures 41,012 707 35,352,678 35,456,174 38,582,553 35,916,304 37,479,540 39,871,238 39,901,641 39,494,032 41,470,398
Excess (Deficiency) Of Revenues Over (Under) Expenditures (3,094,215) (151,894) 555,302 (1,188,239) 1,390,465 333,187 (1,518,852) 429,358 1,673,767 1,166,667
Other Financing Sources (Uses) Capital Lease/Lease Purchase Proceeds 689,803 345,204 287,606 375,000
Bond Proceeds 14,145,000
Premium on Refunding 920,246 Payment to Refunding Bond Escrow Agent (13,634,000) Transfers In 946 651,624 266,948
Transfers Out (15,946) (651,624) (26,000) (40,000) (266,948)
Total Other Financing Sources (Uses) (15,000) (26,000) 2,081,049 345,204 287,606 375,000
Net Change In Fund Balances (3,109,215) (151,894) 529,302 892,810 1,390,465 678,391 (1,518,852) 429,358 1,961,373 1,541,667
Debt Service As A Percentage Of Non capital Expenditures 4.16% 4.49"/o 4.47% 8.31% 4.43% 4.24% 4.29"/o 4.17% 3.96% 3.75%
* Noncapital expenditures are total expenditures less capital outlay.
107
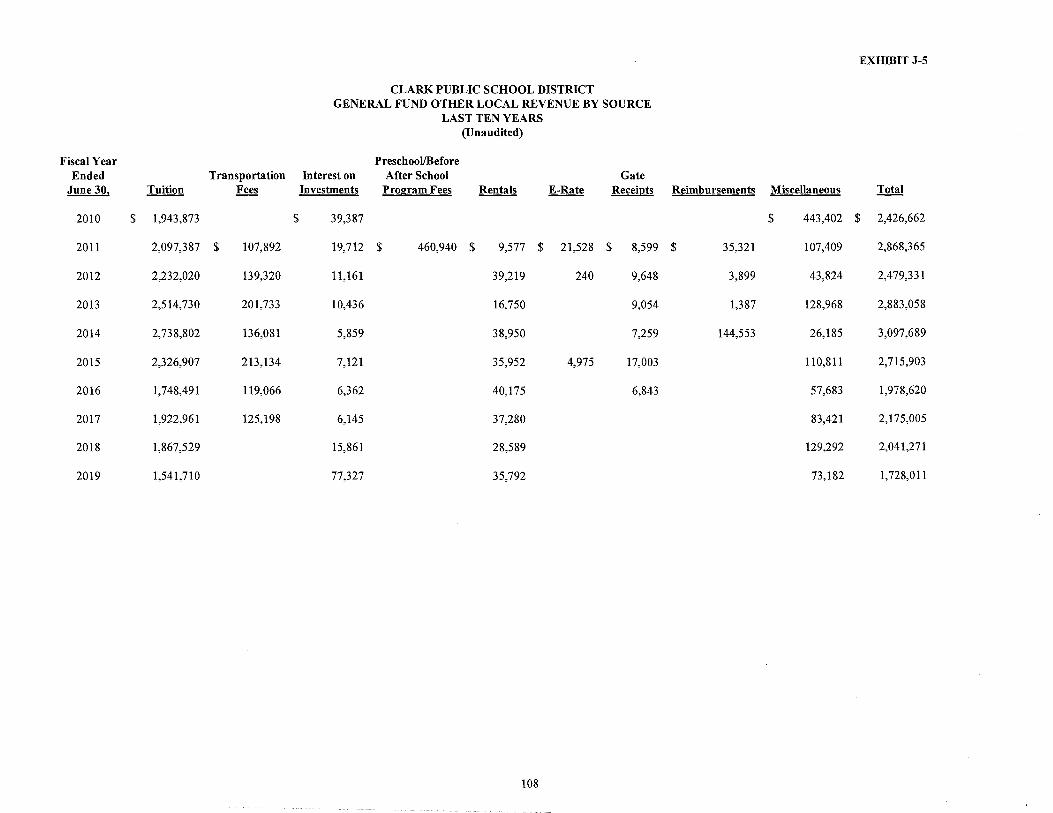
EXHffiiTJ-5
CLARK PUBLIC SCHOOL DISTRICT GENERAL FUND OTHER LOCAL REVENUE BY SOURCE
LAST TEN YEARS (Unaudited)
Fiscal Year Preschool/Before Ended Transportation Interest on After School Gate
June 30, Tuition Fees Investments Program Fees Rentals E-Rate Receipts Reimbursements Miscellaneous Total
2010 $ 1,943,873 $ 39,387 $ 443,402 $ 2,426,662
2011 2,097,387 $ 107,892 19,712 $ 460,940 $ 9,577 $ 21,528 $ 8,599 $ 35,321 107,409 2,868,365
2012 2,232,020 139,320 11,161 39,219 240 9,648 3,899 43,824 2,479,331
2013 2,514,730 201,733 10,436 16,750 9,054 1,387 128,968 2,883,058
2014 2,738,802 136,081 5,859 38,950 7,259 144,553 26,185 3,097,689
2015 2,326,907 213,134 7,121 35,952 4,975 17,003 110,811 2,715,903
2016 1,748,491 119,066 6,362 40,175 6,843 57,683 1,978,620
2017 1,922,961 125,198 6,145 37,280 83,421 2,175,005
2018 1,867,529 15,861 28,589 129,292 2,041,271
2019 1,541,710 77,327 35,792 73,182 1,728,011
108

Year Ended December
31, Vacant Land Residential Farm Reg.
2010 $ 8,652,100 $ 582,437,000
2011 5,038,100 583,858,100
2012 5,198,000 585,885,700 2013 8,244,500 586,452,800
2014 13,999,600 587,465,700 2015 11,044,900 587,334,700 2016 5,402,800 591,176,900
2017 5,394,500 594,456,200 2018 5,704,900 599,609,500
2019 4,860,200 602,056,500
Source: County Abstract ofRatables
a Tax rates are per $100
CLARK PUBLIC SCHOOL DISTRICT
ASSESSED VALUE AND ACTUAL VALUE OF TAXABLE PROPERTY LAST TEN FISCAL YEARS
(Unaudited)
Total Assessed
Qfarm Commercial Industrial Apartment Value Public Utilities
$ 87,990,500 $ 30,747,100 $ 18,177,200 $ 728,003,900 $ 443,172
91,706,600 29,996,800 18,177,200 728,776,800 406,766
91,504,900 29,996,800 16,357,700 728,943,100 403,287 89,972,000 27,317,700 16,357,700 728,344,700 383,409 89,165,200 22,526,500 16,357,700 729,514,700 285,698 89,071,000 22,526,500 26,407,700 736,384,800 300,902
115,793,400 22,574,700 16,357,700 751,305,500 287,491 100,864,100 22,574,700 33,457,700 756,747,200 282,304 100,799,200 22,139,700 33,457,700 761,711,000 323,097 101,112,000 22,884,200 33,457,700 764,370,600 334,121
109
EXHffiiTJ-6
Estimated Actual Total Direct
Net Valuation (County Equalized School Tax
Taxable Value) Rate a
$ 728,447,072 $ 2,658,376,917 $ 3.810
729,183,566 2,553,865,130 3.857
729,346,387 2,555,136,809 3.962
728,728,109 2,434,456,344 3.997
729,800,398 2,378,232,819 4.029
736,685,702 2,411,074,575 4.123
751,592,991 2,528,913,159 4.109
757,029,504 2,547,205,599 4.210
762,034,097 2,695,557,471 4.280
764,704,721 2,738,913,757 4.363

CLARK PUBLIC SCHOOL DISTRICT DIRECT AND OVERLAPPING PROPERTY TAX RATES
LAST TEN FISCAL YEARS (Unaudited)
(rate per $100 of assessed value)
Direct Rate Overlapping Rates
Total Direct and
EXHIBIT J-7
Clark School Clark Overlapping District Township County Tax Rate
Assessment Year
2010 $ 3.810 $ 1.939 $ 1.399 $ 7.148
2011 3.857 2.026 1.494 7.377 2012 3.962 2.046 1.605 7.613 2013 3.997 2.086 1.664 7.747 2014 4.029 2.124 1.702 7.855 2015 4.123 2.145 1.756 8.024 2016 4.109 2.175 1.822 8.106 2017 4.210 2.342 1.864 8.416 2018 4.280 2.377 1.896 8.553 2019 4.363 2.419 1.875 8.657
Source: Municipal Tax Assessor
110

Taxpayer
Clark Developers LLC Clark Commons 100 Walnut LLC L'Oreal USA SID Inc. Clark 1709 LLC Target Corp. Lexington Village Holiday Clark LLC Mastertaste Inc. Halsted Realty, LLC
CLARK PUBLIC SCHOOL DISTRICT PRINCIPAL PROPERTY TAXPAYERS
CURRENT YEAR AND NINE YEARS AGO (Unaudited)
2019 Taxable % ofTotal Assessed District Net
Value Assessed Value
$ 17,100,000 2.24% 14,927,000 1.95% 8,512,500 1.11% 5,840,800 0.76% 5,647,500 0.74% 5,443,200 0.71% 4,707,800 0.62% 4,656,800 0.61% 3,882,200 0.51% 3,378,100 0.44%
$ 74,095,900 9.69%
Source: District CAFR & Municipal Tax Assessor
111
EXHffiiTJ-8
2010 Taxable % ofTotal Assessed District Net
Value Assessed Value
NOT AVAILABLE
$ 0.00%

CLARK PUBLIC SCHOOL DISTRICT PROPERTY TAX LEVIES AND COLLECTIONS
LAST TEN FISCAL YEARS (Unaudited)
Collected within the Fiscal Year of the Levy
Year Ended June 30,
Taxes Levied for the Fiscal Year
Percentage of Amount Levy
2010 $ 27,653,909 $ 27,653,909 100.00% 2011 28,521,811 28,521,811 100.00% 2012 28,809,044 28,809,044 100.00% 2013 29,027,849 29,027,849 100.00% 2014 29,222,121 29,222,121 100.00% 2015 29,633,582 29,633,582 100.00% 2016 30,181,816 30,181,816 100.00% 2017 31,576,451 31,576,451 100.00% 2018 32,167,229 32,167,229 100.00% 2019 33,049,404 33,049,404 100.00%
Source: School District's Financial Statements
112
EXHIBIT J-9
Collections in Subsequent
Years

Fiscal Year Ended June
30,
2010 $ 2011
2012
2013 2014
2015
2016
2017
2018
2019
CLARK PUBLIC SCHOOL DISTRICT RATIOS OF OUTSTANDING DEBT BY TYPE
LAST TEN FISCAL YEARS (UNAUDITED)
Governmental Activities
General Capital Leases I Obligation Interlocal
Bonds Agreements Total District Population
17,948,000 $ 17,948,000 14,775 17,128,000 ' 17,128,000 14,829 16,253,000 16,253,000 14,893 15,820,000 $ 559,307 16,379,307 14,976 14,930,000 427,449 15,357,449 15,141 14,005,000 635,637 14,640,637 15,378 13,060,000 385,270 13,445,270 15,777 12,110,000 136,438 12,246,438 15,868 11,135,000 258,484 11,393,484 15,943 10,160,000 463,243 10,623,243 15,943
Source: District Records
(E) - Estimate
113
EXHIBIT J-10
Per Capita
$ 1,215
1,155
1,091
1,094
1,014
952
852
772 715
E 666

Fiscal Year Ended June
30,
2010
2011 2012
2013
2014
2015 2016
2017
2018
2019
CLARK PUBLIC SCHOOL DISTRICT RATIOS OF NET GENERAL BONDED DEBT OUTSTANDING
LAST TEN FISCAL YEARS (UNAUDITED)
General Bonded Debt Outstanding
Net General Percentage of General Bonded Debt Actual Taxable
Obligation Bonds Deductions Outstanding Value ofProperty
$ 17,948,000 $ 17,948,000 2.46%
17,128,000 17,128,000 2.35%
16,253,000 16,253,000 2.23% 15,820,000 15,820,000 2.17% 14,930,000 14,930,000 2.05% 14,005,000 14,005,000 1.90% 13,060,000 13,060,000 1.74% 12,110,000 12,110,000 1.60% 11,135,000 11,135,000 1.46% 10,160,000 10,160,000 1.33%
Source: District Records
114
EXHIBIT J-11
Per Capita
$ 1,215
1,155
1,091
1,056
986
911 828
763 698
637

CLARK PUBLIC SCHOOL DISTRICT DIRECT AND OVERLAPPING GOVERNMENTAL ACTIVITIES DEBT
AS OF DECEMBER 31, 2018 (UNAUDITED)
MUNICIPAL DEBT
Clark Public School District (As of June 30, 20 19)
Township of Clark- Utility (1)
Township of Clark (1)
Total Direct Debt
OVERLAPPING DEBT APPORTIONED TO THE MUNICIPALITY
Union County: · County of Union (A)
Rahway Valley Sewerage (B)
Total Overlapping Debt
EXHIBIT J-12
$
Total Debt
10,160,000
400,000
17,859,968
28,419,968
27,661,182 14,963,338
42,624,520
Total Direct and Overlapping Outstanding Debt $ 71,044,488
Sources:
(A) The debt for this entity was apportioned by dividing the Municipality's
2018 equalized value by the total 2018 equalized value for Union County
(B) Overlapping Debt was computed based upon municipal flow to the Authority
(1) Township of Clark 2018 Annual Debt Statement
(2) Union County 2018 Annual Debt Statement
115

Equalized valuation basis 2018 $ 2,728,191,261 2017 2,676,856,031 2016 2,616,877,395
$ 8,021,924,687
$ 2,673,974,896
s I 06,958,996 10,160,000
$ 96,798,996
CLARK PUBLIC SCHOOL DISTRICT LEGAL DEBT MARGIN INFORMATION
LAST TEN FISCAL YEARS
Fiscal Year Ended June 30,
2010 2011 2012
Debt limit $ 109,258,808 $ 105,960,204 $ 102,295,500
Total net debt applicable to limit 17,948,000 17,128,000 16,253,000
Legal debt margin s 91,310,808 $ 88,832,204 $ 86,042,500
Total net debt applicable to the limit as a percentage of debt limit 16.43% 16.16% 15.89%
Source: Equalized valuation bases were obtained from the Annual Report of the State of New Jersey, Department of Treasury, Division of Taxation
2013 2014 2015
$ 99,524,920 $ 97,181,669 $ 95,016,873
15,820,000 14,930,000 14,005,000
s 83,704,920 s 82,251,669 $ 81,011,873
15.90% 15.36% 14.74%
116
EXHIBIT J-13
2016 2017 2018 2019
s 95,913,079 $ 99,468,015 $ 103,619,667 $ 96,798,996
13,060,000 12,110,000 11,135,000 10,160,000
$ 82,853,079 s 87,358,015 s 92,484,667 $ 86,638,996
13.62% 12.17% 10.75% 10.50%

CLARK PUBLIC SCHOOL DISTRICT DEMOGRAPHIC AND ECONOMIC STATISTICS
LAST TEN FISCAL YEARS (UNAUDITED)
Year Ended County Per December Capita Personal
31, Population Income
2010 14,775 $ 50,990 2011 14,829 52,990 2012 14,893 54,873 2013 14,976 55,681 2014 15,141 58,571 2015 15,378 60,584 2016 15,777 61,624 2017 15,868 64,413 2018 15,943 N/A 2019 15,943 E N/A
Source:
United States Bureau of Census, Population Division estimates
EXHIBIT J-14
Unemployment Rate
4.5% 4.5% 4.5% 6.1% 5.5% 4.8% 4.1% 3.8% 3.3% NIA
Revisions to historical data, per capita income: US Bureau of Economic Analysis
E- Estimate
N/ A - Not Available
117

Employer
CLARK PUBLIC SCHOOL DISTRICT PRINCIPAL EMPLOYERS
CURRENT YEAR AND NINE YEARS AGO (UNAUDITED)
2019
Employees
% ofTotal
Municipal
Employment
INFORMATION IS NOT AVAILABLE
118
Employees
EXHIBIT J-15
2010
% ofTotal Municipal
Employment

EXHIBIT J-16 CLARK PUBLIC SCHOOL DISTRICT
FULL-TIME EQUN ALENT DISTRICT El\1PLOYEES BY FUNCTION/PROGRAM LAST TEN FISCAL YEARS
2010 2011 2012 2013 2014 2015 2016 2017 2018 2019 Function/Program
Instruction
Regular 184 184 162 164 156 155 156 158 160 155 Special education 51 51 51 53 53 44 45 43 48 49
Support Services:
Student & instruction related services 24 24 52 68 64 78 75 99 71 70 General administrative services 3 3 3 3 2 3 4 3 4 3 School administrative services 14 14 16 16 16 14 14 13 16 15 Business administrative services 5 5 6 5 6 6 6 6 5 4 Plant operations and maintenance 6 6 11 11 10 9 10 11 8 10
Total 287 287 301 320 307 309 310 333 312 306
Source: District Records
119

CLARK PUBLIC SCHOOL DISTRICT OPERATING STATISTICS LAST TEN FISCAL YEARS
(UNAUDITED)
Pupil/Teacher Ratio
Fiscal Operating Cost Per Percentage Teaching Year Enrollment a Expenditures b Pupil c Change Staff Elementary
2010 2,354 $ 34,628,590 $ 14,711 -2.00% 199.0 1:23 2011 2,359 33,069,171 14,018 -4.71% 206.0 1:23 2012 2,299 33,707,849 14,662 4.59% 185.0 1:14 2013 2,270 34,564,575 15,227 3.85% 186.0 1:13 2014 2,311 34,056,492 14,737 -3.22% 175.0 1:15 2015 2,348 35,642,270 15,180 3.01% 199.0 1:15 2016 2,258 37,344,323 16,539 8.95% 201.0 1:13 2017 2,225 37,748,334 16,966 2.58% 201.0 1:13 2018 2,176 37,564,907 17,263 1.75% 208.0 1:24 2019 2,211 39,421,717 17,830 3.28% 204.0 1:16
Source: District records
Note: a Enrollment based on annual October district count b Operating expenditures equal total expenditures less debt service and capital outlay c Cost per pupil represents operating expenditures divided by enrollrnent
120
Middle Senior High School School
1:24 N/A 1:24 N/A 1:11 1:12 1:12 1:12
1:12 1:12
1:12 1:12 1:11 1:12 1:11 1:09 1:15 1:10 1:13 1:10
EXHIBIT J-17
Percentage Average Daily Average Daily Change in Student
Enrollment Attendance Average Daily Attendance (ADE) (ADA) Enrollment Percentage
2,334 2,240 0.11% 95.97% 2,333 2,234 0.00% 95.76% 2,324 2,237 -0.39% 96.26% 2,307 2,210 -0.73% 95.80% 2,334 2,241 1.17% 96.02%
2,336 2,242 0.09% 95.98% 2,230 2,145 -4.54% 96.19% 2,207 2,122 -1.03% 96.15%
2,170 2,270 -1.68% 104.61% 2,223 2,127 2.44% 95.68%

EXHIBIT J-18
CLARK PUBLIC SCHOOL DISTRICT SCHOOL BUILDING INFORMATION
LAST TEN FISCAL YEARS
2010 2011 2012 2013 2014 2015 2016 2017 2018 2019 District Building
Elementary Valley Road Elementary School
Square Feet 40,612 40,612 40,612 40,612 40,612 40,612 40,612 40,612 40,612 40,612
Emo!Jment 426 427 436 410 446 440 445 452 460 482
Frank K. Hehnly Elementary School
Square Feet 45,497 45,497 45,497 45,497 45,497 45,497 45,497 45,497 45,497 45,497
Emollment 505 520 501 505 526 533 540 540 563 545
Middle School Carl H. Kumpf
Square Feet 74,812 74,812 74,812 74,812 74,812 74,812 74,812 74,812 74,812 74,812
Emollment 539 533 531 536 527 513 499 505 482 505
High School Arthur L. Johnson
Square Feet 192,825 192,825 192,825 192,825 192,825 192,825 192,825 192,825 192,825 192,825
Emollment 831 815 809 816 798 795 774 728 671 675
Number of Schools at June 30, 2019
Elementary = 2
Middle School = I High School = I
Source: District records
121

Undistributed Expenditures - Required
Maintenance for School Facilities
11-000-261-XXX
School Facilities
Frank K. Hehnly Elementary
Valley Road Elementary
Carl H. KumpfM.S.
Arthur L. Johnson H.S. Other Facilities
Total School Facilities
$
$
2007
102,972 $ 114,494 154,224
461,558
833,248 $
CLARK PUBLIC SCHOOL DISTRICT GENERAL FUND
SCHEDULE OF REQUffiED MAINTENANCE FOR SCHOOL FACILITIES LAST TEN YEARS
(UNAUDITED)
2010 2011 2012 2013 2014 2015
20,570 $ 98,671 $ 174,656 $ 90,196 $ 116,835 $ 101,436 9,738 88,076 151,550 80,512 121,642 90,545
37,871 162,247 149,313 148,312 121,471 166,795 249,228 418,187 366,724 382,268 298,960 429,908 650,299
967,706 $ 767,181 $ 842,243 $ 701,288 $ 658,908 $ 788,684
122
EXHIBIT J-19
2016 2017 2018 2019
$ 113,744 $ 65,655 $ 48,752 $ 59,681
101,532 55,554 41,251 53,273
187,033 106,058 78,753 98,135
482,071 277,770 322,723 252,938
$ 884,380 $ 505,037 $ 491,479 $ 464,027

Company
CLARK PUBLIC SCHOOL DISTRICT
INSURANCE SCHEDULE AS OF JUNE 30, 2019
(Unaudited)
Type of Coverage
School Package Policy:
Property
Blanket Building & Contents
Blanket Extra Expense
Comprehensive General Liability
Bodily Injury and Property Damage
Employee Benefits Liability
Automobile Liability
Bodily Injury and Property Damage
Uninsured Motorist - Private Passenger
School Leaders Errors and Omission Liability - NJSIG
Surety Bonds:
Workers Compensation
Student Accident - Market
High School Football
Public Employee Dishonesty with Faithful
Performance
Treasurer
Board Secretary/Business Administrator
Source: District Records
123
$
EXHIBIT J-20
Coverage Deductible
73,063,808 5,000
5,000,000
1,000,000
1,000,000
1,000,000
1,000,000
1,000,000 10,000
2,000,000 Each Accident/ Each Employee
5,000,000
250,000 1,000
250,000 1,000 250,000 1,000

SINGLE AUDIT SECTION

LERCH, VINCI & HIGGINS,LLP
DIETER 1'. LERCH, CPA, RMA. PSA
GARY J. VINCI, CPA, RMA, PSA
GARY W. HIGGINS. CPA. RMA. PSA
JEFFREY C. BLISS. CPA. RMA, PSA
PAUl. J. LERCH, CPA, RMA, PSA
DONNA L. JAPHET, CPA, PSA
JULIUS ll. CONSONJ, CPA, PSA
ANDREW D. PA RENTE, CPA, RMA, PSA
CERTIFIED PUBLIC ACCOUNTANTS REGISTERED MUNICIPAL ACCOUNTANTS EXHIBITK-1
ELIZABETH A. SHICK. CPA. RMA, PSi\
ROBERT W. HAAG, CPA. PSA
DEBORAH K. LERCH. CPA, PSA
RALPH M. PICONE. CPA. RMA. PSA
DEBRA GOLLE, CPA
MARK SACO. CPA
SHERYL M. LEIDIG, CPA, PSA
ROBE!U LERCH. CPA
CHRIS SOliN, CPA
REPORT ON INTERNAL CONTROL OVER FINANCIAL REPORTING AND ON COMPLIANCE AND OTHER MATTERS
BASED ON AN AUDIT OF FINANCIAL STATEMENTS PERFORMED IN ACCORDANCE WITH GOVERNMENT AUDITING STANDARDS
Honorable President and Members of the Board of Education Clark Public School District Clark, New Jersey
INDEPENDENT AUDITOR'S REPORT
We have audited, in accordance with the auditing standards generally accepted in the United States of America; the standards applicable to financial audits contained in Government Auditing Standards issued by the Comptroller General of the United States and audit requirements prescribed by the Office of School Finance, Department of Education, State of New Jersey, the financial statements of the governmental activities, the business-type activities, each major fund, and the aggregate remaining fund information of the Clark Public School District as of and for the fiscal year ended June 30, 20 19 and the related notes to the financial statements, which collectively comprise the Clark Public School District's basic financial statements and have issued our report thereon dated December 2, 2019.
Internal Control Over Financial Reporting
In planning and performing our audit of the financial statements, we considered the Clark Public School District's internal control over financial reporting (internal control) to determine the audit procedures that are appropriate in the circumstances for the purpose of expressing our opinions on the financial statements but not for the purpose of expressing an opinion on the effectiveness of the Clark Public School District' s internal control. Accordingly, we do not express an opinion on the effectiveness of the Clark Public School District's internal control.
A deficiency in internal control exists when the design or operation of a control does not allow management or employees, in the normal course of performing their assigned functions, to prevent, or detect and correct, misstatements on a timely basis. A material weakness is a deficiency, or a combination of deficiencies, in internal control, such that there is a reasonable possibility that a material misstatement of the entity's financial statements will not be prevented, or detected and corrected on a timely basis. A significant deficiency is a deficiency, or a combination of deficiencies, in internal control that is less severe than a material weakness, yet important enough to merit attention by those charged with governance.
17- 17 ROUTE 208• FAIR LAWN, NJ 0741 0 • TELEf~ffNE (201) 79 1-71!10 • FACSIMILE (201) 79 1-3035
WWW.LVHCPA.COM

Our consideration of internal control was for the limited purpose described in the frrst paragraph of this section and was not designed to identify all deficiencies in internal control that might be material weaknesses or significant deficiencies. Given these limitations, during our audit we did not identify any deficiencies in internal control that we consider to be material weaknesses. However, material weaknesses may exist that have not been identified.
Compliance and Other Matters
As part of obtaining reasonable assurance about whether the Clark Public School District's financial statements are free from material misstatement, we performed tests of its compliance with certain provisions of laws, regulations, contracts, and grant agreements, noncompliance with which could have a direct and material effect on the determination of financial statement amounts. However, providing an opinion on compliance with those provisions was not an objective of our audit, and accordingly, we do not express such an opinion. The results of our tests disclosed no instances of noncompliance or other matters that are required to be reported under Government Auditing Standards and audit requirements as prescribed by the Office of School Finance, Department of Education, State ofNew Jersey.
However, we noted certain matters that are not required to be reported under Government Auditing Standards that we reported to management of the Clark Public School District in a separate report entitled, "Auditor's Management Report on Administrative Findings- Financial, Compliance and Performance" dated December 2, 2019.
Purpose of this Report
The purpose of this report is solely to describe the scope of our testing of internal control and compliance and the results of that testing, and not to provide an opinion on the effectiveness of the Clark Public School District's internal control or on compliance. This report is an integral part of an audit performed in accordance with Government Auditing Standards in considering the Clark Public School District's internal control and compliance. Accordingly, this communication is not suitable for any other purpose.
Fair Lawn, New Jersey December 2, 2019
125
LERCH, VINCI & HIGGINS, LLP Certified Public Accountants Public School Accountants
Andrew D. Parente Public School Accountant PSA Number CS00224600

LERCH, VINCI & HIGGINS,LLP
DIETER 1'. LERCH, CPA, RMA. PSA
GARY J. VINCI, CPA, RMA, PSA
GARY W. HIGG INS. CPA. RMA. PSA
JEFFREY C. BLISS. CPA. RMA. PSA
PAULJ. LERCH, CPA, RMA, PSA
DONNA L. JAPHET, CPA, PSA
JULIUS ll. CONSONJ. CPA. PSA
ANDREW D. PARENTE, CPA, RMA, PS A
CERTIFIED PUBLIC ACCOUNTANTS REGISTERED MUNICIPAL ACCOUNTANTS
EXHIBITK-2
ELIZABETH A. SHICK. CPA, RMA, PSA
ROBERT W. HAAG. CPA, PSA
DEBORAH K. LERCH. CPA, PSA
RALPH M. PICONE. CPA. RMA. PSA
DEBRA GOLLE. CPA
MARK SACO. CPA
SHERYL M. LEIDIG, CPA. PSA
ROBE\n' LERCH, CPA
CHRIS SOHN, CPA
REPORT ON COMPLIANCE FOR EACH MAJOR FEDERAL AND STATE PROGRAM; REPORT ON INTERNAL CONTROL OVER COMPLIANCE; AND REPORT ON SCHEDULE
OF EXPENDITURES OF FEDERAL AWARDS REQUIRED BY THE U.S. UNIFORM GUIDANCE AND SCHEDULE OF EXPENDITURES OF STATE FINANCIAL ASSISTANCE REQUIRED BY NEW JERSEY OMB
CIRCULAR 15-08
Honorable President and Members of the Board ofEducation
Clark Public School District Clark, New Jersey
INDEPENDENT AUDITOR'S REPORT
Report on Compliance for Each Major Federal and State Program
We have audited the Clark Public School District's compliance with the types of compliance requirements described in the U.S. Office of Management and Budget (OMB) Compliance Supplement and the New Jersey OMB Circular 15-08 State Aid/ Grant Compliance Supplement that could have a direct and material effect on each of Clark Public School District's major federal and state programs for the fiscal year ended June 30, 2019. The Clark Public School District's major federal and state programs are identified in the summary of auditor's results section of the accompanying schedule of findings and questioned costs.
Management's Responsibility
Management is responsible for compliance with the requirements of federal and state statutes, regulations, and the terms and conditions of its federal awards and state financial assistance applicable to its federal and state programs.
Auditor's Responsibility
Our responsibility is to express an opinion on compliance for each of the Clark Public School District's major federal and state programs based on our audit of the types of compliance requirements referred to above. We conducted our audit of compliance in accordance with auditing standards generally accepted in the United States of America; the standards applicable to financial audits contained in Government Auditing Standards, issued by the Comptroller General of the United States; audit requirements as prescribed by the Office of School Finance, Department of Education, State of New Jersey; Title 2 U.S. Code of Federal Regulations Part 200, Uniform Administrative Requirements, Cost Principles, and Audit Requirements for Federal Awards (Uniform Guidance) and New Jersey OMB Circular 15-08, Single Audit Policy for Recipients of Federal Grants, State Grants and State Aid. Those standards, U.S . Uniform Guidance and New Jersey Circular require that we plan and perform the audit to obtain reasonable assurance about whether noncompliance with the types of compliance requirements referred to above that could have a direct and material effect on a major federal or state program occurred. An audit includes examining, on a test basis, evidence about the Clark Public School District's compliance with those requirements and performing such other procedures as we considered necessary in the circumstances.
17- 17 ROUTE 208• FAIR LAWN, NJ 07410 • TELEf~@NE (201) 791-71 00 • FACSIMILE (201) 791-3035
WWW.LVHCPA.COM

We believe that our audit provides a reasonable basis for our opinion on compliance for each major federal and state program. However, our audit does not provide a legal determination of the Clark Public School District's compliance.
Opinion on Each Major Federal and State Program
In our opinion, the Clark Public School District complied, in all material respects, with the types of compliance requirements referred to above that could have a direct and material effect on each of its major federal and state programs for the fiscal year ended June 30, 2019.
Other Matters
The results of our auditing procedures disclosed an instance of noncompliance, which is required to be reported in accordance with the U.S. Uniform Guidance and New Jersey OMB Circular 15-08 and which is described in the accompanying schedule of findings and questioned costs as item 2019-001. Our opinion on each major federal and state program is not modified with respect to these matters.
The Clark Public School District's response to the noncompliance finding identified in our audit is described in the accompanying schedule of findings and questioned costs. The Clark Public School District's response was not subjected to the auditing procedures applied in the audit of compliance and, accordingly, we express no opinion on the response.
Report on Internal Control Over Compliance
Management of the Clark Public School District is responsible for establishing and maintaining effective internal control over compliance with the types of compliance requirements referred to above. In planning and performing our audit of compliance, we considered the Clark Public School District's internal control over compliance with the types of requirements that could have a direct and material effect on each major federal and state program to determine the auditing procedures that are appropriate in the circumstances for the purpose of expressing an opinion on compliance for each major federal and state program and to test and report on internal control over compliance in accordance with the U.S. Uniform Guidance and New Jersey OMB Circular 15-08, but not for the purpose of expressing an opinion on the effectiveness of internal control over compliance. Accordingly, we do not express an opinion on the effectiveness of the Clark Public School District's internal control over compliance.
A deficiency in internal control over compliance exists when the design or operation of a control over compliance does not allow management or employees, in the normal course of performing their assigned functions, to prevent, or detect and correct, noncompliance with a type of compliance requirement of a federal or state program on a timely basis. A material weakness in internal control over compliance is a deficiency, or combination of deficiencies, in internal control over compliance, such that there is a reasonable possibility that material noncompliance with a type of compliance requirement of a federal or state program will not be prevented, or detected and corrected, on a timely basis. A significant deficiency in internal control over compliance is a deficiency, or a combination of deficiencies, in internal control over compliance with a type of compliance requirement of a federal or state program that is less severe than a material weakness in internal control over compliance, yet impmiant enough to merit attention by those charged with governance.
Our consideration of internal control over compliance was for the limited purpose described in the first paragraph of this section and was not designed to identifY all deficiencies in internal control over compliance that might be material weaknesses or significant deficiencies. We did not identify any deficiencies in internal control over compliance that we consider to be material weaknesses. However, material weaknesses may exist that have not been identified.
The purpose of this report on internal control over compliance is solely to describe the scope of our testing of internal control over compliance and the results of that testing based on the requirements of U.S. Uniform Guidance and New Jersey OMB Circular 15-08. Accordingly, this report is not suitable for any other purpose.
127

Report on Schedules of Expenditures of Federal Awards Required by the U.S. Uniform Guidance and Schedule of Expenditures of State Financial Assistance Required by New Jersey OMB Circular 15-08
We have audited the fmancial statements of the Clark Public School District, as of and for the fiscal year ended June 30, 2019 and have issued our report thereon dated December 2, 2019, which contained unmodified opinions on those fmancial statements. Our audit was conducted for the purpose of forming opinions on the fmancial statements that collectively comprise the basic fmancial statements. The accompanying schedule of expenditures of federal awards as required by the U.S. Uniform Guidance and schedule of expenditures of state financial assistance as required by New Jersey OMB Circular 15-08 are presented for purposes of additional analysis and are not a required part of the basic fmancial st~tements. Such information is the responsibility of management and was derived from and relates directly to the underlying accounting and other records used to prepare the basic fmancial statements. The information has been subjected to the auditing procedures applied in the audit of the fmancial statements and certain additional procedures, including comparing and reconciling such information directly to the underlying accounting and other records used to prepare the basic fmancial statements or to the basic financial statements themselves, and other additional procedures in accordance with auditing standards generally accepted in the United States of America. In our opinion, the schedule of expenditures of federal awards and schedule cif expenditures of state financial assistance are fairly stated in all material respects in relation to the basic fmancial statements as a whole.
Fair Lawn, New Jersey December 2, 2019
128
LERCH, VINCI & HIGGINS, LLP Certified Public Accountants Public School Accountants
~~ Andrew D. Parente Public School Accountant PSA Number CS00224600

Federal/Grantor/Pass-Through Grantor/
~
U.S. Department of Human Sen<ices Passed-through State Department of Education
General Fund Medicaid Assistance
Total General Fund
U.S. Department of Agriculture Passed-through State Department of Education
National School LuochProgram Cash Assistance Cash Assistance Non-Cash Assistance (Food Distribution) Non-Cash Assistance (Food Distribution)
Federnl CFDA
Nllmll<r
93.178
FAIN
Nllmll<r
1905NJ5MAP
10.555 191Nl304N1099 10.555 181NJ304N1099 10.555 19INJ304N1099 10.555 181Nl304Nl099
Total U.S. Department of Agriculture/Child Nutrition Cluster
U.S. Department of Education Passed-through State Department of Education
Special Revenue Fund IDEA Part B. Basic Regular IDEA Part B. Basic Regular IDEA Preschool IDEA Preschool Subtotal Special Education Cluster(IDEA)
ESEA Title I Title I TitleD A TitleD A Title Ill. Immigrant
Title Ill.lnunigranl
Title IV Title IV
Workforce Investment - WJA Workforce Investment- WIA
Total U.S. Department of Education
Total Federal Awards
84.027 84.027 84.173 84.173
H027Al80100 H027 A170 100 H173A180114 H173A170114
84.010 S010A180030 84.010 S010Al70030
84.367A S367Al80029 84.367A S367Al70029 84.365 S365Al80030 84.365 S365A170030 84.424 S424Al80031 84.424 S424A170031
17.259 17.259
11ris schedule w.lS not subject to Single Audit in accordance with U.S. Unifonn Guidance.
Seethe Accompanying Notes to the Scheduk of Expenditures ofFedcralAw.mis.
Grant or State Project Number
N/A
N/A N/A
N/A N/A
FT-19 FT-18 PS-19 PS-18
ESEA-19 ESEA-18 ESEA-19 ESEA-18 ESEA-19 ESEA-18 ESEA-19 ESEA-18
WIA--16 WIA-15
Award
.t.m=
7/1/18-6/30/19 s 15.511
7/1118-6/30/19 7/1/17-6/30/18 7/1118..()/30/19 7/1/17-6/30/18
67,753 85,509 41,056 44.659
528.212 510.822
21,988
CLARK PUBLIC SCHOOL DISTRICT
SCHEDULEOFEXPENDITURESOFFEDERALAWARDS
FOR THE FISCAL YEAR ENDED JUNE 30,2019
Ba]ang;June30 2018 (Accounts Unearned Due to
~ ~ .Qnm1Qr
(5,734)
Accounts Unearned Receivable Canyover - Revenue
Carryover - Cash
~
63,320
41,056
Accounts Deferred Refund of Budgetny Receivable Revenue Cancelled PriorYears'
~ MiY=m MiY=m ~ ~
67.753 5.734
(44,427) $ 44,427 486,790 492.790 (98.832) 44,427 44.427 (44,427) 54,405
(1,350) 1,350 21.988 21,988
7/1118-6/30/19 7/1117-6/30/18 711/18-6/30/19 7/1/17-6/30/18 21,255 ~~ ~~
7/1/18-6/30/19 7/1117-6/30/18 7/1/18-6/30/19 7/1117-6/30/18 7/1118-6/30/19 7/1/17-6/30/18 7/1/18-6/30/19
7/1/17-6/30/18
7/1/15-6/30/16 7/1114-6/30/15
64,840
65,343 33,433 33.347
1,880 3.790
10.000 10,000
30,000 30,000
(100.182) 45.777
(65.505) 65.343
(38.575) 23,392
223
(10,000) 8,535
(2,113) 4,100
~
(65,343) 65,343
(23392) 23,392
(8,535)
8.535
65.343 (65,343)
23,392 (23,392)
8,535 (8,535)
64,782 162
31,947
15,183 1.880
427 1,465
125,809
40.064 2,187
1.880
12,771
Balaoce June 30 2019
(Account Unearned
(4,433)
2,539
(85,849) 79,849
(1.350) 1.350
(65,401) 4.374
(24.878) 16.761
(18,108) 5,764
(2,113) 4,100
~
Due to
QmmQr
EXHlBITK-3
MEMO GAAP
Receivable
• $ (4,433)
• ___&ill.)
(6,000)
(61,027)
(8,117) 2,187 •
223 (12,344)
s <222.109) s 153.577 ~ _s __ -__ s __ ~ ~ ~ _s ___ !.___lJ!Z, _s ___ s t202.132) L.!l2d2l. ~ • ~
129

State GrantorfProaram Title
State Department of Educu.tion
General Fund:
Special Edl£ation Aid
Special Edl£ation Aid
Under Adequacy Aid Security Aid
Security Aid
Per Pupil Growth Aid P ARCC Readiness Prof Learning Comm Aid
Total State Aid Public Cluster
Transportation Aid Transportation Aid Nonpublic School TransportationAld Nonpublic School Transportation Aid
Total State Aid TrnnsportationC1uster
Extraordinary Aid Extraordinary Aid Reimbursed TPAF Social Security Contribution Reimbursed TPAF Social Security Contribution On-BebalfTP AF Pension Benefit Contribution 0n-Beha1fTPAF Pension NCGI Premium On-BehalfTPAF Long-TermDisabi1ity Ins. On-BehalfTPAF Post Retirermnt
Medical Contribution
Total General Fund
Special Revenue Fund
New Jersey Non-Public Aid
Auxiliary Services Compensatory Edu:ation
Co~tory Education Transportation
Grantor State Project Number
Grant
~
19-495...034-5120-089 7/1/18-6/30119
18-495..034-5120-089 7/1/17-6/30/18
18-495-034-5120..096 7/1/17-6/30/18 19-495..034-5120-084 7/1/18-6/30/19 18-495..034-5120-084 7/l/17-6/30/18
18-495-034-5120..097 711/17-6/30/18 18-495..034-5120-098 711/17-6/30/18 18-495-034-5120-101 711/17-6/30/18
19-495-034-5120-014 7/1/18-6/30/19 18-495..034-5120..014 7/1117-6/30/18 19-495-034-5120-014 7/1118-6130119 18-495-034-5120-014 711117-6/30118
19-495-034-5120-044 18-495-034-5120-044 19-495..034-5094..003 18-495-034-5094-003 19-495-034-5094-002 19-495-034-5094-004 19-495-034-5094-004
7/1/18-6/30/19 7/1/17-6/30/18 7/l/18-6/30/19 7/1117-6/30118 711/18-6130/19 711/18-6/30/19 7/l/18-6/30/19
19-495-034-5094-001 711118-6/30/19
19-100..034-5120-067 711118-6/30/19
18-100-034-5120-067 7/1/17-6/30/18
19-100-034-5120-068 7/l/18-6/30119
Horm lnstrn:tion 19-100-034-5120..067 7/1/18-6/30/19 Horrt lnstrn:tion 18-100-034-5120-067 7/1/17-6/30118 Total Non Public Aux. SciVice Aid (Chap. 192} Cluster
HaOOicapped Services
Examination and Classification Examination and Classification
Corrective Speech
Corrective Speech Supplermntary lns~r"L£tion
Supplermntary 1nstru:::tion
19-100-034-5120-066 7/1118-6/30/19 18-100..034-5120-066 711/17-6130/18
19-100-034-5120..066 7/1/18-6/30/19
18-100-034-5120-066 7/1/17-6/30/18 19-100~034-5120-066 711118-6/30/19
18-100-034-5120..066 711117-6/30/18
Total Non Public Hand. Service Ald (Chap. 193} Cluster
T C.'\tbook Aid Textbook Aid Nursing Services Nursing Services T echno1ogy Aid Technology Aid Security Security
Total Special Revenu!~Fund
19-100..034-5120-064 18-100-034-5120-064 19-100-034-5120-070 18-100..034-5120-070 19-100-034-5120-373 18-100..034-5120-373 19-100-034-5120-509 18-100-034-5120-509
7/1118-6/30/19 7/1/17~6/30/18
7/l/18-6/30/19 7/1117-6/30/18 7/1118-6/30119 7/1/17-6/30118 7/l/18-6/30119 7/1/17-6/30/18
See the Accompanying Notes to the Schedule of Expenditures of State Financial Assis1ance.
CLARK PUBLIC SCHOOL DISTRICf
SCHEDULE OFEXPENDITIJRES OF STATE FINANCIAL ASSISTANCE
FOR THE FlSCAL YEAR ENDEDJUNE30,2019
Award -976,707
976,707 $
2,264
55,181 40,859
21,890
21,890 21,760
256,592 61,158 24,940 26,175
214,175 83,306
1,135,758 1,131,309 2,850,053
59,659 2,574
1,319,841
Balance June 30 2018
(Accounts Unearned Due to
Receivable Revenue Qmo!Qr_
(87,333}
(202}
(3,653)
(1,957} (1,957} (1,946)
(97,048)
(5,469}
(26.175)
(31,644)
(83,300}
(58,232}
(270.230) -----=--
77
189,595
174,511 16,621
2,813 2,937 --~G~.9~3~7J ----~
(2.937} 77
38,238
78,248 28,570
23,213 49,164
52,335
33,482 36,046 60,819 63,826 22,572 24,346 94,050 49,350
(2,937)
6,923
4,285
11443
1,053
5,978
717
14
19,282
130
888,091 $
87.333
202
50,174 3,653
1.957 1,957 1.946
1,035,313
233,312 5,469
26.175
264,956
83,306 1,079,307
58,232 2,850,053
59,659 2,574
1.319.841
6,753.241
189,595
16,621
2.937 209.153
38,238
28,570
49,164
115.972
33,482
60,819
22.572
94,050
536,048
976,707
55,181
1,031,888
256,592
24.940
281,532
214,175
1,135,769
2,850,053 59,659
2,574
1,319,841
6,895,491
189.595
16,621
2,813
209,029
38,238
24,105
48,770
111.113
32,107
54,126
21,312
20.450
448,137
Refund of
Prior Years'
Balances
17
17
6,923
4,285
235
11.443
1,053
5,978
717
14
19,282
Accounts
Receivable Adju->tment
&lance June 30 2019
{Accounts Unearned Due to Receivable) ~ f.rum1ru:
(88,616)
(5,007)
(93,623}
(23,280)
(24,940}
(48,220)
(214,175)
(56,462)
(412,480) -----=--
(2,813)
(2,813)
(2,813)
4,465
394
4,859
1,375
6,693
1,260
73,600
87.787
• $ (24,940)
(24,940}
(56,462}
Cunrulative Total
Expenditures
976,707
55,181
1,031,888
256,592
24,940
281,532
214,175
1,135.769
2,850,053 59,659
2,574
1.319,841
--~(~8~1.W~~ --~6~.8~9~5,4~9~1
(2,813}
(2.813)
(2.813)
189,595
16,621
2,813
209,029
38,238
24.105
48,770
111,113
32,107
54,126
21,312
20,450
448,137

EXHIBIT K-4
CLARK PUBLIC SCHOOL DISTRICf
SCHEDULE OF EXPENDITURES OF STATE FlNANCIAL ASSISTANCE
FOR THE FISCAL YEAR ENDED JUNE 30,2019
.M<!m Bu1an!e Jl.ll"le ~0 2018 Refund of Accounts Ba}an!e Jl.ll"le 30 2019 Cumulative
Grantor State &ant Award (Accounts Unearned O.,to Cash Budgotary Prior Years' Receivable (Accounts Unearned O.,to GAAI' Total
State Grantor/Program Title ~ Em.ru! - Receivable Revenue Grantor Received ~ Balames ~ ~ Revenue Qrnn!m: Receivable ~
Enterprise Fund
National School Lunch (State Share) 19-100-010-3350-023 7/1/18-6/30/19 5.494 5,124 $ 5,494 (370) (370) $ 5,494
National School Lunch (State Share) 18-100-010-3350-023 7/l/17-6/30/18 6,193 $ (430) 430
Total Enterprise Fund (430) 5,124 5,494 430 (370) (370) 5,494
Total State Fmancial Assistance Subject to Single
Audit Detennination (273,597) 19,282 7,294,413 7,349.122 $ 19,282 430 (415,663) 87,787 . (84,585) 7.349,122
State Fmaneial Assistance
Not Subject to Single Audit Detennination
General Fund
On-BehalfTPAF Pension Benefit Contribution 19495-034-5094-002 711/18-6/30/19 2.850,053 (2,850,053) (2,850,053) (2,850,053)
On-BehalfTPAF Pension NCGI Premium 19-495-034-5094-004 7/1/18-6/30/19 59,659 (59,659) (59,659) (59,659)
On-BehalfTPAF Long-Term Disability Ins. 19-495-034-5094-004 7/l/18-6/30/19 2,574 (2,574) (2,574) (2,574)
On-BehalfTPAF Post Retire~nt Medical Contribution 19-495-034-5094-001 711/18-6/30/19 1,319,841 (1,319.841) ~1,319.841) 0.319,841)
Total State Fmaneial Assistance Utilized for Calculation to Dctcnnine Major Prognnm {273,597) $ 19.282 $ 3,062.286 $ 3,116.995 $ 19.282 $ 430 $ (415.663) 87,787 . $ £84,585) 3,116,995
See the Accompanying Notes to the Schedule ofExpenditurcs of State Finan!ial Assistance. 131

CLARK PUBLIC SCHOOL DISTRICT NOTESTOTHESCHEDULESOFEXPENDITURESOF FEDERAL AWARDS AND STATE FINANCIAL ASSISTANCE FOR THE FISCAL YEAR ENDED JUNE 30, 2019
NOTE 1 GENERAL
EXIDBIT K-5
The accompanying schedules present the activity of all federal and state financial assistance programs of the Clark Public School District. The Board of Education is defined in Note 1(A) to the Board's financial statements. All federal financial assistance received directly from federal agencies, as well as federal awards and state financial assistance passed through other government agencies is included on the schedule of expenditures of federal awards and state financial assistance.
NOTE 2 BASIS OF ACCOUNTING
The accompanying schedules are prepared and presented using the budgetary basis of accounting with the exception of programs recorded in the food service fund, which are presented using the accrual basis of accounting. These basis of accounting are described in Notes 1(C) to the Board's fmancial statements. The information in these schedules is presented in accordance with the requirements of Title 2 U.S. Code of Federal Regulations Part 200, Uniform Administrative Requirements, Cost Principles, and Audit Requirements for Federal Awards (U.S. Uniform Guidance) and New Jersey OMB Circular 15-08, "Single Audit Policy for Recipients of Federal Grants, State Grants, and State Aid". Therefore, some amounts presented in these schedules may differ from the amounts presented in, or used in the preparation of, the financial statements.
NOTE 3 RELATIONSHIP TO FINANCIAL STATEMENTS
The financial statements present the general fund and special revenue fund on a GAAP basis. Budgetary comparison statements or schedules (RSI) are presented for the general fund and special revenue fund to demonstrate finance-related legal compliance in which certain revenue is permitted by law or grant agreement to be recognized in the audit year, whereas for GAAP reporting, revenue is not recognized until the subsequent year or when expenditures have been made.
The general fund is presented in the accompanying schedules on a modified accrual basis with the exception of the revenue recognition of the delayed state aid payments in the current budget year, which is mandated pursuant to N.J.S.A. 18A:22-44.2. For GAAP purposes, those payments are not recognized until the subsequent year due to the state deferral and recording of certain state aid payments in the subsequent year. The special revenue fund is presented in the accompanying schedules on the grant accounting budgetary basis which recognizes encumbrances as expenditures and also recognizes the related revenues, which may include the delayed state aid payments, whereas the GAAP basis does not. The special revenue fund also recognizes the delayed state aid payments in the current budget year, consistent with N.J.S.A. 18A:22-44.2.
The net adjustment to reconcile from the budgetary basis to the GAAP basis is a decrease of $145,255 for the general fund and a decrease of $49,535 for the special revenue fund. See the Notes to Required Supplementary Information for a reconciliation of the budgetary basis to the modified accrual basis of accounting for the general and special revenue funds. Awards and fmancial assistance revenues are reported in the Board's fmancial statements on a GAAP basis as presented as follows:
Federal State Total
General Fund $ 15,510 $ 6,750,236 $ 6,765,746
Special Revenue Fund 626,727 467,177 1,093,904 Food Service Fund 110,244 5,494 115,738
Total Financial Assistance $ 752,481 $ 7,222,907 $ 7,975,388
132

CLARK PUBLIC SCHOOL DISTRICT NOTESTOTHESCHEDULESOFEXPENDITURESOF FEDERAL AWARDS AND STATE FINANCIAL ASSISTANCE FOR THE FISCAL YEAR ENDED JUNE 30, 2019
NOTE 4 RELATIONSHIP TO FEDERAL AND STATE FINANCIAL REPORTS
EXHIBITK-5
Amounts reported in the accompanying schedules may not necessarily agree with the amounts reported in the related federal and state financial reports due to timing differences between the District's fiscal year and grant program years.
NOTE 5 OTHER INFORMATION
Revenues and expenditures reported under the Food Distribution Program as non-cash assistance represent current year value received and current year distributions, respectively. TPAF Social Security contributions in the amount of$1,135,769 represents the amount reimbursed by the State for the employer's share of social security contributions for TP AF members for the fiscal year ended June 30, 2019. The amount reported as TPAF Pension System Contributions in the amount of $2,909,712, TPAF Post-Retirement Medical Benefits Contributions in the amount of $1,319,841 and TPAF Long-Term Disability Insurance in the amount of $2,574 represents the amount paid by the State on behalf of the District for the fiscal year ended June 30, 2019.
NOTE 6 ON-BEHALF PROGRAMS NOT SUBJECT TO STATE SINGLE AUDIT
On-behalf State Programs for TPAF Pension, Post-Retirement Medical Benefits and Long-Term Disability Insurance Contributions payments are not subject to a State single audit and, therefore, are excluded from major program determination. The Schedule of State Financial Assistance provides a reconciliation of State fmancial assistance reported in the District's financial statements and the amount subject to State single audit and major program determination.
NOTE 7 DE MINIMIS INDIRECT COST RATE
The District has not elected to use the 10 percent de minimis indirect cost rate allowed under the Uniform Guidance.
133

EXHIBITK-6
CLARK PUBLIC SCHOOL DISTRICT SCHEDULE OF FINDINGS AND QUESTIONED COSTS
FOR THE FISCAL YEAR ENDED JUNE 30, 2019
Part I- Summary of Auditor's Results
Financial Statement Section
Type of auditors' report issued on financial statements
Internal control over financial reporting:
1) Were material weakness( es) identified?
2) Significant deficiencies identified that are not considered to be material weakness(es)?
Noncompliance material to the basic financial statements noted?
Federal Awards Section
Internal control over compliance:
1) Material weakness(es) identified?
2) Significant deficiencies identified that are not considered to be material weakness( es )?
Type of auditor's report issued on compliance for major programs?
Any audit findings disclosed that are required to be reported in accordance with Uniform Guidance?
Identification of major programs:
CFDA Number(s)
84.027
84.173
Dollar threshold used to distinguish between Type A and Type B programs:
Auditee qualified as low-risk auditee?
FAIN Number
Unmodified
__ yes
yes
__ yes
__ yes
__ yes
Unmodified
__ yes
H027 AlSO 100
H173A180114
$750,000
__ yes
134
X no
~none reported
X no
X no
~none reported
X no
Name of State Program
IDEA Part B Basic
IDEA Preschool
X no

State Awards Section
CLARK PUBLIC SCHOOL DISTRICT SCHEDULE OF FINDINGS AND QUESTIONED COSTS
FOR THE FISCAL YEAR ENDED JUNE 30, 2019
Part I- Summary of Auditor's Results
Auditee qualified as low-risk auditee? _X_ yes
Internal control over major programs:
1) Material weakness( es) identified? __ yes
EXHIBITK-6
no
X no
2) Significant deficiencies identified that are not considered to be material weakness(es)? __ yes X none reported
Type of auditor's report issued on compliance for major programs?
Any audit findings disclosed that are required to be reported in accordance with N.J. Circular Letter 15-08?
Identification of major programs:
GMIS Number(s)
19-495-034-5120-044
19-495-034-5094-003
Dollar threshold used to distinguish between Type A
and Type B programs:
135
Unmodified
_X_ yes no
Name of State Program
Extraordinary Aid
Reimbursed TP AF Social Security
$750,000

CLARK PUBLIC SCHOOL DISTRICT SCHEDULE OF FINDINGS AND QUESTIONED COSTS
FOR THE FISCAL YEAR ENDED JUNE 30, 2019
Part 2 -Schedule of Financial Statement Findings
EXHIBITK-7
This section identifies the reportable conditions, material weaknesses, and instances of noncompliance related to the basic financial statements tliat are required to be reported in accordance with paragraphs 5.18 through 5.20 of Government Auditing Standards.
There are none.
136

CLARK PUBLIC SCHOOL DISTRICT SCHEDULE OF FINDINGS AND QUESTIONED COSTS
FOR THE FISCAL YEAR ENDED JUNE 30, 2019
Part 3- Schedule of Federal and State Award Findings and Questioned Costs
EXHIBITK-7
This section identifies the significant deficiencies, material weaknesses, and instances of noncompliance including questioned costs, related to the audit of major federal and state programs, as required by Uniform Guidance and New Jersey OMB's Circular 15-08.
CURRENT YEAR FEDERAL AWARDS
There are none.
137

CLARK PUBLIC SCHOOL DISTRICT SCHEDULE OF FINDINGS AND QUESTIONED COSTS
FOR THE FISCAL YEAR ENDED JUNE 30, 2019
Part 3- Schedule of Federal and State Award Findings and Questioned Costs
EXHIBITK-7
This section identifies the significant deficiencies, material weaknesses, and instances of noncompliance including questioned costs, related to the audit of major federal and state programs, as required by Unifonn Guidance and New Jersey OMB's Circular 15-08.
CURRENT YEAR STATE A WARDS
Finding 2019-001:
Our audit of the District's Extraordinary Aid application revealed that student enrollment fmms were not in agreement with the student Individualized Education Plans (IEP).
State Program Information:
Extraordinary Aid 495-034-5120-044
Criteria or Specific Requirement
State Grant Compliance Supplement
Condition:
• The student IEP did not include an intensive service as required for Extraordinary Aid in two (2) of the sixteen (16) Extraordinary Aid student enrollment forms tested.
• The intensive service reported on the Extraordinary Aid student enrollment form did not agree with the intensive service reported on the student's IEP for thirteen (13) of the sixteen (16) students tested. Although differences were noted, an intensive service was reported on the IEP and therefore the student was eligible for Extraordinary Aid.
Questioned Costs:
Unknown.
Context:
See Condition.
Effect:
Certain services reported on the application could not be verified to student's IEP.
Cause:
Unlmown.
Recommendation:
The Extraordinary Aid application be reviewed to ensure that services reported on the student enrollment form are in agreement with the student's Individualized Education Plan (IEP).
View of Responsible Official and Planned Corrective Action
Management agrees with this finding and had indicated that procedures will be implemented to take corrective
138

CLARK PUBLIC SCHOOL DISTRICT SUMMARY SCHEDULE OF PRIOR AUDIT FINDINGS
FOR THE FISCAL YEAR ENDED JUNE 30, 2019
EXIDBIT K-8
This section identifies the status of prior-year findings related to the basic financial statements and federal and state awards that are required to be reported in accordance with Uniform Guidance and New Jersey OMB's Circular 15-08.
STATUS OF PRIOR YEAR FINDINGS
Finding 2018-001
Condition:
Salaries used to determine State reimbursements for FICA paid for T.P.A.F. members included certain nonpensionable wages.
Status:
Corrective action has been taken.
139