class i differentials with $2.50 fuel to $5.00 fuel* 30... · cream and skim fractions and...
TRANSCRIPT

Class I Differentials with $2.50 Fuel to $5.00 Fuel*
Chuck Nicholson & Mark Stephenson Cal Poly San Luis Obispo & UW-Madison
Living on a Roller Coaster: 18'h Annual Workshop for Dairy Economists and Policy Analysts
Outline (Surprise!)
• Class I "Price Surface" with different fuel costs -Work funded by AMS Dairy Division
-The main topic
• *Costs of "Localizing" the US Dairy Industry - Recent Food Policy Paper
• *Use of USDA and CBO Price Projections -Recent survey for Ag Policy course
* Special bonus sections! Or " 30% more presentation FREE"
* EXHIBIT
I 3o I
1

Outline
• Background • US Dairy Sector Simulator (USDSS) basic
description
• Modifications from original USDSS model -Additional final and intermediate products
-Nonlinear yield functions
-Revised plant locations
• Class I price surface results
Objectives
• Update the "cost-minimizing" price surface to 2006 -(Okay, so now we should probably update the
update)
• Examine the impacts of changing fuel costs on the Class I price surface -From the 2006 diesel cost of $2.36 to $5.00
-At the start $5.00/gal diesel looked big!
-May 2nd: $4.12/gal, with CA at $4.47/gal
2

Methods
• Cost-minimizing model of the US dairy sector
• Long history of this analysis -Pratt et al. 1998 Class I differentials study
-US Dairy Sector Simulator (USDSS)
-Also funded by AMS
-Input into the differential structure under order reform
• Model was given an "extreme makeover" in 2008
USDSS Model
• Spatially-disaggregated 'transshipment' model
• Minimizes the costs of milk assembly, interplant (intermediate product) use, and final product distribution -Some versions have included processing
costs also
• Nonlinear programming solution technique
3

USDSS Model
5 product categories
US Milk Supply Locations Given milk supply locations ...
f• .I
i ) • • •
~ . \.· , ' I
·.
4

US Cheese Plant Locations ... and processing plant locations, like cheese ...
• , ' ....
...
.. .. .. .... .... 4o.
....
l ,..
. .. .. ..
.. .. ..
......
..
" ~·· ... ·~ .. .. ~ ... ... .............. ... .. .. :;~ .... ... ... .. . .. .. .. :\ ... .. .. ...... ._ ... • •r;. • .. ~ .. .. . t i "' .. ....... ...,. ... .......... ··.~ .a. A A A "•i J
... ... ... ~ .. .. . ··"'" ... ..
-.... · ....
...... .. \• ' '
US Cheese Demand Locations ... and demand locations ...
t~ .--~! ~ ··-- - I , t\ I • -· \ • . • • ., ',
I . / l.. • • • ':..• - :;-i-1 •• ~ "t. \ t • r • ·' • •••• ·r~ f .· ·'
I --L... .:_1
' . • I. ·· ·· •. 1.1 .~····tc~ . ' • ~~ , - 1 • 0 o o rf •' oJo ; •.- •
\. ; \ II '. .: J • ·.-. :\ •• :: : , ·:-;;:· ···.1· .. · ···:·r. \ ~. I • · ) :: •l'; • 1 0 J ' -' ~t:; • •, 1' • : I • . ) • • : • J • { ." • \ ~ , •r' - f._. I • , , \(t/'• , • ', v,
- • ---r:::-1 . • -\:. \ :·: ;/. ·.· :=·~ :.. l • I . I . ..._. . . . . ~~ I' -~ : . • • . · ..
', . . ·I • . ... " .... : -·. - . . .... \ . ~ . . . . :
. . . I I . r \ ;. ··~·· ~L· ... ~··.\ "' . . , . ~ ' . . . ~) ~;;.·. . . ~ l ..
5

The USDSS Model
• Figure out least overall cost for ... - Farm to plant (milk assembly)
- Processing at plant (products)
-Distribution to demand
~~ . -_ ..... $ $
$
Model Solutions Represent: • The work of an imaginary "Dairy Dictator"
-Solution is least-cost for entire system -No emotion about keeping plants in
business
' . .
- . -·~-, ---·· ~~"~
.. ;m ~ ' · ~·:- ~·''\\~ ~ ,r,;-,~1 ·'\.. • ' \ •
""~ '·--..'!
&1 I ·", .'
6

Model Solutions Provide: • Insights about some incentives for a
plant to be at a location -Not actual outcomes -Many important factors omitted
• Uses data for two months -May and October -Original study used 1995 data -Most recent update 2006
Model Solutions Include: • Plant locations • Milk assembly flows • Product distribution flows • Spatial milk values
7

Revisions to Previous Model
Limitations of the previous USDSS: • Limited product/component disaggregation
- 5 products, 2 components (Fat, SNF)
• Newer products not represented -Dry Whey, WPCs, UF milks, MPC
• Fixed product composition (proportions) • Least-cost solution
-No 'policy'; shipment patterns not consistent with incentives for pooling at all points
Changes from Original Model
• Expanded number of final and intermediate (interplant) products
• Nonlinear yield functions based on use of cream and skim fractions and intermediate products -Results in endogenous composition
• Modifications to plant locations -Reduced fluid plants, added key locations not
. . In preVIOUS
----- ······---------------
8

Revised Model Final Products
• Fluid • Dry Whey
• Yogurt • WPC34 & WPCSO
• Ice Cream • Lactose
• Cottage Cheese • Casein & Caseinates
• NDM • 4 MPC products
• Butter • Dried buttermilk
• Cheddar Cheese • Other ECD
• Other Cheese
Model "Intermediate" Products
• Cream
• Skim
• NDM
• Ice Cream Mix
• Fluid buttermilk
• Dry buttermilk
• Fluid whey
• Separated whey
• Whey cream
• Dry Whey
• WPC34 & WPCSO
• Casein & Caseinates
• 4 MPC Products
• Condensed Skim
• 4 UF Skim Products -Permeates
Intermediate means used in the manufacture of another dairy product
9

Model "Intermediate" Products
Example of IP flow
NOM can be used in:
• Fluid (CA)
• Yogurt
• Cheeses
• Ice Cream Mix
Another Example
Separated Whey uses:
• Dry Whey
• WPC34
• WPCBO
Fuel Cost Scenarios
• Changes in Class I price surface with changes in fuel costs
• Three fuel cost scenarios: - $2.36/gallon diesel
- $3.50/gallon diesel
- $5.00/gallon diesel
• These average US diesel prices were modified to represent regional cost differences at origin points for shipments
10

Results
May 2006, $2.36
11

May 2006, $3.50
May 2006, $5.00
12

U.S. Coui'IUOI (GonoJ••II•tOd)
MII)'2J6 - 1100>;10Co•'llt't.GOO
- U0l0t UC«-30 .,DO:I)O, UU.'OOO
]1((11001· ~ '~0
U COJ01 · ~ltQ))D
- ~00001 &ot'('Olo
-e.tCb:lO!&.KC\).)0
- UO'.m! eHC(COO
U.S. Cou .. Uol (Gonorollzod)
MII)'J50 - IICXJI000•"(7!lCOQQ
- 2ll)))Ol'"""'' - l.KOOCI\ UOCOOO
llt0001. ,f,. J OC()OQ
HIX»!H • $ 100000
- ~JCOOOI OOOWJIJ -tWMtrtt<IOOO
- ''rooo' • •t~:ooo
MAY 2006, $2.36 Fuel Cost
MAY 2006, $3.50 Fuel Cost
13

U.S. Cou•tloa (Gonar.~ll:ud)
llly500
- '1o.»GC·1'1«0ll
- 2.l(l)l01 >t«"ll -:21CDX11~...CCOI
,ICX))O, ·• •ocoo• l &O:n; 1 • S 101m I
-i-!0:1011al!.ll..cot
-e,u,o::.o, r1oc®e
- IIO'ne1 & 4~f
MAY 2006, $5.00 Fuel Cost
May 2006, $2.36 to $5.00 Difference
\)
I
14

October 2006, $2.36
October 2006, $3.50
15

- tXOIJOO . li'CIIlOOO
- tlmllh >9«001 - 2.100001 ).GW)ljt
]KlOQ01 .... .&(((01
~ 4C:OJCU • UOOODt
- ucuocn a.xax~t -t..t:<I.I001rtCI«<It
- '100001 a •ocoo•
October 2006, $5.00
OCTOBER 2006, $2.36 Fuel Cost
16

. ,,CI.)D00.,1CGOOo - 2.2COXI1 tlCCQlO -l.to:loollO«<DO
J liCOOCI'· " ~cnooo
.:. 'C0001 · s 1t(ffl0
- S.201)o)QI SOOOXht
-U:Cl.JI>alr!GCQJO
-/IDMQI lll'loCOOII
Clu e I
- IJOI)OOO.lXIIXOO
- ::!,1»)(11 ?9tt«<fl - l .IOI.;J001lob...'O:Xlll
l Kl0001· "· 'C0:00
4400QCI1 · $o100000
- UC\1001 O.o«.o::O
- • 000001 r 100000
- I IC0001 .;1((()00
OCTOBER 2006, $3.50 Fuel Cost
OCTOBER 2006, $5.00 Fuel Cost
17

Oct 2006, $2.36 to $5.00 Difference
Key Results
18

Can Also Examine Flows
• Movements of products
• Fluid plant inflows and outflows
• Cheese plant inflows and outflows
19

May 2006 $5.00 Flows, Fluid
May 2006 $2.36 Flows, Cheese
t ~ -
20

May 2006 $5.00 Flows, Cheese
Key Results, Flows
21

Now, Localization
f ood Policy 000 .... ,
The costs or increased localization for a multiple-product food supply chain: Dairy in the Unirc:d States Charles F. Nlchol!on u. ll!l,url l G6m(Z ~·. 0 liV(f H. G.lo"' ·n.--;-.. oofio-•••ulfur.-1'4oowl'wo, .. ,.,, itw\11•""'"' 16-lL.utM:..,..c;.o~UW".,_,."'-' "L-..hfl ~~'N(''\"flrlt-\W\._.,.._{-.-t,.af"!h "-' " '' ..... l "?'II""" ~--1<':..-.~1-••--.t• .... -- .-.u.. .......... ,.t .,.,1 .. ' 1 _. .......
........ _...,. ~l:~!CII ~.~ : ...... .wJ ko.:,& o&.. .. 9'f'Vrll~1o) .-.,-... ..... -.~ ............ \.o~ ....... -.......u .,.._ v.:••.or o ............... , ,,_ ... .. ....., .... --~.
n., ·-.,.-... ·~ ._,, ..... ~r...., ... ~.(Oof' •lll ~ t,., ... ')oiJ.otlVf\101'Nt' ~ ..... ,.,. ,...,LI ol......,.,~ _.,;n t'll:l tiQPf ~ Wlh. AnnW'C ~ d.'a h., ,..po. t:tlf'llllt:'* fi'C'd.wl WYhl'""ftltOjiiiiiC ...... t\OI~..,IJwb-.l'ldlftaln •• t.'wt #V:y.-~II'MIIIp.a~ll_~ N tf.fll• ... ~t ~koiNU"'C,..f')'o!'\VII~' 11!"-'"'C"ftclil.al~ ..... ,.ttl .. llllllo.oio ............
li)" ~nUlL~ U.r.tp:na~Md ti:\:l!Wllftn~UIIft W~r.~t;JIIf;lf ~<CJ: nWwfV•I _,_.., w.,...., 10 ,,.,.,..,, 1t!t'IT\oKiw "C'N'~ c: ~••C'..,., ~ .. ~ .. , ... tuu ... "• rn.., ..... ,.r.'l)illl.ft ~ilnlltltD illuu.Nl!K.&.kr.U...., l'WM~ft11~U-n~r•IN;IP\'U'.U.
Olll t.l*'(l Wg ... ,~·.,.~- .. ,,,,."r.'"'.-,.."' ""'"C...,..U l'f"'IIOIt\.I!Nifll-'•-"" wt•"lllc..tt lillf".;wd l1udo1~ ""'OIItn .......... ~ ~U Wllllor '"'"'ol>C ~"olrC .u:d dhUIWII;t~~~ ~'- (W ll".tft'IU•Mt ll/1( f lllr(l;o .. IWIIl \ll"~tlrTUw,:i!'~ •JIRI!i("t.IMI!ilf~ lnrlt'i'('tlli'-"'('rtC't' I•" It ' • ,,.,-.,~..,. ..... ,. nln.r~r~•~"".,..,w~..r~d..My ... .,~IO.u•~· .. "Mtto..Jh .... ..,.,~..c-.h .. lftm1 d CMI Ulli! 4..uuno II'""'"' fhr NiAOt•!'lii;:J llortW'""' lf!UU...J ko.:.Jau'- U'1lil n-th l .... '""
IOI:ll:"illtt'1f.W,f
Food Industry Localization
• Given lots of positive talk -Reduction in food miles is often a goal
• Relatively limited analysis of the costs or the benefits
• Usually described on at a "local" scale - "Money stays in local communities, helps our
farmers"
• (Not really consistent with trade theory)
22

Objectives
• Examine the costs of reducing "weighted average source distance" for the US dairy industry -For all products
-For fluid milk (highly visible consumer product)
• Examine the limits too WASD reduction with current spatial organization of the industry
• A "systems" approach, not a local one
Methods
• Use the USDSS!
• Scenario 1: Add a constraint on the total WASD for all products
• Scenario 2: Add a constraint on the total WASD for only fluid milk
• Minimize costs given these constraints
23

Scenario 1 Results
• Maximum feasible reduction is about 20% -64 miles (from base of 317 miles for all)
• 20% decrease in WASD increases system costs -2% (May) to 4% (October)
• Assembly costs are decreased (up to 14%)
• Distribution costs are increased (up to 24%)
• Redistribution of costs in supply chain
Scenario 1 Results, Continued
• Optimal plant numbers are lower
• Some products decrease WASD -Fluid milk butter, yogurt
• Some products increase WASD -Cheese, NOM
24
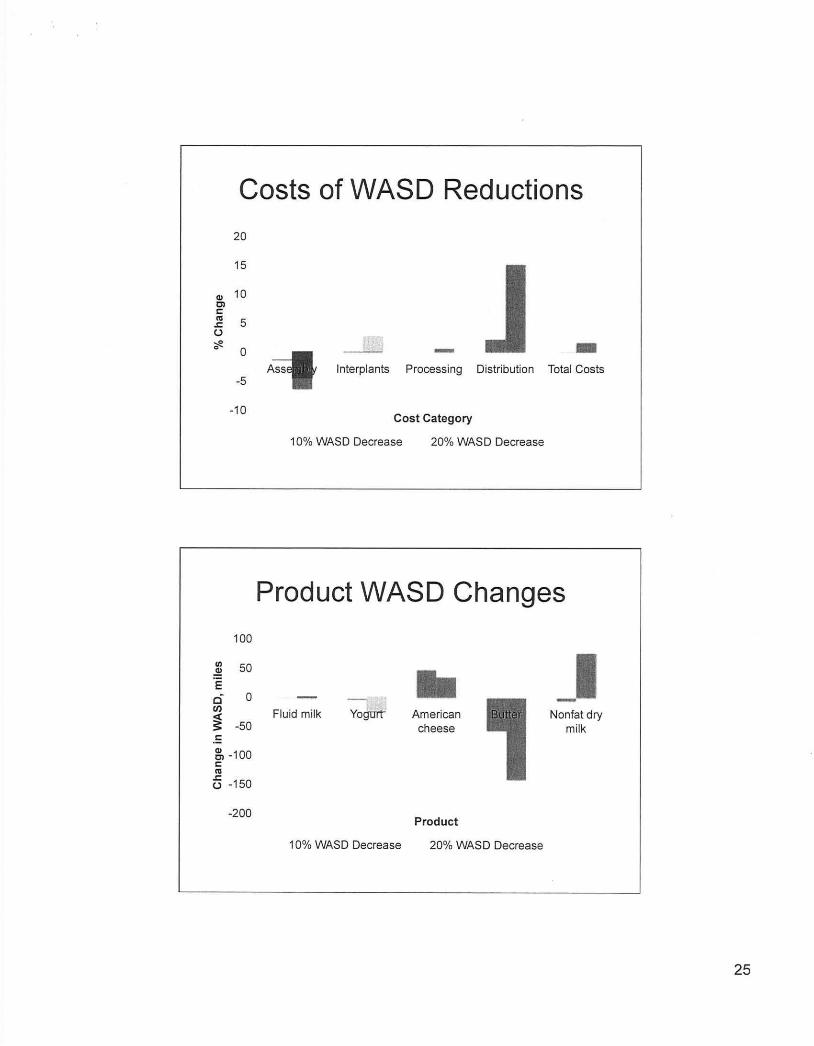
Costs of WASD Reductions
20
15
Q) 10 Cl 1: .,
5 .c: (.)
~ 0 0
-5
-10
100
50
E 6 0 IJ)
~ > -50 1:
~ -100 1: ., B -15o
-200
- -lnterplants Processing Distribution Total Costs
Cost Category
10% WASD Decrease 20% WASD Decrease
Product WASD Changes
Fluid milk
10% WASD Decrease
American cheese
Product
20% WASD Decrease
_I Nonfat dry
milk
25

Scenario 2 Results
• Maximum feasible reduction is 12 miles -From 112 to 100 miles (11%)
• This reduction would increase system costs by 12% -Lower assembly but higher processing and
distribution costs
• Average US gallon cost increase $1.66
• Would increase total WASD by 30% - 98 miles, to 415 miles from 317
Summary
• Reducing WASD in dairy has limits with current spatial organization
• Total cost increases not large, but redistribute costs in supply chain
• Overall WASD reductions do not reduce for all individual products
• Costs for reducing fluid milk WASD are higher
26

Finally, Price Projections
• Cal Poly Ag Policy Student:
• "Price volatility won't be a problem in the future. Just look at the USDA and CBO price forecasts."
US All-Milk Price Projections
20 19 1 ___ _
18 17 -
i 16 ~ 15 .,.. 14
13 12 11
10 r '
2009 2010 2011 2012 2013 2014 2015 2016 2017 2018 2019 2020
- USDA -CBO
27

Finally, Price Projections
• Cal Poly Ag Policy Professor:
• "Don't believe everything you read without understanding where it comes from and what it is used for."
Projections: Trusted? Used?
• 4-question survey
• Sent to workshop mailing list
• N = 79 responses (Thank you!)
28

40
35
30
25
20
15
10
5
0
How Well Predict Future Price Patterns?
Not well at all Somewhat well
•USDA CBO
Statistically significantly different (despite similarities in forecast)
-Quite well
Aggregated percentage > " Somewhat well" is < 10%
50
45
40 35
30 25 20
15
10
5
0
How Much Use for Decision Making?
Not at all
Statistically significantly different (despite similarities in forecast)
-Somewhat Quite a bit
•USDA CBO
Aggregated percentage > " Somewhat" is < 5%
29